A Study on Scour for Irrigation Canals in Egypt, “Case ...
13
American Journal of Engineering and Technology Management 2016; 1(4): 65-77 http://www.sciencepublishinggroup.com/j/ajetm doi: 10.11648/j.ajetm.20160104.13 A Study on Scour for Irrigation Canals in Egypt, “Case Study: The First Reach of El-ibrahimeya Canal” Mohammed Gamal Abdalla Irrigation and Hydraulics Dept., Mansoura University, Mansoura, Egypt Email address: [email protected] To cite this article: Mohammed Gamal Abdalla. A Study on Scour for Irrigation Canals in Egypt, “Case Study: The First Reach of El-ibrahimeya Canal”. American Journal of Engineering and Technology Management. Vol. 1, No. 4, 2017, pp. 65-77. doi: 10.11648/j.ajetm.20160104.13 Received: October 22, 2016; Accepted: November 5, 2016; Published: January 20, 2017 Abstract: A general scour was observed in the first reach of El-Ibrahimeya canal from its intake to km. 60. Also, a local scour was observed around the bridge piles across the canal at km. 23 which may lead to a failureto the bridge because the condition of interred pile length that equals one and half of the free pile length was not satisfied. Moreover, the designed level of the bridge equals (42.15) while the current bed level equals (40.40) that represent a seriousness for the bridge safety. The main objective of this research paper is to study the scour phenomenon generally along the reach under study and for the bridge, especially. A hydrographic survey for canal under study has been carried out. Also, the required data was obtained and analyzed, including discharge values, soil samples, and water levels at different sites along the canal. A one-dimensional mathematical model, namely (SOBEK-1D) was used to simulate the reach under study based on different Scenarios to determine the possible different solutions for the existing problem. A complete design process was carried out for the suggested protection layer related to km. 23 bridge against scour. Keywords: Scour, El-ibrahimeya Canal, Mathematical Model, and SOBEK-1D 1. Introduction Scour has been known as a severe hazard to the performance of flowing water in any stream. It can be defined as a natural phenomenon caused by the flowing water in rivers and streams. It leads to the lowering of the stream bed level by the erosion of water. It can either be caused by normal or flood flow. In other words, it can occur under any flow conditions but the scour effect is higher in case of larger flow. The characteristics of scour and fill in the riverbed during a flood have significant relation to the riverbed stability [1]. It is one of the main causes of bridge failures. Flood flow in natural rivers scours the river bed and creates large holes around bridge piers that gradually extend beneath them, eventually destroying them. Scour depth can be measured by the amount of reduction below the designed dimensions of the channel while the depression or the void caused when the sediment is washed away is called the scour hole, figure (1). The total scour for any stream can be classified into three components: general scour, contraction scour, and local scour which can be divided into sub- divisions as shown in figure (2) [2]. Figure 1. A detailed sketch for a scour hole.
Transcript of A Study on Scour for Irrigation Canals in Egypt, “Case ...
American Journal of Engineering and Technology Management 2016; 1(4): 65-77
http://www.sciencepublishinggroup.com/j/ajetm
doi: 10.11648/j.ajetm.20160104.13
A Study on Scour for Irrigation Canals in Egypt, “Case Study: The First Reach of El-ibrahimeya Canal”
Mohammed Gamal Abdalla
Irrigation and Hydraulics Dept., Mansoura University, Mansoura, Egypt
Email address: [email protected]
To cite this article: Mohammed Gamal Abdalla. A Study on Scour for Irrigation Canals in Egypt, “Case Study: The First Reach of El-ibrahimeya Canal”.
American Journal of Engineering and Technology Management. Vol. 1, No. 4, 2017, pp. 65-77. doi: 10.11648/j.ajetm.20160104.13
Received: October 22, 2016; Accepted: November 5, 2016; Published: January 20, 2017
Abstract: A general scour was observed in the first reach of El-Ibrahimeya canal from its intake to km. 60. Also, a local
scour was observed around the bridge piles across the canal at km. 23 which may lead to a failureto the bridge because the
condition of interred pile length that equals one and half of the free pile length was not satisfied. Moreover, the designed level
of the bridge equals (42.15) while the current bed level equals (40.40) that represent a seriousness for the bridge safety. The
main objective of this research paper is to study the scour phenomenon generally along the reach under study and for the
bridge, especially. A hydrographic survey for canal under study has been carried out. Also, the required data was obtained and
analyzed, including discharge values, soil samples, and water levels at different sites along the canal. A one-dimensional
mathematical model, namely (SOBEK-1D) was used to simulate the reach under study based on different Scenarios to
determine the possible different solutions for the existing problem. A complete design process was carried out for the suggested
protection layer related to km. 23 bridge against scour.
Keywords: Scour, El-ibrahimeya Canal, Mathematical Model, and SOBEK-1D
1. Introduction
Scour has been known as a severe hazard to the
performance of flowing water in any stream. It can be
defined as a natural phenomenon caused by the flowing
water in rivers and streams. It leads to the lowering of the
stream bed level by the erosion of water. It can either be
caused by normal or flood flow. In other words, it can occur
under any flow conditions but the scour effect is higher in
case of larger flow. The characteristics of scour and fill in the
riverbed during a flood have significant relation to the
riverbed stability [1]. It is one of the main causes of bridge
failures. Flood flow in natural rivers scours the river bed and
creates large holes around bridge piers that gradually extend
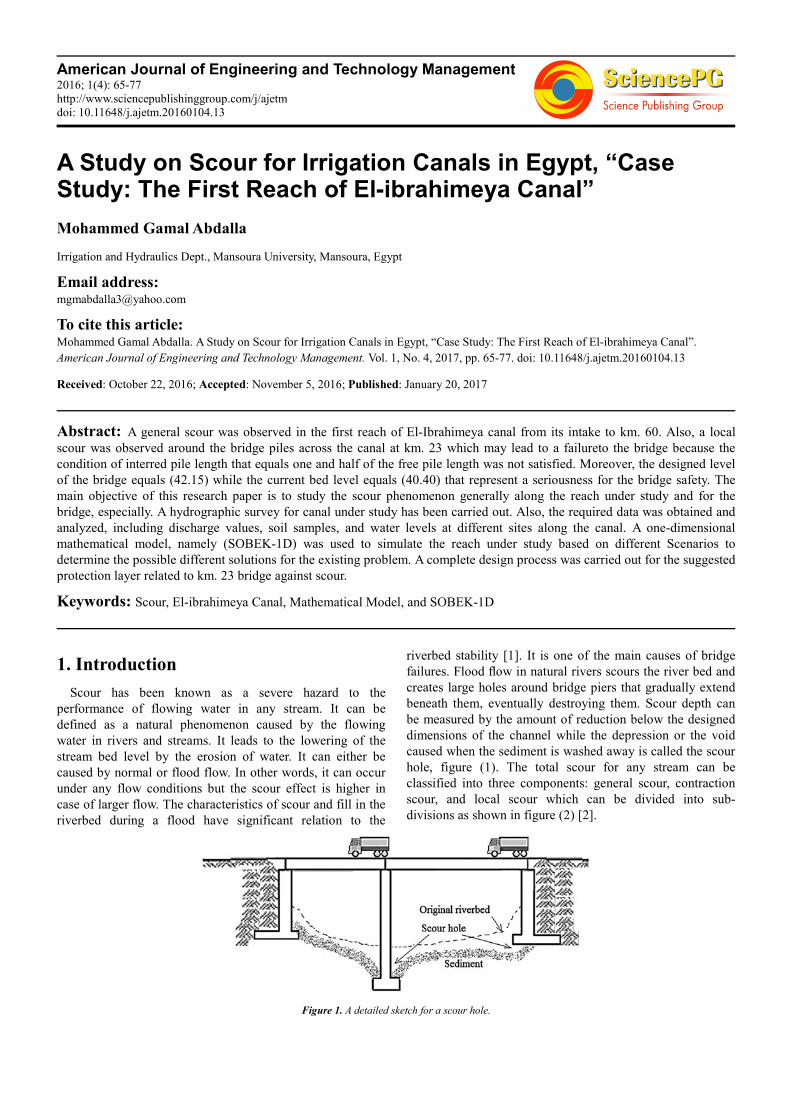
beneath them, eventually destroying them. Scour depth can
be measured by the amount of reduction below the designed
dimensions of the channel while the depression or the void
caused when the sediment is washed away is called the scour
hole, figure (1). The total scour for any stream can be
classified into three components: general scour, contraction
scour, and local scour which can be divided into sub-
divisions as shown in figure (2) [2].
Figure 1. A detailed sketch for a scour hole.
66 Mohammed Gamal Abdalla: A Study on Scour for Irrigation Canals in Egypt,
“Case Study: The First Reach of El-Ibrahimeya Canal”
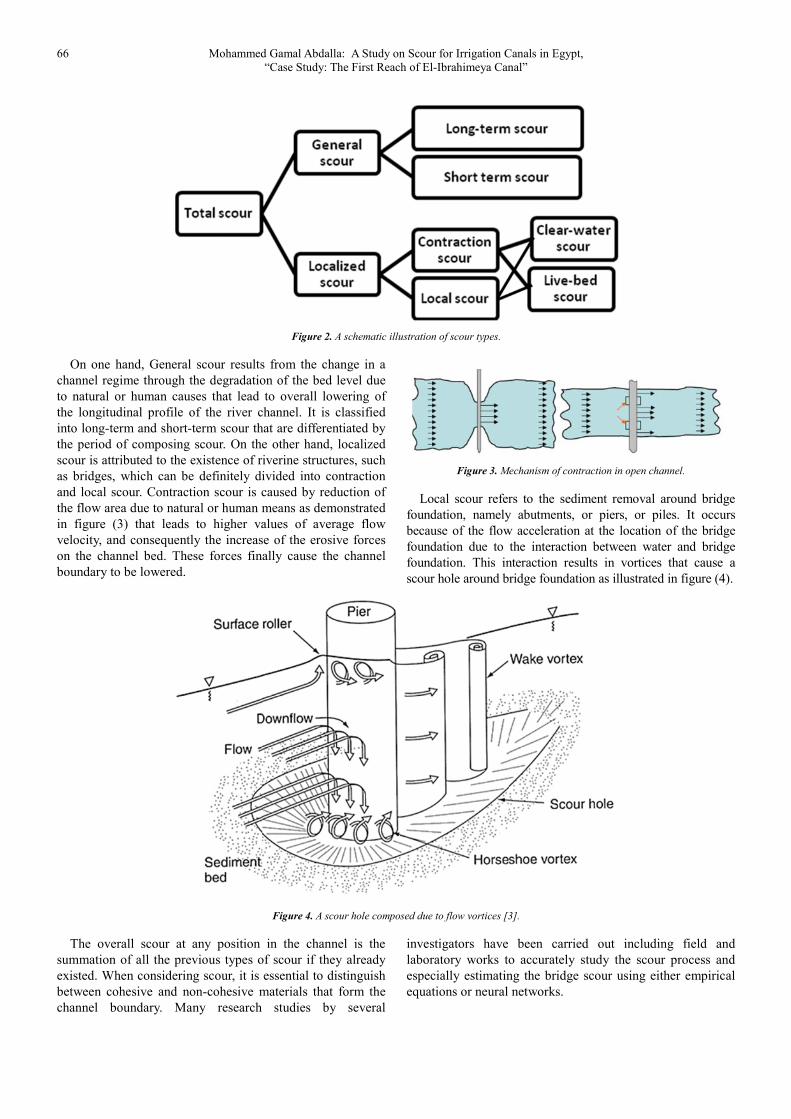
Figure 2. A schematic illustration of scour types.
On one hand, General scour results from the change in a
channel regime through the degradation of the bed level due
to natural or human causes that lead to overall lowering of
the longitudinal profile of the river channel. It is classified
into long-term and short-term scour that are differentiated by
the period of composing scour. On the other hand, localized
scour is attributed to the existence of riverine structures, such
as bridges, which can be definitely divided into contraction
and local scour. Contraction scour is caused by reduction of
the flow area due to natural or human means as demonstrated
in figure (3) that leads to higher values of average flow
velocity, and consequently the increase of the erosive forces
on the channel bed. These forces finally cause the channel
boundary to be lowered.
Figure 3. Mechanism of contraction in open channel.
Local scour refers to the sediment removal around bridge
foundation, namely abutments, or piers, or piles. It occurs
because of the flow acceleration at the location of the bridge
foundation due to the interaction between water and bridge
foundation. This interaction results in vortices that cause a
scour hole around bridge foundation as illustrated in figure (4).
Figure 4. A scour hole composed due to flow vortices [3].
The overall scour at any position in the channel is the
summation of all the previous types of scour if they already
existed. When considering scour, it is essential to distinguish
between cohesive and non-cohesive materials that form the
channel boundary. Many research studies by several
investigators have been carried out including field and
laboratory works to accurately study the scour process and
especially estimating the bridge scour using either empirical
equations or neural networks.
American Journal of Engineering and Technology Management 2016; 1(4): 65-77 67
2. Literature Review
Ettema et al. presents a review on the scour conditions at
the bridge abutments and the difficulties that are faced during
the accurate estimation of scour [4]. The previous studies
related to abutments scour did not recognize the different
forms of scour at the bridge abutments and consequently the
estimation of scour length was inaccurate, so the design
process of bridges was poor. The review presents some
substantial resolved scaling issues associated with laboratory
experiments. These issues concern parameters that can be
neglected and these parameters are not included in the
relationships used for predicting scour depth.
Ghorbani made a field study of scour at bridge piers in
case of flood plain rivers [5]. It was based on the field
evaluation of the pier failures related to scour in cohesion
less-bed rivers. The different hydraulic effects, including
flow velocity, flow depth, bridge pier geometry, and sediment
characteristics such as specific gravity, particle size, angle of
internal friction, and particle size distribution were
considered and the scour depth was related to these variables
in order to estimate it.
Lu et al. perform both field measurements and simulation
of scour depth of bridges constructed in fluvial rivers during
floods based on a case study, namely the Si-Lo Bridge in the
lower Cho-Shui River, the longest river in Taiwan [6]. This
study is very important for cost-effective bridge foundation
design. The collected field data was used to validate the
applicability of the proposed model. The results showed that
the local scour formulae may lead to overestimate of the local
scour depth.
Borghei and Sahebari predicted the scour properties at
river junctions [7]. The discharge ratio of the tributary to the
main branches, the junction angle, the ratio of mean
downstream velocity threshold velocity are the important
non-dimensional variables. To estimate the scour depth, a
relationship between it and the non-dimensional variables
was derived. It is recommended to study this problem on the
basis of laboratory experiments in further studies.
Tulimilli et al. used a 3D software, namely Componential
Fluid dynamics (CFD) to simulate the scour pattern in
experimental flumes [8]. The software displayed the bed
shear stress distribution to accurately estimate the bed levels
displacements. The procedure provides a good foundation to
use the software for natural channels.
Lu et al. predicted the maximum general scour depth
during a flood for intermittent rivers [9]. A high efficient
numbered brick column laying method was used based on
successfully measured short-term general scour data during
typhoon-induced floods for both gravel-bed and sand-bed
reaches in the steep intermittent rivers in Taiwan. Based on
the experimental results, the scoured flow depth formula was
developed as follows which gave better predictions to
estimate the scour depth compared to the one given by
Blench [10]:
�� = 1.26 ∗ �.�∗ ��.��∗���.������.�� � (Lu et al., 2012) (1)
�� = 1.23 ∗ � � �⁄���� ��⁄ � (Blench, 1969) (2)
where:
ds = scour depth;
q = discharge per unit width;
So = longitudinal bed slope;
�� = geometric standard deviation of bed material; and
d50 = median sediment size of bed material.
Roca and Whitehouse presented both a framework and
methods to develop a probabilistic scour risk assessment
using fragility curves to account for uncertainty in input
variables, prediction methods and performance of structures
[11]. It is important to understand the risks related the
possible riverbed movements in the lateral and vertical
directions to define the different protection works against
scour.
Singh and Maiti carried out series of laboratory
experiments to study the scour properties around a circular
obstruction [12]. The developed scour hole in the cohesive
material took the shape of cone with a deeper depth close to
the pier nose and extended in the downstream direction. The
kinematic and dynamic boundary conditions that affect the
exact scour depth make the process of field values estimation
as a complex task so the laboratory simulation is of full
control on all parameters. Relationships were derived to
calculate the exact scour depth around circular piers
depending on shape and size of the pier, soil properties of the
channel bed, Froude number of flow, and vortex formation
and nature around the piers.
El Barbary and El-Sersawy carried out a hydraulic analysis
and scour evaluation for metro tunnel river crossing which
was constructed to cross the hydraulically complex reach of
the Nile River located downstream El-Malik El-Saleh and El-
Giza Bridges [13]. The river reach at the location of the
tunnel is divided into two channels, the eastern channel
(secondary channel) is crossed by El-Malik El-Saleh Bridge
and the western channel (main channel) is crossed by El-Giza
Bridge. One and two dimensional models for simulation the
flow pattern, evaluating the expected morphological changes
at the tunnel location using the historical and recent data, and
estimation of the scour depths due to release different
scenarios of discharges were applied. It was concluded that
the combination of one and two dimensional models provides
a flexible method to evaluate the morphological changes and
a good diagnostic tool to predict the design scour with
reasonable confidence.
Luh and Liu showed that the scour monitoring system has
demonstrated the capability to measure scouring depth [14].
The field results indicated that scour monitoring system using
scouring sensor and antenna stand has the potential for real
world application.
Prendergast and Gavin paved the way for low-maintenance
non-intrusive structural health monitoring to detect and
monitor scour development around structures [15].
Instrumentation related to traditional scour monitoring often
requires expensive installation and maintenance. Also, data
68 Mohammed Gamal Abdalla: A Study on Scour for Irrigation Canals in Egypt,
“Case Study: The First Reach of El-Ibrahimeya Canal”
interpretation from these instruments is difficult and time
consuming.
Capape and Martin-Vide made an evidence of transient
scour and fill [16]. The transient scour and fill refers to the
general scour and fill in a riverbed due to the passage of a
flood. Large sand-bed Pilcomayo River data was used. The
results showed that the velocity leaded to loops with large
hysteresis which is inexplicable by the unsteady flow over a
fixed bed.
3. Site Description
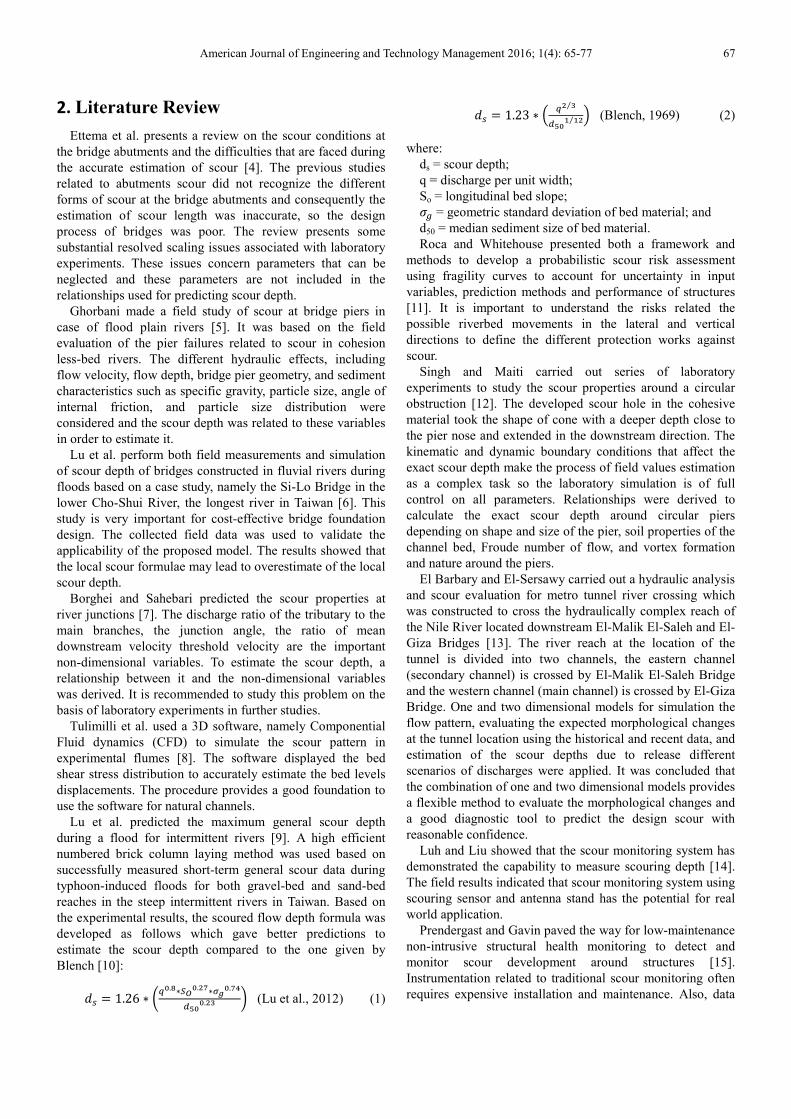
El-Ibrahimeya canal is considered as one of the main
canals in Egypt. Its length is about 267 km with its branches.
It is considered the greatest infrastructure that was
constructed in the era of the Khedive Ismael under the rule of
Ottomans. It was named after the Khedive Ibrahim, the father
of the Khedive Ismael. Also, it is considered one of the best
irrigation structures in the world in that time. It supplies
Assuit, Beni-Suef and Minya Governorates with water. The
reach under study is about 60 km length and takes its water
just before Assuit barrage from The Nile River in Assuit
Governorate and it ends just before Dairout barrage as shown
in figure (5). Also, the figure showed the location of the
bridge under study at km 23.
Figure 5. A google earth photo for reach under study.
4. Data Collection
The hydrographic survey of the reach under study was
carried out by Hydraulics Research Institute “HRI” of the
National Water Research Center, Ministry of water resources
and Irrigation, Egypt. Using the provided echo-sounder light
boat connected to digital global positing system (DGPS), to
record each data set point consisting of X and Y positions as
well as the flow depth at an interval of one second on the
equipped data logger. The hydrographic survey was carried out
along the length of the channel by making cross sections each
100 m. The bray-stoke type current meter was used for
velocity measurements provided with counters and timers. The
discharge values were measured at five cross sections of km 6,
26, 41, 47, and 53. The discharge value equals 565 m3/s at El-
Ibrahimeya intake during the measuring process while the
discharge value equals 350 m3/s just before Dairout regulator.
The measured water surface slope equals 5.8 cm/km as the
water level is (49.90) at El-Ibrahimeya intake while the water
level is (46.42) at Dairout regulator. Bed material sampler was
used to get three soil samples for each cross section and these
samples were analyzed to plot grain size distribution curves
and obtaining the properties of each sample.
5. Data Analysis
The obtained data was analyzed to get the best use of it.
Table (1) illustrates the design data for El-Ibrahimeya canal
which shows the bed width and level at different locations.
Table (2) shows the maximum and minimum discharges for
El-Ibrahimeya canal intake from 1955 to 1965. It is obvious
from the table that the maximum discharges range from
428.24 m3/s to 820.60 m
3/s while the minimum ones vary
between 19.68 m3/s and 57.87 m
3/s.
Table 1. Design data for some cross sections along the length of El-
Ibrahimeya canal.
km. Bed width (m) Bed level (m)
0.00 55 +(43.50)
28.60 55 +(41.79)
59.40 60 +(40.20)
60.60 60 +(40.15)
American Journal of Engineering and Technology Management 2016; 1(4): 65-77 69
Table 2. Maximum and minimum discharges in different years for El-
Ibrahimeya canal.
Year Maximum discharge (m3/s) Minimum discharge (m3/s)
1955 802.08 34.72
1956 820.60 57.87
1957 811.34 57.87
1958 820.60 19.68
ـــــ 820.60 1961
1963 810.19 57.87
1964 798.61 34.72
1965 428.24 34.72
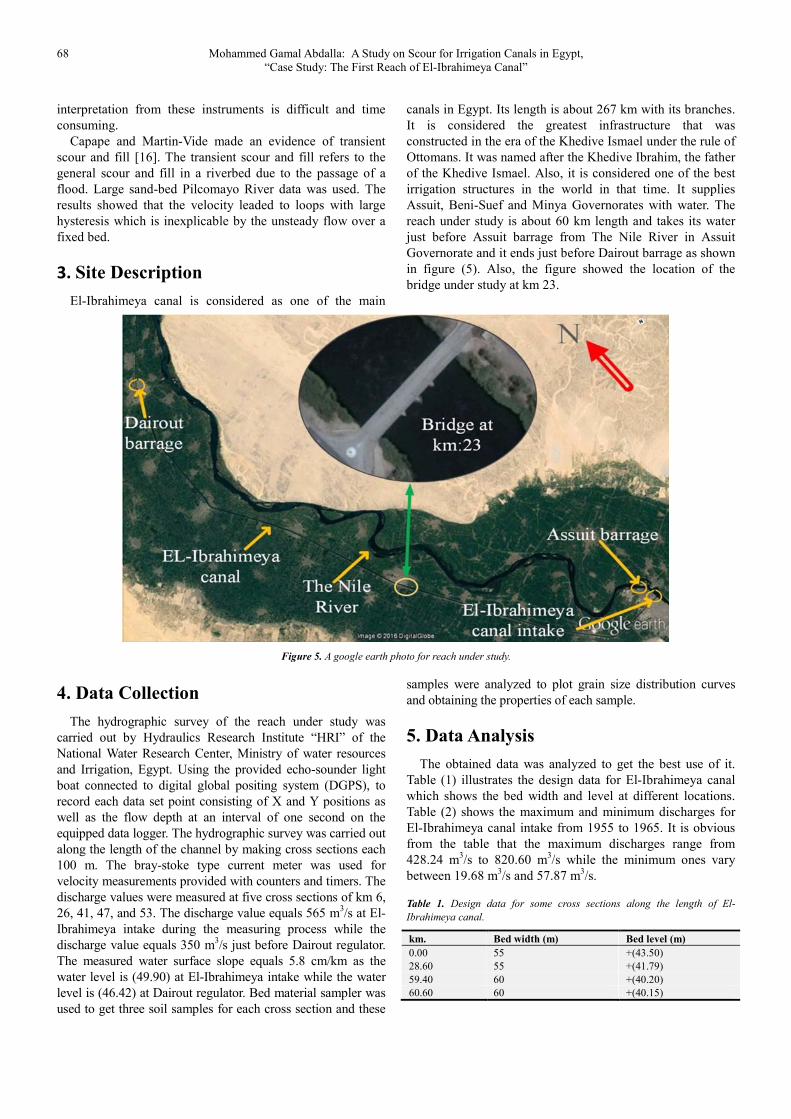
Figure (6) demonstrates a comparison between the
measured longituduinal section of El-Ibrahimeya in 1960 and
the design one. It is obvious from the figure that:
� There is a scour from km. 0 to km. 10 ranged from 1 m
to 2.25 m. The actual level increases with a distance 0.3
m more than the design one from km. 10 to km. 13
� The actual level gradually decreases from km. 13 until
the distance between the actual and design level equals
1.5 m at km. 16.
� The bed level reached the design level at km. 17
� The actual level increases more than the design level
from km. 30.5 to km. 32.0 until it reaches a maximum
value equals 0.6 m.
� The actual level decreases more than the design one
from km. 32 to km. 40 until it reaches a maximum value
of 0.5 m.
� From km. 40 to km. 46, the actual level increases more
than the design one with a value ranged from 0.5 m to
1.4 m.
� The actual level decreases more than the design one
from km. 46 to km. 55 until it reaches a maximum value
equaled 0.9 m.
� From km. 55 to km. 60, the actual level increases more
than the design one until it reached a maximum value of
1.5 m.
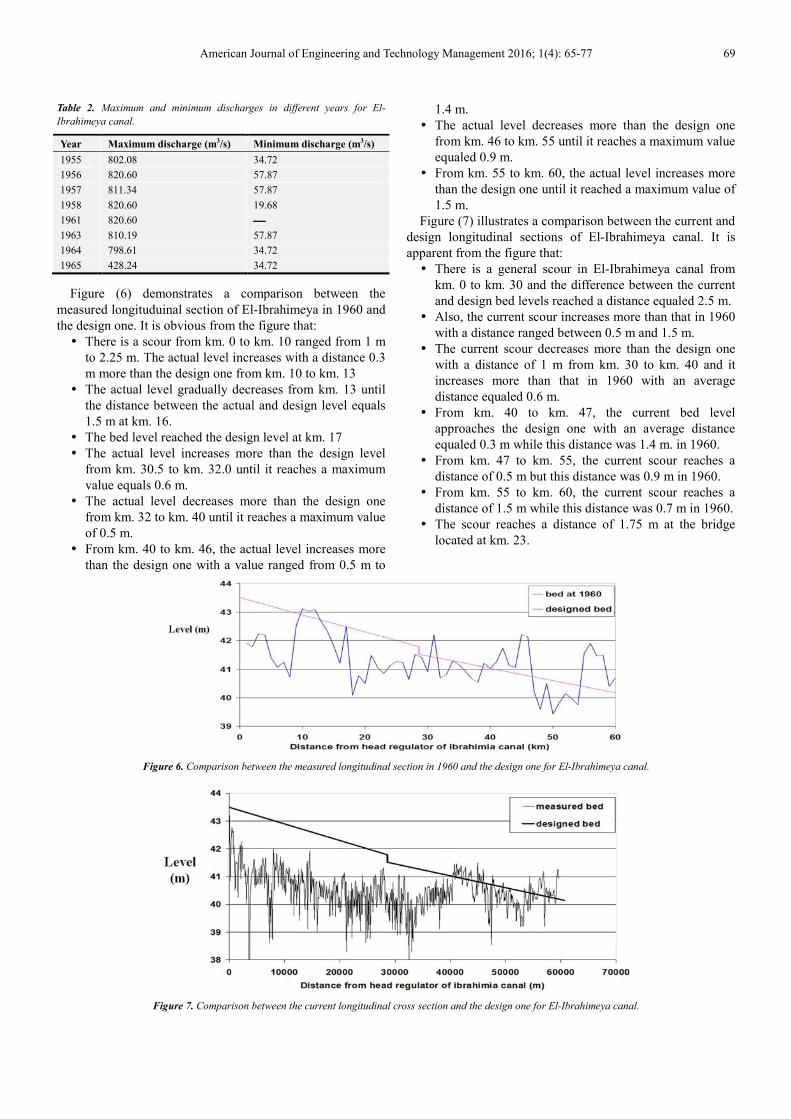
Figure (7) illustrates a comparison between the current and
design longitudinal sections of El-Ibrahimeya canal. It is
apparent from the figure that:
� There is a general scour in El-Ibrahimeya canal from
km. 0 to km. 30 and the difference between the current
and design bed levels reached a distance equaled 2.5 m.
� Also, the current scour increases more than that in 1960
with a distance ranged between 0.5 m and 1.5 m.
� The current scour decreases more than the design one
with a distance of 1 m from km. 30 to km. 40 and it
increases more than that in 1960 with an average
distance equaled 0.6 m.
� From km. 40 to km. 47, the current bed level
approaches the design one with an average distance
equaled 0.3 m while this distance was 1.4 m. in 1960.
� From km. 47 to km. 55, the current scour reaches a
distance of 0.5 m but this distance was 0.9 m in 1960.
� From km. 55 to km. 60, the current scour reaches a
distance of 1.5 m while this distance was 0.7 m in 1960.
� The scour reaches a distance of 1.75 m at the bridge
located at km. 23.
Figure 6. Comparison between the measured longitudinal section in 1960 and the design one for El-Ibrahimeya canal.
Figure 7. Comparison between the current longitudinal cross section and the design one for El-Ibrahimeya canal.
70 Mohammed Gamal Abdalla: A Study on Scour for Irrigation Canals in Egypt,
“Case Study: The First Reach of El-Ibrahimeya Canal”
From the previous results, the scour occurred because of
the flood discharges that pass through the cabal before 1960,
before the construction of High Aswan Dam. From the
previous results, it can be noted that the current scour
increased more than that before 1960 because of the
emergency discharges between 1960 and 1964 (During the
construction of High Dam).
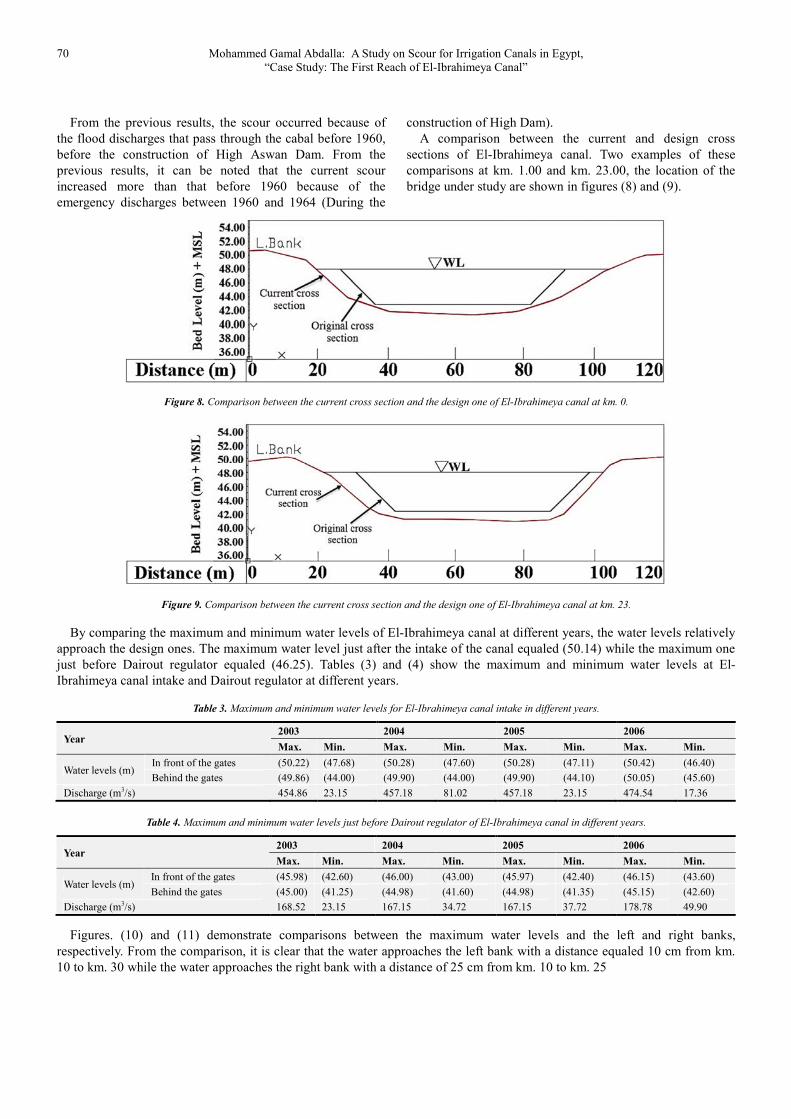
A comparison between the current and design cross
sections of El-Ibrahimeya canal. Two examples of these
comparisons at km. 1.00 and km. 23.00, the location of the
bridge under study are shown in figures (8) and (9).
Figure 8. Comparison between the current cross section and the design one of El-Ibrahimeya canal at km. 0.
Figure 9. Comparison between the current cross section and the design one of El-Ibrahimeya canal at km. 23.
By comparing the maximum and minimum water levels of El-Ibrahimeya canal at different years, the water levels relatively
approach the design ones. The maximum water level just after the intake of the canal equaled (50.14) while the maximum one
just before Dairout regulator equaled (46.25). Tables (3) and (4) show the maximum and minimum water levels at El-
Ibrahimeya canal intake and Dairout regulator at different years.
Table 3. Maximum and minimum water levels for El-Ibrahimeya canal intake in different years.
Year 2003 2004 2005 2006
Max. Min. Max. Min. Max. Min. Max. Min.
Water levels (m) In front of the gates (50.22) (47.68) (50.28) (47.60) (50.28) (47.11) (50.42) (46.40)
Behind the gates (49.86) (44.00) (49.90) (44.00) (49.90) (44.10) (50.05) (45.60)
Discharge (m3/s) 454.86 23.15 457.18 81.02 457.18 23.15 474.54 17.36
Table 4. Maximum and minimum water levels just before Dairout regulator of El-Ibrahimeya canal in different years.
Year 2003 2004 2005 2006
Max. Min. Max. Min. Max. Min. Max. Min.
Water levels (m) In front of the gates (45.98) (42.60) (46.00) (43.00) (45.97) (42.40) (46.15) (43.60)
Behind the gates (45.00) (41.25) (44.98) (41.60) (44.98) (41.35) (45.15) (42.60)
Discharge (m3/s) 168.52 23.15 167.15 34.72 167.15 37.72 178.78 49.90
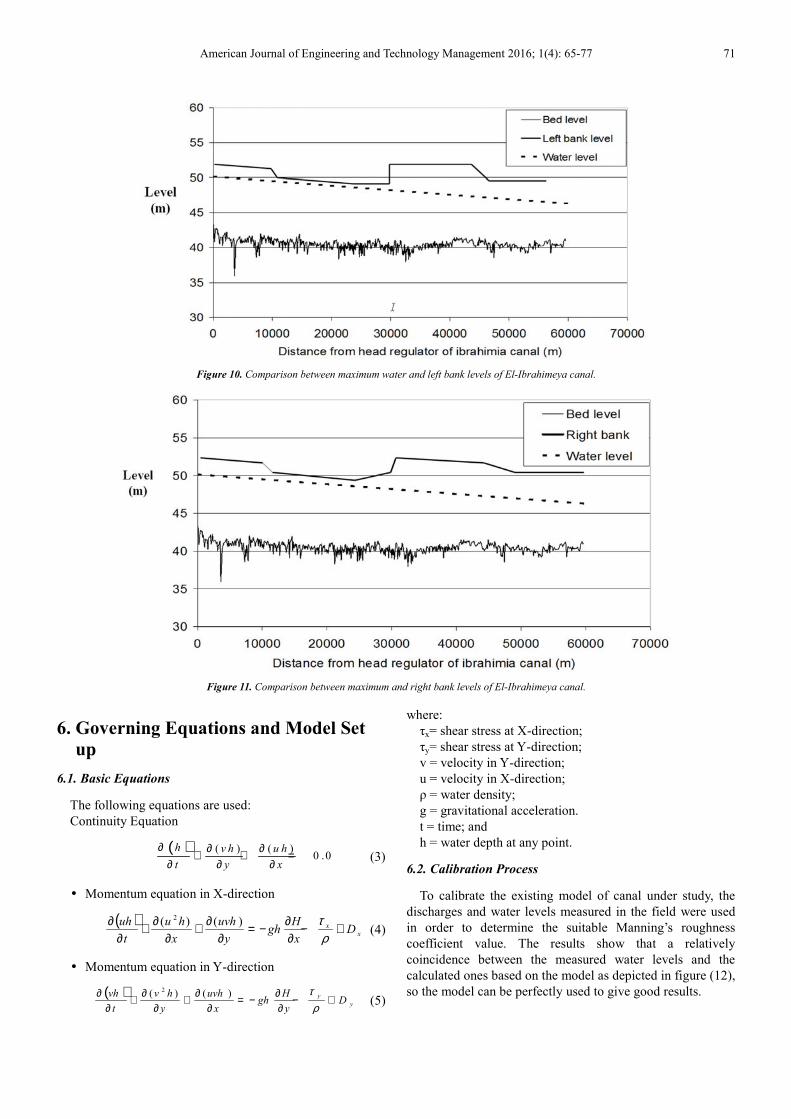
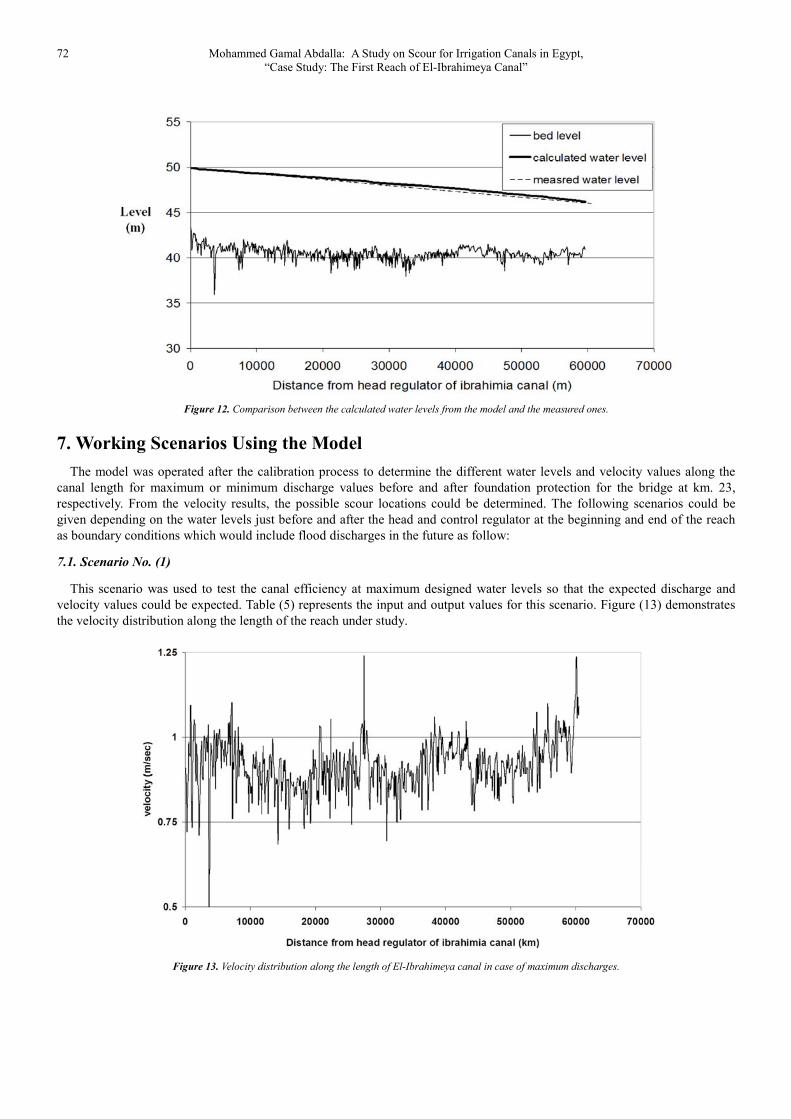
Figures. (10) and (11) demonstrate comparisons between the maximum water levels and the left and right banks,
respectively. From the comparison, it is clear that the water approaches the left bank with a distance equaled 10 cm from km.
10 to km. 30 while the water approaches the right bank with a distance of 25 cm from km. 10 to km. 25
American Journal of Engineering and Technology Management 2016; 1(4): 65-77 71
Figure 10. Comparison between maximum water and left bank levels of El-Ibrahimeya canal.
Figure 11. Comparison between maximum and right bank levels of El-Ibrahimeya canal.
6. Governing Equations and Model Set
up
6.1. Basic Equations
The following equations are used:
Continuity Equation
( ) ( ) ( )0 .0
h v h u h
t y x
∂ ∂ ∂+ + =∂ ∂ ∂ (3)
� Momentum equation in X-direction
( )x
x Dx
Hgh
y
uvh
x
hu
t
uh +−∂∂−=
∂∂+
∂∂+
∂∂
ρτ)()( 2
(4)
� Momentum equation in Y-direction
( )y
yD
y
Hgh
x
uvh
y
hv
t
vh +−∂
∂−=∂
∂+∂
∂+∂
∂ρ
τ)()( 2
(5)
where:
τx= shear stress at X-direction;
τy= shear stress at Y-direction;
v = velocity in Y-direction;
u = velocity in X-direction;
ρ = water density;
g = gravitational acceleration.
t = time; and
h = water depth at any point.
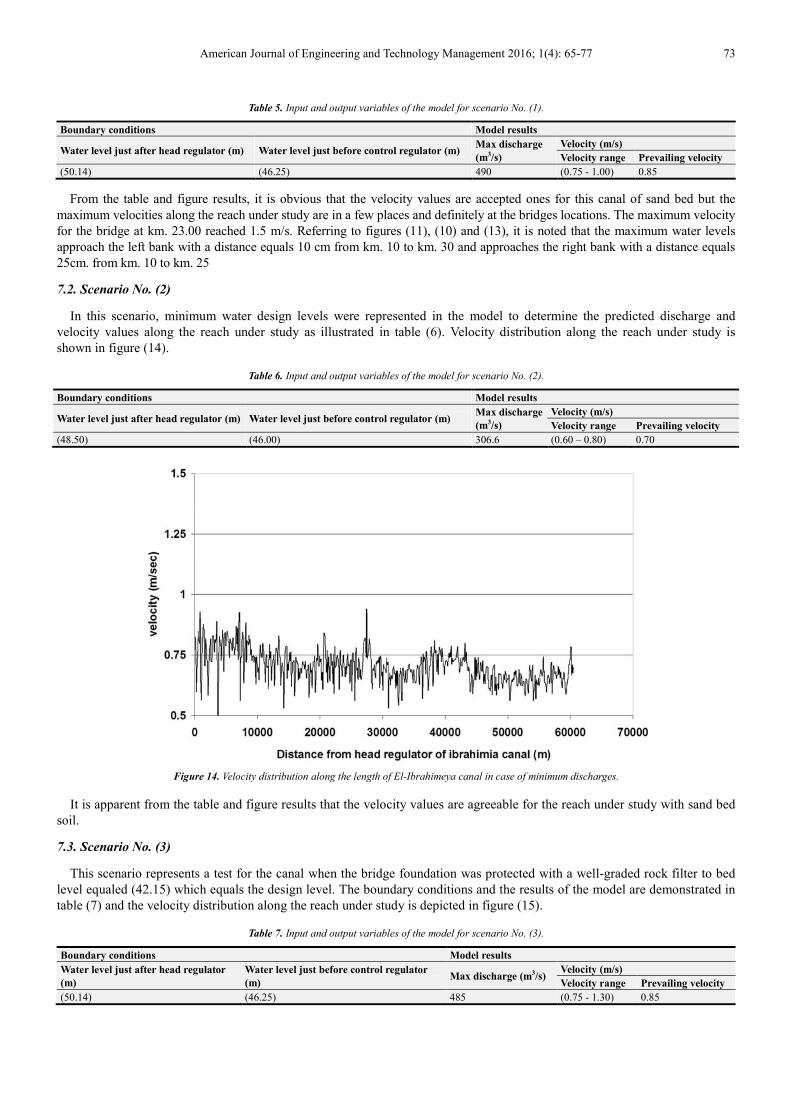
6.2. Calibration Process
To calibrate the existing model of canal under study, the
discharges and water levels measured in the field were used
in order to determine the suitable Manning’s roughness
coefficient value. The results show that a relatively
coincidence between the measured water levels and the
calculated ones based on the model as depicted in figure (12),
so the model can be perfectly used to give good results.
72 Mohammed Gamal Abdalla: A Study on Scour for Irrigation Canals in Egypt,
“Case Study: The First Reach of El-Ibrahimeya Canal”
Figure 12. Comparison between the calculated water levels from the model and the measured ones.
7. Working Scenarios Using the Model
The model was operated after the calibration process to determine the different water levels and velocity values along the
canal length for maximum or minimum discharge values before and after foundation protection for the bridge at km. 23,
respectively. From the velocity results, the possible scour locations could be determined. The following scenarios could be
given depending on the water levels just before and after the head and control regulator at the beginning and end of the reach
as boundary conditions which would include flood discharges in the future as follow:
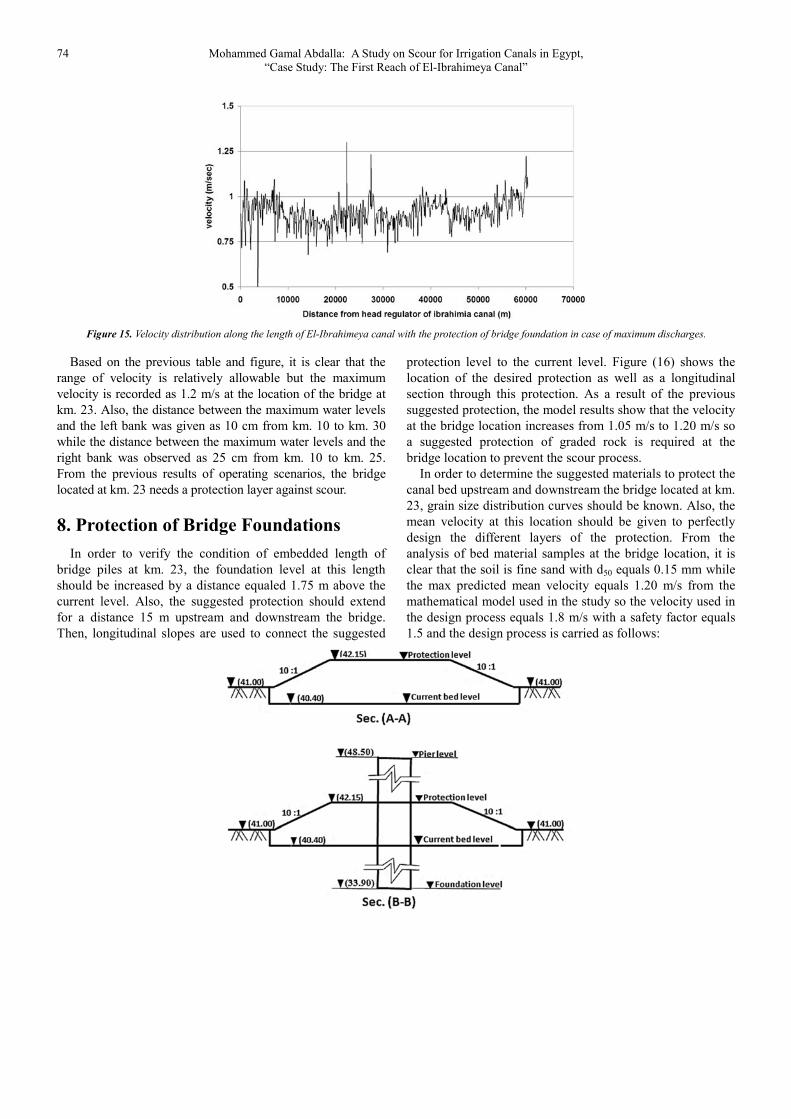
7.1. Scenario No. (1)
This scenario was used to test the canal efficiency at maximum designed water levels so that the expected discharge and
velocity values could be expected. Table (5) represents the input and output values for this scenario. Figure (13) demonstrates
the velocity distribution along the length of the reach under study.
Figure 13. Velocity distribution along the length of El-Ibrahimeya canal in case of maximum discharges.
American Journal of Engineering and Technology Management 2016; 1(4): 65-77 73
Table 5. Input and output variables of the model for scenario No. (1).
Boundary conditions Model results
Water level just after head regulator (m) Water level just before control regulator (m) Max discharge
(m3/s)
Velocity (m/s)
Velocity range Prevailing velocity
(50.14) (46.25) 490 (0.75 - 1.00) 0.85
From the table and figure results, it is obvious that the velocity values are accepted ones for this canal of sand bed but the
maximum velocities along the reach under study are in a few places and definitely at the bridges locations. The maximum velocity
for the bridge at km. 23.00 reached 1.5 m/s. Referring to figures (11), (10) and (13), it is noted that the maximum water levels
approach the left bank with a distance equals 10 cm from km. 10 to km. 30 and approaches the right bank with a distance equals
25cm. from km. 10 to km. 25
7.2. Scenario No. (2)
In this scenario, minimum water design levels were represented in the model to determine the predicted discharge and
velocity values along the reach under study as illustrated in table (6). Velocity distribution along the reach under study is
shown in figure (14).
Table 6. Input and output variables of the model for scenario No. (2).
Boundary conditions Model results
Water level just after head regulator (m) Water level just before control regulator (m) Max discharge
(m3/s)
Velocity (m/s)
Velocity range Prevailing velocity
(48.50) (46.00) 306.6 (0.60 – 0.80) 0.70
Figure 14. Velocity distribution along the length of El-Ibrahimeya canal in case of minimum discharges.
It is apparent from the table and figure results that the velocity values are agreeable for the reach under study with sand bed
soil.
7.3. Scenario No. (3)
This scenario represents a test for the canal when the bridge foundation was protected with a well-graded rock filter to bed
level equaled (42.15) which equals the design level. The boundary conditions and the results of the model are demonstrated in
table (7) and the velocity distribution along the reach under study is depicted in figure (15).
Table 7. Input and output variables of the model for scenario No. (3).
Boundary conditions Model results
Water level just after head regulator
(m)
Water level just before control regulator
(m) Max discharge (m3/s)
Velocity (m/s)
Velocity range Prevailing velocity
(50.14) (46.25) 485 (0.75 - 1.30) 0.85
74 Mohammed Gamal Abdalla: A Study on Scour for Irrigation Canals in Egypt,
“Case Study: The First Reach of El-Ibrahimeya Canal”
Figure 15. Velocity distribution along the length of El-Ibrahimeya canal with the protection of bridge foundation in case of maximum discharges.
Based on the previous table and figure, it is clear that the
range of velocity is relatively allowable but the maximum
velocity is recorded as 1.2 m/s at the location of the bridge at
km. 23. Also, the distance between the maximum water levels
and the left bank was given as 10 cm from km. 10 to km. 30
while the distance between the maximum water levels and the
right bank was observed as 25 cm from km. 10 to km. 25.
From the previous results of operating scenarios, the bridge
located at km. 23 needs a protection layer against scour.
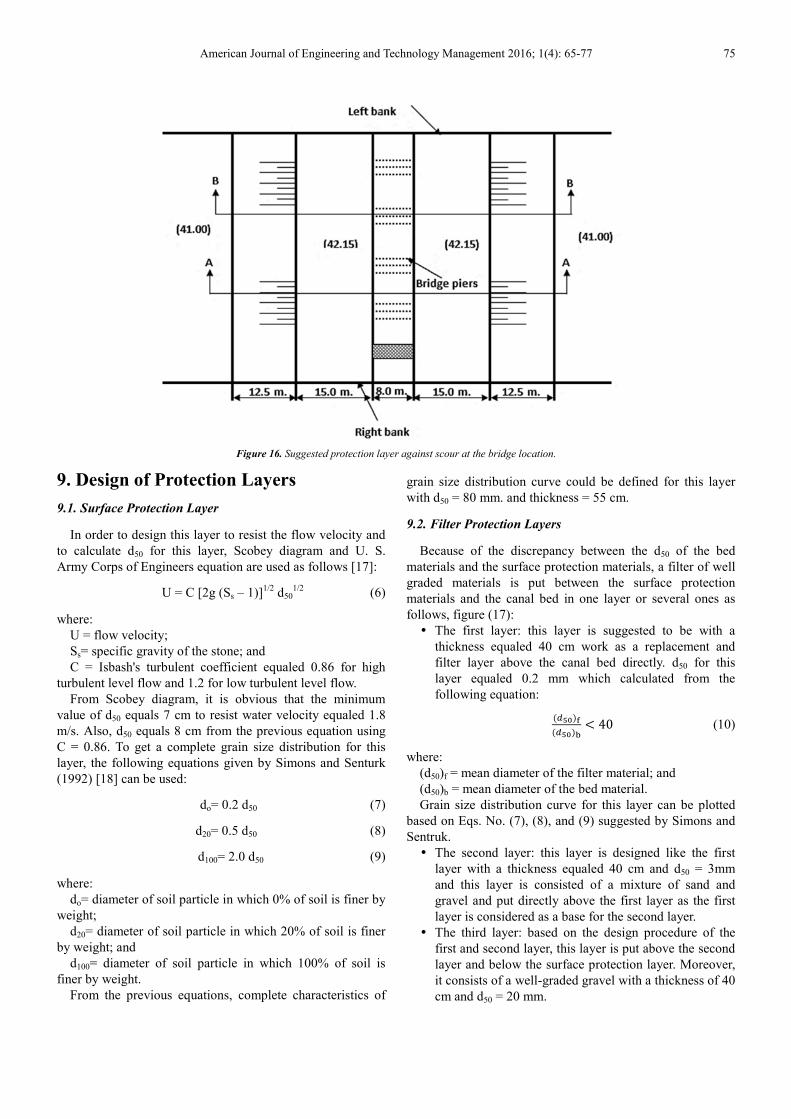
8. Protection of Bridge Foundations
In order to verify the condition of embedded length of
bridge piles at km. 23, the foundation level at this length
should be increased by a distance equaled 1.75 m above the
current level. Also, the suggested protection should extend
for a distance 15 m upstream and downstream the bridge.
Then, longitudinal slopes are used to connect the suggested
protection level to the current level. Figure (16) shows the
location of the desired protection as well as a longitudinal
section through this protection. As a result of the previous
suggested protection, the model results show that the velocity
at the bridge location increases from 1.05 m/s to 1.20 m/s so
a suggested protection of graded rock is required at the
bridge location to prevent the scour process.
In order to determine the suggested materials to protect the
canal bed upstream and downstream the bridge located at km.
23, grain size distribution curves should be known. Also, the
mean velocity at this location should be given to perfectly
design the different layers of the protection. From the
analysis of bed material samples at the bridge location, it is
clear that the soil is fine sand with d50 equals 0.15 mm while
the max predicted mean velocity equals 1.20 m/s from the
mathematical model used in the study so the velocity used in
the design process equals 1.8 m/s with a safety factor equals
1.5 and the design process is carried as follows:
American Journal of Engineering and Technology Management 2016; 1(4): 65-77 75
Figure 16. Suggested protection layer against scour at the bridge location.
9. Design of Protection Layers
9.1. Surface Protection Layer
In order to design this layer to resist the flow velocity and
to calculate d50 for this layer, Scobey diagram and U. S.
Army Corps of Engineers equation are used as follows [17]:
U = C [2g (Ss – 1)]1/2
d501/2
(6)
where:
U = flow velocity;
Ss= specific gravity of the stone; and
C = Isbash's turbulent coefficient equaled 0.86 for high
turbulent level flow and 1.2 for low turbulent level flow.
From Scobey diagram, it is obvious that the minimum
value of d50 equals 7 cm to resist water velocity equaled 1.8
m/s. Also, d50 equals 8 cm from the previous equation using
C = 0.86. To get a complete grain size distribution for this
layer, the following equations given by Simons and Senturk
(1992) [18] can be used:
do= 0.2 d50 (7)
d20= 0.5 d50 (8)
d100= 2.0 d50 (9)
where:
do= diameter of soil particle in which 0% of soil is finer by
weight;
d20= diameter of soil particle in which 20% of soil is finer
by weight; and
d100= diameter of soil particle in which 100% of soil is
finer by weight.
From the previous equations, complete characteristics of
grain size distribution curve could be defined for this layer
with d50 = 80 mm. and thickness = 55 cm.
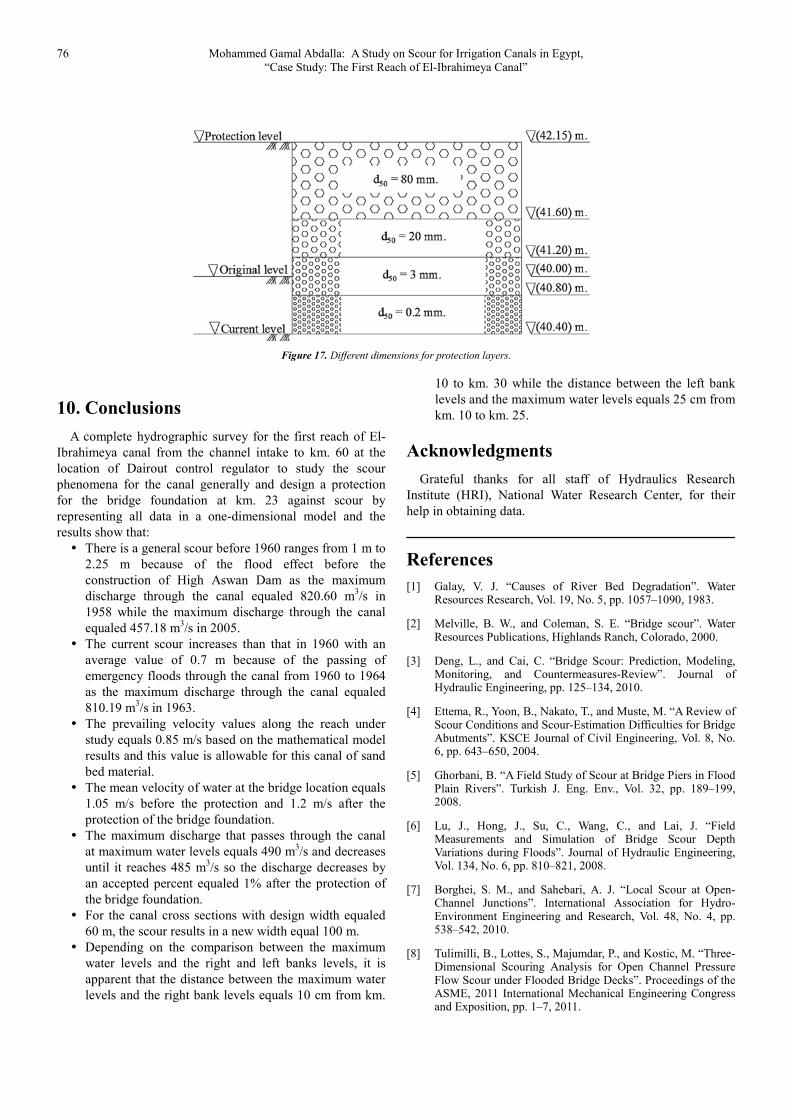
9.2. Filter Protection Layers
Because of the discrepancy between the d50 of the bed
materials and the surface protection materials, a filter of well
graded materials is put between the surface protection
materials and the canal bed in one layer or several ones as
follows, figure (17):
� The first layer: this layer is suggested to be with a
thickness equaled 40 cm work as a replacement and
filter layer above the canal bed directly. d50 for this
layer equaled 0.2 mm which calculated from the
following equation:
���� !���� " # 40 (10)
where:
(d50)f = mean diameter of the filter material; and
(d50)b = mean diameter of the bed material.
Grain size distribution curve for this layer can be plotted
based on Eqs. No. (7), (8), and (9) suggested by Simons and
Sentruk.
� The second layer: this layer is designed like the first
layer with a thickness equaled 40 cm and d50 = 3mm
and this layer is consisted of a mixture of sand and
gravel and put directly above the first layer as the first
layer is considered as a base for the second layer.
� The third layer: based on the design procedure of the
first and second layer, this layer is put above the second
layer and below the surface protection layer. Moreover,
it consists of a well-graded gravel with a thickness of 40
cm and d50 = 20 mm.
76 Mohammed Gamal Abdalla: A Study on Scour for Irrigation Canals in Egypt,
“Case Study: The First Reach of El-Ibrahimeya Canal”
Figure 17. Different dimensions for protection layers.
10. Conclusions
A complete hydrographic survey for the first reach of El-
Ibrahimeya canal from the channel intake to km. 60 at the
location of Dairout control regulator to study the scour
phenomena for the canal generally and design a protection
for the bridge foundation at km. 23 against scour by
representing all data in a one-dimensional model and the
results show that:
� There is a general scour before 1960 ranges from 1 m to
2.25 m because of the flood effect before the
construction of High Aswan Dam as the maximum
discharge through the canal equaled 820.60 m3/s in
1958 while the maximum discharge through the canal
equaled 457.18 m3/s in 2005.
� The current scour increases than that in 1960 with an
average value of 0.7 m because of the passing of
emergency floods through the canal from 1960 to 1964
as the maximum discharge through the canal equaled
810.19 m3/s in 1963.
� The prevailing velocity values along the reach under
study equals 0.85 m/s based on the mathematical model
results and this value is allowable for this canal of sand
bed material.
� The mean velocity of water at the bridge location equals
1.05 m/s before the protection and 1.2 m/s after the
protection of the bridge foundation.
� The maximum discharge that passes through the canal
at maximum water levels equals 490 m3/s and decreases
until it reaches 485 m3/s so the discharge decreases by
an accepted percent equaled 1% after the protection of
the bridge foundation.
� For the canal cross sections with design width equaled
60 m, the scour results in a new width equal 100 m.
� Depending on the comparison between the maximum
water levels and the right and left banks levels, it is
apparent that the distance between the maximum water
levels and the right bank levels equals 10 cm from km.
10 to km. 30 while the distance between the left bank
levels and the maximum water levels equals 25 cm from
km. 10 to km. 25.
Acknowledgments
Grateful thanks for all staff of Hydraulics Research
Institute (HRI), National Water Research Center, for their
help in obtaining data.
References
[1] Galay, V. J. “Causes of River Bed Degradation”. Water Resources Research, Vol. 19, No. 5, pp. 1057–1090, 1983.
[2] Melville, B. W., and Coleman, S. E. “Bridge scour”. Water Resources Publications, Highlands Ranch, Colorado, 2000.
[3] Deng, L., and Cai, C. “Bridge Scour: Prediction, Modeling, Monitoring, and Countermeasures-Review”. Journal of Hydraulic Engineering, pp. 125–134, 2010.
[4] Ettema, R., Yoon, B., Nakato, T., and Muste, M. “A Review of Scour Conditions and Scour-Estimation Difficulties for Bridge Abutments”. KSCE Journal of Civil Engineering, Vol. 8, No. 6, pp. 643–650, 2004.
[5] Ghorbani, B. “A Field Study of Scour at Bridge Piers in Flood Plain Rivers”. Turkish J. Eng. Env., Vol. 32, pp. 189–199, 2008.
[6] Lu, J., Hong, J., Su, C., Wang, C., and Lai, J. “Field Measurements and Simulation of Bridge Scour Depth Variations during Floods”. Journal of Hydraulic Engineering, Vol. 134, No. 6, pp. 810–821, 2008.
[7] Borghei, S. M., and Sahebari, A. J. “Local Scour at Open-Channel Junctions”. International Association for Hydro-Environment Engineering and Research, Vol. 48, No. 4, pp. 538–542, 2010.
[8] Tulimilli, B., Lottes, S., Majumdar, P., and Kostic, M. “Three-Dimensional Scouring Analysis for Open Channel Pressure Flow Scour under Flooded Bridge Decks”. Proceedings of the ASME, 2011 International Mechanical Engineering Congress and Exposition, pp. 1–7, 2011.
American Journal of Engineering and Technology Management 2016; 1(4): 65-77 77
[9] Lu, J., Su, C., Hong, J., and Chen, E. “Prediction of Maximum General Scour Depth during a Flood for Intermittent Rivers”. ICSE6, Paris, pp. 79–86, 2012.
[10] Blench, T. “Mobile-Bed Fluviology”, University of Alberta Press, Edmonton, Canada, 1969.
[11] Roca, M., and Whitehouse, R. “Scour Risk Assessment at River Crossings”. Proceedings of ICSE6, Paris, pp. 1–10, 2012.
[12] Singh, S. M., and Maiti, P. R. “Local Scouring around a Circular Pier in Open Channel”. International Journal of Emerging Technology and Advanced Engineering, Vol. 2, No. 5, pp. 454–458, 2012.
[13] El Barbary, Z., and El-Sersawy, H. “Hydraulic Analysis and Scour Evaluation for Metro Tunnel River Crossing”. Journal of Applied Sciences Research, Vol. 9, No. 8, pp. 5146–5158, 2013.
[14] Luh, Y. P., and Liu, Y. C. “Bridge’s Scour Monitoring System”. Proceedings of the 2nd International Conference on Intelligent Technologies and Engineering Systems. Springer International Publishing, pp. 577–583, 2014.
[15] Prendergast, L., and Gavin, K. “A Review of Bridge Scour Monitoring Techniques”. Journal of Rock Mechanics and Geotechnical Engineering, Vol. 6, No. 2, pp. 138–149, 2014.
[16] Capape, S., and Martin-Vide, J. P. “Evidence of Transient Scour and Fill”. E-Proceedings of the 36th IAHR World Congress, Netherlands, pp. 4–5, 2015.
[17] Isbash, S. “Construction of Dams by Depositing Rock in Running Water”. International Congress on Large Dams, 1936.
[18] Simons, D., and Senturk, F. “Sediment Transport Technology: Water and Sediment Dynamics”. Water Resources Publication, 1992.