Combining and aggregating environmental data for status and trend ...
"A STUDY ON MARKETING, USAGE TREND AND
STATUS OF FANTA & MIRINDA IN
KALAIYA."
By
Devanti Shah
T.U. Regd. No. 18617-90
Thakur Ram Multiple Campus, Birgunj
Campus Roll No. 25/059
A THESIS
SUBMITTED TO :
OFFICE OF THE DEAN
FACULTY OF MANAGEMENT
TRIBHUVAN UNIVERSITY
IN THE PARTIAL FULFILLMENT OF THE REQUIREMENTS
FOR THE DEGREE OF
MASTERS OF BUSINESS STUDIES (M.B.S.)
BIRGUNJ, PARSA (NEPAL)MARCH, 2009

2
RECOMMENDATION
This is to certify that the thesis
Submitted by
Devanti Shah
Entitled
"A Study Of Marketing Usage Trend and Status of Fanta and Mirinda
in Kalaiya"
has been prepared as approved by this department in the prescribed format
of the faculty of management. This thesis is forwarded for examination.
………………………….. ………………………….
Mr. Rajeshwar Pd. Acharya Mr. Rajeshwar Pd. Acharya
(Thesis Supervisor) (Chairperson)
Lecturer, T.R.M. Campus, Birgunj Research Committee
………………………
Campus chief
Date……………….

3
VIVA-VOCE SHEET
We have conducted the viva-voce examination of the thesis
Presented by
Devanti Shah
Entitled
" A study on Marketing, usage Trend and status of Fanta and Mirinda
in Kalaiya " and found the thesis to be the original work of the student and
written according to prescribed format. We recommend the thesis to be accepted
as partial fulfillment of the requirements for Master's Degree in Business Studies
[M.B.S.]
Viva-Voce Committee
Chairperson, Research Committee ………………….
Member (Thesis supervisor) …………………..
Member (External Expert) …………………
Date: ………………..

4
Acknowledgement
This thesis entitled "A study on Marketing, usage Trend and status of
Fanta and Mirinda in Kalaiya" was completed under the entire
co-operation and supervision of my respected guru and guide
Mr. Rajeshwar Pd. Acharya, Lecturer of Faculty of Management at Thakur
Ram Multiple Campus, Birgunj. First, I would like to express my sincere
gratitude to him for his invaluable contributions. I am heartily indebted to
Mr. Rajeshwar Pd. Acharya, the Head of the department of Research
committee (Management) at TRM campus, Birgunj for providing me
adequate suggestions in completion of his thesis likewise, my sincere
thanks goes to my reverent professors. Mr. Avinash Pd. Singh, Dr. Deepak
Shakya, Mr. K.K Shah, Mr. Sanjay Shrestha, Mr. Lalan Dwibedi, Mr.
Bhim Lal Paudel and Mr. Pradeep Aryal for their proper guidance and
encouragement.
I am very much thankful to the retailers, the Hotelers and the consumers as
well as the distributors of Fanta and Mirinda who spared their valuable
time and energy in filling up the questionnaires for accomplishing this
research. Finally, I cannot stand without thanking to Mr. Kalyan P. Gautam
(Lotus Computer, Rec by Nepal Government) computer for laboriously
typing my thesis. TRM Campus staff Mr. Jiwan Shrestha for providing the
needed documents and Newa photo copy for binding it properly.
Last but not the least I want to extent my thankful regards to my family.
Specially to my husband Dr. Mukti Narayan Shah, without whose kindly
supports. I might not have completed this thesis in time.
Devanti Shah
March, 2009

5
CHAPTER 1
Recommendation
Viva vice Sheet
Acknowledgement
Contents
Abbreviation
Introduction
1.1 Background :- .............................................................................. Error! Bookmark not defined.
1.2 Multinational Company ( MNC's) ................................................. Error! Bookmark not defined.
1.3 Focus of the study :- .................................................................... Error! Bookmark not defined.
1.3 Statement of the problems :- ...................................................... Error! Bookmark not defined.
1.4 Objectives of the study ................................................................ Error! Bookmark not defined.
1.5. Importance of the study :- .......................................................... Error! Bookmark not defined.
1.6. Limitation of the study :- ............................................................ Error! Bookmark not defined.
Review of literature .......................................................................... Error! Bookmark not defined.
2.1 Introduction:- .......................................................................... Error! Bookmark not defined.
2.2 Conceptual Framework ............................................................ Error! Bookmark not defined.
2.2.1 .................................................................................................................... The market
......................................................................................................... Error! Bookmark not defined.
2.2.2 ...................................................................................................................... Marketing
......................................................................................................... Error! Bookmark not defined.
2.2.3 ........................................................................................................... Marketing System
......................................................................................................... Error! Bookmark not defined.
2.2.4 Marketing Environment............................................................ Error! Bookmark not defined.
2.2.5 Environment Scanning and Analysis .......................................... Error! Bookmark not defined.
2.2.6 Role of marketing in industrialization ....................................... Error! Bookmark not defined.
2.2.7 The marketing mix .................................................................... Error! Bookmark not defined.
2.2.7.1 Product ................................................................................. Error! Bookmark not defined.

6
2.2.7.2 ........................................................................................................................... Place
......................................................................................................... Error! Bookmark not defined.
2.2.7.3 Promotion ............................................................................. Error! Bookmark not defined.
2.2.7.4 Price ...................................................................................... Error! Bookmark not defined.
2.2.8 Marketing Strategy ................................................................... Error! Bookmark not defined.
2.2.8.1 ........................................................................................................... Product strategy
......................................................................................................... Error! Bookmark not defined.
2.2.8.3 Distribution Strategy ............................................................. Error! Bookmark not defined.
2.2.8.2 Pricing strategy ...................................................................... Error! Bookmark not defined.
2.2.8.4 Promotional Strategy ............................................................. Error! Bookmark not defined.
Sales Promotion:- .............................................................................. Error! Bookmark not defined.
2.2.9 Status ....................................................................................... Error! Bookmark not defined.
2.2.9.1 Status Analysis ....................................................................... Error! Bookmark not defined.
2.2.9.1.1 Product and service status .................................................. Error! Bookmark not defined.
2.2.9.2 ......................................................................................................... Perceived Quality
......................................................................................................... Error! Bookmark not defined.
2.2.10.................................................................................................................. Usage Trend
......................................................................................................... Error! Bookmark not defined.
2.3 ...................................................................................................Review of Related Studies
......................................................................................................... Error! Bookmark not defined.
2.3.1 Rajendra Bahadur Shrestha A study marketing usage pattern, Attitude and Image of cold
drinks in kalaiya Area, unpublished dissertation submitted to the faculty of management, TRM campus
Kalaiya. Error! Bookmark not defined.
2.4 .................................................................................................. Review of Related Articles
......................................................................................................... Error! Bookmark not defined.
2.4.1 ............................................................................. Annual Review of Coca-Cola Company.
......................................................................................................... Error! Bookmark not defined.
2.4.2 Task Force Report ..................................................................... Error! Bookmark not defined.
2.4.2.1 Market Place ......................................................................... Error! Bookmark not defined.
2.4.2.2 Quality .................................................................................. Error! Bookmark not defined.

7
2.4.4 Birth of the top brand ............................................................... Error! Bookmark not defined.
3.1 Introduction ................................................................................ Error! Bookmark not defined.
3.2 Research Design .......................................................................... Error! Bookmark not defined.
3.3 Population and Sample................................................................ Error! Bookmark not defined.
3.4 Nature and sources of Data ......................................................... Error! Bookmark not defined.
3.5 Data collection procedures ........................................................ Error! Bookmark not defined.4
3.6 Data processing and Analysis ....................................................... Error! Bookmark not defined.
4. Data Presentation And Analysis ..................................................... Error! Bookmark not defined.
4.1. ..............................................................................................................Consumer Survey
......................................................................................................... Error! Bookmark not defined.
............................................................................................................. Error! Bookmark not defined.
4.3 Major findings of the study.......................................................... Error! Bookmark not defined.
5.1 Summary ..................................................................................... Error! Bookmark not defined.
5.2 Conclusion .................................................................................. Error! Bookmark not defined.
5.3 Recommendations ...................................................................... Error! Bookmark not defined.
BIBLIOGRAPHY .................................................................................. Error! Bookmark not defined.
DISSERTATIONS: ................................................................................ Error! Bookmark not defined.
JOURNALS ......................................................................................... Error! Bookmark not defined.
WEBSITES .......................................................................................... Error! Bookmark not defined.
Appendex-1 ...................................................................................... Error! Bookmark not defined.
Appendex-2 ...................................................................................... Error! Bookmark not defined.

8
CHAPTER – 1
INTRODUCTION
1.1 Background :-
Nepal is one of the smallest and least developed countries of world. It is
located between latitude 26022' north to 30027' north and longitude 8004' east to
88012' east having a total area of 147,181 Sq. Km. with a population of around
23.81 million ( Tpc 2005:1) life expectancy a birth is estimated at 58.9 years and
infant mortality is 79 per 1000.( Shrestha, 2001::)
Nepal Previously known as a Hindu State with deep-seated monarchy, has
recently been changed into a Federal Democratic Republic. As the country is
located on the southern slopes of the great Himalayas, its beauty and glamour
always remain a source of attraction for visitors and nature lovers. It is a multi-
lingual, multi-racial, multi-religious and multi–occupational country. According
to census report of 2001, it has become a very fertile land for languages & more
than 92 languages are spoken here. About 82 % of the total population derives
livelihood from agriculture and rest depends on other sectors.
Marketing in essence and Fanta & Miranda, is related to the production,
distribution and sales of trade. It enables an organization to know what the
customers rally need and want and what products are to be made to meet both the
necessity of customers and promotion of the sales. Today's marketing
environment is characterized by globalization, technological change and intense
competition. Successful marketers are those who deliver what customers are
willing to purchase as well as ability to purchase. For this reason marketers today
conduct many research and development to study consumer behavior so as to
recognize why and how individual make their consumers decisions. Once it is
understood marketer become able to predict and shape their marketing strategies
accordingly. Definitely marketers who understand markets and consumer
behavior have great competitive advantage in the organization or manufacturer
must determine the attitudes, needs & wants of their customer first and then bring
products in the markets accordingly.
According to Mc Carthy and William D. Perreault – "Marketing is the
performance of anticipating customer or client needs and directing a flow of need
satisfying goods and services from producer to customer or client."
According to Philip Kotler – "Marketing is a social and managerial process
by which individuals and groups obtain what they need and want through
creating, offering and exchanging products of value with others,"
According to American Marketing Association defines marketing as –
"The process of planning of executing the conception pricing, promotion and

9
distribution of idea, goods and services to create exchanges that satisfying
individual and organizational objectives."
According to William J. Stanton and Charles Futrell – "Marketing is a total
system of business activities designed to plan, price, promote and distribute want
– satisfying products, services and ideas to target markets in order to achieve
organizational objectives."
Marketers say branding is the art and cornerstone of marketing. A brand is
a name , term, sign, symbol or design or a combination of them intended to
identify the goods or services of one seller or group of sellers and to differentiate
the from those of competitors. A brand name carries many associations in the
minds of people. These associations make up the brand image. Smart companies,
when they first became acquainted with the product category and brands, what
their brand beliefs are, and how they are satisfied after they purchase. Therefore
the above definitions of marketing suggest that it consists some activities
consisting of study of consumer needs product, price, place and promotion to
facilitate exchange and brands that satisfies individual as well as organizational
objectives within the social and marketing environment prevailing today. This
highlights the important of product is the whole process of marketing mix.
Research area selected for our study is Kalaiya which is a big commercial
hub of Nepal. Being the most populated district, it may prove to be the most
suitable area for the purpose of our research. Since, most of modern hotels,
restaurants and bakeries are also situated in Kalaiya. The consumption of the cold
drinks is found to be in big volume. As such, the true characteristics of the (
Fanta, Miranda) drinks available in the markets. At the same time the results
derived by the research are appreciable to whole country.
1.2 Multinational Company ( MNC's)
The business enterprises which have their headquarters in any one country
and operate business in other countries as well as called multinational companies.
These companies like Europe, Australia and south America the activities of these
companies range from the production of mineral, tea, rubber, coffee, soft drink
exploration and production and processing of oil to the production of goods and
service activities like banking, Insurance, shipping hotel etc. The investment
made by multinational companies has increased dramatically since early 1980s.
According to Sanjay Lall & Streetem – "Multinational Companies are very
large firms with widespread operations which are clearly international in
character and have more than five foreign subsidiaries or more than 15 percent of
total sales produced abroad and acting in cohesive manner to achieve maximum
profit or growth."
According to Mallampally and Sauvant since early 1980s the world foreign
direct investment made by 54,000 MNCs has increase more rapidly than world
10
trade or world output. During 1980-97 the outflow of foreign direct investment
(FDI) increased in the average rate of about 134 percent per annum. In 1998, the
inflow and outflow of global urover 3.4 billion dollar in 4,49,000 foreign
affiliates. The sale proceed of foreign affiliates has reached about 9.5 biullion.
Some of the MNCs operating in Nepal are Surya Nepal Companies,
Colgate Palmolive Nepal, Sitaram Gokul Mills, Nepal Lever Limited, Asian
Paints, Fanta and Miranda, Pepsi Cola and Coca Cola companies. Coca-cola
Sabco operates in seven southern & East African countries and five Asian
countries and employees more than 9,000 people. Coca-cola, imported from
India, was first introducing into Nepal in 1973, with local production of coca-cola
beginning in 1979. Bottlers Nepal Limited (BNL) is the only bottler of coca-cola
production in Nepal and has two bottling plants, namely Kathmandu (BNL) and
Bharatpur (Botllers Nepal Terai limited which is 160 km from Kathmandu, its
capital. The Kathmandu operation stared with 85 BPM in 1979 and currently has
two lines, 220 Bpm in operation since 1985 and 430 BPM running since 1997.
The Bharatpur (Terai) palnt has one line of 350 BPM, which has been in
operation since 1987. Coca-cola companies operate 27 bottling plant and aims to
fulfill requirement of more than 290 million consumers that f live in its markets.
All consumers concern deals with a fair, timely and friendly manner, so as too
satisfy them and resolve their concerns.
Marketing and advertising communication are focused on POP ( Point of
sale), Radio, TV, Hoardings, Truck backs etc. Emphasis is also placed on
consumer price to enforce price compliance.
Marketing and advertising communications are customized to suit to local
sentiments-social, religious, ethnic.
Innovation package and package sizes are offered to give better value to
consumers and ease of storage to retailers.
Price and packs are introduced ina format that is affordable to all segments
of society.
The approach by the Nepal operation to environment issues is guided by a simple
principle to conduct their business in ways that protects, preserve and enhance the
environment. The fully automatic Effluent treatment plants (ETP) are established
in both its plants and have been operational since 2001, to protect the local
environmen6 as well as meet the standards of the coca-cola quality system
(TCCQS).In association with the local community, BNL supports free health
check-up clinic I at Bharatpur. The health centre is managed by a qualified
MBBS doctors and I trained paramedics, who extend free check-ups communities
around theplantin the Terai area. The facility has thus far helped over 600
families get the best medical attention locally. Senior citizens are the main
beneficiaries.
General information about BNL:-

11
Bottling plants : 2
Location : Kathmandu aznd Bharatpur
Numbers of employees : 1000 (Nearly)

12
Country information :-
Capital : Kathmandu
Population : 23.21 Million (Tpc 2005:1)
Life expectancy a birth : 59.9 years (Tpc 2005:1)
Business Language : Nepali
It's per capital income of about Rs. 200,527 (equivalent to USS 276) in F.Y.
2003/04. The GDP current producer's price is estimated to increase by 39.95
billion and has reached Rs. 494.88 billion in F.Y. 2003/04 compared to Rs.
454.93 during F.Y. 2002/03. In F.Y. 2003/04 growth in per capital income is
estimated to have increased by 6.4 percent after the adjustment of 2.2
percent growth rate of population ( Tpc 2005:2).
Currency : Nepalese Rupee.
Time Zone : Currency Converter Company Media
Contact
Points.
Leadership:-
Country Manager
Demand Creator
Market Execution
Demand Fulfillment
Human Resources
Performance Finance
1.3 Focus of the study:-
The research study focused on the role played by image & usage trend of
Fanta & Miranda in Kalaiya Cold Drinks sold in bottles, plastic container or cans.
The people have feeling that the drinks are cold so they are to be used in the hot
season only. In fact, the demands of these drinks are for higher in the summer
season as compared other seasons.
The study will examine the present marketing strategies of Fanta &
Miranda in Kalaiya and try to find out the marketing variables affecting the Fanta
& Miranda. Marketing in its true sense helps to increase effective demand for a
Product through the reduction of distribution of cost and also help to explore
markets for new Products. The role of marketing with regard to dissemination of
information is very important for consumer as well as Producers to buy and
produce goods. It helps in rising markets competitive thus increasing efficiency
of resources use likewise : its role with regard to satisfying consumers and
marketing input available at reasonable price as services has its own importance.
Therefore, the impact marketing is deep and far reaching. A national development
13
program that concentrates only on production will be less effective than a
programmed that recognized the contribution of marketing. The main focus is
being on consumers need satisfaction as well as marketer's profit.
1.3 Statement of the problems :-
Nepal is the poorest countries in the world. Most of the people derives livelihood
from agriculture & rest depends on other sectors. It's capital income low.
Customers want different attributes from the same product. Therefore, usage
pattern brand positioning and brand image are also important to be taken into
account. The Nepalese consumers are provided with different brands and they are
quite free to choose the one they think the best. We can see different brand of
cold drinks in market just as Pepsi, coke, Miranda, Fanta, sprite, 7'up, slice,
lemon fanta etc. The competition is very tough in the fanta and Miranda market
demands are increasing day by day and many new companies are emerging to
fulfill the demand. As a result marketers have to adopt a variety of marketing
tools and techniques in the market place. The manufacturers use different types of
advertisement in different media. Cold drinks are the heavily advertised products.
Large amount of money is spent on the promotion of cold drinks. Yet very few
companies are found to measures the effects of their advertisement. Therefore the
manufacturers must be known that which the best advertising media is. We can
study statement of the problems in this way.
a) What status fanta and Miranda carry in consumers mind ?
b) What are the usage trend of fanta and Miranda?
c) How way the consumers use fanta and Miranda?
d) What type of distribution network exits in the study are for marketing
Fanta and Miranda ?
e) What are the marketing strategies being adopted by the marketers of Fanta
and Miranda?
f) What type impact have advertisements made on the sales of cold drinks in
the study area?
g) What are the affects of sales promotion schemes on sales of Fanta and
Miranda?
1.4 Objectives of the study
The main objective of the study will examine the present marketing strategies of
Fanta and Miranda in Kalaiya and try to find out the marketing variables affecting
the Fanta and Miranda the development in the industrial sector has provided
varieties of product in the Nepalese. Every product is made for the fulfillment of
some needs and wants. The product are used or consumed by the customers in
different way and in different occasions. Customers want different occasions. The
growing interest of customers of cold drinks has created a tough market
competition in Kalaiya today. The specific purpose of study is as the following.

14
a) To examine the consumers perception and behavior in purchase of fanta
and Miranda.
b) To find out the level of awareness in term of brand, their status and
attitudes towards different brands.
c) To evaluate the impact of advertisement and sales promotion schemes of
fanta and Miranda.
d) To evaluate the distribution network and marketing strategies of Fanta &
Miranda in Kalaiya.
e) To identify consumers profile and their reference of Fanta & Miranda.
f) To find out other marketing variables affecting the Fanta & Miranda in
Kalaiya.
1.5. Importance of the study :-
Today's marketing environment is characterized by globalization,
technological changes and strong competition. Successful marketers are those
who deliver what customers are willing to purchase as well as according to their
ability to purchase. Most marketers are facing the problem of not getting target
market share over stocking competition. Different type of product with large
number of alternative brands is available in Nepalese Cold Drinks Markets. In
this situation success of its products. So it will be provided us to know about
consumers taste, choice, preference and loyalty attitude image of certain products
& consumption behavior.
1.6. Limitation of the study :-
The study has been predominantly based on primary information data
collected through a questionnaire survey of limited number of individuals, hotels
and retailers. This study has been confined only to Kalaiya. So, it may not
represent to all Nepalese Fanta & Miranda markets.
Review of literature
Life expectancy a birth is estimated at 58.9 years and infant mortality is 79
per 1000. Nepal's population is growing rapidly at 2.37 % a year and the
population density of around 600 persons per square kilometer of arable land is
one of the highest in the word. The resulting pressure on Nepal's limited natural
resources base contributes to low productivity, poverty and denudation of forest (
Shrestha 2001 ::).
The chapter review of literature will provide concept of market marketing,
marketing system, marketing environment, marketing mix, marketing strategy,
attitude, and image and usage pattern.

15
The role of marketing with regard to dissemination of information is very
important for consumer as well as producers to buy and produce goods.
Research methodology
Research methodology describes the method and process applied in the entire
aspects of the study. Research methodology comprises of methods, tools and
techniques to analyze the data for the comparison various type of Fanta &
Miranda in Kalaiya and also shows the status of various type Cold Drinks which
individuals are preferred. The objectives of the study are to examine the
marketing usage pattern, attitude and image of Fanta & Miranda in Kalaiya area.
In this study the necessary relevant primary data have been collected from the
sample individuals' consumers, hotels and retailers to achieve the goals.
1. Research design:-
Research design is a plan for the collection and analysis of data. It presents
a series of guide posts to enable the researcher to process in the goal. Research
design is very important for the scientific investigations. Research design gives
the investigator a systematic direction to research work. There are various
approaches of research design. For our convenience this study is based on a
survey research design. A limited scale survey has been conducted among the
individuals, hotels and retailers of Fanta & Miranda in Kalaiya. The
questionnaires have been administered in order to generate data and other
information relating to the research questions adopted for this year.
2. Population and sample :-
As the study has included 150 individuals, 60 hotels and retailers of Cold
Drinks based in Kalaiya. Though the sample size is very small in Fanta &
Miranda comparison to total population, sufficient efforts have been made to
make the sample representative by including consumers from the different
professions, age group, educational backgrounds and sex.
Organization of the study
According to the generally format, this study has been organized into five
different chapter. They are:-
Chapter-1 : Introduction
Chapter-2 : Review of literature

16
Chapter-3 : Review methodology
Chapter-4 : Data presentation and analysis
Chapter-5 : Summary, conclusion and recommendations.
The first chapter deals with the introductions that includes backgrounds,
focus of study, statement of problems, objectives of study, importance study,
limitation of study, The second chapter provides review of literature that includes
lightly concept of market, marketing, marketing mix, marketing system,
marketing environment, marketing strategy, attitude, image and usage pattern.
Research methodology utilized for the study has been incorporated in the third
chapter. It deals research design, population and sample, nature and sources of
data collection, procedures and data processing and analysis. The fourth chapter
presents the data presentation and analysis, related with individuals consumers
survey, hotels and retailers survey and major findings of the study. The last fifth
chapters show the summary, conclusions and recommendations of the study. The
bibliography and appendices are presented at the end of the study report.
17
CHAPTER 2
Review of Literature
2.1 Introduction:-
A critical review of literature helps the researcher to develop a through
understanding and insight into research works that relates to the study the
researcher has pursued it is also way to avoid investigation problems that have
been already been definitely answered. Review of Literature occupies an
important role as it tries other research in the area of the problem has already
been done. So far no research work has been conducted on this specific topic.
2.2 Conceptual Framework
2.2.1 The market
A market may be defined as a place where buyers and sellers meet, product
or services are offered for sales, and transfers of ownership occur. A market may
also be defined as the demands made by a certain group of potential buyers
satisfy money to spend, and the willingness to spend it. Thus in the market
demand for any given product or service organization with wants their purchasing
power and their buying behavior.
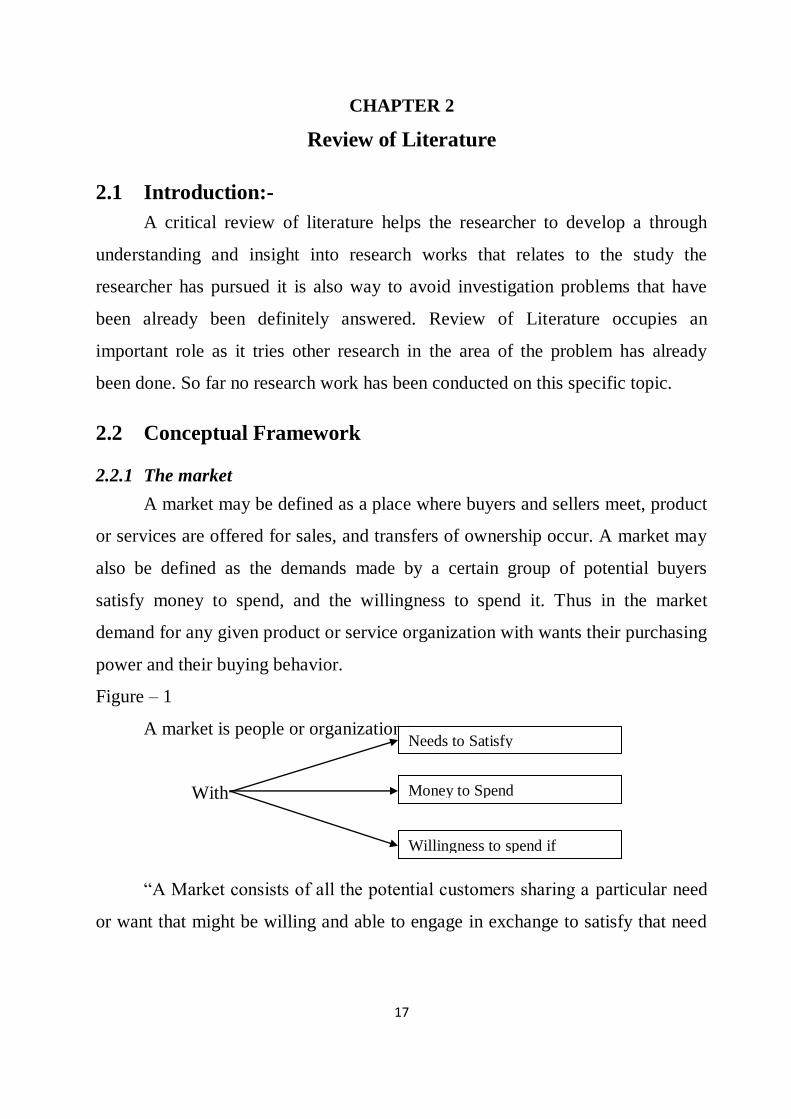
Figure – 1
A market is people or organization :
With
“A Market consists of all the potential customers sharing a particular need
or want that might be willing and able to engage in exchange to satisfy that need
Needs to Satisfy
Money to Spend
Willingness to spend if

18
or want.”1 A market represents the aggregate demands of the buyers and potential
buyers for a product or services over a specific period of time.”2
Market is a group of individuals or organizations who may the goods offered for
sale and who meet these three additional criteria.
a) Member of a Market must have the purchasing power to be able to the
product being offered.
b) Market members must be willing to spend their money or exchange other
resources to obtain the product.
c) Market member must have the authority to make such expenditures.
2.2.2 Marketing
“The term marketing has a number of usages in economy theory and in
business in general.” Marketing is a total system of business activities designed is
to plan, price, promote and distribute want satisfying product, services and ideas
to target markets in order to achieve organizational objectives.3
“Marketing is a social and managerial process by which individuals and group
obtains what they need and want through creating offering, and exchanging
products of value with other.”4
“Marketing is the process of planning and executing the conception pricing
promotion and distribution of ideas, goods and services to create exchange that
satisfying individual and organizational objectives”.5
1 Philip Kotler, Marketing Management Practice Hall Ninth Edition, PP-13
2 Victor P., Bluell, Marketing Management, PP-18
3 William J. Stanton & Charles Futrell
4 Philip Kotler
5 American Marketing Organization

19
“Marketing is the performance of anticipating customer or client needs and
directing a flow of need-satisfying goods and services from producer to customer
as client.”6
Marketing programmer plays a crucial role in the physical distribution of any
product. Therefore each and every firm should have marketing system for
channel the product to the market, to satisfy customer needs and wants.
Sometimes they have to face the marketing problems of capturing the marketing
and creating goodwill.
The marketing process establishes forward linkage for agricultural activities, that
is, it provides economic rewards for the production process. It includes not only
storage and transportation activities of the middleman but also encompasses all
activities linking consumer and the producer.”7
Different authority defines marketing in different ways. A more modern
definition in tune with greatly expanded productive capacity might emphasize the
adoption of production facilities to the market, Specifically marketing might be
defined as the response of businessmen to consumer demand through
adjustment” in production capacities. Adjusting production, accounting, financing
and marketing in the light of changing needs of consumers who are affluent
enough to have varied buying choices.
“Marketing is concern with regular label, timing and character of demand for one
more products of an organization “
“Marketing is the anticipation, stimulation, facilitation, regulation and
satisfaction, people, place and ideas through the exchange process.”8
In light of above definitions, it can be concluded that marketing is a process of
delivering goods and services produced to satisfy the needs of consumers to the
6 MC Carthy & William D. Perreault
7 Mac Millam Dictionary of Modern Economics Fourth Edition, PP-117
8 K.D. Koirala M.K. Publishers 1992, PP-11

20
consumers in an effective way so that the objectives of the producers by making
it possible to sell their produces are fulfilled. Marketing thus satisfies the
objectives of the producers by making it possible to sell their products on the
market in one hand and on the other hand helps consumers to get to the
maximum of satisfaction by providing goods and services for their consumption.
In the modern marketing area every marketers should understand the consumer’s
needs.
Successful marketing understand consumer taste, quality and choice. If
there is no satisfaction of consumers that product doesn’t give result for
consumers’ satisfaction, the product that is available easily and everywhere than
customer attract in that product easily.
2.2.3 Marketing System
The term marketing system consists of two separate words “Marketing
“and “System”. Marketing is a human activity directed at satisfying needs and
wants through exchange processes. On the other the term” System” means
regularly interacting group of activities forming a unified whole. In other words,
System means systematic or regular flow of any thing directed at fulfilling basic
goals. Marketing system deals with the smooth functioning of the marketing
activities far the fulfillment of the consumer needs and wants. If a marketer fails
to do so, then one must know that there is something wrong with the marketing
organization. And in the situation no marketer can work successfully. So the
manager must be able to analyze the marketing system in systematic manner.”9
9 Wroe Alderson, Marketing Behavior and Executive Action, Home Wood, Richard D. Irwin 1957, PP-42

21
“Marketing is a total system of business activities designed to plan price,
promote and distribute want- satisfying products to target market to achieve
organizational objectives.”10
The concept of marketing system is given by the system approach to
marketing based upon the work of brilliantly. Marketing system is related with
those business activities which are related with customer’s needs & wants. A
system is a set of units with relationships among them.
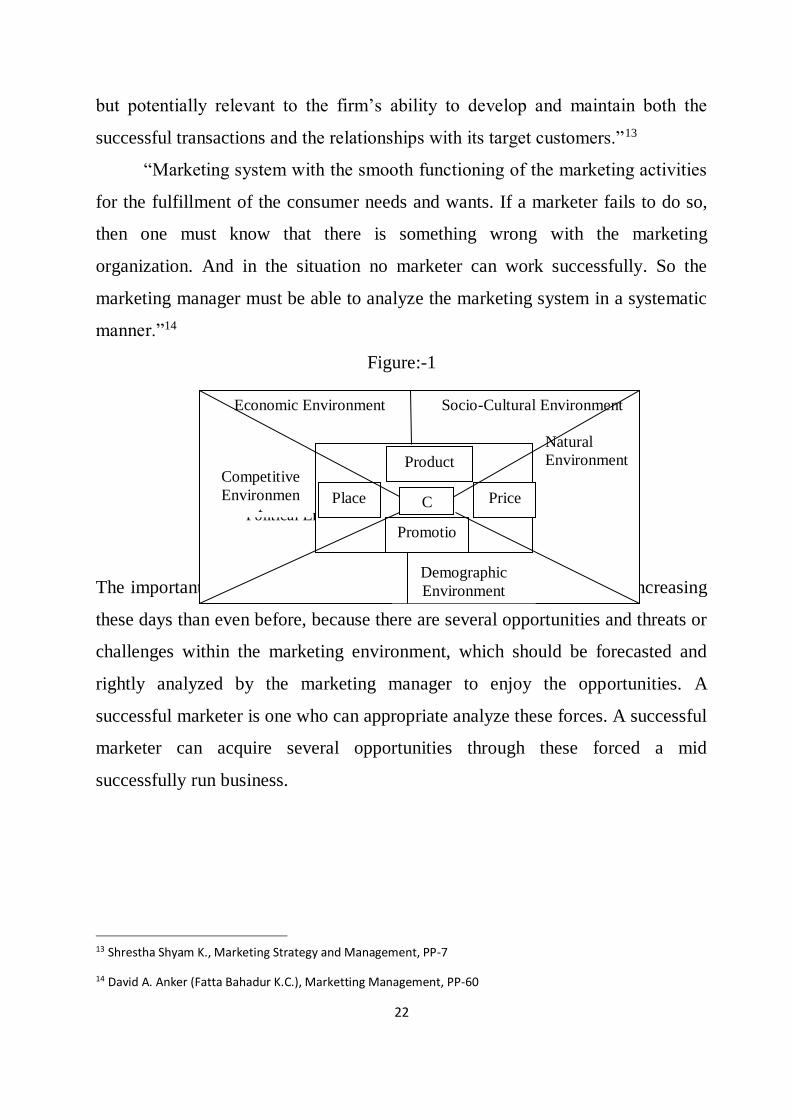
2.2.4 Marketing Environment
The marketing environment consists of external forces that directly or
indirectly influence an organizations acquisition of inputs and generation of
outputs. Examples of inputs include skilled personnel, financial resources, raw
materials and information. The output should be information, package, goods
services or ideas. “The marketing environment as consisting of six categories of
forces:- Political, Legal, Economic, Socio-Cultural, Demographic, Technological
and Natural.”11 In this sense marketing environment lays upon limits or
constraints on the firm’s marketing activities, such as marketing information
system, marketing planning system, implementation system, Control system,
production activities, pricing promotion placing etc.”
“The effect of marketing environment cannot be measured in term of
expectation, assumptions and predictions but in terms of goal achievements.
That’s why investing a huge amount of time, money, energy etc has become a
new life style of almost all marketing enterprises. The key to marketing success
lies more now than ever on knowing what a firm is, what it is in the competitive
environment and who its competitors are.“12 Marketing is an outside organization
10 Stanton Etjel and Walker (Fatha Bahadur K.C. )
11 Fatta Bahadur K.C., Marketing Management, PP-53
12 Pride & Ferrell, “Marketing Concept in Strategy” 6th Edition, PP-41
22
but potentially relevant to the firm’s ability to develop and maintain both the
successful transactions and the relationships with its target customers.”13
“Marketing system with the smooth functioning of the marketing activities
for the fulfillment of the consumer needs and wants. If a marketer fails to do so,
then one must know that there is something wrong with the marketing
organization. And in the situation no marketer can work successfully. So the
marketing manager must be able to analyze the marketing system in a systematic
manner.”14
Figure:-1
The important of marketing environment to the management has been increasing
these days than even before, because there are several opportunities and threats or
challenges within the marketing environment, which should be forecasted and
rightly analyzed by the marketing manager to enjoy the opportunities. A
successful marketer is one who can appropriate analyze these forces. A successful
marketer can acquire several opportunities through these forced a mid
successfully run business.
13 Shrestha Shyam K., Marketing Strategy and Management, PP-7
14 David A. Anker (Fatta Bahadur K.C.), Marketting Management, PP-60
Economic Environment Socio-Cultural Environment
Natural
Environment
Political Environment
Product
Place
Promotio
n
Price C
Competitive
Environmen
t
Demographic
Environment
23
2.2.5 Environment Scanning and Analysis
"Environmental analysis is the process of identifying and understanding
emerging opportunities and threats created by these forces."1 A marketing
managers must be to able to analyze the marketing environment in a
systematic manner. The process of environmental scanning and analysis in
four steps.
a. Environmental scanning
b. Environmental monitoring
c. Environmental forecasting
d. Environmental assessing
In the first step we find the study of information collection from defense
affecting sources and identify the problems. Environmental monitoring
provide.
Different tracks for strategy. Environmental forecasting means
forecasting environmental change. Environmental forecasting compare the
problems with other or first problem & provide develop the alterative tracks.
Assessing environmental identify that the problem affected or not for the
organization.
2.2.6 Role of marketing in industrialization
Industrialization is the impetus of overall development of country. Today
industrialization is countries, which is industrialization is considered as
synonymous to development. the countries, which are industrialization, are
developed too and vice versa ? many countries which we any the most
developed countries like. UK, USA, INDIA, JAPAN, CHINA etc. Have been
1 David A. Anker (marketing management page n. co)
24
fully industrialized and the countries which are developed or developing are
also stepping gradually head toward that direction. A developing country is
not exception to this phenomenon of the words as like Nepal.
Marketing plays a very significant role in acceleration the pace of
industrialization which in turn, aims at marketing the economy developed and
strong. In this connection, it is significant to note that marketing is the most
important multiplier of economic development. The development of marketing
makes possible of assets and productive capacity an economy already
possesses. It mobilizes latent economic energy and finally contributes to the
greatest needs that for the rapid developing of entrepreneurs and in managers.
Marketing plays important role in the process of industrialization. The
proceeds of industrial activity are passed on the society through the process of
marketing. Hence, the success or failure of business largely hinges upon the
art and science of marketing. Which is composed of explorative knowledge,
tact and talent of veteran practitioners?
In the global market, the multinational companies like Sony, Hitachi,
Philips, Tata and Brila, the Bajaj India, Thai foods (wai wai), bottlers Nepal
and many others have been permeating thought the world with the help of
modern marketing practices and methods. Marketing in this sense has made
the producers as well as the customers more conscious towards comparative
service, values, safety, satisfaction and convenience.
2.2.7 The marketing mix
"Marketing mix is the set of marketing tools that the firm uses to pursue its
marketing objectives in the target market."1
The marketing mix is one of the most fundamental concepts associated
with the marketing process. It is well understood by most modern marketers
1 Philip Kotler
25
and is systematically applied on many industries especially those that deal
with physical products. Yet it is to assume that, because most managers have
heard about it and or/use it, there is not need to mention it again book on
marketing. The sad truth is that quite often the precise role and scope of the
concept and its underlying principles are not fully appreciated by those who
tackle about it or use it. Many managers as no more than the cortical model
that helps in understanding the breath of activities encompassed by the
marketing task regard it. In many situation it is considered as no more than an
aid to highlighting the fact that marketing is a much broader concept that just
‘selling’ and prompting. A brief review of the main principles can helps to
clarify its true role in the dev surrounding the marketing mix can helps to
helps to clarify its true role in the developing amid execution of an effective
marketing variable which the organization blends to achieve the marketing
goal in a defined target market the marketing can do influence the demand for
its product in the target market.”2
“Marketing mix is the marketing programs including product conception
and developments pricing decisions, promotion of the product, and distribution to
consumers”1
As stated earlier the marketing mix represents as assembly of takes and
Subtask, which ultimately will help to satisfy the customer’s requirements in
such a way to enable the firm attain its objectives in an optimum fashion. The
subtle part of the concept is that different company in the same business may
opt to develop different ‘mix’ In fact it is this difference that may provide one
company with a competitive advantage over its competitors.
The concept of the marketing mix essentially premises that the decision
marketing executive must analyze certain market forces and certain elements
2 Me carthy, op cit
1 Peter D. Beanett (page no. 15)

26
of marketing if the executive is ultimately to determine a sound “mix” of
marketing elements which promises to be effective and profitable. The “four
Ps model” of the marketing mix has probably gained acceptance because of its
elegance rather than its validity in all situations. Regrettably, what has been
gained in Simplicity has been sacrificed in universal appropriateness. It is easy
to find examples of marketing-programmers, which do not outset that model is
not of universal validity.
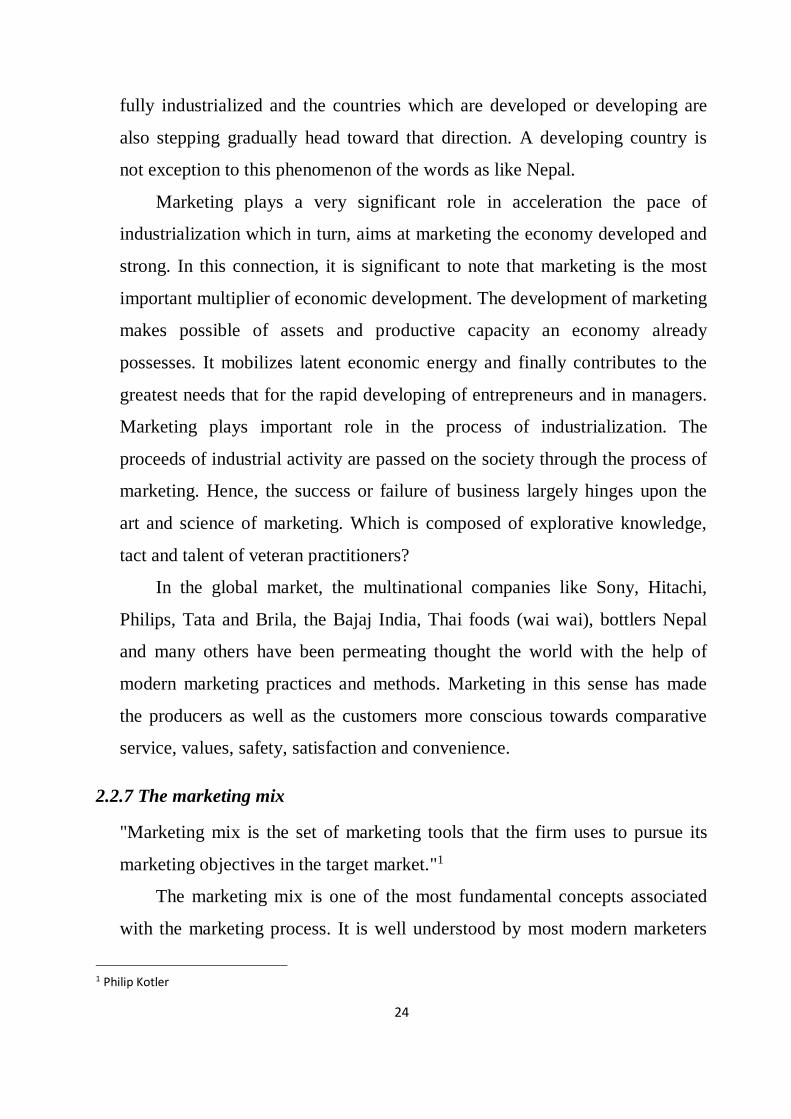
The theory underlying the four Ps is that; if one managers to achieve the
fight product at the fight price with appropriate promotion and in the right
place the Marketing program will be effective successful, However one must
bear in mind that each of the four ps can be broken down info a number of
sub-components.
27
Marketing
Product Price Promotion Place
Product Variety List Price Sales Promotion Channels
Design Discount Advertising Coverage
Features Allowances Sales Force Assortments
Brand Name Payment Period Public Relation Location
Packaging Credit Terms Direct Marketing Inventory
Sizes Transport
Services
Warrenties
Returns
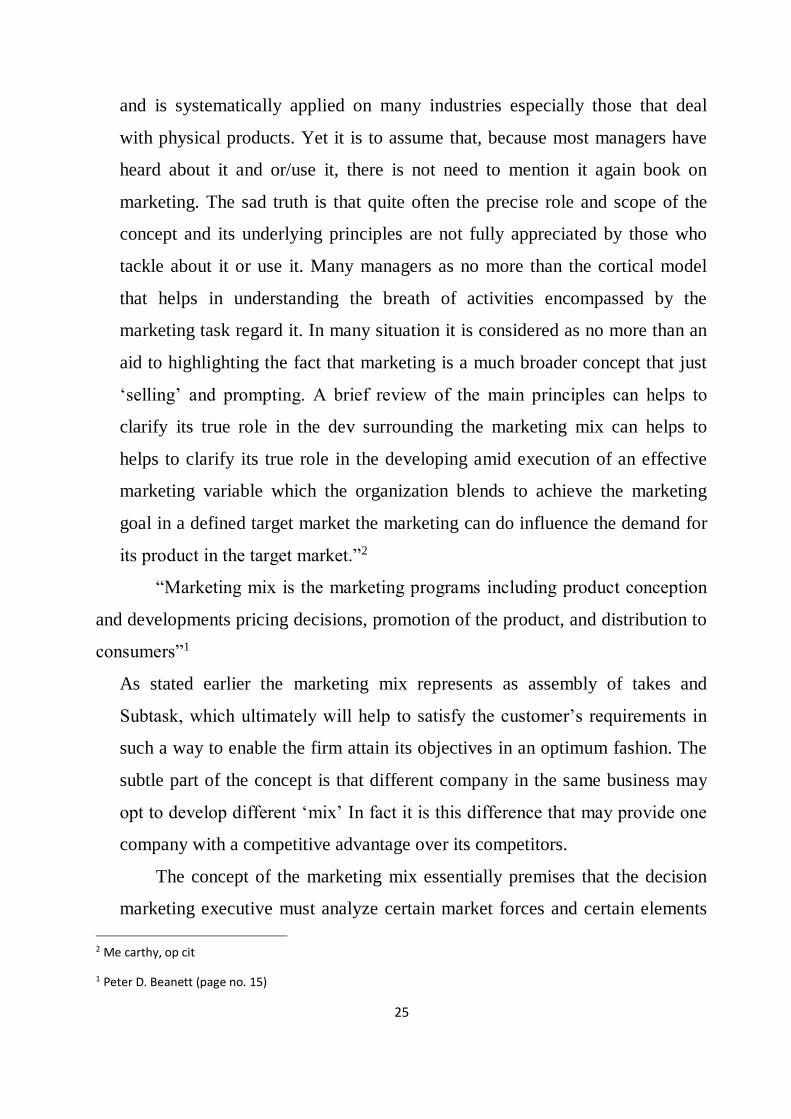
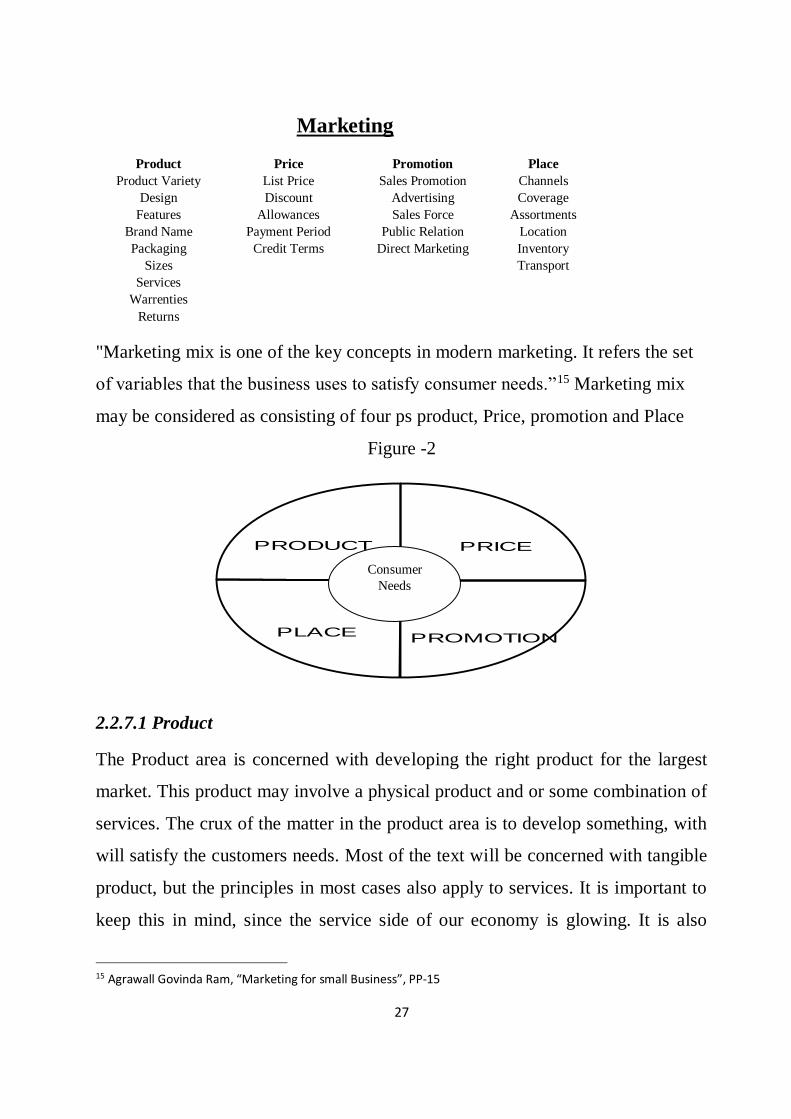
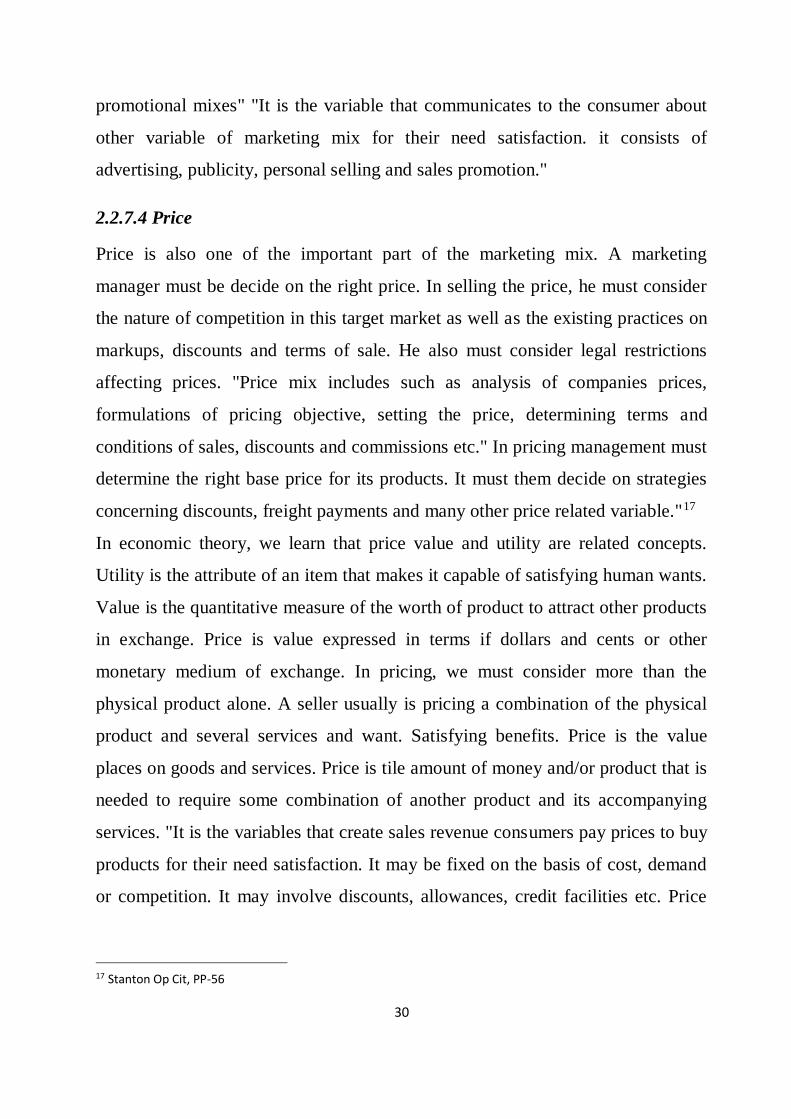
"Marketing mix is one of the key concepts in modern marketing. It refers the set
of variables that the business uses to satisfy consumer needs.”15 Marketing mix
may be considered as consisting of four ps product, Price, promotion and Place
Figure -2
PROMOTIONPLACE
PRICEPRODUCT
2.2.7.1 Product
The Product area is concerned with developing the right product for the largest
market. This product may involve a physical product and or some combination of
services. The crux of the matter in the product area is to develop something, with
will satisfy the customers needs. Most of the text will be concerned with tangible
product, but the principles in most cases also apply to services. It is important to
keep this in mind, since the service side of our economy is glowing. It is also
15 Agrawall Govinda Ram, “Marketing for small Business”, PP-15
Consumer
Needs

28
important to oriented people fall into these trap and neglect important
opportunities for satisfying needs in other ways. Automobile manufactured and
dealers. "A product is anything that can be offered to a market to satisfy a want or
need. Product that is marketed includes physical goods, services, persons, place,
organizations and ideas."16 "The product offered by an organization is what the
business (or an business) entity is all about. While we tend to think of product as
objects, we can see and touch the term product may be used in referring to
intangible markets and ideas as well. So product is a Y2 market's offering as
perceived by the market product mix includes decisions on product lime and mix,
product, quality, variety, design features, branding, packaging and labeling etc. It
also includes important activities such as product planning and development. 1 so
we can say product is commonly accepted as one of the most important parts of
the marketing mix.
2.2.7.2 Place
A marker must consider where, when and by whom the goods and services do not
flow products to consumers automatically. They move through channels of
distribution where a great deal of marketing work is done. Channel members
mayor may not handle the goods some may own them and transfer title, while
other do neither. Some may provide return and repair services, while also storing
and tern sporting them and other may be primarily concerned with transmitting
money and intimation. In other words, a number of things flow through a
channel, besides goods, in both ways. So a product is not much good to a
customer, if it is not available when and where he wants it.
"Place or distribution mix includes design of the distribution channels,
distribution network, dealer, promotion and motivation." System and physical
16 Kotler, op cit pp-430
2 Buell, op cit pp-23

29
distribution of the product any sequence of marketing institutions from producer
to find user or consumer is called channels and so our study of place will be very
important to even though marketing intermediaries are primary a non controllable
environmental factor, a marketing executive has considerable latitude when
marketing with them. Management's responsibility is,
a) To select and manage the trade channels through which the products
will reach the right market at the right time.
b) To develop a distribution system for physical handling products and
them transporting them through the appropriate channels.
2.2.7.3 Promotion
Promotion is one of the most important variables of marketing mix. A great
promotion policy & it's implementation is very necessary for successful market.
The marketing manager's job is to tell target customers that the right product is
available at the right place at the right price.
"Promotion is the ingredient used to inform and persuade the market regarding a
company's product. Advertising personal selling & sales promotion are the major
promotional methods include personal selling, mass selling and sales promotion,
personal selling involves direct face to face relationships between sellers and
potential customers. Mass selling is designed to communicate with numbers if
customers at the same time.
Advertising is the main form of mass selling but it also involves publicity. Sales
promotion refers to specific activities that complement personal and mass selling
such as point of purchase displays booklets, leaflets, and directs mailings."
Companies face the task of distributing the total promotion budget over the five
promotional tools advertising, sales promotion, public relations and publicity,
sales force and direct marketing. Within the same industry, companies can differ
promotional budget. It is possible to achieve a given sales level with varying
30
promotional mixes" "It is the variable that communicates to the consumer about
other variable of marketing mix for their need satisfaction. it consists of
advertising, publicity, personal selling and sales promotion."
2.2.7.4 Price
Price is also one of the important part of the marketing mix. A marketing
manager must be decide on the right price. In selling the price, he must consider
the nature of competition in this target market as well as the existing practices on
markups, discounts and terms of sale. He also must consider legal restrictions
affecting prices. "Price mix includes such as analysis of companies prices,
formulations of pricing objective, setting the price, determining terms and
conditions of sales, discounts and commissions etc." In pricing management must
determine the right base price for its products. It must them decide on strategies
concerning discounts, freight payments and many other price related variable."17
In economic theory, we learn that price value and utility are related concepts.
Utility is the attribute of an item that makes it capable of satisfying human wants.
Value is the quantitative measure of the worth of product to attract other products
in exchange. Price is value expressed in terms if dollars and cents or other
monetary medium of exchange. In pricing, we must consider more than the
physical product alone. A seller usually is pricing a combination of the physical
product and several services and want. Satisfying benefits. Price is the value
places on goods and services. Price is tile amount of money and/or product that is
needed to require some combination of another product and its accompanying
services. "It is the variables that create sales revenue consumers pay prices to buy
products for their need satisfaction. It may be fixed on the basis of cost, demand
or competition. It may involve discounts, allowances, credit facilities etc. Price
17 Stanton Op Cit, PP-56
31
has become the second most important variables of marketing mix because of
inflationary pressures in recent years,"
2.2.8 Marketing Strategy
"A strategy is a broad plan of action by which an organization intends to
reach its objective".18
"Strategic marketing is a process of strategically analyzing environmental,
competitive and business factors affecting business units and forecasting future
trends in business areas of interest to the enterprise. Participating in setting
objectives and formulating corporate and business unit strategy – selecting target
market strategies for the product markets in each business unit, establishing
marketing objectives and developing implementing and managing program
positioning strategies for meeting target market need”19
1. Marketing strategies is both unique and common place. That might
sound like a contradiction of term but it is not. The term “strategy” is
widely used to describe a seemingly endless number of marketing
activities, today, everything in marketing seems to be “strategic”. There
is strategic pricing, strategic market entry, strategic advertising and may
be even strategic strategy. The glut of competition has focused more
attention on performing the traditional marketing action strategically
with an eye towards beating the competition. In that sense, marketing
strategy is common place. In recent years it seems to have been
appended to neatly every marketing action. Marketing strategy is also
unique. There is not one unified definition upon which marketers agree.
Marketing strategy is a commonly used term, but no one is really sure
what means is. “A strategic sector is one in which you can obtain a
18 Prof. Stanton
19 David W. Cravens
32
competitive advantage and exploit strategic sectors are the key to
strategy because each sector’s frame of reference is competition. The
largest competitor in an industry can be unprofitable if the individual
strategic sectors are dominated by smaller competitors.”20 Boyd and
Larreche (1978) had found in the history of marketing strategy that
tremendous confusion over just what strategy is the term “strategy” as
used in marketing has been applied to at least three types of issues each
at a different level of aggregation. At the macro level there are
marketing strategies, which focus on manipulations of the marketing
mix variables-product, price, place, and promotion. According to that
definition setting a strategy for a product consists of selecting a price for
a product, designing an advertising campaign, and then deciding on a
plan of distribution. Finally, there are product market entry strategies,
which include strategies that, look at specific marketing decisions.
Strategies that call for a firm to built market share harvest profit (and
share) or defend share from competitor. Another widely used definition
of strategy in marketing emphasizes the broader perspective of strategy
in management. The definition views strategic market planning as a
four step process.
a) Defining the business b) setting a mission c) selecting functional plans for
marketing d) budgeting for those plans, (A bell and Hammond (1978). In
that sense, marketing strategy is more akin to corporate strategy”.21
The major component of the strategic planning is strategic marketing. Its main
objective is to establish the product/market scope of a business. Strategic and
marketing is the method that concentrates on the market to serve, the competition
20 Subhash Jain the Evolution of Strategic Marketing. PP-81
21 Schnaars Steven P. Marketing Strastegy PP-18

33
to be tackled and the timing of market entry\ exit and related moves. Formally,
strategic marketing deals with the following questions.
a) Where to complete.
b) How to complete?
c) When to complete?
Strategic marketing helps to define the market in entering and completing. That
may be either an entire market or one or more segments of the entire market.
Strategic marketing provides inputs or techniques for solving customer need. That
technique may be either an introduction of a new product or of existing product
with improvements. Similarly, strategic marketing tries to time to enter the
market or until primary demand is established. So, marketing strategy is at the
heart of effective management strategy.
2.2.8.1 Product strategy
“A product is a set of tangible and intangible attributes including
packaging, color, price, manufacturer’s prestige, retailer’s prestige and
manufacturer’s and retailer’s services.”1 product is anything that can be offered to
a market for attention acquisition, use or consumption and that might satisfy a
want or need. Products include more than just tangible goods. Broadly defined,
product includes physical objects, service, persons, place, organizations, ideas or
mixed of these entitles. A product is anything that is potentially valued by a target
market for the benefits of satisfaction it provides (Gaven, Hill and Woodruff).
The general principle is that a firm must have a right product that can satisfy the
needs and wants but a product cannot satisfy their needs and wants over the time
period, because of several reasons. First, like living creating a product also has a
life during which a firm has to reformulate or differentiate or standardize it to
maintain its position in the market. Second consumer demand goes on changing
over the time period. As such, the same consumer may demand different product
over the time period. Finally the requirement of all consumers is not alike,

34
different consumers may demand for different product attributes (such as quality,
product, Service, branding, good packing, attractive color and design prestige,
problem solution etc) at the same time. So we can say that product decision is not
only an important decision in the marketing but also a most challenging task for
the marketers. In the competitive markets the marketer must be able to study each
and every aspects of the product including product life cycle, new product
development product mix and product line, product positioning, branding and
packaging etc.”22
“Product is what marketers offer to consumers. They include goods,
service, Ideas and any other things that can be exchanged by a supplier and a
buyer or consumer. The term product concept refers to the marketing strategist’s
selection and blending of a product’s primary characteristics and auxiliary
dimensions into a basic idea or concept emphasizing a particular set of consumer
benefits.” Product strategy is the core of strategic planning for the enterprise and
it plays a pivotal role in shaping marketing strategy. Management’s strategic
decisions about the product to be offered are among.
The most important of those affecting the future of a company. No other
strategic decision has such widespread impact cutting across every
functional area and affecting all level of an organization. A product
strategy consists of:-
a. Decision how to position a business unit’s product offering
(specific product line or mix) to serve its target market.
b. Setting strategic objectives for the product offering.
c. Selecting a branding strategy.
22 Zikmund and Amico. Marketing. PP- 213
35
d. Developing and implementing a management strategy for new
and existing products.”23
“The channel and physical distribution programmer are developed to
deliver right product the right place at the right time at the lower cost” 24
“Effective control of distribution costs can give an organization an
advantage, if the organization cannot control distribution costs profit
will be impaired in the short run and survival may be threatened in the
long run.” 25
Distribution is concerned with the activities involved in
transferring goods from producers to final buyers and users. It includes
not only physical activities, such as transporting and storing goods but
also the legal promotional and financial activities performed in the
course of transferring ownership. Since a succession of enterprise is
generally involved in the distribution process leading to the final sale to
the user to understand distribution one must analyze both the different
kind of marketing institutions and the marketing channels in which they
operate.
The means of distribution have a very important effect upon
the price of goods and a single means is not enough due to the
geographical diversity where there is single system this has led to the
rise in the price of commodities on the one hand and the non-
availability of them in time, on the other hand. These problem have.26
23 David W Crevens Strategic Management
24 Burr W Hupp, “Inventory Policy is a top mgnt Responsibility in Donald L. Buwersox (ed) Reading in Physical Distribution Management New York, Mac Milan Company 1969, PP-179 ”
25 Ronald J. Lewis “Strengthening control of Physical Distribution Cost” Ibid PP-316
26 Burr W. Hupp, “Inventory policy is a Top Mgmt Responsibility” in Donald L, Buwersoxed Reading in physical
Distribution Management. New York, Macmillan Company. 1969 PP-179

36
2.2.8.2 Distribution Strategy
Distribution play as vital functional role in marketing. A manager
should give due attention towards its better functioning because without
it effective and efficient management the whole marketing system may
collapse. A producer should decide new many middlemen he should
seek at each level of distribution. He will determine the numbers of
retailers, wholesalers, agents and so on.
Simply, distribution is the delivery of the products to the right time,
place and consumer. It is not a single element but it is a mixed of
various to consolidate functions, such as channel of distribution,
transportation, warehousing and inventory controls etc.
About this, we will study famous some marketing writer,
“Distribution may be defined as an operation or a series of operation
which physically bring the goods manufactures or produced by any
particular manufactures in to the hands of the final consumer of
users.”27. “Distribution channels are major factors in the effective
development of the market share, internationally to maintain quality and
ensure services, direct distribution is also undertaken by many
manufactures. Also, the use of multiple channels will expand and
include Tele-marketing, direct response marketing, mail order and
computer assisted buying.”28
Marketing program setting the specific objectives to be
accomplished by price and establishing policies and structure for
guiding pricing decision.”
27 Rustam S. Daver, Modern Marketing Management. Bombay progressive corporation p 2td. Pp -40 28 William Lazer, et al. Marketing 2000 and Beyond, Chicago. American Marketing Association. 1990 pp-164

37
2.2.8.3 Pricing strategy
We know that price is one of the four major elements that the
marketing manager must consider while preparing the marketing
program. In general price is value or amount of money sacrificed to
obtain a particular product or service. Price may also be defined as
the exchange of something of value between parties involved in a
transaction. In economic sense, price is value expressed in terms of
rupees or dollars, or any any other monetary medium of exchange.
In marketing, price is regarded as backbone on which the success of
the marketing program largely depends. No rational product policy,
no product design and no marketing strategy can not be formulated
without consideration of price, nor is price set in isolation of the total
strategy. Since price decisions affect not only the firm’s sales and
profit but also determines its future prospects, they must be taken
into account seriously.
Price is based on systematic decisions to assign a value to
communication the seller’s estimated worth of the offering.
In broader sense, price settings involve of the exchange to all parties
involved in the transaction.
We define a price strategy as “deciding how to position price within
the range of feasible price, establishing whether price shall be used
as an active or passive element in the pointed to the necessity of a
new management in the means of distribution which specially
considers the factors like the nature of the commodity the behavior
of the customers, effectiveness of time, education and social values.
Most producers do not sell their product directly to the final
consumers. That is why they use a variety of intermediaries.

38
Channels are the medium for taking the goods and services to
ultimate buyers. These organization and agencies are grouped
together in various combinations linking particular producing units
through the channels distribution. Distribution channels are among
the most complete and challenging function of decision making
facing a firm in modern business organization.
“In today’s economy most of the producer of goods and services do
not sell their foods directly to the final users between them and the
final users stands a host of marketing intermediaries performing in a
variety of functions and bearing a variety of names. Some
middlemen such as wholesalers and retailer buy take title to and re-
sell the merchandise. They are called merchant middlemen other
such as brokers, manufacturers and may negotiate on behalf of the
producer but do not take title to the goods. They are agent
middlemen.”29
A channel of distribution shall be considered to comprise a set of
institutions, which perform all of the activities utilized to move a
product and its title from production to consumption (Bucklin).
Channels of distributions is an organized network of agencies and
institutions which in combination, perform all the activities required
to link producers with users and users with producers to accomplish
the marketing task. (Craven, Hills & Woodruff)
These intermediaries or channels of distribution tend to be used for
several reasons,
a) The number of sellers, buyers and the distance of product
movement are relatively large.
b) The frequency of purchase is high. 29 Kotler Op. Cit PP-175
39
c) The lot sizes needed by end users are small.
d) Markets are decentralized.
Channel structure
There are three levels of marketing channels.
a) Direct channels.
b) Indirect channels.
c) Mixed channels
Under direct channel, producer himself distributes goods and services to the end
users. No intermediaries are used in this case.
Under indirect channel, several intermediaries such as wholesalers, retailers,
dealers, agent etc. are used to supply goods and services from production point to
the consumption point.
Under mixed channel, producer uses both direct as well as indirect channels at the
same time for the purpose.
It is necessary to understand that the intermediaries or middlemen can be divided
into two categories,
a) Merchant middlemen
b) Agents
Merchant middlemen purchase outright and actually take title to the goods. In this
categories include wholesalers, retailers etc.
Agent acts in an agency capacity on clients and does not take title to the goods
which they deal. They usually charge certain commission in tens of percentage or
lump sum.
Physical Distribution
“Physical distribution management as the process of strategically managing the
movement and storage of materials, parts, and finished inventory from supplies
between enterprise facilities and to customers”1 “Physical distribution as the
1 1 Kotter, op cit pp-433

40
activities concerned with the movement of the right amount of the right products
to the right place of the right time.30
Physical distribution is concerned to the management of physical flow of the
goods from the points of suppliers to the points of purchases. It’s main objective
is getting the right product safely to the right places at the right time at least
possible cost. We can know about its objective in pointly:-
i) To provide customer service
ii) To distribute goods more cost
iii) To minimize the total cost
iv) To supply goods to the right target market function of
physical distribution.
A physical distribution system consists of a sell interrelated functions with
specific boundaries. The interrelated function include the following element:-
a) Transportation
b) Warehousing
c) Inventory management and control
d) Order processing
e) Material Handling
Transportation is the elements of the physical distribution system that links
geographically separated markets and facilities. There are five models of
transportation:-
a) Rail transport
b) Highway transport
c) Water transport
d) Pipe-line transport
e) Air transport
30 Stanton op cit pp-379
41
Warehousing decision determines the number, size and location of storage
facilities needed to services customers demand.
Developing effective warehousing strategies includes the decision regarding
the following elements:-
a) Location of warehouse
b) Determine the type of warehousing i.e private or public warehousing
c) Evaluate development in warehousing.
Inventory decision are concerned with balancing the costs of carrying
inventory, ordering products from supplies and controlling other inventory
costs to achieve a desired level of consumer satisfaction, inventory
accumulation is expensive, yet availability is essential to having satisfied
customers.
Order processing constitutes the communication linkage that stimulates a
physical distribution system into action. In other words, order processing
regards to all those activities involved in collection, checking and transmitting
sales-order information. It is the handing of all paper work associate with the
sale of goods and services offered by an organization.
Material handling, also called the physical handing of goods, is an activity that
is important in inventory warehousing and transportation. The characteristics
of a product to large extent how it will be handled.
2.2.8.4 Promotional Strategy
Promotional Strategy is also one of the most important marketing strategies.
There are various types of promotions. These include advertising, personal
selling, sales promotion and various miscellaneous efforts. When management
has a message to pass to target consumer’s promotion is the proper vehicle. “Like
other marketing tools, both business and non business organizations use
promotion. The state of Louisiana has been promotion family planning since

42
1965”1 “ Promotion can be used to improve the image of police work as a
career”2 A company needs to make marketing decisions offering, pricing and
distribution but also in the area of promotion. “Promotion is any marketing effort
whose function is to inform or persuade actual or potential consumers about the
merits of a (given) product or service for the purpose of including a consumer
either to continue or to start purchasing the firm’s product or service at some
(given) price.”3 Promotion is persuasive communication. It is a highly visible
element in the marketing mix. It sells the target in customers about product, price
and place. It is also known as marketing communication.
“Promotion is applied communication used by marketers to exchange persuasive
messages and information between buyers and sellers.”
“Promotion represents the various communications to inform and persuade
people that a firm directs towards its market targets, channel organizations and
the public at large. These communications consists of adverting, personal selling
and sales promotion activities. Increasingly marketing management is finding it
profitable to combine advertising, personal selling packaging, point of purchase,
direct mail product sampling, publicity and public relations decisions into an
integrated promotion strengths and short coming, the strategy adopted should
capitalize upon the advantages of every component in shaping a cost effective
communications mix”.
Sales Promotion:-
"Those marketing activities, other than personal selling, advertising and publicity
that stimulate consumer purchasing and dealer effectiveness, Such as displays,
shows and expositions, demonstrations, and various no recurrent selling efforts
not in the ordinary routine." 7 sales promotion activities are impersonal and
usually nonrecurring, and are directed to ultimate consumers, industrial
consumers and middlemen. These activities tend to supplement the advertising
and personal selling efforts. Examples of sales promotion are free product
samples, trading stamps, store displays, premiums, coupons and trade shows.
1 Adel L. EI-Ansary and Oscar E. Kramer. ,”Social marketing: The family planning Experience.” Journal of
marketing pp-37
2 Richard W. Hansen et, al “An Application of Marketing concepts in the public sector: A case study.” 1974
3 Combine proceeding American Marketing Association (Chicago: American Marketing Association) pp-252
43
"Sales promotion can be defined as those promotional activities other than
personal selling, advertising and publicity that are intended to stimulate buyer
purchases of leader effectiveness in a specific time period"8
7. Committee on Definitions, American Marketing Association, Marketing
Definition: A Glossary of Marketing, 1960 pp-20
8. Zikmund and d' Amico. Op cit pp-477
Publicity
"Publicity is a means of promoting to the mass market. Publicity is similar
to advertising, except that it is free, is found in the editorial portion of news
media and pertains to newsworthy events. The most common types of publicity
are new it involves an unpaid and unsigned message, even though it may us the
same mass media as advertising does"2
Public Relations:-
"Marketing engages in public relations in order to develop a favorable
image of their organizations and products in the eyes of the public, they direct
this activity to parties other than target consumers. These 'other' include the
public at large union, the press, and environmentalist groups. Public relations
activities include sponsoring floats in parades, lobbying and using promotion
messages to persuade members of the public to take a desired position.3
1. Rollie Eiliman and C.A Kirkpatrick promotion: Persuasive communication
in Marketing, Homewood III: Richard D Irwin Inc 1968 pp-365
2. Zikmund and Amico Op cit pp-476
3. Robin Peterson Marketing a Contemporary Introduction, pp-443
44
Promotion Strategies
Push and Pull Strategies
In puss strategies, the promotion program is directed at middlemen.
The product is "pushed" through the channel. The channel members are
persuaded to order, carry and promote product to consumers. The manufacturer
promotes to wholesaler, the wholesaler promotes to retailer, the emphasized in
push strategy. This strategy is useful where brand loyalty is low and market share
is to be protected. In pull strategy, the promotion program is directed at
customers. The consumers are persuaded to ask to the product from the retailer,
the retailers ask the product from the wholesalers and the wholesalers order the
product from the manufactures. The product is "pulled through the channel to
increase sales. Aggressive advertising and consumer promotion is emphasized in
pull strategy is useful where brand loyalty is high.
2.2.9 Status
As our research is concerned with the status of Fanta and Miranda, it is
very relevant to make some assessment as to the "identifying the target audience"
(as it is called in the language of marketing). For this purpose we are going to
present some analysis of status (images) as a review of literature in the concerned
field of study, as follows:
2.2.9.1 Status Analysis
Status is the set of beliefs, ideas, impressions and person holds as to an
object i.e. a product in the marketing sense. People's attitudes and action towards
and object are highly conditioned by that object's status.
2.2.9.1.1 Product and service status
The status that a product or service has in the mind of the costumer that is
it's positioning is probably more important to its ultimate success than are its
actual characteristics. Marketers try to position their brand so that they are
perceived by the consumer as fitting into a distinctive niche in the market place, a
niche occupied by no other claim will fulfill the consumer's needs better than
completing brands. They strive a create a product image consistent with the
relevant self-status of the targeted consumer segment.
2.2.9.1.2 Positioning Strategies
Positioning strategies is the essence of the marketing mix. It complements
the company's segmentation strategies and selection of target markets.
Positioning conveys the concept, or meaning, or the product or service in terms of
how it fulfills a consumer needs. Different consumer meanings (i.e. product
status) are it fulfills a consumer needs different consumer meanings (i.e. product
status) are sometimes assigned to the same product or service. Thus, a product or

45
service can be positioned differently to different market segments, or can be
repositioned to the same audience without actually being physically changed.
2.2.9.1.3 Repositioning Strategies
Regardless of how well positioned a product appears to be the marketer
may be forced to reposition it in response to market event, such as a competitor
cutting info the brand's market share for example, rather than trying to meet the
lower prices of high-quality private label competition some premium brand
marketers have repositioned their brands to justify their higher price, playing up
brand attributes that had previously been ignored.
When Revlon decided to change the image of Revlon cosmetics to attract a
younger, more diverse audience, its repositioning strategy involved changing its
copy appeals, changing its advertising media (to youth oriented TV shows) and
changing its distribution channels (from higher-price department stores to lower-
priced retail outlets such as drug stores and supermarkets). A similar
repositioning strategy was adapted by Fanta and Miranda to target young
generation. Johnson and Johnson and also adopted same tactics.
Another reason to reposition a product or service is changing consumer
preference for examples, as consumers became aware of the dangers of intense
sustaining; alert conmetic companies began to add sunscreens to lipsticks,
moisturizers and foundation creams and to promote this new benefits as a mayor
attribute, thus repositioning specific product line. They also created a new and
highly profitable product category, self-tanners that required no sun exposure
whatever when health-oriented consumers began to avoid hi-fat foods, many fast-
food chains acted swiftly to reposition their images by offering salad bars and
other health oriented foods. Kentucky fried chicken changed its well known
corporate name to KFC in order to omit the dread word "fried" from its
advertising. Weight watchers repositioned its line of frozen foods from "dietetic"
to "healthy" maintaining its diet-thin imagery while responding to a perceived
shift in consumer values.
2.2.9.2 Perceived Quality
Consumers often judge the quality of a product or service on the basic of a variety
of informational cues that they associate with the product. Some of these cues
intrinsic to the product services and other are extrinsic. Either singly or in
composite, such cues provides the basis for perceptions of product and service
quality.
Cues that are intrinsic concern physical characteristics of the product it self, such
as size, color, flavor or aroma. In some cases, consumers use physical
characteristics to judge product quality for example, consumers often judge the
flavor of ice cream of cake by color cues. Even the perceived quality of laundry
detergents is affected by color cues. Far example many detergents are
traditionally colored blue, in the hopes that housewives will associate the color

46
with “bluing” brighten their laundry similarly fanta of Miranda both are offered
in same color signifying the completion they have with each other.
Consumers like to believe that they base their evaluations of product quality on
intrinsic cues, because that enables them to justify their product decisions, (either
positive or negative) as being “rational” or “objective” product choice. More
often that not, however, they physical characteristics they use to judge quality
have no intrinsic relationship to the products quality. For example though many
consumers claim they buy a brand because of its superior taste, they are often
unable to identify that brand in blind taste tests.
2.2.10 Usage Trend
Products do not sell themselves and marketeering program that insures the same
of products as intended should included a program that will guarantee the sell of
products. This objectives should include the study of usage pattern of the product
i.c. that is in hand. How consumers behave as to the consumption pattern of the
product (i.c. fanta & mirinda in our cause) must be studied. In fact the image of
the product can be derived from the study of the usage pattern of the product
itself. Far this purpose the study of consumer behavior was done by the
researcher in many cases and conclusions were drawn from the answer received
though questionnaires distributed to retailers & consumers also. On the other
hand if a change to be made in taste, price or quality as a whole of the product is
felt, again the study on usage pattern of the product is needed. In our case i.c. our
research on cold drink, The practical aspect of the problem is very clear and lack
of any previous research in the field him dered this detail review of literature.
and the findings as to the usage pattern will come to be implied within the status
and consumer behaviors regarding the marketing of fanta & mirinda in kalaiya. In
fact, the status of these products as well as the attitude of a consumer towards a
certain product are often related to the pattern of use as seen in the maret. SInce
the usage pattern of consumers in directly related to the understanding of
consumer behavior. It is obvious that a marketer or a manufacturer must have an
idea or a consumption related ways and with learning what internal and external
influence impact them to act as they do. As such it can be satued that image and
the attitude themselves as already has come into existence in the mind of the
consumer. As such this specific study as to usage pattern itself does not give
much sense unless it encompasses both image and attitude. Simalary, as
marketing researchers began to study the buying behavior of consumers, they
soon realized that many consumers, rebelled at using the identical products
everyone else used. Instead, They preferred differentiated products that they felt
reflected their own special needs personalities and different image and attitudes
towards different products and as a result set particular types of usage pattern of
products in the market. To meet the needs of specific groups of consumers, most
marketers adopt a policy of "marketing segmentation," Which calls for this

47
division of their total potential markets into smaller, homogeneous segments for
which they could design specific products and or promotional campaigns. At the
same time they also use promotional techniques to very the image of their
products so that they would be perceived as better fulfilling the specific needs of
certain target segments. This process is called nowadays as "positioning". Other
reasons for the developing interest in consumer behavior regarding usage pattern
of consumers include the rate of new product development, growth of the
consumers movement, public policy concerns and environmental concerns etc.
Thus the marketing objective name and such image will definitely lead to some
specific pattern of use of the products and the pattern seen and found in the
existing marketing conditions also lead back to the image and attitude also. This
means usage pattern can also given feed back to the makings regarding the image
and attitudes of consumers lowers certain products.
2.3 Review of Related Studies
2.3.1 Shrestha, Rajendra Bahadur, "A study of marketing, usage pattern, Attitude
and Image of cold Drinks in Birgunj Area"
The study was undertaken in 1998 with the following objectives.
1) To examine the potential consumers in purchasing cold drinks.
2) To identify the purchases behavior of consumers who purchase cold
drinks.
3) To estimate demand of cold drinks in kathmandu.
4) To identify the best choice of consumers in cold drinks on the basic of
selecting brands advertising habitual testing, asking question & personal
inspection,
5) To find out the popular media of advertising for the cold drink which
can easily attract the potential consumers on each company, branded
cold drinks.
6) To estimate sales of cold drinks in Kathmandu.
7) To find the relationship between the brand preference and advertising.
The study has concluded that advertising is considered as the primary source
of information. The advertisement of fanta & mirinda and other branded cold
drinks are founded in Kathmandu. Coca-Cola brand is more popular than other
brand. Consumer gives more preference to the brand but less preference to
quality and test. Television is the most favorite media for advertisement. The
major reason of brand switching is the taste of the products. The study has
recommended that advertising should be more believable and effective, so
manufactures are suggested to advertise their product thought television are
found brand loyal. If they don’t get the desired brand they use the alternative
brand. So the markets are their distribution system. It is suggested that the
manufactured of cold drinks should try to fulfill consumers demand on cold
drinks of their choice.

48
2.3.2Pathak, Krishna Prasad, in 1998 conducted the study on "coffee marketing
system in Nepal " with the following objectives."1
1) To analyze the present phenomena, problems for the farmers engaged in
coffee farming.
2) To assess the existing coffee marketing system.
3) To analyze the challenges problems and profitability of farming processing
and marketing of coffee and processional standards.
4) To recommend measures for improvement.
The following conclusions may be derived from this study. Nepalese farmers
are motivated to plant coffee for better yields and they technical support and
training for professional forming skills. There is no support to formers input;
supply and sales security were varying weak Recently emerging community
activities to show better symptoms in this respect. Pricing to support formers
was effective due to increased competition. Market Promotion is weak and
packing is the first place to start promotional campaign. Now, push sales is the
only measure and no promotions are done. Distribution system components
are assembly transportation, Processing and other processing. Through
Nepalese domestic production covers only 22.9 percent of domestic market.
Nepalese coffee is worth exporting and Nepalese consumers prefer instant
coffee mainly imported from India. It shows that Nepal can develop coffee, as
an important cash crop to generate exports which should help in economic
growth, employment generation and mitigating the ever-increasing
unfavorable balance of trade, for this professional and institutional approach is
warranted for.
The study has recommended to select better seeds appropriate for the Nepalese
landscape and climate. Interest rate 17% is not appropriate for forming and is
very high. Enterprising formers should be trained so as to make them the
bridge between the ordinary formers and technical exports. Wet pulping
should be introduced and formers should be facilitated to pulp hull and grade
the beans and green beans should be improved in trade. There should be
improved in packing of roasted coffee. Demonstration forms should be
developed as the catalysts to incorporate rural people in modern business
ethics. Professionalism should be encouraged in coffee marketing.
1. Krishna Prasad Pathak coffee marketing in Nepal (1998)
Unpublished dissertation submitted to control Department of
Management Tribhuwan University.
2.3.3 Bhatta, shree Chandra, in 1998 conducted a study on "Sales promotion and
effect on sales"
A case study of beer market of Nepal with the objectives of analyzing the
sales promotion and its effect on sales is the main focus of the study.
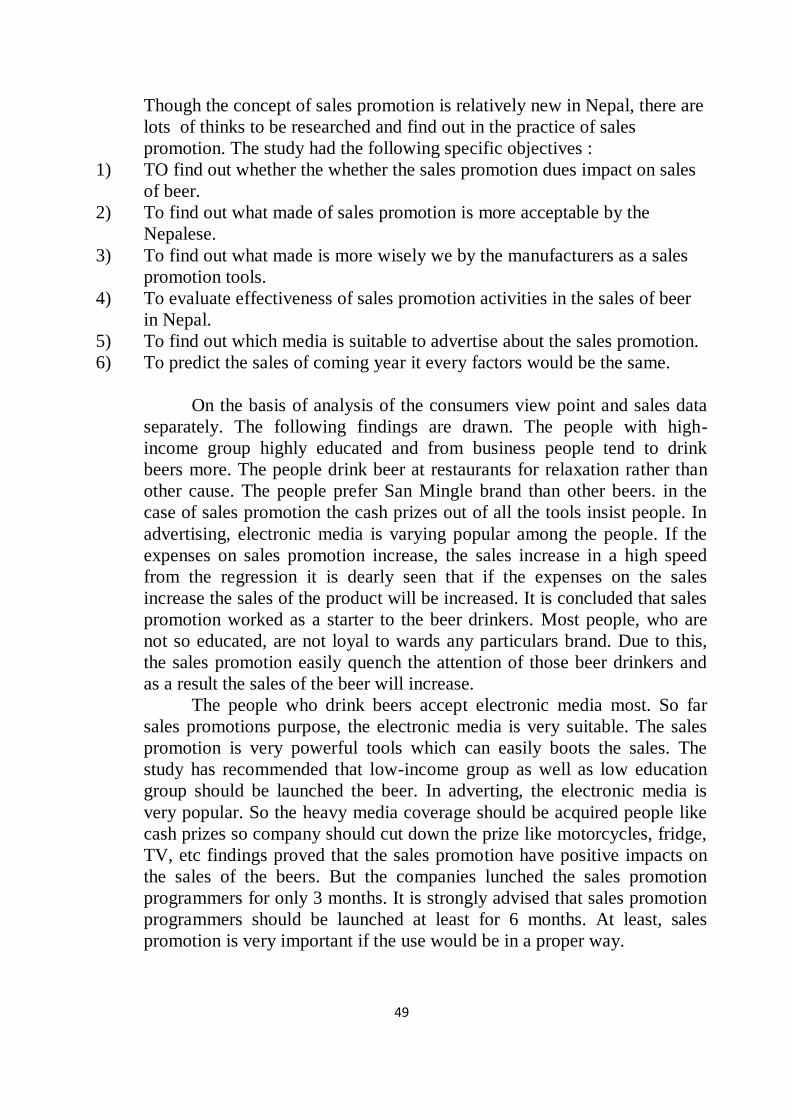
49
Though the concept of sales promotion is relatively new in Nepal, there are
lots of thinks to be researched and find out in the practice of sales
promotion. The study had the following specific objectives :
1) TO find out whether the whether the sales promotion dues impact on sales
of beer.
2) To find out what made of sales promotion is more acceptable by the
Nepalese.
3) To find out what made is more wisely we by the manufacturers as a sales
promotion tools.
4) To evaluate effectiveness of sales promotion activities in the sales of beer
in Nepal.
5) To find out which media is suitable to advertise about the sales promotion.
6) To predict the sales of coming year it every factors would be the same.
On the basis of analysis of the consumers view point and sales data
separately. The following findings are drawn. The people with high-
income group highly educated and from business people tend to drink
beers more. The people drink beer at restaurants for relaxation rather than
other cause. The people prefer San Mingle brand than other beers. in the
case of sales promotion the cash prizes out of all the tools insist people. In
advertising, electronic media is varying popular among the people. If the
expenses on sales promotion increase, the sales increase in a high speed
from the regression it is dearly seen that if the expenses on the sales
increase the sales of the product will be increased. It is concluded that sales
promotion worked as a starter to the beer drinkers. Most people, who are
not so educated, are not loyal to wards any particulars brand. Due to this,
the sales promotion easily quench the attention of those beer drinkers and
as a result the sales of the beer will increase.
The people who drink beers accept electronic media most. So far
sales promotions purpose, the electronic media is very suitable. The sales
promotion is very powerful tools which can easily boots the sales. The
study has recommended that low-income group as well as low education
group should be launched the beer. In adverting, the electronic media is
very popular. So the heavy media coverage should be acquired people like
cash prizes so company should cut down the prize like motorcycles, fridge,
TV, etc findings proved that the sales promotion have positive impacts on
the sales of the beers. But the companies lunched the sales promotion
programmers for only 3 months. It is strongly advised that sales promotion
programmers should be launched at least for 6 months. At least, sales
promotion is very important if the use would be in a proper way.

50
1. Shree Chandra Bhatta, Sales promotion and its effects on sales: A case
study of beer market of Nepal (1998) Unpublished dissertation submitted
to central Department of Management, Tribhuwan University.
2.3.4 Thapaliya, Anup kumar, in 1999
Conducted " A study in market situation of Instant Noodle Yum Yum." (A
case study in Kathmandu.)
A case study mainly focused in marketing situation of Yum Yum in market
having the following main objectives:-
1. To test the market of Yum Yum in Kathmandu.
2. To obtain and Analyze the information on the sales of different kinds
of instant noodles in Kathmandu.
3. To obtain the consumers opining on price, quality and test of
different brand.
4. To compare the position of Yum Yum instant noodles with other
brands.
5. To assets the average percentage of consumers loyalty over several
brands.
6. To compare the price, quality and taste of Yum Yum with other
brands.
7. To suggest the company of Yum Yum for overall marketing
activities for better distribution.
8. To assess the status, usage pattern attitude and image of 'Yum Yum'.
On the basis of the field survey and subsequent analysis the study has
found following. All wholesalers are under the distributorship of Chitawan
supplier the single distributor for yum Yum in Kathmandu. Wholesalers
prefer the brands of noodles on the basis of sales volume. On the basis of
sales volume Wai Wai stands at the top and Yum Yum stands in second.
Few wholesalers have expressed the view that some retailers complain over
the price of Rara, Wai Wai and hits and ot! the taste of Yum Yum. After
introduction of Yum Yum in the market 90% of wholesalers expressed that
the quality is not satisfactory and rest of the wholesalers expressed that the
quality is not satisfactory regarding the distribution of different brand by
their quality. Wai Wai is the best quality noodles and Yum Yum was in
second position. Out of 100 percent 65% use noodles as Tiffin and rest of
35% respondents use it as both Tiffin and dinner.
This study concluded that the use of instant noodles has become a
general consumption phenomenon in Kathmandu. There are various brand
of instant noodles available in the market and market of noodles has turned
to be competitive in recent years. The company does not have effective and
reliable channel to collect information from wholesalers, distributors and
consumers.
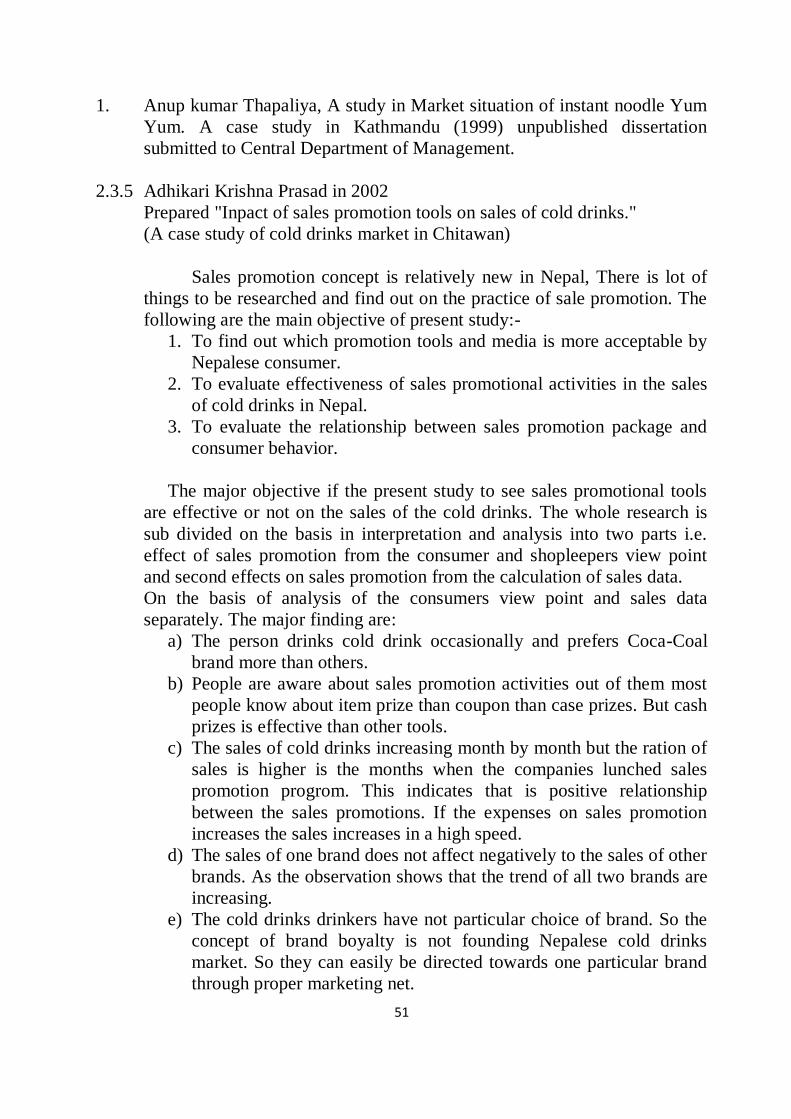
51
1. Anup kumar Thapaliya, A study in Market situation of instant noodle Yum
Yum. A case study in Kathmandu (1999) unpublished dissertation
submitted to Central Department of Management.
2.3.5 Adhikari Krishna Prasad in 2002
Prepared "Inpact of sales promotion tools on sales of cold drinks."
(A case study of cold drinks market in Chitawan)
Sales promotion concept is relatively new in Nepal, There is lot of
things to be researched and find out on the practice of sale promotion. The
following are the main objective of present study:-
1. To find out which promotion tools and media is more acceptable by
Nepalese consumer.
2. To evaluate effectiveness of sales promotional activities in the sales
of cold drinks in Nepal.
3. To evaluate the relationship between sales promotion package and
consumer behavior.
The major objective if the present study to see sales promotional tools
are effective or not on the sales of the cold drinks. The whole research is
sub divided on the basis in interpretation and analysis into two parts i.e.
effect of sales promotion from the consumer and shopleepers view point
and second effects on sales promotion from the calculation of sales data.
On the basis of analysis of the consumers view point and sales data
separately. The major finding are:
a) The person drinks cold drink occasionally and prefers Coca-Coal
brand more than others.
b) People are aware about sales promotion activities out of them most
people know about item prize than coupon than case prizes. But cash
prizes is effective than other tools.
c) The sales of cold drinks increasing month by month but the ration of
sales is higher is the months when the companies lunched sales
promotion progrom. This indicates that is positive relationship
between the sales promotions. If the expenses on sales promotion
increases the sales increases in a high speed.
d) The sales of one brand does not affect negatively to the sales of other
brands. As the observation shows that the trend of all two brands are
increasing.
e) The cold drinks drinkers have not particular choice of brand. So the
concept of brand boyalty is not founding Nepalese cold drinks
market. So they can easily be directed towards one particular brand
through proper marketing net.
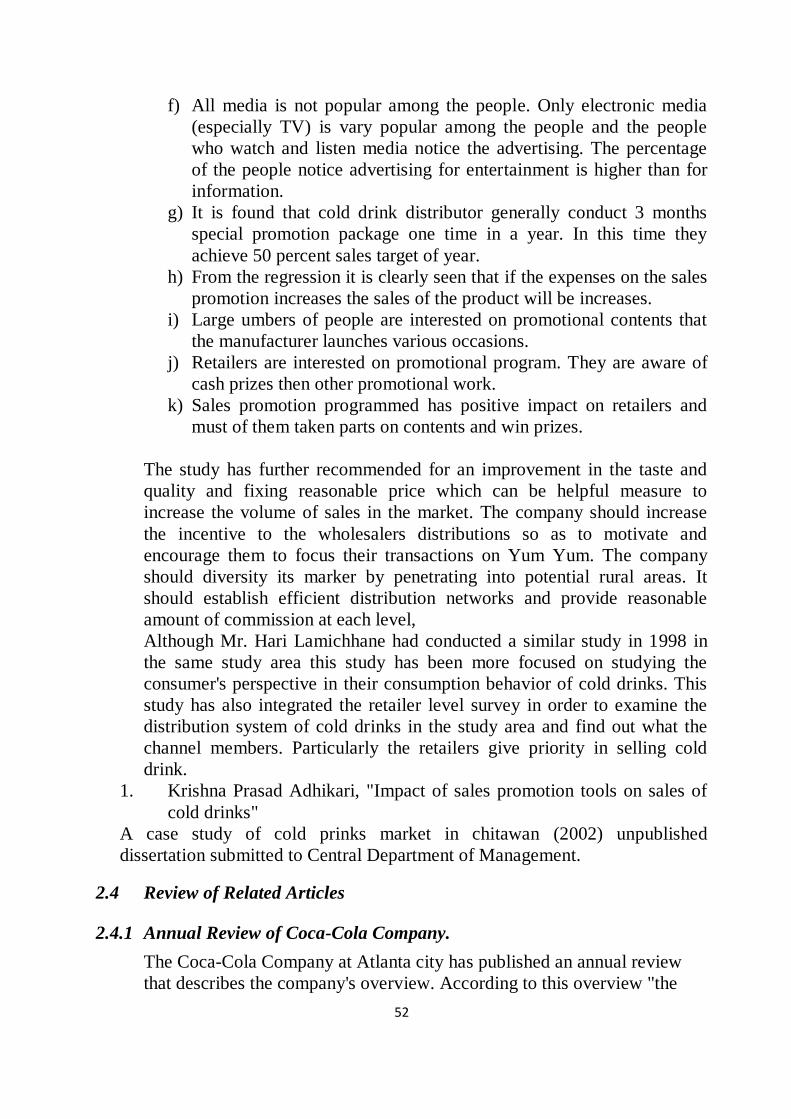
52
f) All media is not popular among the people. Only electronic media
(especially TV) is vary popular among the people and the people
who watch and listen media notice the advertising. The percentage
of the people notice advertising for entertainment is higher than for
information.
g) It is found that cold drink distributor generally conduct 3 months
special promotion package one time in a year. In this time they
achieve 50 percent sales target of year.
h) From the regression it is clearly seen that if the expenses on the sales
promotion increases the sales of the product will be increases.
i) Large umbers of people are interested on promotional contents that
the manufacturer launches various occasions.
j) Retailers are interested on promotional program. They are aware of
cash prizes then other promotional work.
k) Sales promotion programmed has positive impact on retailers and
must of them taken parts on contents and win prizes.
The study has further recommended for an improvement in the taste and
quality and fixing reasonable price which can be helpful measure to
increase the volume of sales in the market. The company should increase
the incentive to the wholesalers distributions so as to motivate and
encourage them to focus their transactions on Yum Yum. The company
should diversity its marker by penetrating into potential rural areas. It
should establish efficient distribution networks and provide reasonable
amount of commission at each level,
Although Mr. Hari Lamichhane had conducted a similar study in 1998 in
the same study area this study has been more focused on studying the
consumer's perspective in their consumption behavior of cold drinks. This
study has also integrated the retailer level survey in order to examine the
distribution system of cold drinks in the study area and find out what the
channel members. Particularly the retailers give priority in selling cold
drink.
1. Krishna Prasad Adhikari, "Impact of sales promotion tools on sales of
cold drinks"
A case study of cold prinks market in chitawan (2002) unpublished
dissertation submitted to Central Department of Management.
2.4 Review of Related Articles
2.4.1 Annual Review of Coca-Cola Company.
The Coca-Cola Company at Atlanta city has published an annual review
that describes the company's overview. According to this overview "the
53
health of our business depends on the health of our consumers. their
communities and the natural environment we all depend on. The people of
the Coca-Cola company work together with our bottling partners our
business partners and members of communities in which we operate and
even our critics to identify and address existing and emerging social and
environmental issues as well as potential solutions with our technical and
marketing expertise, our reputation and network of influence and our
global production and distribution system, We have a tremendous
opportunity to make a meaningful difference in the more than 200
countries we call home. We believe that the greater our presence. the
greater our responsibility."
1. www.2.coca-cola.com
2.4.2 Task Force Report
2.4.2.1 Market Place
The task force report of coca-cola product at Atlanta, USA has described in detail
about the quality product like coca-cola. According to task force report under
place “When you purchase a coca-cola product, you count on its quality. Our
market nearly 2400 beverage products in more than 200 countries. Each of those
products must be of the highest quality and must meet consumer’s changing
tastes, needs and expectations. And in each of those countries, we are an active
member of the business community, working hand in hand with local individuals,
merchants and governments to improve the health and prosperity of the local
economy.
2.4.2.2 Quality
According to task force reports under quality “We ensure the quality and safety
our beverages through the coca-cola quality system (TCCQS), our integrated
approach to managing quality, environment health and safety. We continuously
review TCCQS to ensure it meets the stringent and up to date global requirements
related to food safety, as well as quality management method, industry best
practices and market place conditions. In our ingredient evaluation laboratories,
for example, we perform precise analysis of fruits juices and other ingredients
sent to us by our suppliers, to ensure and to improve product quality, our
processes, too, undergo constant scrutiny, to safeguard the water. We use in our
products and the packaging that carries them to our consumers. We inform and
educate our business partners about our standards so that they meet the highest
quality requirements. Under TCCQS, quality is our highest business objective
and our enduring obligation. A word wide imitative involving every aspect of our
54
business. Every one who works far or with coca-cola is empowered and expected
to maintain the highest standards self quality in products, processes and
relationships. TCCQS mandates in depth self-assessment throughout our
operations, by all our business units, this enables us to continually raise our
standards.
The articles of coca-cola war published in Himalayan times dated on perspective,
Sunday, September 10, 2006 entitle of cola war and branding events. According
to cola wars cola, as it was less formally called (the company trade marked the
nick name in (1962), enjoyed a market share in excess of 60 percentage at the end
of second world war, but increased competition from others drinks began to erode
the company’s dominance. Part of this was coca-cola’s own doing during the
1960s, it introduced new drinks sprite, TAB and Fresca, and in 1982 the
incredibly popular diet. Coke debuted but the increasing success of Pepsi-cola,
which first appeared in 1998, eventually gave the company reason far concern.
It’s impossible to say who fired the first volley, but during the 1970s and 1982s,
the so-called “cola wars” intensified. According to branding events “today, coca-
cola spends more money on global sports sponsorship than Pepsi or any other
company with total world wide expenditures in excess of $1 billion a year. Coke
sponsored the 2002 and 2006 world cup, and it has sponsored the Olympics since
1928. in 1998, the company signed a land mark 100-years deal for sprite to be the
official soft drink of the national basketball distributes approximately300 brands
of drinks around the world, including sprite, TAB, Fresca and Diet coke, surge,
power-Ade (surge and power ad are the official soft and sports drinks,
respectively of the American national Hockey league), Barq’s Dosani bottled
water, the minute Maid line of fruit drinks, and Mr. Pibb. The popular variant
cherry coke was introduced in 1985, and in 2002 Vanilla coke hit store sheives.
Some may believe that the company’s future is mixed as well but the common
perception seems to be: if the company can survive just about anything. With the
name ‘coke’ practically synonymous with ‘cola drinks’ one can’t imagine the
brands name recognition going flat anytime soon. The cola wars will never end,
but coke is far too entrenched in the public’s consciousness to ever settle far less
than number two in the market share battle.
2.4.4 Birth of the top brand
The most valuable global brand of 2006 was published the boss journal dated
September 15 to 14 october 2006. according to these articles “in may, 1886 , coca
cola was invented by doctor john Pemberton a pharmacist from Atlanta , Georgia,
John Pemberton conducted the coca-cola formula in a three legged brass kettle in
his backyard. The name was a suggestion given by John Pemberton’s bookkeeper
55
Frank Robinson. Being a bookkeeper, Frank Robinson also had excellent
penmanship. It was who first scripted “coca-cola” into the following letters which
has become the famous logo of today.
The soft drink was first sold to the public at the soda fountain in Jacob’s
Pharmacy in Atlanta on May 8, 1886. until 1905, the soft drink marketed as a
tonic, contained extracts of cocaine as well as the caffeine-rich kola nut. In 1987,
another Atlanta Pharmacist and businessman, Asa Candler bought the formula for
coca-cola from inventor John Pemberton for 2300 dollars. By the late 1890s,
coca-cola was one of the America’s most popular fountain drinks, largely due to
candler’s aggressive marketing of product, with Asa candler, now at the helm; the
coca-cola company increases syrup sales by over 4000 percent “between” 1890 to
1900. On April 23, 1985, the trade secret “New coke” formula was released.
Today products of the coca-cola company are consumed at the rate of more than
one billion drinks per day.
Today the coca-cola company is the global leader in the non-alcoholic beverage
industry. It offers nearly 400 brands in over 200 countries. Many of these brands,
including soft drinks, fruit juices, bottled water and sports drinks, are only
available in specific regions of the word sometimes in just a single country. The
reason for this is simple: different people like different times and far different
reasons.
Chapter-3
RESEARCH METHODOLOGY
3.1 Introduction
The present study focuses on the marketing on the marketing, usage trend
and status of fanta and Miranda in Kalaiya. In this study, the relevant data have

56
been collected from consumer and retailers. To achieve the objective, the study
follows a research methodology, which has been described as follows:
3.2 Research Design
This study is based on a survey research design. A limited scale survey has
been conducted among the consumers and retailers of Fanta and Miranda in
Kalaiya. The questionnaires have been administered in order to collect data and
other information relating to the research adopted for this study.
3.3 Population and Sample
As the total population of cold drinks users of presently available brands is
find in number the study takes the population as the total consumers of cold
drinks in Kalaiya. Though the sample size is very small in comparison to the total
population, sufficient efforts have been made to make the sample representative
by included consumers from the different profession, age group, educational
backgrounds and sex.
3.4 Nature and sources of Data
This study is based mainly on primary data collected directly from the
respondents. The respondents for this study are the consumers and the retailers of
fanta and Miranda at Kalaiya. Most information has been collected from the
primary source through the questionnaires and oral conversation with concerned
distributors and consumers. The questionnaires were distributed to the consumers
and retailers of Kalaiya collecting necessary information.
Table 3:1
The size of sample and respondents:
Respondents Sample size Questionnaires % question return
Consumers 100 50 100%
Retailers 50 30 100%
Total 150 80
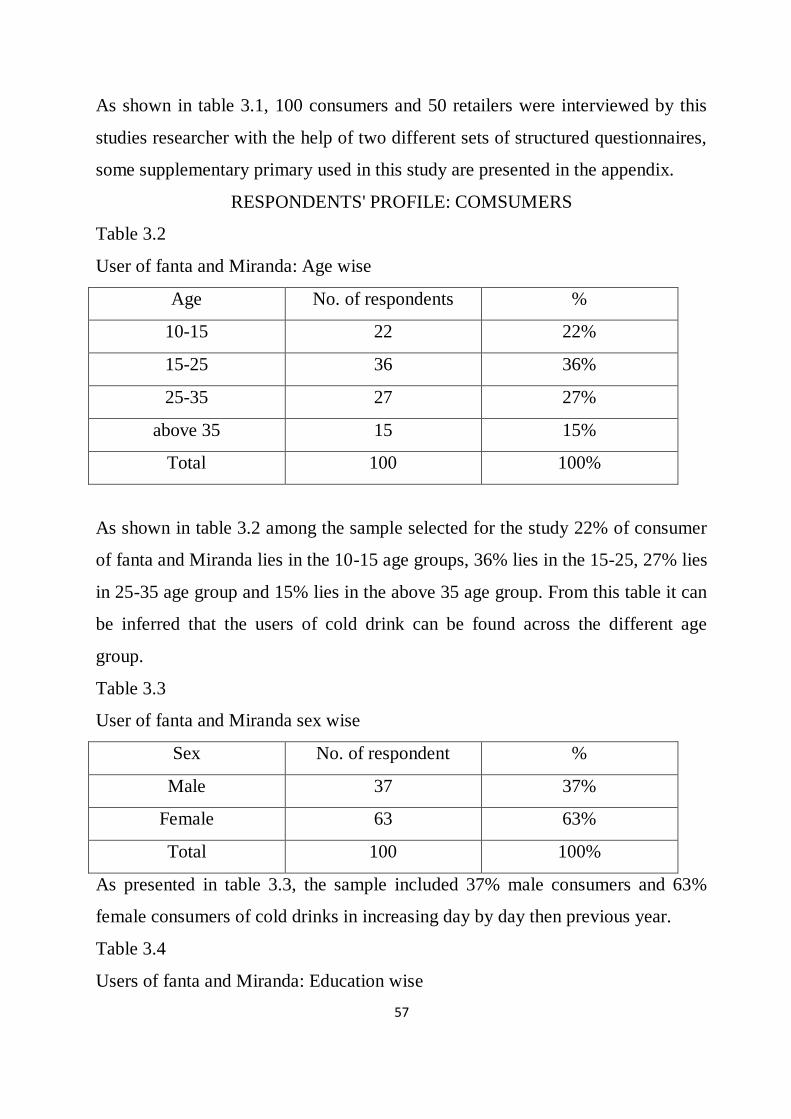
57
As shown in table 3.1, 100 consumers and 50 retailers were interviewed by this
studies researcher with the help of two different sets of structured questionnaires,
some supplementary primary used in this study are presented in the appendix.
RESPONDENTS' PROFILE: COMSUMERS
Table 3.2
User of fanta and Miranda: Age wise
Age No. of respondents %
10-15 22 22%
15-25 36 36%
25-35 27 27%
above 35 15 15%
Total 100 100%
As shown in table 3.2 among the sample selected for the study 22% of consumer
of fanta and Miranda lies in the 10-15 age groups, 36% lies in the 15-25, 27% lies
in 25-35 age group and 15% lies in the above 35 age group. From this table it can
be inferred that the users of cold drink can be found across the different age
group.
Table 3.3
User of fanta and Miranda sex wise
Sex No. of respondent %
Male 37 37%
Female 63 63%
Total 100 100%
As presented in table 3.3, the sample included 37% male consumers and 63%
female consumers of cold drinks in increasing day by day then previous year.
Table 3.4
Users of fanta and Miranda: Education wise

58
Under S.L.C 11 11%
S.L.C passed 19 19%
under graduate 35 35%
Graduate 21 21%
Above graduate 14 14%
Total 100 100%
Under S.L.C
S.L.C passed
under graduate
Graduate
Above graduate
Table 3.4 presents the education profile of the respondents, out of 100
respondents surveyed that 35% of fanta and Miranda users under graduate and
11%, 19%, 21%, 14% under S.L.C passed, Graduate and Above graduate
respectively.
Table 3.5
Users of fanta and Miranda: Occupation wise
Occupation No. of respondents %
Students 38 38%
Job holders 34 34%
Businessman 17 17%
Others 11 11%
Total 100 100%

59
0
5
10
15
20
25
30
35
40
No. of respondents
Students
Job holders
Businessman
Others
Table 3.5 show that 38% are students, 34% are job holders, 17% are businessman
and 11% are other to takes fanta and Miranda.
3.5 Data collection procedures
Two sets of structured questionnaires were developed for the purpose of
collection data from the consumers as well as retailers such as college, banks,
office and hotels etc.
The questionnaires were distributed through personal contact in which the
respondents were requested to personally visit to take interview of the retailers
and consumers. Consumers were chosen from different socio economic
background for interview officers of companies and lecture of college
interviewing fanta and Miranda.
3.6 Data processing and Analysis
The raw data collected through the questionnaires have been manually
processed and presented in the form of table. Once the data are arranged orderly,
simple statistical tools were used for analysis. The processed data have also been
presented graph, bar, diagram and pie- chart. All the questionnaires were
distributed and collected by these studies. So there was not delay in collection of
the consumers. Every questionnaire was thoroughly checked after the collection.

60
CHAPTER – 4
Data Presentation and Analysis
The data and information collected from the consumers and retailers have been
presented, analyzed and interpreted in this chapter for attaining the stated
objectives of the study. The heading first presents the consumer level survey and
the major findings of the study are included at the end of this chapter.
4.1. Consumer Survey
Table : 5.1
Users cold drinks usage trend and their favorite brand.
Brand N0. of respondent Percentage
Coke 37 37%
Fanta 19 19%
Sprite 11 11%
Pepsi 23 23%
Frooti 8 8%
Miranda 3 3%
Total 100 100%
The table 5.1 show that the attitude of consumers to cold drinks of different
brands and whether they consume only one type of brand or more one.
As shown in table 37% of the consumer are found to consume coke, where as
19% of respondent consumed Fanta, 23% of respondents consume Pepsi, 11%of
respondents consume Sprite, 8% consume Frooti and 3% of respondents consume
Miranda. From the above table it proves that the choice of coke is far ahead than
other cold drink.
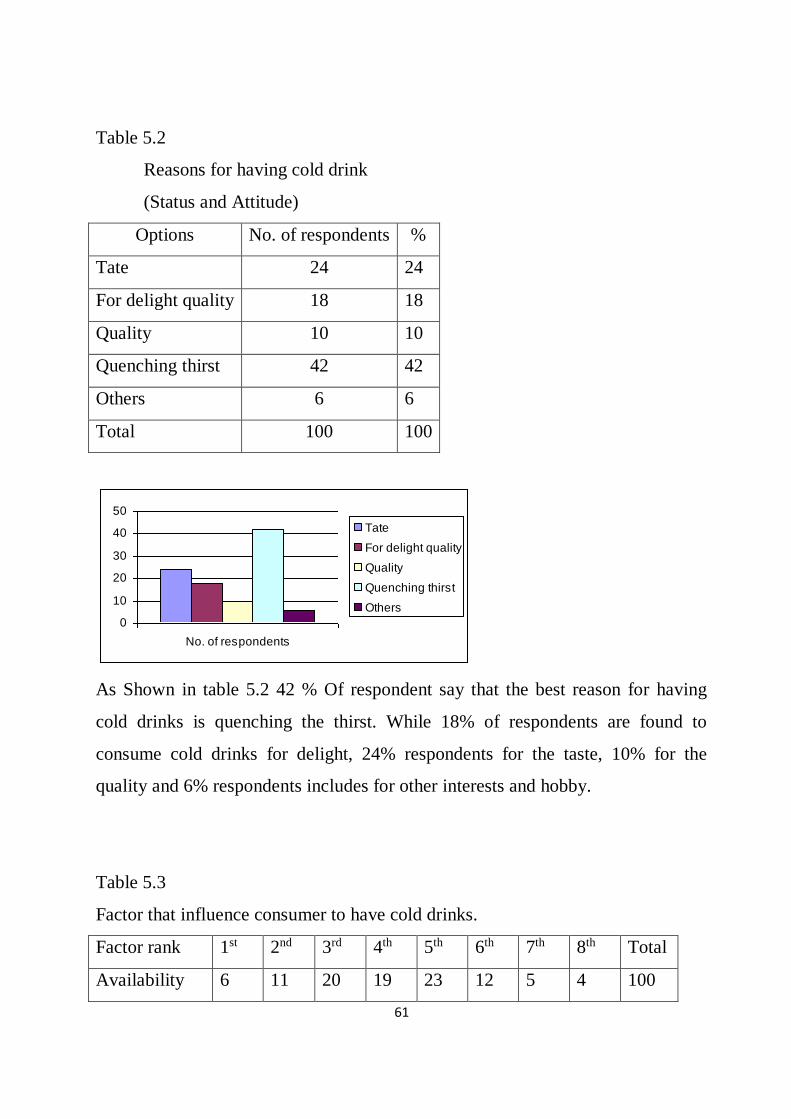
61
Table 5.2
Reasons for having cold drink
(Status and Attitude)
Options No. of respondents %
Tate 24 24
For delight quality 18 18
Quality 10 10
Quenching thirst 42 42
Others 6 6
Total 100 100
0
10
20
30
40
50
No. of respondents
Tate
For delight quality
Quality
Quenching thirst
Others
As Shown in table 5.2 42 % Of respondent say that the best reason for having
cold drinks is quenching the thirst. While 18% of respondents are found to
consume cold drinks for delight, 24% respondents for the taste, 10% for the
quality and 6% respondents includes for other interests and hobby.
Table 5.3
Factor that influence consumer to have cold drinks.
Factor rank 1st 2nd 3rd 4th 5th 6th 7th 8th Total
Availability 6 11 20 19 23 12 5 4 100

62
Advertisement 6 7 16 14 21 20 10 6 100
Sales Scheme 1 1 4 15 14 30 32 3 100
Pricce 4 11 18 21 11 11 20 4 100
Quality 48 19 12 5 5 5 5 1 100
Taste 23 44 17 9 2 3 1 1 100
Brand 11 6 12 14 20 16 16 5 100
Other 1 1 1 3 4 3 11 76 100
The table presented the different factor influencing consumption of cold drinks
have been ranked. Consumers have ranked the quality of cold drinks as the most
important factor (48 first rank and 19 second rank) followed by tast (23 First rank
and 44 second rank) the brand is third position with (11 first rank and 6 second
rank).
Similar availability is in fourth position advertisement is in the fifth position price
in the sixth position and sales scheme and other are in same position.
The table indicate that consumer give higher preference to the quality, taste
and brand name in the choice of cold drinks. Moderate Level of preference to
availability advertisement and price factor and lower preference to the sales
scheme and other factors.
Table : 5.4
Suitable place for Having cold drinking (status)
Option No. of respondents Percentage
Own house 17 17%
Restaurant/Bakery 52 52%
Picnic 12 12%
Festival 11 11%
Others 8 8%

63
Total 100 100%
0
10
20
30
40
50
60
No. of respondents
Own house
Restaurant/Bakery
Picnic
Festival
Others
According to the table 5.4 the most suitable place for having cold drinks is
restaurant / bakery which is the 52% of the total respondents. While 17% of the
respondents consume cold drinks in own house. 12% of respondent consume on
picnic and 11% and 8% of respondent consume cold drink in festival and
respectively.
Table 5.5
Size (ml or liter) of coke and pepsi most preferred
Size No. of respondent Percentage
200 ml 48 48%
250 ml 30 30%
500 ml 3 3%
1 Liter 10 10%
1.5 liter 9 9%
Total 100 100%
As Shown in table in 5.5 most Preferred size is 200 ml bottles (48%), followed by
250 ml (30%), 1 Liter bottles (9%) while 500 ml bottle is the least preferred one.
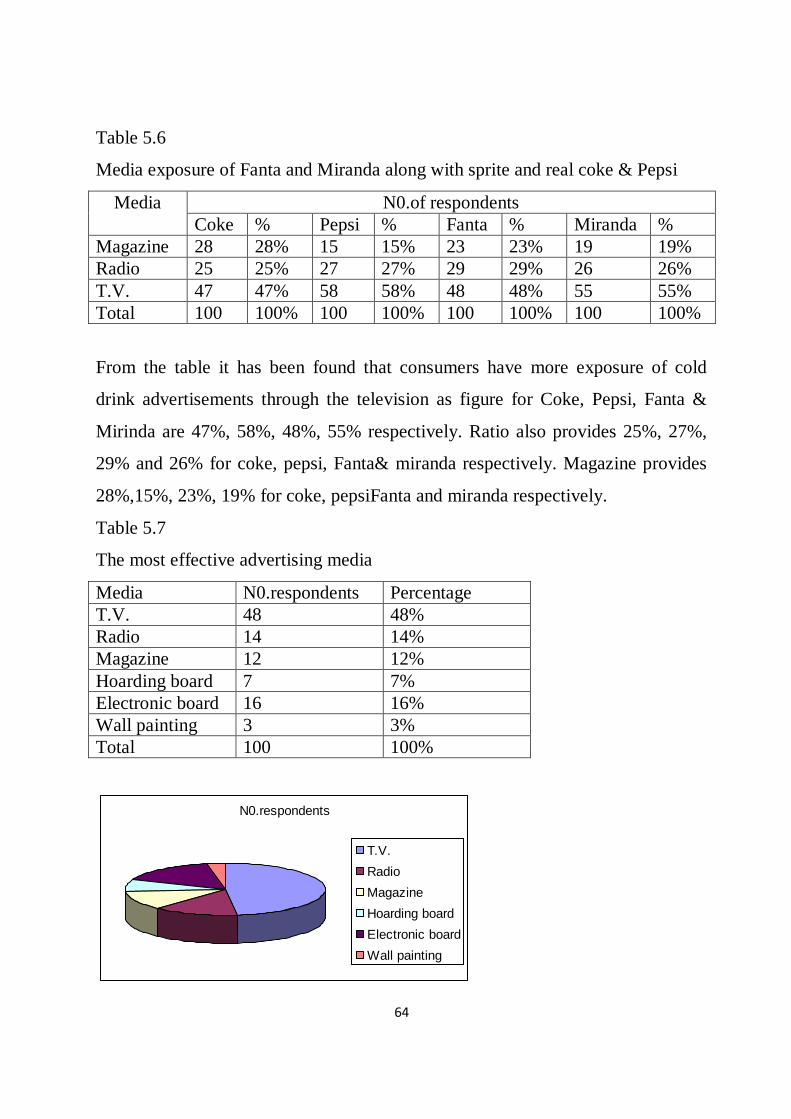
64
Table 5.6
Media exposure of Fanta and Miranda along with sprite and real coke & Pepsi
Media N0.of respondents
Coke % Pepsi % Fanta % Miranda %
Magazine 28 28% 15 15% 23 23% 19 19%
Radio 25 25% 27 27% 29 29% 26 26%
T.V. 47 47% 58 58% 48 48% 55 55%
Total 100 100% 100 100% 100 100% 100 100%
From the table it has been found that consumers have more exposure of cold
drink advertisements through the television as figure for Coke, Pepsi, Fanta &
Mirinda are 47%, 58%, 48%, 55% respectively. Ratio also provides 25%, 27%,
29% and 26% for coke, pepsi, Fanta& miranda respectively. Magazine provides
28%,15%, 23%, 19% for coke, pepsiFanta and miranda respectively.
Table 5.7
The most effective advertising media
Media N0.respondents Percentage
T.V. 48 48%
Radio 14 14%
Magazine 12 12%
Hoarding board 7 7%
Electronic board 16 16%
Wall painting 3 3%
Total 100 100%
N0.respondents
T.V.
Radio
Magazine
Hoarding board
Electronic board
Wall painting
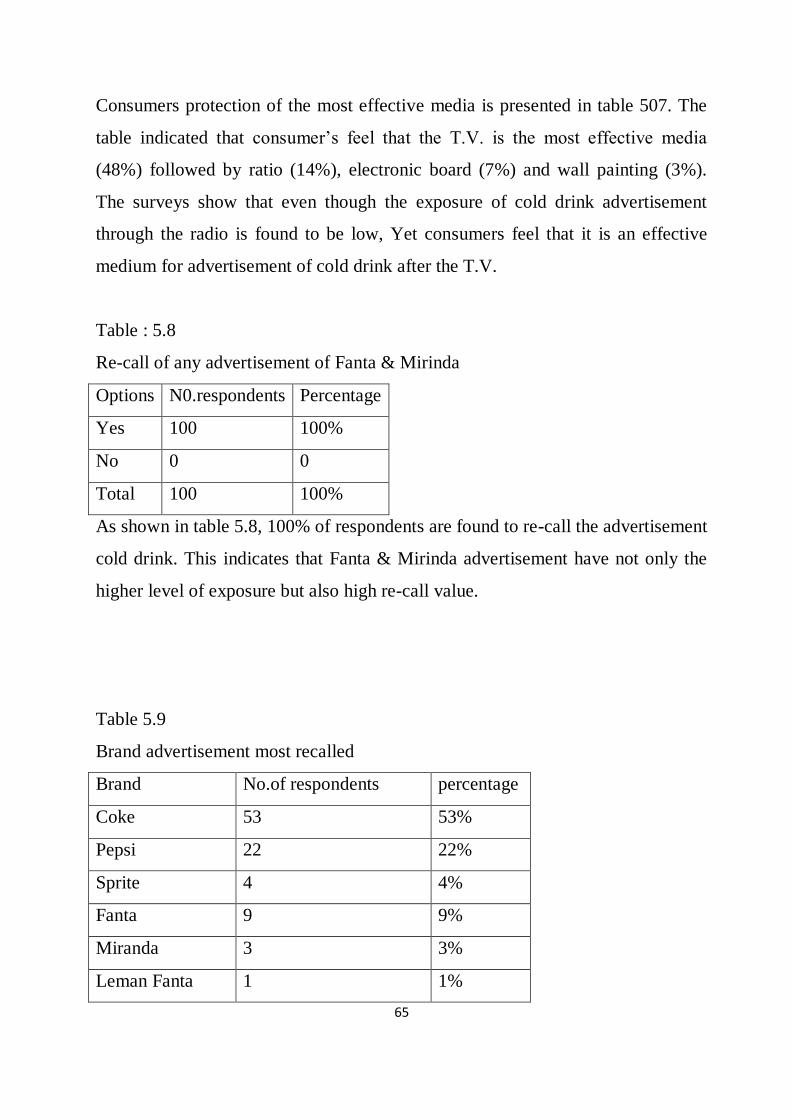
65
Consumers protection of the most effective media is presented in table 507. The
table indicated that consumer’s feel that the T.V. is the most effective media
(48%) followed by ratio (14%), electronic board (7%) and wall painting (3%).
The surveys show that even though the exposure of cold drink advertisement
through the radio is found to be low, Yet consumers feel that it is an effective
medium for advertisement of cold drink after the T.V.
Table : 5.8
Re-call of any advertisement of Fanta & Mirinda
Options N0.respondents Percentage
Yes 100 100%
No 0 0
Total 100 100%
As shown in table 5.8, 100% of respondents are found to re-call the advertisement
cold drink. This indicates that Fanta & Mirinda advertisement have not only the
higher level of exposure but also high re-call value.
Table 5.9
Brand advertisement most recalled
Brand No.of respondents percentage
Coke 53 53%
Pepsi 22 22%
Sprite 4 4%
Fanta 9 9%
Miranda 3 3%
Leman Fanta 1 1%
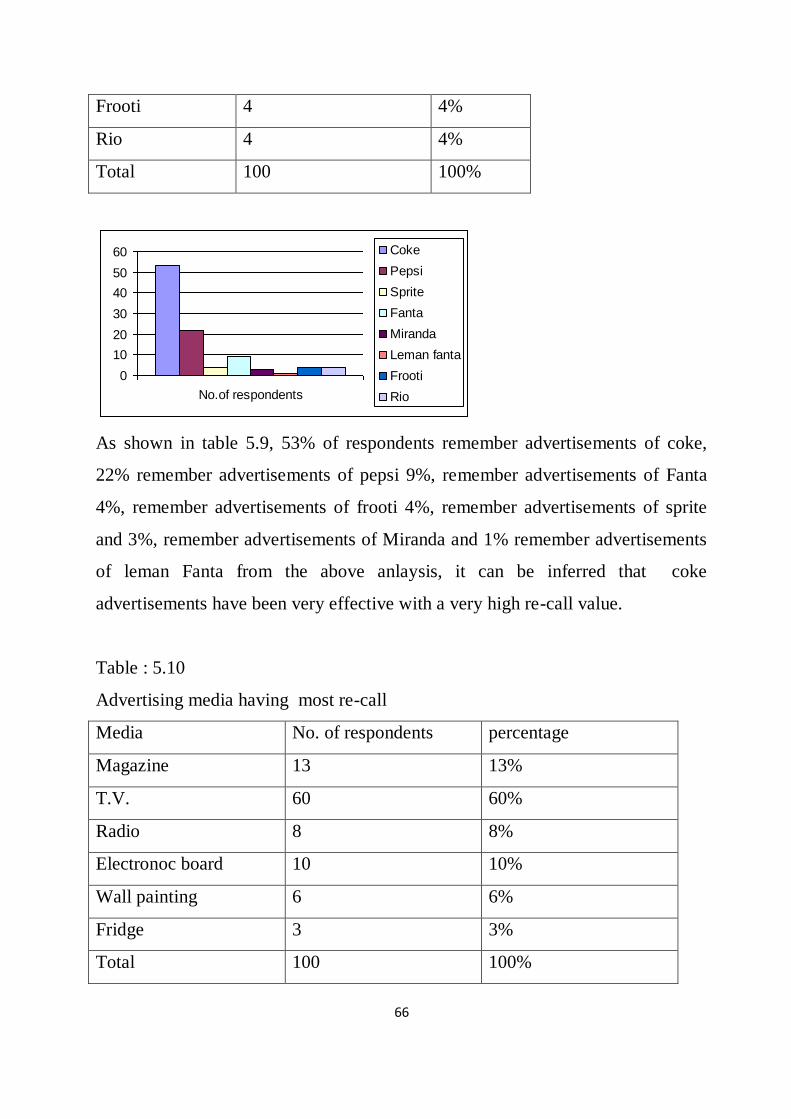
66
Frooti 4 4%
Rio 4 4%
Total 100 100%
0
10
20
30
40
50
60
No.of respondents
Coke
Pepsi
Sprite
Fanta
Miranda
Leman fanta
Frooti
Rio
As shown in table 5.9, 53% of respondents remember advertisements of coke,
22% remember advertisements of pepsi 9%, remember advertisements of Fanta
4%, remember advertisements of frooti 4%, remember advertisements of sprite
and 3%, remember advertisements of Miranda and 1% remember advertisements
of leman Fanta from the above anlaysis, it can be inferred that coke
advertisements have been very effective with a very high re-call value.
Table : 5.10
Advertising media having most re-call
Media No. of respondents percentage
Magazine 13 13%
T.V. 60 60%
Radio 8 8%
Electronoc board 10 10%
Wall painting 6 6%
Fridge 3 3%
Total 100 100%
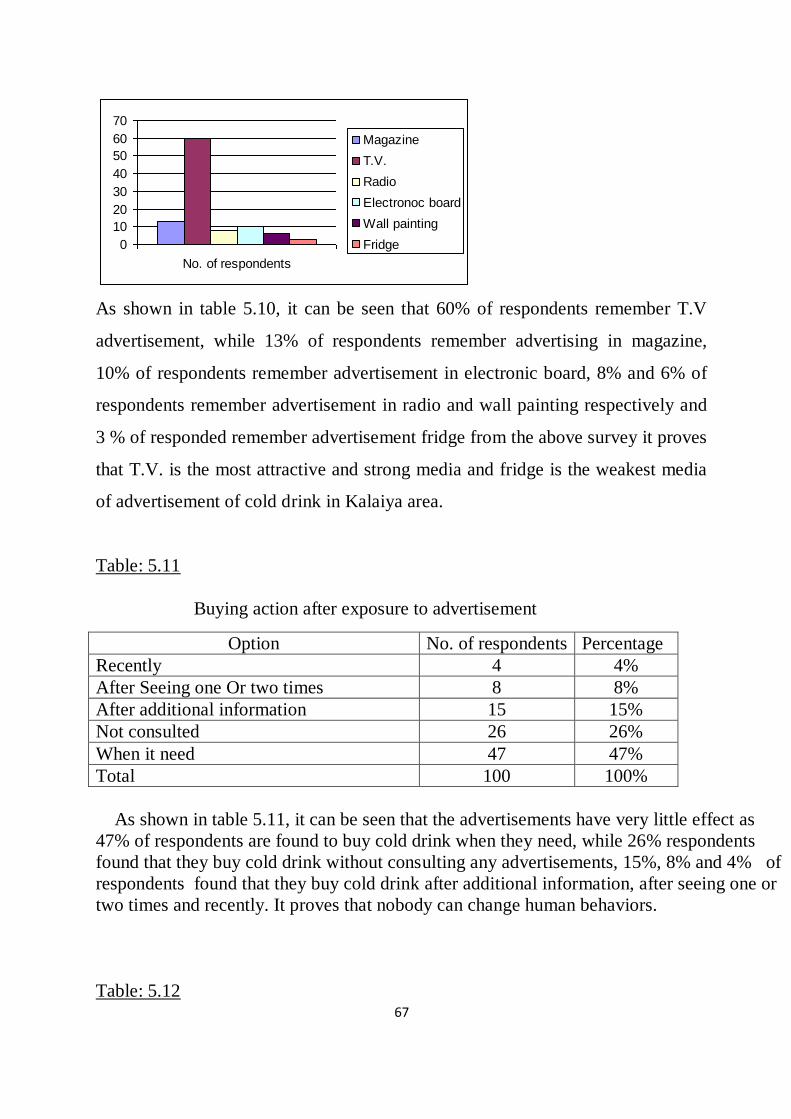
67
0
10
20
30
40
50
60
70
No. of respondents
Magazine
T.V.
Radio
Electronoc board
Wall painting
Fridge
As shown in table 5.10, it can be seen that 60% of respondents remember T.V
advertisement, while 13% of respondents remember advertising in magazine,
10% of respondents remember advertisement in electronic board, 8% and 6% of
respondents remember advertisement in radio and wall painting respectively and
3 % of responded remember advertisement fridge from the above survey it proves
that T.V. is the most attractive and strong media and fridge is the weakest media
of advertisement of cold drink in Kalaiya area.
Table: 5.11
Buying action after exposure to advertisement
As shown in table 5.11, it can be seen that the advertisements have very little effect as
47% of respondents are found to buy cold drink when they need, while 26% respondents
found that they buy cold drink without consulting any advertisements, 15%, 8% and 4% of
respondents found that they buy cold drink after additional information, after seeing one or
two times and recently. It proves that nobody can change human behaviors.
Table: 5.12
Option No. of respondents Percentage
Recently 4 4%
After Seeing one Or two times 8 8%
After additional information 15 15%
Not consulted 26 26%
When it need 47 47%
Total 100 100%
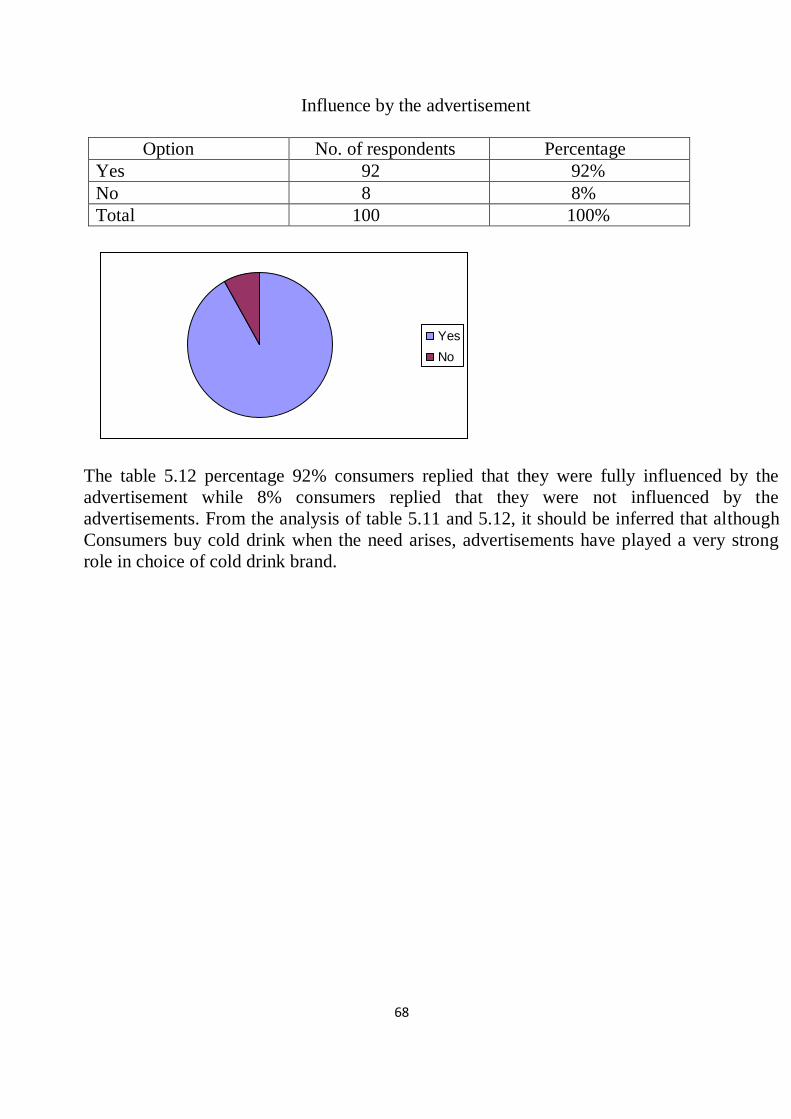
68
Influence by the advertisement
Option No. of respondents Percentage
Yes 92 92%
No 8 8%
Total 100 100%
Yes
No
The table 5.12 percentage 92% consumers replied that they were fully influenced by the
advertisement while 8% consumers replied that they were not influenced by the
advertisements. From the analysis of table 5.11 and 5.12, it should be inferred that although
Consumers buy cold drink when the need arises, advertisements have played a very strong
role in choice of cold drink brand.

69
Table: 5.13
Reasons for changing brand
Reason No. of respondents percentage
Not available 18 18%
Because of expensive 12 12%
Giving more scheme by the competitors 8 8%
To find new taste 50 50%
Because of advertisement 12 12%
Total 100 100%
Not available
Because of
expensive
Giving more
scheme by the
competitors
To find new taste
Because of
advertisement
As presented in table 5.13 consumers are
found often trying other brands as 50% respondents change their brand to find new taste.
While 18% respondents change their brand when they are most preferred brand is not
available. Another 12% of respondents change their brand because of advertisement. 12% of
respondents change their brand because of expensive price. And 8% of respondents change
their brand when completing brand provides different sales schemes. Thus it concludes that a
large number of respondents change their brand to find the new taste.

70
Table 5.14
Participation in the process of buying soft drink
Option No. of respondents Percentage
Myself 55 55%
Family member 11 11%
Friends 22 22%
Others 12 12%
Total 100 100%
As presented in table 5.14, 55% of consumers purchase cold drink for themselves, 22% of
consumer purchase through friends, 11% and 12% of consumers purchase soft drink though
their family and others respectively.
Table 5.15
Frequency of purchase of cold drink
Option No. of respondents Percentage
Once a day 28 28%
Twice a day 9 9%
Once a week 17 17%
Twice a week 24 24%
Whenever they 22 22%
Like
Total 100 100%
Table 5.15 shows the frequency of having cold drinks of the consumers, where 28% of
consumers are found to have cold drink once a day, 9% of consumers have twice a day, 17%
of consumers have cold drink once a week, 24% of consumers have cold drink twice a week
and 22% of consumers have cold drink whenever they like to have. From the table it can be
inferred that the frequency of consumption of cold drink is quite high in kalaiya.
Table 5.16
Reasons for having cola-based cold drink (Fanta & Mirinda)
Fanta Mirinda
Reasons No .of respondent percentage No .of respondent percentage
Because of brand 10 10% 10 10%
Because of taste 18 18% 8 8%
It’s available everywhere 5 5% 11 11%
For freshness 5 5% 8 8%
For quenching the thirst 40 40% 36 36%

71
For fashion 4 4% 13 13%
Because of quality 17 17% 5 5%
Others 1 1% 9 9%
Total 100 100% 100 100%
Table 5.16 presents the reasons for consumption cola-based particularly Fanta & Mirinda. The
analysis shows that 40% of respondents have Fanta because of quenching the thirst, 10%
because of brand, 18% because of taste, 5% because of its available everywhere, 5% for
freshness, 4% for fashion, 17% because of quality and 1% of respondents because of others.
Similarly, 36% of respondent have Mirinda for quenching their thirst, 10% have because of
brand, 8% have because of taste, 11% of it’s available everywhere, 8% for freshness, 13% for
fashion, 5% have because of quality and 9% have chosen Mirinda for others reason.
From the above survey it may be concluded that quenching thirst stands the first reason for
having Fanta% Mirinda. While taste and quality are second and third reasons for having Fanta
and fashion and availability are second and third reasons for having Mirinda.
Table 5.17
Advertisement liked most by respondents.
Option No. of respondents Percentage
Foreign advertisement 23 23%
Nepali model advertisement 41 41%
Nepali folk song advertisement 31 31%
Cartoon picture advertisement 5 5%
Total 100 100%
Table 5.17 presents 41% of the respondents like advertisement based on the Nepali model
advertisement, while 31% of respondents like Nepali folksong advertisement, 23% of
respondents like foreign advertisement and 5% of respondents like cartoon picture
advertisements. From the analysis it may be inferred that the cold drink users primarily like
advertisement with Nepali model while there are sufficient number of respondents who like
other forms of advertisements.

72
4.2 Retailer Survey
Table 5.18
Year in business
Year No. of retailer Percentage
0-5 14 28%
5-10 21 42%
10-15 10 20%
15 above 5 10%
Total 50 100%
As shown in table 5.18, among the 50 retailers surveyed 42% of retailers have been running
their business for the last ten years where as 28% of retailers for the last five years, 20% of
retailers for the fifteen years and 20% of retailers for above fifteen years.
Table 5.19
Brand availability in the retailer outlets
Brand No. of respondents Percentage
Coke
Pepsi
Sprite
Fanta
Mirinda
Lemon Fanta
Frooti
Rio
7’ up
Table 5.19 presents the brand availability in the retail outlets in the Kalaiya. The survey
showed that availability of Coca-Cola products (coke, Fanta, sprite, and lemon Fanta) is
generally higher than the Pepsi product (Pepsi, Mirinda, and 7 up). Rio is also found to be very
strong in terms of availability in the retail stores of the study area. Now a day’s selling
frequency of Frooti is decreasing day by day in our market.
Table 5.20
Retail sales of cold drink per day
Crates No. of respondents Percentage
½ crates 6 12%
1 crates 20 40%
2 crates 14 28%
5 crates 4 8%
Other 6 12%
Total 50 100%

73
Out of 50 retailers 40% of retailers sells one crates of cold drink in a day where as 28% of
retailers sell two crates of cold drink in a day, 12% of retailers sell half crates of cold drink in
a day and 8% of retailers sell five crates of cold drink in a day, from the above table it may be
inferred that the retail sales per store is generally between one to two crates of cold drink a
day.
Table 5.21
Brand that has more sales.
Brand No. of respondents Percentage
Coke 19 38%
Pepsi 9 18%
Sprite 2 4%
Fanta 12 24%
Mirinda 5 10%
Lemon Fanta 3 6%
Total 50 100%
As shown in table 5.21 coke is at the top position among the brands as 38% of the retailers
opined it as the most selling brand and followed by Pepsi, Fanta, Mirinda, Lemon Fanta and
sprite with 24%, 18%, 10%, 6%, and 4% respectively.

74
Table 5.22
Size of bottles sold most
Size (ml/liters) No. of respondents Percentage
200 ml 6 12%
250 ml 32 64%
500 ml 3 6%
1 liter 5 10%
1.5 liter 4 8%
Total 50 100%
As shown in table 5.22, 64% of the retailers opined that 250 ml. Bottle have the highest sales.
Whereas 12% of retailers sale 200 ml, 6% , 10% and 8% of retailers sales 500 ml, 1 liter, and
1.5 liter respectively.
Table 5.23
Type of packaging preferred for selling bottle vs. can
Option No. of respondents Percentage
Can 10 20%
Bottle 40 80%
Total 50 100%
Table 5.23 presents, 80% of retailers opined that it is easy to sell cold drink in bottles. Only
20% of the retailers are found to say it is easy to sell cold drink in cans. The above table
proves that is easy to sell the cold drinks in bottles for the retailers.
Table 5.24
Frequency of company salesman’s visit to the shop
Option Fanta % Mirinda % Frooti % Rio %
Daily 15 30% 26 52% 14 28% 21 425
Once a
Week
25 50% 14 28% 25 50% 15 30%
Twice
a week
8 16% 6 12% 8 16 5 14%
Other 2 4% 4 8% 3 6% 9 18%
Total 50 100% 50 100% 50 1005 50 100%
The table 5.24 indicates that 50% of salesmen of Fanta visit retail shop in once a week
whereas 30% of salesmen visit retail shop in daily, 16% of salesmen visit retail shop twice a
week, similarly 28% of salesmen of pepsi visit retail ship once a week, 52% do it daily and

75
12% visit the shop twice a week. The table above shows the more effective marketing
strategies of Fanta & Mirinda in Kalaiya, as compared to other cold drinks.
Table 5.25
Quantity of purchase of Fanta % Mirinda at a time
Option No. of respondents Percentage
1 crates 3 6%
2 crates 6 12%
More than 3 crates 14 28%
More than 5 crates 19 38%
More than 10 crates 8 16%
Total 50 100%
This survey reveals (table 5.25) that out of 50 retailer 38% of the retailers purchase more than
five crates while 6% purchase one crate, 12% two crates, 28% more than three crates, whereas
16% more than ten crates.
Table 5.26
Satisfaction from the distribution
Option No. of respondents Percentage
Totally satisfied 30 60%
Satisfied 12 24%
Dissatisfied 6 12%
Totally dissatisfied 2 4%
Total 50 100%
Totally satisfied
Satisfied
Dissatisfied
Totally dissatisfied
at presented in the table 5.26 60% of retailers are totally satisfied by current distribution way.
Where as 24% are only satisfied 12% are dissatisfied and 4% are totally dissatisfied. The
analysis indicates that retailers in general are satisfied from the performance of the distribution
of Fanta and Mirinda in Kalaiya.
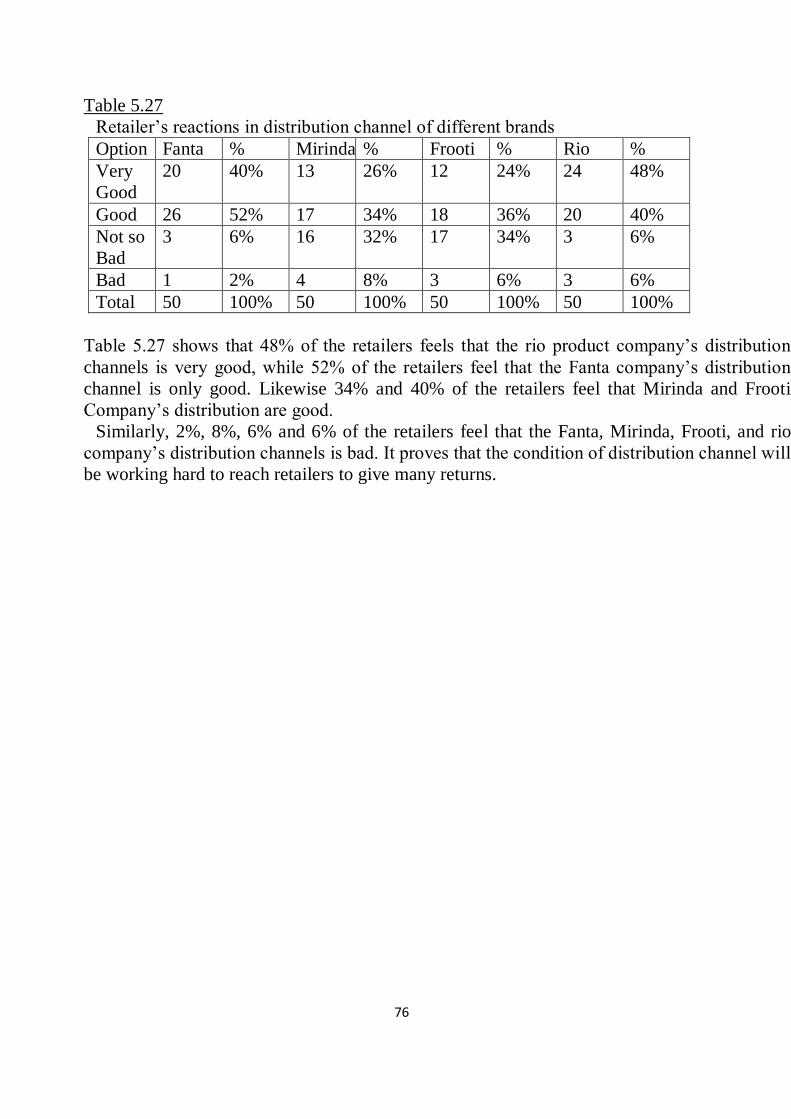
76
Table 5.27
Retailer’s reactions in distribution channel of different brands
Option Fanta % Mirinda % Frooti % Rio %
Very
Good
20 40% 13 26% 12 24% 24 48%
Good 26 52% 17 34% 18 36% 20 40%
Not so
Bad
3 6% 16 32% 17 34% 3 6%
Bad 1 2% 4 8% 3 6% 3 6%
Total 50 100% 50 100% 50 100% 50 100%
Table 5.27 shows that 48% of the retailers feels that the rio product company’s distribution
channels is very good, while 52% of the retailers feel that the Fanta company’s distribution
channel is only good. Likewise 34% and 40% of the retailers feel that Mirinda and Frooti
Company’s distribution are good.
Similarly, 2%, 8%, 6% and 6% of the retailers feel that the Fanta, Mirinda, Frooti, and rio
company’s distribution channels is bad. It proves that the condition of distribution channel will
be working hard to reach retailers to give many returns.
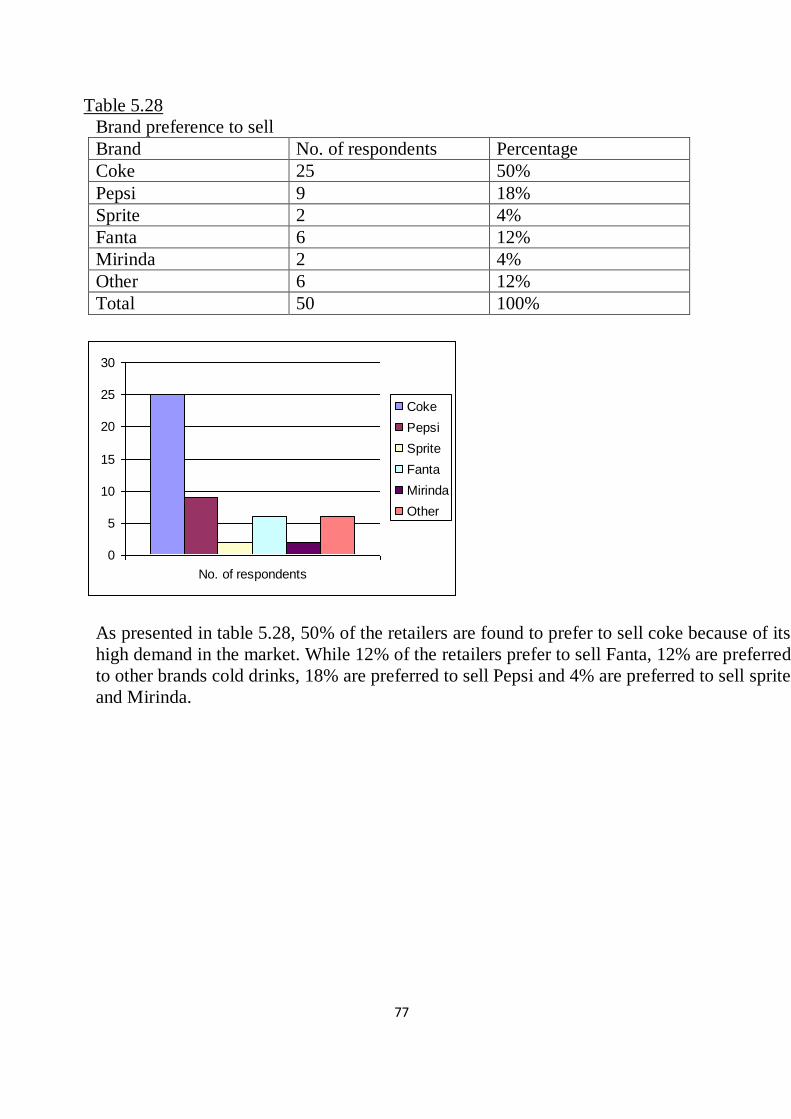
77
Table 5.28
Brand preference to sell
Brand No. of respondents Percentage
Coke 25 50%
Pepsi 9 18%
Sprite 2 4%
Fanta 6 12%
Mirinda 2 4%
Other 6 12%
Total 50 100%
0
5
10
15
20
25
30
No. of respondents
Coke
Pepsi
Sprite
Fanta
Mirinda
Other
As presented in table 5.28, 50% of the retailers are found to prefer to sell coke because of its
high demand in the market. While 12% of the retailers prefer to sell Fanta, 12% are preferred
to other brands cold drinks, 18% are preferred to sell Pepsi and 4% are preferred to sell sprite
and Mirinda.

78
Table 5.29
Reasons for preference to sell the brand
Reason No. of respondents Percentage
Company gives cash
Prize
4 8%
Company gives scheme 9 18%
I believe in the brand 14 28%
That brand consumer like
More
18 36%
Other reasons 50 100%
Total 50 100%
Company gives
cash
Prize
Company gives
scheme
I believe in the
brand
That brand
consumer like
More
As shown in the table 5.29, 36% of the retailers like that brand more while 28% of the retailers
preference to sell because of they believe in the brand, 18% of the retailers preference to sell
because company gives scheme, 18% of the retailers preference to sell because of cash prize
and other reasons respectively.
Table 5.30
Influence of advertising on sales
Option No. of respondents Percentage
Fully responsible 40 80%
Responsible to some
Extent
10 20%
Not responsible 0 0%
Not responsible at all 0 0%
Total 50 100%

79
0
5
10
15
20
25
30
35
40
45
No. of respondents
Fully responsible
Responsible to
some
Extent
Not responsible
Not responsible at
all
The table 5.30 reveals the retailers have high faith on advertising effect on sales as 80% of
them opined that the advertisement is fully responsible for the sales of the brand. While 20%
of the retailers opined as it is partly responsible for the sale of brand. It indicates that there is a
vital role of advertisement to influence sales of any type of brand.
Table 5.31
Influence of advertising of sales of cold drink
Option No. of respondents Percentage
Coke 28 56%
Pepsi 10 20%
Sprite 3 6%
Fanta 5 10%
Mirinda 1 2%
Other 3 6%
Total 50 100%
Table 5.31 shows that retailers have high faith in the coke advertisement as 56% of them feel
that the advertisement of coke has influenced its sales, while this figure for pepsi is only 20%
retailers feelings towards the influence of Fanta advertisement on its sales is 10% for other
type of brand is 6% for sprite is 6% and for Mirinda is 2%. It means Fanta & Mirinda
advertisement has quite lower influenced for its sales.

80
Table 5.32
Factors for increase in sales of Fanta & Mirinda
Option No. of respondents Percentage
Advertising should be
More
15 30%
Decrease in price 6 12%
To put prize in cork 9 18%
Increase in quality 10 20%
Change the taste 4 8%
Others 6 12%
Total 50 100%
Table 5.32 shows that 30% of retailers claim that the advertising is the best factor to increase
in sales of Fanta & Mirinda whereas 20% of the retailers claim to increase quality to increase
in sales of Fanta & Mirinda in Kalaiya. 18% of retailers suggest to put prize in cork to increase
in sales of cold drinks, 12% of the retailers say to other reasons to increase the sales of cold
drinks, 12% of the retailers also say to decrease in price to increase in sales of cold drinks and
only 8% of the retailers claim to change the taste to increase in sales of Fanta & Mirinda.
0
10
20
30
40
50
60
Others
Change the taste
Increase in quality
To put prize in
cork
Decrease in price
Advertising
should be more
Table 5.33
Sales promotion schemes to induce sales
Options No. of respondents Percentage

81
Cash prizes 25 50%
Coupon prizes 10 20%
Item prizes 10 20%
Awards 4 8%
Others 1 2%
Total 50 100%
According to table 5.33, 50% of the retailers said that cash prizes induces sales promotion of
Fanta & Mirinda while 20% or the retailers said that item prizes induce sales promotion of
Fanta & Mirinda, 20% of the retailers said that coupons prizes induces sales promotion of
Fanta & Mirinda, 8% of the retailers said to sales promotion of Fanta & Mirinda because of
awards and only 2% of the retailers said that there is other reasons to induce sales promotion
of Fanta & Mirinda in Kalaiya.
Table 5.34
Sales promotion scheme for the retailers
Option No. of respondents Percentage
Yes 42 84%
No 8 16%
Total 50 100%
As shown in the table 5.34, 84% of the retailers opined that the company must provide them
with sales promotion schemes, while 16% of the retailers said that the companies no need to
provide them with any kind of scheme.
Table 5.35
Type of promotion scheme provided by the company
Option No. of respondents Percentage
Cash discount 15 30%
Cold drink discount 7 14%
Fridge 20 40%
Prizes 6 12%
Other 2 4%
Total 50 100%
As presented in table 5.35, 40% of the retailers want to take fridge as a promotion scheme,
whereas 30% of the retailers want to receive cash discount as promotion scheme, 14% of the
retailers want to receive cold drink discount as promotion scheme, 12% of the retailers want to
receive prizes as promotion scheme and 4% of the retailers want to receive other type of prizes
as promotion scheme.
82
4.3 Major findings of the study
On the basis of above analysis of the data, some major findings have been summed up as
follows:-
1. The market position of coke is dominating here and it is the number one choice while pepsi
hold the second position. As the analysis of table no. 5.1 suggests, the choice for coke is far
more than to any other brands of cold drink available right now in the market. People’s
response towards coke is more positive than to other brands and together with this the
coca-cola company has rightly combined coke with its other products i.e. Fanta, sprite &
lemon Fanta so that it has about 76% if cold drink market.
2. The second major finding is related to the status of cold drinks on the basis of reasons to
drink. Table no. 5.2 exposes status (image) of cold drinks in people’s mind. According to
table 42% of the respondents say that the best reasons to have cold drinks for quenching the
thirst. Another status regarding cold drinks in people’s mind is that it is more suitable to
have cold drinks in restaurants and bakeries as table 5.4 suggest its strength as 52%
3. The third finding hints at consumer’s first preference to quality, taste and brand name and
only the moderate level of preference to availability advertisement and price.
4. It is found that consumer purchase 200ml bottles size of cold drinks more comparing other
size of cold drinks. Table 5.5 shows that 200ml bottles is the most preferred size 48%
consumer purchase 200ml bottles of cold drinks. It means consumer like to purchase small
size of cold drinks.
5. It has been found that consumers have more exposure of Fanta & Mirinda though the
television. Its figure stands as 48%. Naturally it most effective media for advertisement the
second media of exposure is electronic board (16%) which is far below the first one. The
strength of the other media is radio (14%). Surprisingly even the exposure of the Fanta &
Mirinda thorough radio is very low. It needs to be promoted the exposure of advertisement
for Fanta & Mirinda in an under developing country in Nepal.
6. It is interesting enough to find all respondents recalling the advertisement of the cold
drink. It is studied that coke & pepsi advertisement have much higher level of exposure as
well as a very high recall value. The study found that 53% of respondents remember
advertisement of coke, while 22% of the respondents remember advertisement of pepsi, 9%
remember Fanta, 4% remember Frooti, and 4% remember sprite and Rio, whereas 3% and
1% of the respondents remember Mirinda and lemon Fanta respectively. From the above
analysis, it may be inferred that Fanta & Mirinda advertisements have not been very
effective with a very high recall value.
7. Equally important finding can be derived from table no. 5.21; this table defines the
consumption trend of cold drinks. The table suggests that more than 38% of the total sales
of cold drinks are occupied by coke. This means consumers prefer coke rather than other
cold drinks. Therefore consumption trend of cold drinks is dominated by coke.
8. Consumers are often found to try other brands as 50% respondents change their brand to
find new taste while 18% respondents change their brand when their most preferred brand
is not available. Another 12% of respondents change their brand because of effect of
advertisement. 12% of respondents’ changes their brand because of price factor whereas
83
only 8% of respondents change their brand when completing brand provides different sales
large number or respondents change their brand to find the new taste.
9. The advertisement has very little action effects as 47% of respondents are found to buy
cold drinks when they needed. While 26% or respondents found that they buy cold drink
without consulting any advertisement. Only 4% of respondents are found to buy cold
drinks recently after exposure to an advertisement and additional 15% after a few
exposures. However, most of the consumers replied that they have fully influenced by the
advertisements. While marginal number of consumers replied that they were not influenced
by the advertisements. Form this, is should be inferred that though consumers buy cold
drinks when the need arises, advertisements have played a very strong role in the choice of
cold drink brand.
10. In the study area, 55% of consumers purchase cold drinks for themselves. 22% of the
consumers purchase though their friends, whereas 11% of consumers purchase cold drinks
though their family members and others respectively. Similarly, 28% of consumers are
found to have cold drinks once a day, 22% of consumers have cold drinks whenever they
like to have, 24% of consumers have cold drinks twice a week, 17% of consumers have
once a week and only 9% of consumers have twice a day. From this, it can be inferred that
the frequency of consumption of cold drinks is quite high in Kalaiya.
11. In terms of the reasons for consuming cola based drinks, particularly Fanta & Mirinda,
40% of respondents use to have Fanta because of quenching the thirst, 18% because of
taste, 17% for quality, 20% for brand, 5% for freshness, 4% for fashion and 1% for other
reason. Similarly 36% of respondents use to have Mirinda because of quenching the thirst,
13% for fashion, 11% for available everywhere, 10% for brand, 9% for other reason, 8%
for freshness, 8% for taste and 5% for quality. From this study, it can be conclude that
quenching the thirst stands the first attribute for having Fanta & Mirinda.
12. Among the 50 retailers surveyed, 42% of retailers have been running their business for the
last five to ten years, 28% of retailers for the five years, 20% of retailers for last ten to
fifteen years and only 10% of retailers have been running their business for last fifteen
years.
13. The study showed that the availability of coca-cola products (coke, Fanta, sprite and lemon
Fanta) is generally higher than the pepsi products (Pepsi, Mirinda and 7 up). Rio is also
found to be Very strong in terms of availability in the retail stores of the study area while
Frooti is slowly catching up in the Kalaiya market.
14. Out of 50 retailers, 40% sell one crates of cold drink in a day, 28% sell two crates of cold
drinks in a day, 12% sell half and other crates of cold drinks in a day and only 8% sell five
crates of cold drinks in a day. From this, it may be inferred that the retail sales per store is
generally between one to two crates of cold drinks in day.
15. The coke holds the top position among the brands as 38% the retailers opined it as the most
selling brand and it followed by pepsi (24%), Fanta (18%), Mirinda (10%), lemon Fanta
(9%) and sprite (2%).
In the study, 64% if the retailers opined that 500ml bottles has highest sales and 6% of
the retailers opined that 500ml bottles has the lowest sale and 30% of the retailers

84
opined that it is easy to sell cold drinks in bottles. Only 20% of the retailers are found
to say it is easy to sell cold drinks in cans. This infers that it is easy to sell the cold
drinks in bottles for the retailers.
16. Fanta and Mirinda salesman visit about half of the retail outlets once a week. The shop visit
by the company salesman for pepsi and Rio is found to be on a daily basis. Thus, the Fanta
and Mirinda have more aggressive marketing strongly in Birgunj than the Frooti and Rio.
17. This study reveals that out of 50 retailers, 38% of the retailers purchases more than five
crates at only one time while 28% are found to purchase more than three crates at a time,
12% are found to purchases two crates at time and only 6% are found to purchases one
crates at a time. This indicates that the retail purchases of Fanta & Mirinda are mostly
between three to five crates at a time.
18. The study found that 60% of the retailers are totally satisfied with the present distribution
channels, 24% of the retailers are satisfied while 12% of retailers are dissatisfied and only
4% of the retailers are totally dissatisfied. The analysis indicates that the retailers in general
are satisfied with distribution channel and marketers from the performance of the
distribution of Fanta & Mirinda in Kalaiya, 52% of the retailers feel that the Fanta
company’s distribution channel is good. This indicates that the retailers have medium level
of satisfaction with Fanta distribution than the distribution of Mirinda. Similarly, 48% of
the retailers feel that distribution channel of rio is good. This indicates that distribution
channel of company is not so bad and also shows that efficiency of distribution channel
will be increasing in near competition market.
19. In the study, 50% of the retailers are found to prefer to sell coke because of its high
demand in the market. While 18% of the retailers prefer to sell pepsi, 12% of the retailers
prefer to other types of cold drinks. 12% of the retailers prefer to sell Fanta, 4% of the
retailers prefer to sell sprite and Mirinda respectively. Similarly, 36% of the retailers like to
sell cold drinks brand mainly because the consumers like the drinks while 28% of retailers
like to sell because they believed in the brand, 18% of retailers like to sell because the
company provides them with sales schemes 8% of the retailer like to sell because the
company provides cash prizes and 10% for other reasons respectively.
20. The study reveals that the retailers have high faith advertising for its effect on sales as 80%
of them opined that the advertisement is fully responsible for the sale of brand. While 20%
of the retailers opined it partly responsible for sale of brand. So the study indicates that
most of the retailers feel that the advertisement is responsible for the sales of the brand.
21. The study shows that retailers have high faith in the coke advertisement as 56% of them
feels that the advertisement of coke has influenced its sales this figure for pepsi is only
20%. Of retailers feeling the influence of Fanta advertisement on its sales is 10% for others
6% for sprite 6% and for Mirinda 2%. It means Fanta & Mirinda advertisement is low
influenced for its sales.
22. The cold drinks sales increased by different factors. About this 30% or retailers claim that
advertising should be better to increase the sales, 20% of the retailers want the quality, 18% of
the retailers want the prizes in cork, 12% of the retailers want the decrease in price to increase
in sales of Fanta & Mirinda and only 8% of the retailers want of change the taste to increase in

85
sales of cold drinks. From this, it may be inferred that the advertising and quality are essential
to increase in sales of Fanta & Mirinda. In this study, 50% of the retailers said that cash prizes
induces sales of cold drinks while 20% of the retailers found that coupon prizes is more
effective on sales, 20% of them are favor of item prizes, 8% of them are in favor of award and
only 2% of them are in favor of other prizes. This indicates that retailers of the study indicate
that retailers of the study area are in favor of cash prizes.
23. It was found that 40% of the retailers receive fridge in cold drinks as a promotion scheme,
14% of them have received discount in cold drinks as promotion scheme, 30% of them
have received cash discount, 12% of them want prizes and only 4% of them want other
scheme in cold drink as a promotion scheme.
86
CHAPTER 5
SUMMARY, CONCLUSIONS AND RECOMMENDATION
5.1 Summary
In recent days, there has been a rapid increase in the number of industries in Nepal and they
are developing with equal strength. Every year new field of industrial important are being
discovered. Consequently, the number units at different type of industries is also increasing in
the country. All these have introduce a keen competition in the Nepalese market today, a
product not only need quality enhancement, but also better promotion and presentation in the
market. The product should be presented at right time at suitable place with good brand
promotion label and package. Every product need to meet the need and satisfaction of
consumers so get success in the market.
Marketing always plays a very significant role in accelerating the pace of industrialization
which is essentially important in making an economy developed and strong obviously
marketing is the most significant multiplier of economic development. The developing of
marketing makes possible economic integration and the perfect utilization of whatever assets
and productive capacity that as economy has already possessed. It mobilized latent economic
energy and finally contributes to the greatest needs for the rapid development of entrepreneurs
and managers. More over, population density has been creating hot climate, which in turn has
increased the demand of cold drinks brand sold in the Nepalese market has also increased in
recent years. The modern bottled cold drink was first introduced in Nepal in 1976.
When coca-cola was established,
Followed by pepsi in 1986 since then, several industries have been markets have become very
competitive in Nepal and are essential for every company to set up and effective marketing
mechanism to exploit the market potential.
The presents study aims at over viewing the actual marketing of Fanta & Mirinda in Kalaiya.
It has been conducted to examine consumers’ perception and behavior in the purchases of
these drinks in the study area and evaluate distribution network and marketing strategies of
Fanta & Mirinda companies. It aims to evaluate the impact of advertisement sell promotion
schemes on sale of cold drinks and consumers profile and their preference of Fanta & Mirinda
in the study area. It also aims to measure effect of sells promotion schemes in the sales of cold
drinks and identify consumers profile and preference of Fanta & Mirinda. This study has been
conducted through a survey of consumers and retailers. Altogether hundred consumers and
fifty retailers’ opinions have been collected by advertising questionnaires.
5.2 Conclusion
As analyzed in above data presentation and analysis chapter, the marketing usage trend status
of Fanta & Mirinda are described as follows:-

87
1. The consumers are generally found to have cold drinks during the Tiffin time (day). The
best reason for having cold drink is “Quenching the thirst” followed by “For delight” “For
taste” “for quality” and “For their interest and hobby” consumers are found to give higher
performance to quality, taste and brand name in the choice of cold drinks, moderate level
preference to availability, advertisement and price factors and lower level preference to
sales scheme and other factors. The most common place for having cold drink by consumer
is restaurant and bakery shop followed by consumer their own house, picnics, festival and
other places. The most preferred size is the 200 ml bottles, followed by 250ml, 1 liter, and
1.5 liter respectively while 500ml bottle is the least preferred.
2. The coca-cola products (coke, Fanta and sprite) have a combined market share of more
than 76 % of the Kalaiya cold drinks markets.
3. The consumers have more exposure of Fanta and Mirinda advertisements through the
television, magazines provide the second most important exposure while exposure through
radio is found to be very low. In term of consumers perception of the most effective media
the television is the most effective media followed by radio, electronic brand, magazines,
hoarding board and wall printing. Even though the exposure of Fanta and Mirinda
advertisement through radio is found to be low. However, consumers feel that it is as
effective medium for advertisement of Fanta and Mirinda after and electronic board.
4. All respondents are found to recall the advertisement of cold drink. This indicates that the
coke and pepsi advertisement have not only higher level of exposure but also a very high
recall value of coke advertisements was highest followed by Pepsi, Fanta, Frooti, Sprite,
Rio, Mirinda and Lemon Fanta. Very large numbers of respondents remember television
advertising. The study showed that television is more attractive media and radio is the
weakest media of advertisement for Fanta and Mirinda.
5. The advertisements have very little action effects as a large number of respondents are
mostly found to by cold drinks when they need. The study however, showed that although
consumers buy these drinks when the need arises, advertisements have played a very strong
role in the choice of cold drink brand.
6. Consumer are interested in trying others brands as half of the respondents change their
brand to find new taste, more than one fourth change their brand when their most preferred
brand was not available. Some consumers are found to change their brand because of price
factor or when completing brand provided different sales schemes and very few due to
advertisement.
7. The frequency of consumption of cold drinks is high in Kalaiya. Consumption who takes
cold drinks daily are about 28%. Consumers generally purchase cold drinks themselves or
through their family members.
8. Quenching thirst stands the first reason for having Fanta followed by taste while in case of
Mirinda its quenching thirst attribute stands as the first reasons followed by its fashion and
taste. The quenching thirst properties of both Rio and Frooti are the first and the second.
The reason behind the priority consumption status of these drinks is because they are fruit-
based drinks.

88
9. Cold drinks users primarily like Nepali model advertisement while there is a large number
of respondents who like other farms of advertisements also.
10. The study showed that availability of coca-cola provides (coke, Fanta, sprite and lemon
Fanta) is generally higher than Pepsi products (Pepsi, Mirinda and 7up) Rio found to be
very strong in terms of availability retail stores or the study area, while Frooti is slowly
catching up the alaiya market.
11. The coke is at the top position among the brands as two third of the retailers opined it as
the most selling brand followed by fanta and Pepsi. In the study, most of the retailers
opined that 250ml bottle has the highest sales and that is easy to sell cold drinks in bottles.
12. The fanta salesmen visit about half of the retail outlets once a week basis, whereas nearly
half of the Mirinda salesmen visit the retail outlets on a daily basis. The shop visit is found
to be mostly once a week whereas the shop visit by the company salesmen for Rio is found
to be daily on daily bases. This indicates that the fanta and Mirinda have more successful
marketing strategy in Kalaiya than Rio and Frooti.
13. The study indicates that retailers in general are totally satisfied from the performance of the
distribution of the cold drinks I Kalaiya. About 40 % of the retailers fell that the fanta
company's distribution channel is very good. While for Mirinda only 26% of retailers
opined that the company's distribution channel is very good. This indicates that the retailers
have much higher level of satisfaction with fanta's distribution than the distribution of
Mirinda. The retailers are found to prefer to sell fanta because of its high demand in the
Kalaiya market.
14. The study reveals that the retailers have high faith on advertising for its effects on sales. It
also shows that retailers have high faith in the coke advertisement as half of them feel that
the advertisement of coke has influenced is only 20%.ver, 30% of retailers claim that there
has to be more advertisement to increase the sales, where as 20% of retailers want to
increase quality for promoting the sales. From this, it may be inferred that the
advertisement and quality are essential to increase the sales of cold drinks. Retailers are
found to prefer cash prizes to induce sales of cold drinks followed by coupon prizes, item
prizes and awards.
15. More than half of retailers receive sales promotion schemes from the companies in the
form of fridge followed by cash discount and cold drink discount. However the cold drink
company not provides any prizes to retailers as a promotion scheme. More than two thirds
of retailers are brand loyal. The cold drink company has to provide more sales schemes in
future to enhance its sales percentage.
5.3 Recommendations
On the basis of the finding derived from the collected data, the following
recommendations are suggested to the company selling fanta and Mirinida
in Kalaiya.
1. As coca-cola products (coke, fanta, sprite and lemon fanta) have combined
share of more than 75% percent of the fold drink market and also has a

89
very aggressive marketing stratery, the coca-cola company has essentially
to review and revise its current marketing strategies in Kalaiya.
2. Because consumer are found to give high weight age to "Quenching the
thirst" and "For delight" the advertisement of coca-cola company should be
built around these two major attributes. We are already experiencing
through different Indian television channels that markets are hammering
sales promotion of coca-cola. By doing they want to make impression that
coke is equivalent to quenching the thirst and it is the only cold drink in the
market. As consumers are found to give higher preference to the quality,
tastes and brand name, coke is synonym (choice) of cold drink. The
advertisements should also be focused on these important aspects.
3. Since consumers have more exposure of coke and Pepsi advertisement
through the television and magazines, these media should be extensively
utilized.
4. As brand switching is very common among the consumers mainly to find
new taste of unavailability may focus the preferred brand, coca-cola
company should focus on a better availability of its brands. Pepsi products
(Pepsi, Mirinda and 7up) should be improved in its availability factor.
5. Since cold drink users primarily like Nepali model advertisements, the
company should present more advertisements based on popular Nepali
model.
6. The quality sales schemes are vey essential to promote the sales of cold
drinks. Retailers are found to prefer cash prizes to induce sales of cold
drinks followed by coupon prizes, item prices and awards. The company
should focus on these sales promotions schemes to maintain and enhance
the sales status of fanta and Mirinda in Kalaiya.
7. Finally we can say that fanta and Mirinda is not at the top position among
the branda. the company should apply in different marketing strategies
status of fanta and Mirinda in the market.

90

91
BIBLIOGRAPHY
Books
1. Adlerson, Wrope, 1957, "Marketing Behavior and Executive Action"
Homewood III: Richard D. Irwin.
2. Agrawal, , Govinda Ram, 1982 "Marketing for small business" CEDA .T.V
Kritipur.
3. Agrawal, Govinda Ram, 2000 "Marketing Management in Nepal" M.K
publisher and Distributor, Kathmandu
4. Alderson, wroe and Green, Paul E 19 "Planing and problem solving in
Marketing", Homewood II, Richard D.
5. Ansary, Adel IEI. And Kramer, Oscar E, July 1973: I, "Social Marketing: The
family planning experience" Journal of marketing vol. 37 no. 3
6. Barden Neli H and marshal, Martin V; 1959, "Advertising Management"
Irwin, Howewood III.
7. Buell, victor P 1984 " Marketing Managrment" Mc Graw Hill BookCompany,
USA.
8. Carvens, david W, Hills Gerald E, Woodruff Robert B 1996, "Marketing
Management" Richard D. Irwin Inc. USA.
9. Committee on Definitions 1960 American Marketing Association, Chicago.
10. Daver, Rustarns: 1977, "Modern marketing Management" Bombay
progressive corportation(p) Ltd.
11. Dholakia, Khurana Bhandari and Jam, 1998 " marketing management" New
Delhi : Macmillan India Ltd.
12. Duglass Johnson, 1978," Adcertising Today" Chiccago III, Science Research
ssociates.
13. Evans, Joel R Bany Bermann; 1982 'Marketing' New York: McMillan
Publishing Company, Inc
14. Evans Joel R; Berman, Barry, 1982 'Marketing' 3 edition, McMillan
Publishing Company, Inc New York 10022
15. Hansen, Richard W; cocanougher, A. Benton and Harvey, Michael G " An
application of marketing concept in the public sector Chicago American
Marketing Association.
16. Hupp, Burr W; 1969, ' Inventory policy is a top management responsibility"
New York MacMillan Company.
17. Dr Joshi Shyam 2059 B.S "Economic policy Analysis", Taleju publication,
Kathmandu.

92
18. Kelly, Egene J and Lazal Willian ;1972 "Managerial Marketing" Richard D
Irwin Inc.
19. Koirala, Kundan Dutt,2057 " Marketing and management" M.K publishers
and Distributor, Kathmandu, Nepal
20. Kotler, Philip 1998 "Marketing Management '9111 edition, prentice Hall of
India Pvt Ltd New Delhi-110001.
21. Kotler, Philip 1991 "Marketing Management; analysis planning
implementation and control ," New Delhi prentice Hall of India, Pvt. Ltd.
22. Kotler, Philip 1973 october "The tasks of Marketing Management" Hournal
of Marketing vol 37.
23. Kotler, Philip 1980 "Marketing Management planning analysis and control" 4
editions, Englewood cliffs, NJ prentice Hall of India
24. Kotler, Philip 1999 "Marketing Management" 8 editions, prentice Hall of
India Pvt Ltd New Delhi-10001.
25. Kotler, Philip 1999 Asmstrong, Gray "Principle of Marketing" 8 editions,
prentice Hall of India Pvt Ltd New Delhi-110001.
26. Lazer, William, labarcara, Priscilla, Maclacllah, James and Smith Allen, 1990
"Marketing 2000" Beyond Chicago American Marketing Association.
27. Lewis Ronald J; 1969 " Strengthening control of physical Distribution cost
New- York. Mac Millan company.
28. Mc carthy, E Jerome, 1996 "asi Marketing" Homewood, II Irwin
29. Peterson, Robin, 1977,"Marketing A contemporary Introduction" Weley
Hamilton publication
30. Schnaars, stecen P, 1991, "Marketing strategy" Maxwell Mac Millan Canasa
Inc.
31. Shrestha, Shyam kumar, "Marketing stratery and management" year
publication
32. Stanton, WJ, futrell, Charles, ' fundamentals of Marketing." 8 editions, Mc
Graw Hill International Edition, Marketing series.
33. Terry, George R 1977 "principles of Management" Bomabay Tanaporeces
publication.
34. Tillman, Rollic and Kirkpatrick, ca 1968" promotion" persuasive
communication in Marketing," Home wood III Richard D Irwin Inc.
35. Varada, Rajan P. R, (Eds), 1995 "Business of Marketing India" Jaico
publication I louse.
36. Zikmund and D, Damilo; 1986, "Marketing", 2nd edition, New York, John
Wiley Inc.

93
94
DISSERTATIONS:
a. Adhikari, Krishna Prasad; Unpublished Dissertation " Impack of Sales
promotion Tools on sale of cold drinks", (A case study of cold drinks
Market in chitan) 2002. centralDepartment of Management, T.U
Kirtipur, M.B.A Thesis.
b. Bhatta, shree Chandra; Unpublished Dissertation, 'Sales promotion and
its effects on sales", (A case study of Beer market f Nepal) 1998,
Central Department of Management, T.U. Kritipur M.B.AThesis
c. Lamichhane, Hari, " The marketing of cold drinks in Ktm." 1998,
Prithvi Narayan campus, Pokhara, M.B.A Thesis
d. Shrestha, Rajendra Bahadur, " A study of Marketing, usage attern,
Attitude and Imagr of cold drink in Birjung Area" 2006, Thakur Ram
Multiply campus, Birgunj M.B.S Thesis.
e. Thapaliya Anup Kumar; Unpublished Dissertation, "A case study on
Market situation of Instant Noodles Yum-Yum" (A case study of
Narayangarh), 1999, central Department of Management, T.U Kirtipur,
M.B.A.
f. SHYAM PRASAD SHAH, "A study of Marketing, usage Trend and
status of coke and Pepsi in Birgunj Area" 2008, Thakur Ram Multiple
Campus Birgunj M.B.S Thesis)
JOURNALS
g. Himalayan Times, Perspective, Sunday, September-10-2006
h. The Boss, Business-Organization-strategy-success, 15, September tol.
October, 2006.
WEBSITES
i. WWW.ccsabco-za
j. WWW2.coca-cola-com
k. WWW.coca-cola.com\citizenship\marketplace-case-stu
l. WWW.cocacola.nl

95
Appendex-1
Questionnaires for retailers and hotels
I am Devanti shah, a student of M.B.S of Thakur Ram Multiple Campus Birgunj.
I am doing a thesis for the partial fulfillment of Masters Degree in MBS (Masters
of Business Studies). In course of my study I need of your kind support for
collecting information regarding my topic "A study on Marketing usage, Trend
and status of fanta and Mirinda in Kalaiya." I have made a set of questionnaires
for you and request you to fill up them. I assure you that the information provided
by you will be kept confidential and used only for my research purpose.
Thanks
1. How long have you been engaged in this business?
a. Just started b. Less than a year c. More than
a\two\three\...years d. Nearly for…year
2. Which brand of cold drinks do you sell?
a. Coke b. Pepsi c. Fanta d. Sprite e.
7up f. Rio g. Fruity h. Lemon i. All of the
above
3. How many crates of Fanta and Mirinda do you sell per day?
a. Less than one b. One to two c. three to... d. More
than …
4. Which brand\brands of drinks has\have a high market?
a. Coke b. Pepsi c. fanta d. Mirinda e. Real
f. Sprite g. All of the above.
5. Wold you suggest any new technique for promoting the sales
fanta and Mirinda ?
a. If yes, which one?………..
b. The given technique is effective
c. I do not know
6. Which cold drink bottle do you sell more?
Fanta Mirinda
200ml 200ml
250ml 250ml
500ml 500ml
1liter 1liter
5liter 5liter
7. Which one of the above on basis of volume (in ml) is it easy to
sell?

96
a. 200ml b. normally 500ml c. All except 500ml
8. Which of these is easy to sell?
a. Cold drinks in bottles
b. Cold drinks in cans
9. How many times do the people of company (distributors or
agents) visit your shop or hotel?
a. Almost every week b. Twice a week
c. Fortnightly d. Once a month
10. How many crates of fanta and Mirinda do you keep at one
time?
a. 1 to 3 crates b. 3 to 5 crates
c. 5 to 10 crates d. More than 10 crates
11. Mention the level of satisfaction you have with the service of
distributors?
a. Satisfied b. Fully satisfied c. Not satisfied
d. Not at all satisfied
Please, write down the reasons for any one the above
12. On which brand of cold drinks do you give more emphasis?
a. Coke b. Pepsi c. Sprite d. fanta
e. Mirinda f. Others
13. Why do you give more emphasis as mentioned above?
a. Because the company provides with 'new schemes'
b. Because I believe in the brand
c. Because people like the brand more
d. Others reasons…
14. How does advertisement affect the selling of fanta and
amirinda?
a. Affects more b. Does not affect
c. Moderately affect d. Does not
affects at all
15. If your answer is
a. Then advertisement of which brand has more effects?
i. Coke ii. Pepsi iii. Sprite iv. Fanta
v. Mirinda vi. Others
16. Which one of the following should be done to promote the sale
of fanta and Mirinda?

97
a. More advertisement b. More prizes for consumers
through promotional schemes. c. Reduction of price d.
Emphasis on quality e. Change in taste f. All of the
above
17. Does the company provide you with schemes when you
purchase Fanta and Mirinda from them?
a. Yes b. No
18. Which of the schemes do you think as best? Mention the name
…..
19. Which of the following schemes does the company after you?
a. Cash discount b. Discount of one bottle or more in one
bottle c. Refrigerator as reward for selling colds drinks
d. Others reward.
20. Will you give up selling old brand if you are provided with
new and more attractive schemes by others brands?
a. Yes b. No c. It is different to answer
d. I have not thought of it
21. Does the company replace new bottles with the broken ones?
a. They are replaced b. Part of them are replaced. c. Not
replace
22. Please write down any comment or suggestions you have for
fanta and Mirinda?
Respondents:
Name-
Age-
Sex-
Education-
College-
Signature-
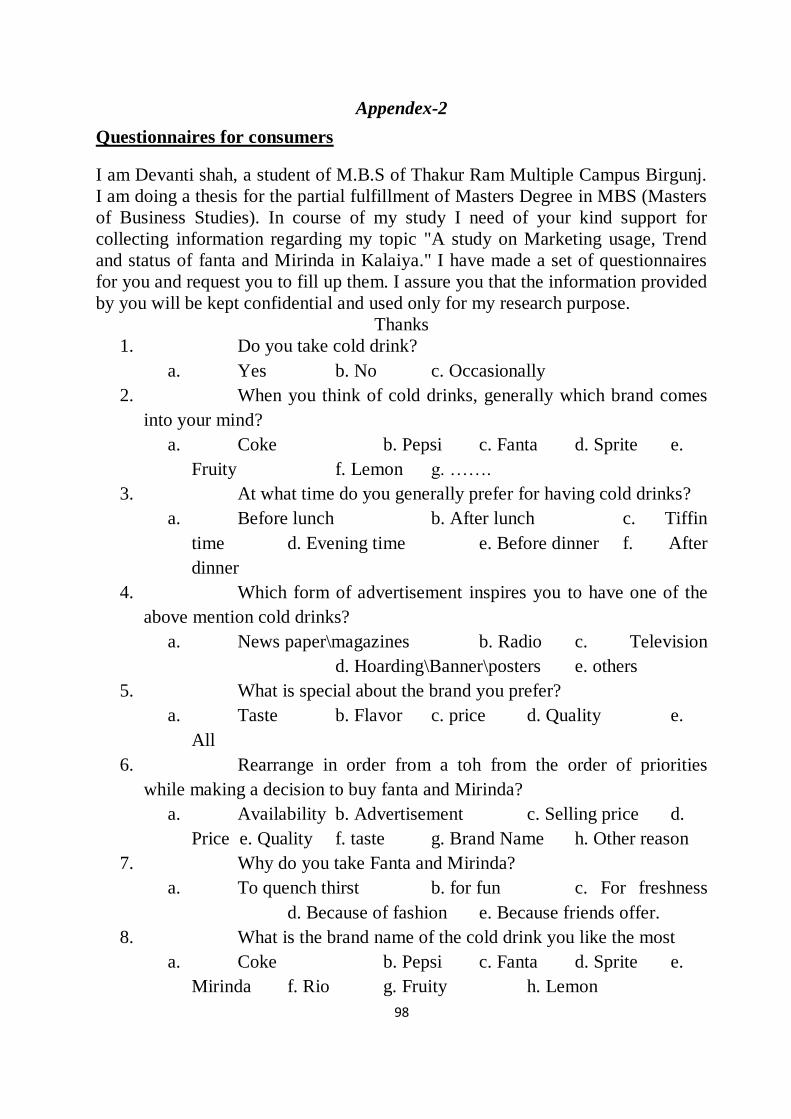
98
Appendex-2
Questionnaires for consumers
I am Devanti shah, a student of M.B.S of Thakur Ram Multiple Campus Birgunj.
I am doing a thesis for the partial fulfillment of Masters Degree in MBS (Masters
of Business Studies). In course of my study I need of your kind support for
collecting information regarding my topic "A study on Marketing usage, Trend
and status of fanta and Mirinda in Kalaiya." I have made a set of questionnaires
for you and request you to fill up them. I assure you that the information provided
by you will be kept confidential and used only for my research purpose.
Thanks
1. Do you take cold drink?
a. Yes b. No c. Occasionally
2. When you think of cold drinks, generally which brand comes
into your mind?
a. Coke b. Pepsi c. Fanta d. Sprite e.
Fruity f. Lemon g. …….
3. At what time do you generally prefer for having cold drinks?
a. Before lunch b. After lunch c. Tiffin
time d. Evening time e. Before dinner f. After
dinner
4. Which form of advertisement inspires you to have one of the
above mention cold drinks?
a. News paper\magazines b. Radio c. Television
d. Hoarding\Banner\posters e. others
5. What is special about the brand you prefer?
a. Taste b. Flavor c. price d. Quality e.
All
6. Rearrange in order from a toh from the order of priorities
while making a decision to buy fanta and Mirinda?
a. Availability b. Advertisement c. Selling price d.
Price e. Quality f. taste g. Brand Name h. Other reason
7. Why do you take Fanta and Mirinda?
a. To quench thirst b. for fun c. For freshness
d. Because of fashion e. Because friends offer.
8. What is the brand name of the cold drink you like the most
a. Coke b. Pepsi c. Fanta d. Sprite e.
Mirinda f. Rio g. Fruity h. Lemon
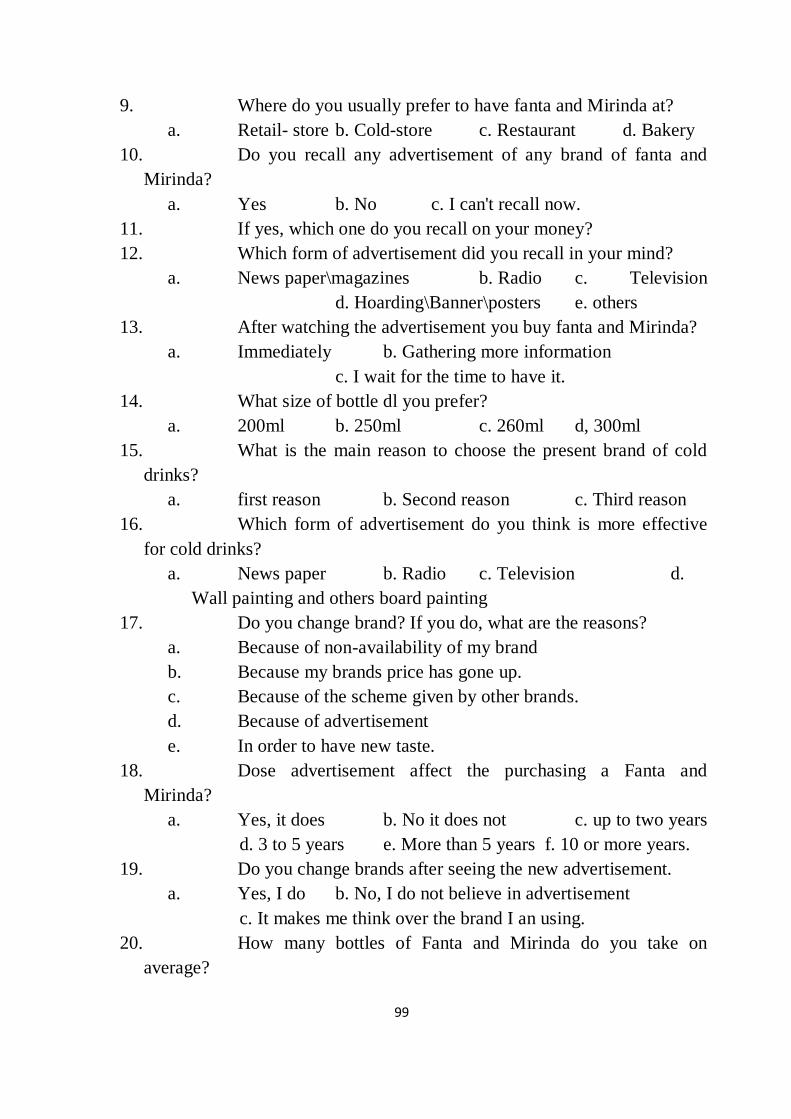
99
9. Where do you usually prefer to have fanta and Mirinda at?
a. Retail- store b. Cold-store c. Restaurant d. Bakery
10. Do you recall any advertisement of any brand of fanta and
Mirinda?
a. Yes b. No c. I can't recall now.
11. If yes, which one do you recall on your money?
12. Which form of advertisement did you recall in your mind?
a. News paper\magazines b. Radio c. Television
d. Hoarding\Banner\posters e. others
13. After watching the advertisement you buy fanta and Mirinda?
a. Immediately b. Gathering more information
c. I wait for the time to have it.
14. What size of bottle dl you prefer?
a. 200ml b. 250ml c. 260ml d, 300ml
15. What is the main reason to choose the present brand of cold
drinks?
a. first reason b. Second reason c. Third reason
16. Which form of advertisement do you think is more effective
for cold drinks?
a. News paper b. Radio c. Television d.
Wall painting and others board painting
17. Do you change brand? If you do, what are the reasons?
a. Because of non-availability of my brand
b. Because my brands price has gone up.
c. Because of the scheme given by other brands.
d. Because of advertisement
e. In order to have new taste.
18. Dose advertisement affect the purchasing a Fanta and
Mirinda?
a. Yes, it does b. No it does not c. up to two years
d. 3 to 5 years e. More than 5 years f. 10 or more years.
19. Do you change brands after seeing the new advertisement.
a. Yes, I do b. No, I do not believe in advertisement
c. It makes me think over the brand I an using.
20. How many bottles of Fanta and Mirinda do you take on
average?

100
a. One bottle a day b. two to three bottles a day c. One
bottles a week d. Twice a week e.
21. Who generally buys fanta and Mirinda for you?
a. Myself b. Family member c. Friends d. Others.
22. I drink fanta, because
a. I like the brand name
b. I like the taste
c. To quaint thirst
d. It is of high quality
e. For refreshment
f. For fashion
g. Mention if there are others reason
23. I drink Mirinda because
24. Which of the following advertisement you live the most?
a. Foreign advertisement b. Nepali model advertisement
c. Nepali folk song advertisement
d. cartoon picture advertisement
25. Any comments about advertisement of fanta and Mirinda?
Respondents:
Name-
Age-
Sex-
Education-
College-
Signature-


![Power Aware Scheduling in MulticoreSystemsbucar/aussois/melhem.pdfPotential Data Center Electrical Usage[1] Historic trend scenario Current efficiency trend scenario Improved operation](https://static.fdocuments.us/doc/165x107/5d5d966888c993935c8b654f/power-aware-scheduling-in-multicoresystems-bucaraussois-data-center-electrical.jpg)