A Study On Market Efficiency Of Selected Commodity ... · PDF fileA STUDY ON MARKET EFFICIENCY...
14
International Journal of Advancements in Research & Technology, Volume 1, Issue 5, October-2012 1 ISSN 2278-7763 Copyright © 2012 SciResPub. IJOART A STUDY ON MARKET EFFICIENCY OF SELECTED COMMODITY DERIVATIVES TRADED ON NCDEX DURING 2011 N.SAJIPRIYA Department of management studies, Manonmaniam Sundaranar University, Tirunelveli, India. Email:[email protected] ABSTRACT The study aims at testing the weak form of Efficient Market Hypothesis in the context of an emerging commodity market - National Commodity Derivatives Exchange (NCDEX), which is considered as the prime commodity derivatives market in India. The study considered daily spot and futures prices of five selected commodities traded on NCDEX over 12 month period (the futures contracts originating and expiring during the period January 2011 to December 2011) The five commodities chosen are Pepper, Crude palm Oil, steel silver and Chana as they account for almost two-thirds of the value of agricultural commodity derivatives traded on NCDEX. The results of Run test indicate that both spot and futures prices are weak form efficient Keywords: Commodity Market, Market Efficiency 1. INTRODUCTION India has a long history of Future Trading in Commodities. In India, trading in Commodity Futures has been in existence from the 19 th century with organized trading in cotton, through the establishment of Bombay Cotton Association Ltd. In 1875 Over a period of time, other commodities were permitted to be traded in future Exchanges. Spot trading in India occurs mostly in regional mantis and unorganized
Transcript of A Study On Market Efficiency Of Selected Commodity ... · PDF fileA STUDY ON MARKET EFFICIENCY...
International Journal of Advancements in Research & Technology, Volume 1, Issue 5, October-2012 1 ISSN 2278-7763
Copyright © 2012 SciResPub. IJOART
A STUDY ON MARKET EFFICIENCY OF SELECTED
COMMODITY DERIVATIVES TRADED ON NCDEX DURING 2011
N.SAJIPRIYA
Department of management studies,
Manonmaniam Sundaranar University,
Tirunelveli, India.
Email:[email protected]
ABSTRACT
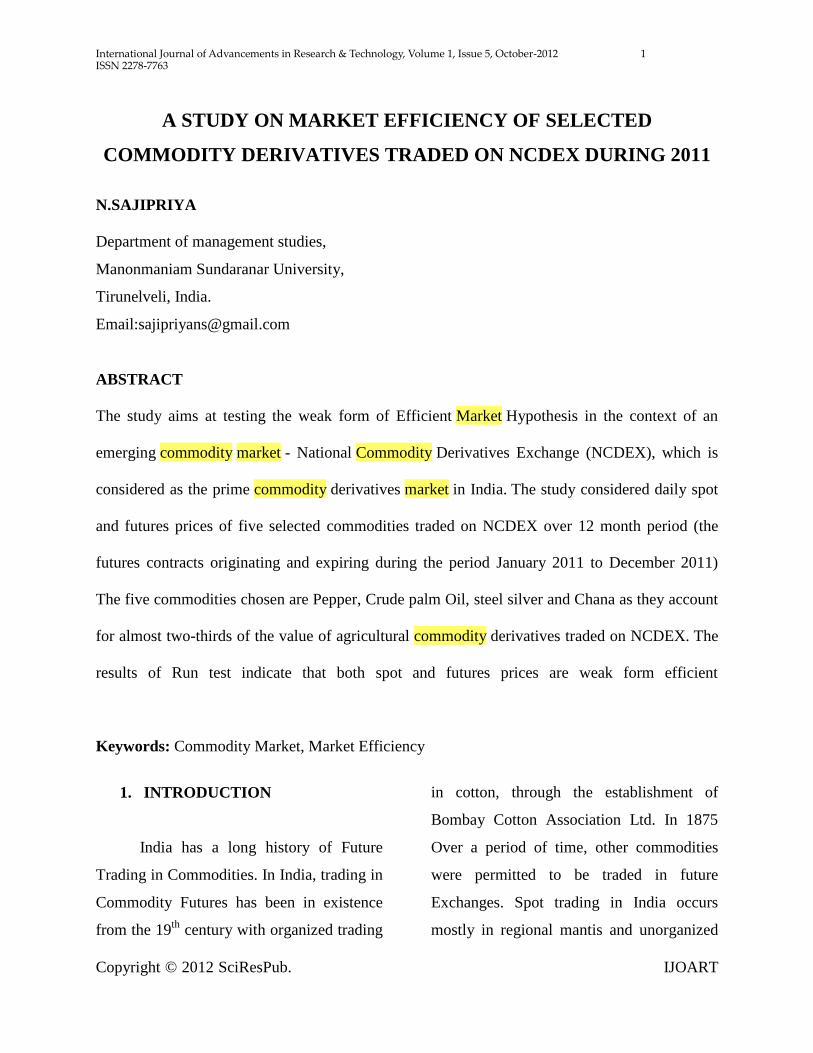
The study aims at testing the weak form of Efficient Market Hypothesis in the context of an
emerging commodity market - National Commodity Derivatives Exchange (NCDEX), which is
considered as the prime commodity derivatives market in India. The study considered daily spot
and futures prices of five selected commodities traded on NCDEX over 12 month period (the
futures contracts originating and expiring during the period January 2011 to December 2011)
The five commodities chosen are Pepper, Crude palm Oil, steel silver and Chana as they account
for almost two-thirds of the value of agricultural commodity derivatives traded on NCDEX. The
results of Run test indicate that both spot and futures prices are weak form efficient
Keywords: Commodity Market, Market Efficiency
1. INTRODUCTION
India has a long history of Future
Trading in Commodities. In India, trading in
Commodity Futures has been in existence
from the 19th
century with organized trading
in cotton, through the establishment of
Bombay Cotton Association Ltd. In 1875
Over a period of time, other commodities
were permitted to be traded in future
Exchanges. Spot trading in India occurs
mostly in regional mantis and unorganized

International Journal of Advancements in Research & Technology, Volume 1, Issue 5, October-2012 2 ISSN 2278-7763
Copyright © 2012 SciResPub. IJOART
market, which are fragmented and isolated.
The 100 unorganized exchanges were
conducting forward trade in various
commodities. The securities market was a
poor competitor of this market as there were
not many papers to be traded at that time.
India, commodity based economy
where two-third of the one billion
population depend on agricultural,
commodities, surprisingly has an under
developed commodity market. Unlike the
physical market futures markets trades in
commodity are largely used as risk
management (hedging) mechanism on either
physical commodity itself or open positions
in commodity stock.
Since commodity “futures” trading
was permitted in 2003, the commodity
derivative market in India has witnessed
phenomenal growth. Trading of commodity
derivatives on exchange platforms helps to
achieve price discovery. Price risk
management besides helping economy with
better resource allocation. Though the
volume of commodity future trade
increased exponentially since its launch in
2003, the functioning of the futures
market came under scrutiny during 20008-
2009 due to price rise.
However, the success of these
markets in performing the stabilizing
function critically depends on whether they
are “efficient”. Moreover the “dual price
system” under which different prices for
same commodities exist, the administration
of a part of market for the commodity by
the government is expected to give rise to
inefficiency . In an emerging market
context like India, the growth of commodity
future market would depend on efficiency
of the future market.
Commodity
A commodity may be defined as an
article, a product or material that is bought
and sold. It can be classified as every kind of
movable property, except Actionable
Claims, Money & Securities. Commodities
actually offer immense potential to become
a separate asset class for market-savvy
investors, arbitrageurs and speculators.
Retail investors, who claim to understand
the equity markets, may find commodities
an unfathomable market. But commodities
are easy to understand as far as
fundamentals of demand and supply are
concerned. Retail investors should
understand the risks and advantages of
International Journal of Advancements in Research & Technology, Volume 1, Issue 5, October-2012 3 ISSN 2278-7763
Copyright © 2012 SciResPub. IJOART
trading in commodities futures before taking
a leap. Historically, pricing in commodities
futures has been less volatile compared with
equity and bonds, thus providing an efficient
portfolio diversification option.
Commodities actually offer immense
potential to become a separate asset class for
market-savvy investors, arbitrageurs and
speculators. Retail investors, who claim to
understand the equity markets, may find
commodities an unfathomable market. But
commodities are easy to understand as far as
fundamentals of demand and supply are
concerned. Retail investors should
understand the risks and advantages of
trading in commodities futures before taking
a leap. Historically, pricing in commodities
futures has been less volatile compared with
equity and bonds, thus providing an efficient
portfoliodiversification option.
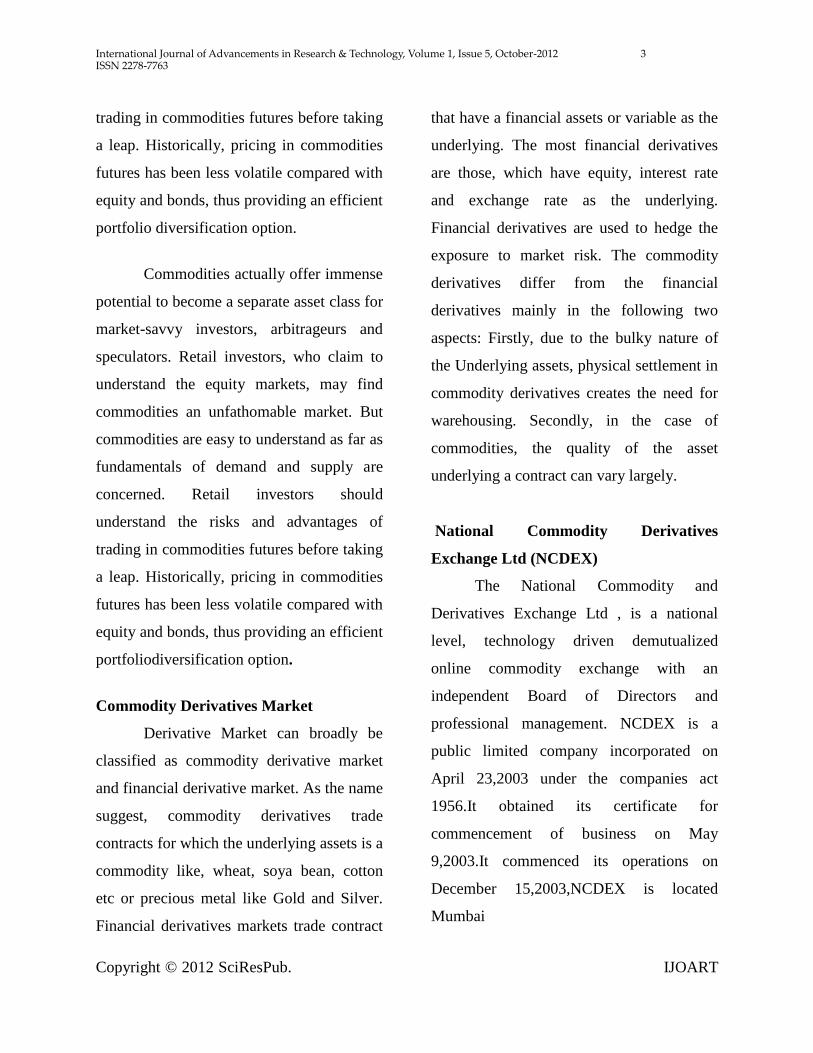
Commodity Derivatives Market
Derivative Market can broadly be
classified as commodity derivative market
and financial derivative market. As the name
suggest, commodity derivatives trade
contracts for which the underlying assets is a
commodity like, wheat, soya bean, cotton
etc or precious metal like Gold and Silver.
Financial derivatives markets trade contract
that have a financial assets or variable as the
underlying. The most financial derivatives
are those, which have equity, interest rate
and exchange rate as the underlying.
Financial derivatives are used to hedge the
exposure to market risk. The commodity
derivatives differ from the financial
derivatives mainly in the following two
aspects: Firstly, due to the bulky nature of
the Underlying assets, physical settlement in
commodity derivatives creates the need for
warehousing. Secondly, in the case of
commodities, the quality of the asset
underlying a contract can vary largely.
National Commodity Derivatives
Exchange Ltd (NCDEX)
The National Commodity and
Derivatives Exchange Ltd , is a national
level, technology driven demutualized
online commodity exchange with an
independent Board of Directors and
professional management. NCDEX is a
public limited company incorporated on
April 23,2003 under the companies act
1956.It obtained its certificate for
commencement of business on May
9,2003.It commenced its operations on
December 15,2003,NCDEX is located
Mumbai

International Journal of Advancements in Research & Technology, Volume 1, Issue 5, October-2012 4 ISSN 2278-7763
Copyright © 2012 SciResPub. IJOART
MARKET EFFICIENCY
There are different types of market
efficiency that are defined in terms of the
available information. Fama (1970) has
categorized market efficiency into three
forms.
(1) Weak form efficiency
(2) Semi –strong form efficiency
(3) Strong form efficiency
Weak form efficiency
Prices reflect all information found in the
record of past prices and volumes market is
called weak form efficient if the current
price fully reflects all available information
in the historic series of price, it is also
known as the “ test of return predictability”.
Semi – strong form efficiency
Prices reflect not only all information
found in the record of prices and volumes
but also all other publicly available
information.
Strong form efficiency
Prices reflect all available
information public as well as private.
2. Objectives of the study
1. To analyze market efficiency of
selected commodities (Chana,
Pepper, Steel, Silver, Crude oil).
2. To study the market efficiency of
NCDEX in India by considering all
commodity indices in future and
spot markets
3. RESEARCH METHODOLOGY OF
THE STUDY
Selection of the Sample
While selecting the sample indices, all the
NCDEX indices, the sample indices consist
of Futures and Spot Prices
Sources and Collection of Data
The present study was mainly based on
secondary data which were collected from
the NCDEX websitewww.ncdex.com.
Further, the available secondary data were
collected from the various published books,
Articles, Journals.
Period of the Study
This study was mainly intended to examine
Market Efficiency of Futures and Spot
market indices of National Commodity
Derivatives Exchange (NCDEX) in India.
International Journal of Advancements in Research & Technology, Volume 1, Issue 5, October-2012 5 ISSN 2278-7763
Copyright © 2012 SciResPub. IJOART
All the indices which were under NCDEX,
from January 1th
2011 to December 31st
2011, were considered as the sample indices
4. REVIEW OF LETERATURE
“Market Efficiency in agricultural future
markets” By Andrew M.Mckenzie and
Mathew .F.Hold (2002).This study
examined in four agricultural commodity
futures (Livecattle, hogs, corn,
soybean).Results indicate that
livecattle,hogs, corn and soy bean meal
futures markets are both efficient, and
biased in the long run, also suggest short run
time varying risk premium in cattle and hogs
futures markets.
“Efficiency Test of agricultural
commodity futures markets in China”By
Wang Hong and Bingfanke (2005).This
result suggest a long term equilibrium
relationship between the future price and
cash price for soybean and weak short term
efficiency in the soy bean market .The study
also highlighted in efficient future market
wheat an suggested that it may have been
caused by over speculation and government
intervention.
“Efficiency and Future Trading- Price
Nexus in Indian Commodity Future
Market” By Pravakar Sahoo(2009).The
examined and future trading price Nexus for
five selected commodities (gold, copper,
petroleum, soyaoil, and chana). Results
suggested that the market is efficient for all
five commodities.
In India, NCDEX is considered as prime
national level commodity exchange for
agricultural and non agricultural
commodities and hence selected for the
study and the time frame chosen for the
study is the future contracts originating and
expiring during the period January 1th
2011
to December 31st 2011. Five selected
commodities namely – Pepper,
Steel,Silver,Chana , and Crude palm oil
have been selected for this study.The future
Open and Close and Spot Close prices on all
trading days during the period were obtained
from home page of NCDEX
(www.ncdex.com).
5.Results and Discussions
Run Test
International Journal of Advancements in Research & Technology, Volume 1, Issue 5, October-2012 6 ISSN 2278-7763
Copyright © 2012 SciResPub. IJOART
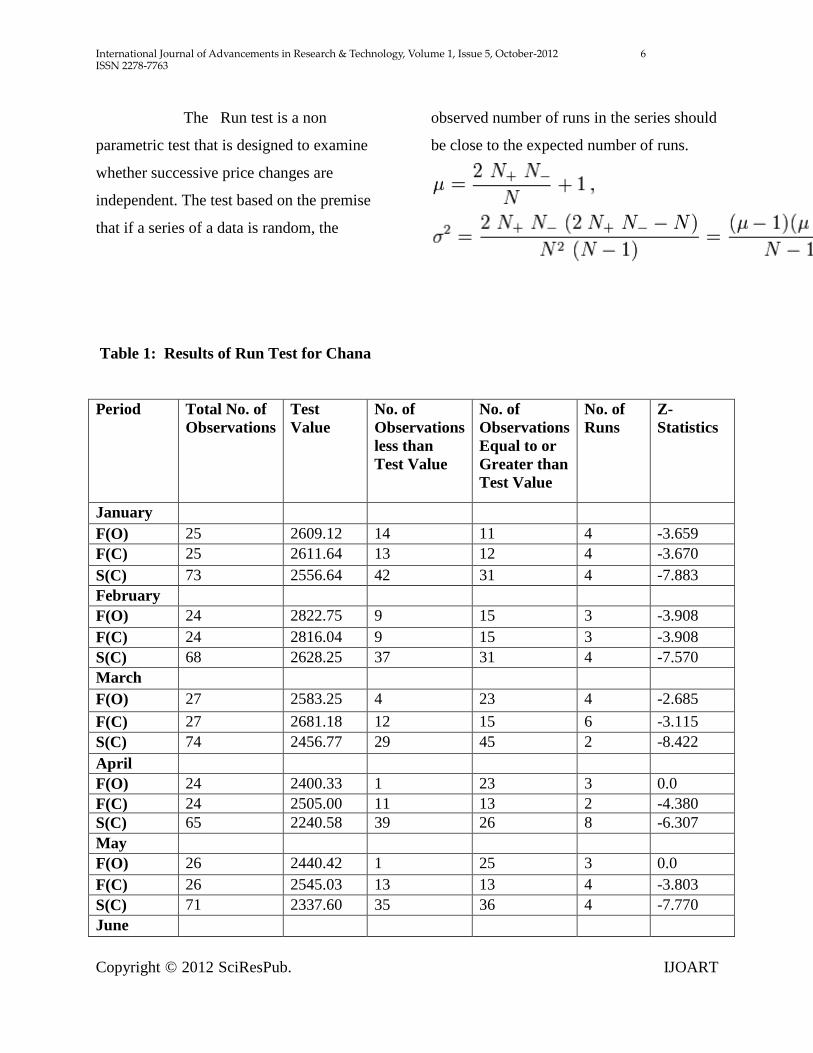
The Run test is a non
parametric test that is designed to examine
whether successive price changes are
independent. The test based on the premise
that if a series of a data is random, the
observed number of runs in the series should
be close to the expected number of runs.
Table 1: Results of Run Test for Chana
Period Total No. of
Observations
Test
Value
No. of
Observations
less than
Test Value
No. of
Observations
Equal to or
Greater than
Test Value
No. of
Runs
Z-
Statistics
January
F(O) 25 2609.12 14 11 4 -3.659
F(C) 25 2611.64 13 12 4 -3.670
S(C) 73 2556.64 42 31 4 -7.883
February
F(O) 24 2822.75 9 15 3 -3.908
F(C) 24 2816.04 9 15 3 -3.908
S(C) 68 2628.25 37 31 4 -7.570
March
F(O) 27 2583.25 4 23 4 -2.685
F(C) 27 2681.18 12 15 6 -3.115
S(C) 74 2456.77 29 45 2 -8.422
April
F(O) 24 2400.33 1 23 3 0.0
F(C) 24 2505.00 11 13 2 -4.380
S(C) 65 2240.58 39 26 8 -6.307
May
F(O) 26 2440.42 1 25 3 0.0
F(C) 26 2545.03 13 13 4 -3.803
S(C) 71 2337.60 35 36 4 -7.770
June

International Journal of Advancements in Research & Technology, Volume 1, Issue 5, October-2012 7 ISSN 2278-7763
Copyright © 2012 SciResPub. IJOART
F(O) 26 2654.61 18 8 2 -4.532
F(C) 26 2660.38 17 9 2 -4.561
S(C) 74 2535.55 51 23 2 -8.408
July
F(O) 26 3148.92 8 18 2 -4.532
F(C) 26 3159.30 8 18 2 -4.532
S(C) 79 2841.38 43 36 4 -7.877
August
F(O) 26 3257.15 1 25 2 -1.588
F(C) 26 3389.96 13 13 5 -3.403
S(C) 71 3036.30 46 25 5 -7.449
September
F(O) 26 3508.65 2 24 2 -3.477
F(C) 26 3639.69 15 11 3 -4.183
S(C) 71 3460.44 34 37 3 -8.008
October
F(O) 26 3249.03 5 21 9 0.00
F(C) 26 3371.92 14 12 4 -3.796
S(C) 62 3274.74 37 25 4 -7.146
November
F(O) 26 3475.92 10 16 6 -2.885
F(C) 26 3459.46 11 15 6 -2.952
S(C) 68 3462.01 25 43 8 -6.476
December
F(O) 17 3153.94 9 8 6 -1.494
F(C) 17 3162.47 9 8 4 -2.499
S(C) 29 34865.10 15 14 5 -3.780
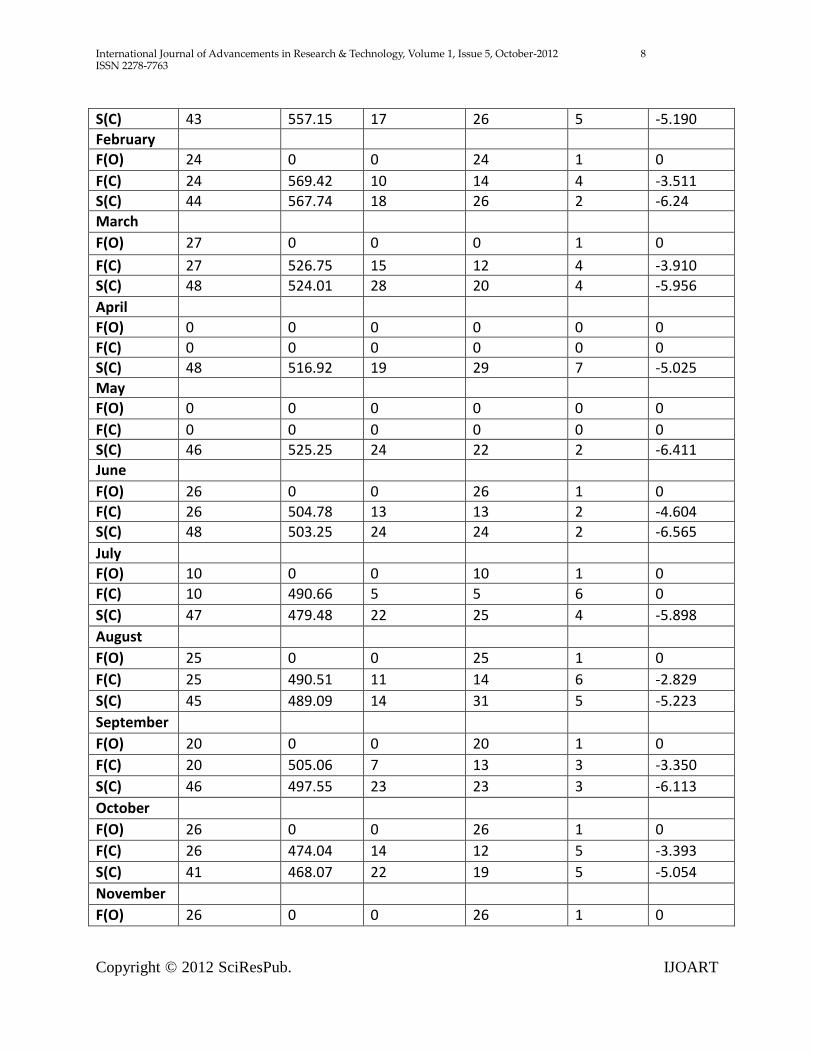
Table 2: Results of Run Test for Crude Palm Oil
Period Total No.of Observations
Test Value
No.of Observations less than Test Value
No.of Observations Equal to or Greater than Test Value
No.Of Runs
Z-Statistics
January
F(O) 25 89.03 21 4 6 -0.264
F(C) 25 557.31 9 16 3 -4.014
International Journal of Advancements in Research & Technology, Volume 1, Issue 5, October-2012 8 ISSN 2278-7763
Copyright © 2012 SciResPub. IJOART
S(C) 43 557.15 17 26 5 -5.190
February
F(O) 24 0 0 24 1 0
F(C) 24 569.42 10 14 4 -3.511
S(C) 44 567.74 18 26 2 -6.24
March
F(O) 27 0 0 0 1 0
F(C) 27 526.75 15 12 4 -3.910
S(C) 48 524.01 28 20 4 -5.956
April
F(O) 0 0 0 0 0 0
F(C) 0 0 0 0 0 0
S(C) 48 516.92 19 29 7 -5.025
May
F(O) 0 0 0 0 0 0
F(C) 0 0 0 0 0 0
S(C) 46 525.25 24 22 2 -6.411
June
F(O) 26 0 0 26 1 0
F(C) 26 504.78 13 13 2 -4.604
S(C) 48 503.25 24 24 2 -6.565
July
F(O) 10 0 0 10 1 0
F(C) 10 490.66 5 5 6 0
S(C) 47 479.48 22 25 4 -5.898
August
F(O) 25 0 0 25 1 0
F(C) 25 490.51 11 14 6 -2.829
S(C) 45 489.09 14 31 5 -5.223
September
F(O) 20 0 0 20 1 0
F(C) 20 505.06 7 13 3 -3.350
S(C) 46 497.55 23 23 3 -6.113
October
F(O) 26 0 0 26 1 0
F(C) 26 474.04 14 12 5 -3.393
S(C) 41 468.07 22 19 5 -5.054
November
F(O) 26 0 0 26 1 0
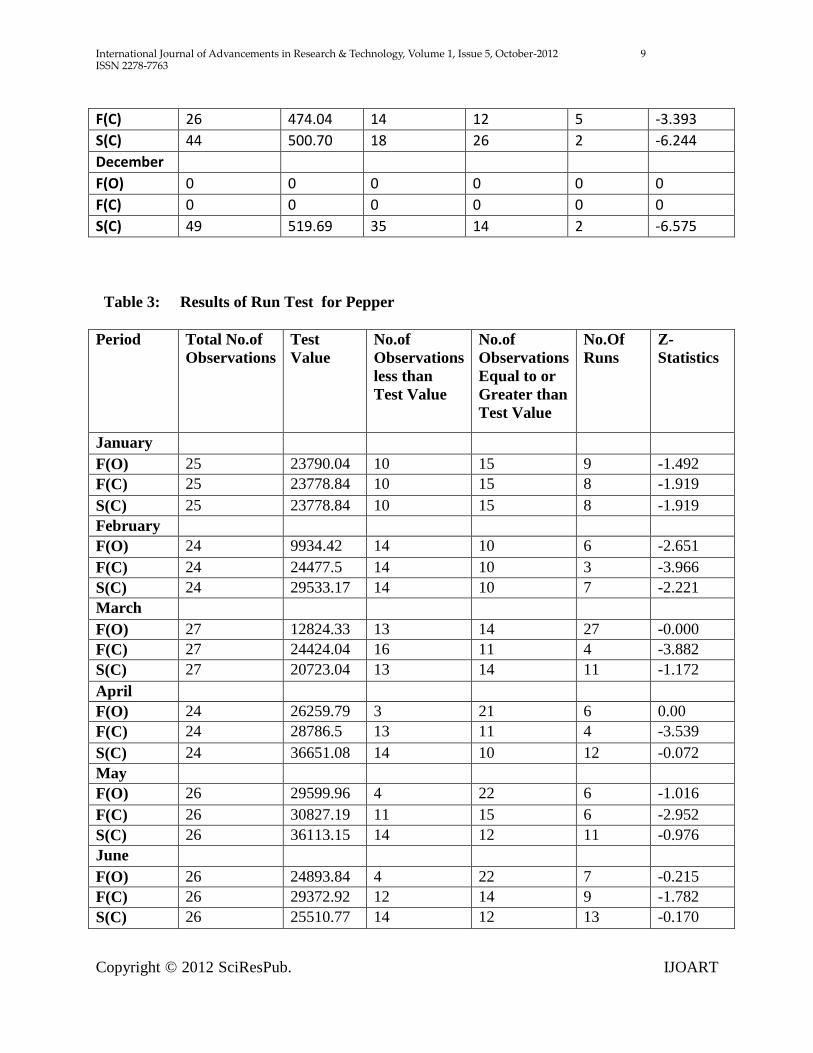
International Journal of Advancements in Research & Technology, Volume 1, Issue 5, October-2012 9 ISSN 2278-7763
Copyright © 2012 SciResPub. IJOART
F(C) 26 474.04 14 12 5 -3.393
S(C) 44 500.70 18 26 2 -6.244
December
F(O) 0 0 0 0 0 0
F(C) 0 0 0 0 0 0
S(C) 49 519.69 35 14 2 -6.575
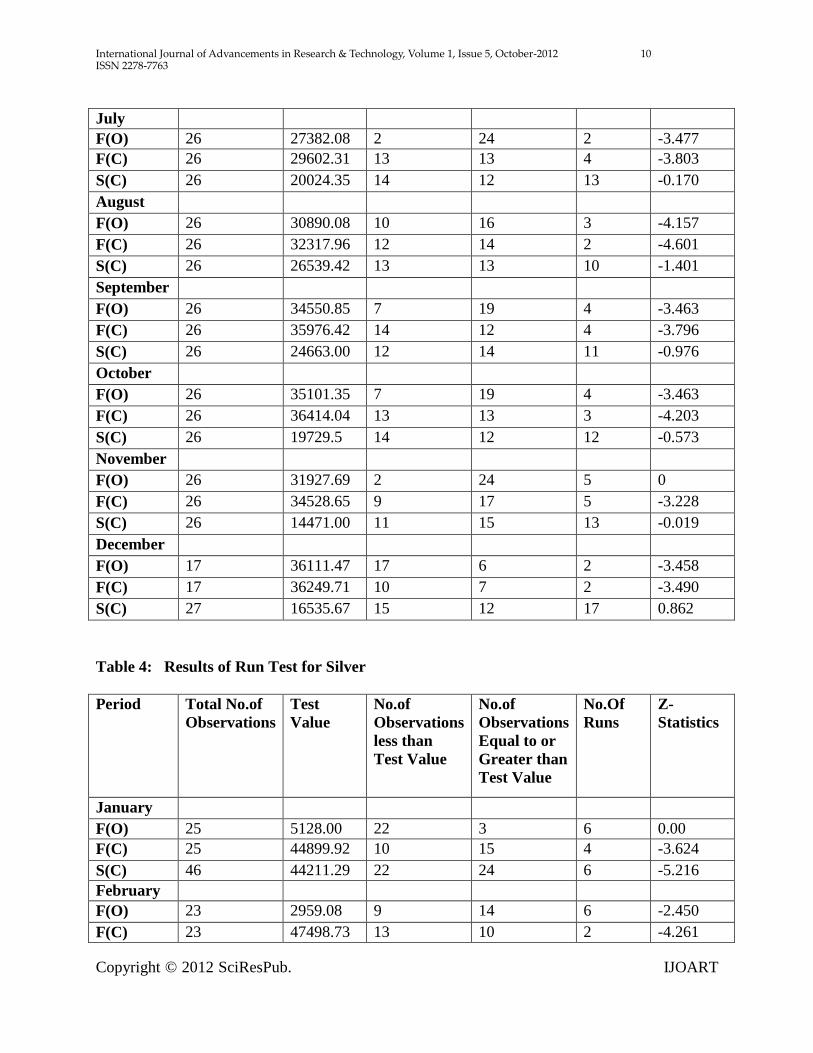
Table 3: Results of Run Test for Pepper
Period Total No.of
Observations
Test
Value
No.of
Observations
less than
Test Value
No.of
Observations
Equal to or
Greater than
Test Value
No.Of
Runs
Z-
Statistics
January
F(O) 25 23790.04 10 15 9 -1.492
F(C) 25 23778.84 10 15 8 -1.919
S(C) 25 23778.84 10 15 8 -1.919
February
F(O) 24 9934.42 14 10 6 -2.651
F(C) 24 24477.5 14 10 3 -3.966
S(C) 24 29533.17 14 10 7 -2.221
March
F(O) 27 12824.33 13 14 27 -0.000
F(C) 27 24424.04 16 11 4 -3.882
S(C) 27 20723.04 13 14 11 -1.172
April
F(O) 24 26259.79 3 21 6 0.00
F(C) 24 28786.5 13 11 4 -3.539
S(C) 24 36651.08 14 10 12 -0.072
May
F(O) 26 29599.96 4 22 6 -1.016
F(C) 26 30827.19 11 15 6 -2.952
S(C) 26 36113.15 14 12 11 -0.976
June
F(O) 26 24893.84 4 22 7 -0.215
F(C) 26 29372.92 12 14 9 -1.782
S(C) 26 25510.77 14 12 13 -0.170
International Journal of Advancements in Research & Technology, Volume 1, Issue 5, October-2012 10 ISSN 2278-7763
Copyright © 2012 SciResPub. IJOART
July
F(O) 26 27382.08 2 24 2 -3.477
F(C) 26 29602.31 13 13 4 -3.803
S(C) 26 20024.35 14 12 13 -0.170
August
F(O) 26 30890.08 10 16 3 -4.157
F(C) 26 32317.96 12 14 2 -4.601
S(C) 26 26539.42 13 13 10 -1.401
September
F(O) 26 34550.85 7 19 4 -3.463
F(C) 26 35976.42 14 12 4 -3.796
S(C) 26 24663.00 12 14 11 -0.976
October
F(O) 26 35101.35 7 19 4 -3.463
F(C) 26 36414.04 13 13 3 -4.203
S(C) 26 19729.5 14 12 12 -0.573
November
F(O) 26 31927.69 2 24 5 0
F(C) 26 34528.65 9 17 5 -3.228
S(C) 26 14471.00 11 15 13 -0.019
December
F(O) 17 36111.47 17 6 2 -3.458
F(C) 17 36249.71 10 7 2 -3.490
S(C) 27 16535.67 15 12 17 0.862
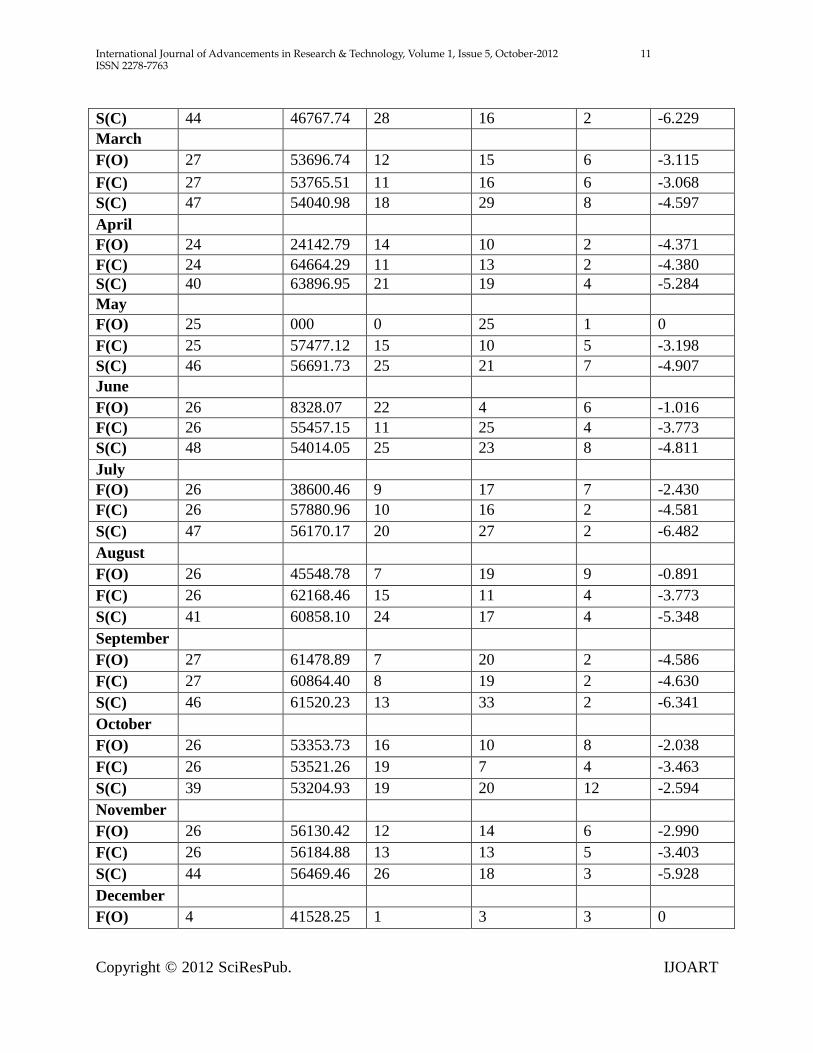
Table 4: Results of Run Test for Silver
Period Total No.of
Observations
Test
Value
No.of
Observations
less than
Test Value
No.of
Observations
Equal to or
Greater than
Test Value
No.Of
Runs
Z-
Statistics
January
F(O) 25 5128.00 22 3 6 0.00
F(C) 25 44899.92 10 15 4 -3.624
S(C) 46 44211.29 22 24 6 -5.216
February
F(O) 23 2959.08 9 14 6 -2.450
F(C) 23 47498.73 13 10 2 -4.261
International Journal of Advancements in Research & Technology, Volume 1, Issue 5, October-2012 11 ISSN 2278-7763
Copyright © 2012 SciResPub. IJOART
S(C) 44 46767.74 28 16 2 -6.229
March
F(O) 27 53696.74 12 15 6 -3.115
F(C) 27 53765.51 11 16 6 -3.068
S(C) 47 54040.98 18 29 8 -4.597
April
F(O) 24 24142.79 14 10 2 -4.371
F(C) 24 64664.29 11 13 2 -4.380
S(C) 40 63896.95 21 19 4 -5.284
May
F(O) 25 000 0 25 1 0
F(C) 25 57477.12 15 10 5 -3.198
S(C) 46 56691.73 25 21 7 -4.907
June
F(O) 26 8328.07 22 4 6 -1.016
F(C) 26 55457.15 11 25 4 -3.773
S(C) 48 54014.05 25 23 8 -4.811
July
F(O) 26 38600.46 9 17 7 -2.430
F(C) 26 57880.96 10 16 2 -4.581
S(C) 47 56170.17 20 27 2 -6.482
August
F(O) 26 45548.78 7 19 9 -0.891
F(C) 26 62168.46 15 11 4 -3.773
S(C) 41 60858.10 24 17 4 -5.348
September
F(O) 27 61478.89 7 20 2 -4.586
F(C) 27 60864.40 8 19 2 -4.630
S(C) 46 61520.23 13 33 2 -6.341
October
F(O) 26 53353.73 16 10 8 -2.038
F(C) 26 53521.26 19 7 4 -3.463
S(C) 39 53204.93 19 20 12 -2.594
November
F(O) 26 56130.42 12 14 6 -2.990
F(C) 26 56184.88 13 13 5 -3.403
S(C) 44 56469.46 26 18 3 -5.928
December
F(O) 4 41528.25 1 3 3 0
International Journal of Advancements in Research & Technology, Volume 1, Issue 5, October-2012 12 ISSN 2278-7763
Copyright © 2012 SciResPub. IJOART
F(C) 4 55156.25 2 2 2 -0.612
S(C) 46 53787.05 26 20 2 -6.406
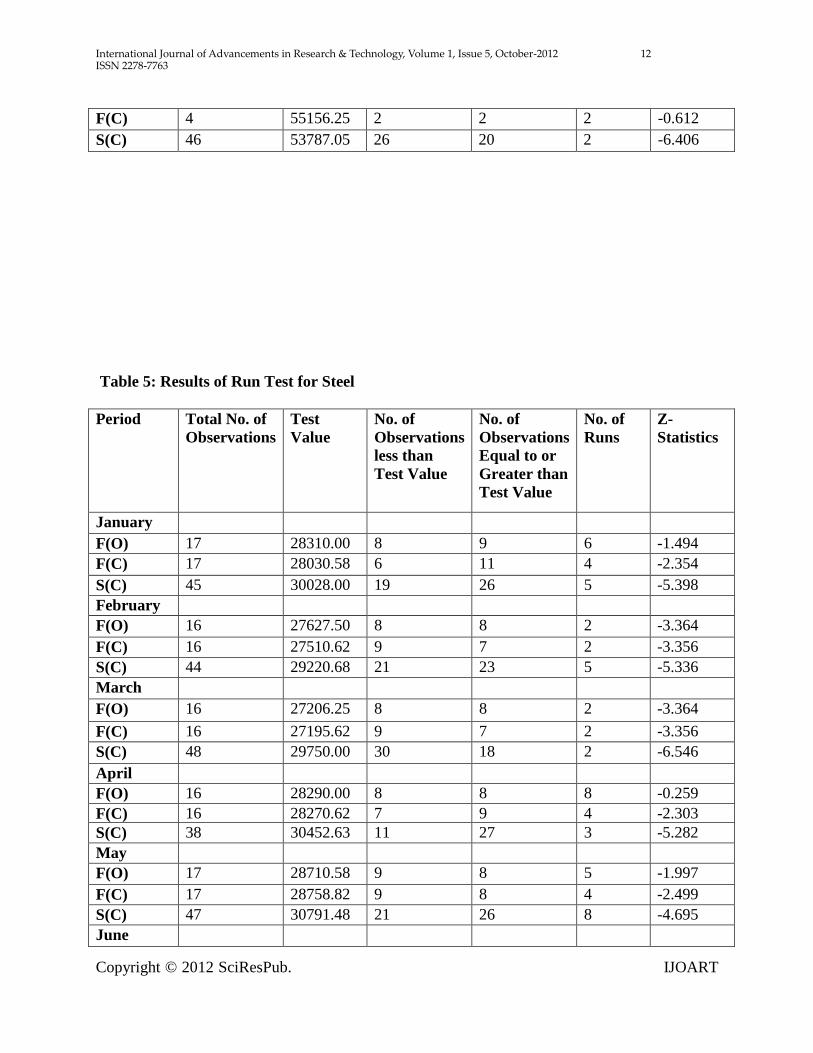
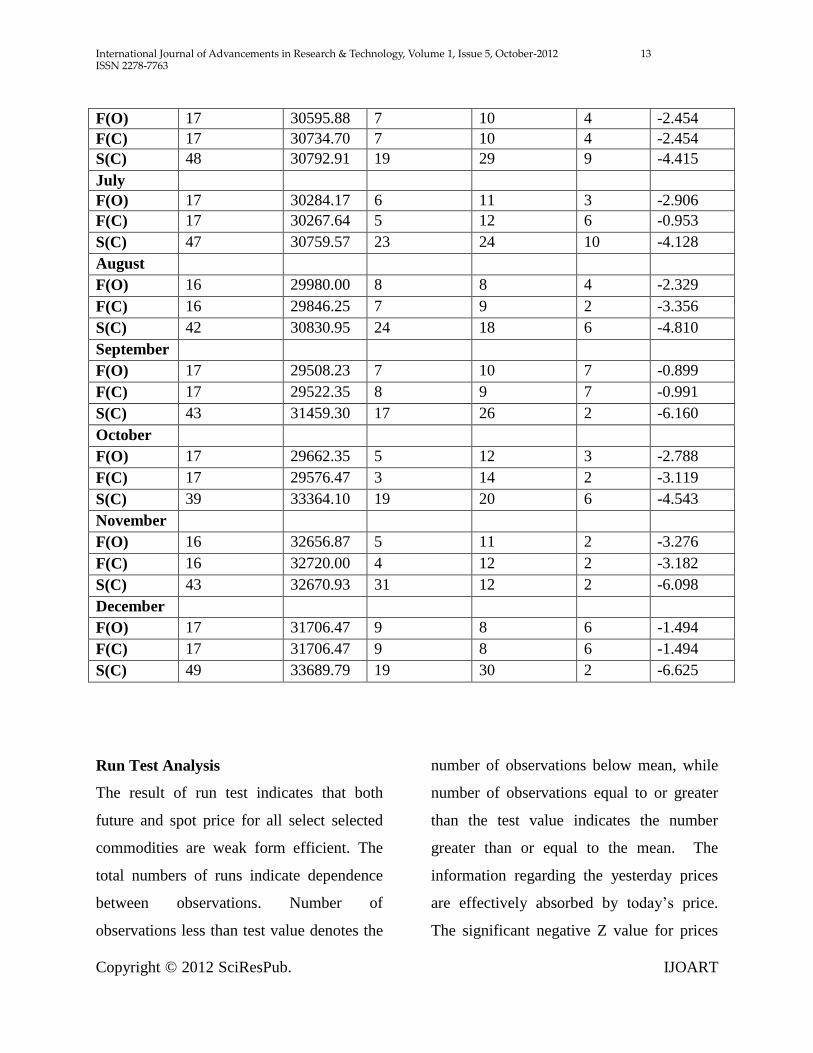
Table 5: Results of Run Test for Steel
Period Total No. of
Observations
Test
Value
No. of
Observations
less than
Test Value
No. of
Observations
Equal to or
Greater than
Test Value
No. of
Runs
Z-
Statistics
January
F(O) 17 28310.00 8 9 6 -1.494
F(C) 17 28030.58 6 11 4 -2.354
S(C) 45 30028.00 19 26 5 -5.398
February
F(O) 16 27627.50 8 8 2 -3.364
F(C) 16 27510.62 9 7 2 -3.356
S(C) 44 29220.68 21 23 5 -5.336
March
F(O) 16 27206.25 8 8 2 -3.364
F(C) 16 27195.62 9 7 2 -3.356
S(C) 48 29750.00 30 18 2 -6.546
April
F(O) 16 28290.00 8 8 8 -0.259
F(C) 16 28270.62 7 9 4 -2.303
S(C) 38 30452.63 11 27 3 -5.282
May
F(O) 17 28710.58 9 8 5 -1.997
F(C) 17 28758.82 9 8 4 -2.499
S(C) 47 30791.48 21 26 8 -4.695
June
International Journal of Advancements in Research & Technology, Volume 1, Issue 5, October-2012 13 ISSN 2278-7763
Copyright © 2012 SciResPub. IJOART
F(O) 17 30595.88 7 10 4 -2.454
F(C) 17 30734.70 7 10 4 -2.454
S(C) 48 30792.91 19 29 9 -4.415
July
F(O) 17 30284.17 6 11 3 -2.906
F(C) 17 30267.64 5 12 6 -0.953
S(C) 47 30759.57 23 24 10 -4.128
August
F(O) 16 29980.00 8 8 4 -2.329
F(C) 16 29846.25 7 9 2 -3.356
S(C) 42 30830.95 24 18 6 -4.810
September
F(O) 17 29508.23 7 10 7 -0.899
F(C) 17 29522.35 8 9 7 -0.991
S(C) 43 31459.30 17 26 2 -6.160
October
F(O) 17 29662.35 5 12 3 -2.788
F(C) 17 29576.47 3 14 2 -3.119
S(C) 39 33364.10 19 20 6 -4.543
November
F(O) 16 32656.87 5 11 2 -3.276
F(C) 16 32720.00 4 12 2 -3.182
S(C) 43 32670.93 31 12 2 -6.098
December
F(O) 17 31706.47 9 8 6 -1.494
F(C) 17 31706.47 9 8 6 -1.494
S(C) 49 33689.79 19 30 2 -6.625
Run Test Analysis
The result of run test indicates that both
future and spot price for all select selected
commodities are weak form efficient. The
total numbers of runs indicate dependence
between observations. Number of
observations less than test value denotes the
number of observations below mean, while
number of observations equal to or greater
than the test value indicates the number
greater than or equal to the mean. The
information regarding the yesterday prices
are effectively absorbed by today’s price.
The significant negative Z value for prices
International Journal of Advancements in Research & Technology, Volume 1, Issue 5, October-2012 14 ISSN 2278-7763
Copyright © 2012 SciResPub. IJOART
indicate that the actual number of runs fall
short of the expected number of runs.
6.Conclusions
Theoretical basis of the weak-form efficient
hypothesis states that the successive prices
are independent and past prices have no
predictive content to forecast commodity
price. The non parametric run test for the
full sample period indicated that both future
and spot price for all selected commodities
are efficient in weak form.
Bibliography
I. Books
Commodity and Financial Derivatives –
S.Kevin
Finanmcial Management – Prasanna
Chandra
Statistics For Management –Chand
II. Articles
“Market Efficiency in agricultural future
markets” By Andrew M.Mckenzie and
Mathew .F.Hold (2002).
“Efficiency Test of agricultural
commodity futures markets in China”By
Wang Hong and Bingfanke (2005).
“Efficiency and Future Trading- Price
Nexus in Indian Commodity Future
Market” By PravakarSahoo(2009).
III. Website
www.googlefinance.com
www.ncdex.com
www.wikipedia.com
www.ssrn.com