A STUDY ON CUSTOMER PREFERENCE TOWARDS LENSKART … · a study on customer preference towards...
27
IJIRMPS | Volume 6, Issue 4, 2018 ISSN: 2349-7300 IJIRMPS1807093 Website : www.ijirmps.org Email : [email protected] 582 A STUDY ON CUSTOMER PREFERENCE TOWARDS LENSKART ONLINE SHOPPING K.V.SHANMUGAVADIVU ASSISTANT PROFESSOR KONGU ARTS AND SCIENCE COLLEGE (AUTONOMOUS) ERODE CHAPTER – I INTRODUCTION AND DESIGN OF THE STUDY 1.1 INTRODUCTION ABOUT THE STUDY SHOPPING A retailer or shop keeper is a business that presents a selection of goods or services and offers to sell them to customers for money or other goods. Shopping is an activity in which a customer browses the available goods or services presented by one or more retailers with the intent to purchase a suitable selection of them. TYPES OF SHOPPING People purchase things what they need. The various types of shopping available for customers are: Shopping Hubs Shopping hubs, or shopping centers, are collections of stores; that is a grouping of several businesses. Typical examples include shopping malls, town squares, flea markets and bazaars. Stores: Stores are divided into multiple categories of stores which sell a selected set of goods or services. Example: Big-box stores, hypermarkets, convenience stores, department stores, general stores, dollar stores etc. Home Shopping Home mail delivery systems and modern technology (such as television, telephones, and the internet), in combination with electronic commerce systems, allow consumers to shop from home. There are three main types of home shopping: mail or telephone ordering from catalogs; telephone ordering in response to advertisements in print and electronic media (such as periodicals, TV and radio); and online shopping. Online shopping has completely redefined the way people make their buying decisions; the internet provides access to a lot of information about a particular product, which can be looked at, evaluated, and comparison-priced at any given time. Online shopping allows the buyer to save the time and expense, which would have been spent traveling to the store or mall. Neighborhood Shopping Generally a straight-line strip center with a grocery store anchor, sometimes a drugstore, and other small retailers. It caters to shoppers in the immediate neighborhood for convenience items, such as landuary, video rental, mail and package stores, and gift items. Corner stores and ice- cream trucks are offering goods and services. Party Shopping The party shopping is a method of marketing products by hosting a social event, using the event to display and demonstrate the product or products to those gathered, and then to take orders for the products before the gathering ends. Online Shopping Online shopping or e-shopping is a form of electronic commerce allowing consumers to directly buy goods or services from a seller over the internet using a web browser. Alternative names are: e-web-store, e-shop, e-store, internet shop, web-shop, web-store, online store, online storefront and virtual store. Mobile commerce (or m-commerce) describes purchasing from an online retailer's mobile optimized online site or app. An online shop evokes the physical analogy of buying products or services at a bricks-and-mortar retailer or shopping center; the process is called business-to-consumer (b2c) online shopping. In the case where a business buys from another
Transcript of A STUDY ON CUSTOMER PREFERENCE TOWARDS LENSKART … · a study on customer preference towards...
IJIRMPS | Volume 6, Issue 4, 2018 ISSN: 2349-7300
IJIRMPS1807093 Website : www.ijirmps.org Email : [email protected] 582
A STUDY ON CUSTOMER PREFERENCE TOWARDS
LENSKART ONLINE SHOPPING
K.V.SHANMUGAVADIVU
ASSISTANT PROFESSOR
KONGU ARTS AND SCIENCE COLLEGE (AUTONOMOUS) ERODE
CHAPTER – I
INTRODUCTION AND DESIGN OF THE STUDY
1.1 INTRODUCTION ABOUT THE STUDY
SHOPPING
A retailer or shop keeper is a business that presents a selection of goods or services and offers to sell them to customers
for money or other goods. Shopping is an activity in which a customer browses the available goods or services presented by one
or more retailers with the intent to purchase a suitable selection of them.
TYPES OF SHOPPING
People purchase things what they need.
The various types of shopping available for customers are:
Shopping Hubs
Shopping hubs, or shopping centers, are collections of stores; that is a grouping of several businesses. Typical examples
include shopping malls, town squares, flea markets and bazaars.
Stores: Stores are divided into multiple categories of stores which sell a selected set of goods or services.
Example: Big-box stores, hypermarkets, convenience stores, department stores, general stores, dollar stores etc.
Home Shopping
Home mail delivery systems and modern technology (such as television, telephones, and the internet), in combination
with electronic commerce systems, allow consumers to shop from home. There are three main types of home shopping: mail or
telephone ordering from catalogs; telephone ordering in response to advertisements in print and electronic media (such as
periodicals, TV and radio); and online shopping. Online shopping has completely redefined the way people make their buying
decisions; the internet provides access to a lot of information about a particular product, which can be looked at, evaluated, and
comparison-priced at any given time. Online shopping allows the buyer to save the time and expense, which would have been
spent traveling to the store or mall.
Neighborhood Shopping
Generally a straight-line strip center with a grocery store anchor, sometimes a drugstore, and other small retailers. It
caters to shoppers in the immediate neighborhood for convenience items, such as landuary, video rental, mail and package stores,
and gift items. Corner stores and ice- cream trucks are offering goods and services.
Party Shopping
The party shopping is a method of marketing products by hosting a social event, using the event to display and
demonstrate the product or products to those gathered, and then to take orders for the products before the gathering ends.
Online Shopping
Online shopping or e-shopping is a form of electronic commerce allowing consumers to directly buy goods or services
from a seller over the internet using a web browser. Alternative names are: e-web-store, e-shop, e-store, internet shop, web-shop,
web-store, online store, online storefront and virtual store. Mobile commerce (or m-commerce) describes purchasing from an
online retailer's mobile optimized online site or app.
An online shop evokes the physical analogy of buying products or services at a bricks-and-mortar retailer or shopping
center; the process is called business-to-consumer (b2c) online shopping. In the case where a business buys from another
IJIRMPS | Volume 6, Issue 4, 2018 ISSN: 2349-7300
IJIRMPS1807093 Website : www.ijirmps.org Email : [email protected] 583
business, the process is called business-to-business (b2b) online shopping. The largest of these online retailing corporations are
alibaba, amazon.com, and eBay. Retail success is no longer all about physical stores. This is evident because of the increase in
retailers now offering online store interfaces for consumers. With the growth of online shopping, comes a wealth of new market
footprint coverage opportunities for stores that can appropriately cater to offshore market demands and service requirements.
History
English entrepreneur Michael Aldrich invented online shopping in 1979. His system connected a modified domestic tv to
a real-time transaction processing computer via a domestic telephone line. He believed that Videotex, the modified domestic TV
technology with a simple menu-driven human–computer interface, was a 'new, universally applicable, participative
communication medium — the first since the invention of the telephone.' this enabled 'closed' corporate information systems to be
opened to 'outside' correspondents not just for transaction processing but also for e-messaging and information retrieval and
dissemination, later known as e-business. His definition of the new mass communications medium as 'participative' [interactive,
many-to-many] was fundamentally different from the traditional definitions of mass communication and mass media and a
precursor to the social networking on the internet 25 years later.
In March 1980 he went on to launch Redifon's office revolution, which allowed consumers, customers, agents,
distributors, suppliers and service companies to be connected on-line to the corporate systems and allow business transactions to
be completed electronically in real-time.
During the 1980s he designed, manufactured, sold, installed, maintained and supported many online shopping systems,
using Videotex technology. These systems which also provided voice response and handprint processing pre-date the internet and
the World Wide Web, the IBM pc, and Microsoft MS-DOS, and were installed mainly in the UK by large corporations.
The first worldwide web server and browser, created by TIM BERNERS-lee in 1990, opened for commercial use in
1991. Thereafter, subsequent technological innovations emerged in 1994: online banking, the opening of an online pizza shop by
pizza hut, Netscape’s ssl v2 encryption standard for secure data transfer, and inters hop’s first online shopping system.
Immediately after, amazon.com launched its online shopping site in 1995 and eBay was also introduced in 1995.
Role of Online Shopping
Online shopping plays a big role in the world where it helps the people to buy the products through internet without any
intermediaries. It helps the customers to save time, travel, cost, energy, etc. One can buy products online with different payment
options like COD, Credit/Debit Card, Net Banking, etc.
The retailers/online store keepers provide various facilities to customers who buy products through online shopping. This
has led to a considerable increase in the number of people who prefer online purchase. To stay competitive the sellers of provision
give multiple discounts like free gift coupons, free delivery and seasonal offers.
Advantages
Online stores are usually available 24 hours a day, and many consumers have internet access both at work and at home.
Other establishments such as internet cafes and schools provide internet access as well. In contrast, visiting a
conventional retail store requires travel and must take place during business hours.
Online stores will display the product with texts, photos, price, etc.
Companies can react quickly to the consumers needs or concerns.
Some things are actually cheaper online than they are in the physical store.
Some online companies like zappos.com provide refuned or exchange facility to consumers.
Disadvantages
Consumers are in good need to provide their personal information like contact details for their shipping.
Merchants also risk fraudulent using stolen credit cards or fraudulent repudiation of the online purchase.
phishing is another danger, where consumers are fooled into thinking they are dealing with a reputable retailer, when
they have actually been manipulated into feeding private information to a system operated by a malicious party.
Computer security has thus become a major concern for merchants and e-commerce service providers, who deploy
countermeasures such as firewalls and anti-virus software to protect their networks.
Sometimes it may take much longer time for the delivery of the products and sometimes consumers receive the item
which is not ordered by them.
1.2 OBJECTIVES OF THE STUDY
To study the social economic characteristics of the respondents.
IJIRMPS | Volume 6, Issue 4, 2018 ISSN: 2349-7300
IJIRMPS1807093 Website : www.ijirmps.org Email : [email protected] 584
To identify the factors that influences the respondents to purchase the product through lenskart online shopping.
To analyse the level of satisfaction towards lenskart online shopping.
To find out the problems faced by the respondents towards lenskart online shopping.
1.3 SCOPE OF THE STUDY
This study highlights the preference of the customers towards the online shopping
This study helps to determine the problems or issues faced by the customers who do online shopping.
It helps to find out the popular online sites which are preferred by the customers.
1.4 LIMITATION OF THE STUDY
1. A sample size of 200 respondents was chosen due to the time constraint for the study.
2. The area of the study is restricted to Erode District only. So the results may not be generalized to other places.
3. The accuracy of the figures and data depends on the respondents view.
1.5 RESEARCH METHODOLOGY
Research methodology is a way to systematically solve the research problem. The research methodology includes the
various methods and techniques for conducting a research.
Defining the Research Problem and Objectives: It is said that, “A problem well defined is “Half solved”. The first step in
research methodology is to define the problem and deciding the research objective. The objective of my study is to know the
consumer buying behavior of personal care products of Himalaya.
RESEARCH DESIGN
Research Design is a blueprint or framework for conducting marketing research project. It specifies the details of the
procedures necessary for obtaining the information needed to structure and solve marketing research problem. The research
design used in this study is descriptive research.
Descriptive Research
The descriptive research is also known as statistical research, describes data and characteristics about the population or
phenomenon being studied. The description is used for frequencies, averages, and other statistical calculations. The research deals
with everything that can be counted and studied. But there are always restrictions to that. The research must have an impact to the
lives of the people around the researcher.
SAMPLING DESIGN
Sampling can be defined as the section of some part of an aggregate or totality on the basis of which judgment or an
inference about aggregate or totality is made. The steps involved in sampling design are as follows:
UNIVERSE
Theoretical universe: Consumers of personal care products of Himalaya all over the world.
Accessible universe: Consumers of personal care products of Himalaya in India.
SAMPLING FRAME The sources of information are retailers, friends and relatives. The sampling frame includes the following which are as
follows:
SAMPLING UNIT Sampling unit of this study was individuals who are using the lenskart.
SAMPLING SIZE Sampling size is the total number of units which covered in our study. The sample size of this study is 200.
SAMPLING TECHNIQUE Sampling Technique used in this study is Non-Probability Convenience Sampling. It is that type of sampling where the
researcher selects the sample according to his or her convenience.
DATA COLLECTION
The data can be collected in two ways and they are as follows:
A) PRIMARY DATA
IJIRMPS | Volume 6, Issue 4, 2018 ISSN: 2349-7300
IJIRMPS1807093 Website : www.ijirmps.org Email : [email protected] 585
Primary data are those, which are collected a fresh and for the first time and thus happen to be original in character. It is
the backbone of any study. Primary data was obtained from personal interview of respondents with the help of widely used and
well-known method of survey, through a well-structured questionnaire.
B) SECONDARY DATA
Secondary data are those which have already been collected by someone else and which have already been passed
through the statistical process. In this case one is not confronted with the problems that are usually associated with the collection
of original data. Secondary data either is published data or unpublished data. Secondary data was collect from the internet only.
RESEARCH INSTRUMENT
Research instrument is that with the help of which we collect the data from respondents. Here in this survey, the
questionnaire has been used which consists of multiple choices, close ended and open ended questions.
TOOLS USED IN THE STUDY
The data gathered through questionnaire for the study were consolidated in relevant table and classified under relevant
headings. Those data were analyzed with the help of statistical techniques such as:
Percentage analysis
Chi-square Analysis
Weighted Average Ranking Method
PERCENTAGE ANALYSIS
Percentage analysis is the method to represent raw streams of data as a percentage (a part in 100 – percent) for better
understanding of collected data. This method is used to make comparison between two or more series of data.
Percentage Analysis = No. of. Respondents
-------------------------------- * 100
Total No. of. Respondents
CHI-SQUARE ANALYSIS
The chi square test is an important test amongst the several tests of significance developed by static’s. It can also be used
to make comparisons between theoretical populations and actual data when categories are used.
2 =
E
EO 2)(
Whereas,
O - Observed Frequencies
E - Expected frequencies
WEIGHTED AVERAGE RANKING METHOD
Weighted average ranking method is used to find out the most significant factor which influences the respondent. As
per this method, respondents have been asked to assign the rank for all factors and the outcome of such ranking have been
converted into score value with the help of the following formula,
x1w1 + x2w2 +x3w3…………..xnwn
---------------------------------------------
Total no. Of respondents
Where,
X = Response count for answer choice.
W = Weight of ranked position.
Weights are applied in reverse. In other words, the respondent’s most preferred choice has the largest weight and their
least preferred choice has the smallest weight. We apply weights in this way to ensure that which answer choice is most
preferred. The factors having highest mean value is considered to be the most important factor.
CHAPTER –II
REVIEW OF LITERATURE
POONAM PAINULY and SHALU RATHI (2016)1 in their research paper “Mobile wallet :An upcoming mode of
business transaction “have analysed that ease of transaction ,secured profile and convenience in handling application put forth the
IJIRMPS | Volume 6, Issue 4, 2018 ISSN: 2349-7300
IJIRMPS1807093 Website : www.ijirmps.org Email : [email protected] 586
benefits of wallet money and also concluded that business sectors like banking ,retail, hospitality etc., are making use of wallet
money and mobile payment instruments including contactless and remote payment in the customers –business and customers to
customers areas.
NGOC DOAN(2014)2 in their research paper “Digital wallet: Requirement and challenges “have identified about
Singapore’s use of digital wallet and analysed the key challenges in building and deploying a digital wallet.
Dr.HEM SHWETA RATHORE3 in her research paper “Adoption of Digital wallet by consumers “have analysed about
the factors that influence consumers in adoption of digital wallet and also analysed the risk and challenges faced by consumers in
usage of digital wallet and concluded that shoppers are adopting digital wallet largely due to convenience and ease to use and in
the future years digital wallet will gain more widespread acceptance.
Barker (1992)4 in his study, Globalization of credit card usage: The case of a developing economy” measured the attitude
of Turkish consumers towards credit cards, and the approach of card issuers by surveying two samples of 200 card holders and
non-holders. The respondents were categorized into better educated, middle aged members of the upper middle class. The most
significant reasons for using a credit card were “case of payment”, followed by “risk of carrying cash”.
Mathur and George (1994)5, “Use of credit-cards by older American” shows the usage behavior pattern of older people
with credit card spending. Using a large national sample of respondents from different age groups, finds that older adults use
credit cards as frequently as younger adults when circumstances for consumption inboth groups are similar. Contrary to it, the
commonly held belief that older people do not use credit cards, the data suggests the need for practitioners to stop thinking about
consumer targets in terms of age and focus more on circumstances that determine one’s likelihood to use credit cards.
Kaynak (1995)6, “Correlates of credit card acceptance and usage in an advanced developing Middle Eastern Country.”
Study shows that with the surge of technological developments, innovation and increase in the level of socio-economic progress
the acceptance of credit cards and usage has increased like anything.
CHAPTER - III
LENSKART ONLINE SHOPPING – A THEORETICAL OVERVIEW
INTRODUCTION
Shopping on the Internet or shopping on-line is becoming more and more popular. More and more people are using the
internet to buy things. People use the internet to0s hop because it is more convenient. They don’t have to leave their home to
order something, and they can shop for anything they want at any time, day or night. Sometimes they can find things online that
cannot be found in the stores near their homes.
INTERNET The Internet is a global network connecting millions of computers. More than 100 countries are linked into exchanges
of data, news and opinions. According to Internet World Stats, as of December 31, 2011 there was an estimated 2,267,233,742
Internet users worldwide. The number of Internet users represents 32.7 percent of the world's population.
Unlike online services, which are centrally controlled, the Internet is decentralized by design. Each Internet computer,
called a host, is independent. Its operators can choose which Internet services to use and which local services to make available to
the global Internet community. Remarkably, this anarchy by design works exceedingly well. There are a variety of ways to
access the Internet. Most online services offer access to some Internet services. It is also possible to gain access through a
commercial Internet Service Provider (ISP).
HISTORY OF THE INTERNET
The history of the Internet begins with the development of electronic computers in the 1950s. Initial concepts of packet
networking originated in several computer science laboratories in the United States, Great Britain, and France. The US
Department of Defense awarded contracts as early as the 1960s for packet network systems, including the development of
the ARPANET (which would become the first network to use the Internet Protocol.) The first message was sent over the
ARPANET from computer science Professor Leonard Kleinrock's laboratory at University of California, Los Angeles (UCLA) to
the second network node at Stanford Research Institute (SRI).
Packet switching networks such as ARPANET, Mark I at NPL in the UK, CYCLADES, Merit Network, Tymnet, and
Telenet, were developed in the late 1960s and early 1970s using a variety of communications protocols. The ARPANET in
particular led to the development of protocols for internetworking, in which multiple separate networks could be joined into a
network of networks.
INTERNET AND ONLINE SHOPPING
The internet is a global network of networks, allowing computers around the world to communicate with each other.
This network has been in existence the late 1960s. In the early 1990s a new language for accessing information on this network
was created Hypertext markup Language (HTML). This allowed the creation of web pages.
A crucial feature of these pages is the ability to move from one to another very simply, by clicking on a hyperlink. This
allows for easy navigation between web pages, which are linked together to collectively make up the World Wide Web.
IJIRMPS | Volume 6, Issue 4, 2018 ISSN: 2349-7300
IJIRMPS1807093 Website : www.ijirmps.org Email : [email protected] 587
The ease of access which this enabled facilitated the rapid expansion of the internet, and its development from a military
and research tool into a form of mass communication and commerce. It is hard to accurately measure the true scale of web but
one estimate in February 2007 suggested that it comprised nearly 30 billion pages, on 109 million distinct websites.
ONLINE SHOPPING IN INDIA
Online shopping has become an important part of our lives. Today everyone relies on internet for everything. There are
virtual stores that allow people to shop comfortable even without stepping out of the house and keeps one way from expenses of
traveling and dealing with salesman. Knowing some amazing facts about online shopping can help people to save money.
The process to buying goods online through the medium of internet rather than going to a brick mortar store, omitting the
in-between sales men and long queues is called online shopping. The people can by almost everything from these stores, starting
from lifestyle, Fragrances, Jewelry, Books, Electric equipments and latest technology devices.
WORKING METHODS OF ONLINE SHOPPING WEBSITES For those who are new to online shopping can get the required knowledge in internet. Online shopping sites in India
are made from a user point of view. The first and basic step is to register you to online shopping website, so that one can login in
website when he/she wants to buy things.
The online shops act as a store front where the business owner presents his products and services giving the users a
chance to pick and buy. One can go through the list of catalogue and huge search the product they need.
STEPS INVOLVED IN ONLINE SHOPPING
Consumers find a product of interest by visiting the website of the retailer directly or by searching among alternative
vendors using a shopping search engine. Once a particular product has been found on the website of the seller, most online
retailers use shopping cart software to allow the consumer to accumulate multiple items and to adjust quantities, like filling a
physical shopping cart or basket in a conventional store. A "checkout" process follows (continuing the physical-store analogy) in
which payment and delivery information is collected, if necessary. Some stores allow consumers to sign up for a permanent
online account so that some or all of this information only needs to be entered once. The consumer often receives an e-mail
confirmation once the transaction is complete.Less sophisticated stores may rely on consumers to phone or e-mail their orders
(although full credit card numbers, expiry date, and Card Security Code, or bank account and routing number should not be
accepted by e-mail, for reasons of security).
PAYMENT FOR ONLINE SHOPPING
Online shoppers commonly use a credit card or a PayPal account in order to make payments. However, some systems enable
users to create accounts and pay by alternative means, such as:
Billing to mobile phones and landlines
Cash on delivery (C.O.D.)
Cheque/ Check
Debit card
Direct debit in some countries
Gift cards
Postal money order
Wire transfer/delivery on payment
Some online shops will not accept international credit cards. Some require both the purchaser's billing and shipping address to be
in the same country as the online shop's base of operation. Other online shops allow customers from any country to send gifts
anywhere.
SCOPE OF ONLINE SHOPPING
Online shopping has proved that shopping helps people to relieve their stress. People can easily choose their favorite
shopping store through which they can enjoy the best of shopping while sitting at home. People have the convenience of
purchasing anything while sitting in any part of the world. Online shopping helps to purchase and sell products and services over
the internet without the need of going physically to the market.
Online shopping has made shopping painless and added more fun. Online stores offer product description, pictures,
comparisons, price and much more. The online stores can offer products, to fulfill the needs of consumer cookies and be used for
tracking the customer selection over the internet. Online shopping makes use of digital technology for managing the flow of
information, products and payment between consumer, site owners and suppliers.
Online shopping grows in popularity. Cloths, Mobile and Tablets, Home Décor, kitchen, footwear, jewellery and
watches, camera and photography, consumer electronics, computer and IT, home appliances, beauty and cosmetics, bags Wallets,
sports, healthcare and automobile products offered in online shopping. In India currently many online shopping sites like
IJIRMPS | Volume 6, Issue 4, 2018 ISSN: 2349-7300
IJIRMPS1807093 Website : www.ijirmps.org Email : [email protected] 588
Shopclues, EBay, Tradus, Jabong offers splendid deals every day. Online shopping is raising phenomenon in India. In past few
years, so many online shopping portals have come up with very good product range. Competition between these stores is
increasing day by day, and good purchase can be made through competitive business.
PROFILE OF THE COMPANY
Lenskart Solutions Private Limited owns and operates an online shopping portal for men and women eyewear in India.
It provides goggles, contact lenses, and sunglasses, as well as frames and sunglasses for kids. The company also owns and operates
eyewear retail stores in India; and provides home eye check-up services in Mumbai, Bangalore, Chennai, Hyderabad, Kolkata,
Pune, Delhi, Gurgaon, Noida, Faridabad, and Ghaziabad. Lenskart Solutions Private Limited was formerly known as Valyoo
Technologies Private Limited and changed its name to Lenskart Solutions Private Limited in May 2015. The company was
incorporated in 2008 and is based in New Delhi, India with retail stores in Delhi, Agartala, Nagpur, Ahmadabad, Mangalore,
Kolhapur, Visakhapatnam, Hyderabad, Bengaluru, Sangli, Mumbai, Pune, Bhubaneshawar, Siliguri, Haridwar, Lucknow,
Faridabad, Meerut, Erode, Ludhiana, Jamshedpur, Kolkata, Varanasi, Trivandrum, Kochi, Chennai, Tirupati, Raipur, Surat,
Ranchi, Cuttack, Kannur, Dhanabad, Indore, and Madurai, India; and Goa. Founded in 2010, By an ex-Microsoft 'techie' with no
money but truckloads of relentless passion to make a difference in this world, Lenskart is India's fastest growing eyewear business
today.
With a rapidly growing business reaching out to over 1,00,000 customers a month via a unique combination of a strong
online business as www.lenskart.com, uniquely designed physical stores, as well as a first of its kind 'home eye check up' service,
Lenskart is revolutionizing the eyewear industry in india.
Cause: 1/3rd of our population needs glasses but doesn't have access to them, making us the blind capital of the world
with over 15 million blind people.
With the cause in mind, Peyush along with his two co-founders Amit Chaudhary and Sumeet Kapahi founded
'VALYOO technologies'.
The aim was in truly add 'valyoo' in customers' lives by eliminating the retailers, setting up our own high quality
manufacturing and supply directly to the consumer everywhere in India. This not only cuts costs,but also helps us maintain high
quality standards. Our in house robotic lens manufacturing and assembling ensures 100% precision and top quality control.
Offering the best quality products at affordable prices helped us grow more than 200% in the last 2 years and we are
among the top 3 optical businesses in India today. From servicing 30 customers per day to more than 3000 today, we have came a
long way. Our commitment to consumer satisfaction and innovative technologies has given us tremendous support from those who
believe in our cause.
GREAT QUALITY
Made by robots
We are India's first and the only brand to use robotic technique that delivers glasses which are accurate to 3 decimal
places. These machines imported from Germany, ensure perfection on all front: an automated system that allows to inspect lenses,
determine the geometric center, and load the lenses for edging without the need of a finishing block.
Mind of machine
Our people have zero tolerance to error and our call center aims to delight every customer, solve their problems and
work on their feedbacks.
VARIETY
We let the numbers talk. We have over 5000 styles of eyewear, which is 5 times more than that any retailer in India.
From big brands like RayBan and Oakley to the best in house brands.
An eye for an eye from sunglasses to reading glasses to contact lenses, we make everything that can help you see
this beautiful world with more clarity. We got the whole world yes it is true make eyewear for men, women, kids, for all humans of
the world.
All covered we have it all. Everyday basics. Everyday fashion. Evening wear. Not just that, we update our styles
every year to keep up with fashion trends around the globe, taking inspiration from fashion capitals and the best designers of the
world.
VALUE FOR MONEY
Not all good things in the world are expensive our prices are lower than any of your local optician. Our customers
can find the most attractive packages on contact lenses
No middle man.No extra cost.No middleman simply means no middle ground. Our products come straight from the
manufacturer, hence getting rid of all extra costs and burden.
One for everyone we have a wide variety of prices to suit all th customers. Prices range from Rs.345 to Rs. 30,000.
never forget that the first frame you buy is absolutely free.
Your friendly neighborhood Lenskart we bring to you the Lenskart experience alive via brick and marter stores.
With over 80 retail stores across the country, we have just started this journey.
TRUST
14 day refund all our product, including prescription lenses come with a 'no question ask' 14 days return policy.
IJIRMPS | Volume 6, Issue 4, 2018 ISSN: 2349-7300
IJIRMPS1807093 Website : www.ijirmps.org Email : [email protected] 589
1 year warranty all Lenskart product come with 1 year warranty. Authenticity card.With every frame or contact lenses,
we provide authenticity card as a proof of quality and authenticity.
CHAPTER- IV
DATA ANALYSIS AND INTERPRETATION
TABLE NO- 4.1
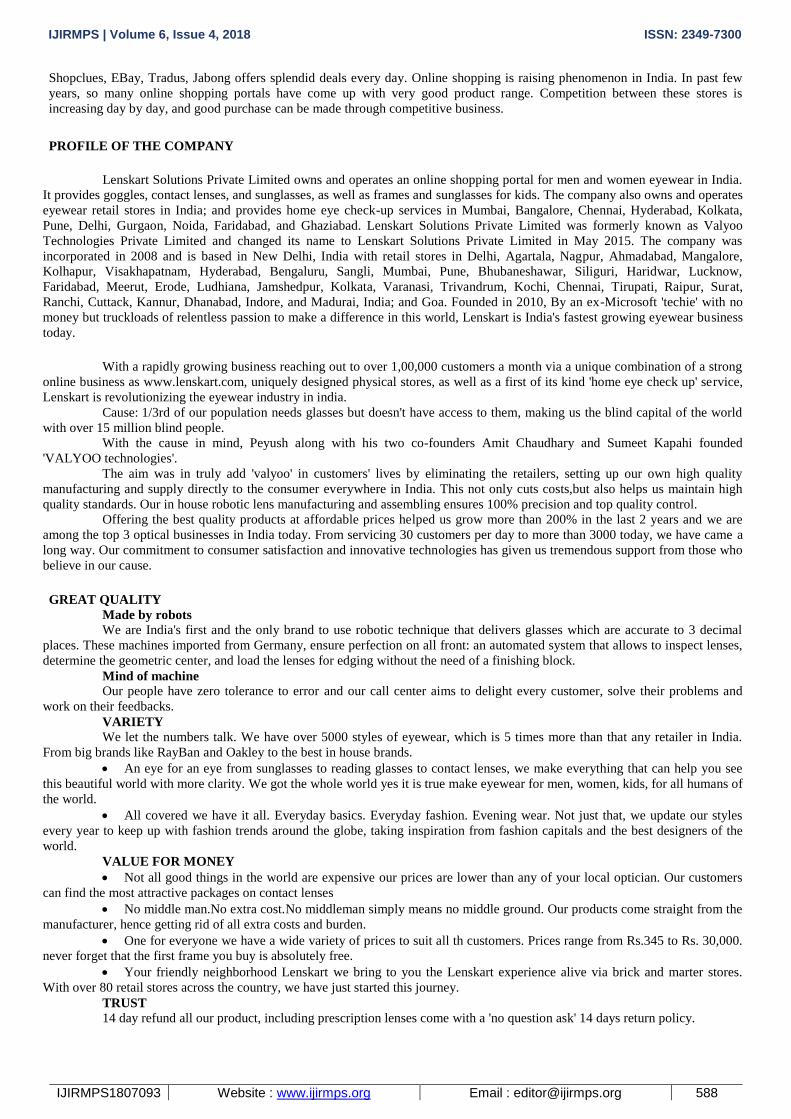
AGE GROUP OF THE RESPONDENTS
S.NO. AGE No. of respondents Percentage
1 Below 20 Years 14 7
2 21-30 Years 76 38
3 31-40Years 72 36
4 Above41 Years 38 19
Total 200 100
Source: Primary data
INTERPRETATION
The above table shows that 38% of the respondents belongs to the age group of 21-30 years, 36% of the respondents
belongs to 31-40 years, 19% of the respondents belongs age Above 41 years and 7% of the respondents belongs to the age group
of below 20 years.
It is concluded that, majority (38% )of the respondents belong to the age group of 21-30 years.
CHART NO. - 4.1
AGE GROUP OF THE RESPONDENTS
TABLE NO. - 4.2
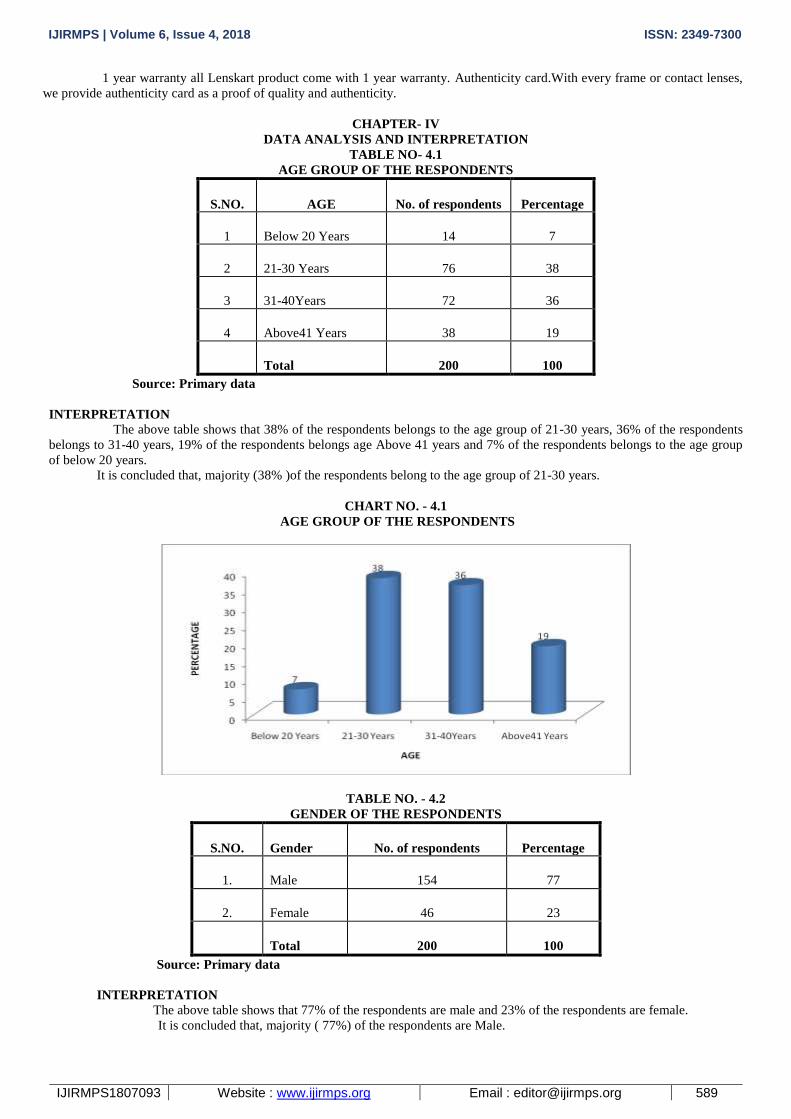
GENDER OF THE RESPONDENTS
S.NO. Gender No. of respondents Percentage
1. Male 154 77
2. Female 46 23
Total 200 100
Source: Primary data
INTERPRETATION
The above table shows that 77% of the respondents are male and 23% of the respondents are female.
It is concluded that, majority ( 77%) of the respondents are Male.
IJIRMPS | Volume 6, Issue 4, 2018 ISSN: 2349-7300
IJIRMPS1807093 Website : www.ijirmps.org Email : [email protected] 590
CHART NO. – 4.2
GENDER OF THE RESPONDENTS
TABLE NO. – 4.3
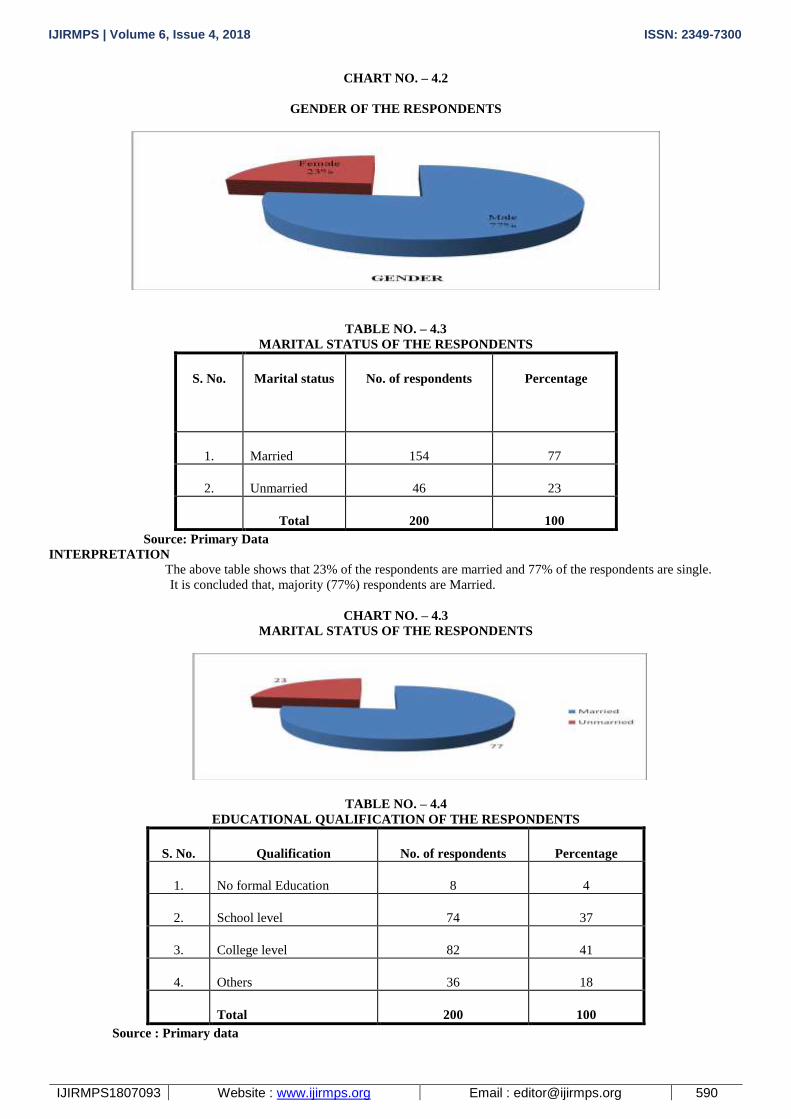
MARITAL STATUS OF THE RESPONDENTS
S. No. Marital status No. of respondents Percentage
1. Married 154 77
2. Unmarried 46 23
Total 200 100
Source: Primary Data
INTERPRETATION
The above table shows that 23% of the respondents are married and 77% of the respondents are single.
It is concluded that, majority (77%) respondents are Married.
CHART NO. – 4.3
MARITAL STATUS OF THE RESPONDENTS
TABLE NO. – 4.4
EDUCATIONAL QUALIFICATION OF THE RESPONDENTS
S. No. Qualification No. of respondents Percentage
1. No formal Education 8 4
2. School level 74 37
3. College level 82 41
4. Others 36 18
Total 200 100
Source : Primary data
IJIRMPS | Volume 6, Issue 4, 2018 ISSN: 2349-7300
IJIRMPS1807093 Website : www.ijirmps.org Email : [email protected] 591
INTERPRETATION
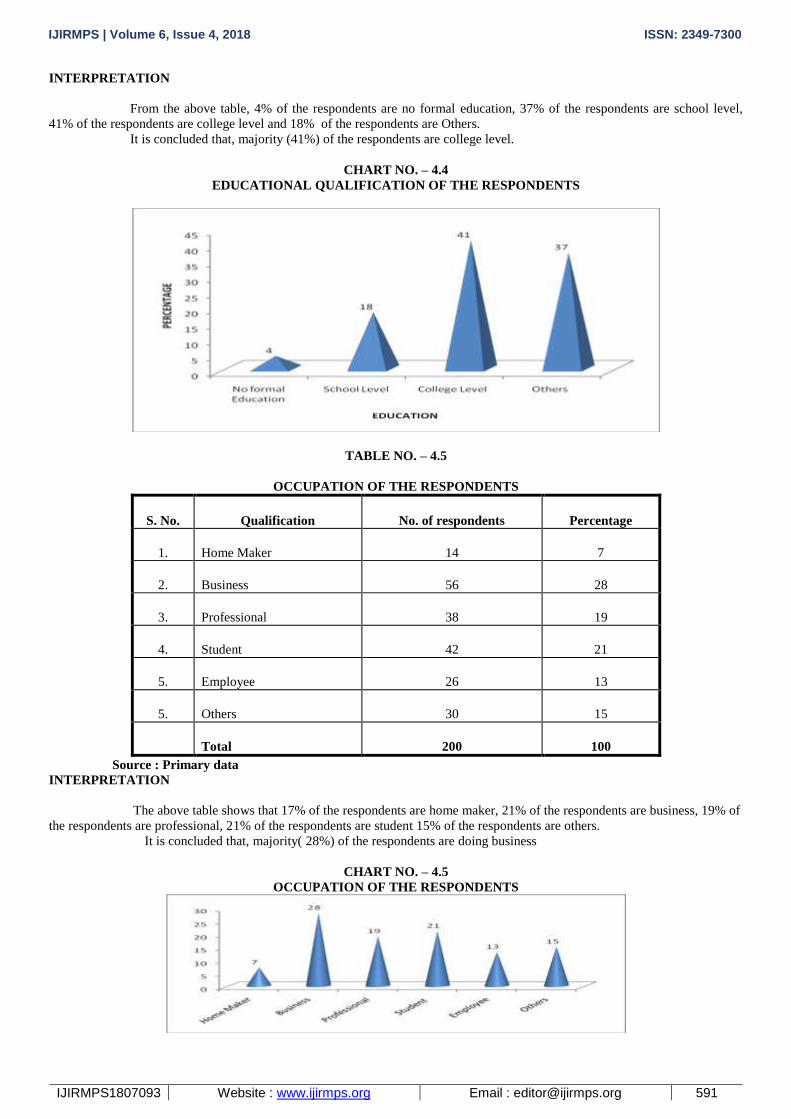
From the above table, 4% of the respondents are no formal education, 37% of the respondents are school level,
41% of the respondents are college level and 18% of the respondents are Others.
It is concluded that, majority (41%) of the respondents are college level.
CHART NO. – 4.4
EDUCATIONAL QUALIFICATION OF THE RESPONDENTS
TABLE NO. – 4.5
OCCUPATION OF THE RESPONDENTS
S. No. Qualification No. of respondents Percentage
1. Home Maker 14 7
2. Business 56 28
3. Professional 38 19
4. Student 42 21
5. Employee 26 13
5. Others 30 15
Total 200 100
Source : Primary data
INTERPRETATION
The above table shows that 17% of the respondents are home maker, 21% of the respondents are business, 19% of
the respondents are professional, 21% of the respondents are student 15% of the respondents are others.
It is concluded that, majority( 28%) of the respondents are doing business
CHART NO. – 4.5
OCCUPATION OF THE RESPONDENTS
IJIRMPS | Volume 6, Issue 4, 2018 ISSN: 2349-7300
IJIRMPS1807093 Website : www.ijirmps.org Email : [email protected] 592
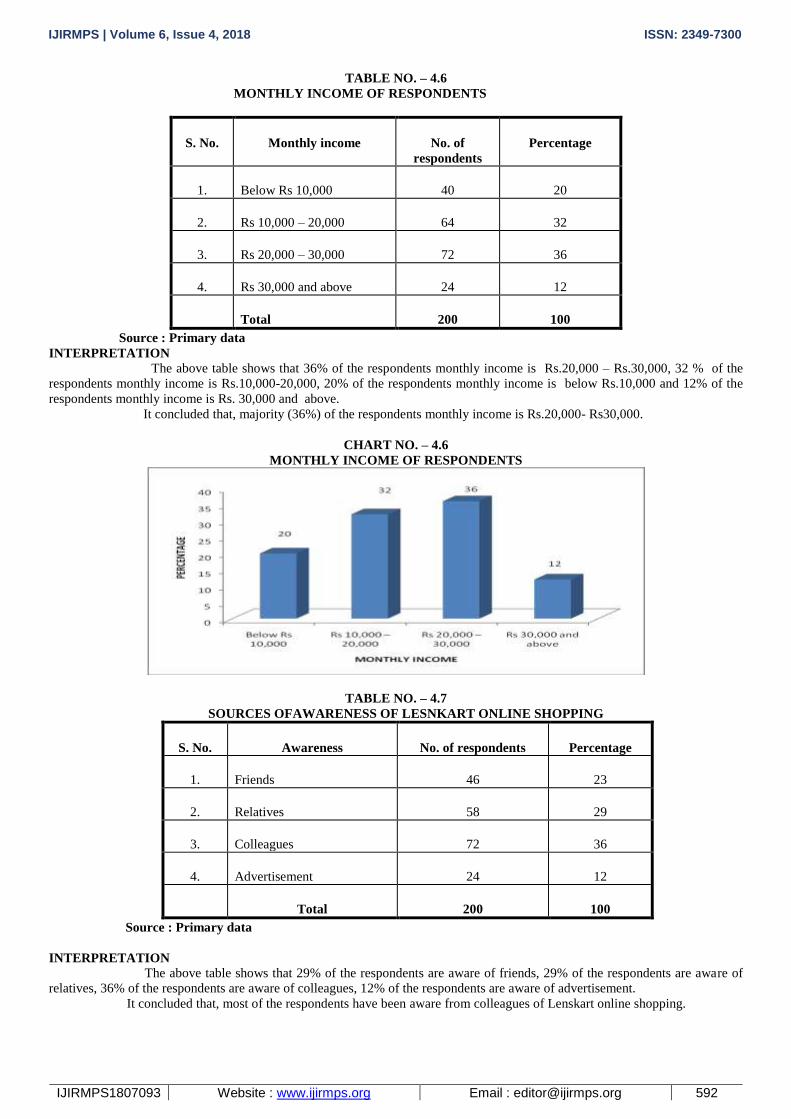
TABLE NO. – 4.6
MONTHLY INCOME OF RESPONDENTS
S. No. Monthly income No. of
respondents
Percentage
1. Below Rs 10,000 40 20
2. Rs 10,000 – 20,000 64 32
3. Rs 20,000 – 30,000 72 36
4. Rs 30,000 and above 24 12
Total 200 100
Source : Primary data
INTERPRETATION
The above table shows that 36% of the respondents monthly income is Rs.20,000 – Rs.30,000, 32 % of the
respondents monthly income is Rs.10,000-20,000, 20% of the respondents monthly income is below Rs.10,000 and 12% of the
respondents monthly income is Rs. 30,000 and above.
It concluded that, majority (36%) of the respondents monthly income is Rs.20,000- Rs30,000.
CHART NO. – 4.6
MONTHLY INCOME OF RESPONDENTS
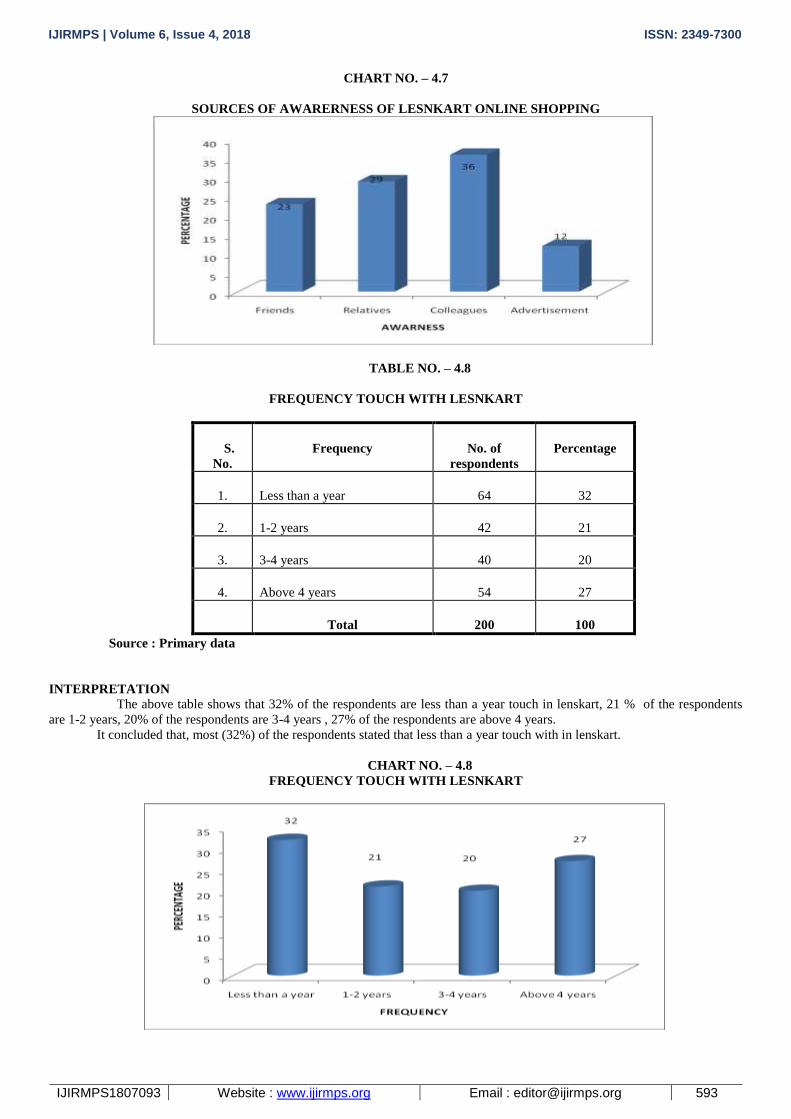
TABLE NO. – 4.7
SOURCES OFAWARENESS OF LESNKART ONLINE SHOPPING
S. No. Awareness No. of respondents Percentage
1. Friends 46 23
2. Relatives 58 29
3. Colleagues 72 36
4. Advertisement 24 12
Total 200 100
Source : Primary data
INTERPRETATION
The above table shows that 29% of the respondents are aware of friends, 29% of the respondents are aware of
relatives, 36% of the respondents are aware of colleagues, 12% of the respondents are aware of advertisement.
It concluded that, most of the respondents have been aware from colleagues of Lenskart online shopping.
IJIRMPS | Volume 6, Issue 4, 2018 ISSN: 2349-7300
IJIRMPS1807093 Website : www.ijirmps.org Email : [email protected] 593
CHART NO. – 4.7
SOURCES OF AWARERNESS OF LESNKART ONLINE SHOPPING
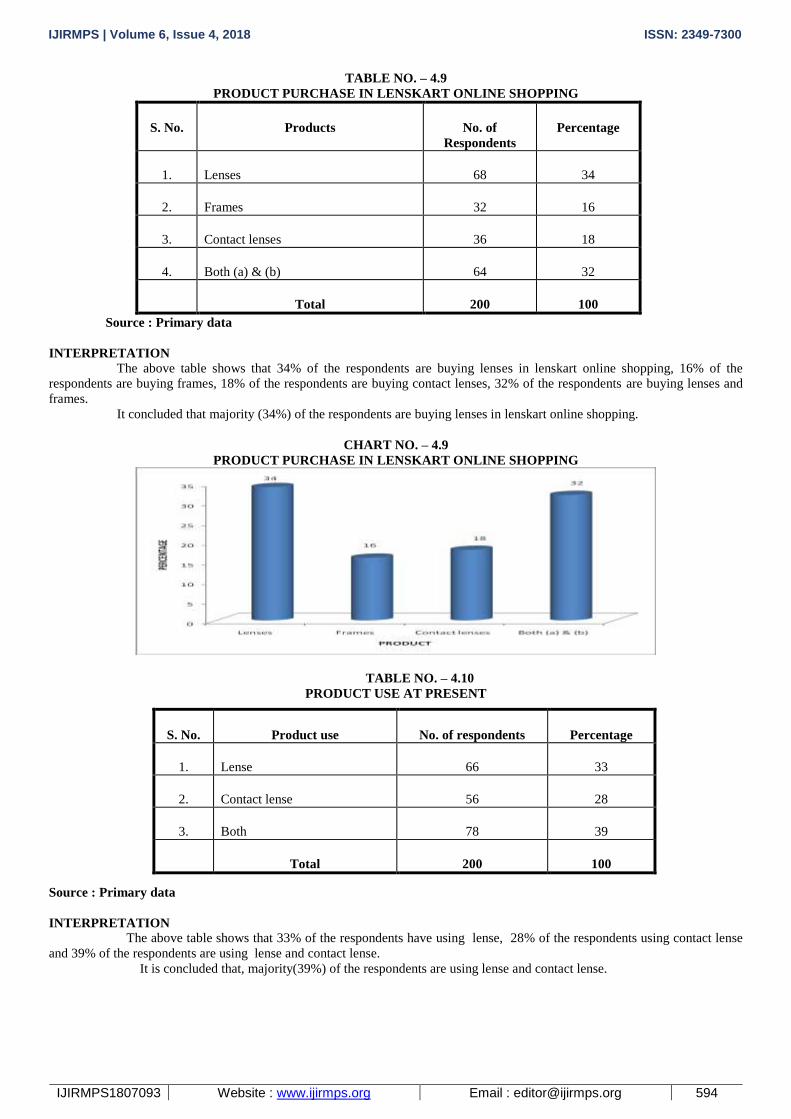
TABLE NO. – 4.8
FREQUENCY TOUCH WITH LESNKART
S.
No.
Frequency No. of
respondents
Percentage
1. Less than a year 64 32
2. 1-2 years 42 21
3. 3-4 years 40 20
4. Above 4 years 54 27
Total 200 100
Source : Primary data
INTERPRETATION
The above table shows that 32% of the respondents are less than a year touch in lenskart, 21 % of the respondents
are 1-2 years, 20% of the respondents are 3-4 years , 27% of the respondents are above 4 years.
It concluded that, most (32%) of the respondents stated that less than a year touch with in lenskart.
CHART NO. – 4.8
FREQUENCY TOUCH WITH LESNKART
IJIRMPS | Volume 6, Issue 4, 2018 ISSN: 2349-7300
IJIRMPS1807093 Website : www.ijirmps.org Email : [email protected] 594
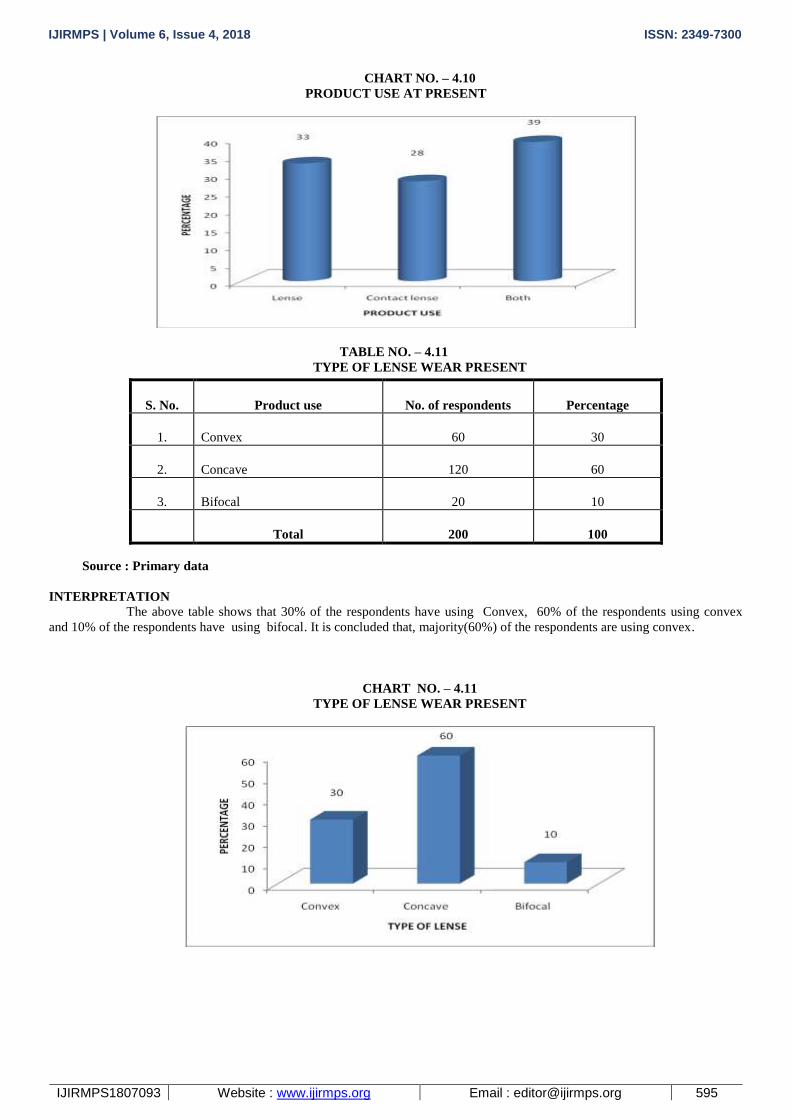
TABLE NO. – 4.9
PRODUCT PURCHASE IN LENSKART ONLINE SHOPPING
S. No. Products No. of
Respondents
Percentage
1. Lenses 68 34
2. Frames 32 16
3. Contact lenses 36 18
4. Both (a) & (b) 64 32
Total 200 100
Source : Primary data
INTERPRETATION
The above table shows that 34% of the respondents are buying lenses in lenskart online shopping, 16% of the
respondents are buying frames, 18% of the respondents are buying contact lenses, 32% of the respondents are buying lenses and
frames.
It concluded that majority (34%) of the respondents are buying lenses in lenskart online shopping.
CHART NO. – 4.9
PRODUCT PURCHASE IN LENSKART ONLINE SHOPPING
TABLE NO. – 4.10
PRODUCT USE AT PRESENT
Source : Primary data
INTERPRETATION
The above table shows that 33% of the respondents have using lense, 28% of the respondents using contact lense
and 39% of the respondents are using lense and contact lense.
It is concluded that, majority(39%) of the respondents are using lense and contact lense.
S. No. Product use No. of respondents Percentage
1. Lense 66 33
2. Contact lense 56 28
3. Both 78 39
Total 200 100
IJIRMPS | Volume 6, Issue 4, 2018 ISSN: 2349-7300
IJIRMPS1807093 Website : www.ijirmps.org Email : [email protected] 595
CHART NO. – 4.10
PRODUCT USE AT PRESENT
TABLE NO. – 4.11
TYPE OF LENSE WEAR PRESENT
Source : Primary data
INTERPRETATION
The above table shows that 30% of the respondents have using Convex, 60% of the respondents using convex
and 10% of the respondents have using bifocal. It is concluded that, majority(60%) of the respondents are using convex.
CHART NO. – 4.11
TYPE OF LENSE WEAR PRESENT
S. No. Product use No. of respondents Percentage
1. Convex 60 30
2. Concave 120 60
3. Bifocal 20 10
Total 200 100
IJIRMPS | Volume 6, Issue 4, 2018 ISSN: 2349-7300
IJIRMPS1807093 Website : www.ijirmps.org Email : [email protected] 596
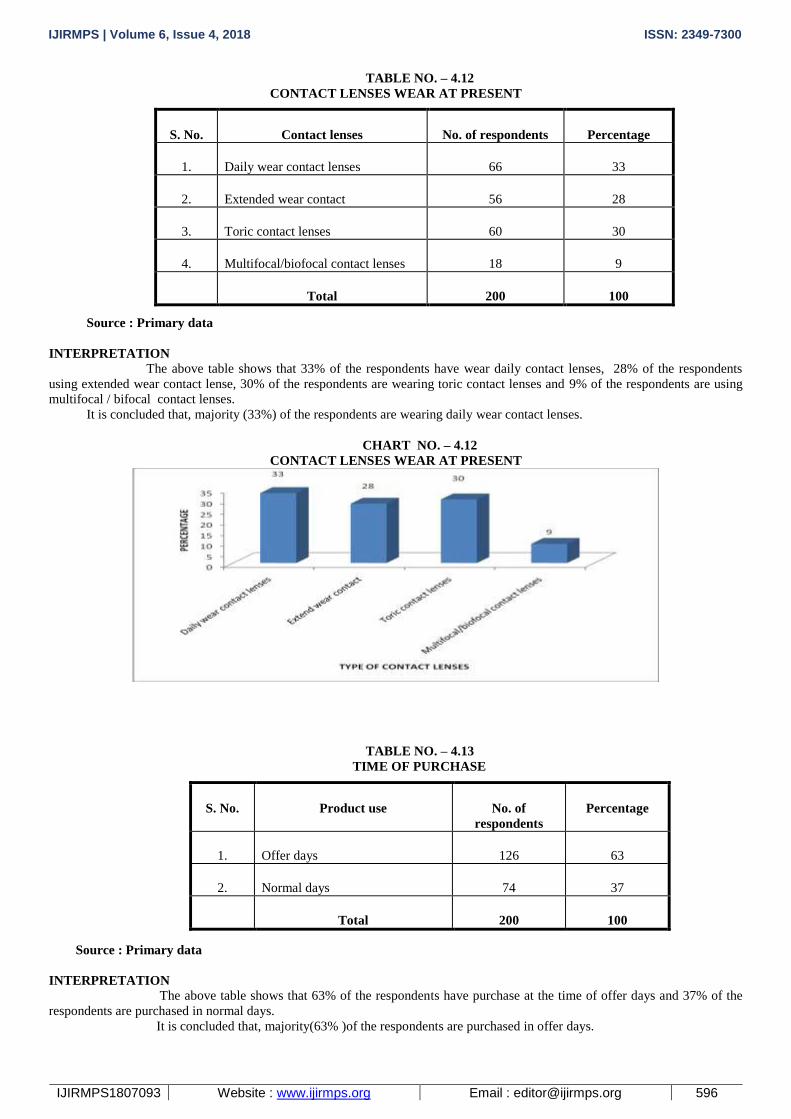
TABLE NO. – 4.12
CONTACT LENSES WEAR AT PRESENT
Source : Primary data
INTERPRETATION
The above table shows that 33% of the respondents have wear daily contact lenses, 28% of the respondents
using extended wear contact lense, 30% of the respondents are wearing toric contact lenses and 9% of the respondents are using
multifocal / bifocal contact lenses.
It is concluded that, majority (33%) of the respondents are wearing daily wear contact lenses.
CHART NO. – 4.12
CONTACT LENSES WEAR AT PRESENT
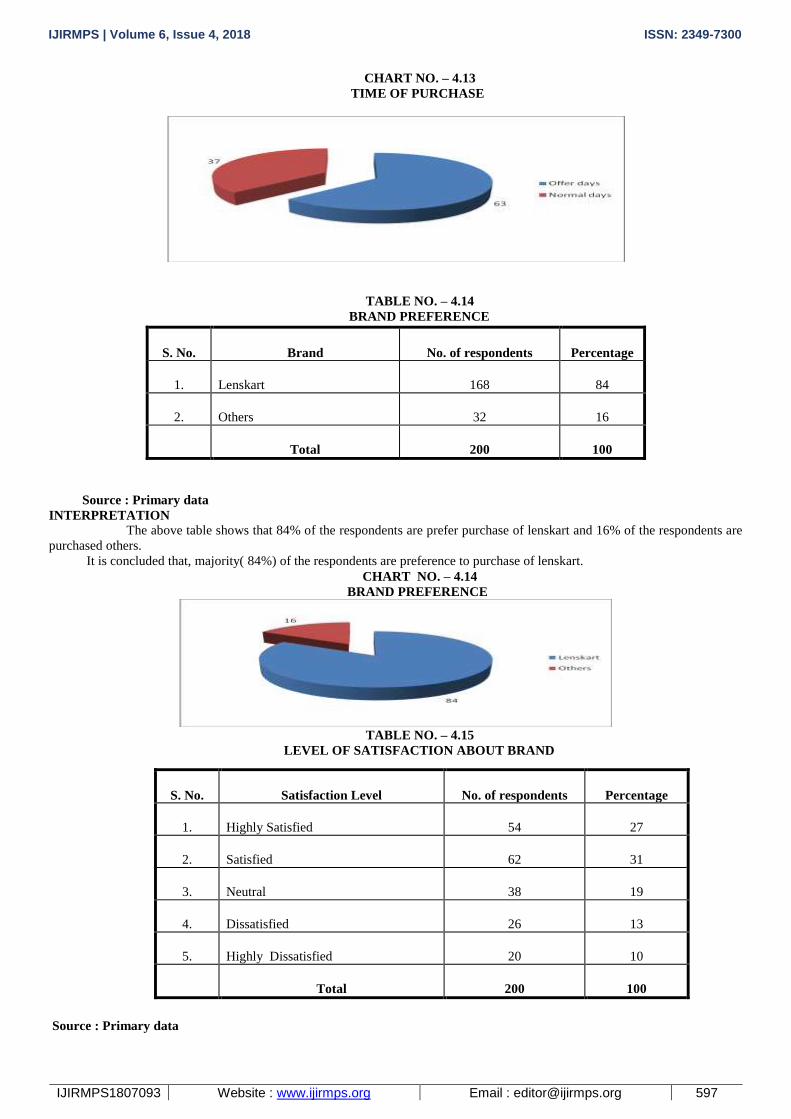
TABLE NO. – 4.13
TIME OF PURCHASE
Source : Primary data
INTERPRETATION
The above table shows that 63% of the respondents have purchase at the time of offer days and 37% of the
respondents are purchased in normal days.
It is concluded that, majority(63% )of the respondents are purchased in offer days.
S. No. Contact lenses No. of respondents Percentage
1. Daily wear contact lenses 66 33
2. Extended wear contact 56 28
3. Toric contact lenses 60 30
4. Multifocal/biofocal contact lenses 18 9
Total 200 100
S. No. Product use No. of
respondents
Percentage
1. Offer days 126 63
2. Normal days 74 37
Total 200 100
IJIRMPS | Volume 6, Issue 4, 2018 ISSN: 2349-7300
IJIRMPS1807093 Website : www.ijirmps.org Email : [email protected] 597
CHART NO. – 4.13
TIME OF PURCHASE
TABLE NO. – 4.14
BRAND PREFERENCE
Source : Primary data
INTERPRETATION
The above table shows that 84% of the respondents are prefer purchase of lenskart and 16% of the respondents are
purchased others.
It is concluded that, majority( 84%) of the respondents are preference to purchase of lenskart.
CHART NO. – 4.14
BRAND PREFERENCE
TABLE NO. – 4.15
LEVEL OF SATISFACTION ABOUT BRAND
Source : Primary data
S. No. Brand No. of respondents Percentage
1. Lenskart 168 84
2. Others 32 16
Total 200 100
S. No. Satisfaction Level No. of respondents Percentage
1. Highly Satisfied 54 27
2. Satisfied 62 31
3. Neutral 38 19
4. Dissatisfied 26 13
5. Highly Dissatisfied 20 10
Total 200 100
IJIRMPS | Volume 6, Issue 4, 2018 ISSN: 2349-7300
IJIRMPS1807093 Website : www.ijirmps.org Email : [email protected] 598
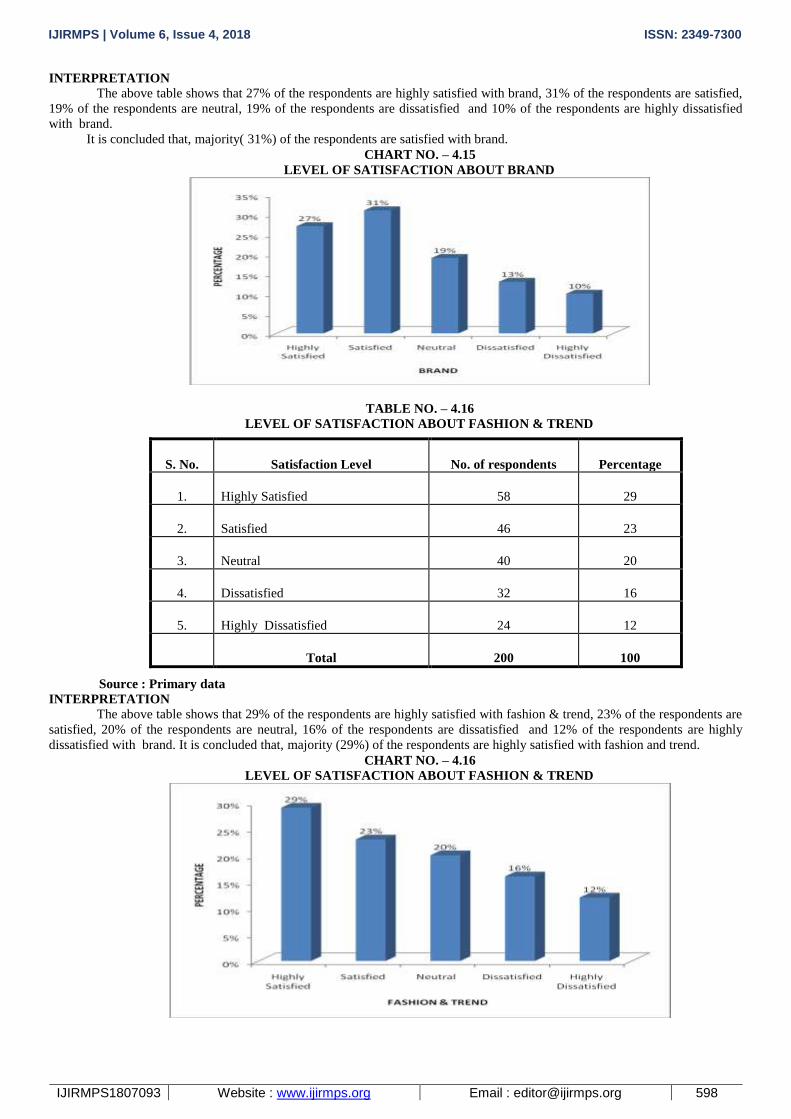
INTERPRETATION
The above table shows that 27% of the respondents are highly satisfied with brand, 31% of the respondents are satisfied,
19% of the respondents are neutral, 19% of the respondents are dissatisfied and 10% of the respondents are highly dissatisfied
with brand.
It is concluded that, majority( 31%) of the respondents are satisfied with brand.
CHART NO. – 4.15
LEVEL OF SATISFACTION ABOUT BRAND
TABLE NO. – 4.16
LEVEL OF SATISFACTION ABOUT FASHION & TREND
Source : Primary data
INTERPRETATION
The above table shows that 29% of the respondents are highly satisfied with fashion & trend, 23% of the respondents are
satisfied, 20% of the respondents are neutral, 16% of the respondents are dissatisfied and 12% of the respondents are highly
dissatisfied with brand. It is concluded that, majority (29%) of the respondents are highly satisfied with fashion and trend.
CHART NO. – 4.16
LEVEL OF SATISFACTION ABOUT FASHION & TREND
S. No. Satisfaction Level No. of respondents Percentage
1. Highly Satisfied 58 29
2. Satisfied 46 23
3. Neutral 40 20
4. Dissatisfied 32 16
5. Highly Dissatisfied 24 12
Total 200 100
IJIRMPS | Volume 6, Issue 4, 2018 ISSN: 2349-7300
IJIRMPS1807093 Website : www.ijirmps.org Email : [email protected] 599
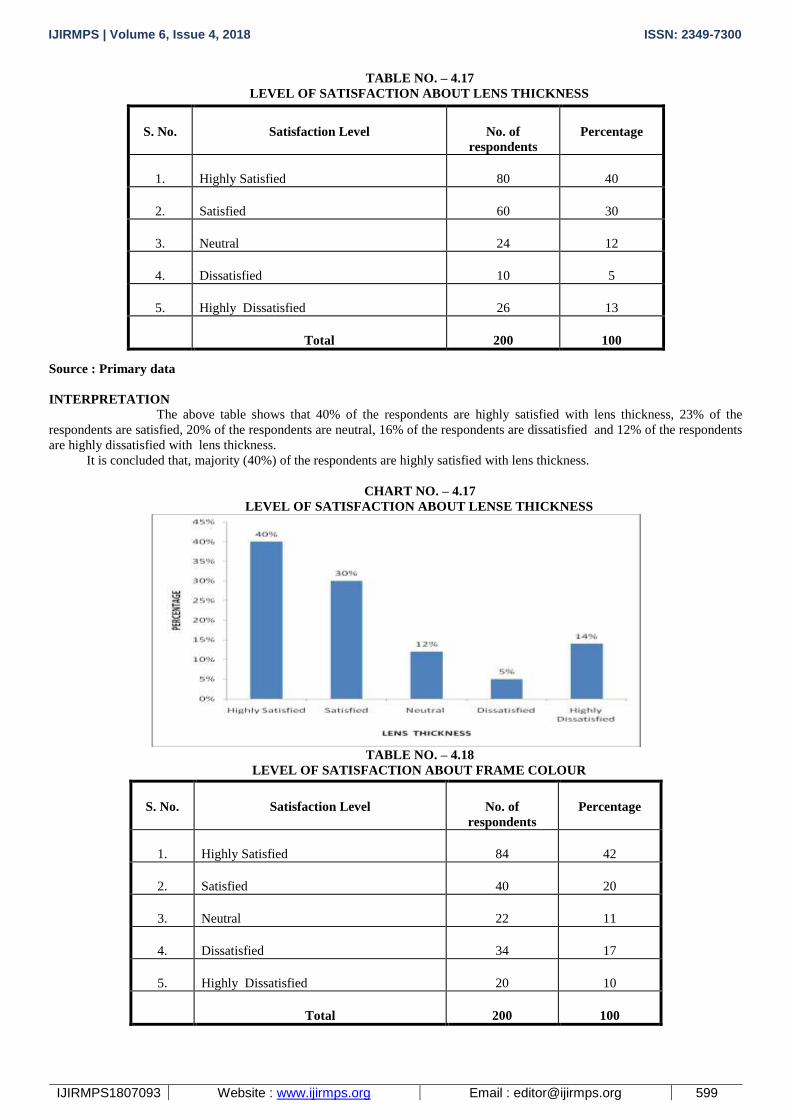
TABLE NO. – 4.17
LEVEL OF SATISFACTION ABOUT LENS THICKNESS
Source : Primary data
INTERPRETATION
The above table shows that 40% of the respondents are highly satisfied with lens thickness, 23% of the
respondents are satisfied, 20% of the respondents are neutral, 16% of the respondents are dissatisfied and 12% of the respondents
are highly dissatisfied with lens thickness.
It is concluded that, majority (40%) of the respondents are highly satisfied with lens thickness.
CHART NO. – 4.17
LEVEL OF SATISFACTION ABOUT LENSE THICKNESS
TABLE NO. – 4.18
LEVEL OF SATISFACTION ABOUT FRAME COLOUR
S. No. Satisfaction Level No. of
respondents
Percentage
1. Highly Satisfied 80 40
2. Satisfied 60 30
3. Neutral 24 12
4. Dissatisfied 10 5
5. Highly Dissatisfied 26 13
Total 200 100
S. No. Satisfaction Level No. of
respondents
Percentage
1. Highly Satisfied 84 42
2. Satisfied 40 20
3. Neutral 22 11
4. Dissatisfied 34 17
5. Highly Dissatisfied 20 10
Total 200 100
IJIRMPS | Volume 6, Issue 4, 2018 ISSN: 2349-7300
IJIRMPS1807093 Website : www.ijirmps.org Email : [email protected] 600
Source : Primary data
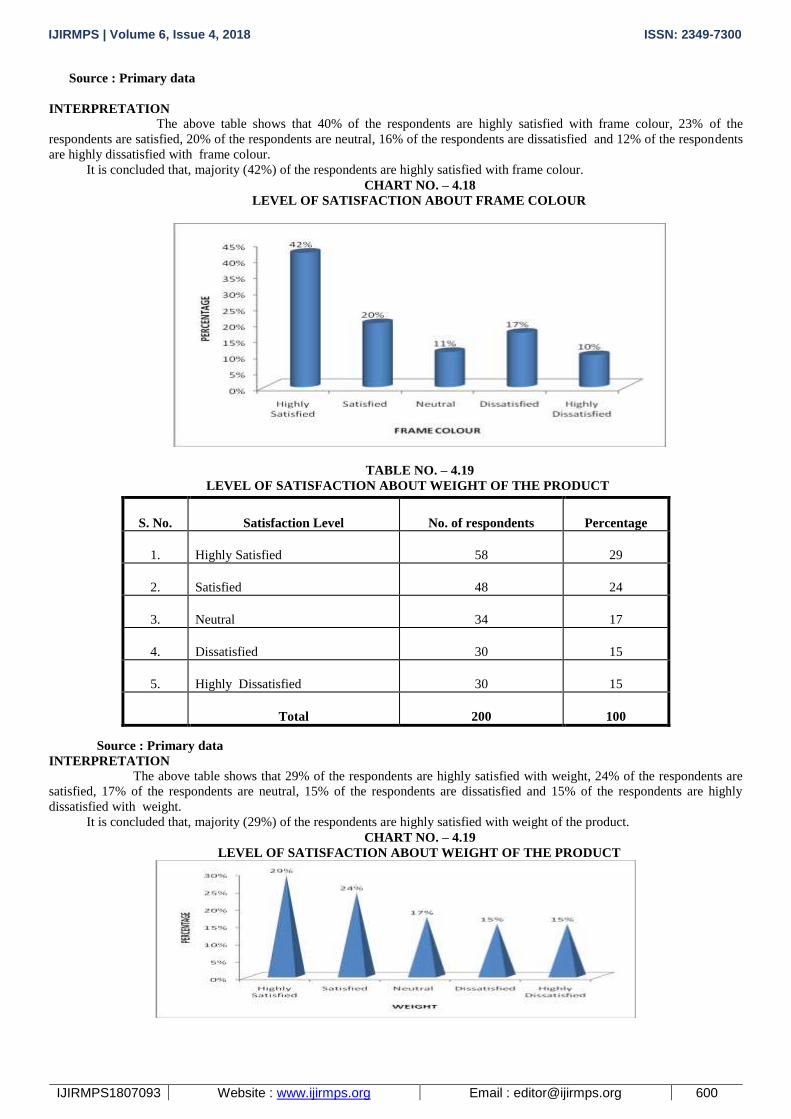
INTERPRETATION
The above table shows that 40% of the respondents are highly satisfied with frame colour, 23% of the
respondents are satisfied, 20% of the respondents are neutral, 16% of the respondents are dissatisfied and 12% of the respondents
are highly dissatisfied with frame colour.
It is concluded that, majority (42%) of the respondents are highly satisfied with frame colour.
CHART NO. – 4.18
LEVEL OF SATISFACTION ABOUT FRAME COLOUR
TABLE NO. – 4.19
LEVEL OF SATISFACTION ABOUT WEIGHT OF THE PRODUCT
Source : Primary data
INTERPRETATION
The above table shows that 29% of the respondents are highly satisfied with weight, 24% of the respondents are
satisfied, 17% of the respondents are neutral, 15% of the respondents are dissatisfied and 15% of the respondents are highly
dissatisfied with weight.
It is concluded that, majority (29%) of the respondents are highly satisfied with weight of the product.
CHART NO. – 4.19
LEVEL OF SATISFACTION ABOUT WEIGHT OF THE PRODUCT
S. No. Satisfaction Level No. of respondents Percentage
1. Highly Satisfied 58 29
2. Satisfied 48 24
3. Neutral 34 17
4. Dissatisfied 30 15
5. Highly Dissatisfied 30 15
Total 200 100
IJIRMPS | Volume 6, Issue 4, 2018 ISSN: 2349-7300
IJIRMPS1807093 Website : www.ijirmps.org Email : [email protected] 601
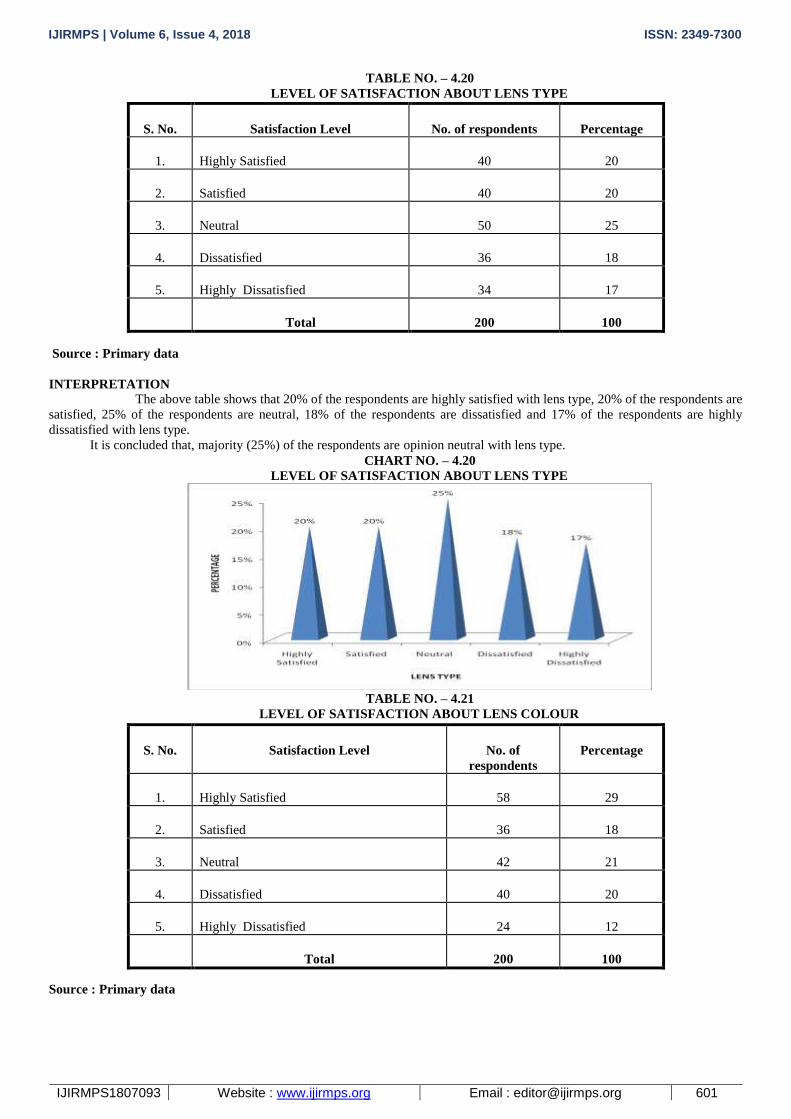
TABLE NO. – 4.20
LEVEL OF SATISFACTION ABOUT LENS TYPE
Source : Primary data
INTERPRETATION
The above table shows that 20% of the respondents are highly satisfied with lens type, 20% of the respondents are
satisfied, 25% of the respondents are neutral, 18% of the respondents are dissatisfied and 17% of the respondents are highly
dissatisfied with lens type.
It is concluded that, majority (25%) of the respondents are opinion neutral with lens type.
CHART NO. – 4.20
LEVEL OF SATISFACTION ABOUT LENS TYPE
TABLE NO. – 4.21
LEVEL OF SATISFACTION ABOUT LENS COLOUR
Source : Primary data
S. No. Satisfaction Level No. of respondents Percentage
1. Highly Satisfied 40 20
2. Satisfied 40 20
3. Neutral 50 25
4. Dissatisfied 36 18
5. Highly Dissatisfied 34 17
Total 200 100
S. No. Satisfaction Level No. of
respondents
Percentage
1. Highly Satisfied 58 29
2. Satisfied 36 18
3. Neutral 42 21
4. Dissatisfied 40 20
5. Highly Dissatisfied 24 12
Total 200 100
IJIRMPS | Volume 6, Issue 4, 2018 ISSN: 2349-7300
IJIRMPS1807093 Website : www.ijirmps.org Email : [email protected] 602
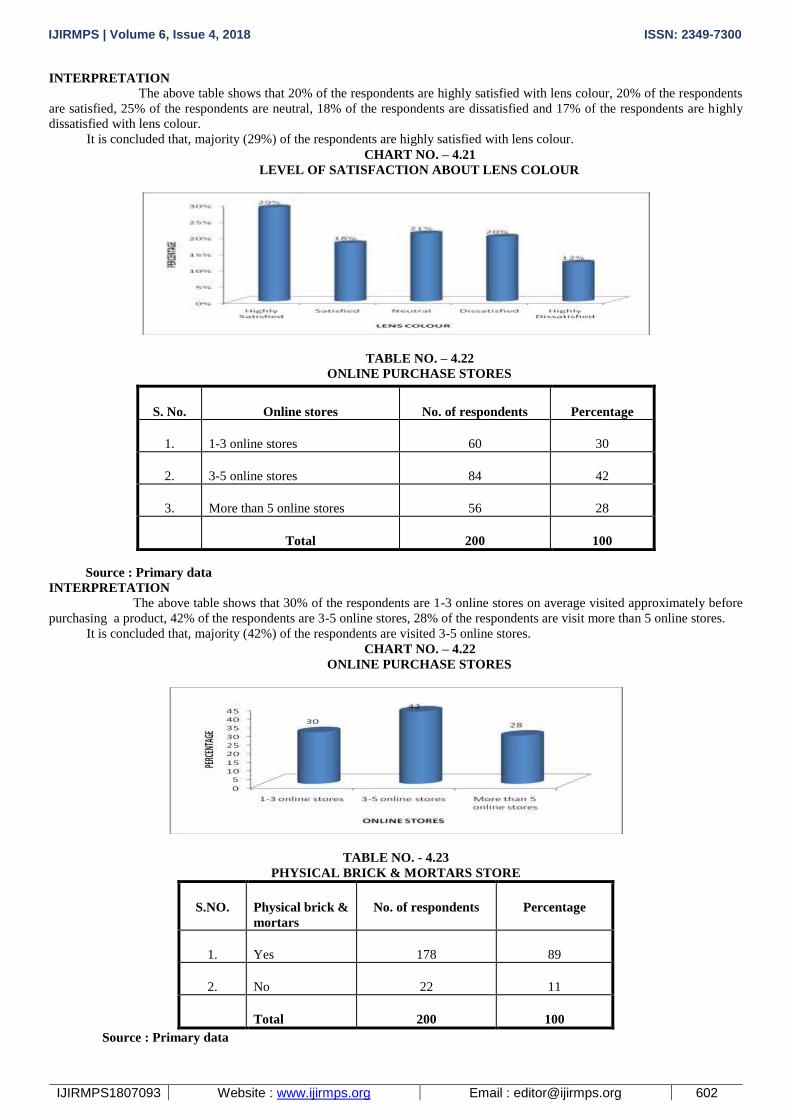
INTERPRETATION
The above table shows that 20% of the respondents are highly satisfied with lens colour, 20% of the respondents
are satisfied, 25% of the respondents are neutral, 18% of the respondents are dissatisfied and 17% of the respondents are highly
dissatisfied with lens colour.
It is concluded that, majority (29%) of the respondents are highly satisfied with lens colour.
CHART NO. – 4.21
LEVEL OF SATISFACTION ABOUT LENS COLOUR
TABLE NO. – 4.22
ONLINE PURCHASE STORES
Source : Primary data
INTERPRETATION
The above table shows that 30% of the respondents are 1-3 online stores on average visited approximately before
purchasing a product, 42% of the respondents are 3-5 online stores, 28% of the respondents are visit more than 5 online stores.
It is concluded that, majority (42%) of the respondents are visited 3-5 online stores.
CHART NO. – 4.22
ONLINE PURCHASE STORES
TABLE NO. - 4.23
PHYSICAL BRICK & MORTARS STORE
S.NO. Physical brick &
mortars
No. of respondents Percentage
1. Yes 178 89
2. No 22 11
Total 200 100
Source : Primary data
S. No. Online stores No. of respondents Percentage
1. 1-3 online stores 60 30
2. 3-5 online stores 84 42
3. More than 5 online stores 56 28
Total 200 100
IJIRMPS | Volume 6, Issue 4, 2018 ISSN: 2349-7300
IJIRMPS1807093 Website : www.ijirmps.org Email : [email protected] 603
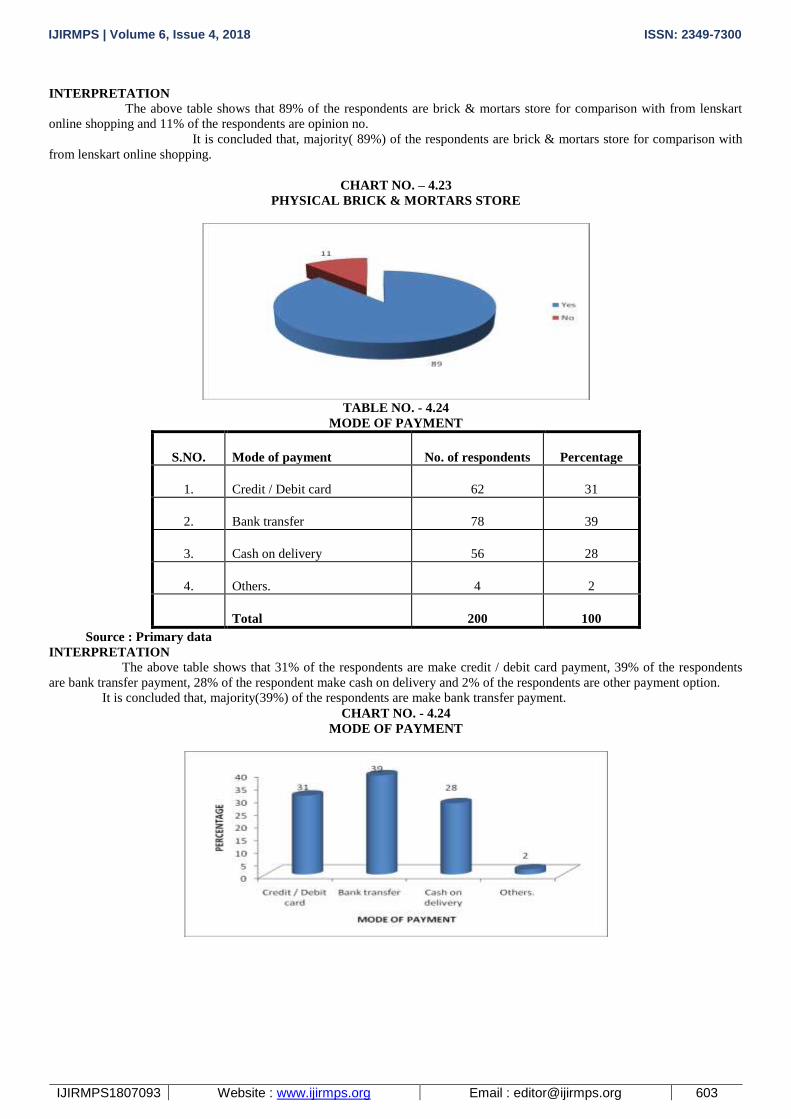
INTERPRETATION
The above table shows that 89% of the respondents are brick & mortars store for comparison with from lenskart
online shopping and 11% of the respondents are opinion no.
It is concluded that, majority( 89%) of the respondents are brick & mortars store for comparison with
from lenskart online shopping.
CHART NO. – 4.23
PHYSICAL BRICK & MORTARS STORE
TABLE NO. - 4.24
MODE OF PAYMENT
S.NO. Mode of payment No. of respondents Percentage
1. Credit / Debit card 62 31
2. Bank transfer 78 39
3. Cash on delivery 56 28
4. Others. 4 2
Total 200 100
Source : Primary data
INTERPRETATION
The above table shows that 31% of the respondents are make credit / debit card payment, 39% of the respondents
are bank transfer payment, 28% of the respondent make cash on delivery and 2% of the respondents are other payment option.
It is concluded that, majority(39%) of the respondents are make bank transfer payment.
CHART NO. - 4.24
MODE OF PAYMENT
IJIRMPS | Volume 6, Issue 4, 2018 ISSN: 2349-7300
IJIRMPS1807093 Website : www.ijirmps.org Email : [email protected] 604
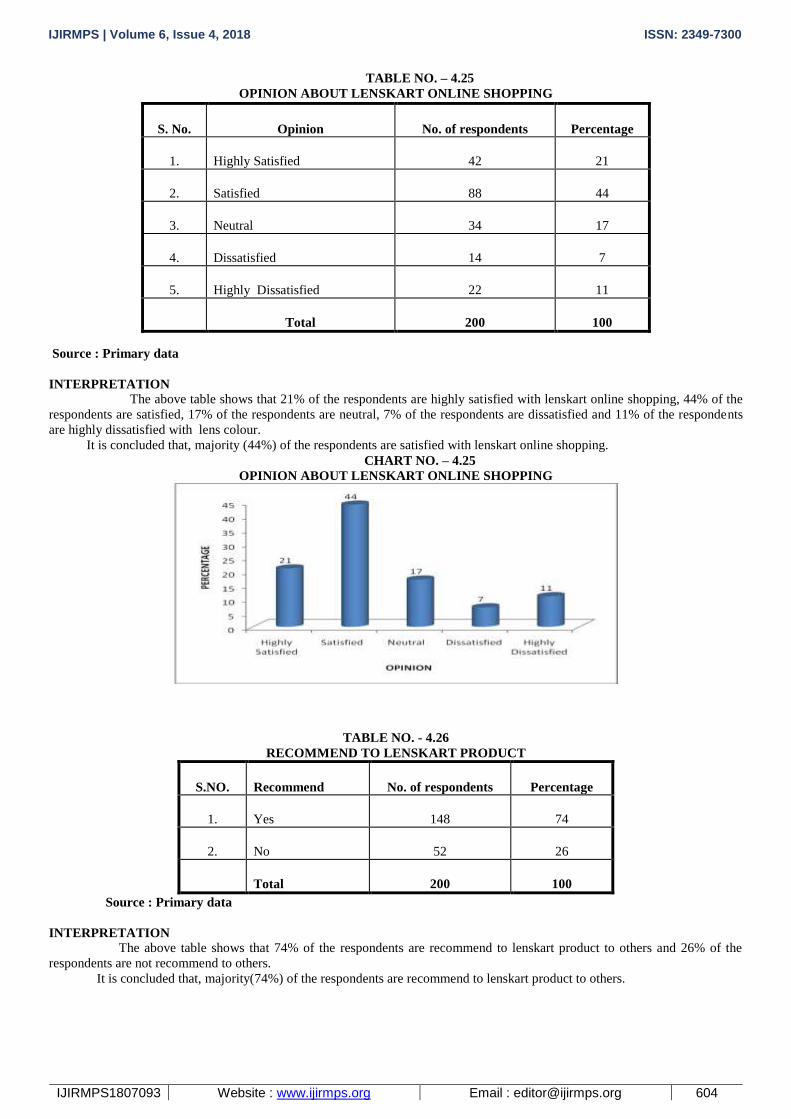
TABLE NO. – 4.25
OPINION ABOUT LENSKART ONLINE SHOPPING
Source : Primary data
INTERPRETATION
The above table shows that 21% of the respondents are highly satisfied with lenskart online shopping, 44% of the
respondents are satisfied, 17% of the respondents are neutral, 7% of the respondents are dissatisfied and 11% of the respondents
are highly dissatisfied with lens colour.
It is concluded that, majority (44%) of the respondents are satisfied with lenskart online shopping.
CHART NO. – 4.25
OPINION ABOUT LENSKART ONLINE SHOPPING
TABLE NO. - 4.26
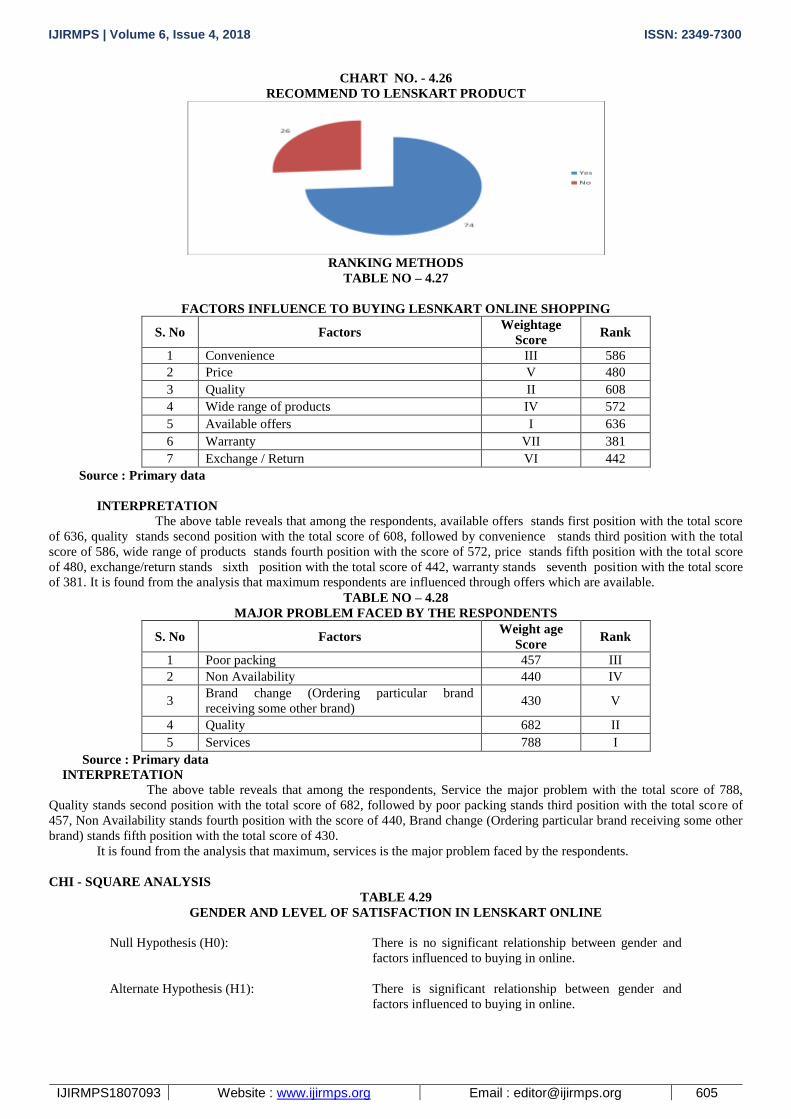
RECOMMEND TO LENSKART PRODUCT
S.NO. Recommend No. of respondents Percentage
1. Yes 148 74
2. No 52 26
Total 200 100
Source : Primary data
INTERPRETATION
The above table shows that 74% of the respondents are recommend to lenskart product to others and 26% of the
respondents are not recommend to others.
It is concluded that, majority(74%) of the respondents are recommend to lenskart product to others.
S. No. Opinion No. of respondents Percentage
1. Highly Satisfied 42 21
2. Satisfied 88 44
3. Neutral 34 17
4. Dissatisfied 14 7
5. Highly Dissatisfied 22 11
Total 200 100
IJIRMPS | Volume 6, Issue 4, 2018 ISSN: 2349-7300
IJIRMPS1807093 Website : www.ijirmps.org Email : [email protected] 605
CHART NO. - 4.26
RECOMMEND TO LENSKART PRODUCT
RANKING METHODS
TABLE NO – 4.27
FACTORS INFLUENCE TO BUYING LESNKART ONLINE SHOPPING
S. No Factors Weightage
Score Rank
1 Convenience III 586
2 Price V 480
3 Quality II 608
4 Wide range of products IV 572
5 Available offers I 636
6 Warranty VII 381
7 Exchange / Return VI 442
Source : Primary data
INTERPRETATION
The above table reveals that among the respondents, available offers stands first position with the total score
of 636, quality stands second position with the total score of 608, followed by convenience stands third position with the total
score of 586, wide range of products stands fourth position with the score of 572, price stands fifth position with the total score
of 480, exchange/return stands sixth position with the total score of 442, warranty stands seventh position with the total score
of 381. It is found from the analysis that maximum respondents are influenced through offers which are available.
TABLE NO – 4.28
MAJOR PROBLEM FACED BY THE RESPONDENTS
S. No Factors Weight age
Score Rank
1 Poor packing 457 III
2 Non Availability 440 IV
3 Brand change (Ordering particular brand
receiving some other brand) 430 V
4 Quality 682 II
5 Services 788 I
Source : Primary data
INTERPRETATION
The above table reveals that among the respondents, Service the major problem with the total score of 788,
Quality stands second position with the total score of 682, followed by poor packing stands third position with the total score of
457, Non Availability stands fourth position with the score of 440, Brand change (Ordering particular brand receiving some other
brand) stands fifth position with the total score of 430.
It is found from the analysis that maximum, services is the major problem faced by the respondents.
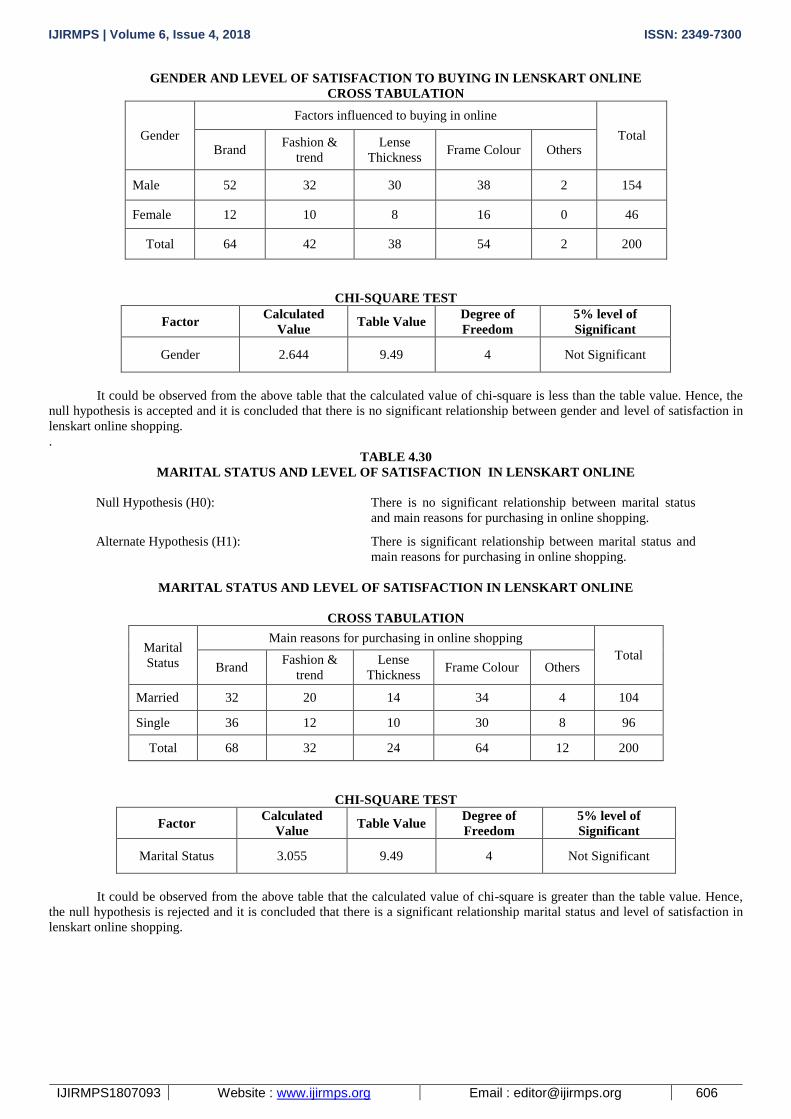
CHI - SQUARE ANALYSIS
TABLE 4.29
GENDER AND LEVEL OF SATISFACTION IN LENSKART ONLINE
Null Hypothesis (H0): There is no significant relationship between gender and
factors influenced to buying in online.
Alternate Hypothesis (H1): There is significant relationship between gender and
factors influenced to buying in online.
IJIRMPS | Volume 6, Issue 4, 2018 ISSN: 2349-7300
IJIRMPS1807093 Website : www.ijirmps.org Email : [email protected] 606
GENDER AND LEVEL OF SATISFACTION TO BUYING IN LENSKART ONLINE
CROSS TABULATION
Gender
Factors influenced to buying in online
Total Brand
Fashion &
trend
Lense
Thickness Frame Colour Others
Male 52 32 30 38 2 154
Female 12 10 8 16 0 46
Total 64 42 38 54 2 200
CHI-SQUARE TEST
Factor Calculated
Value Table Value
Degree of
Freedom
5% level of
Significant
Gender 2.644 9.49 4 Not Significant
It could be observed from the above table that the calculated value of chi-square is less than the table value. Hence, the
null hypothesis is accepted and it is concluded that there is no significant relationship between gender and level of satisfaction in
lenskart online shopping.
.
TABLE 4.30
MARITAL STATUS AND LEVEL OF SATISFACTION IN LENSKART ONLINE
Null Hypothesis (H0): There is no significant relationship between marital status
and main reasons for purchasing in online shopping.
Alternate Hypothesis (H1): There is significant relationship between marital status and
main reasons for purchasing in online shopping.
MARITAL STATUS AND LEVEL OF SATISFACTION IN LENSKART ONLINE
CROSS TABULATION
Marital
Status
Main reasons for purchasing in online shopping
Total Brand
Fashion &
trend
Lense
Thickness Frame Colour Others
Married 32 20 14 34 4 104
Single 36 12 10 30 8 96
Total 68 32 24 64 12 200
CHI-SQUARE TEST
Factor Calculated
Value Table Value
Degree of
Freedom
5% level of
Significant
Marital Status 3.055 9.49 4 Not Significant
It could be observed from the above table that the calculated value of chi-square is greater than the table value. Hence,
the null hypothesis is rejected and it is concluded that there is a significant relationship marital status and level of satisfaction in
lenskart online shopping.
IJIRMPS | Volume 6, Issue 4, 2018 ISSN: 2349-7300
IJIRMPS1807093 Website : www.ijirmps.org Email : [email protected] 607
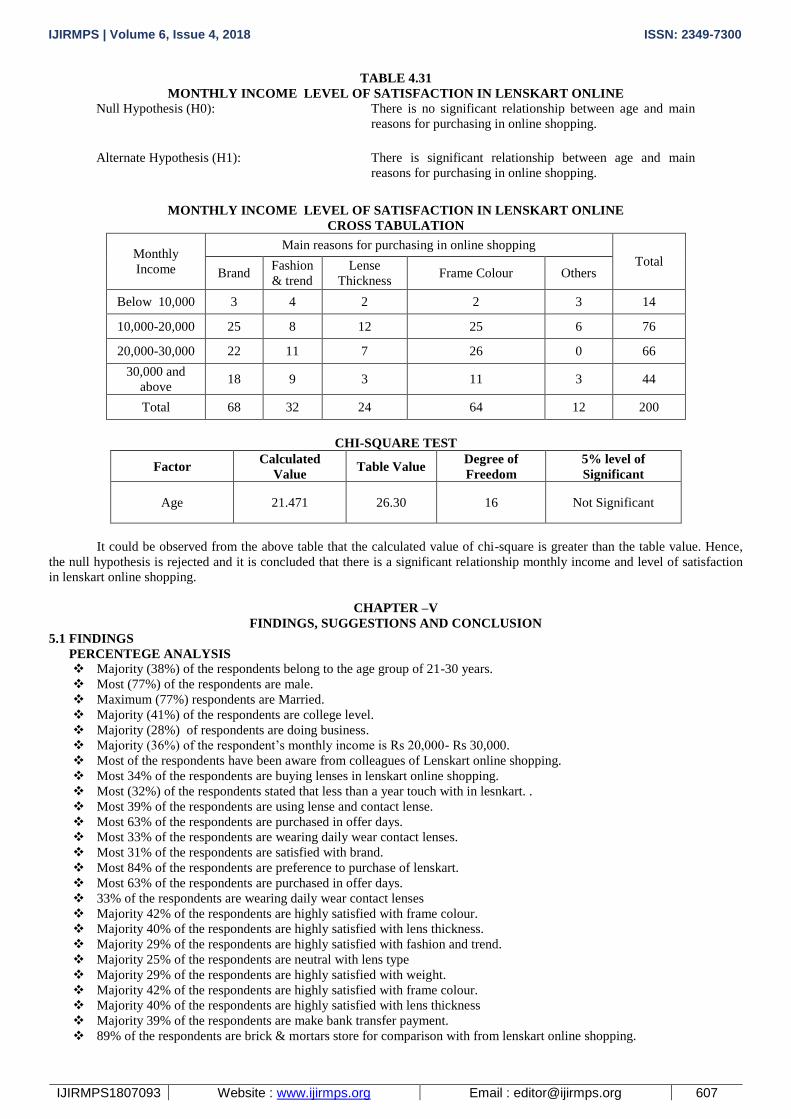
TABLE 4.31
MONTHLY INCOME LEVEL OF SATISFACTION IN LENSKART ONLINE
Null Hypothesis (H0): There is no significant relationship between age and main
reasons for purchasing in online shopping.
Alternate Hypothesis (H1): There is significant relationship between age and main
reasons for purchasing in online shopping.
MONTHLY INCOME LEVEL OF SATISFACTION IN LENSKART ONLINE
CROSS TABULATION
Monthly
Income
Main reasons for purchasing in online shopping
Total Brand
Fashion
& trend
Lense
Thickness Frame Colour Others
Below 10,000 3 4 2 2 3 14
10,000-20,000 25 8 12 25 6 76
20,000-30,000 22 11 7 26 0 66
30,000 and
above 18 9 3 11 3 44
Total 68 32 24 64 12 200
CHI-SQUARE TEST
Factor Calculated
Value Table Value
Degree of
Freedom
5% level of
Significant
Age 21.471 26.30 16 Not Significant
It could be observed from the above table that the calculated value of chi-square is greater than the table value. Hence,
the null hypothesis is rejected and it is concluded that there is a significant relationship monthly income and level of satisfaction
in lenskart online shopping.
CHAPTER –V
FINDINGS, SUGGESTIONS AND CONCLUSION
5.1 FINDINGS
PERCENTEGE ANALYSIS
Majority (38%) of the respondents belong to the age group of 21-30 years.
Most (77%) of the respondents are male.
Maximum (77%) respondents are Married.
Majority (41%) of the respondents are college level.
Majority (28%) of respondents are doing business.
Majority (36%) of the respondent’s monthly income is Rs 20,000- Rs 30,000.
Most of the respondents have been aware from colleagues of Lenskart online shopping.
Most 34% of the respondents are buying lenses in lenskart online shopping.
Most (32%) of the respondents stated that less than a year touch with in lesnkart. .
Most 39% of the respondents are using lense and contact lense.
Most 63% of the respondents are purchased in offer days.
Most 33% of the respondents are wearing daily wear contact lenses.
Most 31% of the respondents are satisfied with brand.
Most 84% of the respondents are preference to purchase of lenskart.
Most 63% of the respondents are purchased in offer days.
33% of the respondents are wearing daily wear contact lenses
Majority 42% of the respondents are highly satisfied with frame colour.
Majority 40% of the respondents are highly satisfied with lens thickness.
Majority 29% of the respondents are highly satisfied with fashion and trend.
Majority 25% of the respondents are neutral with lens type
Majority 29% of the respondents are highly satisfied with weight.
Majority 42% of the respondents are highly satisfied with frame colour.
Majority 40% of the respondents are highly satisfied with lens thickness
Majority 39% of the respondents are make bank transfer payment.
89% of the respondents are brick & mortars store for comparison with from lenskart online shopping.
IJIRMPS | Volume 6, Issue 4, 2018 ISSN: 2349-7300
IJIRMPS1807093 Website : www.ijirmps.org Email : [email protected] 608
42% of the respondents are visited 3-5 online stores.
29% of the respondents are highly satisfied with lens colour
74% of the respondents are recommend to lenskart product to others.
44% of the respondents are satisfied with lenskart online shopping
It is found from the analysis that maximum, service the major problem faced by the respondents.
It is found from the analysis that maximum respondents are influencing available offers.
CHI SQUARE TEST
It could be observed from the above table that the calculated value of chi-square is less than the table value. Hence, the
null hypothesis is accepted and it is concluded that there is no significant relationship between gender and level of
satisfaction in lenskart online shopping.
It could be observed from the above table that the calculated value of chi-square is greater than the table value. Hence,
the null hypothesis is rejected and it is concluded that there is a significant relationship marital status and level of
satisfaction in lenskart online shopping.
It could be observed from the above table that the calculated value of chi-square is greater than the table value. Hence,
the null hypothesis is rejected and it is concluded that there is a significant relationship monthly income and level of
satisfaction in lenskart online shopping.
5.2 SUGGESTIONS:
The fear of purchasing online by using a credit card would be reduced if the companies and different banks collaborate
and the banks maintain online accounts directly.
To boost the confidence of the existing and new online shoppers, the government should provide adequate legal frame
works to ensure strengthen measures are taken against people who indulge in online fraud
Most of the people other than students are not having awareness about online shopping; the website merchant should
take steps to create awareness among the public.
The online seller has to take maximum effort to offer the products with competitive price because the price of the
product plays a big role in purchase decision.
The online shopping website must be made known to consumers through different methods of advertisements.
The customers prefer the cash on delivery to make payment for their lenskart shopping but some of the products are not
coming with cash on delivery option. To improve the effectiveness of online shopping this issue must be addressed.
Considerable number of respondents facing some problems while shopping in online. This problem should be carefully
observed, analysed an settled.
5.3 CONCLUSION:
The internet is “anytime, anywhere” media and the expanding power of the internet has brought forth a new generation
of interaction platform between humans and computers. The current technological development with respect to the internet has
given rise to a new marketing system. The study brought to the fact that most of the online shoppers are students and educated
people who have a positive perception towards online shopping, Risk perceptions particularly concerns about online security, are
deterring many people from lenskart online shopping
BIBLIOGRAPHY
REFERENCES FROM BOOKS
Gupta, S.P., Statistical Methods,Sultan Chand & Sons Publisher, Third Edition,2011
Kothari,C.R., Research methodology-Methods & Techinques, New Delhi, age International (P) Ltd., Publisher,
Second edition,2009
Varma Agarwal., Marketing research, Forward Book Dept , 2010.
Kotler Philip., Marketing Management, PHI Pvt.Ltd., New Delhi, 2009
WEBSITES www.arno.unimass.nl/show.cgi?fid:2720
www.ibimapublishing.com