A Study on China’s Measures for the Decoupling of the ...
34
A Study on China’s Measures for the Decoupling of the Economic Growth and the Carbon Emission Rao Lei Gao Min Ref. 587904–EPP–1–2017–1-ES-EPPJMO-NETWORK Jean Monet Network EU-China: Comparative experiences and contributions to global governance in the fields of climate change, trade and competition Documento de Trabajo Serie Política de la Competencia y Regulación Número 61 / 2020
Transcript of A Study on China’s Measures for the Decoupling of the ...

Real Instituto Universitario de Estudios EuropeosUniversidad CEU San Pablo Avda. del Valle 21, 28003 MadridTeléfono: 91 514 04 22 | Fax: 91 514 04 [email protected], www.idee.ceu.es
A Study on China’s Measures for the Decoupling of the Economic Growth and the Carbon Emission
Rao LeiGao Min
Abstract: Since the reform and opening-up in 1978, China’s economy has been growing for decades. At the same time, the total energy consumption and carbon dioxide emissions are increasing, which cause the dual pressure of energy supply and ecological environment. With the development of technology, the adjustment of energy consumption structure, and the transformation and upgrading of industrial structure, China has put great efforts on the increasing of energy efficiency and decreasing of fossil energy consumption, which results in the decline of carbon intensity and the gradual decoupling of China’s economic growth and carbon emissions. It is significant to study the main reasons for the decoupling between China’s economic growth and carbon emissions, and to discuss the measures for the decoupling is momentous for exploring a green, low-carbon and sustainable development path for future in China.
Keywords: Decoupling; economic growth; emission; energy consumption.
ISBN: 978-84-17385-95-8 Ref. 587904–EPP–1–2017–1-ES-EPPJMO-NETWORK
Jean Monet Network EU-China: Comparative experiences and contributions to global governance in the fields of climate change, trade and competition
Partners of the Jean Monnet Network
Chinese Academy of Social Sciences Fudan University
University College London Université Catholique de Louvain
Documento de TrabajoSerie Política de la Competencia y RegulaciónNúmero 61 / 2020

Documento de Trabajo
Política de la Competencia y RegulaciónNúmero 61 / 2020
A Study on China’s Measures for the Decoupling of the Economic Growth and the Carbon Emission
Rao Lei*1, Gao Min2
1,2 School of Economics, Sichuan University, Chengdu 610065, Sichuan, China.
* Corresponding to: RAO Lei, School of economics, Sichuan University, No. 24, Section 1 South of first Ring Road, Chengdu 610065, Sichuan, China.

Serie Política de la Competencia y Regulación Documentos de Trabajo del Real Instituto Universitario de Estudios Europeos
A Study on China’s Measures for the Decoupling of the Economic Growth and the Carbon Emission
Cualquier forma de reproducción, distribución, comunicación pública o transformación de esta obra solo puede ser realizada con la autorización de sus titulares, salvo excepción prevista por la ley. Diríjase a CEDRO (Centro Español de Derechos Reprográficos, www.cedro.org) si necesita escanear algún fragmento de esta obra.
© 2020, Rao Lei, Gao Min© 2020, por Fundación Universitaria San Pablo CEU
CEU EdicionesJulián Romea 18, 28003 MadridTeléfono: 91 514 05 73, fax: 91 514 04 30Correo electrónico: [email protected]
Real Instituto Universitario de Estudios EuropeosAvda. del Valle 21, 28003 Madridwww.idee.ceu.es
ISBN: 978-84-17385-95-8Depósito legal: M-26147-2020
Maquetación: Gráficas Vergara, S. A.
El Real Instituto Universitario de Estudios Europeos de la Universidad CEU San Pablo, Centro Euro-peo de Excelencia Jean Monnet, es un centro de investigación especializado en la integración euro-pea y otros aspectos de las relaciones internacionales.
Los Documentos de Trabajo dan a conocer los proyectos de investigación originales realizados por los investigadores asociados del Instituto Universitario en los ámbitos histórico-cultural, jurídi-co-político y socioeconómico de la Unión Europea.
Las opiniones y juicios de los autores no son necesariamente compartidos por el Real Instituto Uni-versitario de Estudios Europeos.
Los documentos de trabajo están también disponibles en: www.idee.ceu.es

Contenido
1. INTRODUCTION ......................................................................................................................................... 5
2. LITERATURE REVIEW ................................................................................................................................. 5
3. THE DECOUPLING PROCESS OF CHINA’S ECONOMIC GROWTH AND CARBON EMISSION ......... 6
3.1. The decoupling turning of China’s economic growth and carbon emission ....................................6
3.1.1. China’s economic growth coupling the increasing growth rate of energy consumption ........6
3.1.2. China’s economic growth coupling with the slowdown growth rate of energy consumption .9
3.2. The causes for the decoupling of China’s economic growth and carbon emission .........................10
3.2.1. The decrease of carbon intensity as the most apparent cause ..................................................10
3.2.2. The energy saving and carbon reduction policies as the most important cause .....................11
4. THE MEASURES FOR THE DECOUPLING BY DECREASING CARBON INTENSITY IN CHINA ......... 12
4.1. The measures on energy-activities for the decrease of carbon intensity in China ..........................12
4.1.1. Adjustment of industrial structure to decrease carbon intensity..............................................12
4.1.2. Optimizing of Energy Structure to decrease carbon intensity ..................................................13
4.1.3. Improvement of energy efficiency to decrease carbon intensity ..............................................15
4.2. The measures on carbon reduction for the decrease of carbon intensity in China .........................16
4.2.1. China’s ETS as a significant measure for the carbon reduction ................................................16
4.2.2. China’s pilot ETS test providing successful experience for the implementation ....................17
4.2.3. EU-China cooperation in the emission reduction .....................................................................19
CONCLUSION ................................................................................................................................................... 20
BIBLIOGRAPHY ................................................................................................................................................ 21


Real Instituto Universitario de Estudios Europeos | 5
1. IntroductionChina’s economy has been developing at a continuously rate of the average annual growth rate of 9.36% since the economic reforms and open-door policies in 1978, which has become the fastest growing economy in the world. China’s GDP in 1978 was 367.87 billion yuan, which accounted for 1.8% of the world economy1, while in 2019, China’s GDP has exceeded 99 trillion yuan, which is expected to account for more than 16% of the world economy2. However, since the foundation of China’s national economy was weak and the economic development lagged far behind western developed countries at the time of 1978, China has started with the extensive economic growth mode based on the low level of technologies, resulting excessive energy consumption, causing the rapid increase of carbon dioxide emissions and environmental pollution from then on. As China has made considerable progress in the economic development and technologies, the awareness of energy saving and emission reduction has been gradually enhanced as well. At present, China is at a critical period of national economic development, accompanying with the reduction of the consumption of fossil energy and reducing carbon emissions.
As a big and responsible country, China has made a commitment to reduce carbon dioxide emissions per unit of GDP by 40% to 45% by 2020, based on the level of that in 2005, and has successfully fulfilled the commitment in advance. Then China has announced to reach the peak of CO
2 emissions at around 2030
and strive to achieve it even ahead of that time. Another commitment for 2030 is that the CO2 emissions
per unit of GDP in China is to be reduced by 60% to 65% than that in 20053. Therefore, it is significant to study the causes and the measures for the decoupling of China’s economic growth and carbon emissions to find out the more efficient measures for the further carbon reduction.
2. Literature reviewThe current study on the relationship between economic growth and carbon emissions focuses on the following aspects: firstly, using economic analysis tools to study the law between carbon emissions and economic growth Zhang (2013) has used environmental Kuznets curve (EKC) to analyze the relationship between per capita income and per capita CO
2 in the study of carbon emissions and economic growth in
Beijing. Via EKC hypothesis and the decoupling theory, Zhang et al. (2017) have found that the coordination of carbon emissions and economic growth between EU and other countries is very good, but in the developing countries, such as China and India, it needs to be strengthened. Qi (2018) has analyzed the fluctuation trend of the “expansion connection –weak decoupling– strong decoupling” between China’s economic growth and carbon emissions by using the decoupling model.
Secondly, by summarizing empirical data, analyzing empirically the relationship between economic growth and carbon emissions Wang (2010) has analyzed the relationship between energy consumption and economic growth in China, basing on the historical data from 1990 to 2007, and has pointed out that at certain stages, the economic growth and energy consumption can be in absolute decoupling or in relative decoupling. Peng et al. (2011) have has analyzed the relationship between carbon dioxide emissions and economic growth from a national or regional perspective, which shows a weak decoupling phenomenon in China then. Schandl (2016) has assessed the decoupling potential of economic growth and environmental pressure in 13 countries and regions around the world, and has found that OECD countries still have great potential to reduce carbon emissions and have little impact on economic growth.
As for the building of China’s emission trading scheme (ETS), it is based on the experience of EU ETS with the typical mode of Cap and Trade. Wang & Chen (2018) have has combed through the relevant policy development and the process of China’s carbon market building. They have analyzed the market performance and the performance of each pilot carbon market. Tian & Xu (2019) have summarized the
1 The 23th of series reports on the achievements of economic and social development in the 70th anniversary of the founding of the People’s Republic of China. National Bureau of Statistics of China: http://www.stats.gov.cn/
2 China’s economy in 2019. The State Council Information Office of the People’s Republic of China: http://www.scio.gov.cn/
3 China’s Energy Policy 2012. The State Council Information Office of the People’s Republic of China: http://www.scio.gov.cn/

6 | Real Instituto Universitario de Estudios Europeos
results of China’s carbon trading pilot and has put forward relevant policy recommendations considering the existing problems. Li et al. (2014) have has compared the operation mechanism and current situation of emission trading market at home and abroad, and has analyzed the transaction volume and transaction volume of the seven major carbon emission trading pilot areas in China to found out the root cause of the slow development of carbon emission trading market. Based on the development of global carbon market, Wang & Zhao (2019) have analyzed the research situation of carbon accounting, carbon quota and carbon pricing and have put forward corresponding countermeasures and suggestions for China’s national carbon market construction according to the research results and gaps.
The above-mentioned literatures mainly analyze the relationship between economic growth and carbon emissions through empirical analysis, but few studies the reasons for the decoupling of economic growth and carbon emissions from the internal relationship among the economic growth, energy consumption and carbon emissions. Therefore, it is significant to take the coupling relationship between energy consumption and economic growth as the starting point so as to have further explanation for the policies and measures which make China’s economic growth and carbon emission be decoupled through the reduction of carbon intensity.
3. The decoupling process of China’s economic growth and carbon emissionChina has become a middle-income country since 2012 and has become the world’s second largest economy after the United States. As China’s economic development continues, the quality and the efficiency of the economic development are taken into consideration with keen interest. For a couple of decades, China has been trying to find a green and low-carbon development mode consistent with the national conditions to decouple the economic growth from the carbon emissions. As the carbon emissions mainly depends on energy consumption structure and energy efficiency, on the premise of unchanged energy consumption structure, the larger energy consumption means the more carbon emission, and the higher the energy efficiency, the lower the carbon intensity. Therefore, China takes energy consumption as the breakthrough point and gradually realizing the decoupling of the carbon emissions from the economic growth by optimizing energy structure and improving energy efficiency.
3.1. The decoupling turning of China’s economic growth and carbon emission
3.1.1. China’s economic growth coupling the increasing growth rate of energy consumption
China’s GDP has shown a rapid growth trend from 1978 (the beginning of the reforms) to 2019. In the period of the early stage of the reforms and opening-up, the economic growth has the priority and the extensive and high-speed growth is characterized by “high energy consumption and high pollution” which lead to various environmental problems. The growth of GDP means the increasing consumption of energy. The dual effects of industrialization and urbanization cause the energy consumption and carbon emission increasing rapidly, which make China become the world’s top energy consumer and carbon dioxide emitter, accounting for nearly 30% of global emissions although China’s per capita carbon emission is still at a low level4.
It can be seen from Fig. 1 that over the past 40 years, China’s energy consumption has increased with the increase of economic aggregate, especially before 2008. Although China’s economic development has made remarkable achievements, the rapid growth trend of energy consumption should be eased.
4 Shan, Y.; Guan, D. et al. China CO2 emission accounts 1997–2015. Sci Data 5,170201 (2018): https://doi.org/10.1038/sdata.2017.201

Real Instituto Universitario de Estudios Europeos | 7
Figure 1. The trend of GDP growth and energy consumption growth in China 1978-2019
Data source: National Bureau of Statistics of China
Fig. 2 shows that since 1978, with the development of China’s industry and the advancement of urbanization, the total energy consumption has increased year by year and exceeded the total energy production in early 1990s. As China’s economic growth has increased continuously together with that of the energy consumption, it brings about the increase of carbon emission since 1978.
Since 2000, due to the rising proportion of manufacture in the national economy, China’s growth rate of energy consumption is much higher than that of energy production. Until the “12th Five Year Plan” period of 2011-2015, China has emphasized the transformation of energy development mode and the adjustment of energy structure as well, resulting in the slowdown of the growth rate of total energy consumption and total energy production, although the energy production and consumption have picked up a bit since 2017.
Figure 2. China’s energy production and consumption from 1978 to 2019
8
Figure 2 China’s energy production and consumption from 1978 to 2019
Data source: National Bureau of Statistics of China.
The following is the global carbon emissions ranking (Table 1) in 2018. Only the top 7
countries and regions are selected here. The data in the table shows that in 2018, the global
carbon emission is 33890.8 million tons, while China as a developing country with rapid
economic development and the world’s largest carbon emitter, the carbon emission is 9428.7
million tons, which accounts for 28% of the world’s total carbon emission and is 1.8 times than
that of the second ranked United States and 2.7 times than that of the third ranked EU. However,
as for the per capita carbon emission, it is 6.7 tons in China, which is lower than that of the
developed countries such as the US (14.6 tons), Japan (8.9 tons) and Germany (8.7 tons)5. Table 1 Ranking of global carbon emissions for 2018
Data source: BP Statistical Review of World Energy (2019)
The main reason for the continuous increase of carbon emissions in China is the increase
5 BP Statistical Review of World Energy (2019): https://www.bp.com/zh_cn/china/
0
100000
200000
300000
400000
500000
600000
197819801982198419861988199019921994199619982000200220042006200820102012201420162018
Total energy production Total energy consumption
Country Total CO2
emissions (Mt)
Proportion of global
carbon emission (%)
CO2 emissions
per capita (t)
World 33890.8 1 4.4
China 9428.7 0.28 6.7
United States 5145.2 0.15 14.6
EU 3479.3 0.10 6.3
India 2479.1 0.07 1.6
Russia 1550.8 0.05 10.6
Japan 1148.4 0.02 8.9
Germany 725.7 0.02 8.7
Data source: National Bureau of Statistics of China
7
level4.
It can be seen from Fig.1 that over the past 40 years, China’s energy consumption has
increased with the increase of economic aggregate, especially before 2008. Although China’s
economic development has made remarkable achievements, the rapid growth trend of energy
consumption should be eased.
Figure 1 The trend of GDP growth and energy consumption growth in China 1978-2019
Data source: National Bureau of Statistics of China.
Fig.2 shows that since 1978, with the development of China’s industry and the
advancement of urbanization, the total energy consumption has increased year by year and
exceeded the total energy production in early 1990s. As China’s economic growth has increased
continuously together with that of the energy consumption, it brings about the increase of
carbon emission since 1978.
Since 2000, due to the rising proportion of manufacture in the national economy, China’s
growth rate of energy consumption is much higher than that of energy production. Until the
“12th Five Year Plan” period of 2011-2015, China has emphasized the transformation of energy
development mode and the adjustment of energy structure as well, resulting in the slowdown
of the growth rate of total energy consumption and total energy production, although the energy
production and consumption have picked up a bit since 2017.
4 Shan, Y., Guan, D. et al. China CO2 emission accounts 1997–2015. Sci Data 5,170201 (2018): https://doi.org/10.1038/sdata.2017.201
0
200000
400000
600000
800000
1000000
1200000
197819801982198419861988199019921994199619982000200220042006200820102012201420162018
GDP Energy consumption

8 | Real Instituto Universitario de Estudios Europeos
The following is the global carbon emissions ranking (Table 1) in 2018. Only the top seven countries and regions are selected here. The data in the table shows that in 2018, the global carbon emission is 33,890.8 million tons, while China as a developing country with rapid economic development and the world’s largest carbon emitter, the carbon emission is 9,428.7 million tons, which accounts for 28% of the world’s total carbon emission and is 1.8 times than that of the second ranked United States and 2.7 times than that of the third ranked EU. However, as for the per capita carbon emission, it is 6.7 tons in China, which is lower than that of the developed countries such as the US (14.6 tons), Japan (8.9 tons) and Germany (8.7 tons)5.
Table 1. Ranking of global carbon emissions for 2018
Country Total CO2 emissions (Mt)Proportion of global carbon emission (%)
CO2 emissions per capita (t)
World 33,890.8 1 4.4
China 9,428.7 0.28 6.7
United States 5,145.2 0.15 14.6
EU 3,479.3 0.10 6.3
India 2,479.1 0.07 1.6
Russia 1,550.8 0.05 10.6
Japan 1,148.4 0.02 8.9
Germany 725.7 0.02 8.7
Data source: BP Statistical Review of World Energy (2019)
The main reason for the continuous increase of carbon emissions in China is the increase of the huge consumption of fossil energy. China is rich in coal but poor in oil and gas. Such characteristics of the natural resource endowments determine that the primary energy consumption structure is dominated by coal which may cause more emissions than oil and gas.
Since 1978, China’s total carbon emissions show an overall upward trend, which are showed in Fig. 3. The carbon emissions before 1995 have showed a relatively uniform growth trend, but after 1995, they are more diverse. The carbon emissions from 1995 to 2018 can be divided into three dynamic stages: firstly, from 1995 to 2001, the total carbon emissions increase slowly from 3,029 million tons to 3,525 million tons, with a growth rate of only 16.37%; secondly, from 2002 to 2011, it is a period of a rapid growth from 3,845 million tons to 8,805 million tons, with a growth rate of 129%; thirdly, from 2012 to 2018, the growth rate slows down to 4.9% and the total carbon emissions just increase from 8,991 million tons to 9,428 million tons, and even with a slightly drop down in 20136.
The causes for the dynamic changes of the carbon emission are closely related to the development of China’s economy and the macro-control of the government. Before 2000, China’s economy had developed more slowly with less energy consumption increase and less carbon emission increase. Since the accession to WTO in 2001, China’s economy has developed rapidly. The GDP has increased from 12 trillion yuan in 2002 to 47.2 trillion yuan in 20117. As the economic growth mainly depends on the increase of the output value of the second industry, which causes a sharp increase of the energy consumption and then leads to a rocket-up in carbon emission.
The turning point of China’s carbon emission comes as China’s energy saving and emission reduction policies have been successively introduced in line with the “Common but Differentiated Responsibilities” for the emission reduction. Since 2011, China has started to carry out carbon emission pilots, to establish voluntary emission reduction mechanism, and to deploy comprehensively the key emission reduction plan. From then on, the carbon emissions have been controlled with a relatively stable growth trend.
5 BP Statistical Review of World Energy (2019): https://www.bp.com/zh_cn/china/
6 BP Statistical Review of World Energy (2019): https://www.bp.com/zh_cn/china/
7 National Bureau of Statistics of China: http://www.stats.gov.cn/
Real Instituto Universitario de Estudios Europeos | 9
Figure 3. Total carbon emissions in China from 1978 to 2018
10
Figure 3 Total carbon emissions in China from 1978 to 2018
Data source: BP Statistical Review of World Energy (2019)
3.1.2 China’s economic growth coupling with the slowdown growth rate of energy
consumption
Energy is one of the basic elements of production, and the growth rate of energy
consumption is often used as an important indicator to judge the economic situation. However,
as the industrial structure and energy structure are constantly changing, the progress of science
and technology and the improvement of energy efficiency result in the gradual decoupling of
economic growth and energy consumption. As can be seen from Fig.4, in recent years, China’s
economic growth and energy consumption have achieved a slight decoupling. During the 11th
Five Year Plan (2006-2010) and the 12th Five Year Plan (2011-2015), China has taken a variety
of energy saving and emission reduction measures so that the growth rate of energy
consumption has slowed down notably. With the adjustment of China’s industrial structure and
the transformation of economic growth mode, the energy consumption from 2013 has declined
significantly.
0
1000
2000
3000
4000
5000
6000
7000
8000
9000
10000
1978
1980
1982
1984
1986
1988
1990
1992
1994
1996
1998
2000
2002
2004
2006
2008
2010
2012
2014
2016
2018
CO2 emission(in million tonnes)
Data source: BP Statistical Review of World Energy (2019)
3.1.2. China’s economic growth coupling with the slowdown growth rate of energy
consumption
Energy is one of the basic elements of production, and the growth rate of energy consumption is often used as an important indicator to judge the economic situation. However, as the industrial structure and energy structure are constantly changing, the progress of science and technology and the improvement of energy efficiency result in the gradual decoupling of economic growth and energy consumption. As can be seen from Fig.4, in recent years, China’s economic growth and energy consumption have achieved a slight decoupling. During the 11th Five Year Plan (2006-2010) and the 12th Five Year Plan (2011-2015), China has taken a variety of energy saving and emission reduction measures so that the growth rate of energy consumption has slowed down notably. With the adjustment of China’s industrial structure and the transformation of economic growth mode, the energy consumption from 2013 has declined significantly.
Figure 4. GDP growth rate and energy growth rate in China
11
Figure 4 GDP growth rate and energy growth rate in China
Data source: National Bureau of Statistics of China.
It is shown in Fig. 4 that China keeps an increasing growth rate of GDP in the recent
decades, but the energy production growth rate drops down obviously in recent years.
Meanwhile, as the economic development goes hand in hand with the improvement of people’s
living standard, the demand for energy consumption also grows in China. However, due to the
improvement of energy utilization, the carbon emission per unit GDP, in other words the carbon
intensity, is continuously reduced. Although China’s economic growth and energy consumption
have not yet achieved a strong decoupling, as the increasing contribution of the tertiary industry
in the proportion of GDP, the adjustment of the energy structure for less fossil fuels especially
for less coal, and the improvement of energy efficiency, China is striving to peak the greenhouse
gas emissions by 2030 or even earlier. The significant contribution of the decreasing carbon
intensity is remarkable for China’s low-carbon development.
3.2 The causes for the decoupling of China’s economic growth and carbon
emission
3.2.1 The decrease of carbon intensity as the most apparent cause
The most apparent cause for decoupling economic growth from carbon emissions in China
is the decrease of carbon intensity which mainly due to the reduction of energy consumption
and improvement of energy efficiency. The carbon emission intensity index, which reflects the
-10
-5
0
5
10
15
20
2005 2006 2007 2008 2009 2010 2011 2012 2013 2014 2015 2016
growth rate of GDP (%) growth rate of energy production (%) growth rate of energy consumption(%)
Data source: National Bureau of Statistics of China
It is shown in Fig. 4 that China keeps an increasing growth rate of GDP in the recent decades, but the energy production growth rate drops down obviously in recent years. Meanwhile, as the economic development goes hand in hand with the improvement of people’s living standard, the demand for energy consumption also grows in China. However, due to the improvement of energy utilization, the carbon emission per unit GDP, in other words the carbon intensity, is continuously reduced. Although China’s economic growth
10 | Real Instituto Universitario de Estudios Europeos
and energy consumption have not yet achieved a strong decoupling, as the increasing contribution of the tertiary industry in the proportion of GDP, the adjustment of the energy structure for less fossil fuels especially for less coal, and the improvement of energy efficiency, China is striving to peak the greenhouse gas emissions by 2030 or even earlier. The significant contribution of the decreasing carbon intensity is remarkable for China’s low-carbon development.
3.2. The causes for the decoupling of China’s economic growth and carbon emission
3.2.1. The decrease of carbon intensity as the most apparent cause
The most apparent cause for decoupling economic growth from carbon emissions in China is the decrease of carbon intensity which mainly due to the reduction of energy consumption and improvement of energy efficiency. The carbon emission intensity index, which reflects the resource utilization efficiency and carbon emission efficiency in the process of economic development, can reflect the level of technology efficiency in the production of a country or region. According to China’s Intended Nationally Determined Contributions (INDC) submitted to the Secretariat of the United Nations Framework Convention on climate change at the world climate conference in 2015, China has committed that the carbon intensity by 2030 is to be 60%-65% lower than that in 2005. In order to achieve this goal, China has accelerated the green and low-carbon transformation. China’s climate actions provide a solid base for the global goal of temperature control of 2℃8.
China’s goal for reducing carbon intensity is clear and determined and it is correlated with the plans for the economic development in the country. It also shows China’s efforts to cope with global governance of climate change and China’s determination to improve the mode of economic development by reducing energy consumption, developing green economy, and taking on the sustainable development in the production and the low-carbon life style of the people.
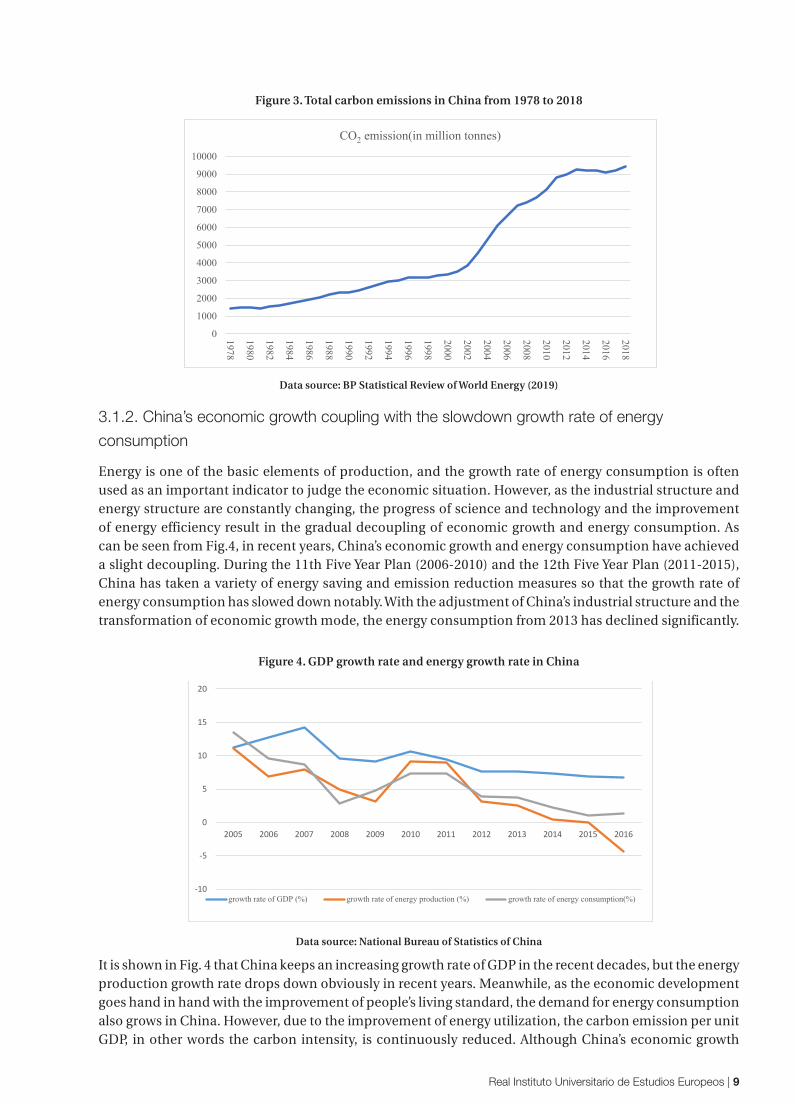
Table 2. Global carbon intensity change in 2014-2018
Country 2014-2015 Country 2015-2016 Country 2016-2017 Country 2017-2018
World -2.8% World -2.6% World -2.6% World -1.6%
China -6.4% UK -7.7% China -5.2% Germany -6.5%
UK -6.0% China -6.5% Mexico -5.0% Mexico -5.2%
US -4.7% Mexico -4.6% Argentina -4.9% France -4.2%
South Africa -4.5% Australia -3.8% UK -4.7% Italy -4.0%
Mexico -4.4% Brazil -3.8% Brazil -4.5% Saudi Arabia -4.0%
Canada -4.2% US -3.4% US -3.7% China -3.9%
Japan -2.7% Japan -2.4% South Africa -3.6% EU -3.7%
Turkey -2.6% Canada -2.1% Germany -2.8% Brazil -3.5%
India -2.0% Russia -1.7% India -2.5% UK -3.5%
Korea -1.4% EU -1.7% Australia -1.8% Japan -3.0%
Data source: Price Waterhouse Coopers
Table 2 shows the data by PwC (Price Waterhouse Coopers) of the global carbon intensity changes in 2014-2018 as well as the top 10 countries in terms of carbon intensity reduction. From 2014 to 2015, as the global carbon emission intensity decreasing by 2.8%, China ranked first with a decline rate at 6.4%, and in the following two years, kept the rate at 6.5% and 5.2%. However, by 2017-2018, China dropped to the sixth
8 Enhanced Actions on Climate Change: China’s Intended Nationally Determined Contributions. The State Council Information Office of the People’s Republic of China: http://www.scio.gov.cn/
Real Instituto Universitario de Estudios Europeos | 11
place with the carbon intensity decreasing rate at 3.9%9. The decline of the decreasing rate for China’s carbon intensity since 2017 is caused firstly by the smooth growth of the macro-economy in China which leads to the coal consumption growing continuously; secondly by the instability of alternative non fossil energy. Since the hydropower generation was affected by the fluctuation of incoming water, the power generation capacity was reduced by 4.2% in 2017, and at the same time, the instability of wind power generation led to an increase of 7.1% in thermal power generation and an increase in coal consumption of more than 70 million tons10; thirdly, by the declining trend of emissions, China’s carbon emissions have been continuously in a fast-declining trend, but it would inevitably come across the bottleneck in the process of decline, because there are many factors which may influence the speed of carbon intensity decline so that it would be difficult to maintain the high-speed decline all the time; fourthly by the cyclical recovery of the global industrial production. Since the decline of energy intensity and carbon intensity can hardly be offset with the growth of population and that of the per capita income, especially in the year of 2017, hence the increase of carbon emissions; fifthly by the continuous promotion of energy saving and emission reduction in the previous years, which has been hindered for it is difficult to furtherly stimulate the reduction of carbon emissions with the measures already in use. Therefore, it is urgently demanded to have creative methodologies and innovative measures for further emission reduction in China.
3.2.2. The energy saving and carbon reduction policies as the most important cause
Since 1978, China’s total carbon emissions have continuously increased, because China’s economic development depends a lot on the manufacture which causes the increase of energy consumption. However, due to the policies and the measures for energy saving and emission reduction, China has made great improvement in decreasing the energy intensity and increasing the energy efficiency.
In November 1997, the first Energy Conservation Law of the People’s Republic of China has been passed by the National People’s Congress, which has been implemented since 1998. With the implementation of the law, a series of energy saving policies and regulations related to industry, construction, transportation, and end products have been issued later, promoting the overall improvement of energy saving and energy efficiency. In August 2004, China’s National Development and Reform Commission and the General Administration of Quality Supervision have jointly formulated and issued the measures for the administration of energy efficiency labeling. From then on, China’s energy efficiency labeling system has been established with a great significance to improve the energy efficiency for the energy consuming equipments and to improve the consumers’ awareness of energy saving. In addition, energy saving and emission reduction are closely related to the implementation of the policies for industrial structure adjustment.
Because of implementing the policies to promote energy saving and emission reduction, China’s energy efficiency, as an example, is getting more and more efficient and the energy intensity is getting lower and lower. As can be seen from Fig. 5, China’s energy intensity has greatly decreased since 1990.
9 The Paris Agreement: a turning point? The low carbon economy index 2016-2019. Price Waterhouse Coopers: https://www.pwccn.com/
10 National Bureau of Statistics of China: http://www.stats.gov.cn/

12 | Real Instituto Universitario de Estudios Europeos
Figure 5. Trends of energy intensity in China from 1990 to 2019
14
Development and Reform Commission and the General Administration of Quality Supervision
have jointly formulated and issued the measures for the administration of energy efficiency
labeling. From then on, China’s energy efficiency labeling system has been established with a
great significance to improve the energy efficiency for the energy consuming equipments and
to improve the consumers’ awareness of energy saving. In addition, energy saving and emission
reduction are closely related to the implementation of the policies for industrial structure
adjustment.
Because of implementing the policies to promote energy saving and emission reduction,
China’s energy efficiency, as an example, is getting more and more efficient and the energy
intensity is getting lower and lower. As can be seen from Fig. 5, China’s energy intensity has
greatly decreased since 1990.
Figure 5 Trends of energy intensity in China from 1990 to 2019
Data source: National Bureau of Statistics of China.
4. The measures for the decoupling by decreasing carbon intensity in
China
The decrease of carbon intensity in China is the most apparent reason to achieve the goal
for the decoupling of China’s economic growth and carbon emissions, which mainly depends
on the reduction of energy intensity, the improvement of energy productivity and energy
0,00
1,00
2,00
3,00
4,00
5,00
6,00
1990
1991
1992
1993
1994
1995
1996
1997
1998
1999
2000
2001
2002
2003
2004
2005
2006
2007
2008
2009
2010
2011
2012
2013
2014
2015
2016
2017
2018
2019
Energy intensity
Data source: National Bureau of Statistics of China
4. The measures for the decoupling by decreasing carbon intensity in ChinaThe decrease of carbon intensity in China is the most apparent reason to achieve the goal for the decoupling of China’s economic growth and carbon emissions, which mainly depends on the reduction of energy intensity, the improvement of energy productivity and energy efficiency. Therefore, it is significant to study the measures taken to reduce the carbon intensity in China from the perspectives of energy activities and carbon emission reduction.
4.1. The measures on energy-activities for the decrease of carbon intensity in China
4.1.1. Adjustment of industrial structure to decrease carbon intensity
In the past four decades, China’s rapid economic development is a coin with two sides, and the backward side shows a series of problems as the acceleration of resource consumption, pollution, and emission and so on. The problems are closely related to the characteristics of China’s industrial structure: the continuously increase of manufacture which causes more energy and resource consumption. In recent decades, China’s industrial structure has been constantly adjusted. An important feature as China’s economy entering the “new normal” stage is to emphasize the importance of continuous optimization and upgrading of economic structure. In the 13th five-year plan released in 2015, the government’s work has focused on transforming the mode of economic development, adjusting, and optimizing the industrial structure to achieve sustainable economic development.
As energy saving and emission reduction are closely related to economic development, which are inseparable from industrial restructuring and promoting the upgrading of the industrial structure, changing the mode of economic development have become the main theme of China’s economic and social development. China has adopted the industrial restructuring measures include upgrading traditional industries, accelerating the development of emerging industries, closing backward production capacity, and reducing production in energy intensive industries. The increasing growth rate of tertiary industry, which exceeds the second industry from 2014 on11, is a good way to show the decrease of the carbon intensity by adjusting the industrial structure in China.
11 National Bureau of Statistics of China: http://www.stats.gov.cn/

Real Instituto Universitario de Estudios Europeos | 13
Figure 6. Changes in the growth rate of the industries
16
Figure 6 changes in the growth rate of the industries
Data source: China Statistical Yearbook 2015-2019 Fig.6 shows the development and changes of the industrial structure of China in 2014-
2017. The first industry keeps at a lower growth rate and has a declining trend, and the second
industry keeps at a higher growth rate as 7.3% in 2014, but declines to 5.8% in 2017. However,
the service (or tertiary) industry has developed more rapidly, which surpasses the second
industry for years. As the proportion of tertiary industry consists more in the GDP, China’s
industrial structure is to be greener and the carbon intensity is decreasing12.
4.1.2 Optimizing of Energy Structure to decrease carbon intensity
The optimization of energy structure demands the reasonable proportion of all kinds of
energy in the total energy consumption in which the proportion of fossil energy consumption
should not be too large. It could be diverse for different countries with different economic
conditions so that countries may optimize the energy structure in accordance with their own
resources and technologies to effectively achieve energy saving and carbon emission reduction.
At the background of low-carbon economy, China’s measures for optimizing energy structure
includes: imposing strict control over the growth of total energy consumption, especially that
of coal and oil which are the high-carbon energy; promoting the clean utilization of fossil fuel
and the development of non-fossil energy. In fig.7, it can be seen that China’s total energy
consumption is growing and the coal dominates the biggest proportion in the energy
consumption structure. However, since 2013, China’s total coal consumption has declined, and
12 National Bureau of Statistics of China: http://www.stats.gov.cn/
4,1% 3,9% 3,9%3,5%
7,3%
6,1% 6,1% 5,8%
7,8%8,3% 8,0%
7,6%
0,0%
1,0%
2,0%
3,0%
4,0%
5,0%
6,0%
7,0%
8,0%
9,0%
2014 2015 2016 2017
primary industry secondary industry service industry
Data source: China Statistical Yearbook 2015-2019
Fig. 6 shows the development and changes of the industrial structure of China in 2014-2017. The first industry keeps at a lower growth rate and has a declining trend, and the second industry keeps at a higher growth rate as 7.3% in 2014, but declines to 5.8% in 2017. However, the service (or tertiary) industry has developed more rapidly, which surpasses the second industry for years. As the proportion of tertiary industry consists more in the GDP, China’s industrial structure is to be greener and the carbon intensity is decreasing12.
4.1.2. Optimizing of Energy Structure to decrease carbon intensity
The optimization of energy structure demands the reasonable proportion of all kinds of energy in the total energy consumption in which the proportion of fossil energy consumption should not be too large. It could be diverse for different countries with different economic conditions so that countries may optimize the energy structure in accordance with their own resources and technologies to effectively achieve energy saving and carbon emission reduction. At the background of low-carbon economy, China’s measures for optimizing energy structure includes: imposing strict control over the growth of total energy consumption, especially that of coal and oil which are the high-carbon energy; promoting the clean utilization of fossil fuel and the development of non-fossil energy. In Fig. 7, it can be seen that China’s total energy consumption is growing and the coal dominates the biggest proportion in the energy consumption structure. However, since 2013, China’s total coal consumption has declined, and the proportion of coal consumption in the total energy consumption has declined, which makes the energy structure be optimized with the decrease of heavy emission by coal.
12 National Bureau of Statistics of China: http://www.stats.gov.cn/
Primary Industry Secondary Industry Service Industry

14 | Real Instituto Universitario de Estudios Europeos
Figure 7. Total energy consumption and coal consumption of China
17
the proportion of coal consumption in the total energy consumption has declined, which makes
the energy structure be optimized with the decrease of heavy emission by coal.
Figure 7 Total energy consumption and coal consumption of China
Data source: National Bureau of Statistics of China.
Traditionally, coal is used for urban heating in China, and the heating has caused a lot of
coal consumption and carbon emissions especially in the cold north part of the country. In order
to promote the clean use of fossil fuels, it is a good way to reduce the amount of coal
consumption for household heating and to increase the proportion of electricity-producing coal.
As the thermal power generation plants equipped with higher level of technologies and the
modern equipment, they can be more efficient to make clean use of the coal and produce more
coal-fired power to support the transformation project from “coal to electricity” for household
heating. By 2018, China has completed the project for 2.74 million households, decreasing the
end consumption of coal scattering around.
Another way to optimize the energy structure is to increase the supply of oil and gas to
replace the higher-carbon coal consumption. The household heating project of transforming
from “coal to natural gas” is a good example for the optimization. More than 2 million
households have turned from “coal to natural gas” for heating by 2018 in China, decreasing the
bulk coal consumption in order to have the emission reduction13.
Gradually, as reducing the dependence on fossil energy and increasing the utilization of
13 Ministry of Ecology and Environment of People’s Republic of China.
0,5
0,55
0,6
0,65
0,7
0,75
0
50000
100000
150000
200000
250000
300000
350000
400000
450000
500000
2001
2002
2003
2004
2005
2006
2007
2008
2009
2010
2011
2012
2013
2014
2015
2016
2017
2018
Total energy consumption(ten thousand ton standard coal)
Total coal consumption(ten thousand ton standard coal)
The proportion of coal in the energy consumption(%)
Data source: National Bureau of Statistics of China
Traditionally, coal is used for urban heating in China, and the heating has caused a lot of coal consumption and carbon emissions especially in the cold north part of the country. In order to promote the clean use of fossil fuels, it is a good way to reduce the amount of coal consumption for household heating and to increase the proportion of electricity-producing coal. As the thermal power generation plants equipped with higher level of technologies and the modern equipment, they can be more efficient to make clean use of the coal and produce more coal-fired power to support the transformation project from “coal to electricity” for household heating. By 2018, China has completed the project for 2.74 million households, decreasing the end consumption of coal scattering around.
Another way to optimize the energy structure is to increase the supply of oil and gas to replace the higher-carbon coal consumption. The household heating project of transforming from “coal to natural gas” is a good example for the optimization. More than 2 million households have turned from “coal to natural gas” for heating by 2018 in China, decreasing the bulk coal consumption in order to have the emission reduction13.
Gradually, as reducing the dependence on fossil energy and increasing the utilization of non-fossil energy, the renewable energy and even some new clean energy are to consist of more in the energy supply system to achieve the coordinated and sustainable development of economy, environment, and resources. Fig. 8 shows the upward trend for the proportion of non-fossil energy sources in the primary energy consumption in China.
13 Ministry of Ecology and Environment of People’s Republic of China.

Real Instituto Universitario de Estudios Europeos | 15
Figure 8. The percentages of non-fossil energy sources in the primary energy consumption in China
18
non-fossil energy, the renewable energy and even some new clean energy are to consist of more
in the energy supply system to achieve the coordinated and sustainable development of
economy, environment, and resources. Fig. 8 shows the upward trend for the proportion of non-
fossil energy sources in the primary energy consumption in China.
Figure 8 The percentages of non-fossil energy sources in the primary energy consumption in China
Data source: China Statistical Yearbook 2019
China is increasing the proportion of non-fossil energy in the total primary energy
consumption to about 15% by 2020, and about 20% by 2030. As shown in Fig. 8, since 2005,
the proportion of non-fossil energy consumption in China has basically maintained an upward
trend with a slightly decline in 2011. Then it has been on a rapid upward trend since 2012 and
reached 14.3% in 201814. As China’s total energy consumption in 2019 has grown at a low
speed, the energy consumption and energy structure have continued to be cleaner and more
efficient. Therefore, the target of 15% of non-fossil energy consumption in 2020 can be
achieved apparently, which may contribute to the decrease of the carbon intensity in China.
4.1.3 Improvement of energy efficiency to decrease carbon intensity
Since the promulgation of Energy Conservation Law of the People’s Republic of China in
1998, the implementation of energy saving measures has been guaranteed by the law. China has
taken reducing energy intensity as a binding indicator and implemented strict annual assessment
since 2006. Fig.9 shows that between 1998 and 2002, China’s energy consumption intensity,
defined as energy consumption per unit of GDP, falls by an average of 2.5%. From 2003 to
14 National Bureau of Statistics of China: http://www.stats.gov.cn/
7,4 7,4 7,58,4 8,5
9,48,4
9,7 10,211,3
12,113,3 13,8 14,3
0
2
4
6
8
10
12
14
16
2005 2006 2007 2008 2009 2010 2011 2012 2013 2014 2015 2016 2017 2018
Data source: China Statistical Yearbook 2019
China is increasing the proportion of non-fossil energy in the total primary energy consumption to about 15% by 2020, and about 20% by 2030. As shown in Fig. 8, since 2005, the proportion of non-fossil energy consumption in China has basically maintained an upward trend with a slightly decline in 2011. Then it has been on a rapid upward trend since 2012 and reached 14.3% in 201814. As China’s total energy consumption in 2019 has grown at a low speed, the energy consumption and energy structure have continued to be cleaner and more efficient. Therefore, the target of 15% of non-fossil energy consumption in 2020 can be achieved apparently, which may contribute to the decrease of the carbon intensity in China.
4.1.3. Improvement of energy efficiency to decrease carbon intensity
Since the promulgation of Energy Conservation Law of the People’s Republic of China in 1998, the implementation of energy saving measures has been guaranteed by the law. China has taken reducing energy intensity as a binding indicator and implemented strict annual assessment since 2006. Fig. 9 shows that between 1998 and 2002, China’s energy consumption intensity, de℃ned as energy consumption per unit of GDP, falls by an average of 2.5%. From 2003 to 2004, while China’s economy grows significantly, the intensity of energy consumption has increased. In this regard, the government quickly makes corresponding adjustments, and has issued and implemented a series of energy efficiency policies to save energy, reduce emissions, improve quality, and increase efficiency. Since 2005, China’s energy intensity has continuously declined, with energy intensity falling by 39.8% from 1.08 tce/ten thousand CNY (2010 CNY) in 2005 to 0.65 tce/ten thousand CNY (2010 CNY) in 201715. As the economy continues to grow steadily, China’s total energy consumption has shown an overall growth trend over the last decade. However, due to a series of energy savings measures, China’s energy intensity has declined, resulting in a slow-down growth rate of total energy consumption.
14 National Bureau of Statistics of China: http://www.stats.gov.cn/
15 Energy Efficiency China 2018. China Council for an Energy E℃cient Economy: http://www.cceee.org.cn/class/view?id=38

16 | Real Instituto Universitario de Estudios Europeos
Figure 9. Energy Consumption and Intensity in China (1978-2017)
19
2004, while China’s economy grows significantly, the intensity of energy consumption has
increased. In this regard, the government quickly makes corresponding adjustments, and has
issued and implemented a series of energy efficiency policies to save energy, reduce emissions,
improve quality, and increase efficiency. Since 2005, China’s energy intensity has continuously
declined, with energy intensity falling by 39.8% from 1.08 tce/ten thousand CNY ( 2010 CNY)
in 2005 to 0.65 tce/ten thousand CNY (2010 CNY) in 201715. As the economy continues to
grow steadily, China’s total energy consumption has shown an overall growth trend over the
last decade. However, due to a series of energy savings measures, China’s energy intensity has
declined, resulting in a slow-down growth rate of total energy consumption.
Figure 9 Energy Consumption and Intensity in China (1978-2017)
Data source: The Energy Efficiency Report of China 2018
In addition, since the implementation of the energy efficiency labeling system in 2005, the
energy efficiency labeling system has covered 33 kinds of energy consumption products,
involving more than 9000 enterprises and more than 900 testing institutions, and has achieved
more than 441.9 billion-kilowatt hour energy-saving results. The system has effectively
guaranteed the energy efficiency improvement of energy consumption products in China, and
promoted the development of national energy saving and emission reduction. It is estimated
that by 2020, the implementation the system is to save 277.5 TWH of electric power, 129
million tons of standard coal and more than 110 million tons of carbon emissions16.
15 Energy Efficiency China 2018. China Council for an Energy Efficient Economy: http://www.cceee.org.cn/class/view?id=38 16 The 10th Anniversary Seminar of Energy Efficiency Labeling System. National Development and Reform Commission: https://www.ndrc.gov.cn/
Data source: The Energy Efficiency Report of China 2018
In addition, since the implementation of the energy efficiency labeling system in 2005, the energy efficiency labeling system has covered 33 kinds of energy consumption products, involving more than 9,000 enterprises and more than 900 testing institutions, and has achieved more than 441.9 billion-kilowatt hour energy-saving results. The system has effectively guaranteed the energy efficiency improvement of energy consumption products in China, and promoted the development of national energy saving and emission reduction. It is estimated that by 2020, the implementation the system is to save 277.5 TWH of electric power, 129 million tons of standard coal and more than 110 million tons of carbon emissions16.
As a successful case, the energy efficiency labeling system has enhanced the improvement of air conditioning energy efficiency level which further promotes the improvement of the energy efficiency standards in the air conditioning industry in China. The high-power with low energy efficiency air conditioning products are gradually eliminated from the market, and the upgraded high energy efficiency air conditioners prevail. Other industries producing energy consuming products follow the example to upgrade the energy efficiency of the products, and further promote the energy saving and emission reduction in China.
4.2. The measures on carbon reduction for the decrease of carbon intensity in ChinaIn addition to the energy saving activities, China also takes measures of emission reduction to achieve the decoupling of economic growth and carbon emissions, although the emission reduction measures are relatively lagging in the starting time and effects. In terms of reducing carbon emissions and achieving low-carbon development through emission reduction measures, EU’s experience of ETS is very significant and China follows the example and draws the lessons from EU ETS so as to establish China’s ETS with more effective measures for the emission reduction in China.
4.2.1. China’s ETS as a significant measure for the carbon reduction
Emission trading scheme is regarded as an efficient market-based measure for emission reducing. EU ETS has implemented for more than fifteen years and has accumulated valuable experience in supervision and management for China. To follow the “cap and trade” mode of EU ETS, China learns to do and has the pilots for ETS. In October 2011, the National Development and Reform Commission of China has announced to have carbon emission trading pilots, approving five cities as Beijing, Shanghai, Tianjin,
16 The 10th Anniversary Seminar of Energy Efficiency Labeling System. National Development and Reform Commission: https://www.ndrc.gov.cn/

Real Instituto Universitario de Estudios Europeos | 17
Chongqing, and Shenzhen, and 2 provinces as Hubei and Guangdong, to carry out carbon emission trading pilots which have been launched since 2013.
After more than four years of pilot operation, China’s national ETS and the unified carbon trading market have been established. On December 19, 2017, with the approval of the State Council, the National Development and Reform Commission officially has issued China’s national carbon emission trading market construction plan. The issuance of this document officially marks the start of China’s carbon emission trading scheme. Although only one industry (the power generation industry) is included in at first, China’s ETS, with the continuous development and improvement, would cover more energy intensive industries and other carbon intensive industries. China’s carbon trading market is to be one of the most important carbon markets in the world.
China has carefully studied EU ETS offset mechanism, and China’s pilots of ETS in the 5 cities+2 provinces have innovatively used the mechanism with creative ideas so that the industries which are not yet covered in China’s pilot ETS are also motivated in activities of emission reduction. With the participation of more industries that are not even covered by the ETS, the carbon emission reduction in China is to be successfully implemented.
4.2.2. China’s pilot ETS test providing successful experience for the implementation
China’s pilot ETS in the 5 cities+2 provinces for emission trading before the establishment of a national emission trading market shows the practical and cautious ways of the Chinese government for policy making and implementation, since China is such a big country that any fault in the policy making and implementation might cause serious results for a lot of people. Therefore, China always has pilots for some fresh and innovative ideas and policies in order to decrease the lost in case of failure and increase the possibilities for the success.
From June 2013 to June 2014, the 5cities+2 provinces pilot carbon emission trading markets have started one after another, and some of them, especially Hubei province have successively carried out the work. On December 22, 2016, Fujian Province voluntarily has launched the carbon emission trading market, becoming the eighth carbon emission trading pilot in China. Table 3 shows the rules of the 8 local carbon trading pilot markets. Some of the provisions of the pilots are similar, while others are quite different, because each of the pilot market is supervised in accordance with the local conditions by the local provincial government. The local autonomy for the pilot carbon markets provides the local authorities with the flexibilities to adopt the most effective modes for them, and with the motivation for the creativities in implementation. The enthusiasm of the local industries to participate in the carbon emission market is motivated and the different rules of the regional development lead to the different market performance.

18 | Real Instituto Universitario de Estudios Europeos
Table 3. the rules of China’s 8 local carbon emission trading pilot markets
Provinces and cities
Quota allocation mode Quota allocation method Carbon market coverageSubject of carbon
market
Shenzhen
Mixed mode: more than 90% of the quota be issued free of charge, and the quota from 2013 to 2015 be allocated in one time, considering the growth of the industry.
Based on the baseline method (the annual carbon emission quota of the enterprise is determined, based on its emission efficiency and its actual business volume), some industries adopt the competitive method to determine.
635 enterprises from 26 industries including power, gas, and water supply.
Performing enterprises, institutional investors, and individual investment.
Shanghai
Free distribution: 100% free, one-time allocation of 2013-2015 quota, with appropriate consideration of industry growth.
Baseline method and historical emission method (the carbon emission quota is determined, based on the historical emission level of the enterprise and the contribution of early emission reduction).
197 enterprises from steel, petrochemical, chemical, metal, building materials, fiber industries, covering 57% of the city’s emissions.
Performing enterprises, institutional investors.
Beijing
Mixed mode: more than 95% free allocation, distributed annually, based on the data of the previous year (without considering the increment).
Historical emission method.
About 490 enterprises from power, heat, cement, petrochemical, and public construction industries covering half of the city’s emissions.
Performing enterprises, institutional investors.
Guangdong
Hybrid mode: 97% of the free allocation for electric power enterprises in 2013 and 95% in 2014, distributed annually, considering the trend of economic and social development.
Historical emission method (based on the amount of emissions in 2010-2012), considering the characteristics of the industry.
239 enterprises from power, cement, steel, ceramics, metals, petrochemicals, plastics, and paper industries, accounting for 42% of the province’s emissions.
Performing enterprises, institutional investors.
Tianjin
Free distribution: 100% free allocation, annual quota for 2013-2015 are set at one time, which can be adjusted every year.
Historical emission method is adopted for stock and baseline is adopted for increment.
114 enterprises from steel, chemical, power, petrochemical, oil refining and other industries, accounting for 60% of the city’s emissions.
Performing enterprises, institutional investors, and individual investors.
HubeiFree distribution: 100% free allocation, no increment considered.
Stock: 80% of quota allocation is based on historical emission method, 20% is used for auction; increment: 15% quota reserved by the government.
138 enterprises from iron and steel, chemical industry, cement, electric power and other industries, accounting for 35% of the total emissions of the province.
Performing enterprises, institutional investors, and individual investors.
Chongqing
Distribution free of charge: 100% free allocation, the upper limit for the total amount control of the annual quota is determined with an annual decrease of 4.13%, without considering the increment.
Historical emission method.
240 enterprises from cement, steel, electric power, and other industries, accounting for 30%-45% of total emissions.
Performing enterprises.
FujianDistribution free of charge: 100% free allocation.
Adopt the combination of baseline method and historical emission method.
Power, petrochemical, chemical, building materials, steel, nonferrous metals, paper, aviation, ceramics and other nine industries.
Performing enterprises, institutional investors, and individual investors.
Source from: Official websites of the development and reform commissions of the pilot provinces and cities

Real Instituto Universitario de Estudios Europeos | 19
Fig. 10 shows the volume and the turnover of the transactions per pilot in 2019. During this period, Hubei is the most successful pilot in China, with a carbon trading volume of 64.17 million tons and a turnover of 129.7142 million yuan, which has accounted for more than 30% of the eight pilots in the country, ranking the first. Hubei has fully played a pilot role and provided the valuable experience for the building of the national carbon emission trading scheme. The second one is Guangdong with a turnover of 106.619 million yuan and the volume of 58.378 million tons17.
In sum, the market performance of each pilot carbon market is quite different, which is related to the differences of the local energy consumption and carbon emissions, the economic development level, and the government supervision. The pilot projects of the local provinces and cities have made a very important contribution to the building of the national carbon emission market.
Figure 10. Trading volume and turnover of 8 carbon trading pilots in 2019
24
Figure 10 Trading volume and turnover of 8 carbon trading pilots in 2019
Source link: http://k.tanjiaoyi.com/
4.2.3 EU-China cooperation in the emission reduction
EU ETS is the largest carbon emission trading scheme in the world, which makes a great
contribution to the global carbon emission reduction by mandating carbon emissions for
enterprises. EU ETS has implemented for three phrases. The first two phases adopt the
decentralized governance model, while the third phrase adopts the centralized governance
model. The Commission sets the overall quota and distribution rules, and member States are
responsible for their implementation. The implementation of the market-based mechanism of
ETS has achieved the purpose of EU’s climate actions, while China is intended to adopt the
market-based mechanism for the pilots. EU’s approaches provide China with valuable
experience in the implementation of ETS and China expects to cooperate with EU in the global
governance of climate change.
In fact, China and EU have a long-standing cooperation on tackling the climate change. In
2005 the EU-China Partnership on Climate Change has provided a high-level political
framework for cooperation and dialogue. In 2010, China and EU have issued a joint statement
on climate change dialogue and cooperation. Recently, China and EU have issued a statement
on climate change and clean energy, which has agreed to strengthen bilateral cooperation. China
has learnt from the experience and lessons of EU ETS and EU also provides technical support
for China in the design of the national ETS and the pilots of emission trading.
Beijing; 1331,8
Shanghai; 1516,9
Guangdong; 5837,8
Tianjin; 306,6
Shenzhen; 2641,7
Hubei; 6417
Chongqing; 848,2
Fujian; 803,4
Carbon trading volume(10 thousand tons)
Beijing; 79714,8
Shanghai; 42956,4
Guangdong; 106619,3
Tianjin; 4200,4
Shenzhen; 72553,4
Hubei; 129714,2
Chongqing; 4894,7
Fujian; 16374,5
Carbon trading turnover(10 thousand yuan)
Source link: http://k.tanjiaoyi.com/
4.2.3 EU-China cooperation in the emission reduction
EU ETS is the largest carbon emission trading scheme in the world, which makes a great contribution to the global carbon emission reduction by mandating carbon emissions for enterprises. EU ETS has implemented for three phrases. The first two phases adopt the decentralized governance model, while the third phrase adopts the centralized governance model. The Commission sets the overall quota and distribution rules, and member States are responsible for their implementation. The implementation of the market-based mechanism of ETS has achieved the purpose of EU’s climate actions, while China is intended to adopt the market-based mechanism for the pilots. EU’s approaches provide China with valuable experience in the implementation of ETS and China expects to cooperate with EU in the global governance of climate change.
In fact, China and EU have a long-standing cooperation on tackling the climate change. In 2005 the EU-China Partnership on Climate Change has provided a high-level political framework for cooperation and dialogue. In 2010, China and EU have issued a joint statement on climate change dialogue and cooperation. Recently, China and EU have issued a statement on climate change and clean energy, which has agreed to strengthen bilateral cooperation. China has learnt from the experience and lessons of EU ETS and EU also provides technical support for China in the design of the national ETS and the pilots of emission trading.
17 Source link: http://k.tanjiaoyi.com/

20 | Real Instituto Universitario de Estudios Europeos
ConclusionChina’s measures to achieve the decoupling between the economic growth and carbon emissions mainly replies on the decrease of energy consumption and increase of energy efficiency as a breakthrough for the carbon intensity reduction, while the emission reduction measures as the pilots of ETS have achieved successful experience, and the national ETS is on the way to be implemented in the country. As the decrease of carbon intensity is mainly due to the achievements of energy saving and emission reduction, China’s measures on energy-activities as adjusting the industrial structure, optimizing the energy structure, and improving the energy efficiency are efficient and effective. The building of China’s national carbon emission trading scheme, with EU’s technical support in the design of the scheme and the projects of EU-China cooperation for carbon reduction, may have more contribution to the future decreasing of carbon intensity in China.
China has fulfilled the commitment made at the Copenhagen climate change conference to “reduce the emission intensity per unit of GDP by 40% to 45% by 2020” three years ahead of the schedule, with an average annual decrease of 4.9% for the carbon intensity18. Now China is striving to achieve the goals of the Paris Agreement for the Intended Nationally Determined Contributions (INDCs) as to reduce the carbon dioxide emission intensity per unit of GDP by 60%-65% compared with that in 2005, to increase the proportion of non-fossil energy in the total primary energy consumption to about 20%, and to peak the carbon dioxide emission around 2030 or before.
At present, China is improving the economic development and is turning from the quantity-focused growth of GDP to the quality-focused growth, and switching from the resource dependent development model, which is driven by increasing the input of the factors, to the economic development driven by knowledge and innovation. According to what President XI says that the lucid waters and lush mountains are invaluable assets, China’s economic development is to be greener, and the low-carbon economic development with more efficient measures on energy saving and carbon reduction is to decouple furtherly the economic growth and the carbon emissions in China.
18 SCIO briefing on China’s Policies and Actions for Addressing Climate Change (2018). The State Council Information Office: http://www.scio.gov.cn/

Real Instituto Universitario de Estudios Europeos | 21
BibliographyDuan, M., Qi, S. & Wu, L., 2018. Designing China’s national carbon emissions trading system in a transitional period. Climate Policy, 18(S1), pp. S1-S6.
Gao, W., 2017. Study on the effectiveness of energy conservation and emission reduction policies from the perspective of industrial restructuring. Lanzhou University.
He, J., Lu, L. & Wang, H., 2018. Analysis on the win-win path of economic growth and carbon dioxide emission reduction. China population, resources, and environment, 28(10), pp. 9-17.
Huang, Z., 2018. Analysis on decoupling of carbon emission and economic growth in Hubei Province. Science and technology and industry, 18(02), pp. 14-21+26.
Liu, C., Sun, Z. & Zhang, J., 2019. Study on the effect of carbon emission reduction policy in China’s carbon emission trading pilot. China population, resources, and environment, 29(11), pp. 49-58.
Liu, H., 2013. Learning from EU-ETS experience and building China’s carbon emission trading system: an interview with three European countries. Open guide, Issue 03, pp. 50-63.
Li, W., 2017. Summary of research on carbon emission trading in China. Reference for economic research, Issue 42, pp. 36-48.
Li, W., 2017. Summary of research on carbon emission trading in China. Reference for economic research, Issue 42, pp. 36-48.
Li, Z. & Zhang, X., 2014. Research on the operation, problems, and Countermeasures of carbon emission trading market in China. Journal of ecological environment, 23(11), pp. 1876-1882.
Li, Z., Zhang, X. & Dong, Y., 2014. Research on the operation status, problems and Countermeasures of China’s carbon emission trading market. Journal of ecological environment, 23(11), pp. 1876-1882.
Mi, G. & Chang, Q., 2017. Study on the “tail effect” of China’s economic growth under the constraints of energy structure and carbon emissions. Resources and environment in arid areas, 31(02), pp. 50-55.
Peng, J., Huang, X., Zhong, T. & Zhao, Y., 2011. Study on the decoupling of China’s economic growth and energy carbon emissions. Resource science, 33(04), pp. 626-633.
Qi, Y., 2018. An analysis of the decoupling effect of China’s regional economic growth and carbon emissions and the track of the shift of the center of gravity. Modern finance and Economics (Journal of Tianjin University of Finance and Economics), 38(05), pp. 17-29.
Schandl, H., 2016. Decoupling global environmental pressure and economic growth: scenarios for energy use, materials use and carbon emissions. Journal of Cleaner Production, 132(20), pp. 45-56.
Sun, T., 2017. Study on the adjustment of China’s energy structure and its impact under carbon emission constraints. China University of Petroleum.
Tian, C. & Xu, C., 2019. Effectiveness analysis and policy suggestions of carbon trading pilot in China. Journal of North China University of Technology, 31(01), pp. 7-14.
Wan, F. & Du, L., 2015. Optimization and improvement of the design of China’s unified carbon trading market mechanism -- Analysis and selection based on EU-ETS mechanism and its operation. Research on economy and management, 36(04), pp. 16-23.
Wang, C., 2010. Decoupling Analysis of China Economic Growth and Energy Consumption. China Population, Resources and Environment, 20(03), pp. 35-37.
Wang, K. & Chen, M., 2018. Review and Prospect of China’s carbon trading market. Journal of Beijing Institute of Technology (Social Sciences Edition), 20(02), pp. 24-31.
Wang, W. & Zhao, Y., 2019. Global carbon market research and Its Enlightenment on China’s carbon market construction. Northeast Asia Forum, 28(02), pp. 97-112+128.

Wei, Z., 2015. Development status, international experience, and path selection of carbon emission trading market in China. Journal of seeking truth, 42(05), pp. 64-71.
Wen, B. & Bin, L., 2015. Current situation, and future development of China’s carbon market. Journal of Tsinghua University (Natural Science Edition), 55(12), pp. 1315-1323.
Zhang, C., 2016. Study on the influencing factors, convergence, and spillover of carbon emission intensity in China. Chongqing University.
Zhang, L., 2013. An Empirical Study on the relationship between carbon emission and economic growth in Beijing, Based on EKC and STIRPAT model. Technology economy, 32(01), pp. 90-95.
Zhang, Q. & Zhang, Y., 2019. Analysis of factors influencing China’s economic growth and carbon emissions in the 40 years of reform and opening-up. Resources and environment in arid areas, 33(10), pp. 9-13.
Zhang, X., Luo, H. & Lv, L., 2017. Analysis of coordination between carbon emission and economic growth. ournal of environmental engineering technology, 7(04), pp. 517-524.
Zhao, Z. & Chen, J., 2018. Empirical analysis of the relationship between carbon dioxide emissions and economic growth. China Environmental Science, 38(07), pp. 2785-2793.

Números Publicados
Serie Unión Europea y Relaciones Internacionales
Nº 1/2000“La política monetaria única de la Unión Europea”
Rafael Pampillón Olmedo
Nº 2/2000“Nacionalismo e integración”
Leonardo Caruana de las Cagigas y Eduardo González Calleja
Nº 1/2001“Standard and Harmonize: Tax Arbitrage”
Nohemi Boal Velasco y Mariano González Sánchez
Nº 2/2001“Alemania y la ampliación al este: convergencias y divergencias”
José María Beneyto Pérez
Nº 3/2001
“Towards a common European diplomacy? Analysis of the European Parliament resolution on
establishing a common diplomacy (A5-0210/2000)”
Belén Becerril Atienza y Gerardo Galeote Quecedo
Nº 4/2001“La Política de Inmigración en la Unión Europea”
Patricia Argerey Vilar
Nº 1/2002“ALCA: Adiós al modelo de integración europea?”
Mario Jaramillo Contreras
Nº 2/2002“La crisis de Oriente Medio: Palestina”
Leonardo Caruana de las Cagigas
Nº 3/2002
“El establecimiento de una delimitación más precisa de las competencias entre la Unión
Europea y los Estados miembros”
José María Beneyto y Claus Giering
Nº 4/2002“La sociedad anónima europea”
Manuel García Riestra
Nº 5/2002
“Jerarquía y tipología normativa, procesos legislativos y separación de poderes en la Unión
Europea: hacia un modelo más claro y transparente”
Alberto Gil Ibáñez
Nº 6/2002
“Análisis de situación y opciones respecto a la posición de las Regiones en el ámbito de la UE.
Especial atención al Comité de las Regiones”
Alberto Gil Ibáñez
Nº 7/2002
“Die Festlegung einer genaueren Abgrenzung der Kompetenzen zwischen der Europäischen
Union und den Mitgliedstaaten”
José María Beneyto y Claus Giering
Nº 1/2003“Un español en Europa. Una aproximación a Juan Luis Vives”
José Peña González
Nº 2/2003“El mercado del arte y los obstáculos fiscales ¿Una asignatura pendiente en la Unión
Europea?”
Pablo Siegrist Ridruejo

Nº 1/2004“Evolución en el ámbito del pensamiento de las relaciones España-Europa”José Peña González
Nº 2/2004“La sociedad europea: un régimen fragmentario con intención armonizadora”Alfonso Martínez Echevarría y García de Dueñas
Nº 3/2004“Tres operaciones PESD: Bosnia i Herzegovina, Macedonia y República Democrática de Congo”Berta Carrión Ramírez
Nº 4/2004“Turquía: El largo camino hacia Europa”Delia Contreras
Nº 5/2004“En el horizonte de la tutela judicial efectiva, el TJCE supera la interpretación restrictiva de la legitimación activa mediante el uso de la cuestión prejudicial y la excepción de ilegalidad” Alfonso Rincón García Loygorri
Nº 1/2005“The Biret cases: what effects do WTO dispute settlement rulings have in EU law?”Adrian Emch
Nº 2/2005“Las ofertas públicas de adquisición de títulos desde la perspectiva comunitaria en el marco de la creación de un espacio financiero integrado”José María Beneyto y José Puente
Nº 3/2005“Las regiones ultraperiféricas de la UE: evolución de las mismas como consecuencia de las políticas específicas aplicadas. Canarias como ejemplo”Carlota González Láynez
Nº 24/2006“El Imperio Otomano: ¿por tercera vez a las puertas de Viena?”Alejandra Arana
Nº 25/2006“Bioterrorismo: la amenaza latente”Ignacio Ibáñez Ferrándiz
Nº 26/2006“Inmigración y redefinición de la identidad europea”Diego Acosta Arcarazo
Nº 27/2007“Procesos de integración en Sudamérica. Un proyecto más ambicioso: la comunidad sudamericana de naciones”Raquel Turienzo Carracedo
Nº 28/2007“El poder del derecho en el orden internacional. Estudio crítico de la aplicación de la norma democrática por el Consejo de Seguridad y la Unión Europea”Gaspar Atienza Becerril
Nº 29/2008“Iraqi Kurdistan: Past, Present and Future. A look at the history, the contemporary situation and the future for the Kurdish parts of Iraq”Egil Thorsås
Nº 30/2008“Los desafíos de la creciente presencia de China en el continente africano”Marisa Caroço Amaro
Nº 31/2009
“La cooperación al desarrollo: un traje a medida para cada contexto. Las prioridades para la promoción de la buena gobernanza en terceros paises: la Unión Europea, los Estados Unidos y la Organización de las Naciones Unidas”Anne Van Nistelroo
Nº 32/2009“Desafios y oportunidades en las relaciones entre la Unión Europea y Turquía”Manuela Gambino
Nº 33/2010“Las relaciones trasatlánticas tras la crisis financiera internacional: oportunidades para la Presidencia Española”Román Escolano

Nº 34/2010“Los derechos fundamentales en los tratados europeos. Evolución y situación actual”Silvia Ortiz Herrera
Nº 35/2010“La Unión Europea ante los retos de la democratización en Cuba”
Delia Contreras
Nº 36/2010“La asociación estratégica UE-Brasil. Retórica y pragmatismo en las relaciones Euro-Brasileñas”(Vol 1 y 2)
Ana Isabel Rodríguez Iglesias
Nº 37/2011“China’s foreign policy: A European Perspective”
Fernando Delage y Gracia Abad
Nº 38/2011“China’s Priorities and Strategy in China-EU Relations”
Chen Zhimin, Dai Bingran, Zhongqi Pan and Ding Chun
Nº 39/2011
“Motor or Brake for European Policies? Germany’s new role in the EU after the Lisbon-
Judgmentof its Federal Constitutional Court”
Ingolf Pernice
Nº 40/2011“Back to Square One - the Past, Present and Future of the Simmenthal Mandate”
Siniša Rodin
Nº 41/2011“Lisbon before the Courts: Comparative Perspectives”
Mattias Wendel
Nº 42/2011
“The Spanish Constitutional Court, European Law and the constitutional traditions
commonto the Member States (Art. 6.3 TUE). Lisbon and beyond”
Antonio López-Pina
Nº 43/2011“Women in the Islamic Republic of Iran: The Paradox of less Rights and more Opportunities”
Désirée Emilie Simonetti
Nº 44/2011“China and the Global Political Economy”
Weiping Huang & Xinning Song
Nº 45/2011“Multilateralism and Soft Diplomacy”
Juliet Lodge and Angela Carpenter
Nº 46/2011“FDI and Business Networks: The EU-China Foreign Direct Investment Relationship”
Jeremy Clegg and HinrichVoss
Nº 47/2011
“China within the emerging Asian multilateralismand regionalism. As perceived through a
comparison with the European Neighborhood Policy”
Maria-Eugenia Bardaro & Frederik Ponjaert
Nº 48/2011“Multilateralism and global governance”
Mario Telò
Nº 49/2011“EU-China: Bilateral Trade Relations and Business Cooperation”
Enrique Fanjul
Nº 50/2011“Political Dialogue in EU-China Relations”.
José María Beneyto, Alicia Sorroza, Inmaculada Hurtado y Justo Corti
Nº 51/2011
“La Política Energética Exterior de la Unión Europea. Entre dependencia, seguridad de abastecimiento, mercado y geopolítica”.
Marco Villa
Nº 52/2011“Los Inicios del Servicio Europeo de Acción Exterior”Macarena Esteban Guadalix

Nº 53/2011“Holding Europe’s CFSP/CSDP Executive to Account in the Age of the Lisbon Treaty”Daniel Thym
Nº 54/2011“El conflicto en el Ártico: ¿hacia un tratado internacional?”Alberto Trillo Barca
Nº 55/2012“Turkey’s Accession to the European Union: Going Nowhere”William Chislett
Nº 56/2012“Las relaciones entre la Unión Europea y la Federación Rusa en materia de seguridad y defensa Reflexiones al calor del nuevo concepto estratégico de la Alianza Atlántica”Jesús Elguea Palacios
Nº 57/2012“The Multiannual Financial Framework 2014-2020: A Preliminary analysis of the Spanish position”Mario Kölling y Cristina Serrano Leal
Nº 58/2012“Preserving Sovereignty, Delaying the Supranational Constitutional Moment? The CJEU as the Anti-Model for regional judiciaries”Allan F. Tatham
Nº 59/2012“La participación de las Comunidades Autónomas en el diseño y la negociación de la Política de Cohesión para el periodo 2014-2020”Mario Kölling y Cristina Serrano Leal
Nº 60/2012“El planteamiento de las asociaciones estratégicas: la respuesta europea ante los desafíos que presenta el nuevo orden mundial”Javier García Toni
Nº 61/2012“La dimensión global del Constitucionalismo Multinivel. Una respuesta legal a los desafíos de la globalización”Ingolf Pernice
Nº 62/2012“EU External Relations: the Governance Mode of Foreign Policy”Gráinne de Búrca
Nº 63/2012“La propiedad intelectual en China: cambios y adaptaciones a los cánones internacionales”Paula Tallón Queija
Nº 64/2012“Contribuciones del presupuesto comunitario a la gobernanza global: claves desde EuropaCristina Serrano Leal
Nº 65/2013“Las Relaciones Germano-Estadounidenses entre 1933 y 1945”Pablo Guerrero García
Nº 66/2013“El futuro de la agricultura europea ante los nuevos desafíos mundiales”Marta Llorca Gomis, Raquel Antón Martín, Carmen Durán Vizán, Jaime del Olmo Morillo-Velarde
Nº 67/2013“¿Cómo será la guerra en el futuro? La perspectiva norteamericana”Salvador Sánchez Tapia
Nº 68/2013
“Políticas y Estrategias de Comunicación de la Comisión Europea”Actores y procesos desde que se aprueban hasta que la información llega a la ciudadanía españolaMarta Hernández Ruiz
Nº 69/2013“El reglamento europeo de sucesiones. Tribunales competentes y ley aplicable. Excepciones al principio general de unidad de ley”Silvia Ortiz Herrera
Nº 70/2013“Private Sector Protagonism in U.S. Humanitarian Aid”Sarah Elizabeth Capers

Nº 71/2014“Integration of Turkish Minorities in Germany”Iraia Eizmendi Alonso
Nº 72/2014“La imagen de España en el exterior: La Marca España”Marta Sabater Ramis
Nº 73/2014“Aportaciones del Mercado Interior y la política de competencia europea: lecciones a considerar por otras áreas de integración regional”Jerónimo Maillo
Nº 74/2015“Las relaciones de la UE con sus socios meridionales a la luz de la Primavera Árabe”Paloma Luengos Fernández
Nº 75/2015“De Viena a Sarajevo: un estudio del equilibrio de poder en Europa entre 1815 y 1914”Álvaro Silva Soto
Nº 76/2015“El avance de la ultraderecha en la Unión Europea como consecuencia de la crisis: Una perspectiva del contexto político de Grecia y Francia según la teoría del ‘chivo expiatorio’”Eduardo Torrecilla Giménez
Nº 77/2016“La influencia de los factores culturales en la internacionalización de la empresa: El caso de España y AlemaniaBlanca Sánchez Goyenechea
Nº 78/2016“La Cooperación Estructurada Permanente como instrumento para una defensa común”Elena Martínez Padilla
Nº 79/2017“The European refugee crisis and the EU-Turkey deal on migrants and refugees”Guido Savasta
Nº 80/2017“Brexit:How did the UK get here?”Izabela Daleszak
Nº 81/2017“Las ONGD españolas: necesidad de adaptación al nuevo contexto para sobrevivir”Carmen Moreno Quintero
Nº 82/2017“Los nuevos instrumentos y los objetivos de política económica en la UE: efectos de la crisis sobre las desigualdades”Miguel Moltó
Nº 83/2017“Peace and Reconciliation Processes: The Northern Irish case and its lessons”Carlos Johnston Sánchez
Nº 84/2018“Cuba en el mundo: el papel de Estados Unidos, la Unión Europea y España”Paula Foces Rubio
Nº 85/2018
“Environmental Protection Efforts and the Threat of Climate Change in the Arctic: Examined Through International Perspectives Including the European Union and the United States of America”Kristina Morris
Nº 86/2018“La Unión Europea pide la palabra en la (nueva) escena internacional” José Martín y Pérez de Nanclares
Nº 87/2019“El impacto de la integración regional africana dentro del marco de asociación UE-ACP y su implicación en las relaciones post Cotonú 2020”Sandra Moreno Ayala
Nº 88/2019“Lucha contra el narcotráfico: un análisis comparativo del PlanColombia y la Iniciativa Mérida”Blanca Paniego Gámez
Nº 89/2019“Desinformación en la UE: ¿amenaza híbrida o fenómenocomunicativo?Evolución de la estrategia de la UE desde 2015”Elena Terán González
Nº 90/2019“La influencia del caso Puigdemont en la cooperación judicial penal europea”Pablo Rivera Rodríguez
Nº 91/2020 “Trumping Climate Change:National and International Commitments to Climate Change in the Trump Era”Olivia Scotti
Nº 92/2020 “El impacto social de la innovación tecnológica en Europa”Ricardo Palomo-Zurdo, Virginia Rey-Paredes, Milagros Gutiérrez-Fernández, Yakira Fernández-Torres
Nº 93/2020 “El Reglamento sobre la privacidad y las comunicaciones electrónicas, la asignatura pendiente del Mercado Único Digital”Ana Gascón Marcén
Nº 94/2020 “Referencias al tratamiento constitucional de la Unión Europea en algunos Estados Miembros”Rafael Ripoll Navarro
Nº 95/2020 “La identidad europea, ¿en crisis? Reflexiones en torno a los valores comunes en un entorno de cambio”Irene Correas Sosa
Nº 96/2020 “La configuración de un sistema de partidos propiamente europeo”Luis Rodrigo de Castro
Nº 97/2020 “El Banco Asiático de Inversión en Infraestructura. La participación de Europa y de España”Amadeo Jensana Tanehashi
Nº 98/2020 “Nuevas perspectivas en las relaciones entre la Unión Europea y China”Georgina Higueras
Nº 99/2020 “Inversiones Unión Europea-China: ¿hacia una nueva era?”Jerónimo Maillo y Javier Porras
Nº 100/2020 “40 años de reforma: el papel de China en la comunidad internacional”Enrique Fanjul
Nº 101/2020 “A climate for change in the European Union The current crisis implications for EU climate and energy policies”Corina Popa
Nº 102/2020 “La Cooperación Sur-Sur, entre lo ideal y la realidad. Análisis de los casos de Cuba y Haití”María Fernández Sánchez
Nº 103/2020 “El Derecho Internacional Humanitario después de la II Guerra Mundial”Gonzalo del Cura Jiménez

Serie Política de la Competencia y Regulación
Nº 1/2001 “El control de concentraciones en España: un nuevo marco legislativo para las empresas”José María Beneyto
Nº 2/2001 “Análisis de los efectos económicos y sobre la competencia de la concentraciónEndesa-Iberdrola”Luis Atienza, Javier de Quinto y Richard Watt
Nº 3/2001 “Empresas en Participación concentrativas y artículo 81 del Tratado CE: Dos años de apli-cación del artículo 2(4) del Reglamento CE de control de las operaciones de concentración”Jerónimo Maíllo González-Orús
Nº 1/2002 “Cinco años de aplicación de la Comunicación de 1996 relativa a la no imposición de multas o a la reducción de su importe en los asuntos relacionados con los acuerdos entre empresas”Miguel Ángel Peña Castellot
Nº 1/2002 “Leniency: la política de exoneración del pago de multas en derecho de la competencia”Santiago Illundaín Fontoya
Nº 3/2002 “Dominancia vs. disminución sustancial de la competencia ¿cuál es el criterio más apro-piado?: aspectos jurídicos”Mercedes García Pérez
Nº 4/2002 “Test de dominancia vs. test de reducción de la competencia: aspectos económicos”Juan Briones Alonso
Nº 5/2002 “Telecomunicaciones en España: situación actual y perspectivas”Bernardo Pérez de León Ponce
Nº 6/2002 “El nuevo marco regulatorio europeo de las telecomunicaciones”Jerónimo González González y Beatriz Sanz Fernández-Vega
Nº 1/2003 “Some Simple Graphical Interpretations of the Herfindahl-Hirshman Index and their Implications”Richard Watt y Javier De Quinto
Nº 2/2003 “La Acción de Oro o las privatizaciones en un Mercado Único”Pablo Siegrist Ridruejo, Jesús Lavalle Merchán y Emilia Gargallo González
Nº 3/2003 “El control comunitario de concentraciones de empresas y la invocación de intereses na-cionales. Crítica del artículo 21.3 del Reglamento 4064/89”Pablo Berenguer O´Shea y Vanessa Pérez Lamas
Nº 1/2004 “Los puntos de conexión en la Ley 1/2002 de 21 de febrero de coordinación de las compe-tencias del Estado y las Comunidades Autónomas en materia de defensa de la competencia”Lucana Estévez Mendoza
Nº 2/2004 “Los impuestos autonómicos sobre los grandes establecimientos comerciales como ayuda de Estado ilícita ex art. 87 TCE”Francisco Marcos
Nº 1/2005 “Servicios de Interés General y Artículo 86 del Tratado CE: Una Visión Evolutiva”Jerónimo Maillo González-Orús

Nº 2/2005 “La evaluación de los registros de morosos por el Tribunal de Defensa de la Competencia”Alfonso Rincón García Loygorri
Nº 3/2005 “El código de conducta en materia de fiscalidad de las empresas y su relación con el régi-men comunitario de ayudas de Estado”Alfonso Lamadrid de Pablo
Nº 18/2006 “Régimen sancionador y clemencia: comentarios al título quinto del anteproyecto de la ley de defensa de la competencia”Miguel Ángel Peña Castellot
Nº 19/2006 “Un nuevo marco institucional en la defensa de la competencia en España”Carlos Padrós Reig
Nº 20/2006 “Las ayudas públicas y la actividad normativa de los poderes públicos en el anteproyecto de ley de defensa de la competencia de 2006”Juan Arpio Santacruz
Nº 21/2006 “La intervención del Gobierno en el control de concentraciones económicas”Albert Sánchez Graells
Nº 22/2006 “La descentralización administrativa de la aplicación del Derecho de la competencia en España”José Antonio Rodríguez Miguez
Nº 23/2007 “Aplicación por los jueces nacionales de la legislación en materia de competencia en el Proyecto de Ley”Juan Manuel Fernández López
Nº 24/2007 “El tratamiento de las restricciones públicas a la competencia”Francisco Marcos Fernández
Nº 25/2008 “Merger Control in the Pharmaceutical Sector and the Innovation Market Assessment. European Analysis in Practice and differences with the American Approach”Teresa Lorca Morales
Nº 26/2008 “Separación de actividades en el sector eléctrico”Joaquín Mª Nebreda Pérez
Nº 27/2008 “Arbitraje y defensa de la competencia”Antonio Creus Carreras y Josep Maria Juliá Insenser
Nº 28/2008 “El procedimiento de control de concentraciones y la supervición por organismos regula-dores de las Ofertas Públicas de Adquisición”Francisco Marcos Fernández
Nº 29/2009 “Intervención pública en momentos de crisis: el derecho de ayudas de Estado aplicado a la intervención pública directa en las empresas”Pedro Callol y Jorge Manzarbeitia
Nº 30/2010 “Understanding China’s Competition Law & Policy: Merger Control as a Case Study”Jeronimo Maillo
Nº 31/2012 “Autoridades autonómicas de defensa de la competencia en vías de extinción”Francisco Marcos
Nº 32/2013 “¿Qué es un cártel para la CNC?”Alfonso Rincón García-Loygorri

Nº 33/2013 “Tipología de cárteles duros. Un estudio de los casos resueltos por la CNC”Justo Corti Varela
Nº 34/2013 “Autoridades responsables de la lucha contra los cárteles en España y la Unión Europea”José Antonio Rodríguez Miguez
Nº 35/2013 “Una revisión de la literatura económica sobre el funcionamiento interno de los cárteles y sus efectos económicos” María Jesús Arroyo Fernández y Begoña Blasco Torrejón
Nº 36/2013 “Poderes de Investigación de la Comisión Nacional de la Competencia”Alberto Escudero
Nº 37/2013 “Screening de la autoridad de competencia: Mejores prácticas internacionales”María Jesús Arroyo Fernández y Begoña Blasco Torrejón
Nº 38/2013 “Objetividad, predictibilidad y determinación normativa. Los poderes normativos ad extra de las autoridades de defensa de la competencia en el control de los cárteles”Carlos Padrós Reig
Nº 39/2013 “La revisión jurisdiccional de los expedientes sancionadores de cárteles”Fernando Díez Estella
Nº 40/2013 “Programas de recompensas para luchar contra los cárteles en Europa: una comparativa con terceros países”Jerónimo Maíllo González-Orús
Nº 41/2014 “La Criminalización de los Cárteles en la Unión Europea”Amparo Lozano Maneiro
Nº 42/2014 “Posibilidad de sancionar penalmente los cárteles en España, tanto en el presente como en el futuro”Álvaro Mendo Estrella
Nº 43/2014 “La criminalización de los hardcore cartels: reflexiones a partir de la experiencia de EE. UU. y Reino Unido”María Gutiérrez Rodríguez
Nº 44/2014 “La escasez de acciones de daños y perjuicios derivadas de ilícitos antitrust en España, ¿Por qué?”Fernando Díez Estella
Nº 45/2014 “Cuantificación de daños de los cárteles duros. Una visión económica”Rodolfo Ramos Melero
Nº 46/2014 “El procedimiento sancionador en materia de cárteles”Alfonso Lamadrid de Pablo y José Luis Buendía Sierra
Nº 47/2014 “Japanese Cartel Control in Transition”Mel Marquis and Tadashi Shiraishi
Nº 48/2015 “Una evaluación económica de la revisión judicial de las sanciones impuestas por la CNMC por infracciones anticompetitivas”Javier García-Verdugo

Nº 49/2015 “The role of tax incentives on the energy sector under the Climate Change’s challengesPasquale Pistone”Iñaki Bilbao
Nº 50/2015 “Energy taxation and key legal concepts in the EU State aid context: looking for a common understanding”Marta Villar Ezcurra and Pernille Wegener Jessen
Nº 51/2015 “Energy taxation and key legal concepts in the EU State aid context: looking for a common understanding Energy Tax Incentives and the GBER regime”Joachim English
Nº 52/2016 “The Role of the Polluter Pays Principle and others Key Legal Principles in Energy Taxes, on an State aid Context”José A. Rozas
Nº 53/2016 “EU Energy Taxation System & State Aid Control Critical Analysis from Competitiveness and Environmental Protection Objectives”Jerónimo Maillo, Edoardo Traversa, Justo Corti and Alice Pirlot
Nº 54/2016 “Energy Taxation and State Aids: Analysis of Comparative Law”Marta Villar Ezcurra and Janet Milne
Nº 55/2016 “Case-Law on the Control of Energy Taxes and Tax Reliefs under European Union Law”Álvaro del Blanco, Lorenzo del Federico, Cristina García Herrera, Concetta Ricci, CaterinaVerrigni and Silvia Giorgi
Nº 56/2017 “El modelo de negocio de Uber y el sector del transporte urbano de viajeros: implicaciones en materia de competencia”Ana Goizueta Zubimendi
Nº 57/2017 “EU Cartel Settlement procedure: an assessment of its results 10 years later”Jerónimo Maillo
Nº 58/2019 “Quo Vadis Global Governance? Assessing China and EU Relations in the New Global Economic Order”Julia Kreienkamp and Dr Tom Pegram
Nº 59/2019 “From Source-oriented to Residence-oriented: China’s International Tax Law Reshaped by BRI?”Jie Wang
Nº 60/2020 “The EU-China trade partnership from a European tax perspective”Elena Masseglia Miszczyszyn, Marie Lamensch, Edoardo Traversa, Marta Villar Ezcurra

Real Instituto Universitario de Estudios EuropeosUniversidad CEU San Pablo Avda. del Valle 21, 28003 MadridTeléfono: 91 514 04 22 | Fax: 91 514 04 [email protected], www.idee.ceu.es
A Study on China’s Measures for the Decoupling of the Economic Growth and the Carbon Emission
Rao LeiGao Min
Abstract: Since the reform and opening-up in 1978, China’s economy has been growing for decades. At the same time, the total energy consumption and carbon dioxide emissions are increasing, which cause the dual pressure of energy supply and ecological environment. With the development of technology, the adjustment of energy consumption structure, and the transformation and upgrading of industrial structure, China has put great efforts on the increasing of energy efficiency and decreasing of fossil energy consumption, which results in the decline of carbon intensity and the gradual decoupling of China’s economic growth and carbon emissions. It is significant to study the main reasons for the decoupling between China’s economic growth and carbon emissions, and to discuss the measures for the decoupling is momentous for exploring a green, low-carbon and sustainable development path for future in China.
Keywords: Decoupling; economic growth; emission; energy consumption.
ISBN: 978-84-17385-95-8 Ref. 587904–EPP–1–2017–1-ES-EPPJMO-NETWORK
Jean Monet Network EU-China: Comparative experiences and contributions to global governance in the fields of climate change, trade and competition
Partners of the Jean Monnet Network
Chinese Academy of Social Sciences Fudan University
University College London Université Catholique de Louvain
Documento de TrabajoSerie Política de la Competencia y RegulaciónNúmero 61 / 2020