Public Health England: Public awareness and opinion survey 2016
A STUDY ON AWARENESS, SATISFACTION AND OPINION TOWARDS
DIGITAL BRANDING AMONG RETAIL SHOPS IN PANDEMIC
SITUATION
Dr. D. Kiruthika
1, Associate Professor, Department of Commerce,
Dr. V. Punitha2, Associate Professor, PG & Research Department of Commerce,
CMS College of Science and Commerce, Coimbatore.
ABSTRACT
Talk about a change in landscape! What we have seen change with the pandemic is
unprecedented and it is enough to alter life going forward. All aspects of living, work and doing
business has been forced to change. Shops of big brands saw their worst with the lockdown in
place. From people fearful to come out of their homes to strict laws enforced to keep people at
home and regular market places shut to prevent the spread of the virus. The need for many things
before the pandemic are no longer needed or relevant. Like clothes, jewellery, home appliances,
party supplies and exotic vacations. So how are people’s needs and wants shaped in a pandemic,
when spending on frivolities is the last thing on the mind? On the business end, there was a
sudden scramble to redefine the market space for items that were no longer relevant in a long
stretched season of pandemic. How will you brand and market designer shoes when no one is
going out? How do you get the customer to still shop with you when they don’t come to the shop
anymore? Many are the questions that bombarded the businesses this pandemic. For items that
still have relevance in the market, sellers have turned to the digital platform to sell their products.
This is where digital branding comes in. It is the finding of a market by putting oneself on online
platforms. To find out the digital branding success in the pandemic 147 businesses were surveyed
for the changes they had done to go online. The study is structured to give an overall view of the
success of digital campaigning and the awareness and satisfaction among the customers.
Keywords:Digital branding, Digital branding awareness, Digital Branding satisfaction, Digital
branding retail shops, retail shops pandemic situation.
1. INTRODUCTION
With disruption of such a magnitude, life as we know it has changed with regard to shopping and
buying things from a store or online. Brand as we know is fickle one day it means promise of
great things to come and the next day they are out of business. Businesses that have survived the
ISSN NO: 0776-3808
http://aegaeum.com/ Page No: 1420
AEGAEUM JOURNAL
Volume 8, Issue 8, 2020
many cycles of growth and recession to this day earn the respect of its customers to be able to
bounce back and innovate themselves in hard times. In a good market brands pop up and vanish
all the time. It is like the survival of the fittest in the market. Some products lose their fancy the
moment they are on the shelves while others hold a steadier grip for a few seasons. The success
of a brand is in its foundation of strategizing. We can have a good product in hand and yet have
no strategy to make proper roadway for the product to reach the customer. With more tech savvy
businesses using the online platform to make their presence known, the question is do they see it
as a necessary thing?
The increase in the use of smart phones and personal devices means more access to the potential
customer. And it is only natural to want to have a piece of the market for one’s business. With
such a scope in the openness of the market, the next step is to have strategy that will catapult your
brand higher in the sea of brands out on the World Wide Web. A good brand presence will
translate to customer correctly perceiving the product, advertisement reaching the target
customers and the product appearing in the right search category. With the advent of online
shopping, retail brick and mortar shops and brands are declining rapidly. This is because of the
rapidly changing markets and needs of the customers. They see shopping online easier than going
to a physical shop and wasting time. Even small businesses are creating their presence online
with moving their sales to WhatsApp and Facebook to reach a wider customer base. The options
are limitless as the horizon to grow into is limitless and yet the risk of getting lost in the vastness
of the online stores and brands are great. No change is pleasant for the moment yet when it is
embraced with positivity the benefits can be quite rewarding.
1.2 STATEMENT OF PROBLEM
For many businesses the move to digital branding is a new one. A forced change of medium of
selling, branding and marketing. Overnight the pandemic stole their usual way of doing business.
The loss to the business has been quite devastating. How do they find their customer base when
there is no footfall into the stores? The burning question is can digital retailing and branding be
the solution that these businesses need? It isn’t an entirely new thing many businesses have
moved to an online platform and found their migration a success. In the study we will tackle how
digital branding worked for those surveyed and what were the challenges that they faced. It’s all
ISSN NO: 0776-3808
http://aegaeum.com/ Page No: 1421
AEGAEUM JOURNAL
Volume 8, Issue 8, 2020
good when we see one side of it but the other side is how are customers made aware of the
products and drawn in to buy? Was the purchase from such portals satisfying and useful?
1.3 OBJECTIVES OF THE STUDY
1. To study the level of awareness towards multi-channel medium for digital branding.
2. To know the level of opinion towards the various medium of Digital branding.
3. To ascertain the level of importance among various interactive in-store advertising.
4. To identify the level of benefits among various factors belongs to interactive in-
storeadvertising.
5. To analyze the level of satisfaction towards the various multi-channel medium used for
Digital Branding.
1.4 REVIEW OF LITERATURE
• Rizwan Raheem Ahmed et al, (2015)1the researchers set out to find how the use of
digital branding has helped businesses grow in their reach to new customers and increase their
income in the city of Karachi in Pakistan. The focus is to find how the move to new media
platforms have benefited the conventional businesses that made the shift to digital marketing. The
reach of these platforms are very large and the need that the researchers felt was the need of the
hour is right strategizing plan. It can be a waste of resources and time if the right strategy is not
employed for the business. In Karachi, the signs were very promising that the move of big brands
to the online platform has done them good as they have managed to make a connection with
customers online.
• Tanya Sammut-Bonnici, (2015)2 the uniqueness to brand is that it makes a company, a
product or service stand apart from the rest of the businesses around. A tangible way for the
customer to correctly link a product to a company. Why is it so important one may ask? Because
it’s the uniqueness the sets apart from the rest. Established brands are able to better control their
pricing and not have to cut even on a low margin. Because of the brand trust of the customers
these brands have an edge over competitors as their brand loyalty from customers are more and
stable than the rest. The focal point of a brand is the ability to build association to a product at the
same time distinguish it from the brands. The future of branding is to focus on strategy to be able
to assess their brand effectiveness on deeper constructs than just customer perception. This will
ISSN NO: 0776-3808
http://aegaeum.com/ Page No: 1422
AEGAEUM JOURNAL
Volume 8, Issue 8, 2020
help the branding process evolve to a more stable place than the flimsy perception based
assessment.
• Yi Zhang, (2015)3 the idea of understanding brand can be a fluid proposal. Why so?
Because brand is a construct that is understood differently by businesses and its customer. The
traditional approach is to assess the success of a business by the brand loyalty it enjoys and all
successes to the company is attributed to the brand. But the focus of this study is to review
current and past research papers and find how brand is assessed and also at the same time to find
the shortcomings of this approach of assessing brand success only from the perspective of the
customer. The researcher at the end of the study outlined a few suggestions for future study like
the concept of brand emotion that is how the brand makes them feel and respond accordingly.
This is a new concept that can be tested across different businesses.
• Deepak Verma and Madhu Bala, (2018)4 the study covers the rise in digital marketing
in India. The world is more connected now than ever and so why should marketing be left to
traditional mediums and old ways. Since there is a smart phone in everyone’s hand and are
connected to Facebook and WhatsApp these become easier target areas for advertising and brand
marketing. The paper has reviewed other journals, research papers and articles to study the
benefits of digital marketing. There are many ways that marketing is done these days as more
people are searching for their needs and shopping online. There is a mass shift in the landscape of
retail shopping, banking and service industry. The study concludes on a positive note to say that
digital branding is the way to move forward with regard to branding and marketing.
• P.Sathya, (2015)5 the study sought to understand the role and benefits of digital
marketing and its influence on the customer’s purchasing influence. For the study, 100
respondents and the sales figures of the company was taken to measure the impact on the
customer’s buying influence. Some of the benefits seen is that digital marketing is inexpensive
but the reach is much greater than traditional marketing. The mediums for marketing and
advertisement are far more in number than then ordinary ones. The researcher had concluded
with some suggestions in the way of finding a way to collect data from the customer on viewing
the advertisement, this would be excellent way to gather information on customer preference and
keep it at the foremost when designing product or a marketing strategy.
2. RESEARCH METHODOLOGY
ISSN NO: 0776-3808
http://aegaeum.com/ Page No: 1423
AEGAEUM JOURNAL
Volume 8, Issue 8, 2020
The present research centers on the adequacy of the awareness, satisfaction and opinion
towards digital branding among retail shops. The reasoning that is utilized in this research is
realism. The specialist gathers and investigations information utilizing adequate learning to
answer the examination question, so the exploration is more disposed towards realism.
2.1 RESEARCH DESIGN
The type of research chosen for the study is descriptive research. In descriptive research,
various parameters will be chosen and analyze the variations between these parameters. This was
done with an objective to find out theawareness, satisfaction and opinion towards digital branding
among retail shops in Pandemic situation.
2.2 DATA SOURCES
The data collected for the study is mainly through the distribution of a questionnaire; to
be precise the data collected for thestudy was both primary and secondary sources.
2.3 PRIMARY DATA
Primary data is the information collected for the first time; there are several methods in
which the data complies. In this project, it was obtained by questionnaires. The data were
collected through an online survey using ‘Google form’ and sent to study participants through
WhatsApp and E-mail. Participants were provided full consent before participation in the online
survey.
2.4 SECONDARY DATA
Secondary data needed for conducting research work were collected from websites, library
and search engines.
2.5 RESEARCH INSTRUMENT:
In this study, the primary data was collected by a survey technique. In this, we distributed
the questionnaires to the respondents. The researcher structured the questionnaire in the form of
Close-Ended Questions.
2.6 SAMPLING DESIGN:
Sampling design is to clearly define set of objective, technically called the universe to be
studied. Sampling technique used is a Convenience Sampling Method.
2.7 SAMPLE SIZE:
ISSN NO: 0776-3808
http://aegaeum.com/ Page No: 1424
AEGAEUM JOURNAL
Volume 8, Issue 8, 2020
This refers to the number of items to be selected from the universe to constitute a sample.
The sample size for this study was taken as 147.
3. DATA ANALYSIS AND INTERPRETATION
I.SIMPLE PERCENTAGE ANALYSIS
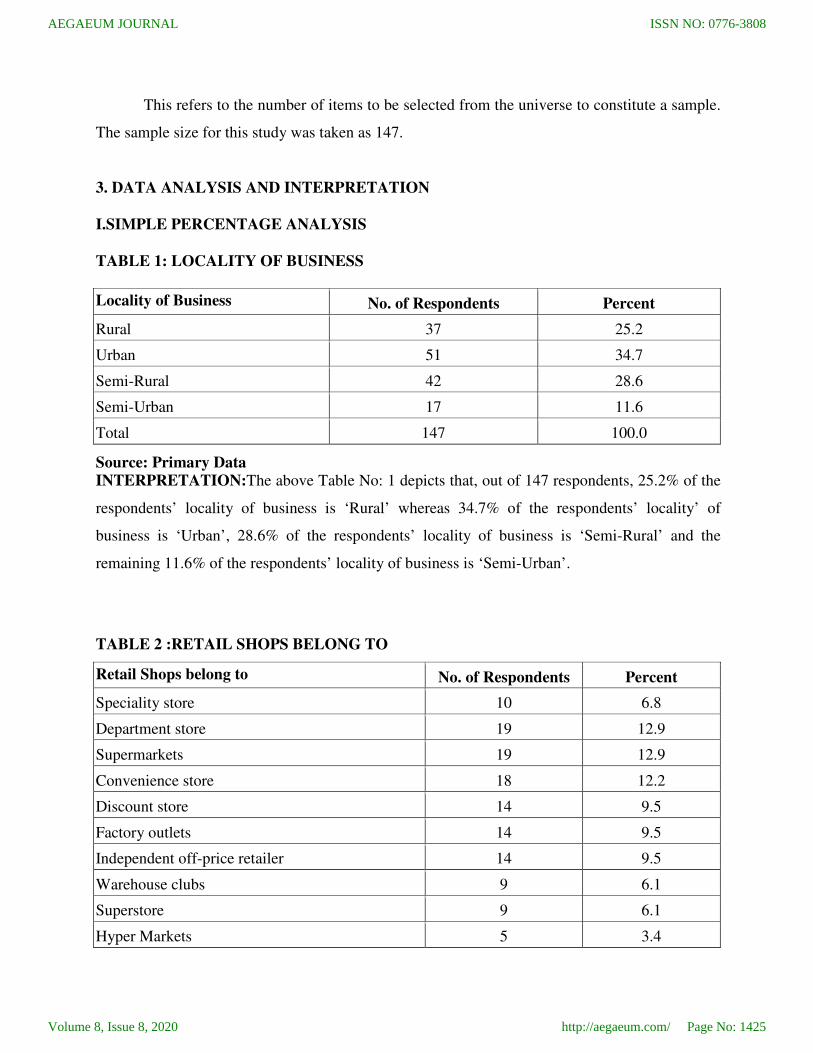
TABLE 1: LOCALITY OF BUSINESS
Locality of Business No. of Respondents Percent
Rural 37 25.2
Urban 51 34.7
Semi-Rural 42 28.6
Semi-Urban 17 11.6
Total 147 100.0
Source: Primary Data
INTERPRETATION:The above Table No: 1 depicts that, out of 147 respondents, 25.2% of the
respondents’ locality of business is ‘Rural’ whereas 34.7% of the respondents’ locality’ of
business is ‘Urban’, 28.6% of the respondents’ locality of business is ‘Semi-Rural’ and the
remaining 11.6% of the respondents’ locality of business is ‘Semi-Urban’.
TABLE 2 :RETAIL SHOPS BELONG TO
Retail Shops belong to No. of Respondents Percent
Speciality store 10 6.8
Department store 19 12.9
Supermarkets 19 12.9
Convenience store 18 12.2
Discount store 14 9.5
Factory outlets 14 9.5
Independent off-price retailer 14 9.5
Warehouse clubs 9 6.1
Superstore 9 6.1
Hyper Markets 5 3.4
ISSN NO: 0776-3808
http://aegaeum.com/ Page No: 1425
AEGAEUM JOURNAL
Volume 8, Issue 8, 2020
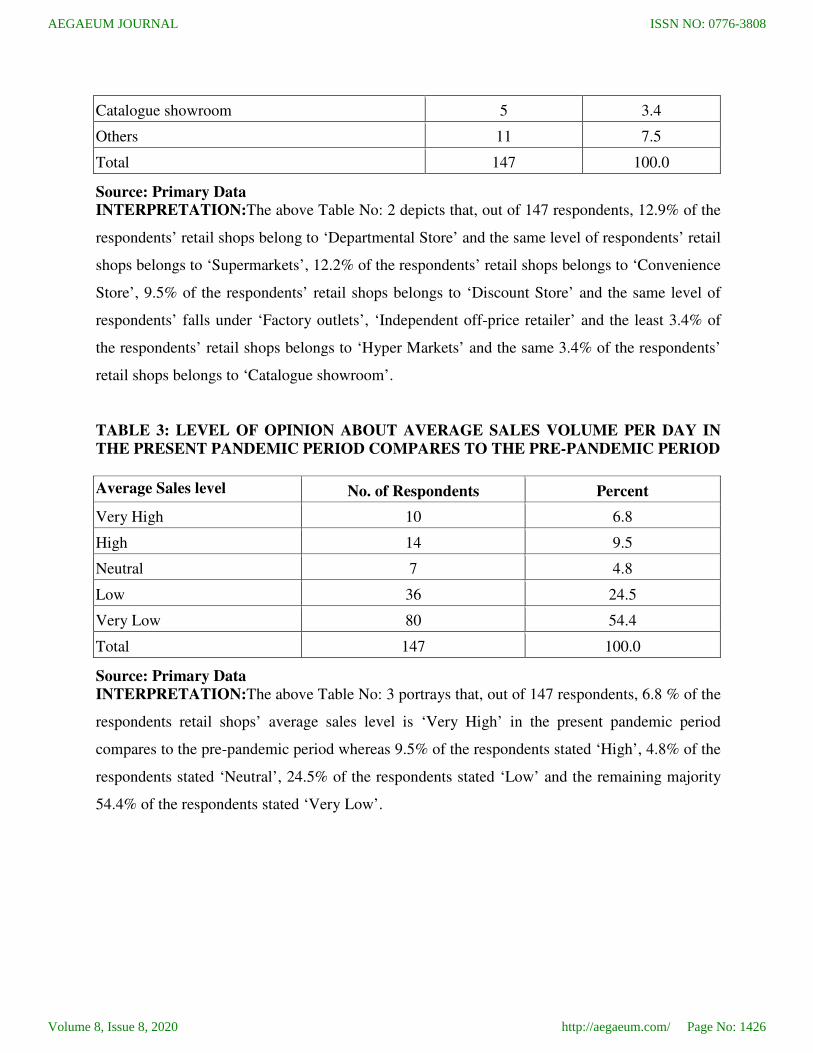
Catalogue showroom 5 3.4
Others 11 7.5
Total 147 100.0
Source: Primary Data
INTERPRETATION:The above Table No: 2 depicts that, out of 147 respondents, 12.9% of the
respondents’ retail shops belong to ‘Departmental Store’ and the same level of respondents’ retail
shops belongs to ‘Supermarkets’, 12.2% of the respondents’ retail shops belongs to ‘Convenience
Store’, 9.5% of the respondents’ retail shops belongs to ‘Discount Store’ and the same level of
respondents’ falls under ‘Factory outlets’, ‘Independent off-price retailer’ and the least 3.4% of
the respondents’ retail shops belongs to ‘Hyper Markets’ and the same 3.4% of the respondents’
retail shops belongs to ‘Catalogue showroom’.
TABLE 3: LEVEL OF OPINION ABOUT AVERAGE SALES VOLUME PER DAY IN
THE PRESENT PANDEMIC PERIOD COMPARES TO THE PRE-PANDEMIC PERIOD
Average Sales level No. of Respondents Percent
Very High 10 6.8
High 14 9.5
Neutral 7 4.8
Low 36 24.5
Very Low 80 54.4
Total 147 100.0
Source: Primary Data
INTERPRETATION:The above Table No: 3 portrays that, out of 147 respondents, 6.8 % of the
respondents retail shops’ average sales level is ‘Very High’ in the present pandemic period
compares to the pre-pandemic period whereas 9.5% of the respondents stated ‘High’, 4.8% of the
respondents stated ‘Neutral’, 24.5% of the respondents stated ‘Low’ and the remaining majority
54.4% of the respondents stated ‘Very Low’.
ISSN NO: 0776-3808
http://aegaeum.com/ Page No: 1426
AEGAEUM JOURNAL
Volume 8, Issue 8, 2020
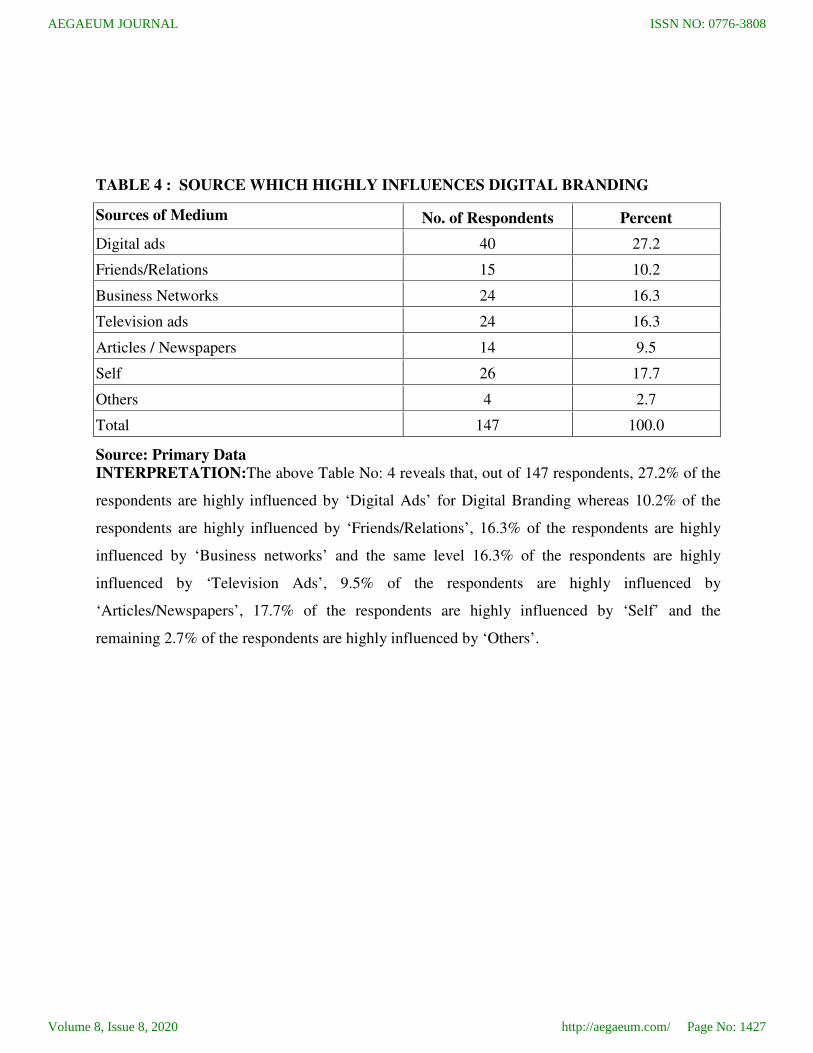
TABLE 4 : SOURCE WHICH HIGHLY INFLUENCES DIGITAL BRANDING
Sources of Medium No. of Respondents Percent
Digital ads 40 27.2
Friends/Relations 15 10.2
Business Networks 24 16.3
Television ads 24 16.3
Articles / Newspapers 14 9.5
Self 26 17.7
Others 4 2.7
Total 147 100.0
Source: Primary Data
INTERPRETATION:The above Table No: 4 reveals that, out of 147 respondents, 27.2% of the
respondents are highly influenced by ‘Digital Ads’ for Digital Branding whereas 10.2% of the
respondents are highly influenced by ‘Friends/Relations’, 16.3% of the respondents are highly
influenced by ‘Business networks’ and the same level 16.3% of the respondents are highly
influenced by ‘Television Ads’, 9.5% of the respondents are highly influenced by
‘Articles/Newspapers’, 17.7% of the respondents are highly influenced by ‘Self’ and the
remaining 2.7% of the respondents are highly influenced by ‘Others’.
ISSN NO: 0776-3808
http://aegaeum.com/ Page No: 1427
AEGAEUM JOURNAL
Volume 8, Issue 8, 2020

TABLE 5: LEVEL OF AWARENESS TOWARDS THE MULTI-CHANNEL MEDIUM
FOR DIGITAL BRANDING
Descriptive Statistics
Multi-Channel Medium N Minimum Maximum Mean Std. Deviation
New media marketing 147 1.00 5.00 2.7279 1.06345
Cross-media marketing 147 1.00 5.00 2.5238 1.43981
Retail media 147 1.00 5.00 2.8707 1.24015
Affiliate marketing 147 1.00 5.00 2.8231 1.20331
Display advertising 147 1.00 5.00 3.3810 1.50038
Email marketing 147 1.00 5.00 2.6599 1.24690
Search marketing 147 1.00 5.00 3.0000 1.10416
Social Media 147 1.00 5.00 3.1633 1.31400
Social Networking 147 1.00 5.00 2.6667 1.11240
Online PR 147 1.00 5.00 2.2653 1.44926
Game advertising 147 1.00 5.00 2.5374 .80471
SMS Marketing 147 1.00 5.00 3.1497 1.37170
Video advertising 147 1.00 5.00 2.4286 .81088
Valid N (list wise) 147
Source: Primary Data
INTERPRETATION: The above table 5 elaborates the level of awareness towards the multi-
channel medium for digital branding whichare ranked from 1 to 13. ‘Display advertising’ has
taken the first stance with a mean value of 3.381 whereas ‘Social Media’ stood at second with a
mean value of 3.1633, ‘SMS Marketing’ stood at third with a mean value of 3.1497, ‘Search
marketing’ stood at fourth with a mean value of 3.00, ‘Retail media’ stood at fifth with a mean
value of 2.8707, ‘Affiliate marketing’ stood at sixth with a mean value of 2.8231, ‘New media
marketing’ stood at seventh with a mean value of 2.7279, ‘Social Networking’ stood at eighth
with a mean value of 2.6667, ‘Email marketing’ stood at ninth with a mean value of 2.6599,
‘Game advertising’ stood at tenth with a mean value of 2.5374, ‘Cross-media marketing’ stood at
eleventh with a mean value of 2.5238, ‘Video advertising’ stood at twelfth with a mean value of
2.4286and ‘Online PR’ stood at Thirteenth with a mean value of 2.2653.
ISSN NO: 0776-3808
http://aegaeum.com/ Page No: 1428
AEGAEUM JOURNAL
Volume 8, Issue 8, 2020
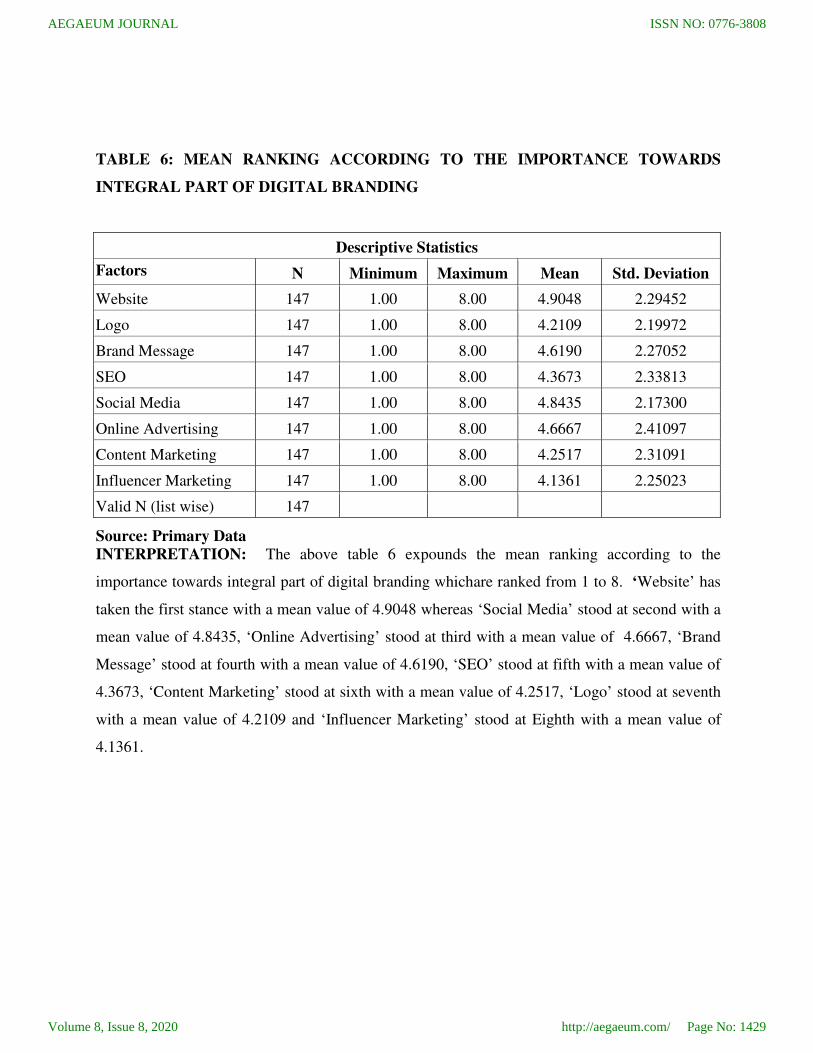
TABLE 6: MEAN RANKING ACCORDING TO THE IMPORTANCE TOWARDS
INTEGRAL PART OF DIGITAL BRANDING
Descriptive Statistics
Factors N Minimum Maximum Mean Std. Deviation
Website 147 1.00 8.00 4.9048 2.29452
Logo 147 1.00 8.00 4.2109 2.19972
Brand Message 147 1.00 8.00 4.6190 2.27052
SEO 147 1.00 8.00 4.3673 2.33813
Social Media 147 1.00 8.00 4.8435 2.17300
Online Advertising 147 1.00 8.00 4.6667 2.41097
Content Marketing 147 1.00 8.00 4.2517 2.31091
Influencer Marketing 147 1.00 8.00 4.1361 2.25023
Valid N (list wise) 147
Source: Primary Data
INTERPRETATION: The above table 6 expounds the mean ranking according to the
importance towards integral part of digital branding whichare ranked from 1 to 8. ‘Website’ has
taken the first stance with a mean value of 4.9048 whereas ‘Social Media’ stood at second with a
mean value of 4.8435, ‘Online Advertising’ stood at third with a mean value of 4.6667, ‘Brand
Message’ stood at fourth with a mean value of 4.6190, ‘SEO’ stood at fifth with a mean value of
4.3673, ‘Content Marketing’ stood at sixth with a mean value of 4.2517, ‘Logo’ stood at seventh
with a mean value of 4.2109 and ‘Influencer Marketing’ stood at Eighth with a mean value of
4.1361.
ISSN NO: 0776-3808
http://aegaeum.com/ Page No: 1429
AEGAEUM JOURNAL
Volume 8, Issue 8, 2020
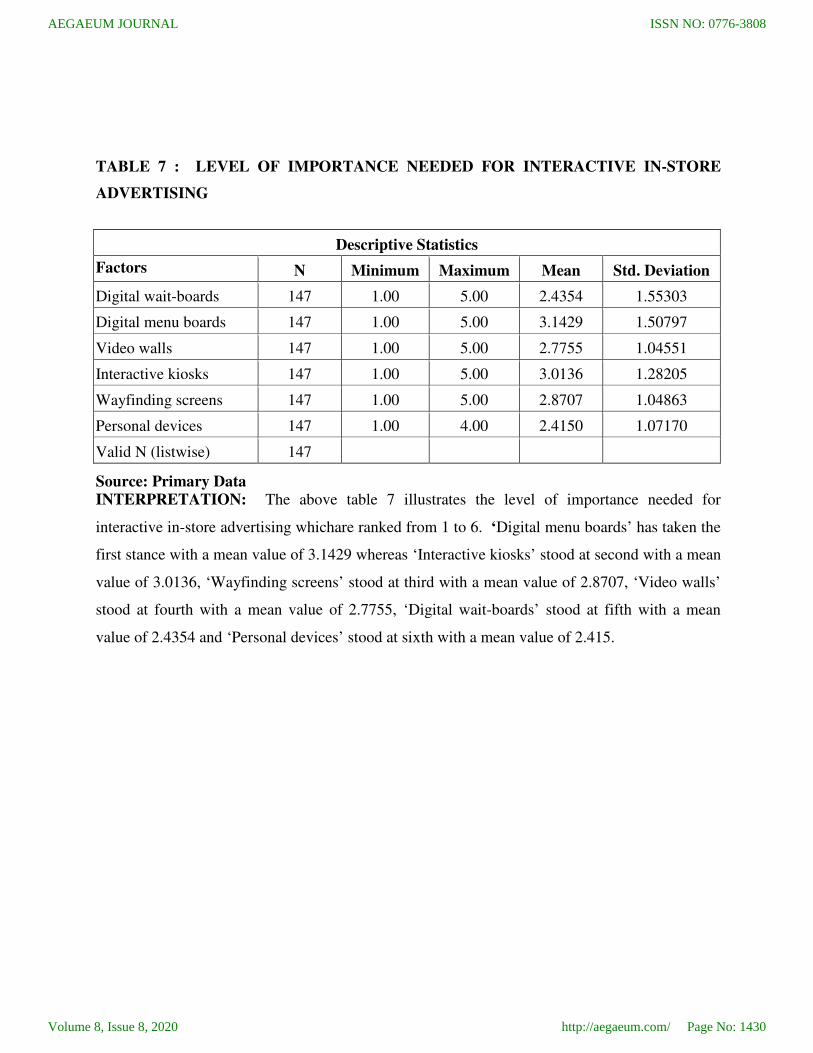
TABLE 7 : LEVEL OF IMPORTANCE NEEDED FOR INTERACTIVE IN-STORE
ADVERTISING
Descriptive Statistics
Factors N Minimum Maximum Mean Std. Deviation
Digital wait-boards 147 1.00 5.00 2.4354 1.55303
Digital menu boards 147 1.00 5.00 3.1429 1.50797
Video walls 147 1.00 5.00 2.7755 1.04551
Interactive kiosks 147 1.00 5.00 3.0136 1.28205
Wayfinding screens 147 1.00 5.00 2.8707 1.04863
Personal devices 147 1.00 4.00 2.4150 1.07170
Valid N (listwise) 147
Source: Primary Data
INTERPRETATION: The above table 7 illustrates the level of importance needed for
interactive in-store advertising whichare ranked from 1 to 6. ‘Digital menu boards’ has taken the
first stance with a mean value of 3.1429 whereas ‘Interactive kiosks’ stood at second with a mean
value of 3.0136, ‘Wayfinding screens’ stood at third with a mean value of 2.8707, ‘Video walls’
stood at fourth with a mean value of 2.7755, ‘Digital wait-boards’ stood at fifth with a mean
value of 2.4354 and ‘Personal devices’ stood at sixth with a mean value of 2.415.
ISSN NO: 0776-3808
http://aegaeum.com/ Page No: 1430
AEGAEUM JOURNAL
Volume 8, Issue 8, 2020
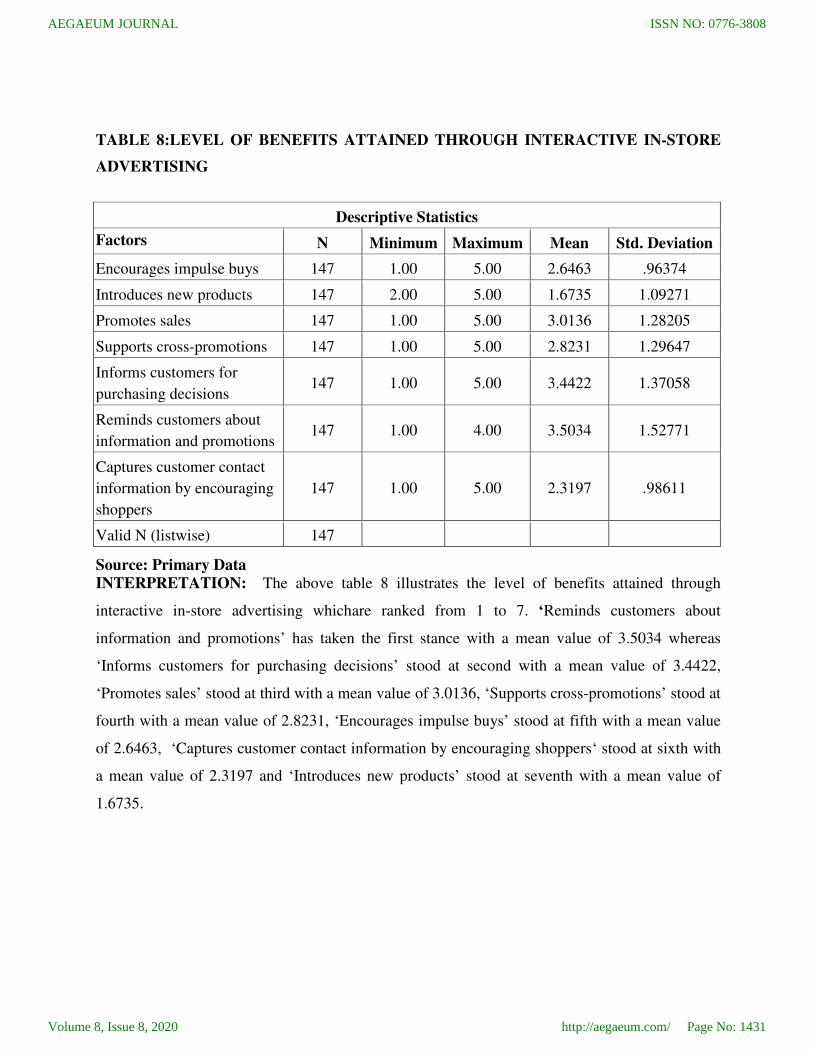
TABLE 8:LEVEL OF BENEFITS ATTAINED THROUGH INTERACTIVE IN-STORE
ADVERTISING
Descriptive Statistics
Factors N Minimum Maximum Mean Std. Deviation
Encourages impulse buys 147 1.00 5.00 2.6463 .96374
Introduces new products 147 2.00 5.00 1.6735 1.09271
Promotes sales 147 1.00 5.00 3.0136 1.28205
Supports cross-promotions 147 1.00 5.00 2.8231 1.29647
Informs customers for
purchasing decisions 147 1.00 5.00 3.4422 1.37058
Reminds customers about
information and promotions 147 1.00 4.00 3.5034 1.52771
Captures customer contact
information by encouraging
shoppers
147 1.00 5.00 2.3197 .98611
Valid N (listwise) 147
Source: Primary Data
INTERPRETATION: The above table 8 illustrates the level of benefits attained through
interactive in-store advertising whichare ranked from 1 to 7. ‘Reminds customers about
information and promotions’ has taken the first stance with a mean value of 3.5034 whereas
‘Informs customers for purchasing decisions’ stood at second with a mean value of 3.4422,
‘Promotes sales’ stood at third with a mean value of 3.0136, ‘Supports cross-promotions’ stood at
fourth with a mean value of 2.8231, ‘Encourages impulse buys’ stood at fifth with a mean value
of 2.6463, ‘Captures customer contact information by encouraging shoppers‘ stood at sixth with
a mean value of 2.3197 and ‘Introduces new products’ stood at seventh with a mean value of
1.6735.
ISSN NO: 0776-3808
http://aegaeum.com/ Page No: 1431
AEGAEUM JOURNAL
Volume 8, Issue 8, 2020
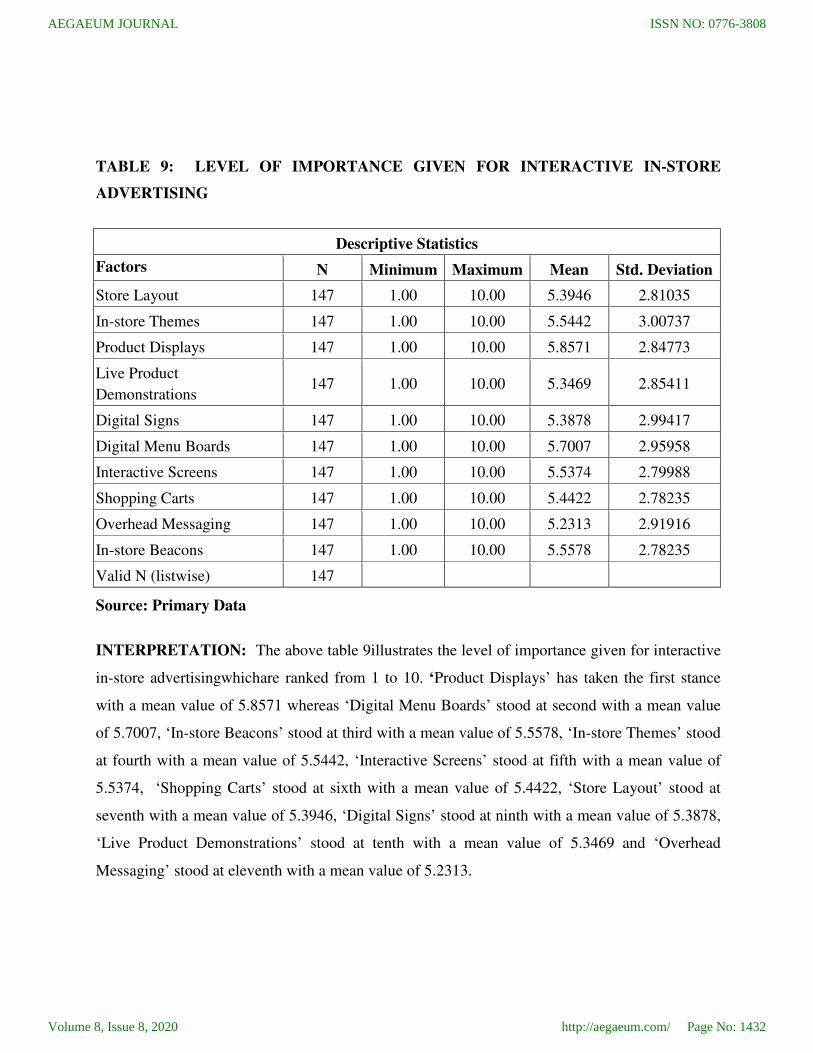
TABLE 9: LEVEL OF IMPORTANCE GIVEN FOR INTERACTIVE IN-STORE
ADVERTISING
Descriptive Statistics
Factors N Minimum Maximum Mean Std. Deviation
Store Layout 147 1.00 10.00 5.3946 2.81035
In-store Themes 147 1.00 10.00 5.5442 3.00737
Product Displays 147 1.00 10.00 5.8571 2.84773
Live Product
Demonstrations 147 1.00 10.00 5.3469 2.85411
Digital Signs 147 1.00 10.00 5.3878 2.99417
Digital Menu Boards 147 1.00 10.00 5.7007 2.95958
Interactive Screens 147 1.00 10.00 5.5374 2.79988
Shopping Carts 147 1.00 10.00 5.4422 2.78235
Overhead Messaging 147 1.00 10.00 5.2313 2.91916
In-store Beacons 147 1.00 10.00 5.5578 2.78235
Valid N (listwise) 147
Source: Primary Data
INTERPRETATION: The above table 9illustrates the level of importance given for interactive
in-store advertisingwhichare ranked from 1 to 10. ‘Product Displays’ has taken the first stance
with a mean value of 5.8571 whereas ‘Digital Menu Boards’ stood at second with a mean value
of 5.7007, ‘In-store Beacons’ stood at third with a mean value of 5.5578, ‘In-store Themes’ stood
at fourth with a mean value of 5.5442, ‘Interactive Screens’ stood at fifth with a mean value of
5.5374, ‘Shopping Carts’ stood at sixth with a mean value of 5.4422, ‘Store Layout’ stood at
seventh with a mean value of 5.3946, ‘Digital Signs’ stood at ninth with a mean value of 5.3878,
‘Live Product Demonstrations’ stood at tenth with a mean value of 5.3469 and ‘Overhead
Messaging’ stood at eleventh with a mean value of 5.2313.
ISSN NO: 0776-3808
http://aegaeum.com/ Page No: 1432
AEGAEUM JOURNAL
Volume 8, Issue 8, 2020
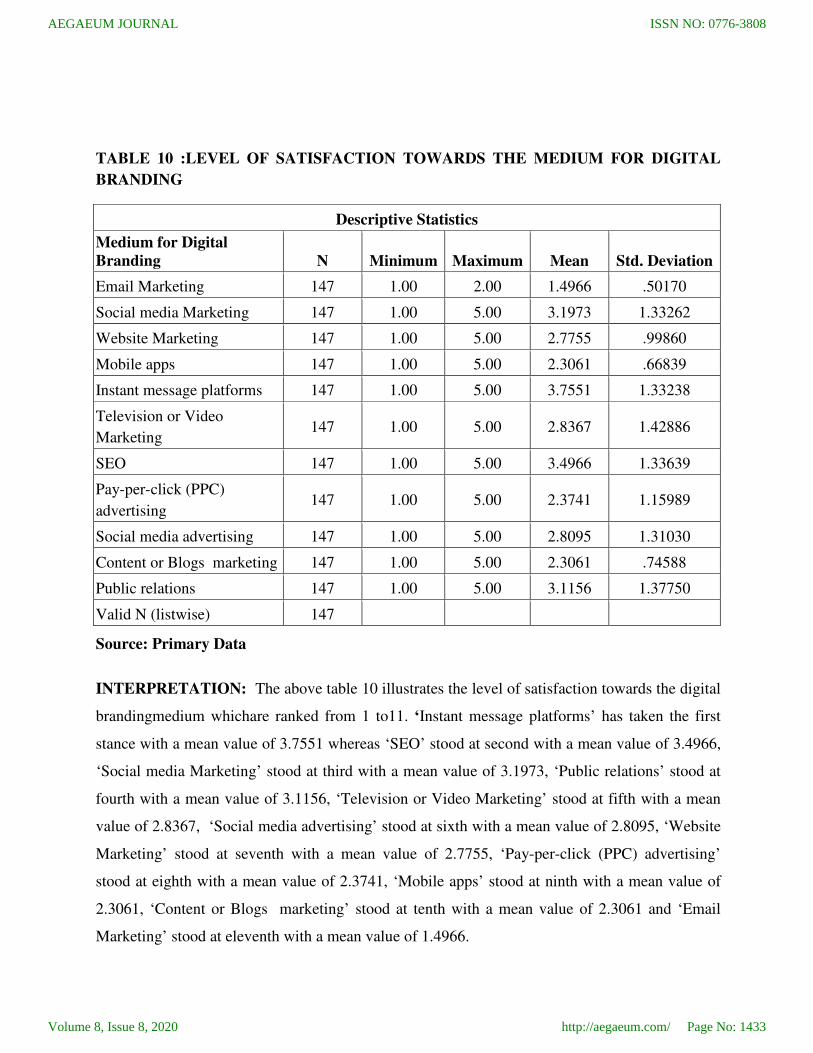
TABLE 10 :LEVEL OF SATISFACTION TOWARDS THE MEDIUM FOR DIGITAL
BRANDING
Descriptive Statistics
Medium for Digital
Branding N Minimum Maximum Mean Std. Deviation
Email Marketing 147 1.00 2.00 1.4966 .50170
Social media Marketing 147 1.00 5.00 3.1973 1.33262
Website Marketing 147 1.00 5.00 2.7755 .99860
Mobile apps 147 1.00 5.00 2.3061 .66839
Instant message platforms 147 1.00 5.00 3.7551 1.33238
Television or Video
Marketing 147 1.00 5.00 2.8367 1.42886
SEO 147 1.00 5.00 3.4966 1.33639
Pay-per-click (PPC)
advertising 147 1.00 5.00 2.3741 1.15989
Social media advertising 147 1.00 5.00 2.8095 1.31030
Content or Blogs marketing 147 1.00 5.00 2.3061 .74588
Public relations 147 1.00 5.00 3.1156 1.37750
Valid N (listwise) 147
Source: Primary Data
INTERPRETATION: The above table 10 illustrates the level of satisfaction towards the digital
brandingmedium whichare ranked from 1 to11. ‘Instant message platforms’ has taken the first
stance with a mean value of 3.7551 whereas ‘SEO’ stood at second with a mean value of 3.4966,
‘Social media Marketing’ stood at third with a mean value of 3.1973, ‘Public relations’ stood at
fourth with a mean value of 3.1156, ‘Television or Video Marketing’ stood at fifth with a mean
value of 2.8367, ‘Social media advertising’ stood at sixth with a mean value of 2.8095, ‘Website
Marketing’ stood at seventh with a mean value of 2.7755, ‘Pay-per-click (PPC) advertising’
stood at eighth with a mean value of 2.3741, ‘Mobile apps’ stood at ninth with a mean value of
2.3061, ‘Content or Blogs marketing’ stood at tenth with a mean value of 2.3061 and ‘Email
Marketing’ stood at eleventh with a mean value of 1.4966.
ISSN NO: 0776-3808
http://aegaeum.com/ Page No: 1433
AEGAEUM JOURNAL
Volume 8, Issue 8, 2020
FACTOR ANALYSIS
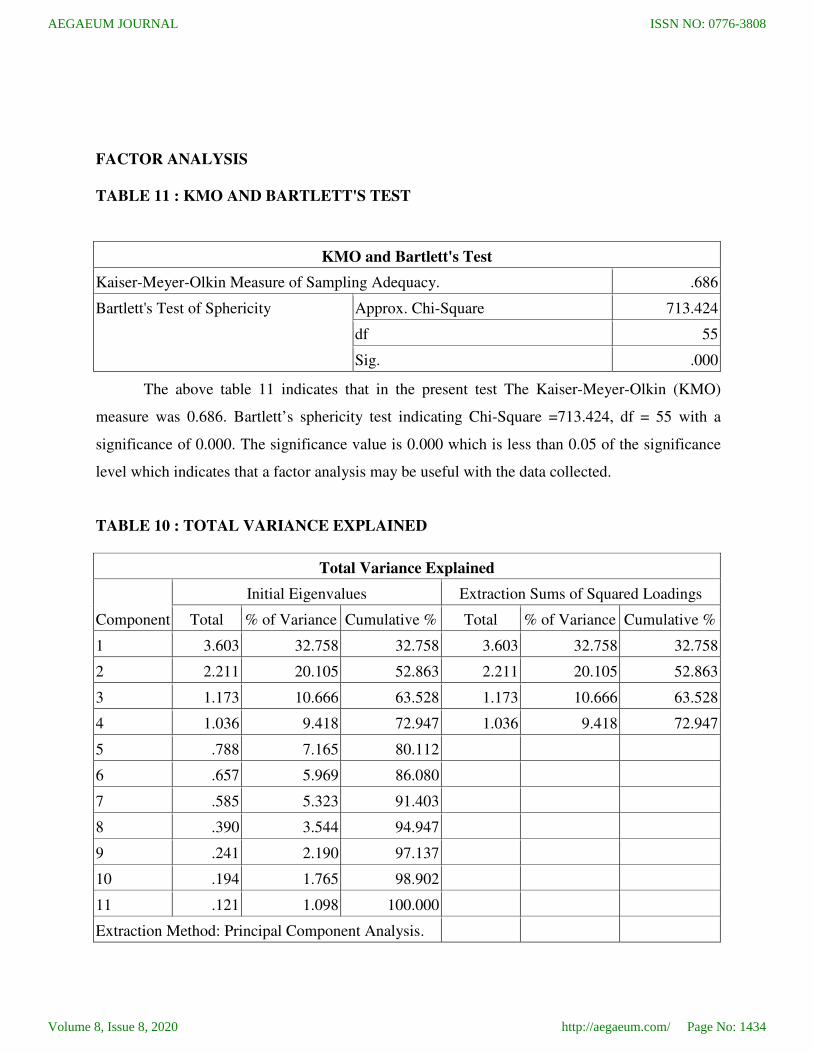
TABLE 11 : KMO AND BARTLETT'S TEST
KMO and Bartlett's Test
Kaiser-Meyer-Olkin Measure of Sampling Adequacy. .686
Bartlett's Test of Sphericity Approx. Chi-Square 713.424
df 55
Sig. .000
The above table 11 indicates that in the present test The Kaiser-Meyer-Olkin (KMO)
measure was 0.686. Bartlett’s sphericity test indicating Chi-Square =713.424, df = 55 with a
significance of 0.000. The significance value is 0.000 which is less than 0.05 of the significance
level which indicates that a factor analysis may be useful with the data collected.
TABLE 10 : TOTAL VARIANCE EXPLAINED
Total Variance Explained
Component
Initial Eigenvalues Extraction Sums of Squared Loadings
Total % of Variance Cumulative % Total % of Variance Cumulative %
1 3.603 32.758 32.758 3.603 32.758 32.758
2 2.211 20.105 52.863 2.211 20.105 52.863
3 1.173 10.666 63.528 1.173 10.666 63.528
4 1.036 9.418 72.947 1.036 9.418 72.947
5 .788 7.165 80.112
6 .657 5.969 86.080
7 .585 5.323 91.403
8 .390 3.544 94.947
9 .241 2.190 97.137
10 .194 1.765 98.902
11 .121 1.098 100.000
Extraction Method: Principal Component Analysis.
ISSN NO: 0776-3808
http://aegaeum.com/ Page No: 1434
AEGAEUM JOURNAL
Volume 8, Issue 8, 2020
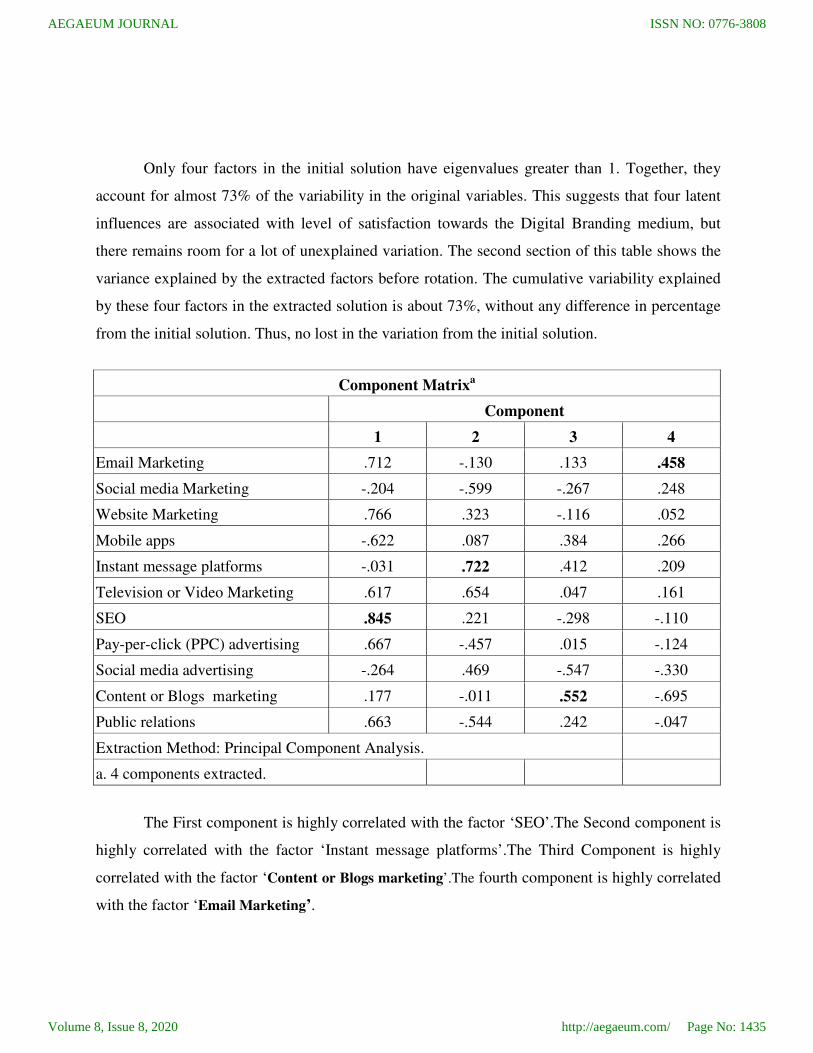
Only four factors in the initial solution have eigenvalues greater than 1. Together, they
account for almost 73% of the variability in the original variables. This suggests that four latent
influences are associated with level of satisfaction towards the Digital Branding medium, but
there remains room for a lot of unexplained variation. The second section of this table shows the
variance explained by the extracted factors before rotation. The cumulative variability explained
by these four factors in the extracted solution is about 73%, without any difference in percentage
from the initial solution. Thus, no lost in the variation from the initial solution.
Component Matrixa
Component
1 2 3 4
Email Marketing .712 -.130 .133 .458
Social media Marketing -.204 -.599 -.267 .248
Website Marketing .766 .323 -.116 .052
Mobile apps -.622 .087 .384 .266
Instant message platforms -.031 .722 .412 .209
Television or Video Marketing .617 .654 .047 .161
SEO .845 .221 -.298 -.110
Pay-per-click (PPC) advertising .667 -.457 .015 -.124
Social media advertising -.264 .469 -.547 -.330
Content or Blogs marketing .177 -.011 .552 -.695
Public relations .663 -.544 .242 -.047
Extraction Method: Principal Component Analysis.
a. 4 components extracted.
The First component is highly correlated with the factor ‘SEO’.The Second component is
highly correlated with the factor ‘Instant message platforms’.The Third Component is highly
correlated with the factor ‘Content or Blogs marketing’.The fourth component is highly correlated
with the factor ‘Email Marketing’.
ISSN NO: 0776-3808
http://aegaeum.com/ Page No: 1435
AEGAEUM JOURNAL
Volume 8, Issue 8, 2020
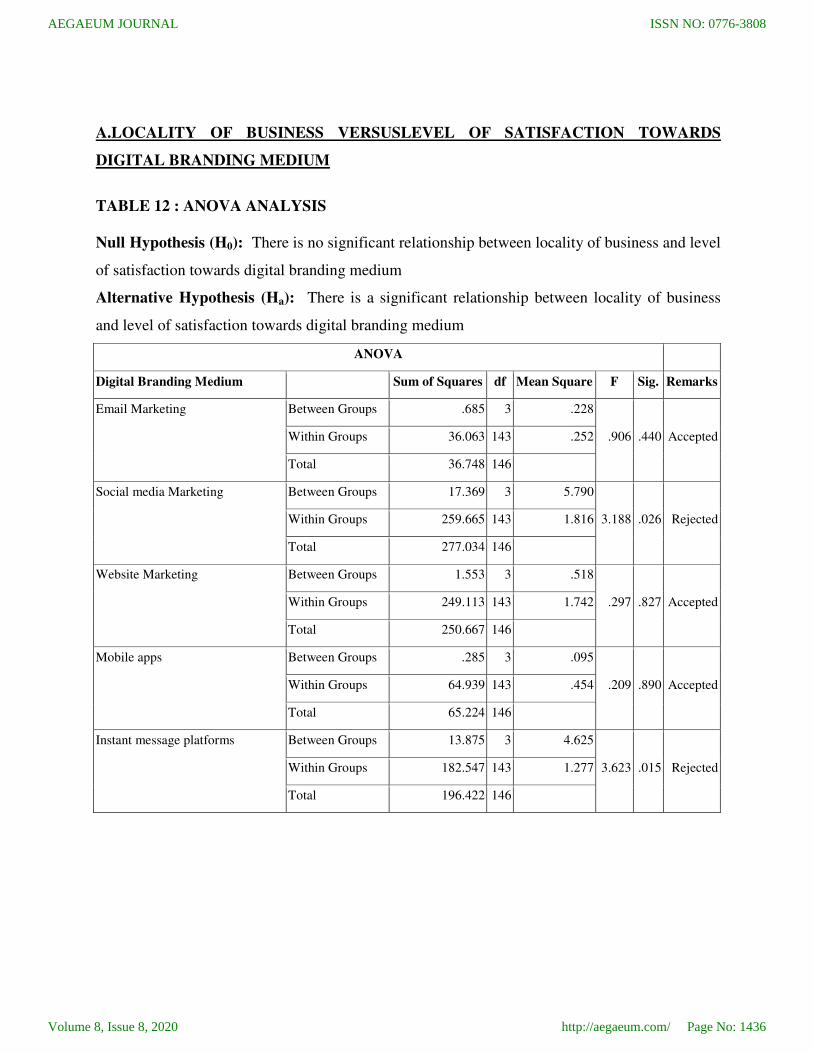
A.LOCALITY OF BUSINESS VERSUSLEVEL OF SATISFACTION TOWARDS
DIGITAL BRANDING MEDIUM
TABLE 12 : ANOVA ANALYSIS
Null Hypothesis (H0): There is no significant relationship between locality of business and level
of satisfaction towards digital branding medium
Alternative Hypothesis (Ha): There is a significant relationship between locality of business
and level of satisfaction towards digital branding medium
ANOVA
Digital Branding Medium Sum of Squares df Mean Square F Sig. Remarks
Email Marketing Between Groups .685 3 .228
.906 .440 Accepted Within Groups 36.063 143 .252
Total 36.748 146
Social media Marketing Between Groups 17.369 3 5.790
3.188 .026 Rejected Within Groups 259.665 143 1.816
Total 277.034 146
Website Marketing Between Groups 1.553 3 .518
.297 .827 Accepted Within Groups 249.113 143 1.742
Total 250.667 146
Mobile apps Between Groups .285 3 .095
.209 .890 Accepted Within Groups 64.939 143 .454
Total 65.224 146
Instant message platforms Between Groups 13.875 3 4.625
3.623 .015 Rejected Within Groups 182.547 143 1.277
Total 196.422 146
ISSN NO: 0776-3808
http://aegaeum.com/ Page No: 1436
AEGAEUM JOURNAL
Volume 8, Issue 8, 2020

Television or Video Marketing Between Groups 10.447 3 3.482
2.001 .116 Accepted Within Groups 248.832 143 1.740
Total 259.279 146
SEO Between Groups 4.676 3 1.559
.876 .455 Accepted Within Groups 254.508 143 1.780
Total 259.184 146
Pay-per-click (PPC) advertising Between Groups 6.939 3 2.313
1.136 .337 Accepted Within Groups 291.143 143 2.036
Total 298.082 146
Social media advertising Between Groups 3.740 3 1.247
2.301 .080 Accepted Within Groups 77.484 143 .542
Total 81.224 146
Content or Blogs marketing Between Groups 7.368 3 2.456
2.541 .059 Accepted Within Groups 138.224 143 .967
Total 145.592 146
Public relations Between Groups 8.056 3 2.685
1.520 .212 Accepted Within Groups 252.692 143 1.767
Total 260.748 146
The ANOVA table no.12 indicates the probability value of ANOVA at 5% level of significance stated that
the null hypothesis is accepted between the Locality of business with Email Marketing, Website Marketing, Mobile
apps, Television or Video Marketing, SEO, Pay-per-click (PPC) advertising, Social media advertising, Content or
Blogs marketing and Public relations. There is no significant association between the Locality of business with
Email Marketing, Website Marketing, Mobile apps, Television or Video Marketing, SEO, Pay-per-click (PPC)
advertising, Social media advertising, Content or Blogs marketing and Public relations.
ISSN NO: 0776-3808
http://aegaeum.com/ Page No: 1437
AEGAEUM JOURNAL
Volume 8, Issue 8, 2020
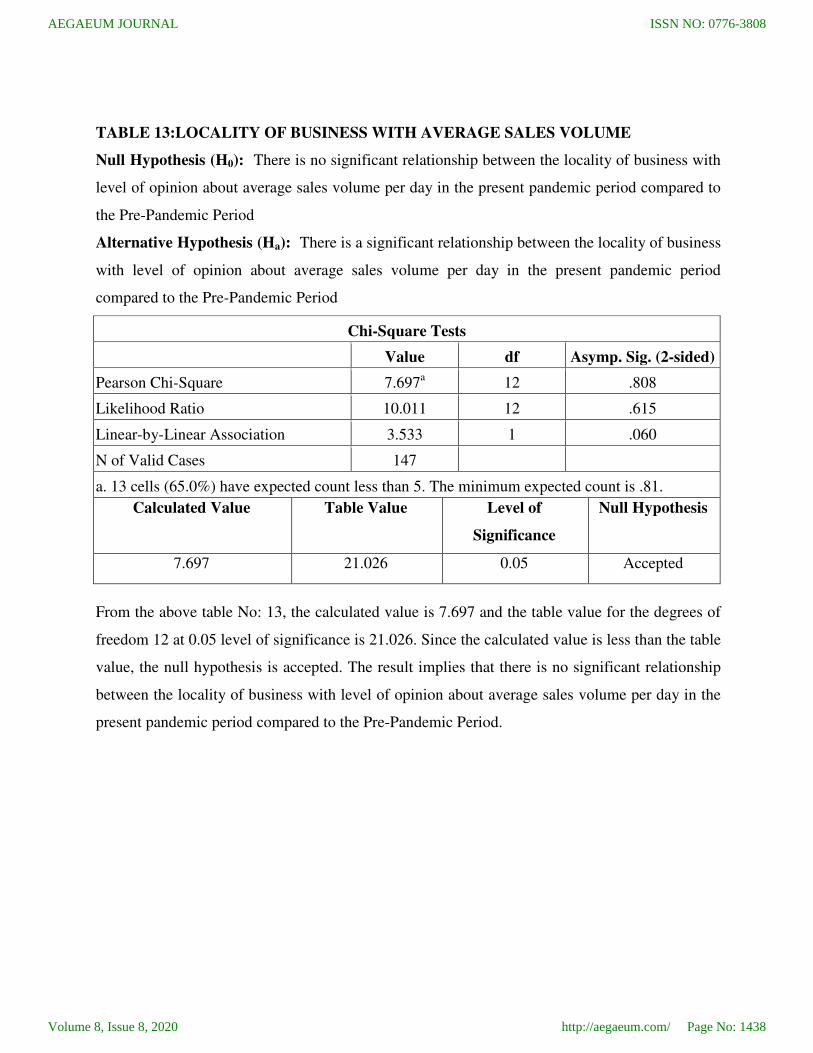
TABLE 13:LOCALITY OF BUSINESS WITH AVERAGE SALES VOLUME
Null Hypothesis (H0): There is no significant relationship between the locality of business with
level of opinion about average sales volume per day in the present pandemic period compared to
the Pre-Pandemic Period
Alternative Hypothesis (Ha): There is a significant relationship between the locality of business
with level of opinion about average sales volume per day in the present pandemic period
compared to the Pre-Pandemic Period
Chi-Square Tests
Value df Asymp. Sig. (2-sided)
Pearson Chi-Square 7.697a 12 .808
Likelihood Ratio 10.011 12 .615
Linear-by-Linear Association 3.533 1 .060
N of Valid Cases 147
a. 13 cells (65.0%) have expected count less than 5. The minimum expected count is .81.
Calculated Value Table Value Level of
Significance
Null Hypothesis
7.697 21.026 0.05 Accepted
From the above table No: 13, the calculated value is 7.697 and the table value for the degrees of
freedom 12 at 0.05 level of significance is 21.026. Since the calculated value is less than the table
value, the null hypothesis is accepted. The result implies that there is no significant relationship
between the locality of business with level of opinion about average sales volume per day in the
present pandemic period compared to the Pre-Pandemic Period.
ISSN NO: 0776-3808
http://aegaeum.com/ Page No: 1438
AEGAEUM JOURNAL
Volume 8, Issue 8, 2020
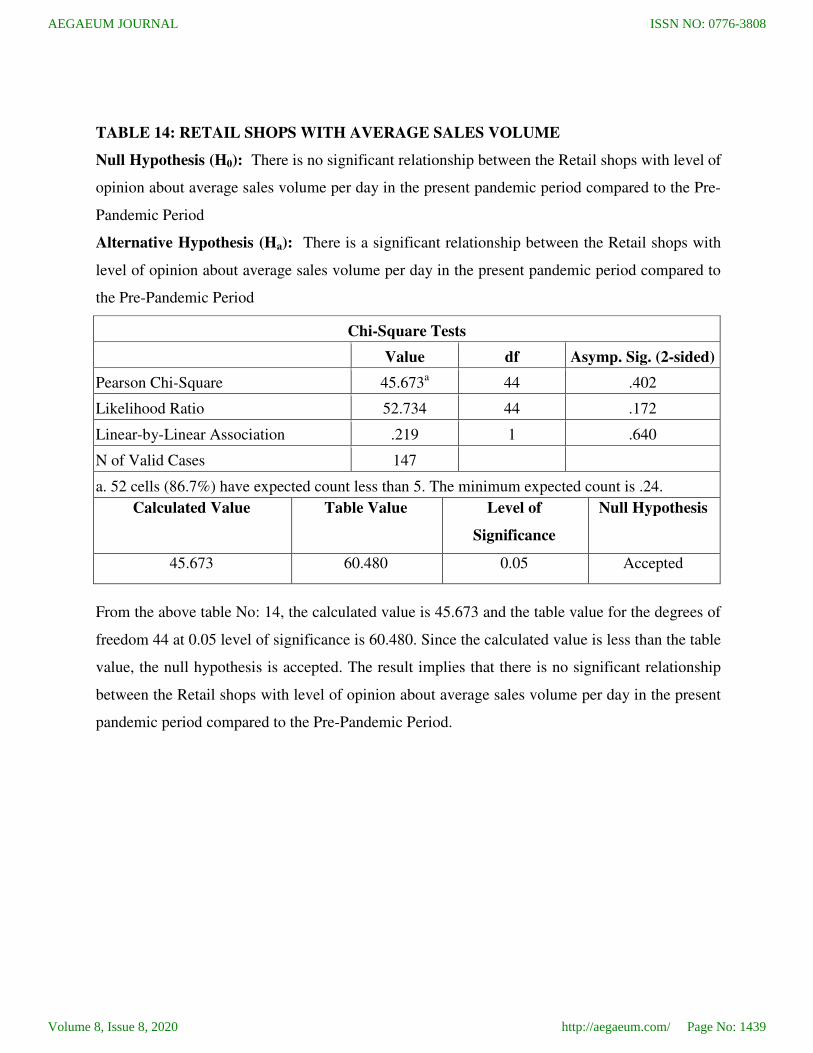
TABLE 14: RETAIL SHOPS WITH AVERAGE SALES VOLUME
Null Hypothesis (H0): There is no significant relationship between the Retail shops with level of
opinion about average sales volume per day in the present pandemic period compared to the Pre-
Pandemic Period
Alternative Hypothesis (Ha): There is a significant relationship between the Retail shops with
level of opinion about average sales volume per day in the present pandemic period compared to
the Pre-Pandemic Period
Chi-Square Tests
Value df Asymp. Sig. (2-sided)
Pearson Chi-Square 45.673a 44 .402
Likelihood Ratio 52.734 44 .172
Linear-by-Linear Association .219 1 .640
N of Valid Cases 147
a. 52 cells (86.7%) have expected count less than 5. The minimum expected count is .24.
Calculated Value Table Value Level of
Significance
Null Hypothesis
45.673 60.480 0.05 Accepted
From the above table No: 14, the calculated value is 45.673 and the table value for the degrees of
freedom 44 at 0.05 level of significance is 60.480. Since the calculated value is less than the table
value, the null hypothesis is accepted. The result implies that there is no significant relationship
between the Retail shops with level of opinion about average sales volume per day in the present
pandemic period compared to the Pre-Pandemic Period.
ISSN NO: 0776-3808
http://aegaeum.com/ Page No: 1439
AEGAEUM JOURNAL
Volume 8, Issue 8, 2020

4. RESULTS AND DISCUSSIONS
4.1 FINDINGS
• 34.7% of the respondents’ locality’ of business is ‘Urban’ and 28.6% of the respondents’
locality of business is ‘Semi-Rural’.
• 12.9% of the respondents’ retail shops belong to ‘Departmental Store’ and the same level of
respondents’ retail shops belongs to ‘Supermarkets’.
• Majority 54.4% of the respondents stated ‘Very low’ average sales volume per day in the
present pandemic period compares to the pre-pandemic period
• 27.2% of the respondents are highly influenced by ‘Digital Ads’ for Digital Branding.
• The level of awareness towards the multi-channel medium for digital branding which are
ranked from ‘Display advertising’ has taken the first stance with a mean value of 3.381 and
‘Online PR’ stood at last with a mean value of 2.2653.
• The mean ranking according to the importance towards integral part of digital branding which
are ranked from ‘Website’ has taken the first stance with a mean value of 4.9048 and
‘Influencer Marketing’ stood at last with a mean value of 4.1361.
• The level of importance needed for interactive in-store advertising which are ranked from
‘Digital menu boards’ has taken the first stance with a mean value of 3.1429 and ‘Personal
devices’ stood at sixth with a mean value of 2.415.
• The level of benefits attained through interactive in-store advertising which are ranked from
‘Reminds customers about information and promotions’ has taken the first stance with a
mean value of 3.5034 and ‘Introduces new products’ stood at last with a mean value of
1.6735.
• The level of importance given for interactive in-store advertising which are ranked from
‘Product Displays’ has taken the first stance with a mean value of 5.8571 and ‘Overhead
Messaging’ stood at eleventh with a mean value of 5.2313.
• The level of satisfaction towards the digital branding medium which are ranked from ‘Instant
message platforms’ has taken the first stance with a mean value of 3.7551 and ‘Email
Marketing’ stood at eleventh with a mean value of 1.4966.
ISSN NO: 0776-3808
http://aegaeum.com/ Page No: 1440
AEGAEUM JOURNAL
Volume 8, Issue 8, 2020
• There is no significant association between the Locality of business with Email Marketing,
Website Marketing, Mobile apps, Television or Video Marketing, SEO, Pay-per-click (PPC)
advertising, Social media advertising, Content or Blogs marketing and Public relations.
• There is no significant relationship between the localities of business with level of opinion
about average sales volume per day in the present pandemic period compared to the Pre-
Pandemic Period.
• There is no significant relationship between the Retail shops with level of opinion about
average sales volume per day in the present pandemic period compared to the Pre-Pandemic
Period.
4.2 SUGGESTIONS
• The study had only 34.7% of its respondents from an urban area and the remainder were
rural or semi- urban. If we take that ratio across the other results arrived it a very clear
view of the disparity is observed. Most of the respondents who are affected by the digital
branding and advertising were from the urban areas. This in itself is a quick note that the
market is still under reached by digital marketing. Rural customers may need a different
approach with digital marketing getting to them. But nevertheless the markets wait to be
reached and captured.
• A majority of 54 % of the respondents reported very low sales during the pandemic time.
That is a staggering portion of the industry that has gone under water during this time.
The assumption is that essential goods like convenience store and departmental store saw
a spike in sales in this time as 6.8% of them reported very high sales. The majority still
hadn’t found a market share to rebrand and sell their products. Therefore much work and
strategy are the need of the hour.
• Digital branding is still in its infancy as much of the advertisement were from display
banners on the website and other social media sites. Not many reported being aware of the
other mediums of digital branding. A targeted approach is the need of the hour and a one
size fits all approach may not give the desired results.
• It is very important to connect the customer to the brand and its products. The survey
showed that having a digital display board in the store to connect their online experience
ISSN NO: 0776-3808
http://aegaeum.com/ Page No: 1441
AEGAEUM JOURNAL
Volume 8, Issue 8, 2020
will be useful to help customers know their products and make decisions on purchasing
more. Constant reminders through messaging will keep the customers mind fresh on the
promotions and offers in the store.
• Social media marketing is the next in thing with regard to digital branding. It would do
businesses well to shift their focus to locating their customer base and send focused
advertising to them either directly to them or to their social media sites. The search engine
marketing will help target those customers who are searching for similar products.
4.3 CONCLUSION
No doubt it has been a difficult time to do business or own a retail company. With the
pandemic making all previously existing needs and wants obsolete leaving just a few essentials to
be craved for and all the others becoming irrelevant. In such a time businesses are looking for
ways to still connect with their customers and have their reach to them. The study is proof that
digital branding can be incorporated into new mediums and good results can be seen. Part why
the move to digital marketing and branding can be hard is because of the uncertainty in the
migration and change. There has not been one like this before the usual way of gauging customer
likes and preferences which could be lost because of the faceless contact approach.
Creating awareness of the branding is key to a sustained multimedia approach to branding
and marketing. As more buying and selling moves online, there will be better avenues to create
an online presence and unique brand identity which will satisfy customer preferences and grow to
be an evolving way to grow the businesses online face.
Reference
1. Rizwan Raheem Ahmed et al. (2016). Impact of Digital Media on Brand Loyalty and Brand
Positioning. New Media and Mass Communication. 45 (1), 16-28.
2. Sammut-Bonnici, Tanya. (2015). Brand and Branding. 10.1002/9781118785317.weom120161.
3. Yi Zhang. (2015). The Impact of Brand Image on Consumer Behaviour: A Literature
Review. Open Journal of Business and Management, 3 (1), 58-62.
4. Deepak Verma and Madhu Bala. (2018). A Critical Review of Digital Marketing. International
Journal of Management, IT & Engineering. 8 (10), 321-339.
ISSN NO: 0776-3808
http://aegaeum.com/ Page No: 1442
AEGAEUM JOURNAL
Volume 8, Issue 8, 2020

5. P.Sathya. (2017). A Study on Digital Marketing and its Impact. International Journal of Science
and Research (IJSR). 6 (2), 866-868.
6. https://retailnext.net/en/blog/key-aspects-in-creating-a-sustainable-retail-branding-strategy
7. https://www.smartinsights.com/online-brand-strategy/brand-development/digital-branding-
definition/
ISSN NO: 0776-3808
http://aegaeum.com/ Page No: 1443
AEGAEUM JOURNAL
Volume 8, Issue 8, 2020