
A study of three iron-based oxygen carriers in a Chemical...
70
A study of three iron-based oxygen carriers in a Chemical Looping Combustion process with a Victorian brown coal Master of Science Thesis in Master program Innovative and sustainable chemical engineering, MPISC Tove Karlsson Department of Chemical and Biological Engineering Division of Energy and Materials CHALMERS UNIVERSITY OF TECHNOLOGY 412 96 Gothenburg, Sweden, 2014 This work was performed at the Department of Chemical Engineering at Monash University, Australia
Transcript of A study of three iron-based oxygen carriers in a Chemical...

A study of three iron-based oxygen
carriers in a Chemical Looping
Combustion process with a Victorian
brown coal
Master of Science Thesis in Master program Innovative and sustainable
chemical engineering, MPISC
Tove Karlsson
Department of Chemical and Biological Engineering
Division of Energy and Materials
CHALMERS UNIVERSITY OF TECHNOLOGY
412 96 Gothenburg, Sweden, 2014
This work was performed at the Department of Chemical Engineering at Monash University,
Australia


A study of three iron-based oxygen
carriers in a Chemical Looping
Combustion process with a Victorian
brown coal
TOVE KARLSSON
Supervisors: Professor Sankar Bhattacharya and Mr Sharmen Rajendran
Department of Chemical Engineering, Monash University, Australia
Examiner: Associate Professor Henrik Leion
Chemical and Biological Engineering, Environmental Inorganic Chemistr
Department of Chemical & Biological Engineering
CHALMERS UNIVERSITY OF TECHNOLOGY
Göteborg, Sweden 2014

i
A study of three iron-based oxygen carriers in a Chemical
Looping Combustion process with a Victorian brown coal
TOVE KARLSSON
© TOVE KARLSSON, 2014
Department of Chemical & Biological Engineering
Chalmers University of Technology
SE-412 96 Göteborg
Sweden
This work was performed at the Department of Chemical Engineering at Monash University, Australia,
20th of January to the 30
th of May 2014.
Cover:
A SEM picture of a fresh WA-1 particle at a magnification of 500x
Division of Energy and Materials
Göteborg, Sweden 2014

ii
ACKNOWLEDGEMENT
The author acknowledges the support of Monash University and the Chemical Engineering
department for their hospitality and help for this Master thesis project. A thanks to ÅForsk
and Fredrika-Bremer-Förbundets stipendiestiftelse (Fredrika Bremer Association Scholarship
Foundation) for making the collaboration between Chalmers University of technology,
Sweden and Monash University, Australia possible.
iii
ABSTRACT It is generally accepted that the rising global temperature is due to the increasing
concentration of greenhouse gases in the atmosphere, where the majority of the global
greenhouse gases emission is derived from energy production [1]. Coal is extensively used all
over the world to meet the local energy needs due to its wide availability and low cost. If coal
is to continue to serve as a primary energy source new technologies with higher efficiency or
methods of less energy intensive capture of carbon dioxide is needed [2]. One method is
Chemical Looping Combustion (CLC). In CLC, a metal oxide is used to transport oxygen for
oxidation of the fuel, and is termed oxygen carrier (OC).
This study consisted of two parts involving both experimental and modelling aspects. The
modelling part in this study is a preliminary model aimed at simulating the operation of a
10kWth fluidized bed reactor system. In the experimental part, Limonite and two iron ores
from Western Australia, denoted as WA-1 and WA-2, were used together with a Victorian
brown coal. The oxygen carriers were evaluated through Temperature Programed Reduction
(TPR), Temperature Programed Oxidation (TPO), Thermogravimetric Analysis (TGA) and in
a Fluidized bed reactor (FB). The fresh oxygen carrier, TGA sample residues and FB residues
were characterised with Scanning Electron Microscopy (SEM), Energy Dispersive X-Ray
Spectroscopy (EDX) and X-Ray Diffraction (XRD). The fresh oxygen carrier and FB residues
were also evaluated with Accelerated Surface Area and Porosimetry (ASAP).
Based on the results from the TPR/TPO and TGA experiment, the capacity of WA-1 was
found to be the largest on account of its high Fe2O3 content. The three iron ores showed a
stable cyclic behaviour when evaluated for 5 cycles and full conversion of coal was evident
from the TGA experiments. Limonite showed the best redox reactivity compared to the other
oxygen carriers even though it contained the least amount of Fe2O3. The WA-1 and WA-2
samples showed a conversion of around 40%, when Limonite had values around 80% after 10
cycles in a fluidized bed reactor (FB). The OCs appeared to lose their reactivity in the first
few cycles, but after 10 cycles showed a stable behaviour. The reduced OCs after the 10th
cycle showed the presence of both Fe2O3 and Fe3O4. There was no agglomeration in any of
the experiments. The coal used in this study shows promising results for a future CLC process
in terms of conversion. The results from the experiments showed that Limonite was the best
OC for a future CLC process using the coal tested. Porosity and the content of other minerals
in the ore are the factors for its good reactivity.
The process model developed using Aspen Plus were based on two types of reactors with the
first being RGibbs reactor operating on the principal of minimization of Gibbs free energy.
The second one was RBatch reactor using a number of different kinetic parameters. The
results showed that Fe2O3 is a good starting point for a CLC unit as an oxygen carrier for use
with the Victorian brown coal. An almost complete conversion in the fuel reactor and total
conversion in the air reactor was obtained for the models based on the Gibbs reactors. A
number of kinetic parameters were studied in the model with batch reactors, giving a wide
range of results. The air reactor showed rate dependence to the inflow of O2 into the reactor.
Further development of kinetics and also comparison between experimental and model
predictions needs to be done.

iv
TABLE OF CONTENTS
1. INTRODUCTION .................................................................................................................. 5
1.1 Background ................................................................................................................................... 5
1.1.1 Chemical Looping Combustion .............................................................................................. 6
1.1.2 Coal ........................................................................................................................................ 8
1.1.3 Oxygen carriers ...................................................................................................................... 9
1.1.4 Working CLC units .............................................................................................................. 11
1.1.5 Studies of Victorian Brown coal .......................................................................................... 12
1.2 Objectives .................................................................................................................................... 13
1.3 Boundaries ................................................................................................................................... 13
1.4 Issues to be examined .................................................................................................................. 13
2. MATERIALS ....................................................................................................................... 14
3. METHODOLOGY ............................................................................................................... 16
3.1 Temperature programmed reduction/oxidation (TPR/TPO) ....................................................... 16
3.2 Thermogravimetric analysis (TGA) ............................................................................................ 17
3.3 Fluidized bed reactor ................................................................................................................... 18
3.3.1 Characterization of oxygen carriers ...................................................................................... 19
3.4 Aspen Plus modeling ................................................................................................................... 20
3.4.1 Gibbs free energy model ...................................................................................................... 20
3.4.2 A CLC model based on kinetic values ................................................................................. 21
4. RESULTS ............................................................................................................................. 23
4.1 TPR/TPO – Capacity and Reactivity of OC ................................................................................ 23
4.2 TGA – Redox Reaction with Coal............................................................................................... 25
4.2.1 SEM Images of the Fresh and Used OC ............................................................................... 28
4.2.2 EDX Analysis of fresh samples and samples in the TGA .................................................... 29
4.2.3 XRD Measurements of fresh samples and samples in the TGA .......................................... 30
4.3 Fluidized bed reactor ................................................................................................................... 31
4.3.1 SEM Images of Fresh and Used Oxygen Carriers ................................................................ 35
4.3.2 EDX Analysis of samples used in the Fluidized Bed Reactor .............................................. 35
4.3.3 XRD Analysis of samples from the Fluidized Bed Reactor ................................................. 36
4.3.4 ASAP measurements of the fresh and the used particles ..................................................... 37
4.4 Process modeling using Aspen Plus ............................................................................................ 38
4.4.1 Analysis of the model using only Gibbs reactors ................................................................. 38
4.4.2 Analysis using different kinetics .......................................................................................... 41
5. DISCUSSION ...................................................................................................................... 44

v
5.1 TPR/TPO ................................................................................................................................. 44
5.2 TGA ......................................................................................................................................... 44
5.3 Fluidized bed reactor ............................................................................................................... 45
5.4 Aspen plus modeling ............................................................................................................... 46
6. CONCLUSIONS .................................................................................................................. 48
7. RECOMMENDATIONS FOR FUTURE WORK ............................................................... 49
9. REFERENCES ..................................................................................................................... 50
APPENDIX 1-13

5
1. INTRODUCTION Changes in the earth´s climate have been a frequently discussed subject over the past few
decades. It is generally accepted that the rising mean global temperature is due to the
increasing concentration of greenhouse gases in the atmosphere. A significant rise in
temperature can cause drastic changes in nature such as rising ocean levels, extreme weather
fluctuations and melting of glaciers [3]. Around 65 % of the global greenhouse gas ( CO2,
NOx, SOx, CH4) emission is derived from energy production [1], with the most prevalent gas
being carbon dioxide [3, 4].
Today’s society uses large amounts of energy, and it is therefore important to find ways to
generate energy without releasing enormous amounts of carbon dioxide into the atmosphere.
Coal is extensively used all over the globe to meet our energy needs due to its wide
availability and low cost. However, new technologies with higher efficiency and methods of
more energy efficient capture of carbon dioxide are needed if coal is to continue to serve as a
primary energy source [2].
1.1 Background
Carbon dioxide Capture and Storage (CCS) is a process aimed at capturing carbon dioxide
from power generation facilities which produce vast amounts of CO2 and store it, preventing
its release into the atmosphere. The gas can be stored in different locations such as under the
ocean, deep saline formation, coal seams as well as depleted oil and gas reservoirs [2]. The
various storage possibilities and separation process are currently under development. The
Statoil Company has sequestered 14 million tons of CO2 between 1996 to the beginning of
2013 into the North Sea [5] with no evidence of leakage [6]. There are two ways that have
been proposed to sequester CO2 into the sea. The first way is to pump the CO2 to a depth of
1500m, where the CO2 and seawater solution would have a higher density than seawater and
would sink. The second way is to release CO2 at a depth of 3000 meters where it would form
liquid CO2 due to the high pressure, creating a CO2 lake. More studies needs to be done to
predict the future CO2 storage capacity. Studies about the environmental impact on marine
life [4] is also a necessity before such a location is used as a CO2 reservoir.
There are three main categories for carbon dioxide separation: Pre-combustion capture, Post-
combustion capture and Oxyfuel combustion [2, 4].
Pre-combustion is a process whereby the fuel is gasified to syngas and reacted with water to
produce carbon dioxide and hydrogen gas. The hydrogen gas can be used as a fuel in the
industry or used elsewhere. This method is close to commercial deployment [2, 7].
Post-combustion is the capture of carbon dioxide after combustion through separation
processes. Carbon dioxide is often separated by absorption processes with the most commonly
used absorbent being Monoethanolamine (MEA) [7]. The problem with MEA is the energy
intensive solvent regeneration process and that the solvent is corrosive in presence of O2 [4].

6
Post combustion capture is expensive and incurs large energy penalties, but is presently being
used for carbon dioxide separation in industrial and commercial processes [7].
Oxyfuel combustion is a technique where the fuel is burned with a gas mixture that does not
contain any nitrogen gas. Often the gases are carbon dioxide and oxygen [7]. Promising
results have been seen in Australia, but the technique still requires more research before it can
be used in an industrial scale [4].
1.1.1 Chemical Looping Combustion
The methods for CO2 separation mention above are expensive due to need of some sort of gas
separation. An alternative CCS technology that is in a developing stage is Chemical Looping
Combustion (CLC). A typical CLC reactor configuration consists of dual circulating fluidized
beds termed Air Reactor (AR) and Fuel Reactor (FR). CLC uses oxygen carriers (OC), which
are typically metal oxides, to transport oxygen to the FR where the metal oxide is reduced by
the fuel which gets oxidized in the process. Fuel used in CLC is usually either in a solid or
gaseous state, with limited studies using liquid fuels [8]. Gaseous fuel has been studied to a
greater depth compared to solid fuels. The fuel type causes differences in reactor
configuration and in what type of oxygen carriers to use. [9]. Solid fuels can be found in a
larger quantity than natural gas, and it is often less expensive, which makes it an attractive
fuel for CLC [10]. Chemical looping is aimed at generating a highly pure CO2 stream for
possible sequestration, but it can also be used to produce hydrogen. [9].
Figure 1 shows a schematic of the CLC process. Oxygen carriers transport oxygen to a FR
where the metal oxide is reduced, and the fuel is oxidized. The oxygen carrier is then oxidized
with air in the AR and can thereafter be used again [11]. The reactions taking place in the FR
are the devolatilization and gasification of the coal which leads to the generation of volatiles,
H2, CO and ash which are shown in Equations (1-3) [11, 12]. To obtain high conversion of the
fuel, good contact between the fuel and the oxygen carriers is needed [13] which is why
typically a fluidized bed reactor is employed for both reactors.
Air reactor
Fuel reactor
Fuel
CO2 H
2O
Ash
Air in
Air out
MexOy
MexO
y-1
Figure 1. Representation of a CLC process

7
Upon introduction of the oxygen carriers in the reactor, the reduction of the particles occur according
to Equations (4-6) [11]. The reduction reaction is often endothermic and the oxidation reaction is
exothermic. A point to note is that the total heat produced in both the reactors is the same as in
conventional combustion with air [14].
During combustion, a possible side reaction termed Water Gas Shift Reaction can occur
according to Equation (7) below [11].
In theory, the reaction in the air reactor is supposed to be only with the reduced oxygen
carriers as shown in Equation (8). If there is some char that bypasses into the AR, then the
char will burn in the reactor as shown in Equation (9) resulting in a loss of carbon dioxide
capture efficiency [11]. Due to the fact that combustion is done in absence of air, the
production of NOx is almost nonexistent in a CLC process, except for the nitrogen in the fuel
[15].
In this report the word oxidation and reduction will be used for the oxidation and reduction of
the oxygen carriers, while the oxidation of the fuel will be mentioned explicitly.
The temperature in the reactors is an important operation condition as different oxygen
carriers need different temperatures to perform at its best while minimizing agglomeration
and excessive sintering. The fuel also affects the CLC process, depending on its state, the
configuration of the system needs to be changed to obtain a good conversion [12]. Another
important factor that also affects the CLC process and the reactor configuration is the solids
circulation, large circulation flows have been shown to affect the carbon capture negatively
[16].
Agglomeration, fouling and corrosion of heat exchangers surfaces are important design
aspects to be considered. It is important to know how the bed material and fuel interact with
one another to minimize or eliminate problems in the fluidized bed and downstream
equipment. Laboratory based experiments are different to large fluidized bed reactors,

8
especially in relation to the separations of ash particles. This will affect the properties of the
bed material and the measurements obtained in a laboratory may differ relative to an
industrial fluidized bed combustor [17]. The residence time in the reactor needs to be
sufficient to avoid char particles from either flowing into the AR and combusting or
elutriating out of the FR [18]. The fluidized bed is assumed to contain a perfect mixture of
fuel and oxygen carrier, but the fuel on the surface of the bed may be preferentially gasified
without coming in contact with the oxygen carrier. Detection of syngas (H2 and CO) from the
FR exhaust is a possibility due to the gasification products of the fuel not having sufficient
time to react with the oxygen carrier. Hence, it is difficult to fully convert the fuel when the
fuel has to first be gasified. There is also a possibility of segregation between small and larger
particles, where smaller particles would migrate to the top of the fluidized bed [19].
Different methods have been proposed to minimize the reduction in fuel conversion due to
unburned gases. One such method is oxygen polishing whereby oxygen gas is used at the
exhaust of the FR to combust the unburned gases. Another method is to separate the
unconverted gases and send it back again into the FR to react with the oxygen carrier. The
third way is to use two FRs in a row, to increase the possibility of the reduction reactions by
effectively increasing the residence time. The fourth method is to use certain oxygen carriers
in a process called chemical looping with oxygen uncoupling [12]. These oxygen carriers
have another reaction mechanism whereby they release the oxygen present within their matrix
in the FR. The very reactive oxygen will combust the fuel, independent of its physical state.
This is described in more detail in a later section.
Evaluation of large scale CLC technologies has been done and simulations show that the cost
of the oxygen carriers in a CLC plant is in the same range as MEA which is used in a Post-
combustion capture plant, if the OCs lifetime is in the range of 300 hours [11]. The quantity
of bed material in a CLC process should be minimized as this would lead to a decrease in the
capital and operating costs, in terms of the number of compressors required to supply the
fluidizing gas and size of equipment.
When using solid fuels, ash will be generated compared to when gaseous fuels are used.
Therefore, oxygen carriers used in a CLC process with solid fuels will have a shorter lifetime
due to the loss of oxygen carriers during ash removal. The oxygen carriers used in a CLC
process with solid fuel should therefore have a low cost [12].
1.1.2 Coal
About 30 % of the total global energy is produced using coal which is typically employed for
electricity generation. The largest coal producers around the world are: China, USA, India,
Australia, Indonesia and Russia. The global energy consumption is expected to increase by
50 % between 2010 and 2035, with 75 % of this increase ascribed to China’s increase in
energy consumption [20].
Coal has different ranks with the major ranks in ascending order being: lignite (also called
brown coal), subbituminous coal, bituminous coal and anthracite, which has the highest rank.
The rank of the coal is decided based on the amount of fixed carbon, moisture and volatile
matter. Normally a higher rank translates to older coal that has been buried deeper in the

9
ground and therefore has experienced higher pressure and temperature resulting in a higher
amount of fixed carbon. Lignite is usually soft, friable and can ignite spontaneously under
certain conditions while anthracite is hard and needs temperature above 925 C to ignite [21].
Coal mined from different seams will contain different amounts of hydrocarbons, aromatic
compounds and minerals [21]. Coals can be mined from underground mines or from surface
mines depending on its location. The carbon and hydrogen content changes with different
types of coal, hence different coals will have different heating values and composition. The
possible interaction between the oxygen carriers and minerals present in coals in a CLC
process is highly variable. This depends on the oxygen carrier used as well as the ash formed
from thermal processing of the minerals present in a given coal. Some oxygen carriers are
more susceptible to interaction with certain minerals and this has to be taken into account
when selecting the type of oxygen carrier for a given coal.
The amount of oxygen carrier to be used needs to be sufficient to transport enough oxygen for
complete combustion of the fuel. Solid-solid interactions between the fuel and oxygen carrier
is not high enough to be appreciable; therefore it is necessary to gasify the fuel. Taking this
into account, it has been found that gasification is the rate determining step in a CLC
process[22].
Australia is one of the leading coal exporters in the world, both for generation of electricity
and production of steel using coking coal. Australia is expected to continue to be a significant
exporter of coal in the years to come [20]. Victoria is a state in Australia with large resources
of brown coal, over 500 years of at the current rate of consumption [23]. The possibility of
using CLC with different Victorian brown coals is an important step when considering low
emission combustion techniques for the future of Australia’s power generation.
1.1.3 Oxygen carriers
The choice of oxygen carriers is important as previously mentioned. The criteria for oxygen
carrier selection is that it should have good reactivity, the ability to fully convert the fuel,
negligible attrition and agglomeration , low cost , be environmentally benign and should not
pose a health risk in its handling and use [12]. The oxygen carrier also needs to be capable of
fluidization as well as maintain mechanical and chemical stability during repeated redox
cycles [4]. Typically, gaseous fuels are used with highly reactive oxygen carries which are
generally costly, while solid fuels are used with a low cost oxygen carriers [9].
Transitions metals such as Ni, Cu, Co, Fe, and Mn and are possible oxygen carriers. W, Mo,
Nb, V, Ce, In and Sn can be reduced and oxidized but due to low melting point, some of these
candidates are not suitable for a CLC process [4]. For example Co has good thermodynamics
for oxidation and reduction but is expensive and coupled with potential health and safety
issues makes it unsuitable as a candidate for a CLC process [9]. The oxygen carriers which
have been significantly tested are the Fe-, Ni-, Cu- and Mn-based materials. There has also
been research into mixing of metal oxides to improve the oxygen carriers’ abilities with the
added metals investigated being Ca, Fe, Si, Mg, Cu and Ni [12]. Due to the low price of Fe
and Cu, these metals are attractive oxygen carriers to further investigate. The use of Cu
requires a lower working temperature due to its low melting point compared to other oxygen

10
carriers [24]. Mixture of different metals oxides that have the capability to act as oxygen
carriers have been evaluated, for example CuFe2O4 showed superior performance compared
to single oxygen carrier materials [25]. Ni- based oxygen carriers have a high reactivity and
superior strength compared to other oxygen carriers [4] but is more expensive than other
candidates and toxic.
Natural mineral ores and industrial byproducts are also possible options for oxygen carriers
[26, 27]. The mineral ilmenite is a low-cost oxygen carrier that has been evaluated in a
number of studies. It contains Fe and Ti in the form of FeTiO3. Leion et al. (2008) concluded
that ilmenite results in high conversion of CO and moderate conversion of CH4 with no
tendency of deactivation after 3 days of experiments [28]. Cuadrat et al. (2012) evaluated the
behaviour of ilmenite as an oxygen carrier and found that structural changes could be
observed whereby the porosity of the particles increased from 1.2% to 38% after 100 reaction
cycles [29]. Berguerand et al. (2008 and 2010) used ilmenite in a 10 kWth reactor with solid
fuels with stable operation for 11h obtaining CO2 capture in the range of 60 to 75%; they also
found that by increasing the temperature, better results could be obtained. [13, 30]. Ilmenite
has shown to be resilient to ash interaction when it was mixed with different ash minerals in a
study by Keller (2014) while other oxygen carriers such as CuO/MgAl2O4 and Mn3O4/ZrO2
were more affected by the ash minerals [31]. Another potential oxygen carrier is industrial
residues such as iron scale from steel production. Leion et al. (2009) showed that it is possible
to use this as an oxygen carrier and in some cases the conversion of syngas and methane was
similar to manufactured Fe2O3/MgAl2O4 OCs [10]. Other options for oxygen carriers have
been investigated such as sulphates, for example CaSO4 [9]. Fan et al. (2014) showed that the
bimetallic oxygen carriers, NiFe2O4, CuFe2O4 and MnFeO3 showed better performance
compared to pure Fe2O3 [32]. Synergistic effects have been observed between bimetallic
oxygen carriers such as CuO-Fe2O3 resulting in better oxygen release capacities for CuO [33].
The most common and cheapest metal in nature is iron. It has favorable characteristics to be
used as an oxygen carrier and it would be ideal to use iron ores as an oxygen carrier without
having to first refine it [4]. Natural iron ore is often a mixture of hematite (Fe2O3), goethite
(α-FeO(OH)), limonite (FeO(OH)nH2O) and magnetite (Fe3O4) [34]. The reduction reaction
of hematite to iron is a slow process, and the favorable process is for the hematite to reduce to
magnetite. Different reduction mechanisms of Fe2O3 have been proposed throughout literature
[35]. Investigation showed the presence of two peaks during experiments with H2 reduction of
Fe2O3 [36]. The first peak represented the reduction of Fe2O3 to Fe3O4 while the second was
of Fe3O4 to Fe. Similar results with two peaks during the reduction of Fe2O3 have also been
shown by Li et al. (2010) [37], while another investigation did not show two peaks [38].
To improve the reaction with iron, support materials have been used which increase the
surface area and physical strength of the generated oxygen carrier. Al2O3 has been proven to
be a good support material for use with iron [39].Observation of the reaction of a few
different ores together with methane in presence of steam gasification of coal showed that
Limonite and Magnetite had better reactivity compared to the other materials evaluated in that
study [40].

11
Chemical Looping with Oxygen Uncoupling (CLOU) is done using certain oxygen carriers
that have a different reaction mechanism compared to the oxygen carriers used in CLC.
Oxygen carriers suitable for CLOU need to have an equilibrium concentration of O2 at the
temperatures used in a FR [10]; this makes the oxygen carrier to release its oxygen in the FR
and thereafter the very reactive gaseous oxygen will oxidize the solid fuel. CuO has shown
good performance as an oxygen carrier for CLOU. The advantage with this method is that the
rate limiting gasification reaction in a normal CLC no longer exists [10, 12].
Ruben et al. (2011) found that ash from coal was not harmful for the oxygen carriers which
were investigated and that in some cases the minerals in the ash increased the oxygen carriers’
reactivity. The experiments were carried out in a Thermogravimetric analyzer (TGA) and the
presence of ash led to an increase in the porosity and surface area of the oxygen carrier
allowing for increased access of the reducing gases to the active sites. It is unclear, however,
if similar results will be observed in a fluidized bed [41].
Leion et al. (2007, 2008) used synthetic oxygen carrier particles such as Fe2O3/MgAl2O4 in
their study. They concluded that the reactivity of the oxygen carrier is not the rate limiting
step in a CLC process, but rather the gasification of the fuel. Gasification rate increases with
the use of oxygen carriers due the removal (oxidation) of H2 and CO gases, which are known
gasification inhibitors, by the oxygen carriers. No agglomeration was found in either of the
studies. The use of steam as a gasification agent in the fluidized bed significantly increased
the conversion rate of the fuel in both the studies [19, 22].
The economical aspect needs to be taken into account when evaluating the oxygen carriers.
Ongoing costs needs to be accounted for such as the addition of fresh oxygen carriers to
replace the particles that have undergone attrition or deactivation as well as those which were
lost during the ash separation step [11]. Hence, cheap oxygen carriers are preferred for this
reason.
1.1.4 Working CLC units
There have been a number of studies using solid fuels in CLC processes in recent years. There
are a number of different experimental CLC facilities ranging from 1 kWth up to couple of
MWth.
At Chalmers University in Sweden there are two units having capacities of 10 kWth and 100
kWth. The 10 kWth unit has been used in several studies with different solid fuels and oxygen
carriers. Berguerand et al. (2008) and Linderholm et al. (2012) are just a few examples in the
literature which used the 10 kWth unit. Berguerand et al. (2008) result has been mention
previously and Linderholm et al. (2012). showed that the gasification rate of the fuel was
enhanced by using Manganese ore [13, 27]. The 100 kWth unit has been used by Markstrom et
al. (2012, 2014) with different coals and showed a stable operation with minimal loss of char
into the AR resulting in high CO2 capture efficiencies [42, 43].
At Southeast University in Nanjing, China there is a 1 kWth unit which has been operated with
iron ore as the oxygen carrier and a 10 kWth unit that has been used with coal and biomass as
fuels with Ni- and Fe-based oxygen carriers. Shen et al. (2009) conducted a study with iron

12
oxide and biomass in the 10 kWth unit and found that the gasification of the biomass was
more temperature dependent than the oxidation of the fuel by the oxygen carrier. The tests
were conducted for 30 hours without changing the oxygen carrier [44].
Abad et al. (2012) used a 1.5 kWth unit at CSIC , Zaragoza in a CLOU mode of operation with
solid fuel and obtained 100% conversion, with even a few percent of O2 being found in the
FR’s exhaust [45].
IFP in Lyon, France has a 10 kWth plant having three reactors with two ARs in series.
Yazdanpanah et al. (2014) made a reactor model and validated it against experimental values
obtained from the 10 kWth unit. The model was able to predict the outlet concentrations of H2
and CO as well as the CO2 yield [46].
Thon et al. (2013) from Hamburg University have performed experiments using a 25 kWth
unit with a two stage fluidized bed reactor. They have studied the use of ilmenite with solid
fuels and obtained an outlet concentration of CO2 of more than 90 vol % [47].
One of the largest plants is the 1MWth CLC plant in Dramstadt which has published
operational results showing that the FR is working as expected [48] but further investigation
is ongoing. Alstom Power Plant Laboratories are developing a CLC plant having a capacity of
3MWth and testing on the plant has begun [49].
1.1.5 Studies of Victorian Brown coal
There have only been a few studies with Victorian brown coal, which typically has very low
ash content and a high amount of oxygen, as a fuel for CLC.
Saha et al. (2011) investigated Loy Yang, a type of Victorian brown coal with NiO and CuO
oxygen carriers. They used a TGA in their study and reported 5 cycles of reduction and
oxidation of the oxygen carrier in presence of coal. Two different temperatures were studied,
950 °C and 800 °C. The reason a lower temperature was used was because CuO was found to
sinter at 950 °C and that the re-oxidation was hard to accomplish at this temperature. Since
the ash content in Loy Yang was very low, ash separation after each cycle was not possible
and it therefore accumulated in each subsequent cycle. CuO displayed high reactivity with a
combustion conversion of 96% while this value was only 67% with NiO [23].
In another study by Saha et al. (2012), Loy Yang coal was investigated again and this time
with Fe2O3 and NiO oxygen carriers. They found that agglomeration was not evident between
Fe2O3 and Loy Yang coal’s ash with no loss in the mass of the oxygen carriers used. A
subsequent decrease in reactivity of the OCs was observed, with Fe2O3 and NiO showing a
combustion percentage of 89% and 67% respectively in the 5th
cycle [50].
Experiments showed that the reduction reactivity of CuO and NiO with Victorian coal had its
highest rate at the second cycle, and then decreased. This may be due to structural changes
during the first cycle and the decrease later on due to accumulation of ash. It was found that
the oxidation was not affected by the accumulation of ash [23].

13
In Leion et al. (2008), a few different coals were investigated of which one was an Indonesian
coal similar in composition to the coal used in this study. They found that it was possible to
separate the reaction of char from the reaction of volatiles for the Indonesian coal, due to its
high content of volatiles compared to the other coals which were studied. The required
residence time was found to be shorter for coals containing higher amounts of volatile matter
[19].
A fair number of studies using coal in a CLC process have been performed but there are very
few investigations which have used Victorian brown coal as a fuel for CLC. Therefore further
studies are needed to identify the possible issues associated with using such a fuel in CLC.
1.2 Objectives
This study aims at evaluating the reactivity of three different oxygen carriers with one type of
Victorian brown coal. A secondary aim of the project is the development of a preliminary
Aspen Plus model, for a Victorian brown coal fuelled CLC in a fluidized bed reactor, using
one of the evaluated oxygen carriers in this study.
1.3 Boundaries
The project aims to evaluate the performance of three oxygen carriers against one Victorian
brown coal using a Thermogravimetric analyser (TGA) and a fluidized bed reactor over
multiple redox cycles. The OCs will first be evaluated with a Temperature programmed
reduction/oxidation (TPR/TPO) measurements without the coal. This will be done at one
pressure and one temperature.
1.4 Issues to be examined
Is the reactivity and capacity significantly different between the three oxygen carriers?
Is agglomeration evident?
Are there any interactions between the oxygen carrier and coal ash?
Are any of these interactions detrimental to the performance of CLC of Victorian
brown coal using Fe2O3-based oxygen carriers i.e. what issues are expected to arise?

14
2. MATERIALS The Victorian brown coal which was used is Yallourn coal. The composition of the coal is
shown in Table 1, Table 2 and Table 3 below. The oxygen carriers that were used are Fe2O3-
based ores: The first ore is from Western Australia and is further denoted as WA-1. The
second ore is also from Western Australia, denoted as WA-2. The third ore is Limonite (FeO
(OH)* nH2O) sourced from Indonesia. The composition of the different oxygen carriers can
be found in Table 4 below.
Table 1. Proximate Analysis of Yallourn coal
Yallourn coal
Moisture, % ar ~65
Ash, % db 1.9 - 2.4
Volatile Matter, % db 48.0 – 50.5
Fixed Carbon, % db 47.0 – 49.1
HHV, MJ/kg 24.5 – 26.1
Table 2. Ultimate Analysis of Yallourn coal
Yallourn coal
C, % db 64.9 - 66.6
H, % db 4.0 - 4.6
N, % db 0.4 - 0.5
S, % db 0.2 – 0.3
O, % db ~22.5
Table 3 Ash composition of Yallourn coal
Ash Composition (%)
SiO2 5.3 – 15.0
Al2O3 3.0 – 5.0
Fe2O3 34.1 – 40.4
TiO2 0.1 – 0.44
K2O 0.3 – 1.0
MgO 14.2 – 17.2
Na2O 4.8 – 6.0
CaO 6.3 – 8.3
SO3 13.7 – 17.0

15
Table 4 Composition of WA-1, WA-2, and Limonite
db% WA-1 WA-2 Limonite
Fe2O3 95,2 91 80,1
SiO2 2,2 4.9 4,9
Al2O3 1,1 2.7 5,5
Na2O 1,2 0.2
MgO 0,2 0.3 0,9
MnO 1.0 1,8
P2O5 0.1 0.1 0.1
SO3 0.1
TiO2 0.1
Co3O4 0.3
Cr2O3 3,9
NiO 1,9
Other 0.1 0.3
The oxygen carriers were sieved to the size range of 150-350 µm while the coal was sieved to
a range of 600-1000 µm. To enable the Limonite sample to be sieved, it was dried for 5 hr at
300 °C, to remove some of the moisture. One key observation is that the bulk density of
Limonite was significantly less relative to both the WA-1 and WA-2 samples. A comparison
between a calcined and a fresh WA-1 samples was also done, where the WA-1 sample was
calcined at 900 °C for 3 hours.

16
3. METHODOLOGY This study contains of two parts, the first involving experimental results with the other being
modelling using Aspen Plus. The Aspen plus model is a model for future experiments in a
10kWth fluidized bed reactor using the WA-1 oxygen carrier which was used in the
experimental part of this study. The two parts are separated into individual sections. The
following describe the methodology employed for the different instruments and analysis
techniques used.
3.1 Temperature programmed reduction/oxidation (TPR/TPO)
The reduction and oxidation properties of the oxygen carriers were evaluated through
Temperature programmed reduction/oxidation (TPR/TPO) measurements. A 50 mg sample of
the oxygen carrier was placed on a small pad of glass wool housed within a quarts sample
tube. Figure 2 shows the ChemiSorb 2720 unit from Micromeritics which was used for the
analysis. The operating principle is through the use of a Thermal Conductivity Detector (TCD)
which measures the difference in thermal conductivities of the gases exiting the sample tube
against the carrier gas. The gas from the sample tube exit was passed through dry ice to
ensure that no moisture entered the TCD detector. Reduction was done using a gas mixture
containing 5 % H2 in N2 while oxidation was done in air. N2 was used as a purge gas for 10
minutes between the reduction and oxidation reactions.
The sample was preheated to 300 °C at a ramp rate of 20 °C /min to drive off the moisture
present in the oxygen carriers. At 300 °C, the furnace was turned off and the sample was
cooled to 100 °C in N2 gas. Once a temperature of 100 °C was reached, the N2 gas was
switched to the H2/N2 gas mixture and the TCD signals that were generated was recorded. The
furnace was then turned on with a ramp rate of 10 °C /min to a temperature of 900°C. When
the sample temperature reached 900 °C, a dwell time of 30 min was used to ensure complete
Figure 2. TPO/TPR instrument
ChemiSorb 2720

17
reduction of the oxygen carrier. The temperature in the sample tube was maintained at 900 °C
for the remainder of the experiment.
After the first reduction and purge, oxidation was done using air for a duration of 10 minutes.
A N2 purge was done at the end of the oxidation stage and before the next reduction stage to
prevent the mixing of gases. The next 4 reduction reactions had a dwell time of 75 min at an
isothermal temperature of 900 °C. In total, 5 redox cycles were evaluated in one experiment
over a duration of 580 minutes.
3.2 Thermogravimetric analysis (TGA)
A Thermogravimetric analyzer (TGA) was used to study the reaction between the fresh
oxygen carriers and Yallourn coal. The purpose of this experiment was to determine the OC
reactivity and stability over multiple redox cycles with coal. The TGA results were displayed
in terms of mass change as a function of time and temperature.
To study the effect of gasification agents, CO2 and steam was used with the WA-1 sample. A
comparison between the calcined and fresh WA-1 samples together with the two gasification
agents were also done in the TGA.
The TGA instrument used was a NETZSCH STA 449 F3 Jupiter which can be seen in Figure
3. A steam generator from NETZSCH was also used for the experiments utilizing steam
gasification.
Coal was mixed with the oxygen carriers at a 1:50 ratio for all experiments, which is higher
than the stoichiometric amount required for complete combustion of the fuel by means of
hematite reduction to magnetite.
500 mg of the oxygen carrier was placed in an alumina crucible and mixed with 10 mg of coal.
The sample was heated at a ramp rate of 5 °C /min to 200°C and then to 900°C at a rate of
Figure 3. TGA used in this project

18
10 °C /min after which it had a 30 min dwell time in a reducing atmosphere. Oxidation was
done for 30 minutes at the end of the cycle and then the sample was cooled down to room
temperature to begin a new reaction cycle. 20 ml/min of CO2 with 80 ml/min of N2 was used
for the reduction reaction and 20 ml/min of air (21 % O2 and 79% N2) with 80 ml/min N2 was
used during oxidation. The oxygen carriers where evaluated for 5 cycles, with the addition of
new coal at the start of every cycle. The experiment was terminated at the end of the fifth
oxidation reaction. Ash separation after each cycle was not possible due to the small amount
of ash generated by the coal.
The WA-1 sample and coal mixture was also subjected to steam gasification during the
reduction step in a separate experiment. The steam flow rate was 20 ml/min with 80 ml/min of
N2 during the reduction stage. This was done to evaluate the effect of gasification agents,
similar to that which can be found in literature [19, 22].
3.3 Fluidized bed reactor
The last part of the experimental plan was to evaluate the oxygen carriers’ performance in a
fluidized bed reactor (FB). Ten reduction/oxidation (redox) cycles were performed and the
change in the reactivity of the oxygen carriers was measured by means of analyzing the
composition of the exhaust gases. The experiments were performed with CO2 as the
gasification agent.
The FB reactor was filled with 100g of the oxygen carriers and heated to 900 °C under a flow
of 4.8 L/min N2 and 1.2 L/min air. The gas was changed when the O2 level reached a stable
value signifying completely oxidized oxygen carriers. CO2 was introduced at a flow rate of
1.2 L/min together with 4.8 L/min N2. Once the CO2 level stabilized, 1g of coal was added to
the reactor. When the CO and CO2 concentration returned to their initial values, the CO2 flow
was shut off. After the CO2 level decreased to zero, air was turned on to initiate the oxidation
of the oxygen carriers. The presence of a CO2 peak when the air was turned on would signify
incomplete combustion of char during the reduction experiment. The experiment was
terminated at the end of the tenth reduction reaction.
The fluidized bed reactor is 50 mm in diameter having a height of around 1 meter. Figure 4
below shows the schematic of the setup.

19
3.3.1 Characterization of oxygen carriers
The fresh samples alongside the residues from the TGA and the small fluidized bed reactor
were evaluated with a JOEL 7001F Scanning Electron Microscope (SEM) coupled with an
Oxford Instruments X-Max 80 Silicon Drift Energy Dispersive X-Ray Spectrometer (EDX) to
study the changes in the morphology and surface elemental composition.
A Rigaku MiniFlex 600 X-Ray Diffractometer (XRD) was used to evaluate changes in the
presence of crystalline compounds on the surface of the oxygen carrier before and after the
experiment.
To obtain the Brunauer, Emmett and Teller (BET) surface area, total pore volume and the
average adsorption pore diameter of the oxygen carrier particles, an Accelerated Surface Area
and Porosimetry (ASAP) instrument was used. This model of the instrument was
Coal feeder
Gas mixer
On-Line
Gas Analyser
MFC
MFC
MFC
Thermocouple
N2 Air
CO2
Furnace
Distributor plate
Figure 4 Schematic setup of the fluidized bed reactor (MFC is Mass Flow controller)

20
Micromeritics ASAP 2010. Both the fresh sample and the spent particles from the fluidized
bed reactor experiments were analysed using this technique.
3.4 Aspen Plus modeling
Four different process models for a CLC system were developed, some based on the
minimization of Gibbs free energy while others were done using reaction kinetics obtained
from literature. The models were developed to serve as a comparison with the experimental
results from a 10kWth fluidized bed reactor. The goal was to use the models to optimize the
process parameters for the fluidized bed reactor operation.
3.4.1 Gibbs free energy model
A model for a CLC system was constructed in Aspen Plus. The FR was modeled with three
units in which two units were needed for modeling the gasification reaction of coal and one
was used for the oxidation reaction of the gas species with the oxygen carrier. Fan et al. (2008)
have modeled a CLC system with 3 reaction units [51] and a similar approach was used in this
model.
The reactor component RYield was used to decompose the coal into its main components.
The coal components were then mixed with the fluidizing gas in a RGibbs reactor. The
RGibbs reactor is an equilibrium reactor based on the minimization of Gibbs free energy. The
RYeild and RGibbs units modeled the gasification reaction of coal in the FR of the CLC unit
and are here named the decomposing reactor, as it represent the gasification of coal. The
decomposing reactor was kept constant in all the models which were generated. Another
RGibbs reactor was used for the reduction reaction wherein the oxygen carrier stream was
added. This part is named as the Fuel Reactor (FR) throughout the modelling section and does
not concern the gasification block. The gases coming out from the FR was separated from the
solid outflow which was then sent to the AR. The gas stream was condensed to separate the
liquid and gas phases. The AR was also a RGibbs reactor, where the outflow from the reactor
was a mixture of oxidized oxygen carriers and oxygen depleted air which continued to a
cyclone where the solids were separated.
The inflow of coal was set to 1 kg/hr with a composition as shown in Table 2 in the Materials
section above. The amount of fluidizing gas for coal, termed Carbon carrier gas (CCG), was
initially set to 25 L/min at 1atm and 25 °C with 20 % of CO2 and balance N2. The inflow of
Fe2O3 was also initially set to 100 kg/hr, which is sufficient to reduce all the coal while
reducing the oxygen carrier to no lower than Fe3O4. All the reactors were operated at 900 °C
and 2.5 atm. The inflow of air mixture was 25 L/min consisting of 20 % of air in N2, resulting
in a flow of 4.2 % O2 and 95.8 % N2, which was sufficient to oxidize the oxygen carriers back
to its highest oxidation state. Analyses were done on a few parameters including the
temperature and pressure in the reactor, the CCG composition and flow rate as well as the
oxygen carrier flow into the FR. Different concentrations and flow rates of O2 in the air into
the AR were also investigated.

21
3.4.2 A CLC model based on kinetic values
The RGibbs reactor mentioned above gives the equilibrium concentration of gases coming out
from the reactor. The next model utilizes kinetics obtained from literature. By using an
RBatch reactor, it was possible to add reaction kinetics to the model. The RBatch reactor was
chosen due to its simplicity and it was better compared to a plug flow or CSTR reactor. Bing
et al. (2012) evaluated NO and N2O formation in a fluidized bed combustor with a more
sophisticated model for the FR utilizing a large amount of different kinetics [52]. The models
developed in this study are much simpler than that, but could be further developed to a much
more sophisticated model, when more knowledge about the system is known. The reactions
used in the batch reactor are as follows:
Reactions A1-A3 were used in the FR model while Reaction B1 was used in the AR. All the
above reactions were used with kinetics data from Abad et al.(2007) [11, 53]. The A1
reactions were also used with reduction kinetics from Bohn et al. (2010) [54] and the
oxidation reaction was similarly evaluated with kinetic from Son et al. (2006) [55] as for
Abad et al. (2007).
Other kinetic models were also evaluated, with the assumption that coal gasification was the
rate governing process [10, 12]. Therefore it was sufficient to represent the kinetics for the
oxidation of the syngas by the oxygen carriers even if the gas species were formed in the
gasification stage before. Different gasification kinetics from literature and experiments were
evaluated. The reduction kinetics was only used in the fuel reactor while the air reactor was
modelled as a RGibbs reactor. While evaluating the oxidation kinetics the reduction reactor
was a RGibbs reactor to minimize the affect different reduction kinetics would have.
The gasification kinetics was incorporated using the Arrhenius equation, as shown below in
Equation 10:
The different kinetic values used in this model can be found in Table 5. When using reaction
kinetics, other possible reactions were not accounted for, so the inflow of the reactant gas was
divided into two parts: the reactants for the reaction with the oxygen carrier and the “inert”
part. This addition was the last and fourth model developed. The reactants were added to the
batch reactor with most of the oxygen carrier. The “inert” part was directed to a RGibbs
reactor containing a fraction of the oxygen carrier. This was used to evaluate if there was a
change in the equilibrium composition of the other species from reactions with the oxygen
carrier. Due to splitting of the streams, the composition of the streams would change resulting

22
in a variation of the concentration compared to the real case, but the goal here was to
determine if this change was negligible and if it was possible to assume the non-reactants as
inert. The different model configurations can be seen in Figure 37 to Figure 40 in the
Appendix.
Table 5. Kinetic parameters used in the Aspen Plus models
Reference k0-XX -value (s-1) *
Ea-
activation
energy
(kJ/mol)
Conditions
Reduction/oxidation kinetics
Abad et al.
(2007) [11,
53]
k0-A1=9.0*10-4
k0-A2=2.5*10-4
k0-A3=8*10-4
k0-B1=3.1*10-4
Ea-A1=24
Ea-A2=20
Ea-A3=49
Ea-B1=14
60% Fe support material Al2O3,
(A1+A2)
45% Fe support material Al2O3
(A3+B1)
TGA-evaluation, syngas
Gasification kinetics -
Gasification of a South
Australian
low-rank coal with carbon
dioxide and steam: kinetics and
reactivity studies
Ye et al.
(1998) [56]
k0-A1=22.16667
k0-A2=22.16667
Ea-A1=91
Ea-A2=91
Bowmans coal, CO2 in single-
particle reactor, atmospheric
pressure, temperatures 714-
892°C
Gasification kinetics -
experimental values
Rajendran
(Unpublished
data)
k0-A1=2.33*106
k0-A2=2.33*106
Ea-A1=212.5
Ea-A2=212.5
shrinking core model, 20% CO2
in N2, with Fe2O3 oxygen
carrier, Yallourn coal
Gasification kinetics -
experimental values
Tanner
(Unpublished
data)
k0-A1=10617.7
k0-A2=10617.7
Ea-A1=140.5
Ea-A2=140.5
TGA, 10mg Yallourn char, 90%
CO2 in N2, shrinking core model
Gasification kinetics - CO2-
Gasification Reactivity of
Different Carbonaceous
Materials at Elevated
Temperatures
Gu et al.
(2009) [57]
k0-A1= 80393.6
k0-A2= 80393.6
Ea-A1=174.92
Ea-A2=174.92
petroleum coke, CO2
gasification TGA
1223 - 1673 K,
Gasification kinetics -
Gasification kinetics of coal
chars in carbon dioxide
Osafune et
al. (1987)
[58]
k0-A1=4600
k0-A2=4600
Ea-A1=165
Ea-A2=165
TGA, CO2 gasification,
1143-1559 K, shrinking
spherical
ash less particle model,
Taiheiyo coal
Gasification kinetics -
Gasification kinetics of coal
chars in carbon dioxide
Osafune et
al. (1987)
[58]
k0-A1=6600
k0-A2=6600
Ea-A1=170
Ea-A2=170
TGA, CO2 gasification,
1143-1559 K, shrinking
spherical
ash less particle model,
Yallourn coal
Gasification kinetics - CO2
Gasification Kinetics of Two
Alberta Coal Chars
Koviacik et
al. (1991)
[59]
k0-A1=2591666.67
k0-A2=2591666.67
Ea-A1=212
Ea-A2=212
Obed Mountain coal chars,
TGA, Max Temp. 950°C CO2
partial pressure at 0.1 Mpa,
Volume reaction model.
Reduction kinetics Bohnt et al.
(2010) [54]
k0-A1=26695351
k0-A2=26695351
Ea-A1=75
Ea-A2=75
Reduction of Fe2O3 to Fe3O4,
N2+CO+CO2 (respectively, 82,
3 and 15 vol. %) 723 -973 K, 1
bar, A fluidized bed reactor.
First order reaction
Oxidation kinetics Son et al.
(2006)[55] k0-B1=0.004 Ea-B1=6
A thermobalance reactor, 1223
K, Fe2O3 supported on
bentonite, oxidized by 10% O2,
shrinking core model
* Subscripts A1,A2 and A3 denotes the reactions in the FR as mentioned in the Methodology section. B1 represents the
reaction in the AR,

23
4. RESULTS The experimental and modelling results are presented in this section. The experimental
section involves the evaluation using TPR/TPO, followed by TGA, and small fluidized bed
reactor. The last part covers the different models generated using Aspen plus.
4.1 TPR/TPO – Capacity and Reactivity of OC
Redox experiments were conducted in the TPR/TPO unit using the three oxygen carriers.
Figure 5 shows the TCD signals obtained over the five redox reactions which were performed.
When the gases were changed, large negative peaks appeared which is due to the difference in
the thermal conductivity of the gases relative to the carrier gas. The oxidation peak is small
and often overshadowed by the peak from the changing of the gas and hence could not be
separated from one another. Since the oxidation reaction is fast, it was not possible to
distinguish the signals due to the change in gas and oxidation of the oxygen carrier. As
mentioned in the methodology chapter, the temperature profile was increased to 900 °C, with
a 10 °C/min ramp rate from 100 °C and this is clearly depicted in Figure 5. Once the set point
of 900°C was reached, it was maintained throughout the rest of the experiment. There was a
slight increase in temperature during each of the oxidation reactions for all the different OCs
which shows that they all were exothermic reactions.
Figure 5. TPR/TPO measurements of five cycles

24
The reduction of the OC occurred progressively as the temperature was increased during the
first cycle. In Figure 6, a few peaks can be seen during this first reduction period. It can be
seen that the WA-2 sample has two peaks and this corresponds to findings in the literature [36,
37] which state that this is due to the reduction of Fe2O3 to Fe3O4 and Fe3O4 to Fe. Limonite
shows three peaks and the first small peak may be due to presence of other oxygen carrier
materials. The WA-1 sample displays other unstructured peaks as evidenced in Figure 6 and
could be due to other Fe2O3 reduction paths as discussed in literature [35].
It can be seen that Limonite is reduced at a faster rate and at lower temperature compared to
the WA-1 and WA-2 samples. The first peak appears to be around 380°C for both the WA-1
and WA-2 while Limonite’s first peak was at 250°C. The large, last peak for Limonite was at
720 °C, while this was at 800 °C for the WA-2 sample and 860 °C for the WA-1 oxygen
carrier. Magnacca et al. (2003) showed that the two peaks occur at 376 °C and 627 °C in TPR
measurement of α-Fe2O3 with 5% H2 in Ar at a flow of 40 ml STP [36]. Neither the WA-1 nor
WA-2 OCs was completely reduced when the final temperature was reached, whereas
Limonite was almost fully reduced when the temperature was 900 °C.
The large peaks found in the 2nd
to 5th
reduction cycle during the 900 °C isothermal period is
due to signals generated from the change in gases and reduction of the OC. It is possible to
distinguish the presence of more than one peak in this part. The first part in this peak is due to
the change in gas and is replicable for each reduction cycle while the other peaks experience
changes in each cycle. Using peak deconvolution to separate the peaks, three peaks during the
reduction period are distinguishable, with the first attributed to the change in gas while the
other two attributed to the reduction of the oxygen carrier. Figure 7 shows the presence of
Figure 6. TPR/TPO measurements, first cycle reduction
25
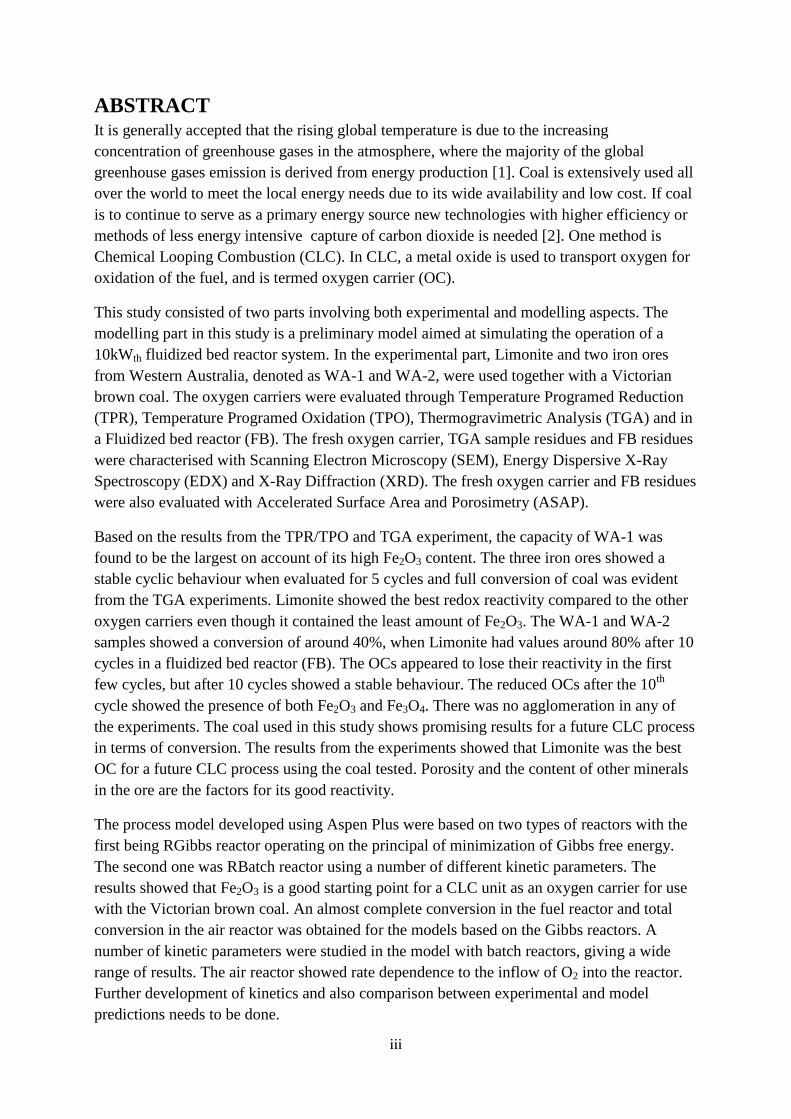
three peaks for the 2nd
reduction of Limonite, the first being the peak due to the change in gas,
which is tall and narrow while the latter two had lower intensities but covered a wider area.
This is in agreement with other findings [36, 37].
The reduction capacity of the oxygen carriers can be represented by the area below the
reduction peaks while reactivity can be inferred from the height in the peaks. The 2nd
to the 5th
reduction reactions are plotted for the three OCs in Figure 25 to Figure 27 in the Appendix.
The reduction capacity increased for WA-1 and WA-2 for each cycle as evidenced by the
increasing area below the reduction peaks. The capacity of the WA-1 OC increased after each
cycle and this is probably due to structural changes and at the 5th
cycle the WA-1 showed the
largest capacity of the three studied OCs. Limonite on the other hand showed a larger capacity
in the beginning with a subsequent decline in the capacity to a constant value in cycles 3-5.
For both the WA-1 and WA-2 samples, the reactivity and capacity was the largest at the 5th
cycle. Limonite had the highest peak values while WA-1 had the second highest and WA-2
had the lowest reactivity.
4.2 TGA – Redox Reaction with Coal
The measurements performed in the TGA were recorded from 200 °C. The OC samples were
fresh samples having different moisture content. In the preheating stage, there was loss of
moisture from the fresh OC and coal. The OC would only lose moisture in the first cycle,
whereas coal would lose its moisture content in each of the cycles. Therefore, the amount of
moisture-free OC in the measurements varied. The measurements performed in the TGA were
recorded from 200 °C onwards. The purpose of this experiment was to determine the OC
reactivity and stability over multiple redox cycles with coal.
Figure 7. TPR/TPO measurements 2nd cycle of Limonite, with calculated peaks

26
The WA-1 OC showed a quick drop in mass in the initial 10 minutes of the first cycle as can
be seen in Figure 8. This loss is due to evaporation of moisture and gasification of coal which
proceeded to react with the OC. After the first cycle, the reduction and oxidation patterns
were stable and replicable. WA-1 lost 20 mg (4 %) from the initial 500 mg in the first cycle
and had a steady mass of 480 mg in the next four cycles. Other studies have also showed that
Fe2O3 did not lose its mass over the multiple redox cycles [50].
The WA-2 OC showed a larger drop in mass in the first cycle, but stabilized to a repeatable
pattern for the next four runs, similar to the WA-1 OC. The WA-2 sample lost 40 mg of mass
(8 %) after the first cycle, but then showed a steady amount of 460 mg mass for the
subsequent cycles. The Fe2O3 content of the WA-2 sample was 9 % less when compared to
the Fe2O3 content in the WA-1 sample.
Limonite lost moisture in the first cycle, but it also lost a small amount of moisture in the
second cycle, creating lower values for the second cycle as can be seen in Figure 8 c). The
loss of moisture was not as fast when compared to the other two samples at 200 °C. Limonite
lost 34 mg of mass (6.8 %) in the first cycle, but it also lost 1 mg (0.2 %) in the second cycle.
The redox pattern was stable beyond the second reaction cycle. Limonite had 20 % less Fe2O3
Figure 8. TGA measurements of a) WA-1, b)WA-2 and c) Limonite for 5 cycles
a) b)
c)

27
compared to the WA-1 sample. The differences in the loss of moisture in each of the OCs
could be due to the different ways that water was bonded to the OC.
A comparison among the different OCs was carried out and can be seen in Figure 9. An
assumption was made that all the OCs would show a steady pattern from the second cycle.
The samples were also compared with a sample of fresh WA-1 which was reacted with coal
under steam gasification. The coal was fully converted in all cases and this is supported by the
absence of a mass change at the end of the reduction section as shown in Figure 9 b) were the
mass change rate is depicted.
The results show that Limonite had the largest loss/gain in mass at the fastest rate among the
three tested OCs. The results obtained here is similar to that from the TPR/TPO section
whereby Limonite showed the highest reactivity. The WA-1 and WA-2 samples had almost
identical weight loss/gain patterns. One run with steam was also evaluated using the WA-1
sample and the pattern was similar, except for the gain in mass during the reduction reaction.
Coal was gasified at a faster rate and at an earlier temperature with steam compared to when
CO2 was used. This is evident by a higher mass change peak that was shifted to the left in
Figure 9 b). and it has been shown in the literature that steam has a positive effect on the
gasification of the coal [19].
Figure 10 shows another comparison of the second cycle, wherein the WA-1 and calcined
WA-1 samples are compared. The comparison showed that there was a difference between the
sample used in presence of steam compared to when CO2 was used. The sample in presence
of steam had higher reactivity, probably due to faster gasification of the coal. A slight
difference could be seen between the calcined and fresh samples. The calcined sampled
showed a higher reaction rate compared to the fresh sample both in presence of steam and
CO2 with the most evident difference being between the two samples in CO2. Both the oxygen
carriers in the steam runs showed an increase in mass at the end of the reduction cycle,
Figure 9.Comparison of the 2nd cycle of different samples, a) mass change and b) rate of change
a) b)

28
showing an oxidation of the OC. This may be due to oxidation by steam on the surface of the
particle, on which a greater extent of reduction would have occurred as it was the closest to
the coal and its gasification products.
4.2.1 SEM Images of the Fresh and Used OC
The fresh samples were first characterized using SEM. The surface of the WA-1 and the WA-
2 samples consisted of a thin layer of small particles and this can be seen in Figure 28 a)-b),
and Figure 29 a)-b) in the Appendix. Figure 31 in the Appendix shows that the calcined WA-1
sample has a surface covered with small coalesced particles. The fresh Limonite sample
showed a much more porous structure with the presence of a lot more fines as depicted in
Figure 30a)-b) in the Appendix compared to all the other samples. It appears that the surface
area of the WA-1 and WA-2 oxygen carriers is much lower than Limonite, which could
explain Limonite’s better performance during the TPR/TPO and TGA experiments. The
surface area was considerably larger for Limonite OC than for both WA-1 OC and WA-2 OC
as will be shown by the ASAP measurements of the fresh samples in Table 6 further down in
this report, confirming the reasoning for the enhanced reactivity of Limonite.
The used WA-1 sample also showed grain coalescence as evidenced in Figure 28 c)-d) in the
Appendix. The fresh WA-1 sample appears rougher, while the used sample is smoother. The
WA-1 particles used in steam for the 2 redox cycles displayed formation of cracks, as shown
in Figure 28 c)-d) in the Appendix which would provide larger specific surface area leading to
higher reactivity.
The change in the surface of the WA-2 sample is very small. Figure 29 c)-d) in the Appendix
shows that the surface is covered in small grains after 5 cycles in the TGA. After the 5 runs in
the TGA, Limonite’s physical appearance had changed and the surface was covered with
more particles as shown in Figure 30 c)-d) in the Appendix.
Figure 10. Comparison of the 2nd cycle of WA-1 samples, both in mass change and the rate of change

29
Very little ash deposition was evident on the particles and this was expected due to the small
amount of ash present in the Yallourn coal. Agglomeration of the particles was not evident
and this is supported by the fact that Fe2O3 has a melting point of 1500 °C. Other studies
showed that sintering of the grains were not present in experiments using Fe2O3 with a
different Victorian brown coal [50]. The surface of the three OCs in this study had changed
due to conditioning and grain coalescence relative to the fresh particle.
The calcined WA-1 sample in Figure 31 in the Appedix showed a very smooth surface with
few small particles on it. After the 5 redox cycles, the surface had become less smooth and
more particles appeared on the surface which would give rise to a slightly larger surface area
and more reactive sites. The calcined WA-1 sample used in 2 redox cycles with steam showed
less particles on the surface than the one used in 5 cycles with CO2. The calcined sample, as
depicted in Figure 31 a)-b) in the Appedix, shows a smother surface with less sharp edges
than for the fresh WA-1 as can be seen in Figure 28 a)-b) in the Appendix. The difference
shows that calcination results in a physical change of the oxygen carrier morphology.
4.2.2 EDX Analysis of fresh samples and samples in the TGA
It is important to understand the extent of interaction between the ash formed from thermal
treatment of coal and the OC in a CLC unit as this can give rise to agglomeration problems,
loss of the oxygen carriers’ reactivity and bed defluidization in a fluidized bed reactor.
Yallourn coal contains very low amounts of ash, and therefore the extent of ash interaction
should be very small. It is impossible to compare the surface composition of the same
particles before and after the experiment. Since the OCs were natural ores, their composition
were highly heterogeneous leading to differences in the composition of each particle.
Therefore, multiple samples were analysed and the spectra closes to the average are shown in
Figure 11.
It was found that there was very little change in composition between the fresh and used
samples, especially for the WA-1 and the WA-2 samples as can be seen in Figure 11. The
Limonite OC loses very small amounts of S, and gains very small amounts of Ca as shown in
Figure 11, where the small increase of Ca could be due to ash interaction. Limonite sample
showed a decrease in oxygen, which could be due to loss of structurally-bound water in the
first redox cycle in the TGA.

30
The calcined WA-1 sample showed no change between the used and new sample based on the
EDX evaluation as can be seen in Figure 33 in the Appendix. It also showed very small
differences between the fresh and calcined sample when comparing Figure 32 and Figure 33
in the Appendix.
For all the OCs, no significant changes could be detected in the EDX which means that ash
interaction with the OCs were not significant.
4.2.3 XRD Measurements of fresh samples and samples in the TGA
The fresh samples showed low peak intensities, with the WA-1 sample being the one that
displayed the highest intensity for a fresh sample and was the most crystalline sample among
the other fresh OCs as shown in Figure 12 and Figure 13. The unused calcined WA-1 OC
sample showed very high peak intensities in Figure 12 b), indicative of a high degree of
crystallinity. The Limonite sample generated the peaks with the highest intensity after the 5
reduction cycles compared to the other two fresh samples. The WA-2 sample did not show
any change in composition after 5 cycles except for a change in intensity and that more
defined peaks were evident as can be seen in Figure 13 a). The used calcined WA-1 sample
did not show any big changes except for a loss in intensity, compared to the unused sample as
depicted in Figure 12 b). Used Limonite showed the presence of SiO2 and Fe2O3 whereas the
fresh one only showed Fe2O3. However, the EDX analysis shows that Limonite has small
amounts of Si in the fresh sample as well. As Limonite was the least crystalline sample, peaks
for SiO2 may not have been detected in the fresh sample. The fresh WA-1 sample was found
to be a mixture of Fe2O3 and Goethite (FeHO2). After the redox cycles, no FeHO2 could be
detected as it was converted to Fe2O3. The loss of moisture as shown in the TGA supports this
observation. It can also be seen that there is significant overlap between the Fe2O3 and SiO2
peaks for all three OCs. All three samples indicated the presence of Fe, O and Si in the EDX
analysis, so an assumption that both Fe2O3 and SiO2 can be found in the samples are
reasonable
Figure 11. Electron Dispersive Spectra of a) Fresh samples of OC and b) Used sample after 5 cycles in TGA
a) b)

31
4.3 Fluidized bed reactor
The results from the fluidized bed were analyzed based on the composition of the outflow
gases. Figure 14 shows the outflow composition of the generated gases, for the three fresh
oxygen carriers.
b) a)
Figure 13.XRD measurements of a) WA-2 and b) Limonite
b) a)
Figure 12.XRD measurements of a) WA-1 and b) Calcined WA-1

32
In the WA-1 and WA-2 experiments, a small decrease in the concentration of CO2 can be seen
with an accompanied increase in CO with progressing experiments. Limonite had showed a
very high amount of produced CO2 and low amount of CO in the first cycles, but lesser
amounts of CO was converted as the cycles continued resulting in a lower CO2 concentration
in the outflow, similar to that observed with the WA-1 and WA-2 samples indicating decrease
in CO2 conversion. The CO2 conversion was calculated as Equation 11 below shows.
Where the was found with Equation 12
Figure 14. Produced CO, CO2 and CH4 out from the fluidized bed reactor with a) WA-1, b) WA-2 and c) Limonite
a) b)
c)

33
Here, denotes the fraction of the gas of interest and the is the molar outlet flow.
The is the molar outflow of CO2 and the is the flow of CO2 used
for fluidizing the bed. is the amount of carbon contained in the fuel. The
carbon conversion, was evaluated using Equation 13 below which has been used by
Zhang et al. (2013)[60]
The carbon conversion shows how much of the carbonaceous matter in the fuel has been
converted into gases. With the carbon conversion, the carbon conversion rate, , can be
found using Equation 14. This show how fast the carbonaceous matter converts to gaseous
species.
All the OCs showed a decreasing trend with respect to CO2 conversion as the cycles
progressed. This is clearly displayed in Figure 15 showing the amount of produced CO2
compared to the total carbonaceous gases generated from the coal. In this figure it can also be
seen that there is a large difference between the CO2 conversions of the three OCs, with
Limonite giving the highest concentration of CO2 relative to the carbonaceous gases.
Figure 15. CO2 conversion compared with produced CO, CO2 and CH4
34
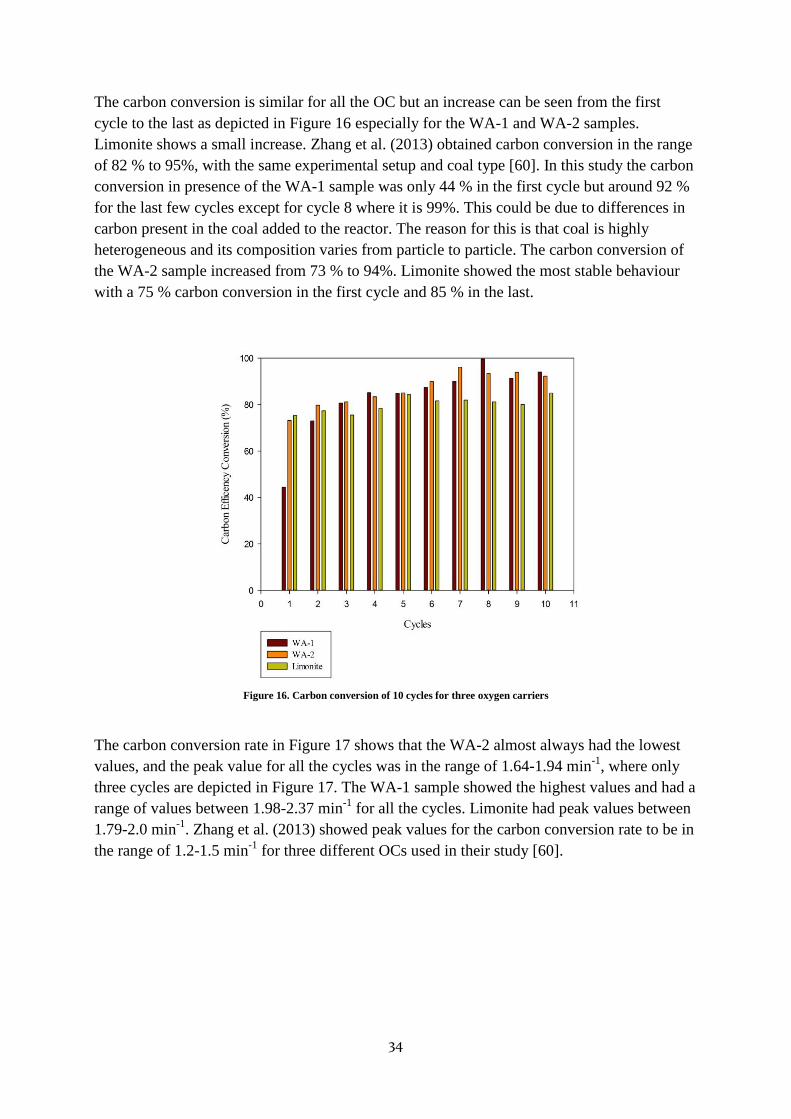
The carbon conversion is similar for all the OC but an increase can be seen from the first
cycle to the last as depicted in Figure 16 especially for the WA-1 and WA-2 samples.
Limonite shows a small increase. Zhang et al. (2013) obtained carbon conversion in the range
of 82 % to 95%, with the same experimental setup and coal type [60]. In this study the carbon
conversion in presence of the WA-1 sample was only 44 % in the first cycle but around 92 %
for the last few cycles except for cycle 8 where it is 99%. This could be due to differences in
carbon present in the coal added to the reactor. The reason for this is that coal is highly
heterogeneous and its composition varies from particle to particle. The carbon conversion of
the WA-2 sample increased from 73 % to 94%. Limonite showed the most stable behaviour
with a 75 % carbon conversion in the first cycle and 85 % in the last.
The carbon conversion rate in Figure 17 shows that the WA-2 almost always had the lowest
values, and the peak value for all the cycles was in the range of 1.64-1.94 min-1
, where only
three cycles are depicted in Figure 17. The WA-1 sample showed the highest values and had a
range of values between 1.98-2.37 min-1
for all the cycles. Limonite had peak values between
1.79-2.0 min-1
. Zhang et al. (2013) showed peak values for the carbon conversion rate to be in
the range of 1.2-1.5 min-1
for three different OCs used in their study [60].
Figure 16. Carbon conversion of 10 cycles for three oxygen carriers

35
4.3.1 SEM Images of Fresh and Used Oxygen Carriers
SEM analysis was carried out on the three used OCs which were removed from the fluidized
bed after the 10th
reduction. The used sample was therefore in its reduced form. None of the
OCs showed any signs of agglomeration but some particles showed evidence of crack on their
surface. SEM images of the WA-1 sample are depicted in Figure 34 in the Appendix together
with pictures of the fresh WA-1 sample which is the same as the one from the TGA
experiments.
There were small cracks in the used WA-1 particles and the surfaces are covered in more
fines. The used WA-1 sample appears a bit rougher than the fresh WA-1 sample but no
significant difference can be seen. There was no noticeable change in the WA-2 sample as
shown in the SEM pictures as shown in Figure 35 in the Appendix. The Limonite sample in
Figure 36 in the Appendix shows a loss of porosity and some of the fine particles on the
surface appear to have coalesced. The reduction in porosity can explain the loss in reactivity
which resulted in lower concentrations of CO2 generated as can be seen Figure 15.
4.3.2 EDX Analysis of samples used in the Fluidized Bed Reactor
EDX spectra of the samples can be found in Figure 18 from which it was found that there was
no significant change in composition of the used OCs compared to the fresh OC. The only
change that could be seen was a small gain in Mg for all the samples, possibly from the coal
ash. The small amount of Sulphur found in the fresh Limonite sample as seen in Figure 11 a)
could not be found in the used one. The amount of Mg and also S are so small that a
conclusion that there is significant ash interaction cannot be drawn.
Figure 17. Carbon conversion rate of the three OC, at 3 different cycles

36
4.3.3 XRD Analysis of samples from the Fluidized Bed Reactor
The XRD analysis of the OC samples after the 10th
reduction reaction is depicted in Figure 19
and shows the presence of Fe2O3, Fe3O4 and SiO2. These were expected due to the OCs being
sampled in its reduced form. The only change relative to the fresh sample was that the WA-1
sample no longer had Geothite (FeHO2) and that SiO2 was found on the Limonite samples. As
mention before, the fresh Limonite sample could have contained SiO2 even though it was not
found in the XRD analysis of the fresh sample. The presence of Fe2O3 shows that the sample
is not fully reduced, and the sample still has some capacity to be reduced. This is also
expected as stoichiometrically the OC was supplied in excess compared to the amount of
carbon matter in the fuel and that not all of the fuel had reacted with the OC.
Figure 18. EDX measurement of the three Oxygen carriers from the fluidized bed reactor

37
4.3.4 ASAP measurements of the fresh and the used particles
The BET surface area in Table 6 shows that the fresh Limonite particles had a larger surface
area than the other two OCs. Also, the used Limonite particles from the FB reactor
experiment still had the largest surface area. The surface area of the used samples was
significantly reduced compared to the fresh samples as can be seen in Table 6. This could be
the reason for the reduced reactivity of all the OCs from the FB experiments, as a reduced
surface area would result in a reduction of active sites for reaction with the gas.
The fresh WA-1 and WA-2 samples had a similar order of magnitude for the total pore
volume as can be seen in Table 7. The total pore volume at adsorption was measured for pores
having an average diameter of 17.0-3000.0 Å. The fresh Limonite sample had a very large
pore volume, but this was also reduced after 10 runs in the FB reactor. Also, the WA-1 and
WA-2 OCs showed a reduction in pore volume after 10 runs in the FB reactor, which would
suggest that the pores of interest in the OC samples had shrunk during reduction and oxidation.
The average pore diameter for the different OCs can be seen in Table 8 below. The fresh
samples showed similar patterns in pore diameter as the BET surface area, where the
Limonite sample had the largest pore diameter while the WA-1 sample had the smallest
average value. After 10 runs in the FB reactor, the WA-2 sample was found to have the
largest pore diameter compared to both Limonite and WA-1. All of the three OCs had
experienced an increase in their pore diameter after 10 cycles, whereby the WA-2 sample had
a doubling in the pore diameter after 10 runs in the FB reactor.
After the 10 redox cycle experiment, all the OCs had a smaller surface area and pore volume
but with larger average pore sizes. This is possibly due to coalescence of the grains forming
larger grains with bigger pores that would reduce the surface area and pore volume of the OCs.
This structural change could be the reason for the lower reactivity of the particles.
Figure 19. XRD measurements of the three Oxygen carriers from the fluidized bed reactor

38
Table 6. Brunauer, Emmett and Teller (BET) surface area of the OC particles
m2/g Fresh OC Used OC in the FB
WA-1 43.4282 1.9403
WA-2 78.1391 5.4033
Limonite 120.821 16.3534
Table 7. Pore volume of the OC particles at adsorption
cm3/g Fresh OC Used OC in the FB
WA-1 0.020607 0.003556
WA-2 0.035349 0.014882
Limonite 0.210546 0.048984
Table 8. Pore size (4V/A) at adsorption of the OC particles
Å Fresh OC Used OC in the FB
WA-1 46.552 68.007
WA-2 49.111 101.122
Limonite 71.201 97.865
4.4 Process modeling using Aspen Plus
A screen shot of the process models developed are shown in Figure 37 to Figure 40 in the
Appendix. The largest species from the reactants CO, H2 and CH4 exiting the gasification
reactor was found to be CO. The conversion of CO is therefore used as the key result in this
study. The initial settings in the models were 900 °C, 1kg/hr coal, 100kg/hr of Fe2O3 and a
flow of air mixture and Carbon carrier gas (CCG) into the different air reactor and fuel reactor
respectively at a rate of 25 L/min.
4.4.1 Analysis of the model using only Gibbs reactors
The result of the simulations using Gibbs reactors for the initial settings yielded around 99.9%
conversion of CO. The H2 and CH4 had also been totally converted while the Fe3O4 from the
fuel reactor had reoxidized back to its original state of Fe2O3 after going through the air
reactor.
A sensitivity analysis was done whereby different parameters were changed such as
Temperature: 327-1127 °C (600-1400K) in the fuel reactor and decomposing reactor
Pressure: 1-15 atm in the fuel reactor and decomposing reactor
Fe2O3 feed rate: 50-100 kg/hr into the fuel reactor
Ratio of O2/N2 0.02-10.2 (2-91% O2 in total flow) in CCG into the decomposing
reactor
Ratio of O2/N2 0.0002-0.286 (0.02-22.2% O2 in total flow) in the air mixture into air
reactor

39
There is a change in CO conversion with respect to temperature in the Gibbs reactor used for
reduction (the fuel reactor). The change in temperature of the fuel reactor, where the reduction
of OC occurs, results in an increasing CO concentration at higher temperatures as can be seen
in Figure 20. The H2 increases a little with temperature, the CH4 change is so small that it is
negligible. The large amount of CO and H2 into the fuel reactor from the decomposition
reactor results in an increased amount of CO and H2 in the outflow from the fuel reactor.
When the amount of CO increases at higher temperatures, both into and out from the fuel
reactor, the concentration of CO2 decreases as the sum of these concentrations together with
CH4 yields a constant value that is related to the carbon content of the coal. The higher the
temperature, the higher the amount of CO and H2 produced with fewer amounts of CH4 and
CO2 showing temperature dependence.
The conversion of the different gases was very close to 100% for most of the investigated
temperatures in the Gibbs reactors, as can be seen in Figure 41 in the Appendix. At very low
or high temperatures, the conversion decreases for CO and H2 with the CO conversion being
the most sensitive to temperature change as well as having the largest flow. The conversion
for CO is around 99.9 % for 350 °C and increases until a temperature of 820 °C after which it
decreases for higher temperatures but is still above 99.97 % at 1100 °C.
With a change in pressure from 1atm to 15 atm, results were obtained showing that the
decomposing reactor was pressure dependent and the fuel reactor was not. A change was
detected in the decomposing reactor as can be seen in Figure 21 a) and this presents the
outflow from the decomposing reactor which is the inflow to the fuel reactor. Lesser CO and
H2 were produced with increasing pressure, but a slight increase in CH4 production could be
detected. A change in the pressure did not affect the outflow of CO, H2 or CH4 from the fuel
reactor as can be seen in Figure 21 b). This shows that pressure does not affect the reduction
stage in the Gibbs reactor even if the inflow to the fuel reactor was changed. The modeling
only investigates up to 15 atm in pressure, while this may be higher in a real CLC application.
Figure 20. Change in composition in the a) inflow and b) outflow flow of the fuel reactor, due to temperature change in the
fuel reactor and decomposing reactor
a) a) b)

40
The CO2 composition in the Carbon carrier gas (CCG) flow was varied, by varying the flow
rate of CO2, and evaluated as shown in Figure 22. With a high concentration of CO2 in the
inflow a higher amount of CO was generated probably due to equilibrium between CO2 and
CO. The higher flow of CO2 generates higher flows of CO in the outflow from the fuel reactor
as can be seen in Figure 22 b), but H2 and CH4 does not show a significant dependency on the
amount of CO2 in the CCG.
In the air reactor, the composition of the inflow of air mixture was changed. The flow of N2 is
assumed constant, at a rate of 751.62 kg/hr, and inert when changing the flow of O2 and
therefore the composition of the flow. A change of O2 concentration in the air flow to the
reactor shows that a total conversion of Fe3O4 can be reached at a concentration of 0.26 % O2
Figure 22. Change in species of a) inflow and b) outflow of the fuel reactor, when Carbon carrier gas (CCG) composition
change
a) b)
Figure 21. Change in composition in the a) inflow and b) outflow flow of the fuel reactor, due to pressure change in the fuel
reactor and decomposing reactor
a) b)

41
in N2 at the total flow rate of 25L/min, resulting in a flow of 1.96 kg/hr of O2. Compared to
the initial condition of 4.2 % O2 resulting a flow rate of 35.64 kg/hr of O2, this is a very low
concentration and the initial input had a large excess of O2. The smallest flow of air mixture
into the reactor needed for total conversion of Fe3O4 is 1.301 L/min, consisting of 4.2 % O2 in
N2. While this is sufficient from a thermodynamics perspective, it will not be enough in a real
application as such a low flow rate would not be able to fluidize the particles.
The feed rate of Fe2O3 needed to convert most of the coal was 59.2 kg/hr (conversion above
99.99 % of CO). A larger flow of Fe2O3 did not result in a higher conversion, so the additional
40 kg/hr supplied will theoretically not react in this model.
Both the reduction and the oxidation simulations showed that Fe2O3 had good thermodynamic
reduction and oxidation capacities and that it is a good starting point as an oxygen carrier for a
CLC unit. The model shows that the Fe2O3 could convert almost all of the CO, H2 and CH4 in
the fuel reactor while air oxidized the Fe3O4 to Fe2O3 in the air reactor.
4.4.2 Analysis using different kinetics
The second part of the modelling work with Aspen Plus was done using kinetic parameters
from literature. There were a few kinetic parameters for CLC systems in the literature, while
some of the evaluated ones are shown in Table 5. Figure 23 shows how the kinetics affects the
residence time in the reactor necessary to produce a high conversion of CO.
Figure 23. CO conversion for different kinetic parameters

42
Bohnt et al. (2010) had redox kinetics that resulted in a very short residence time and a high
conversion compared to all the other kinetics used in this study. It showed that a residence
time of 0.00025 seconds was sufficient to reach 100 % conversion. This value was not plotted
in Figure 23, but it would have showed a vertical line on the left side of the graph due to large
differences with all the other kinetic values used in this study. Kinetic parameters from Abad
et al. results in very low conversions even at very long residence times compared to the fastest
kinetics by Bohnt et al. (2010) or even gasification kinetics by Ye et al. (1998). The
gasification kinetics, except kinetics from Osafune et al, had all reached 100% conversion
before 100 minutes, as can be seen in Figure 23. Rajendran’s kinetic parameters were
obtained from a TGA wherein coal and Fe2O3 were used. With this kinetics, a conversion of
90 % can be reach at 1.2 hours from the model. Other gasification kinetics gives good
conversion at 30 min, for example the gasification kinetics of Yallourn by Tanner. An older
study using Yallourn, by Osafune et al. (1988), showed that a residence time of 5.5 hours was
required for a 90 % conversion.
A temperature sensitivity analysis for three of the 8 kinetic parameters was done using data
from Abad, Rajendran and Osafune which can be seen in Figure 42 to Figure 44 in the
Appendix. Higher temperatures resulted in higher conversion, as is expected due the
dependence of temperature in the Arrhenius equation. The longer the residence time the
higher the conversion. Abad’s kinetic parameters were found to be the slowest one with the
lowest conversion whiles the values by Rajendran being the fastest one of the three.
Two oxidation kinetic parameters were also evaluated as can be seen in Figure 24. The fuel
reactor was a Gibbs reactor resulting in the formation of Fe3O4 which was sent to the air
reactor, the batch reactor with kinetics. There was no difference between the Fe3O4
conversions with the two different kinetic parameters, indicating that the kinetic is not the rate
determining step. If the flow consisted of 21% O2 in N2, a flow of pure air instead of the
mixture of air in N2, the different kinetics resulted in a different conversion of Fe3O4 as can be
seen in Figure 44 in the Appendix. Herein, Abad et al. (2007) showed 70% conversion of
Fe3O4 after 420 min of residence time at 900 °C, while the oxidation kinetics from Son et al.
(2006) gave a conversion of 80% at 15 min. This indicates that the rate governing stage in the
air reactor is the inflow of O2 into the reactor.
The kinetics used in this study are varied, some were based on gasification kinetics while
others were developed by researchers at the Department of Chemical Engineering at Monash
University. There is a very small amount of kinetic data in the literature on the oxidation and
reduction of Fe2O3 in a CLC setup.

43
4.4.2.1 Reaction between oxygen carrier and other species
The fuel stream into the fuel reactor, after the decomposing reactor was divided into two
streams. This to evaluate if it was possible to assume that most of the species formed in the
gasification stage, except for CH4, CO, CO2, H2 and H2O used in the reaction, were inert.
They did not appear in the reactions mentioned in the Methodology section (A1-A3). The
result shows that the species that do not appear in the reduction reactions change only in the
range of 10-8
kg/hr (10-6
mol/hr) with a total inlet flow of 22.4 mol/hr. The largest flow in this
is N2 from the Carbon carrier gas. All the other species had small flow rates relative to that of
N2.
Figure 24. Fe3O4 conversion with two different oxidation kinetics in the air reactor

44
5. DISCUSSION
5.1 TPR/TPO
An increase in capacity of the three oxygen carriers was progressively seen in the TPR/TPO.
This may be due to structural changes during the reduction and oxidation of the oxygen
carrier resulting in conditioning of the particle.
Theoretically, since the WA-1 OC contained more Fe2O3 than the other two, it should have
higher capacity. The capacity was also the largest for WA-1 in the 5th
cycle compared to the
other OCs. The reactivity of the three OCs were different, Limonite had the highest peak
value after deconvolution and therefore should have the highest reactivity, while the WA-1
showed slightly higher values than WA-2. Limonite contained other species which could act
as OCs . Studies have shown that bimetallic OCs display better results than regular Fe2O3 [32].
With this in mind and that Limonite is also a more porous material than the other OCs used in
this study, these would explain the high reactivity of Limonite in comparison to the other OCs.
5.2 TGA
Based on the TPR/TPO results, the TGA tests were aimed at establishing that Limonite was
the one with the best reactivity. Capacity is not measured in the TGA as the amount of coal
added was not sufficient to reduce the OC beyond Fe3O4. The result was similar, in that the
Limonite OC displayed high reduction and oxidation reactivity which could be attributed to
the other metal oxides found in the ore and its porous form as already mentioned.
The amount of coal used in each cycle was 10 mg and the ash content of the coal was around
2 % having up to 40 % Fe2O3 which could act as an oxygen carrier. This would lead to the
amount of ash in the sample being 0.2 mg in each cycle, resulting in an increase of 1 mg for a
total of 5 cycles. The ash in the sample that does not act as an oxygen carrier is less than 0.6
mg, which is negligible compared to the 500 mg of OC which was added in the beginning.
The mass loss in the beginning of every cycle is due to moisture as the different OC contained
different amount of moisture. Since the sample used in the TGA was the fresh OC, the
amount of mass used for each sample varied slightly. The shape of the mass loss curve of
moisture in the first cycle for WA-1 is similar to the WA-2 samples wherein the loss is quick
and at a lower temperature. Limonite shows a weight loss that is not as fast, which can be due
to the way the moisture is bound in the particle.
The oxygen carrier particles evaluated with SEM showed that the WA-1 and the WA-2
samples have lower surface areas. The fresh Limonite sample showed a large surface area in
the ASAP evaluation compared to the other two fresh OC sample as can be seen in Table 6.
The larger surface area of Limonite could explain the better results which were obtained. This
is because the larger surface area gives rise to more active sites for reaction with the reducing
gases leading to a higher reactivity. Tian et al. (2013) showed that Limonite demonstrated a
better reduction performance than most of the other iron ores evaluated in that study [40].
The run using steam for the fresh WA-1and calcined WA-1 samples showed a gain in weight
during the end of the reduction cycle. This may be due to oxidation by steam on the surface of

45
the particle, on which a greater extent of reduction would have occurred as it was the closest
to the coal and its gasification products. Steam had a positive effect on the gasification of coal
as seen with the few samples which were tested in the TGA. Similar findings to this have
been reported in literature [19].
The fresh WA-1 particles showed the formation of cracks after 2 runs in steam. The surface is
more uneven after it was used, with the presence of smaller particles in different sizes. This
would indicate a higher reactivity from a surface area view point after a couple of cycles. The
cracks could be due to the reduction of the fresh particles. No cracks could be seen in the
calcined samples as the calcination process increases the thermal and mechanical stability of
the oxygen carrier and can be the explanation as to why no cracks could be detected. The
samples experimented in the TGA experiences little attrition or mechanical stress and
therefore the formation of cracks by these two mechanisms are highly unlikely.
There was very little ash deposition and no agglomeration of the particles in the samples from
the TGA. This was expected due to the small amount of ash in the coal. No agglomeration of
particles was supported by the fact that Fe2O3 has a melting point of 1500 °C. Saha et al.
(2012). showed that sintering of the grains were not present in their experiment using Fe2O3
and they did not find any ash interaction with their coal which is another type of Victorian
brown coal [50]
The SEM images showed that the small particles on the surface had coalesced. In all the three
used OC samples, the appearance of the surface had changed. The sample which underwent
the most obvious change was Limonite as shown in Figure 30 in the Appendix. Oxidation is
an exothermic process and it is possible that some of the other oxygen carrier components
may have melted resulting in it changing its shape.
Both the EDX evaluation and the XRD analysis from the three TGA experiments showed that
the fresh and used samples contained the same species, Fe2O3 and SiO2. The fresh WA-1
sample shows goethite to be present initially in the XRD analysis but this was lost after it was
subjected to thermal treatment in the reactor. The loss of moisture in the fresh WA-1 sample
causes goethite (FeHO2) to form Fe2O3 when oxidized. Fresh Limonite showed only Fe2O3 in
the XRD analysis but it is assumed to also contain SiO2 due to Si was found in the EDX
analysis, this was not detected because the XRD signal was not clear. A small ash interaction
could be seen in the EDX sample for Limonite, where Limonite lost S due to thermal
treatment but gained small amounts of Ca, this was not detected in the XRD analysis and is
assumed to be a negligible effect. It is also worth indicating that XRD detects only crystalline
compounds, and not amorphous compounds.
5.3 Fluidized bed reactor
The results from the small fluidized bed reactor show that Limonite is the best of the three
OCs in terms of CO2 conversion of the produced gases. This was also found with the
TPR/TPO and TGA experiments confirming that Limonite had the best reactivity. Instead of
an increase in reactivity over the reaction cycles as the TPR/TPO showed, the result from the
FB showed a decreasing reactivity for the first cycles, but then gave a stable value. This is
probably due to structural changes where all the OCs showed a lower surface area after 10

46
runs in the FB reactor. A 100% conversion of CO and CH4 to CO2 and H2O is not reasonable
as the coal was added from the top of the reactor. The coal would devolatilize and gasify as
soon as it enters the fluidization chamber and some of these gases would most likely exit the
reactor into the gas analyzer without reacting with the OC.
The WA-1 and WA-2 samples show an amount of 40% CO2 in the outflow of produced gases.
Even when taking into account the previously mentioned statement, this conversion cannot be
concluded as a good result. The conversion values are stable but very low. The Limonite
sample had a conversion of 90% of CO2 which is good in the first cycle, but after subsequent
cycles the conversion was below 80%.
The concentration of Fe2O3 in the oxygen carriers does not seem to be a crucial factor in this
study, but the porosity is a more important factor, as Limonite shows better results compare to
WA-1 which has a higher amount of Fe2O3 in the sample. Limonite also contained other
minerals that could potentially have a positive effect on its reactivity.
The carbon conversion rate was only marginally higher for this study compared to that of
Zhang et al (2013) study [60]. The heterogeneity of the coal sample could be the reason to the
differences together with the other oxygen carrier used in that study. The carbon conversion
rate shows the gasification rate, the reduction of the oxygen carriers should increase that rate.
This is due to the reaction between the OC and the gasified products is removing the
hindering products of the gasification. The OC with highest reaction rate should therefore
show the highest carbon conversion as it removes the gasification products fastest. The
Limonite sample showed the most stable carbon conversion and rate over the 10 cycles in the
FB and had highest reaction rate in the TGA and TPR/TPO, but still the WA-1 had the highest
values. The Limonite sample which had the best reactivity did not show a better carbon
conversion rate compared to WA-1, and this needs to be further investigated.
5.4 Aspen plus modeling
The Aspen models were developed for a fluidizing bed reactor configuration intended for
simulation of a CLC process using Fe2O3 and Victorian brown coal. The Gibbs model shows
the equilibrium outcome while a real reactor will probably have dependence on kinetics, the
residence time of particles as well as temperature and pressure. The amount of Fe2O3 would
make a difference in the conversion of the coal in a real case, as more material will have more
surface area for the reducing gas to react with. But this did not have a considerable effect in
this analysis based on the Gibbs reactors. Changes in conversion over the fuel reactor could
be detected due to temperature changes but not due to pressure. The conversion changes for
temperature was very small and a conclusion that temperature and pressure will significantly
affect the conversion could not be found, due to reaction is based on equilibrium and assumed
to go to steady state.
Due to changes in temperature a higher amount of CO could be detected in the inflow to the
fuel reactor. A favorable reactor temperature, when evaluating the conversion over the fuel
reactor shows that a temperature range between 600-950 °C would give the highest
conversions, but outside these ranges the conversion is still high for the Gibbs reactor.

47
The Chatelier's principle says that the equilibrium concentrations does not depend on pressure,
only when the volume changes the effect of pressure is present. This is not the case in our
process where one mole CO reacts and form one mole CO2. Hence there should not be a
change due to pressure change for the fuel reactor. The pressure change did only give a small
change in the decomposing reactor that represented the gasification stage in the reactor. The
decomposition reactor shows how solid coal is gasified, giving a volume change. If the
Chatelier's principle is used in this part there would be an affect due to the pressure in the
decomposition reactor. Roberts et al. (2000) showed little pressure dependency on char
gasification, compared to temperature dependency [61]. In this model only a small change
could be detected and it is possible that no or larger effect on the gasification will be evident
in an experiment. The pressure dependency in a CLC reactor has been shown by Garcia et al.
(2005). They showed that the reactivity for the oxygen carriers did decrease when the total
pressure increased [62].
The gasification kinetics used in this model is not totally representative for modelling a CLC
unit with iron ore containing Fe2O3 together with a fuel like Yallourn coal. There is very little
information on reaction kinetics of the oxygen carrier with solid fuels in literature. Therefore
the gasification kinetics of coal was used due to it being the rate governing step in the CLC
unit. Some of the gasification kinetics was for Yallourn coal, but others were for other coal or
char. The kinetics were also obtained using different methods with a variance in the type of
reactor such as a single particle reactor, a TGA or a fluidized bed reactor, which will all have
an effect on the kinetics. Literature proposes a number of different ways to reduce the Fe2O3
with many intermediate steps, which could also give different kinetic parameters for each step.
The kinetic parameters generated by Abad et al. (2007) resulted in a very low conversion rate.
The gasification stage have been concluded the rate governing stage [19, 22] and reduction
kinetics should give a faster reactions than gasification kinetics. But when comparing
residence time using the reduction kinetic parameters of Abad et al. (2007) with any
gasification kinetics, the residence time is shorter for all of the gasification kinetics. This
indicates that a further evaluations with the kinetics from Abad et al. (2007) needs to be done.
The kinetic parameters were primarily from TGA or similar scale equipment, where the
particles are in a fixed bed. While CLC typically utilizes a fluidized bed and that the presence
of mixing would give an even faster reaction rate. Gasification in presence of oxygen carriers
should be faster due to the fact that the reduction of the oxygen carriers consumes the
products of the gasification reaction, which are known gasification inhibitors. Due to the
presence of oxygen carriers and a fluidized bed reactor, experimental values should be faster
than the one found in this model.
Bohn et al. (2013) have kinetics for the reduction of Fe2O3 in a fluidized bed reactor, but
using those values, the residence time in the batch reactor was found to be 0.00025 seconds to
reach equilibrium. Comparing these values with Rajendran who has reduced Fe2O3 with
Yallourn coal, that shows a good conversion after 1.2 hours, represents how the kinetic
parameters can significantly affect the CO conversion in the model.

48
The two kinetics evaluated for the air reactor shows identical result with initial composition
settings. When the composition of the air inflow increased from 4.2% to 21% of O2, it
resulted in a difference between the two kinetics used. This shows that the inflow of O2 of the
initial settings will be the rate governing factor. The oxidation is and exothermic reaction and
therefore will the reaction be needed to be controlled to not cause large temperature rise, that
will affect the particles negative, such as sintering and agglomeration.
When investigating the effect of the inert particles and the oxygen carriers, the result showed
that the need for dividing the fuel reactor into a batch reactor and a Gibbs-reactor is
unnecessary. The inert species were found to not react with the oxygen carriers in a wider
range of conditions. If an evaluation of these reactions is needed, the kinetic parameters and
reactions can be added to the model. The Victorian coal in this model has a low amount of ash,
nitrogen, and very little amount of sulfur. It is therefore reasonable to assume these as inert
components, as the evaluation shows. The ash was assumed from the start to go straight
through the reaction as an inert, in a real process parts of the ash will probably affect the CLC
process. This could for example react with the oxygen carriers or it can cause the particles to
agglomerate and cannot be assumed to be inert in a real case. In this study, the ash content is
very low, but if the model is to be used for other coals with higher ash content, then there is a
need for including the reaction kinetics of the ash.
6. CONCLUSIONS This study consisted of two parts involving both experimental and modelling aspects. The
experimental work is to evaluate the use of three different iron ores as oxygen carriers
together with a Victorian brown coal in a CLC process.The modelling part in this study is a
preliminary model aimed at simulating the operation of a 10kWth fluidized bed reactor system.
The three iron ores showed a stable cyclic behaviour when evaluated using both the TPR/TPO
and TGA for five cycles totalling 9.7 hours and 11.7 hours respectively. While the surface
morphology of the three OCs in this study changed due to conditioning and coalescence of the
grains, these show promising features in terms of reactivity and minimum interaction with the
ash from Yallourn coal based on the TGA experiments. Among the three tested minerals, the
Limonite sample showed the best redox reactivity compared to the WA-1 and the WA-2
samples. This is due to its highly porous nature and also to a lesser extent due to the content
of other minerals in the ore which could act as oxygen carriers. The WA-1 sample showed the
largest capacity based on the TPR/TPO experiment and this is due to it having the highest
amount of Fe2O3.
The fluidized bed results showed 80 % CO2 conversion with the Limonite sample, but for both
the WA-1 and WA-2 samples the CO2 conversion was 40 % after 10 cycles of operation. The
oxygen carriers showed a decreasing CO2 conversion over 10 cycles. The OCs also showed a
decreasing surface area after 10 cycles in the fluidized bed which could explain the decreasing
reactivity in the fluidized bed reactor. The OC was removed while it was in a reduced state

49
from the last reduction cycle and showed the presence of both Fe2O3 and Fe3O4 in the XRD
analysis. This indicates that the OC was not fully reduced as expected because the OC was in
excess. The samples did not show any agglomeration but the surface morphology of the
oxygen carriers had changed in the form of cracks which could be due to attrition in the
fluidized bed. The coal used in this study shows promising results for a future CLC process
due to its low ash content, and that no significant interaction could be concluded in this study.
The process model developed using Aspen Plus showed that Fe2O3 is a good starting point for
a CLC unit as an oxygen carrier for use with the Victorian brown coal. An almost complete
conversion of CO, H2 and CH4 in the fuel reactor and total conversion of the Fe3O4 to Fe2O3
in the air reactor was obtained for the models based on the Gibbs reactors. A number of
kinetic parameters were studied in the model with batch reactors, showing 100 % conversion
of CO after 0.00025 seconds to 90 % conversion after 5.5 hours depending on the kinetic used.
The two different kinetics used in the air reactor did not show any difference for a low flow of
O2. With a higher flow of O2 the different kinetics showed a difference in Fe3O4 conversion
showing that the low flow of O2 is rate determining. Further development of kinetics and also
comparison between experimental and model predictions needs to be done.
The reduction kinetics used was based on CO2 gasification or reduction of Fe2O3, but in a
future CLC process model both CO2 and Steam gasification and reduction needs to be used to
give a proper model for a real CLC plant.
7. RECOMMENDATIONS FOR FUTURE WORK This study involved one experimental part and the other part was process modeling. One of
the OCs in the experimental evaluation, WA-1, should be evaluated in further experiments,
and in a larger alternating fluidized bed reactor. The experimental part could be extended with:
The fresh WA-1 showed poor results and a future work using this would be to evaluate
the effect of calcination. A smaller particle size is also a possibility as it would give a
higher surface area.
The carbon conversion rate for the different oxygen carriers needs to be further
evaluated
Suggestion for further work in process modeling include:
Change the batch reactor to a fluidized bed reactor and utilizing appropriate kinetic
parameters developed for this coal in CO2 and steam and in presence of Fe2O3.
Evaluate the effects of process parameters, as pressure, over a wider range.
Compare the model predictions with experimental data
50
9. REFERENCES 1. Marrero, G.A., Greenhouse gases emissions, growth and the energy mix in Europe.
Energy Economics, 2010. 32(6): p. 1356-1363.
2. Mandil, C., Reducing Greeenhouse Gas Emissions - The potential of Coal. 2005,
International Energy Agency: 9 rue de la Fédération, 75739 Paris.
3. Constantin, F.A. and I. Loredana, International Multidisciplinary Scientific
GeoConference : SGEM : Surveying Geology & mining Ecology Management.
Surveying Geology & mining Ecology Management (SGEM), 2009. 1: p. 8.
4. Hossain, M.M. and H.I. de Lasa, Chemical-looping combustion (CLC) for inherent
CO2 separations—a review. Chemical Engineering Science, 2008. 63(18): p. 4433-
4451.
5. Statoil. Sleipner West. 2013 17 December [cited 2014 11 May]; Available from:
http://www.statoil.com/en/TechnologyInnovation/NewEnergy/Co2CaptureStorage/Pa
ges/SleipnerVest.aspx.
6. Carbon-Capture-Sequestration-Technologies. Sleipner Fact Sheet: Carbon Dioxide
Capture and Storage Project 2014 21 January [cited 2014 11 May]; Available from:
https://sequestration.mit.edu/tools/projects/sleipner.html.
7. Herzog, H. and D. Golomb, Carbon capture and storage from fossil fuel use.
Encyclopedia of energy, 2004. 1: p. 1-11.
8. Hoteit, A., A. Forret, W. Pelletant, J. Roesler, and T. Gauthier, Chemical looping
combustion with different types of liquid fuels. Oil & Gas Science and Technology–
Revue d’IFP Energies nouvelles, 2011. 66(2): p. 193-199.
9. Lyngfelt, A., Oxygen carriers for chemical looping combustion-4 000 h of operational
experience. Oil & Gas Science and Technology–Revue d’IFP Energies nouvelles,
2011. 66(2): p. 161-172.
10. Leion, H., T. Mattisson, and A. Lyngfelt, Use of ores and industrial products as
oxygen carriers in chemical-looping combustion. Energy & Fuels, 2009. 23(4): p.
2307-2315.
11. Abad, A., J. Adánez, F. García-Labiano, L.F. de Diego, P. Gayán, and J. Celaya,
Mapping of the range of operational conditions for Cu-, Fe-, and Ni-based oxygen
carriers in chemical-looping combustion. Chemical Engineering Science, 2007. 62(1):
p. 533-549.
12. Lyngfelt, A., Chemical-looping combustion of solid fuels–status of development.
Applied Energy, 2014. 113: p. 1869-1873.
13. Berguerand, N. and A. Lyngfelt, The use of petroleum coke as fuel in a 10kWth
chemical-looping combustor. International Journal of Greenhouse Gas Control, 2008.
2(2): p. 169-179.
14. Adánez, J., L. De Diego, F. García-Labiano, P. Gayán, A. Abad, and J. Palacios,
Selection of oxygen carriers for chemical-looping combustion. Energy & Fuels, 2004.
18(2): p. 371-377.
15. Ishida, M. and H. Jin, A novel chemical-looping combustor without NOx formation.
Industrial & engineering chemistry research, 1996. 35(7): p. 2469-2472.
16. Abad, A., J. Adánez Elorza, D. Poza, P. Gayán Sanz, F. García Labiano, and A.
Lyngfelt, Fuel reactor model validation: Assessment of the key parameters affecting
the chemical-looping combustion of coal. 2013.
17. Zevenhoven-Onderwater, M., J.-P. Blomquist, B.-J. Skrifvars, R. Backman, and M.
Hupa, The prediction of behaviour of ashes from five different solid fuels in fluidised
bed combustion. Fuel, 2000. 79(11): p. 1353-1361.
18. Shen, L., J. Wu, and J. Xiao, Experiments on chemical looping combustion of coal
with a NiO based oxygen carrier. Combustion and Flame, 2009. 156(3): p. 721-728.

51
19. Leion, H., T. Mattisson, and A. Lyngfelt, Solid fuels in chemical-looping combustion.
International Journal of Greenhouse Gas Control, 2008. 2(2): p. 180-193.
20. Coal Mining - Quarterly Update 12/16/2013. 2013, Hoover's Inc.: Austin. p. 0.
21. Schweinfurth, S.P. and R.B. Finkelman, Coal--a complex natural resource: an
overview of factors affecting coal quality and use in the United States. Vol. 1143.
2003: US Dept. of the Interior, US Geological Survey.
22. Leion, H., T. Mattisson, and A. Lyngfelt, The use of petroleum coke as fuel in
chemical-looping combustion. Fuel, 2007. 86(12): p. 1947-1958.
23. Saha, C. and S. Bhattacharya, Comparison of CuO and NiO as oxygen carrier in
chemical looping combustion of a Victorian brown coal. International Journal of
Hydrogen Energy, 2011. 36(18): p. 12048-12057.
24. Jerndal, E., T. Mattisson, and A. Lyngfelt, Thermal analysis of chemical-looping
combustion. Chemical Engineering Research and Design, 2006. 84(9): p. 795-806.
25. Wang, B., R. Yan, H. Zhao, Y. Zheng, Z. Liu, and C. Zheng, Investigation of chemical
looping combustion of coal with CuFe2O4 oxygen carrier. Energy & Fuels, 2011.
25(7): p. 3344-3354.
26. Leion, H., E. Jerndal, B.-M. Steenari, S. Hermansson, M. Israelsson, E. Jansson, M.
Johnsson, R. Thunberg, A. Vadenbo, T. Mattisson, and A. Lyngfelt, Solid fuels in
chemical-looping combustion using oxide scale and unprocessed iron ore as oxygen
carriers. Fuel, 2009. 88(10): p. 1945-1954.
27. Linderholm, C., A. Lyngfelt, A. Cuadrat, and E. Jerndal, Chemical-looping
combustion of solid fuels–Operation in a 10kW unit with two fuels, above-bed and in-
bed fuel feed and two oxygen carriers, manganese ore and ilmenite. Fuel, 2012. 102: p.
808-822.
28. Leion, H., A. Lyngfelt, M. Johansson, E. Jerndal, and T. Mattisson, The use of
ilmenite as an oxygen carrier in chemical-looping combustion. Chemical Engineering
Research and Design, 2008. 86(9): p. 1017-1026.
29. Cuadrat, A., A. Abad, J. Adánez, L. De Diego, F. García-Labiano, and P. Gayán,
Behavior of ilmenite as oxygen carrier in chemical-looping combustion. Fuel
Processing Technology, 2012. 94(1): p. 101-112.
30. Berguerand, N. and A. Lyngfelt, Batch testing of solid fuels with ilmenite in a 10kWth
chemical-looping combustor. Fuel, 2010. 89(8): p. 1749-1762.
31. Keller, M., M. Arjmand, H. Leion, and T. Mattisson, Interaction of mineral matter of
coal with oxygen carriers in chemical-looping combustion (CLC). Chemical
Engineering Research and Design, 2013.
32. Fan, Y. and R.V. Siriwardane, Novel New Oxygen Carriers for Chemical Looping
Combustion of Solid Fuels. Energy & Fuels, 2014.
33. Siriwardane, R., H. Tian, T. Simonyi, and J. Poston, Synergetic effects of mixed
copper–iron oxides oxygen carriers in chemical looping combustion. Fuel, 2013. 108:
p. 319-333.
34. Australian-Government-Geoscience-Australia. Iron Fact Sheet - Australian atlas of
minerals resources, mines & processing centers. 2014-03-05]; Available from:
http://www.australianminesatlas.gov.au/education/fact_sheets/iron.html.
35. Monazam, E.R., R.W. Breault, and R. Siriwardane, Reduction of hematite (Fe2O3) to
wüstite (FeO) by carbon monoxide (CO) for chemical looping combustion. Chemical
Engineering Journal, 2014. 242: p. 204-210.
36. Magnacca, G., G. Cerrato, C. Morterra, M. Signoretto, F. Somma, and F. Pinna,
Structural and surface characterization of pure and sulfated iron oxides. Chemistry of
materials, 2003. 15(3): p. 675-687.

52
37. Li, K., H. Wang, Y. Wei, and D. Yan, Syngas production from methane and air via a
redox process using Ce–Fe mixed oxides as oxygen carriers. Applied Catalysis B:
Environmental, 2010. 97(3): p. 361-372.
38. Wimmers, O., P. Arnoldy, and J. Moulijn, Determination of the reduction mechanism
by temperature-programmed reduction: application to small iron oxide (Fe2O3)
particles. The Journal of Physical Chemistry, 1986. 90(7): p. 1331-1337.
39. Mattisson, T., M. Johansson, and A. Lyngfelt, Multicycle reduction and oxidation of
different types of iron oxide particles application to chemical-looping combustion.
Energy & Fuels, 2004. 18(3): p. 628-637.
40. Tian, H., R. Siriwardane, T. Simonyi, and J. Poston, Natural Ores as Oxygen Carriers
in Chemical Looping Combustion. Energy & Fuels, 2013. 27(8): p. 4108-4118.
41. Rubel, A., Y. Zhang, K. Liu, and J. Neathery, Effect of ash on oxygen carriers for the
application of chemical looping combustion to a high carbon char. Oil & Gas Science
and Technology–Revue d’IFP Energies nouvelles, 2011. 66(2): p. 291-300.
42. Markström, P., C. Linderholm, and A. Lyngfelt, Operation of a 100kW chemical-
looping combustor with Mexican petroleum coke and Cerrejón coal. Applied Energy,
2014. 113: p. 1830-1835.
43. Markström, P., A. Lyngfelt, and C. Linderholm. Chemical-looping combustion in a
100 kW unit for solid fuels. in 21st International Conference on Fluidized Bed
Combustion, June. 2012.
44. Shen, L., J. Wu, J. Xiao, Q. Song, and R. Xiao, Chemical-looping combustion of
biomass in a 10 kWth reactor with iron oxide as an oxygen carrier. Energy & Fuels,
2009. 23(5): p. 2498-2505.
45. Abad, A., I. Adánez-Rubio, P. Gayán, F. García-Labiano, L.F. de Diego, and J.
Adánez, Demonstration of chemical-looping with oxygen uncoupling (CLOU) process
in a 1.5 kWth continuously operating unit using a Cu-based oxygen-carrier.
International Journal of Greenhouse Gas Control, 2012. 6: p. 189-200.
46. Yazdanpanah, M., A. Forret, T. Gauthier, and A. Delebarre, Modeling of CH4
combustion with NiO/NiAl2O4 in a 10kWth CLC pilot plant. Applied Energy, 2014.
113: p. 1933-1944.
47. Thon, A., M. Kramp, E.-U. Hartge, S. Heinrich, and J. Werther, Operational
experience with a system of coupled fluidized beds for chemical looping combustion of
solid fuels using ilmenite as oxygen carrier. Applied Energy, 2013.
48. Orth, M., J. Ströhle, and B. Epple. Design and Operation of a 1 MWth Chemical
Looping Plant. in Proc. 2nd Int. Conf. Chemical Looping, Darmstadt, Germany. 2012.
49. Abdulally, I. and C. Beal. Alstom’s Chemical Looping Prototypes Program Update. in
Proc. From the 37th Int. Technical Conf. on Clean Coal & Fuel Systems. 2012.
50. Saha, C. and S. Bhattacharya, Chemical looping combustion of low-ash and high-ash
low rank coals using different metal oxides–A thermogravimetric analyser study. Fuel,
2012. 97: p. 137-150.
51. Fan, L., F. Li, and S. Ramkumar, Utilization of chemical looping strategy in coal
gasification processes. Particuology, 2008. 6(3): p. 131-142.
52. Liu, B., X.-m. Yang, W.-l. Song, and W.-g. Lin, Process simulation of formation and
emission of NO and N2O during coal decoupling combustion in a circulating fluidized
bed combustor using Aspen Plus. Chemical Engineering Science, 2012. 71: p. 375-391.
53. Abad, A., F. García-Labiano, L.F. de Diego, P. Gayán, and J. Adánez, Reduction
kinetics of Cu-, Ni-, and Fe-based oxygen carriers using syngas (CO+ H2) for
chemical-looping combustion. Energy & Fuels, 2007. 21(4): p. 1843-1853.

53
54. Bohnt, C., J. Cleeton, C. Miiller, S. Scotr, and J. Dennis. Measuring the kinetics of the
reduction of iron oxide with carbon monoxide in a fluidized bed. in Proceedings of the
20th International Conference on Fluidized Bed Combustion. 2010. Springer.
55. Son, S.R. and S.D. Kim, Chemical-looping combustion with NiO and Fe2O3 in a
thermobalance and circulating fluidized bed reactor with double loops. Industrial &
engineering chemistry research, 2006. 45(8): p. 2689-2696.
56. Ye, D., J.B. Agnew, and D. Zhang, Gasification of a South Australian low-rank coal
with carbon dioxide and steam: kinetics and reactivity studies. Fuel, 1998. 77(11): p.
1209-1219.
57. Gu, J., S. Wu, X. Zhang, Y. Wu, and J. Gao, CO2-gasification reactivity of different
carbonaceous materials at elevated temperatures. Energy Sources, Part A, 2009.
31(3): p. 232-243.
58. Osafune, K. and H. Marsh, Gasification kinetics of coal chars in carbon dioxide. Fuel,
1988. 67(3): p. 384-388.
59. Kovacik, G., A. Chambers, and B. Özüm, CO2 gasification kinetics of two Alberta
coal chars. The Canadian Journal of chemical engineering, 1991. 69(3): p. 811-815.
60. Zhang, S., S. Rajendran, R. Xiao, and S. Bhattacharya, Chemical-Looping Combustion
of Victorian Brown Coal Using Mixed Oxygen Carriers of Iron and Manganese
Oxides, in CHEMECA. 2013: Brisbane Convention & Exhibition Centre.
61. Roberts, D. and D. Harris, Char gasification with O2, CO2, and H2O: Effects of
pressure on intrinsic reaction kinetics. Energy & Fuels, 2000. 14(2): p. 483-489.
62. Garcia-Labiano, F., J. Adanez, L.F. de Diego, P. Gayán, and A. Abad, Effect of
pressure on the behavior of copper-, iron-, and nickel-based oxygen carriers for
chemical-looping combustion. Energy & Fuels, 2006. 20(1): p. 26-33.

Appendix-1
APPENDIX
TPR Measurements of oxygen carriers in cycle 2 to 5
The reduction cycles are here presented for each oxygen carrier.
Figure 26.TPR measurements of cycle 2-5 of WA-2
Figure 25. TPR measurements of cycle 2-5 of WA-1
Appendix-2
Figure 27. TPR measurements of cycle 2-5 of Limonite

Appendix-3
SEM-figures fresh and used sample from TGA
Here are SEM pictures of WA-1, WA-2, Limonite and Calcined WA-1, both fresh samples
and samples used in the TGA, with CO2 and steam
b) a)
c) d)
e) f)
Figure 28. SEM pictures of WA-1. a) Fresh 500x, b) Fresh 5000x, c) 5
cycles in CO2 500x, d) 5 cycles in CO2 5000x, e)
2 cycles in steam 500x, f) 5 cycles in steam 5000x

Appendix-4
a) b)
c) d)
Figure 30. SEM pictures of Limonite. a) Fresh 500x, b) Fresh 30 000x, c) 5 cycles in CO2 500x, d) 5 cycles in CO2 30 000x
a) b)
c) d)
Figure 29. SEM pictures of WA-2. a) Fresh 500x, b) Fresh 5000x, c) 5 cycles in CO2 500x, d) 5 cycles in CO2 5000x

Appendix-5
b) a)
c) d)
e) f)
Figure 31. SEM pictures of Calcined WA-1. a) Calcined 500x, b) Calcined 5000x, c) 5 cycles in CO2 500x,
d) 5 cycles in CO2 5000x, e) 2 cycles in steam 500x, f) 5 cycles in steam 5000x

Appendix-6
EDX-figures for WA-1 fresh and Calcined sample
The EDX measurements of the fresh WA-1 and the Calcined WA-1.Displaying the unused
sample, the sample used for 5 runs in CO2 gasification and 2 runs in steam gasification, in the
TGA
Figure 33. Samples of Calcined WA-1, Calcined WA-1 used both in CO2 and Steam in TGA
Figure 32. Samples of Fresh WA-1,WA-1 used both in CO2 and Steam in TGA
Appendix-7
SEM figures from the Fluidized bed reactor
Here are SEM pictures of WA-1, WA-2 and Limonite, both fresh samples and samples used
in the fluidized bedreactor.
b) a)
c) d)
Figure 34. SEM pictures of WA-1. a) Fresh 500x, b) Fresh 5000x, c) 10 cycles, 500x, d) 10 cycles, 5000x,

Appendix-8
a) b)
c) d)
Figure 36. SEM pictures of Limonite. a) Fresh 500x, b) Fresh 30 000x, c) 10 cycles, 500x, d) 10 cycles 30 000x
a) b)
c) d)
Figure 35. SEM pictures of WA-2. a) Fresh 500x, b) Fresh 5000x, c) 10 cycles, 500x, d) 10 cycles, 5000x

Appendix-9
Model figuration of the Aspen modeling
Figure 37. Aspen plus model with RGibbs reactors
Red ring is Fuel reactor and Blue ring is Air reactor
Figure 38. Aspen plus model with one RBatch reactor for fuel reactor used when evaluating reduction kinetics

Appendix-10
Figure 40. Aspen plus model with one RBatch reactor and one RGibbs reactor modelling the reduction reactor and effects of other possible reactions
Figure 39. Aspen plus model with one RBatch reactor for air reactor used when evaluated oxidation kinetics

Appendix-11
Conversion of species when using Gibbs reactor
The conversion over the fuel reactor, when change in temperature both in the fuel reactor and in the
decomposing reactor is here presented:
Sensitivity analysis on temperature dependence for different kinetics
Three different kinetics are used for following analysis on the fuel reactor
Figure 41. Conversion of species in fuel reactor, when changing temperature in both fuel and decomposing reactor

Appendix-12
Figure 43. CO conversion depending on the residence time and temperature for kinetics by Osafune et al. (1988)
Figure 42. CO conversion depending on the residence time and temperature for kinetics by Rajendran

Appendix-13
Two different kinetics are used for following analysis on air reactor.
Figure 45. Fe3O4 conversion with two different oxidation kinetics
Figure 44. CO conversion depending on the residence time and temperature for kinetics by Abad et al. (2007)


![Definition Iron deficiency anemia is caused from a shortness of iron in the body. “[Iron] is a component of hemoglobin (which transports oxygen within.](https://static.fdocuments.us/doc/165x107/56649c9e5503460f9495e8f4/definition-iron-deficiency-anemia-is-caused-from-a-shortness-of-iron-in.jpg)


