A study of the noninstrumented physical examination of the knee found high observer variability
9
A study of the noninstrumented physical examination of the knee found high observer variability Laurence Wood, George Peat, Ross Wilkie, Elaine Hay, Elaine Thomas, Julius Sim* Primary Care Sciences Research Centre, Keele University, Staffordshire ST5 5BG, UK Accepted 7 November 2005 Abstract Objective: This study estimated the inter- and intraobserver reliability of a set of noninstrumented physical examination measures for knee pain in older adults. Study Design and Setting: Forty-five patients from primary care, and 13 patients from secondary care, were each examined by two out of a team of three physical therapists, and were reexamined by one of these observers 1 month later. The examination items were standard- ized and included dichotomous, ordinal and continuous variables considered relevant to a primary care context. Results: For individual dichotomous items, median interobserver and intraobserver agreement (k) was 0.22 (interquartile range IQR 5 0.12–0.35) and 0.41 (IQR 5 0.28–0.56) respectively. For ordinally rated variables, weighted kappa ranged from 20.08 to 0.43 for interobserver agreement, and from 0.00 to 0.79 for intraobserver agreement. The median intraclass correlation coefficient for continuous examination variables was 0.80 (range 0.68–0.89) for interobserver agreement, and 0.84 (range 0.67–0.95) for intraobserver agreement. Conclusion: For trained but nonexpert examiners, agreement was generally poor for dichotomous and ordinal examination items; however, k-values are liable to be depressed by the low prevalence of clinical signs in this sample. Agreement on continuous variables was notably better. Ó 2006 Elsevier Inc. All rights reserved. Keywords: Observer variability; Reliability; Knee; Physical examination 1. Introduction Knee pain is a common complaint in the general popu- lation and results in a large number of primary care consul- tations [1]. Clinical decision making rests largely on the findings of the clinical history and the physical examina- tion, the latter being a common method of evaluation of os- teoarthritis of the knee in primary care [2]. A number of studies have provided estimates of the re- liability of the physical examination of the knee [3–13]. The setting, design, conduct, and analysis of reliability studies in this field has varied considerably, however, with the result that a consistent conclusion on the reliability of the physical examination of the knee has yet to emerge. To the extent that reliability estimates vary in relation to as- pects of study design, it becomes important to consider the group (in terms of both patients and examiners) to which estimates are to be applied. Our interest centered on the inter- and intraobserver reliability of the physical examination of knee pain in primary care. In this setting, an emphasis on simple, noninstrumented physical examina- tion by nonspecialist examiners, in patients with predomi- nantly mild clinical severity, appears to be appropriate. Although elements of this focus have been included in the design of previous studies, few have focused on reliabil- ity in primary care. 2. Methods 2.1. Subjects and observers Potential participants were identified by retrospective re- cord review from four sources. The computerized consulta- tion records of two general practices were searched for all Read-coded knee consultations and consecutive patients meeting the eligibility criteria were invited to participate. Inclusion criteria were (a) men or women age 50 years or over and (b) consultation in primary care with a knee prob- lem within the last 18 months. Exclusion criteria were (a) previous knee joint replacement; (b) psychiatric illness or learning difficulties; and (c) patients no longer registered with the general practice. In addition, participants meeting * Corresponding author. Tel.: 144-(0)1782-584253; fax: 144-(0)1782- 584255. E-mail address: [email protected] (J. Sim). 0895-4356/06/$ – see front matter Ó 2006 Elsevier Inc. All rights reserved. doi: 10.1016/j.jclinepi.2005.11.004 Journal of Clinical Epidemiology 59 (2006) 512–520
-
Upload
laurence-wood -
Category
Documents
-
view
212 -
download
0
Transcript of A study of the noninstrumented physical examination of the knee found high observer variability

Journal of Clinical Epidemiology 59 (2006) 512–520
A study of the noninstrumented physical examination of the kneefound high observer variability
Laurence Wood, George Peat, Ross Wilkie, Elaine Hay, Elaine Thomas, Julius Sim*Primary Care Sciences Research Centre, Keele University, Staffordshire ST5 5BG, UK
Accepted 7 November 2005
Abstract
Objective: This study estimated the inter- and intraobserver reliability of a set of noninstrumented physical examination measures forknee pain in older adults.
Study Design and Setting: Forty-five patients from primary care, and 13 patients from secondary care, were each examined by two outof a team of three physical therapists, and were reexamined by one of these observers 1 month later. The examination items were standard-ized and included dichotomous, ordinal and continuous variables considered relevant to a primary care context.
Results: For individual dichotomous items, median interobserver and intraobserver agreement (k) was 0.22 (interquartile range IQR 5
0.12–0.35) and 0.41 (IQR 5 0.28–0.56) respectively. For ordinally rated variables, weighted kappa ranged from 20.08 to 0.43 forinterobserver agreement, and from 0.00 to 0.79 for intraobserver agreement. The median intraclass correlation coefficient for continuousexamination variables was 0.80 (range 0.68–0.89) for interobserver agreement, and 0.84 (range 0.67–0.95) for intraobserver agreement.
Conclusion: For trained but nonexpert examiners, agreement was generally poor for dichotomous and ordinal examination items;however, k-values are liable to be depressed by the low prevalence of clinical signs in this sample. Agreement on continuous variableswas notably better. � 2006 Elsevier Inc. All rights reserved.
Keywords: Observer variability; Reliability; Knee; Physical examination
1. Introduction
Knee pain is a common complaint in the general popu-lation and results in a large number of primary care consul-tations [1]. Clinical decision making rests largely on thefindings of the clinical history and the physical examina-tion, the latter being a common method of evaluation of os-teoarthritis of the knee in primary care [2].
A number of studies have provided estimates of the re-liability of the physical examination of the knee [3–13].The setting, design, conduct, and analysis of reliabilitystudies in this field has varied considerably, however, withthe result that a consistent conclusion on the reliability ofthe physical examination of the knee has yet to emerge.To the extent that reliability estimates vary in relation to as-pects of study design, it becomes important to consider thegroup (in terms of both patients and examiners) to whichestimates are to be applied. Our interest centered on theinter- and intraobserver reliability of the physical
* Corresponding author. Tel.: 144-(0)1782-584253; fax: 144-(0)1782-
584255.
E-mail address: [email protected] (J. Sim).
0895-4356/06/$ – see front matter � 2006 Elsevier Inc. All rights reserved.
doi: 10.1016/j.jclinepi.2005.11.004
examination of knee pain in primary care. In this setting,an emphasis on simple, noninstrumented physical examina-tion by nonspecialist examiners, in patients with predomi-nantly mild clinical severity, appears to be appropriate.Although elements of this focus have been included inthe design of previous studies, few have focused on reliabil-ity in primary care.
2. Methods
2.1. Subjects and observers
Potential participants were identified by retrospective re-cord review from four sources. The computerized consulta-tion records of two general practices were searched for allRead-coded knee consultations and consecutive patientsmeeting the eligibility criteria were invited to participate.Inclusion criteria were (a) men or women age 50 years orover and (b) consultation in primary care with a knee prob-lem within the last 18 months. Exclusion criteria were (a)previous knee joint replacement; (b) psychiatric illness orlearning difficulties; and (c) patients no longer registeredwith the general practice. In addition, participants meeting
513L. Wood et al. / Journal of Clinical Epidemiology 59 (2006) 512–520
inclusion criterion (a) and exclusion criteria (a) and (b)were identified from consecutive referrals to a rheumatologyoutpatient clinic, and from the waiting list for total knee re-placement at a hospital department of orthopedic surgery.This sampling strategy was designed to include patientsacross a range of severity likely to be encountered withinprimary care, but with enrichment from secondary care inan attempt to ensure that the high-severity end of this spec-trum would be captured.
Ethical approval for the study was obtained from theNorth Staffordshire Local Research Ethics Committee,and written informed consent was obtained from allparticipants.
Observers were three research physical therapists with 7,9, and 10 years of postqualification experience, based at anacademic center for primary care research. Intraobserveragreement was examined in relation to each observer, andinterobserver agreement was examined in relation to allthree possible pairings of these three observers.
Prior to the study, observers were trained in the stan-dardized physical examination with reference to a manualof detailed protocols. These protocols covered patient andobserver positioning, details of the test procedure, verbalinstructions and prompts to the patient, response optionsfor the test, and criteria for these response options. The ob-servers received feedback during training from two special-ist musculoskeletal physical therapy clinicians. Prior to thestudy, each observer was also given feedback on a video-recording of his own examination of one patient. Twofurther training sessions, 1 and 2 months into the study,were aimed at maintaining a standardized approach to inter-preting the protocols and conducting the examination, andto reinforce the methods outlined in the manual.
2.2. Procedure
Potentially eligible patients were sent an invitation letterand information sheet and invited to telephone the researchcenter if they were interested in participating. Those re-sponding were screened for eligibility, and were given anappointment at a research clinic held in a community hos-pital outpatient department.
At the first visit, participants were assessed indepen-dently by two of the three observers participating in thestudy, with an interval of five minutes between assessments.The order of assessment by the observers was varied sys-tematically, so that each assessor was the first assessor onapproximately an equal number of occasions. The alloca-tion of patients to assessor pairs was quasi-random, in thatappointments were preassigned to pairs of observers andparticipants were booked into the next available slot.
Observers were blinded to patients’ medical records andsource of referral. The physical examination was precededby a structured clinical history [14], taken by each observer.After each assessment, documents were sealed in an opaqueenvelope, and no discussion of cases was permitted
between observers. Following the second assessment, par-ticipants completed a brief set of self-report questionnaires.These included a 0–10 numerical rating scale for pain in-tensity and the WOMAC (3.0, ordinal version), a 24-itemknee-specific instrument that generates scores for the sever-ity of pain (0–20), stiffness (0–8), and physical function(0–68) over the preceding 48 hours [15].
Clinical assessments and self-report questionnaires wererepeated by the first observers |1 month later. To identifyany change in clinical status between first and second visit,participants were asked a single transition question andcoded as being ‘‘better,’’ ‘‘worse,’’ or ‘‘about the same.’’
2.3. Physical examination measures
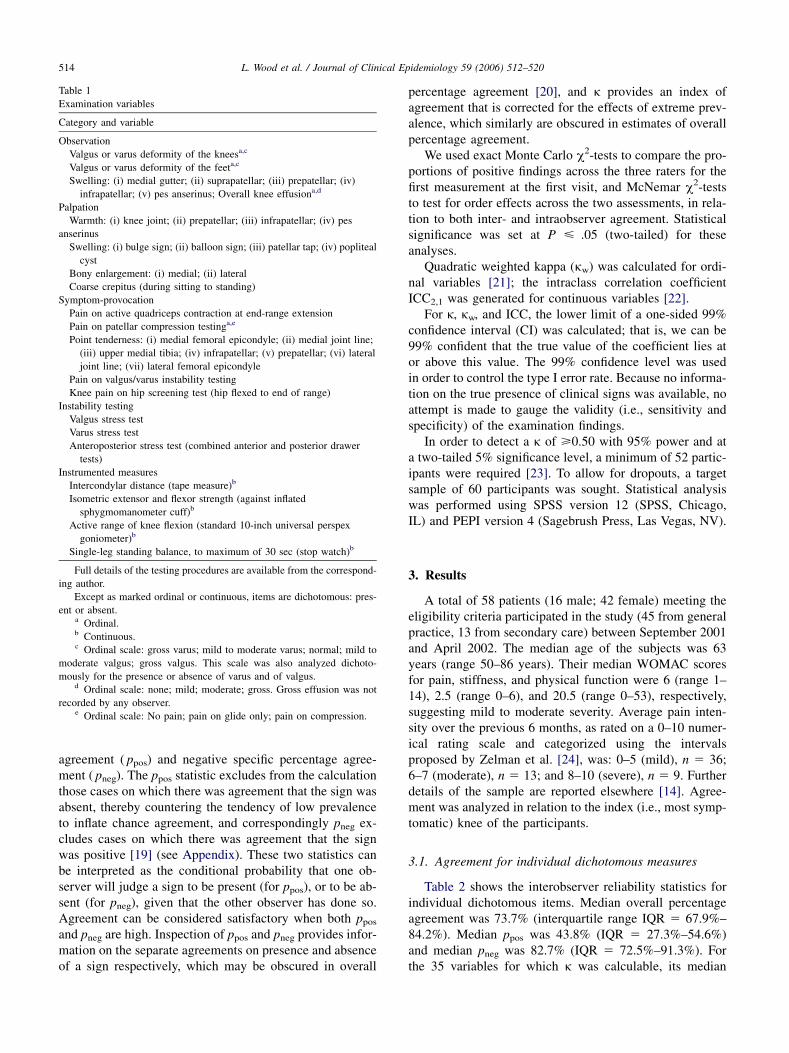
The items included in the physical examination were se-lected for their appropriateness to everyday clinical practicein primary care, and were identified in a four-stage process.First, we consulted a broad range of rheumatology text-books for what their authors considered to be the importantitems in a knee examination. Second, we excluded pro-cedures that were deemed inappropriate for a clinicalexamination in primary care (e.g., unduly complex ortime-consuming, requiring specialist equipment, related tospecific clinical syndromes). Third, we consulted two se-nior lecturer-physicians in rheumatology and five seniorphysical therapists for their views on which physical exam-ination items should be included and which should be ex-cluded. Fourth, we reviewed the primary textual sourcesfor information regarding usefulness, reliability and valid-ity of the candidate items. The resulting content of thephysical examination is shown in Table 1. As well as gaug-ing agreement on individual physical examination items,we also examined agreement on a composite classificationfor knee osteoarthritis [16].
The physical examination was constrained to a maximumof 40 minutes; although longer than a typical clinical exam-ination in a primary care setting, this much time wasneeded to complete all of the examination items. Tests mostliable to aggravate the subject’s symptoms were placed atthe end of the examination, to minimize their biasing effecton other tests. Assessment findings were recorded on a stan-dard form that was checked for missing data immediatelypost assessment.
2.4. Statistical analysis
Inter- and intraobserver agreement for dichotomousitems was measured by k [17]. A high or low prevalenceleads to high chance agreement, and the magnitude of kis reduced accordingly [18]. The prevalence of each itemwas therefore calculated, and is expressed as the mean ofthe two observers’ prevalence estimates. In addition tooverall percentage agreement (the percentage of cases forwhich there was agreement that the sign was either presentor absent), we also calculated positive specific percentage
514 L. Wood et al. / Journal of Clinical Epidemiology 59 (2006) 512–520
agreement ( ppos) and negative specific percentage agree-ment ( pneg). The ppos statistic excludes from the calculationthose cases on which there was agreement that the sign wasabsent, thereby countering the tendency of low prevalenceto inflate chance agreement, and correspondingly pneg ex-cludes cases on which there was agreement that the signwas positive [19] (see Appendix). These two statistics canbe interpreted as the conditional probability that one ob-server will judge a sign to be present (for ppos), or to be ab-sent (for pneg), given that the other observer has done so.Agreement can be considered satisfactory when both ppos
and pneg are high. Inspection of ppos and pneg provides infor-mation on the separate agreements on presence and absenceof a sign respectively, which may be obscured in overall
Table 1
Examination variables
Category and variable
Observation
Valgus or varus deformity of the kneesa,c
Valgus or varus deformity of the feeta,c
Swelling: (i) medial gutter; (ii) suprapatellar; (iii) prepatellar; (iv)
infrapatellar; (v) pes anserinus; Overall knee effusiona,d
Palpation
Warmth: (i) knee joint; (ii) prepatellar; (iii) infrapatellar; (iv) pes
anserinus
Swelling: (i) bulge sign; (ii) balloon sign; (iii) patellar tap; (iv) popliteal
cyst
Bony enlargement: (i) medial; (ii) lateral
Coarse crepitus (during sitting to standing)
Symptom-provocation
Pain on active quadriceps contraction at end-range extension
Pain on patellar compression testinga,e
Point tenderness: (i) medial femoral epicondyle; (ii) medial joint line;
(iii) upper medial tibia; (iv) infrapatellar; (v) prepatellar; (vi) lateral
joint line; (vii) lateral femoral epicondyle
Pain on valgus/varus instability testing
Knee pain on hip screening test (hip flexed to end of range)
Instability testing
Valgus stress test
Varus stress test
Anteroposterior stress test (combined anterior and posterior drawer
tests)
Instrumented measures
Intercondylar distance (tape measure)b
Isometric extensor and flexor strength (against inflated
sphygmomanometer cuff)b
Active range of knee flexion (standard 10-inch universal perspex
goniometer)b
Single-leg standing balance, to maximum of 30 sec (stop watch)b
Full details of the testing procedures are available from the correspond-
ing author.
Except as marked ordinal or continuous, items are dichotomous: pres-
ent or absent.a Ordinal.b Continuous.c Ordinal scale: gross varus; mild to moderate varus; normal; mild to
moderate valgus; gross valgus. This scale was also analyzed dichoto-
mously for the presence or absence of varus and of valgus.d Ordinal scale: none; mild; moderate; gross. Gross effusion was not
recorded by any observer.e Ordinal scale: No pain; pain on glide only; pain on compression.
percentage agreement [20], and k provides an index ofagreement that is corrected for the effects of extreme prev-alence, which similarly are obscured in estimates of overallpercentage agreement.
We used exact Monte Carlo c2-tests to compare the pro-portions of positive findings across the three raters for thefirst measurement at the first visit, and McNemar c2-teststo test for order effects across the two assessments, in rela-tion to both inter- and intraobserver agreement. Statisticalsignificance was set at P < .05 (two-tailed) for theseanalyses.
Quadratic weighted kappa (kw) was calculated for ordi-nal variables [21]; the intraclass correlation coefficientICC2,1 was generated for continuous variables [22].
For k, kw, and ICC, the lower limit of a one-sided 99%confidence interval (CI) was calculated; that is, we can be99% confident that the true value of the coefficient lies ator above this value. The 99% confidence level was usedin order to control the type I error rate. Because no informa-tion on the true presence of clinical signs was available, noattempt is made to gauge the validity (i.e., sensitivity andspecificity) of the examination findings.
In order to detect a k of >0.50 with 95% power and ata two-tailed 5% significance level, a minimum of 52 partic-ipants were required [23]. To allow for dropouts, a targetsample of 60 participants was sought. Statistical analysiswas performed using SPSS version 12 (SPSS, Chicago,IL) and PEPI version 4 (Sagebrush Press, Las Vegas, NV).
3. Results
A total of 58 patients (16 male; 42 female) meeting theeligibility criteria participated in the study (45 from generalpractice, 13 from secondary care) between September 2001and April 2002. The median age of the subjects was 63years (range 50–86 years). Their median WOMAC scoresfor pain, stiffness, and physical function were 6 (range 1–14), 2.5 (range 0–6), and 20.5 (range 0–53), respectively,suggesting mild to moderate severity. Average pain inten-sity over the previous 6 months, as rated on a 0–10 numer-ical rating scale and categorized using the intervalsproposed by Zelman et al. [24], was: 0–5 (mild), n 5 36;6–7 (moderate), n 5 13; and 8–10 (severe), n 5 9. Furtherdetails of the sample are reported elsewhere [14]. Agree-ment was analyzed in relation to the index (i.e., most symp-tomatic) knee of the participants.
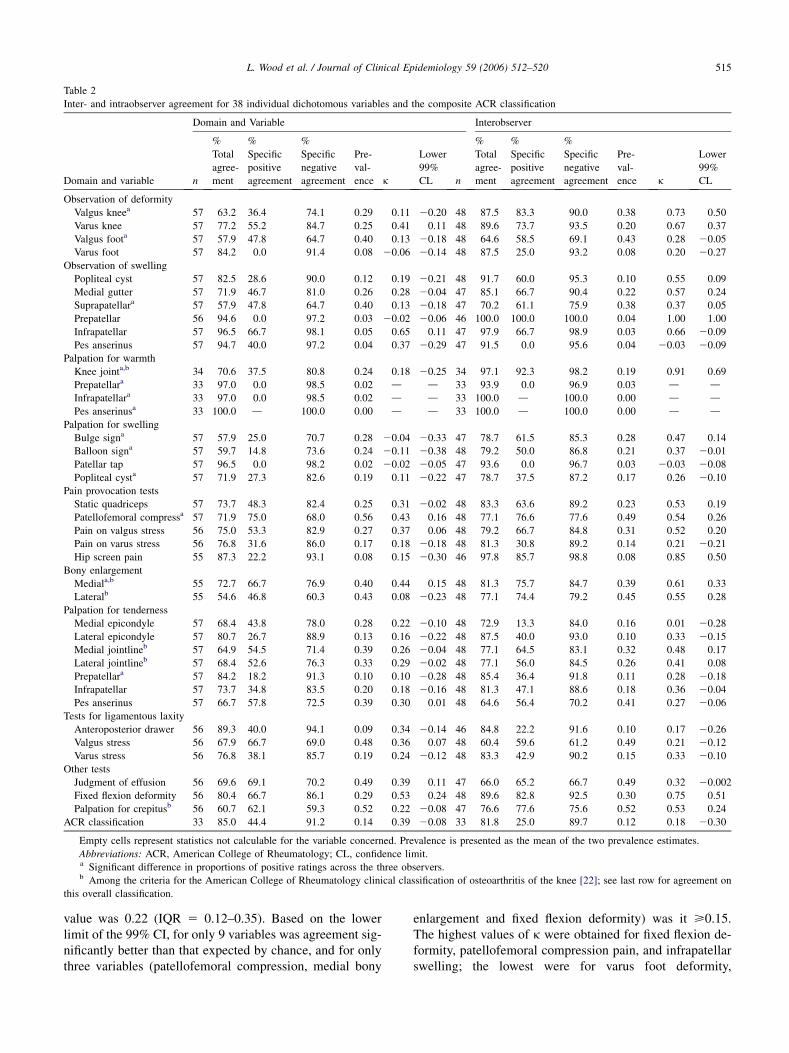
3.1. Agreement for individual dichotomous measures
Table 2 shows the interobserver reliability statistics forindividual dichotomous items. Median overall percentageagreement was 73.7% (interquartile range IQR 5 67.9%–84.2%). Median ppos was 43.8% (IQR 5 27.3%–54.6%)and median pneg was 82.7% (IQR 5 72.5%–91.3%). Forthe 35 variables for which k was calculable, its median
515L. Wood et al. / Journal of Clinical Epidemiology 59 (2006) 512–520
Table 2
Inter- and intraobserver agreement for 38 individual dichotomous variables and the composite ACR classification
Domain and Variable Interobserver
Domain and variable n
%
Total
agree-
ment
%
Specific
positive
agreement
%
Specific
negative
agreement
Pre-
val-
ence k
Lower
99%
CL n
%
Total
agree-
ment
%
Specific
positive
agreement
%
Specific
negative
agreement
Pre-
val-
ence k
Lower
99%
CL
Observation of deformity
Valgus kneea 57 63.2 36.4 74.1 0.29 0.11 20.20 48 87.5 83.3 90.0 0.38 0.73 0.50
Varus knee 57 77.2 55.2 84.7 0.25 0.41 0.11 48 89.6 73.7 93.5 0.20 0.67 0.37
Valgus foota 57 57.9 47.8 64.7 0.40 0.13 20.18 48 64.6 58.5 69.1 0.43 0.28 20.05
Varus foot 57 84.2 0.0 91.4 0.08 20.06 20.14 48 87.5 25.0 93.2 0.08 0.20 20.27
Observation of swelling
Popliteal cyst 57 82.5 28.6 90.0 0.12 0.19 20.21 48 91.7 60.0 95.3 0.10 0.55 0.09
Medial gutter 57 71.9 46.7 81.0 0.26 0.28 20.04 47 85.1 66.7 90.4 0.22 0.57 0.24
Suprapatellara 57 57.9 47.8 64.7 0.40 0.13 20.18 47 70.2 61.1 75.9 0.38 0.37 0.05
Prepatellar 56 94.6 0.0 97.2 0.03 20.02 20.06 46 100.0 100.0 100.0 0.04 1.00 1.00
Infrapatellar 57 96.5 66.7 98.1 0.05 0.65 0.11 47 97.9 66.7 98.9 0.03 0.66 20.09
Pes anserinus 57 94.7 40.0 97.2 0.04 0.37 20.29 47 91.5 0.0 95.6 0.04 20.03 20.09
Palpation for warmth
Knee jointa,b 34 70.6 37.5 80.8 0.24 0.18 20.25 34 97.1 92.3 98.2 0.19 0.91 0.69
Prepatellara 33 97.0 0.0 98.5 0.02 d d 33 93.9 0.0 96.9 0.03 d dInfrapatellara 33 97.0 0.0 98.5 0.02 d d 33 100.0 d 100.0 0.00 d d
Pes anserinusa 33 100.0 d 100.0 0.00 d d 33 100.0 d 100.0 0.00 d d
Palpation for swelling
Bulge signa 57 57.9 25.0 70.7 0.28 20.04 20.33 47 78.7 61.5 85.3 0.28 0.47 0.14
Balloon signa 57 59.7 14.8 73.6 0.24 20.11 20.38 48 79.2 50.0 86.8 0.21 0.37 20.01
Patellar tap 57 96.5 0.0 98.2 0.02 20.02 20.05 47 93.6 0.0 96.7 0.03 20.03 20.08
Popliteal cysta 57 71.9 27.3 82.6 0.19 0.11 20.22 47 78.7 37.5 87.2 0.17 0.26 20.10
Pain provocation tests
Static quadriceps 57 73.7 48.3 82.4 0.25 0.31 20.02 48 83.3 63.6 89.2 0.23 0.53 0.19
Patellofemoral compressa 57 71.9 75.0 68.0 0.56 0.43 0.16 48 77.1 76.6 77.6 0.49 0.54 0.26
Pain on valgus stress 56 75.0 53.3 82.9 0.27 0.37 0.06 48 79.2 66.7 84.8 0.31 0.52 0.20
Pain on varus stress 56 76.8 31.6 86.0 0.17 0.18 20.18 48 81.3 30.8 89.2 0.14 0.21 20.21
Hip screen pain 55 87.3 22.2 93.1 0.08 0.15 20.30 46 97.8 85.7 98.8 0.08 0.85 0.50
Bony enlargement
Mediala,b 55 72.7 66.7 76.9 0.40 0.44 0.15 48 81.3 75.7 84.7 0.39 0.61 0.33
Lateralb 55 54.6 46.8 60.3 0.43 0.08 20.23 48 77.1 74.4 79.2 0.45 0.55 0.28
Palpation for tenderness
Medial epicondyle 57 68.4 43.8 78.0 0.28 0.22 20.10 48 72.9 13.3 84.0 0.16 0.01 20.28
Lateral epicondyle 57 80.7 26.7 88.9 0.13 0.16 20.22 48 87.5 40.0 93.0 0.10 0.33 20.15
Medial jointlineb 57 64.9 54.5 71.4 0.39 0.26 20.04 48 77.1 64.5 83.1 0.32 0.48 0.17
Lateral jointlineb 57 68.4 52.6 76.3 0.33 0.29 20.02 48 77.1 56.0 84.5 0.26 0.41 0.08
Prepatellara 57 84.2 18.2 91.3 0.10 0.10 20.28 48 85.4 36.4 91.8 0.11 0.28 20.18
Infrapatellar 57 73.7 34.8 83.5 0.20 0.18 20.16 48 81.3 47.1 88.6 0.18 0.36 20.04
Pes anserinus 57 66.7 57.8 72.5 0.39 0.30 0.01 48 64.6 56.4 70.2 0.41 0.27 20.06
Tests for ligamentous laxity
Anteroposterior drawer 56 89.3 40.0 94.1 0.09 0.34 20.14 46 84.8 22.2 91.6 0.10 0.17 20.26
Valgus stress 56 67.9 66.7 69.0 0.48 0.36 0.07 48 60.4 59.6 61.2 0.49 0.21 20.12
Varus stress 56 76.8 38.1 85.7 0.19 0.24 20.12 48 83.3 42.9 90.2 0.15 0.33 20.10
Other tests
Judgment of effusion 56 69.6 69.1 70.2 0.49 0.39 0.11 47 66.0 65.2 66.7 0.49 0.32 20.002
Fixed flexion deformity 56 80.4 66.7 86.1 0.29 0.53 0.24 48 89.6 82.8 92.5 0.30 0.75 0.51
Palpation for crepitusb 56 60.7 62.1 59.3 0.52 0.22 20.08 47 76.6 77.6 75.6 0.52 0.53 0.24
ACR classification 33 85.0 44.4 91.2 0.14 0.39 20.08 33 81.8 25.0 89.7 0.12 0.18 20.30
Empty cells represent statistics not calculable for the variable concerned. Prevalence is presented as the mean of the two prevalence estimates.
Abbreviations: ACR, American College of Rheumatology; CL, confidence limit.a Significant difference in proportions of positive ratings across the three observers.b Among the criteria for the American College of Rheumatology clinical classification of osteoarthritis of the knee [22]; see last row for agreement on
this overall classification.
value was 0.22 (IQR 5 0.12–0.35). Based on the lowerlimit of the 99% CI, for only 9 variables was agreement sig-nificantly better than that expected by chance, and for onlythree variables (patellofemoral compression, medial bony
enlargement and fixed flexion deformity) was it >0.15.The highest values of k were obtained for fixed flexion de-formity, patellofemoral compression pain, and infrapatellarswelling; the lowest were for varus foot deformity,

516 L. Wood et al. / Journal of Clinical Epidemiology 59 (2006) 512–520
prepatellar swelling, and the patellar tap sign. The medianprevalence, calculated on 38 variables, was 0.25 (IQR 5
0.09–0.39), indicating low prevalence of the examinationsigns.
Table 2 also shows the intraobserver reliability statisticsfor dichotomous items. Median overall percentage agree-ment was 83.3% (IQR 5 77.1%–91.5%). Median ppos was60.0% (IQR 5 37.5%–73.7%) and median pneg was 89.2%(IQR 5 84.0%–93.2%). The median value of k (calculatedon 35 variables) was 0.41 (IQR 5 0.28–0.56). Based on thelower limit of the 99% CI, agreement was significantly betterthan that expected by chance for 19 variables; the lower con-fidence limit was >0.15 for 14 items and >0.4 for 5 items.The highest values of k were obtained for prepatellar swell-ing, knee joint warmth, and hip screen pain; the lowest wereobtained for pes anserinus swelling, patellar tap sign, and me-dial epicondyle tenderness. The median prevalence, calcu-lated on 38 variables, was 0.20 (IQR 5 0.10–0.38).
Those tests relying on visual observation produced me-dian k-values of 0.24 and 0.56 for interobserver and intra-observer agreement respectively. The corresponding figuresfor palpation tests were 0.18 and 0.37, and those for pain-provocation tests and tests requiring a maneuver on the partof the examiner were 0.33 and 0.43. Point estimates for fivevariables met Shrout’s [25] cutoff for ‘fair’ agreement (k >
0.40) for both inter- and intraobserver agreement: varusknee deformity, observation of infrapatellar swelling, patel-lofemoral compression pain, medial bony enlargement, andfixed flexion deformity.
At the first assessment on the first visit, the proportion ofpositive findings differed significantly across the three par-ticipating observers in relation to 12 of the 38 individual di-chotomous variables (Table 2). In the interobserveranalysis, the mean percentage of positive findings on the38 dichotomous variables differed by !1 percentage pointbetween both observers on the first visit (t 5 –1.029, P 5
.310); for 14 variables the difference was less than 65 per-centage points and for only five variables was the differencegreater than 610 percentage points. In the intraobserveranalysis, the corresponding mean percentage differed by!0.5% for the first observer between the first and secondvisits (t 5 0.300, P 5 .766); for 15 variables the differencewas less than 65 percentage points and for only four vari-ables was it greater than 610 percentage points. For the 35individual dichotomous items on which they were calcula-ble, McNemar c2-tests on the individual dichotomous vari-ables were nonsignificant for both inter- and intraobserveragreement, suggesting that there were no order effects.
There was a low, nonsignificant correlation betweenvalues of k for intraobserver variables and those for the cor-responding interobserver variables (r 5 0.143, P 5 .414).For 8 out of 35 items (valgus foot deformity, pes anserinusswelling, patellar tap sign, patellofemoral compressionpain, medial epicondyle tenderness, lateral joint line tender-ness, valgus laxity, and judgment of effusion), k was higherfor interobserver than for intraobserver agreement.
3.2. Agreement for clinical classification
Criteria for the American College of Rheumatology clin-ical classification of osteoarthritis of the knee [16] compriseknee pain on most days of the past month, plus three of thefollowing: (i) age O50 years; (ii) morning stiffness !30min; (iii) palpable crepitus; (iv) bony tenderness at the jointmargins (medial and/or lateral); (v) bony enlargement (me-dial and/or lateral); (vi) no palpable warmth. Because allpatients in our study were aged O50 years, and data forthe reliability of the knee pain and morning stiffness vari-ables were available from a linked study of the subjectiveexamination of the knee, using the same sample [14], wewere able to calculate agreement on the complete classifi-cation criteria. This yielded a k of 0.39 for interobserveragreement and a k of 0.18 for intraobserver agreement(Table 2). The mean prevalence of knee osteoarthritis inthe sample, according to this classification, was approxi-mately 13% (Table 2).
3.3. Agreement for ordinal and continuous measures
Table 3 shows the inter- and intraobserver reliability sta-tistics for the ordinally rated examination variables. Valuesof kw ranged from –0.08 to 0.43 for interobserver agree-ment, and from 0.00 to 0.79 for intraobserver agreement.The poorest agreement was for foot deformity; for bothinter- and intraobserver agreement, kw was not significantlygreater than zero. For only two variables (intraobserveragreement for knee deformity and patellofemoral compres-sion pain) was the lower limit of the 99% CI > 0.3.
Agreement for variables measured on continuous scalesis shown in Table 4. Because the magnitude of the ICC isdetermined in part by the range of the scores on which itis calculated, the coefficient of variation (i.e., the standarddeviation standardized by the mean) has been included.For variables with a high coefficient of variation, the ICCis likely to be somewhat inflated. The median ICC for inter-observer agreement was 0.80 (range 0.68–0.89), and for in-traobserver agreement was 0.84 (range 0.67–0.95). Thehighest interobserver agreement was for intermalleolargap (ICC 5 0.89), and the highest intraobserver agreementwas for intercondylar gap (ICC 5 0.95). Interobserveragreement was poorest for flexor strength. Intraobserveragreement was poorest for single leg balance, and for thisthe ICC was lower than for interobserver agreement. Thelower limit of the 99% CI was >0.44 for all variables.
4. Discussion
This study of examination items considered appropriatefor use in the everyday clinical situation was based on clin-ical examinations by three physical therapists who wereexperienced in musculoskeletal practice but not likely to beconsidered clinical experts. The examination items wereselected in relation to their appropriateness and feasibility

517L. Wood et al. / Journal of Clinical Epidemiology 59 (2006) 512–520
Table 3
Inter- and intraobserver agreement for ordinally rated examination variables
Interobserver Intraobserver
Domain and variable n
% Total
agreement kw
Lower
99% CL n
% Total
agreement kw
Lower
99% CL
Observation of deformity
Kneea 57 44 0.43 0.10 48 77 0.79 0.60
Foota 57 46 20.08 20.42 48 58 0.00 20.47
Pain provocation tests
Patellofemoral compressb 57 60 0.42 0.13 48 71 0.62 0.35
Miscellaneous tests
Judgment of effusionc 57 53 0.43 0.18 47 58 0.35 0.03
Abbreviations and variables: CL, confidence limit; kw, observed quadratic-weighted kappa.a Five-point scale.b Three-point scale.c Four-point scale.
in primary care, and the patients participating in the studywere drawn for the most part from primary care con-sulters, but were enriched with a sample from secondarycare, in an attempt to reflect the spectrum of cases likelyto be seen in primary care. The examination items and theparticipants were thus broadly representative of clinicalpractice in primary care; however, the fact that only threeobservers were used in the study limits the extent to whichformal generalization can be made.
For individual dichotomous examination variables, themedian interobserver value of k was low, despite high over-all percentage agreement. Values of pneg were considerablyhigher that those of ppos (by a median of 0.38), however,and the median prevalence was low at 0.25. Hence, thecombination of low k and high total agreement reflects, atleast in part, the disparity in levels of agreement betweenpositive and negative findings and the low prevalence ofthe signs. The design of the study did not permit the calcu-lation of interobserver bias, as all observers occupied therole of each rater (1 and 2).
Intraobserver agreement for the dichotomous itemsshowed a very similar picture, except that k-values weregenerally higher. Again, values of pneg were considerablyhigher that those of ppos (by a median of 0.24), and the me-dian prevalence was low at 0.20. Interestingly, there was no
significant correlation across inter- and intraobserver anal-yses in the relative size of agreement for the items undertest. Although one would usually expect interobserveragreement to be lower than intraobserver agreement, inseven (20%) of the dichotomous items the reverse wasthe case. In two cases, however, the differences were neg-ligible, and in the case of the largest discrepancy (pes an-serinus swelling) a change in just one rating in theintraobserver analysis would equalize the coefficients. Thishighlights the instability of k when there is a very high orlow prevalence.
It is not easy to draw conclusions from median values ofk in different categories of examination items; however,comparing across the interobserver and intraobserver anal-yses, median k-values are most similar for test items elicit-ing pain or requiring a maneuver on the part of theexaminer, suggesting that these tests are less dependenton the individual judgment of the observer concerned thanthose depending on observation or palpation. Note that ex-amination items depending on palpation were not includedin the five dichotomous items attaining a k > 0.40 for bothinter- and intraobserver agreement.
Focusing on the clinical classification of knee osteoar-thritis [16], k was low for both inter- and intraobserveragreement (Table 4), and for interobserver agreement
Table 4
Inter- and intraobserver agreement for continuous (instrumented) examination variables
Interobserver Intraobserver
Variable n ICC Lower 99% CL CV n ICC Lower 99% CL CV
Intercondylar gap 57 0.83 0.71 191 47 0.95 0.90 203
Intermalleolar gap 57 0.89 0.80 240 47 0.74 0.54 262
Flexion (degrees) 57 0.68 0.47 9 46 0.82 0.67 9
Extensor strengtha 55 0.83 0.71 39 46 0.85 0.68 38
Flexor strengtha 55 0.70 0.51 39 45 0.89 0.75 39
Single leg balancea 57 0.77 0.62 110 48 0.67 0.44 103
Abbreviations: CL, confidence limit; CV, coefficient of variation; ICC, intraclass correlation coefficient (model 2,1).a Scores for these variables were censored; participants with extensor or flexor strength ratings O300 N were assigned a score of 300, and those with
single-leg balance O30 sec were assigned a score of 30 sec.
518 L. Wood et al. / Journal of Clinical Epidemiology 59 (2006) 512–520
somewhat lower than the estimate (k 5 0.59) obtained byBellamy et al. [9]. The fact that agreement was worsewithin than between observers is attributable in part tothe low intraobserver agreement in the linked study [14]for ‘‘pain on most days in the last month’’ (k 5 0.44), be-cause this is a necessary condition for the classification.The poor agreement on the presence of knee pain probablyreflects the fact that most participants responded ‘‘better’’or ‘‘worse’’ to the transition question, suggesting that insome cases the underlying clinical status of their knee orknees may have changed in the intervening 1-month period.
For ordinal examination variables, kw values were alsolow, particularly for observation of foot deformity. Forthose variables measured on a continuous scale, agreementwas better than for the dichotomous and ordinal variables(though caution should be exercised when comparingvalues of k and the ICC, as their interpretation is somewhatdifferent). This points to a considerably higher level ofagreement on instrumented measures, in which ratings areless susceptible to individual clinical interpretation.
Many of the k-values in this study are comparable toestimates obtained in previous studies. Some studies, how-ever, report considerably higher agreement on certainitems. For example, in relation to interobserver agreementCushnaghan et al. [3] report k 5 0.64 for tibiofemoral crep-itus, Fritz et al. [8] report k 5 0.66 for knee joint warmth,and Hart et al. [4] report k 5 0.74 for (unspecified) jointtenderness; these are at least twice the corresponding esti-mates from the current study. A recent study of the physicalexamination of the knee by Cibere et al. [13] found 30 of 42items (71%) to have ‘‘adequate’’ interobserver reliability(interpreted as k O 0.60 for dichotomous items). Warmth,medial instability, and lateral instability were the only threedichotomous items to be highly unreliable. Although thefindings of this study seem to indicate considerably betterreliability than in our study, a number of issues should beconsidered in any comparison of the findings. First, in theCibere et al. study [13], the examiners were all rheumatol-ogists with experience of osteoarthritis research studies inthe knee and therefore probably had greater specialist clin-ical experience of assessment than did our examiners. Sec-ond, the two studies did not test the same items; only 13dichotomous items were tested by Cibere et al. [13], in con-trast to 38 in our study, and not all items in their study wereincluded in ours. Third, the patients are likely to have hadmore severe knee problems, and thus more marked physicalsigns, than in our study, given that the inclusion criteria in-cluded a higher severity threshold and the patients all hadconfirmed radiographic signs of osteoarthritis (Kellgren–Lawrence grade 2 or above). Finally, Cibere et al. [13] re-ported the prevalence-adjusted, bias-adjusted k (PABAK).This statistic adjusts the obtained value of k for both prev-alence and bias, and thus obviates the tendency of a highpositive or negative prevalence index to reduce the magni-tude of k (see Appendix). Hoehler [26], however, arguesthat the PABAK serves to inflate k inappropriately in the
presence of a prevalence effect, and Vach [27] maintainsthat the very nature of k is that identical agreement ratesare judged differently in the light of the marginal preva-lences, which determine the amount of chance agreement.Further, by adjusting the marginal frequencies, PABAKdoes not reflect the observed diagnostic behavior of the ex-aminers [28]. We therefore did not use PABAK for the pri-mary analysis of our data. It can be noted, however, that forthe interobserver agreement on dichotomous items in ourstudy the median PABAK would be 0.45 (IQR 5 0.35,0.63), twice that of the median unadjusted k; hence, theuse of PABAK by Cibere et al. [13] may well explain someof the difference between their estimates and ours.
The findings in the present study relating to dichotomousand ordinal examination items are in contrast to those fromthe linked study of the reliability of subjective examination[14]. For these items, the median interobserver k was 0.71(IQR 5 0.54–0.83) and median intraobserver k was 0.59(IQR 5 0.45–0.76); for 23 items, k was O0.60 for bothinter- and intraobserver agreement. Although a less extrememedian prevalence of negative findings may partly accountfor the higher k-values in the Peat et al. [14] study, it none-theless appears that it is easier to achieve agreement on sub-jective than on objective examination items.
A number of issues should be considered when interpret-ing the generally low reliability found for dichotomous andordinal examination items in this study. As we have alreadynoted, a high prevalence index (either positive or negative)tends to depress the magnitude of k, despite high percent-age total agreement. The proportion of positive findingsat the first visit differed significantly across the three raterson 12 of the individual dichotomous items. This suggeststhat, for these variables at least, the observers did not havethe same propensity to rate a sign as present, which wouldpotentially reduce the scope for agreement.
In addition, although the mean percentage of positivefindings on dichotomous items did not differ between firstand second observers at the first visit, for some variablesthere may have been systematic changes between measure-ments by the two observers. For example, it is possible thatthe first examination may have created a lower threshold foreliciting pain in the second examination. Furthermore, inthe intraobserver agreement study, despite no significantchange on average in the percentage of positive findings,as already noted most participants responded ‘‘better’’ or‘‘worse’’ to the transition question, suggesting that the un-derlying clinical status of their knee or knees may havechanged. That is, although there was no overall systematicchange in the percentage of positive findings in the dichot-omous items, there may have been changes in individualpatients’ clinical statusdin the direction of both improve-ment and deteriorationdwhich may have affected intraob-server agreement. For the 15 individual dichotomous itemswhere total agreement was !80% and k ! 0.61 in the in-trarater analysis, true change in the underlying clinical vari-able over the 1-month interval was a plausible explanation

519L. Wood et al. / Journal of Clinical Epidemiology 59 (2006) 512–520
for 11 items (73%); the four items for which such changewas not considered a plausible explanation were valgusfoot, lateral bony enlargement, laxity on valgus stress,and palpation for crepitus. Thus, the fluctuating nature ofmany clinical features of knee pain suggests that high levelsof intraobserver agreement should not be expected for thesevariables. Hence, for both the interobserver and the intraob-server analyses, there may be some underestimation ofagreement for the items concerned.
Additionally, although detailed assessment protocolswere used, these are inevitably subject to interpretationby individual examiners. Indeed, slight differences in theway in which individual examiners had interpreted and ad-hered to the protocols emerged in discussions at the end ofthe study. It should also be noted that the total time takenfor the subjective and objective examination to be con-ducted by the two observers was |1.5 hours. This may haveintroduced some error through patient or examiner fatigueor loss of concentration. Finally, the nature of professionaltraining in different disciplines and the degree of subse-quent clinical experience may be a reason for differentlevels of reliability between this study and others.
The small number of statistically significant k-values forinterobserver agreement on dichotomous examination vari-ables may suggest that a larger sample should be employed.Additionally, most analyses were based on fewer than theavailable number of patients, because it was not possiblein these instances to obtain two ratings from every patient.At the 99% one-sided confidence level used in the analysisof individual dichotomous items, the range of achievedsample sizes (from n 5 33 to n 5 57) provided between49% and 76% power to detect a ‘‘fair’’ k of >0.40 as sta-tistically significant [29].
These findings suggest that there is scope to improveexaminer agreement, perhaps through further training;however, the training and standardization in this study areprobably superior to those experienced in everyday clinicalcontexts, and the practicality of higher levels of training isdebatable. Researchers should consider carefully the reten-tion in a standardized physical examination of those itemsthat manifest low levels of agreement and are not crucialto diagnosis or clinical decision-making. The low preva-lence of signs in this clinical population argues furtherfor a selective approach to the inclusion of items in a stan-dardized examination.
Acknowledgments
This work was funded by the Medical Research Counciland HNHS R&D funding to Staffordshire Moorlands Pri-mary Care Research Consortium. The authors wish to thankthe staff and patients of the clinical centers involved in thiswork, the administrative and health informatics staff atPCSRC involved in this work, and Peter Croft for adviceon the manuscript.
Appendix
k 5observed agreement 2 chance agreement
1 2 chance agreement
The cells in a two-by-two contingency table for agree-ment between two raters are defined in Table A1.
The prevalence estimate for observer one is f1/n, and forobserver two is g1/n. Overall percentage agreement is givenby [(a 1 d )/n] 3 100.
Specific positive percentage agreement ( ppos) is givenby [2a/(2a 1 b 1 c)] 3 100, and specific negative percent-age agreement ( pneg) is given by [2d/(2d 1 b 1 c)] 3 100.
The prevalence-adjusted, bias-adjusted k (PABAK) iscalculated by replacing the values in each of cells a andd by (a 1 d )/2, and the values in each of cells b and cby (b 1 c)/2.
Table A1
Two-by-two contingency table for agreement between two raters
Observer 1
Present Absent Total
Observer 2
Present a b g1
Absent c d g2
Total f1 f2 n
References
[1] Peat G, McCarney R, Croft P. Knee pain and osteoarthritis in older
adults: a review of community burden and current use of primary
health care. Ann Rheum Dis 2001;60:91–7.
[2] Mamlin LA, Melfi CA, Parchman ML, Gutierrez B, Allen DI,
Katz BP, Dittus RS, Heck DA, Freund DA. Management of osteoar-
thritis of the knee by primary care physicians. Arch Fam Med 1998;7:
563–7.
[3] Cushnaghan J, Cooper C, Dieppe P, Kirwan J, McAlindon T,
McCrae F. Clinical assessment of osteoarthritis of the knee. Ann
Rheum Dis 1990;49:768–70.
[4] Hart DJ, Spector TD, Brown P. Clinical signs of early osteoarthritis:
reproducibility and relationship to x-ray changes in 541 women in the
general population. Ann Rheum Dis 1991;50:467–70.
[5] Watkins MA, Riddle DL, Lamb RL, Personius WJ. Reliability of go-
niometric measurements and visual estimates of knee range of motion
obtained in a clinical setting. Phys Ther 1991;71:90–6.
[6] Jones A, Hopkinson N, Patrick M, Berman P, Doherty M. Evaluation
of a method for clinically assessing osteoarthritis of the knee. Ann
Rheum Dis 1992;51:243–5.
[7] Bellamy N, Carette S, Ford PM, Kean WF, le Riche NG, Lussier A,
Wells GA, Campbell J. Osteoarthritis antirheumatic drug trials. 1.
Effects of standardization procedures on observer dependent outcome
measures. J Rheumatol 1992;19:436–43.
[8] Fritz JM, Delitto A, Erhard RE, Roman M. An examination of the
selective tissue tension scheme, with evidence for the concept of
a capsular pattern of the knee. Phys Ther 1998;78:1046–56.
[9] Bellamy N, Klestov A, Muirden K, Kuhnert P, Do KA, O’Gorman L,
Martin N. Perceptual variation in categorizing individuals according
to American College of Rheumatology classification criteria for
hand, knee, and hip osteoarthritis (OA): observations based on an
Australian Twin Registry study of OA. J Rheumatol 1999;26:2654–8.
520 L. Wood et al. / Journal of Clinical Epidemiology 59 (2006) 512–520
[10] Jensen LK, Mikkelsen S, Loft IP, Eenberg W. Work-related knee
disorders in floor layers and carpenters. J Occup Environ Med
2000;42:835–42.
[11] Petersen CM, Hayes KW. Construct validity of Cyriax’s selective
tension examination: association of end-feels with pain at the knee
and shoulder. J Orthop Sports Phys Ther 2000;30:512–21.
[12] Liow RY, Walker K, Wajid MA, Bedi G, Lennox CM. The reliability of
the American Knee Society Score. Acta Orthop Scand 2000;71:603–8.
[13] Cibere J, Bellamy N, Thorne A, Esdaile JM, McGorm KJ,
Chalmers A, Huang S, Peloso P, Shojania K, Singer J, Wong H,
Kopec J. Reliability of the knee examination in osteoarthritis: effect
of standardization. Arthritis Rheum 2004;50:458–68.
[14] Peat G, Wood L, Wilkie R, Thomas E. How reliable is structured
clinical history-taking in older adults with knee problems? Inter-
and intra-observer variability of the KNE-SCI. J Clin Epidemiol
2003;56:1030–7.
[15] Bellamy N. WOMAC Osteoarthritis Index: a user’s guide. London,
Ontario. London Health Services Centre: McMaster University;
1996.
[16] Altman R, Asch E, Bloch D, Bole G, Borenstein D, Brandt K,
Christy W, Cooke TD, Greenwald R, Hochberg M, Howell D,
Kaplan D, Koopman W, Longley S III, Makin H, McShane DJ,
Medsger T Jr, Meenan R, Mikkelsen W, Moskowitz R, Murphy W,
Rothschild B, Segal M, Sokoloff L, Wolfe F. Diagnostic and Thera-
peutic Criteria Committee of the American Rheumatism Association.
Development of criteria for the classification and reporting of osteo-
arthritis: classification of osteoarthritis of the knee. Arthritis Rheum
1986;29:1039–49.
[17] Cohen J. A coefficient of agreement for nominal scales. Educ Psychol
Meas 1960;20:37–46.
[18] Feinstein AR, Cicchetti DV. High agreement but low kappa: I. The
problems of two paradoxes. J Clin Epidemiol 1990;43:543–9.
[19] Fleiss JL, Levin B, Paik MC. Statistical methods for rates and propor-
tions. 3rd ed. Hoboken, NJ: Wiley-Interscience; 2003.
[20] Cicchetti DV, Feinstein AR. High agreement but low kappa: II.
Resolving the paradoxes. J Clin Epidemiol 1990;43:551–8.
[21] Cohen J. Weighted kappa: nominal scale agreement with provision
for scaled disagreement or partial credit. Psychol Bull 1968;70:
213–20.
[22] Shrout PE, Fleiss JL. Intraclass correlations: use in assessing rater re-
liability. Psychol Bull 1979;86:420–8.
[23] Dunn G. Design and analysis of reliability studies: the statistical eval-
uation of measurement errors. London: Edward Arnold; 1989.
[24] Zelman DC, Hoffman DL, Seifeldin R, Dukes EM. Development of
a metric for a day of manageable pain control: derivation of pain
severity cut-points for low back pain and osteoarthritis. Pain 2003;
106:35–42.
[25] Shrout PE. Measurement reliability and agreement in psychiatry. Stat
Methods Med Res 1998;7:301–17.
[26] Hoehler FK. Bias and prevalence effects on kappa viewed in terms of
sensitivity and specificity. J Clin Epidemiol 2000;53:499–503.
[27] Vach W. The dependence of Cohen’s kappa on the prevalence does
not matter. J Clin Epidemiol 2005;58:655–61.
[28] Sim J, Wright CC. The kappa statistic in reliability studies: use,
interpretation and sample size requirements. Phys Ther 2005;85:
257–68.
[29] Donner A, Eliasziw M. A goodness-of-fit approach to inference pro-
cedures for the kappa statistic: confidence interval construction,
significance-testing and sample size estimation. Stat Med 1992;11:
1511–9.