A STUDY OF THE DIVERSE T DWARF POPULATION REVEALED BY …
49
The Astrophysical Journal Supplement Series, 205:6 (49pp), 2013 March doi:10.1088/0067-0049/205/1/6 C 2013. The American Astronomical Society. All rights reserved. Printed in the U.S.A. A STUDY OF THE DIVERSE T DWARF POPULATION REVEALED BY WISE Gregory N. Mace 1 ,2 , J. Davy Kirkpatrick 2 , Michael C. Cushing 3 , Christopher R. Gelino 2 , Roger L. Griffith 2 , Michael F. Skrutskie 4 , Kenneth A. Marsh 5 , Edward L. Wright 1 , Peter R. Eisenhardt 6 , Ian S. McLean 1 , Maggie A. Thompson 7 , Katholeen Mix 2 , Vanessa Bailey 8 , Charles A. Beichman 2 , Joshua S. Bloom 9 , Adam J. Burgasser 10 ,11 , Jonathan J. Fortney 12 , Philip M. Hinz 8 , Russell P. Knox 8 , Patrick J. Lowrance 2 , Mark S. Marley 13 , Caroline V. Morley 12 , Timothy J. Rodigas 8 , Didier Saumon 14 , Scott S. Sheppard 15 , and Nathan D. Stock 8 1 Department of Physics and Astronomy, UCLA, 430 Portola Plaza, Box 951547, Los Angeles, CA 90095-1547, USA; [email protected] 2 Infrared Processing and Analysis Center, MS 100-22, California Institute of Technology, Pasadena, CA 91125, USA 3 Department of Physics and Astronomy, MS 111, University of Toledo, 2801 W. Bancroft St., Toledo, OH 43606-3328, USA 4 Department of Astronomy, University of Virginia, Charlottesville, VA 22904, USA 5 School of Physics and Astronomy, Cardiff University, Cardiff CF24 3AA, UK 6 NASA Jet Propulsion Laboratory, 4800 Oak Grove Drive, Pasadena, CA 91109, USA 7 Department of Astrophysical Sciences, Princeton University, Peyton Hall, 4 Ivy Lane, Princeton, NJ 08544-1001, USA 8 Steward Observatory, The University of Arizona, 933 N. Cherry Ave., Tucson, AZ 85721, USA 9 Department of Astronomy, University of California, Berkeley, CA 94720, USA 10 Department of Physics, University of California, San Diego, CA 92093, USA 11 Department of Physics, Massachusetts Institute of Technology, 77 Massachusetts Ave., Cambridge, MA 02139, USA 12 Department of Astronomy and Astrophysics, University of California, Santa Cruz, CA 95064, USA 13 NASA Ames Research Center, Moffett Field, CA 94035, USA 14 Los Alamos National Laboratory, Los Alamos, NM 87545, USA 15 Department of Terrestrial Magnetism, Carnegie Institution of Washington, 5241 Broad Branch Rd. NW, Washington, DC 20015, USA Received 2012 November 14; accepted 2013 January 15; published 2013 February 25 ABSTRACT We report the discovery of 87 new T dwarfs uncovered with the Wide-field Infrared Survey Explorer (WISE) and 3 brown dwarfs with extremely red near-infrared colors that exhibit characteristics of both L and T dwarfs. Two of the new T dwarfs are likely binaries with L7 ± 1 primaries and mid-type T secondaries. In addition, our follow-up program has confirmed 10 previously identified T dwarfs and 4 photometrically selected L and T dwarf candidates in the literature. This sample, along with the previous WISE discoveries, triples the number of known brown dwarfs with spectral types later than T5. Using the WISE All-Sky Source Catalog we present updated color–color and color-type diagrams for all the WISE-discovered T and Y dwarfs. Near-infrared spectra of the new discoveries are presented along with spectral classifications. To accommodate later T dwarfs we have modified the integrated flux method of determining spectral indices to instead use the median flux. Furthermore, a newly defined J-narrow index differentiates the early-type Y dwarfs from late-type T dwarfs based on the J-band continuum slope. The K/J indices for this expanded sample show that 32% of late-type T dwarfs have suppressed K-band flux and are blue relative to the spectral standards, while only 11% are redder than the standards. Comparison of the Y/J and K/J index to models suggests diverse atmospheric conditions and supports the possible re-emergence of clouds after the L/T transition. We also discuss peculiar brown dwarfs and candidates that were found not to be substellar, including two young stellar objects and two active galactic nuclei. The substantial increase in the number of known late-type T dwarfs provides a population that will be used to test models of cold atmospheres and star formation. The coolest WISE-discovered brown dwarfs are the closest of their type and will remain the only sample of their kind for many years to come. Key words: binaries: general – brown dwarfs – galaxies: active – infrared: stars – stars: low-mass Online-only material: color figures 1. INTRODUCTION Brown dwarfs were initially theorized nearly 50 years ago as the lowest mass products of star formation (Kumar 1963; Hayashi & Nakano 1963). Without the energy provided by hydrogen burning, brown dwarfs cool as they age and tran- sition to later spectral types (e.g., Burgasser 2004, Figure 2). As a result, older field brown dwarfs can have higher masses than young brown dwarfs, even though they have the same effective temperature and spectral type (Baraffe et al. 2003; Burrows et al. 1997). Brown dwarfs are classified by their spec- tral morphology, which is primarily related to effective tem- perature, but is also modulated by metallicity, clouds, gravity, and binarity. The cooling process results in a dearth of field L dwarfs and a surplus of T dwarfs relative to the initial mass function (Burgasser 2004). Since Gl 229B was discovered in 1995 (Nakajima et al. 1995), the T dwarf sample has increased in spurts thanks primarily to the Two Micron All Sky Survey (2MASS; Skrutskie et al. 2006), the Sloan Digital Sky Survey (SDSS; York et al. 2000), the United Kingdom Infrared Telescope Infrared Deep Sky Survey (UKIDSS; Lawrence et al. 2007), and the Canada–France–Hawaii Telescope Legacy Survey (CFHTLS; Delorme et al. 2008b). T dwarfs are classified by increased methane, water, and molecular hydrogen collision- induced absorption (CIA) in the near-infrared (Burgasser et al. 2002, 2006b; Geballe et al. 2002), and have inferred tempera- tures between ∼500 and ∼1300 K (Cushing et al. 2008, 2011; Stephens et al. 2009). 1
Transcript of A STUDY OF THE DIVERSE T DWARF POPULATION REVEALED BY …

The Astrophysical Journal Supplement Series, 205:6 (49pp), 2013 March doi:10.1088/0067-0049/205/1/6C© 2013. The American Astronomical Society. All rights reserved. Printed in the U.S.A.
A STUDY OF THE DIVERSE T DWARF POPULATION REVEALED BY WISE
Gregory N. Mace1,2, J. Davy Kirkpatrick2, Michael C. Cushing3, Christopher R. Gelino2, Roger L. Griffith2,Michael F. Skrutskie4, Kenneth A. Marsh5, Edward L. Wright1, Peter R. Eisenhardt6, Ian S. McLean1,
Maggie A. Thompson7, Katholeen Mix2, Vanessa Bailey8, Charles A. Beichman2,Joshua S. Bloom9, Adam J. Burgasser10,11, Jonathan J. Fortney12, Philip M. Hinz8,
Russell P. Knox8, Patrick J. Lowrance2, Mark S. Marley13, Caroline V. Morley12,Timothy J. Rodigas8, Didier Saumon14, Scott S. Sheppard15, and Nathan D. Stock8
1 Department of Physics and Astronomy, UCLA, 430 Portola Plaza, Box 951547, Los Angeles, CA 90095-1547, USA; [email protected] Infrared Processing and Analysis Center, MS 100-22, California Institute of Technology, Pasadena, CA 91125, USA
3 Department of Physics and Astronomy, MS 111, University of Toledo, 2801 W. Bancroft St., Toledo, OH 43606-3328, USA4 Department of Astronomy, University of Virginia, Charlottesville, VA 22904, USA
5 School of Physics and Astronomy, Cardiff University, Cardiff CF24 3AA, UK6 NASA Jet Propulsion Laboratory, 4800 Oak Grove Drive, Pasadena, CA 91109, USA
7 Department of Astrophysical Sciences, Princeton University, Peyton Hall, 4 Ivy Lane, Princeton, NJ 08544-1001, USA8 Steward Observatory, The University of Arizona, 933 N. Cherry Ave., Tucson, AZ 85721, USA
9 Department of Astronomy, University of California, Berkeley, CA 94720, USA10 Department of Physics, University of California, San Diego, CA 92093, USA
11 Department of Physics, Massachusetts Institute of Technology, 77 Massachusetts Ave., Cambridge, MA 02139, USA12 Department of Astronomy and Astrophysics, University of California, Santa Cruz, CA 95064, USA
13 NASA Ames Research Center, Moffett Field, CA 94035, USA14 Los Alamos National Laboratory, Los Alamos, NM 87545, USA
15 Department of Terrestrial Magnetism, Carnegie Institution of Washington, 5241 Broad Branch Rd. NW, Washington, DC 20015, USAReceived 2012 November 14; accepted 2013 January 15; published 2013 February 25
ABSTRACT
We report the discovery of 87 new T dwarfs uncovered with the Wide-field Infrared Survey Explorer (WISE) and3 brown dwarfs with extremely red near-infrared colors that exhibit characteristics of both L and T dwarfs. Two ofthe new T dwarfs are likely binaries with L7 ± 1 primaries and mid-type T secondaries. In addition, our follow-upprogram has confirmed 10 previously identified T dwarfs and 4 photometrically selected L and T dwarf candidatesin the literature. This sample, along with the previous WISE discoveries, triples the number of known brown dwarfswith spectral types later than T5. Using the WISE All-Sky Source Catalog we present updated color–color andcolor-type diagrams for all the WISE-discovered T and Y dwarfs. Near-infrared spectra of the new discoveriesare presented along with spectral classifications. To accommodate later T dwarfs we have modified the integratedflux method of determining spectral indices to instead use the median flux. Furthermore, a newly defined J-narrowindex differentiates the early-type Y dwarfs from late-type T dwarfs based on the J-band continuum slope. TheK/J indices for this expanded sample show that 32% of late-type T dwarfs have suppressed K-band flux and areblue relative to the spectral standards, while only 11% are redder than the standards. Comparison of the Y/J andK/J index to models suggests diverse atmospheric conditions and supports the possible re-emergence of cloudsafter the L/T transition. We also discuss peculiar brown dwarfs and candidates that were found not to be substellar,including two young stellar objects and two active galactic nuclei. The substantial increase in the number of knownlate-type T dwarfs provides a population that will be used to test models of cold atmospheres and star formation.The coolest WISE-discovered brown dwarfs are the closest of their type and will remain the only sample of theirkind for many years to come.
Key words: binaries: general – brown dwarfs – galaxies: active – infrared: stars – stars: low-mass
Online-only material: color figures
1. INTRODUCTION
Brown dwarfs were initially theorized nearly 50 years agoas the lowest mass products of star formation (Kumar 1963;Hayashi & Nakano 1963). Without the energy provided byhydrogen burning, brown dwarfs cool as they age and tran-sition to later spectral types (e.g., Burgasser 2004, Figure 2).As a result, older field brown dwarfs can have higher massesthan young brown dwarfs, even though they have the sameeffective temperature and spectral type (Baraffe et al. 2003;Burrows et al. 1997). Brown dwarfs are classified by their spec-tral morphology, which is primarily related to effective tem-perature, but is also modulated by metallicity, clouds, gravity,and binarity. The cooling process results in a dearth of field L
dwarfs and a surplus of T dwarfs relative to the initial massfunction (Burgasser 2004). Since Gl 229B was discovered in1995 (Nakajima et al. 1995), the T dwarf sample has increasedin spurts thanks primarily to the Two Micron All Sky Survey(2MASS; Skrutskie et al. 2006), the Sloan Digital Sky Survey(SDSS; York et al. 2000), the United Kingdom InfraredTelescope Infrared Deep Sky Survey (UKIDSS; Lawrenceet al. 2007), and the Canada–France–Hawaii Telescope LegacySurvey (CFHTLS; Delorme et al. 2008b). T dwarfs are classifiedby increased methane, water, and molecular hydrogen collision-induced absorption (CIA) in the near-infrared (Burgasser et al.2002, 2006b; Geballe et al. 2002), and have inferred tempera-tures between ∼500 and ∼1300 K (Cushing et al. 2008, 2011;Stephens et al. 2009).
1

The Astrophysical Journal Supplement Series, 205:6 (49pp), 2013 March Mace et al.
The cool brown dwarfs discovered by the Wide-field InfraredSurvey Explorer (WISE; Wright et al. 2010) will provide themost robust tests of cool atmospheric models. Recent analy-sis of the T9 spectral standard UGPS J072227.51−054031.2(Bochanski et al. 2011; Leggett et al. 2012; Lucas et al. 2010),and the Y dwarfs presented by Cushing et al. (2011), highlightsthe shortcomings of current models to match the low-flux near-infrared spectra of the coolest known objects. One promisingavenue is the recent work of Morley et al. (2012) to include sul-fide clouds in modeling the coolest brown dwarf atmospheres.
Tight constraints on the field mass function can be imposedby a complete census of the low-mass component of the solarneighborhood, of which the local T-dwarf component is a vitalpart. Our knowledge of the functional form of the mass functionhas a compounding influence on models of galaxy, star, andplanet formation processes. Also, knowledge of the low-masscomponent of the solar neighborhood can be used to determinethe minimum mass for star formation (Burgasser 2004; Allenet al. 2005). To approach a complete volume-limited census,we have chosen brown dwarf candidates from the WISE All-Sky Source Catalog by imposing methane sensitive color con-straints. Employing various near-infrared spectrographs, whichprovide diverse resolution and wavelength coverage, we haveproduced accurate classifications for these candidates throughcomparison to spectroscopic standards. Astrometric monitoringof the coolest objects provides trigonometric parallax measure-ments, as discussed by Marsh et al. (2013) and Beichman et al.(2013). Kirkpatrick et al. (2012) use this information to deter-mine absolute magnitude relationships and constrain the massfunction.
In this paper we present the spectra of 100 T dwarfs, including90 newly reported sources, which comprise approximately one-third of the present sample. Combined with the 89 T dwarfsreported by Kirkpatrick et al. (2011), WISE has more thantripled the number of brown dwarfs with spectral types later thanT5. In Section 2 we discuss our photometric selection criteriaand present WISE All-Sky photometry for all the objects inKirkpatrick et al. (2011) and the new brown dwarfs presentedhere. In Section 3 we present our follow-up photometry andspectroscopy for the new T dwarfs and a few objects in theliterature. Spectral classification, indices, and further analysisare presented in Section 4, along with comments on noteworthyobjects. In Section 5 we present a dedicated discussion on the re-emergence of clouds in late-type T dwarfs. Interlopers, whichmimic brown dwarfs in WISE color space, are discussed inSection 6. Our results are summarized in Section 7. In theAppendix we discuss our motivation for redefining spectralindices as the median flux over a wavelength range rather thanthe integrated flux.
2. CANDIDATE SELECTION
The WISE All-Sky Data Release (Cutri et al. 2012) is theculmination of a two-pass all-sky survey at 3.4, 4.6, 12, and22 μm, hereafter referred to as bands W1, W2, W3, and W4,respectively (Wright et al. 2010). Designed as a variant of themethane imaging technique (Tinney et al. 2005), the W1 − W2color compares the flux from the deep 3.3 μm CH4 absorptionband to the bright 4.6 μm flux in T and Y dwarfs (Mainzeret al. 2011). Cooler T and Y dwarf atmospheres possess redderW1 − W2 colors than M and L dwarfs. In W3 and W4, past theblackbody peak for the coolest T dwarf, the flux decreases andis further reduced by NH3 absorption (Saumon et al. 2003;Burrows et al. 2003). Objects with W2 − W3 � 4.0 can
be disregarded as brown dwarf candidates, and only 2 of 13candidates with W2 − W3 > 3.0 are T dwarfs (see Section 6).
Initial candidate selection, as described by Kirkpatricket al. (2011), was made using the WISE Preliminary DataRelease.16 Our search required W1 − W2 colors (or limits)greater than 1.5 mag, which corresponds roughly to types �T5,and W2 − W3 < 3.0 mag, which reduces the number of veryred extragalactic contaminants and sources embedded in starformation regions. To identify brown dwarfs earlier than T5 wesearched for objects with W1 − W2 > 0.4 mag and no associ-ation with a 2MASS source (implying that the J − W2 coloris either very red or the object has moved). Extragalactic con-taminants were culled from the bright source candidates usingthe following criteria: W1 − W2 > 0.96(W2 − W3) − 0.96(as shown in Figure 3 of Kirkpatrick et al. 2011). Spectroscopicfollow-up of our initial candidates confirmed ∼100 new browndwarfs. Kirkpatrick et al. (2011) provide photometry from theWISE Preliminary Data Release for these new objects and theobjects in Mainzer et al. (2011) and Burgasser et al. (2011).
Making use of the WISE All-Sky Data Release,17 specificallythe database of extractions from the atlas images which is a unionof the WISE All-Sky Source Catalog and the WISE All-Sky Re-ject Table, we modified our selection criteria to identify the red-dest candidates. The details of our query method can be foundin Kirkpatrick et al. (2012). Briefly, we required W1 − W2 >2.0 mag, W2 − W3 < 3.5 mag, signal-to-noise ratio(S/N) > 3 per frame at W2, that the source is not blended withanother source in visual inspection, that the source is point-like,and that the absolute Galactic latitude be greater than 3◦ if itsGalactic longitude falls within 20◦ of the Galactic center. Toaid in follow-up, finder charts of a 2′ × 2′ field around eachcandidate were constructed using DSS2 BRI (epoch ∼1980s),SDSS ugriz (where available; epoch ∼2000), 2MASS JHKs(epoch ∼2000), and WISE four-band data (epoch ∼2010). Pri-oritization was accomplished by visually inspecting each ofthese finder charts.18 T dwarf candidates that were detected atvisual wavelengths and showed no clear proper motion wereexcluded from further follow-up.
Comparison of the WISE photometry in the Preliminary DataRelease and the All-Sky Data Release reveals measurementsbiases of ∼0.3, 0.05, and 0.4 mag in W1, W2, and W3, re-spectively. This is a known difference in the catalogs andis further discussed in Section 6.3 of the WISE ExplanatorySupplement.19 The Pass-2 source extraction, which producedthe All-Sky Source Catalog, implemented a number of improve-ments listed in Section 4.1 of the Explanatory Supplement. Be-cause the WISE All-Sky Data Release is the premier data prod-uct from the WISE mission, we present this new photometry inTable 1 for the brown dwarfs in Kirkpatrick et al. (2011) andin Table 2 present photometry for our newly confirmed browndwarfs.
Figures 1 and 2 present the updated W1 −W2 and W2 −W3colors as a function of spectral type for objects in Tables 1and 2 and for Y dwarfs from Kirkpatrick et al. (2012). Similarplots were included in Kirkpatrick et al. (2011) for M, L, T,and Y dwarfs, but here we focus on the T dwarf sequence. Thegradual onset of methane absorption at 3.3 μm (Noll et al. 2000)
16 See http://wise2.ipac.caltech.edu/docs/release/prelim/expsup/.17 See http://wise2.ipac.caltech.edu/docs/release/allsky/.18 In lieu of creating ∼90 additional figures for the finder charts of the newobjects, we point the readers to the excellent DSS+SDSS+2MASS+WISEFinder Chart Service at IRSA (http://irsa.ipac.caltech.edu/).19 See http://wise2.ipac.caltech.edu/docs/release/allsky/expsup/.
2

The Astrophysical Journal Supplement Series, 205:6 (49pp), 2013 March Mace et al.
Table 1Updated WISE All-Sky Photometry for Discoveries from Kirkpatrick et al. (2011)
Object Name NIR Sp. W1 W2 W3 W4 W1 − W2 W2 − W3Type (mag) (mag) (mag) (mag) (mag) (mag)
(1) (2) (3) (4) (5) (6) (7) (8)
WISE J000849.75−173922.9 T6 16.41 ± 0.09 14.56 ± 0.07 >12.15 >8.49 1.86 ± 0.12 <2.40WISE J003119.76−384036.1 L2 pec (blue) 12.40 ± 0.03 12.01 ± 0.02 11.56 ± 0.17 >8.76 0.39 ± 0.04 0.45 ± 0.17WISE J004928.48+044059.9 L9 13.45 ± 0.03 12.97 ± 0.03 12.01 ± 0.29 8.39 ± 0.27 0.48 ± 0.04 0.96 ± 0.29WISE J010637.07+151852.8 M8 pec 13.08 ± 0.03 12.73 ± 0.03 12.49 ± 0.37 >8.81 0.35 ± 0.04 0.24 ± 0.38WISE J012333.23+414203.8 T7 17.04 ± 0.11 15.03 ± 0.07 12.99 ± 0.45 >9.20 2.01 ± 0.14 2.03 ± 0.46WISE J013836.58−032221.2 T3 14.43 ± 0.03 13.40 ± 0.03 12.35 ± 0.35 >9.30 1.03 ± 0.05 1.05 ± 0.35WISE J014807.25−720258.7 T9.5 >18.94 14.69 ± 0.05 >12.86 >9.52 >4.25 <1.83WISE J015010.89+382724.1 T0 13.65 ± 0.03 12.98 ± 0.03 11.74 ± 0.19 >9.04 0.67 ± 0.04 1.24 ± 0.20WISE J020625.27+264023.6 L9 pec (red) 13.40 ± 0.03 12.82 ± 0.03 11.33 ± 0.22 >8.88 0.59 ± 0.04 1.49 ± 0.22WISE J022105.97+384203.2 T6.5 16.87 ± 0.15 14.70 ± 0.08 >12.69 >9.24 2.18 ± 0.17 <2.00WISE J022322.36−293257.2 T7/7.5 17.16 ± 0.12 14.02 ± 0.04 12.64 ± 0.32 >9.64 3.13 ± 0.13 1.39 ± 0.32WISE J022623.98−021142.8 T7 17.60 ± 0.19 14.59 ± 0.06 >12.86 >9.18 3.01 ± 0.20 <1.74WISE J025409.51+022358.6 T8 15.76 ± 0.05 12.74 ± 0.03 11.49 ± 0.14 >9.44 3.02 ± 0.06 1.25 ± 0.14WISE J030533.51+395434.6 T6 17.38 ± 0.24 14.69 ± 0.07 >12.64 >9.12 2.69 ± 0.25 <2.05WISE J030724.59+290447.4 T6.5 17.22 ± 0.21 14.99 ± 0.11 >12.39 >8.74 2.23 ± 0.24 <2.60WISE J031325.94+780744.3 T8.5 15.88 ± 0.06 13.19 ± 0.03 11.32 ± 0.12 9.00 ± 0.37 2.69 ± 0.07 1.87 ± 0.12WISE J032337.53−602554.5 T8.5 18.10 ± 0.32 14.50 ± 0.05 >12.73 >9.18 3.61 ± 0.33 <1.76WISE J033349.34−585618.1 T3 13.99 ± 0.03 13.25 ± 0.03 12.30 ± 0.21 >9.20 0.75 ± 0.04 0.95 ± 0.22WISE J041022.71+150248.4 Y0 >18.33 14.18 ± 0.06 >11.86 >8.90 >4.15 <2.32WISE J041054.48+141131.1 T6 17.02 ± 0.16 15.08 ± 0.10 >12.10 >9.01 1.95 ± 0.19 <2.98WISE J044853.28−193548.6 T5 pec 16.52 ± 0.09 14.30 ± 0.05 >12.49 >9.17 2.22 ± 0.10 <1.81WISE J045853.89+643452.5 T8.5 16.67 ± 0.11 13.03 ± 0.03 12.60 ± 0.41 >9.28 3.64 ± 0.12 0.43 ± 0.41WISE J050003.04−122343.2 T8 17.66 ± 0.24 13.94 ± 0.04 11.56 ± 0.15 8.99 ± 0.36 3.72 ± 0.25 2.38 ± 0.15WISE J051317.27+060814.7 T6.5 15.82 ± 0.07 13.86 ± 0.05 >12.40 >9.10 1.97 ± 0.08 <1.46WISE J052536.35+673952.6 T6 pec >17.98 15.04 ± 0.09 >12.81 >9.20 >2.94 <2.23WISE J052844.51−330823.9 T7 pec 17.73 ± 0.23 14.60 ± 0.06 12.27 ± 0.24 >9.33 3.13 ± 0.24 2.33 ± 0.25WISE J053957.00−103436.7 T5.5 17.28 ± 0.22 14.83 ± 0.08 >12.64 >8.95 2.46 ± 0.23 <2.18WISE J054231.26−162829.1 T6.5 16.39 ± 0.09 13.98 ± 0.05 >12.35 >8.78 2.41 ± 0.10 <1.63WISE J061135.13−041024.0 T0 13.57 ± 0.03 12.93 ± 0.03 >12.06 >9.08 0.63 ± 0.04 <0.88WISE J061208.69−492024.2 T3.5 15.41 ± 0.03 14.11 ± 0.03 12.81 ± 0.27 >9.78 1.30 ± 0.05 1.30 ± 0.27WISE J061213.85−303612.5 T6 16.35 ± 0.07 14.03 ± 0.04 12.96 ± 0.45 >8.93 2.32 ± 0.08 1.07 ± 0.45WISE J061407.49+391235.9 T6 16.47 ± 0.12 13.65 ± 0.04 12.02 ± 0.28 >9.07 2.83 ± 0.12 1.63 ± 0.28WISE J062309.94−045624.6 T8 17.33 ± 0.20 13.82 ± 0.04 >12.63 >9.07 3.52 ± 0.20 <1.18WISE J062542.21+564625.4 T6 16.33 ± 0.08 14.38 ± 0.06 12.44 ± 0.35 >8.77 1.95 ± 0.10 1.94 ± 0.36WISE J062720.07−111428.0 T6 15.00 ± 0.04 13.26 ± 0.03 11.53 ± 0.21 >8.96 1.74 ± 0.05 1.73 ± 0.21WISE J065609.59+420531.9 T3 14.31 ± 0.03 13.22 ± 0.03 12.04 ± 0.30 >8.72 1.09 ± 0.05 1.18 ± 0.30WISE J074457.25+562821.0 T8 17.08 ± 0.15 14.49 ± 0.06 12.48 ± 0.36 >9.17 2.59 ± 0.16 2.01 ± 0.36WISE J075003.78+272545.4 T8.5 >18.11 14.46 ± 0.07 >12.69 >8.96 >3.65 <1.78WISE J075108.80−763449.5 T9 17.54 ± 0.13 14.52 ± 0.04 11.44 ± 0.08 >9.21 3.01 ± 0.14 3.08 ± 0.09WISE J075946.98−490454.0 T8 >17.92 13.86 ± 0.04 >12.95 >9.15 >4.05 <0.92WISE J081958.05−033528.5 T4 14.38 ± 0.03 13.08 ± 0.04 11.83 ± 0.28 >8.81 1.31 ± 0.05 1.25 ± 0.28WISE J082131.64+144319.2 T5.5 16.49 ± 0.12 14.37 ± 0.07 >12.58 >8.96 2.12 ± 0.14 <1.78WISE J083641.10−185947.0 T8 pec >18.41 15.18 ± 0.10 >12.47 >9.18 >3.23 <2.71WISE J085716.24+560407.6 T8 17.49 ± 0.21 14.11 ± 0.05 >12.49 >9.29 3.37 ± 0.22 <1.63WISE J090649.35+473538.5 T8 17.48 ± 0.23 14.65 ± 0.08 >12.06 >8.96 2.83 ± 0.24 <2.59WISE J092906.77+040957.9 T6.5 16.63 ± 0.12 14.23 ± 0.06 >11.91 >9.07 2.40 ± 0.13 <2.32WISE J095259.29+195508.1 T6 16.87 ± 0.16 14.34 ± 0.06 >12.18 >8.99 2.53 ± 0.17 <2.16WISE J101808.04−244557.9 T8 17.38 ± 0.21 14.17 ± 0.05 >12.55 >9.17 3.21 ± 0.22 <1.62WISE J101905.62+652954.2 T6 16.42 ± 0.07 14.03 ± 0.04 >12.40 >9.44 2.39 ± 0.08 <1.63WISE J104245.23−384238.3 T8.5 >18.57 14.52 ± 0.06 >12.95 >9.26 >4.06 <1.57WISE J112254.72+255022.2 T6 16.20 ± 0.08 13.97 ± 0.05 >12.39 >8.99 2.22 ± 0.10 <1.58WISE J115013.85+630241.5 T8 16.99 ± 0.11 13.40 ± 0.03 12.32 ± 0.24 >9.23 3.59 ± 0.11 1.08 ± 0.25WISE J121756.90+162640.8 T9 16.80 ± 0.13 13.09 ± 0.03 12.12 ± 0.31 >8.90 3.71 ± 0.14 0.97 ± 0.31WISE J131106.20+012254.3 T9: 18.27 ± 0.46 14.76 ± 0.09 >12.32 >9.25 3.50 ± 0.47 <2.45WISE J131141.92+362924.7 L5 pec (blue) 13.51 ± 0.03 13.11 ± 0.03 12.74 ± 0.44 >8.88 0.40 ± 0.04 0.38 ± 0.44WISE J132004.16+603426.3 T6.5 16.94 ± 0.11 14.41 ± 0.05 >12.42 >9.43 2.52 ± 0.12 <2.00WISE J132233.64−234016.8 T8 16.99 ± 0.14 13.93 ± 0.04 >12.70 8.78 ± 0.35 3.06 ± 0.14 <1.23WISE J134806.99+660328.4 L9 14.43 ± 0.03 13.76 ± 0.03 12.65 ± 0.29 >9.62 0.68 ± 0.04 1.11 ± 0.30WISE J140518.39+553421.3 Y0 (pec?) >18.82 14.10 ± 0.04 12.43 ± 0.27 >9.40 >4.72 1.67 ± 0.28WISE J143602.20−181421.9 T8 pec 17.21 ± 0.14 14.71 ± 0.06 >12.28 >9.23 2.50 ± 0.16 <2.43WISE J145715.03+581510.2 T7 16.83 ± 0.08 14.47 ± 0.04 13.34 ± 0.53 >9.64 2.36 ± 0.09 1.13 ± 0.53WISE J150649.97+702736.1 T6 13.39 ± 0.02 11.27 ± 0.02 10.15 ± 0.03 >9.07 2.12 ± 0.03 1.12 ± 0.04WISE J151906.63+700931.4 T8 17.17 ± 0.09 14.14 ± 0.03 13.44 ± 0.47 >9.86 3.03 ± 0.10 0.70 ± 0.47WISE J154151.65−225024.9 Y0.5 16.74 ± 0.17 14.25 ± 0.06 >12.31 >8.89 2.49 ± 0.18 <1.93
3

The Astrophysical Journal Supplement Series, 205:6 (49pp), 2013 March Mace et al.
Table 1(Continued)
Object Name NIR Sp. W1 W2 W3 W4 W1 − W2 W2 − W3Type (mag) (mag) (mag) (mag) (mag) (mag)
(1) (2) (3) (4) (5) (6) (7) (8)
WISE J161215.94−342028.5 T6.5 >18.19 13.96 ± 0.05 >12.47 >9.12 >4.23 <1.49WISE J161441.46+173935.5 T9 >17.90 14.25 ± 0.05 >12.45 >9.21 >3.65 <1.80WISE J161705.74+180714.1 T8 17.12 ± 0.15 14.16 ± 0.05 12.49 ± 0.36 >9.38 2.96 ± 0.16 1.67 ± 0.36WISE J162208.93−095934.4 T6 16.50 ± 0.14 14.17 ± 0.06 >12.55 >8.53 2.33 ± 0.15 <1.62WISE J162725.65+325524.6 T6 16.25 ± 0.07 13.60 ± 0.04 12.56 ± 0.35 >9.25 2.65 ± 0.08 1.04 ± 0.35WISE J164715.57+563208.3 L9 pec (red) 13.60 ± 0.02 13.09 ± 0.02 12.06 ± 0.09 >9.62 0.52 ± 0.03 1.03 ± 0.10WISE J165311.05+444422.8 T8 16.49 ± 0.07 13.81 ± 0.04 12.26 ± 0.23 >9.49 2.68 ± 0.08 1.55 ± 0.24WISE J171104.60+350036.8 T8 >18.15 14.72 ± 0.06 >12.76 >9.45 >3.43 <1.96WISE J171717.02+612859.3 T8 18.42 ± 0.20 15.09 ± 0.05 13.51 ± 0.38 >10.07 3.33 ± 0.20 1.58 ± 0.39WISE J172844.93+571642.7 T6 17.96 ± 0.18 15.01 ± 0.05 >13.49 >9.84 2.95 ± 0.19 <1.51WISE J173835.53+273259.0 Y0 >18.41 14.55 ± 0.06 11.93 ± 0.19 >8.98 >3.86 2.62 ± 0.20WISE J174124.25+255319.6 T9 15.38 ± 0.05 12.33 ± 0.03 10.83 ± 0.09 >8.60 3.05 ± 0.06 1.50 ± 0.09WISE J180435.37+311706.4 T9.5: >18.64 14.70 ± 0.06 >12.55 >9.42 >3.94 <2.15WISE J181210.85+272144.3 T8.5: 17.80 ± 0.29 14.23 ± 0.05 >12.26 >9.31 3.58 ± 0.29 <1.97WISE J182831.08+265037.7 �Y2 >18.47 14.39 ± 0.06 >12.53 >8.75 >4.08 <1.87WISE J183058.56+454257.4 L9 14.81 ± 0.03 14.17 ± 0.04 >13.17 >9.67 0.65 ± 0.05 <1.00WISE J184124.73+700038.0 T5 16.59 ± 0.05 14.39 ± 0.03 13.67 ± 0.47 >9.54 2.20 ± 0.06 0.71 ± 0.47WISE J185215.76+353716.7 T7 16.55 ± 0.10 14.24 ± 0.05 12.55 ± 0.32 >8.87 2.31 ± 0.11 1.69 ± 0.32WISE J190624.74+450807.1 T6 16.09 ± 0.06 13.82 ± 0.04 13.03 ± 0.43 >9.66 2.27 ± 0.07 0.79 ± 0.43WISE J195246.65+724000.8 T4 14.22 ± 0.03 13.02 ± 0.03 12.05 ± 0.14 >9.44 1.21 ± 0.04 0.96 ± 0.14WISE J195905.65−333833.5 T8 16.44 ± 0.10 13.88 ± 0.05 >12.14 >8.76 2.56 ± 0.11 <1.74WISE J201824.97−742327.5 T7 16.54 ± 0.11 13.62 ± 0.04 >12.52 >9.22 2.92 ± 0.11 <1.10WISE J205628.91+145953.2 Y0 >18.25 13.93 ± 0.05 12.00 ± 0.27 >8.78 >4.33 1.93 ± 0.27WISE J213456.73−713744.5 T9 pec >17.74 13.99 ± 0.05 12.33 ± 0.31 >9.02 >3.75 1.66 ± 0.32WISE J215751.35+265931.4 T7 17.13 ± 0.15 14.48 ± 0.06 >11.91 >8.58 2.65 ± 0.16 <2.57WISE J220922.11−273439.6 T7 16.50 ± 0.11 13.84 ± 0.05 >12.28 >9.12 2.66 ± 0.12 <1.56WISE J221354.68+091139.4 T7 16.69 ± 0.11 14.60 ± 0.07 >12.34 >9.04 2.10 ± 0.13 <2.26WISE J222623.05+044004.0 T8/8.5 17.29 ± 0.22 14.71 ± 0.09 >12.24 >9.08 2.58 ± 0.24 <2.47WISE J223729.52−061434.4 T5 >17.49 14.73 ± 0.09 >12.28 >8.85 >2.75 <2.45WISE J223937.55+161716.1 T3 14.67 ± 0.04 13.44 ± 0.03 12.14 ± 0.33 >8.92 1.23 ± 0.05 1.30 ± 0.33WISE J225540.75−311842.0 T8 16.92 ± 0.17 14.18 ± 0.06 >12.20 >9.09 2.74 ± 0.18 <1.98WISE J231336.38−803700.1 T8 16.30 ± 0.07 13.64 ± 0.03 12.40 ± 0.25 >9.58 2.65 ± 0.07 1.24 ± 0.25WISE J231939.14−184404.4 T7.5 17.15 ± 0.16 13.76 ± 0.05 >12.06 9.07 ± 0.51 3.39 ± 0.17 <1.70WISE J232519.53−410535.0 T9 pec 17.60 ± 0.25 14.13 ± 0.05 >12.49 >9.04 3.47 ± 0.25 <1.64WISE J232728.74−273056.6 L9 14.05 ± 0.03 13.18 ± 0.03 11.82 ± 0.22 >9.24 0.87 ± 0.05 1.36 ± 0.22WISE J234026.61−074508.1 T7 15.95 ± 0.08 13.58 ± 0.04 >12.37 >9.00 2.37 ± 0.09 <1.21WISE J234351.20−741846.9 T6 15.74 ± 0.05 13.73 ± 0.04 >12.43 >9.37 2.01 ± 0.06 <1.30WISE J234446.23+103415.6 T9 >18.03 15.11 ± 0.12 11.76 ± 0.25 >8.56 >2.92 3.35 ± 0.28WISE J234841.10−102844.1 T7 16.89 ± 0.15 14.40 ± 0.06 >12.56 >9.09 2.49 ± 0.16 <1.84WISE J235941.07−733504.8 T6.5 15.25 ± 0.04 13.32 ± 0.03 11.57 ± 0.13 >9.38 1.93 ± 0.05 1.75 ± 0.13
Notes. Scholz et al. (2011) independently discovered the T9 dwarf WISE J1741+2553, first announced in Gelino et al. (2011), and also noted WISE J0254+0223 as aproper motion object of presumably late type.
complicates the functional form of the W1 − W2 color aroundthe L-T transition. Although the dispersion in the W1 − W2color for the late-type T dwarfs is large (∼1.5 mag), early-typeT dwarfs display a considerably smaller dispersion until T4 orT5. Most objects later than T9 only have W2 and W3 detections,resulting in W1 − W2 lower limits. The gap between the limitsand the verified detections of the late-type sources implies thatthe W1 limit is an overestimate and the resultant W1−W2 colorlimits are artificially high. Upper limits in W2−W3 are a resultof non-detections in W3, which is the case for many of our newT dwarfs. The dispersion in the W1 −W2 and W2 −W3 colorsis likely caused by clouds and/or non-equilibrium chemistry inT dwarf atmospheres (Saumon et al. 2003), and are largest forspectral types later than T4.
3. FOLLOW-UP PHOTOMETRY AND SPECTROSCOPY
T dwarf candidates selected by WISE colors alone are reliablewhen they fall within the core of the T dwarf W1 − W2 versus
W2 − W3 color–color diagram in Figure 3. However, near theperiphery of this region the number of non-stellar interlopersincreases. Additional photometry of WISE candidates allows usto identify sources that have near-infrared colors characteristicof brown dwarfs, and provides near-IR magnitudes that guidefacility selection for spectroscopic observation.
3.1. Follow-up Photometric Observations
Most of our photometric observations are described inCushing et al. (2011) and Kirkpatrick et al. (2011, 2012).We have separated the 2MASS and Mauna Kea Observato-ries Near-Infrared (MKO; Simons & Tokunaga 2002; Toku-naga et al. 2002) systems since care should be taken whenmaking comparisons between the two filter systems whose dif-ferent bandpasses produce slightly different magnitudes. Someof our photometry is provided by the 2MASS All-Sky Point
4

The Astrophysical Journal Supplement Series, 205:6 (49pp), 2013 March Mace et al.
Table 2WISE All-Sky Photometry for Brown Dwarf Discoveries from This Paper
Object Name W1 W2 W3 W4 W1 − W2 W2 − W3(mag) (mag) (mag) (mag) (mag) (mag)
(1) (2) (3) (4) (5) (6) (7)
WISE J000517.48+373720.5 16.88 ± 0.12 13.27 ± 0.03 11.99 ± 0.24 >9.23 3.61 ± 0.12 1.28 ± 0.24WISE J003829.05+275852.1 18.04 ± 0.29 14.38 ± 0.05 12.46 ± 0.31 >8.78 3.67 ± 0.29 1.91 ± 0.32WISE J003830.54+840517.7 17.53 ± 0.17 15.34 ± 0.09 >13.18 >9.53 2.19 ± 0.19 <2.16WISE J004024.88+090054.8 16.06 ± 0.08 13.92 ± 0.07 >12.06 >8.65 2.13 ± 0.11 <1.87WISE J004542.56+361139.1 15.34 ± 0.04 13.73 ± 0.03 12.61 ± 0.35 >9.28 1.61 ± 0.05 1.12 ± 0.35WISE J004945.61+215120.0 15.47 ± 0.04 12.97 ± 0.03 11.73 ± 0.17 >9.21 2.50 ± 0.05 1.24 ± 0.17WISE J013525.64+171503.4 17.19 ± 0.15 14.74 ± 0.07 >12.73 >8.86 2.45 ± 0.17 <2.02WISE J021010.25+400829.6 16.29 ± 0.09 14.74 ± 0.08 >12.66 >9.17 1.55 ± 0.12 <2.08WISE J023318.05+303030.5 16.59 ± 0.12 14.46 ± 0.07 >12.25 >9.06 2.13 ± 0.14 <2.22WISE J024512.62−345047.8 17.92 ± 0.31 14.56 ± 0.06 12.19 ± 0.27 >9.20 3.36 ± 0.32 2.38 ± 0.27WISE J024714.52+372523.5 >18.37 14.70 ± 0.08 >12.58 >9.11 >3.67 <2.11WISE J025934.00−034645.7 17.33 ± 0.14 15.10 ± 0.08 >12.90 >9.46 2.23 ± 0.16 <2.20WISE J031614.68+382008.0 14.72 ± 0.04 13.56 ± 0.04 12.37 ± 0.39 >8.78 1.16 ± 0.06 1.19 ± 0.40WISE J031624.35+430709.1 >17.86 14.56 ± 0.07 >12.82 >9.18 >3.30 <1.74WISE J032120.91−734758.8 >19.19 15.60 ± 0.08 13.01 ± 0.32 >9.19 >3.59 2.59 ± 0.33WISE J032517.69−385454.1 18.46 ± 0.31 14.98 ± 0.06 13.22 ± 0.46 >9.66 3.47 ± 0.31 1.76 ± 0.46WISE J032547.72+083118.2 15.44 ± 0.06 13.49 ± 0.04 >11.66 >8.80 1.95 ± 0.07 <1.83WISE J033515.01+431045.1 >18.15 14.60 ± 0.08 >12.42 >8.95 >3.55 <2.18WISE J033605.05−014350.4 >17.96 14.54 ± 0.07 >12.56 >9.01 >3.42 <1.98WISE J033651.90+282628.8 16.01 ± 0.08 14.44 ± 0.07 >12.47 >8.93 1.57 ± 0.11 <1.97WISE J041358.14−475039.3 >19.39 15.69 ± 0.08 >13.14 >9.53 >3.70 <2.55WISE J042417.94+072744.1 >18.44 15.33 ± 0.13 >12.68 >9.02 >3.11 <2.65WISE J043052.92+463331.6 >18.08 14.40 ± 0.07 11.51 ± 0.18 >8.69 >3.69 2.88 ± 0.19WISE J051208.66−300404.4 >18.24 15.24 ± 0.10 12.53 ± 0.31 >9.48 >3.00 2.71 ± 0.32WISE J054047.00+483232.4 >18.25 15.07 ± 0.12 >12.09 >9.27 >3.18 <2.98WISE J054601.19−095947.5 15.94 ± 0.07 13.96 ± 0.05 >12.56 >9.05 1.97 ± 0.08 <1.40WISE J061437.73+095135.0 16.92 ± 0.19 14.29 ± 0.07 >12.04 8.90 ± 0.39 2.62 ± 0.20 <2.25WISE J062905.13+241804.9 14.36 ± 0.03 13.63 ± 0.04 11.83 ± 0.25 >8.99 0.74 ± 0.06 1.80 ± 0.25WISE J064205.58+410155.5 13.36 ± 0.03 12.55 ± 0.03 11.70 ± 0.31 >8.76 0.81 ± 0.04 0.85 ± 0.31WISE J070159.79+632129.2 14.20 ± 0.03 13.22 ± 0.03 12.48 ± 0.42 >9.08 0.98 ± 0.05 0.74 ± 0.42WISE J072312.44+340313.5 >18.27 14.73 ± 0.08 >12.21 >8.92 >3.54 <2.52WISE J073347.94+754439.2 17.16 ± 0.14 14.77 ± 0.07 12.20 ± 0.23 >9.04 2.39 ± 0.15 2.57 ± 0.24WISE J075430.95+790957.8 14.41 ± 0.03 13.73 ± 0.03 12.30 ± 0.26 >9.52 0.67 ± 0.05 1.43 ± 0.26WISE J081117.81−805141.3 17.29 ± 0.12 14.38 ± 0.04 11.85 ± 0.15 9.09 ± 0.30 2.91 ± 0.13 2.53 ± 0.15WISE J081220.04+402106.2 18.24 ± 0.47 15.08 ± 0.10 >12.76 >9.06 3.16 ± 0.48 <2.32WISE J092055.40+453856.3a 13.06 ± 0.02 12.39 ± 0.03 11.29 ± 0.17 >9.08 0.67 ± 0.04 1.10 ± 0.17WISE J095047.32+011733.3b 18.05 ± 0.34 14.48 ± 0.06 >12.85 >9.20 3.56 ± 0.34 <1.63WISE J102557.72+030755.7 17.89 ± 0.38 14.10 ± 0.06 >12.19 >8.81 3.79 ± 0.38 <1.90WISE J103907.73−160002.9 16.65 ± 0.11 14.16 ± 0.05 12.73 ± 0.52 >8.94 2.49 ± 0.12 1.43 ± 0.52WISE J105047.90+505606.2 18.05 ± 0.34 14.94 ± 0.08 >12.95 >9.02 3.11 ± 0.35 <1.99WISE J105130.01−213859.7 17.17 ± 0.17 14.54 ± 0.06 >12.69 >9.17 2.62 ± 0.18 <1.85WISE J112438.12−042149.7 16.56 ± 0.12 14.05 ± 0.05 >12.49 >8.58 2.51 ± 0.13 <1.56WISE J114340.22+443123.8 18.51 ± 0.39 15.27 ± 0.08 >13.00 >9.70 3.25 ± 0.39 <2.27WISE J122152.28−313600.8 15.86 ± 0.06 13.85 ± 0.04 12.35 ± 0.35 >9.14 2.01 ± 0.07 1.50 ± 0.35WISE J122558.86−101345.0 16.34 ± 0.09 13.99 ± 0.05 12.11 ± 0.30 >9.10 2.36 ± 0.10 1.88 ± 0.30WISE J124629.65−313934.2c 13.33 ± 0.02 12.38 ± 0.02 11.41 ± 0.12 >8.83 0.94 ± 0.03 0.98 ± 0.12WISE J125015.56+262846.9 16.36 ± 0.09 14.58 ± 0.07 >12.84 >9.06 1.78 ± 0.11 <1.74WISE J125715.90+400854.2 16.74 ± 0.10 14.47 ± 0.05 >12.40 >8.76 2.28 ± 0.11 <2.06WISE J130141.62−030212.9 18.06 ± 0.38 14.95 ± 0.09 >12.24 >8.88 3.11 ± 0.39 <2.72WISE J131833.98−175826.5 18.10 ± 0.34 14.75 ± 0.07 >12.43 >9.47 3.35 ± 0.34 <2.32WISE J133750.46+263648.6 16.31 ± 0.08 14.62 ± 0.06 >12.22 >9.03 1.69 ± 0.10 <2.39WISE J134802.49−134412.0d 16.15 ± 0.07 14.18 ± 0.05 >12.14 >9.14 1.97 ± 0.08 <2.03WISE J140035.40−385013.5 15.34 ± 0.04 13.75 ± 0.03 >12.78 >9.47 1.60 ± 0.05 <0.97WISE J142320.84+011638.0e 18.01 ± 0.30 14.85 ± 0.07 >12.66 >9.41 3.16 ± 0.30 <2.19WISE J144901.85+114710.9f 17.39 ± 0.16 14.84 ± 0.07 >12.40 >9.44 2.55 ± 0.17 <2.43WISE J150502.39−285345.5g 14.02 ± 0.03 13.30 ± 0.04 11.76 ± 0.26 >8.70 0.72 ± 0.05 1.53 ± 0.28WISE J151721.13+052929.3 >18.10 15.13 ± 0.08 >13.13 >9.52 >2.97 <2.01WISE J152305.10+312537.6 17.91 ± 0.21 14.39 ± 0.04 >13.32 >9.62 3.52 ± 0.22 <1.08WISE J154214.00+223005.2 >18.88 15.02 ± 0.06 >12.88 >9.51 >3.86 <2.15WISE J154352.78−043909.5h 16.11 ± 0.08 14.39 ± 0.06 >12.51 >8.42 1.72 ± 0.10 <1.89WISE J154459.27+584204.5 18.39 ± 0.30 15.03 ± 0.06 >13.42 >9.75 3.36 ± 0.31 <1.62WISE J162541.36+152811.1g 16.90 ± 0.13 14.72 ± 0.07 >12.50 >9.15 2.18 ± 0.15 <2.22WISE J162918.56+033535.6g 13.40 ± 0.03 12.50 ± 0.03 11.32 ± 0.14 >8.64 0.90 ± 0.04 1.18 ± 0.14WISE J163236.47+032927.3 15.90 ± 0.07 14.34 ± 0.06 >12.71 >9.11 1.56 ± 0.09 <1.63
5

The Astrophysical Journal Supplement Series, 205:6 (49pp), 2013 March Mace et al.
Table 2(Continued)
Object Name W1 W2 W3 W4 W1 − W2 W2 − W3(mag) (mag) (mag) (mag) (mag) (mag)
(1) (2) (3) (4) (5) (6) (7)
WISE J163645.56−074325.1 16.20 ± 0.12 14.69 ± 0.09 >12.40 >8.81 1.51 ± 0.14 <2.29WISE J170745.85−174452.5 16.54 ± 0.15 13.68 ± 0.05 >11.89 >8.87 2.85 ± 0.16 <1.79WISE J172134.46+111739.4 15.90 ± 0.06 14.28 ± 0.06 >12.27 >8.86 1.62 ± 0.09 <2.02WISE J173035.99+420742.5 15.11 ± 0.03 14.61 ± 0.05 >13.47 >9.50 0.51 ± 0.06 <1.13WISE J173421.02+502349.9 15.41 ± 0.03 14.34 ± 0.04 >13.48 >9.85 1.07 ± 0.05 <0.87WISE J173623.03+605920.2 >18.70 15.35 ± 0.07 13.29 ± 0.41 >9.85 >3.36 2.06 ± 0.42WISE J173859.27+614242.1 14.06 ± 0.03 13.34 ± 0.03 12.20 ± 0.15 >9.86 0.72 ± 0.04 1.14 ± 0.15WISE J174113.12+132711.9 17.50 ± 0.29 14.73 ± 0.08 >12.49 >8.67 2.77 ± 0.30 <2.24WISE J174303.71+421150.0 15.40 ± 0.04 13.92 ± 0.04 12.38 ± 0.25 >9.50 1.48 ± 0.05 1.54 ± 0.25WISE J174556.65+645933.8 >19.48 16.40 ± 0.09 >14.22 >10.54 >3.08 <2.18WISE J174640.78−033818.0 >18.02 14.79 ± 0.10 >12.17 >8.80 >3.23 <2.62WISE J175510.28+180320.2 14.60 ± 0.03 13.74 ± 0.04 12.36 ± 0.31 >9.28 0.87 ± 0.05 1.38 ± 0.32WISE J175929.37+544204.7 >18.55 15.51 ± 0.08 >13.61 >9.44 >3.05 <1.90WISE J180901.07+383805.4i >18.00 15.19 ± 0.09 >12.56 >9.52 >2.81 <2.64WISE J180952.53−044812.5 13.29 ± 0.03 12.73 ± 0.03 12.38 ± 0.48 >8.98 0.56 ± 0.04 0.35 ± 0.48WISE J181243.14+200746.4 >18.55 15.35 ± 0.12 >12.89 >9.23 >3.20 <2.46WISE J181329.40+283533.3 15.72 ± 0.06 14.07 ± 0.05 12.54 ± 0.35 >9.38 1.65 ± 0.07 1.53 ± 0.35WISE J184041.77+293229.2 >18.53 15.12 ± 0.09 12.71 ± 0.40 >9.37 >3.41 2.41 ± 0.41WISE J190903.16−520433.5 >18.20 15.34 ± 0.13 12.56 ± 0.40 >9.25 >2.85 2.79 ± 0.42WISE J191359.78+644456.6 17.37 ± 0.12 15.07 ± 0.05 >12.90 >9.63 2.30 ± 0.13 <2.18WISE J192841.35+235604.9 13.94 ± 0.04 12.11 ± 0.03 11.03 ± 0.13 >8.91 1.83 ± 0.04 1.09 ± 0.13WISE J195436.15+691541.3 17.35 ± 0.08 14.97 ± 0.04 >13.84 >9.51 2.38 ± 0.09 <1.14WISE J195500.42−254013.9 >18.13 15.02 ± 0.11 >12.34 >8.51 >3.12 <2.67WISE J200804.71−083428.5 16.25 ± 0.10 14.23 ± 0.06 >12.64 >8.86 2.02 ± 0.12 <1.59WISE J201404.13+042408.5 >17.94 15.16 ± 0.12 >12.30 >8.95 >2.78 <2.87WISEPC J201546.27+664645.1j 16.70 ± 0.09 14.68 ± 0.06 13.02 ± 0.45 >9.14 2.02 ± 0.11 1.66 ± 0.46WISE J201920.76−114807.5 17.29 ± 0.21 14.32 ± 0.06 >12.20 >9.03 2.96 ± 0.22 <2.12WISE J203042.79+074934.7 12.96 ± 0.03 12.12 ± 0.03 10.96 ± 0.11 >8.96 0.83 ± 0.04 1.16 ± 0.11WISE J204356.42+622048.9 13.90 ± 0.03 13.02 ± 0.03 12.12 ± 0.22 >9.27 0.87 ± 0.04 0.90 ± 0.22WISE J212321.92−261405.1 16.95 ± 0.13 14.52 ± 0.13 >11.62 >8.24 2.42 ± 0.19 <2.90WISE J214706.78−102924.0 >17.60 15.06 ± 0.12 >12.47 >8.80 >2.54 <2.59WISE J223617.59+510551.9 13.84 ± 0.03 12.48 ± 0.03 11.02 ± 0.08 >9.32 1.36 ± 0.04 1.47 ± 0.09WISE J223720.39+722833.8 15.67 ± 0.06 13.61 ± 0.04 12.62 ± 0.38 >9.38 2.06 ± 0.07 0.99 ± 0.38WISE J230133.32+021635.0 16.30 ± 0.08 14.34 ± 0.06 >12.47 >9.13 1.96 ± 0.10 <1.88WISE J230356.79+191432.9 16.50 ± 0.10 14.67 ± 0.07 >12.66 >8.74 1.83 ± 0.12 <2.00WISE J233543.79+422255.2 18.55 ± 0.51 15.31 ± 0.10 12.98 ± 0.49 >9.36 3.24 ± 0.52 2.34 ± 0.50WISE J234228.98+085620.2f 16.07 ± 0.08 13.97 ± 0.05 12.63 ± 0.53 9.08 ± 0.54 2.10 ± 0.09 1.34 ± 0.53WISE J235716.49+122741.8 15.84 ± 0.06 13.99 ± 0.05 12.35 ± 0.40 >9.16 1.85 ± 0.08 1.64 ± 0.40
Notes.a L dwarf candidate, Aberasturi et al. (2011).b ULAS J095047.28+011734.3, Leggett et al. (2012).c IR source, Andrei et al. (2011).d LHS 2803B, Deacon et al. (2012).e BD +01◦ 2920B, Pinfield et al. (2012).f T7 candidates, Scholz (2010).g PSO J226.2599−28.8959, PSO J246.4222+15.4698, PSO J247.3273+03.5932, Deacon et al. (2011).h VHS J154352.78−043909.6, Lodieu et al. (2012).i WISE J180901.07+383805.4, Luhman et al. (2012).j A nearby object caused source confusion in the pipeline used to generate the All-Sky Catalog, resulting in a non-detection of this object. The magnitudes reportedhere were taken from the first-pass processing operations co-add Source Working Database.
Source Catalog and the Reject Table.20 Other follow-up ground-based photometry on the 2MASS system is from the 2MASScamera on the 1.5 m Kuiper Telescope at Steward Observa-tory and the Peters Automated Infrared Imaging Telescope(PAIRITEL; Bloom et al. 2006) on the 1.3 m telescope atFred Lawrence Whipple Observatory. Photometry on the MKOsystem is from the Wide-field Infrared Camera (WIRC; Wil-
20 See http://www.ipac.caltech.edu/2mass/releases/allsky/doc/explsup.htmlfor details.
son et al. 2003) at the 5 m Hale Telescope at Palomar Ob-servatory, the Persson’s Auxilliary Nasmyth Infrared Camera(PANIC; Martini et al. 2004) on the 6.5 m Magellan tele-scope at Las Campanas Observatory, and the NOAO ExtremelyWide Field Infrared Imager (NEWFIRM; Autry et al. 2003)on the 4 m Victor M. Blanco Telescope at Cerro Tololo Inter-American Observatory (CTIO). Ten of our candidates are avail-able in UKIDSS Data Release 8 (Hewett et al. 2006; Lawrenceet al. 2007; Casali et al. 2007; Hambly et al. 2008; Hodgkinet al. 2009). Photometric filters installed in the Ohio State
6

The Astrophysical Journal Supplement Series, 205:6 (49pp), 2013 March Mace et al.
Figure 1. WISE W1 − W2 color vs. spectral type. Objects from Kirkpatricket al. (2011) (including those announced by Mainzer et al. 2011, Cushing et al.2011, and Burgasser et al. 2011) are marked with red triangles and limit arrows.The Y dwarfs from Kirkpatrick et al. (2012) are marked with blue squares andlimit arrows. T dwarfs announced in this paper are marked with black circlesand limit arrows.
(A color version of this figure is available in the online journal.)
Infrared Imager/Spectrometer (OSIRIS; Depoy et al. 1993) useBarr filters which produce T dwarf photometry most similar tothe MKO system (Kirkpatrick et al. 2012, Section 2.2.5), sothey are listed with the MKO measurements. All images wereacquired between 2010 August and 2012 August, and sourceextractions from our observations use source apertures that are1.5 × FWHM of the source point-spread function.
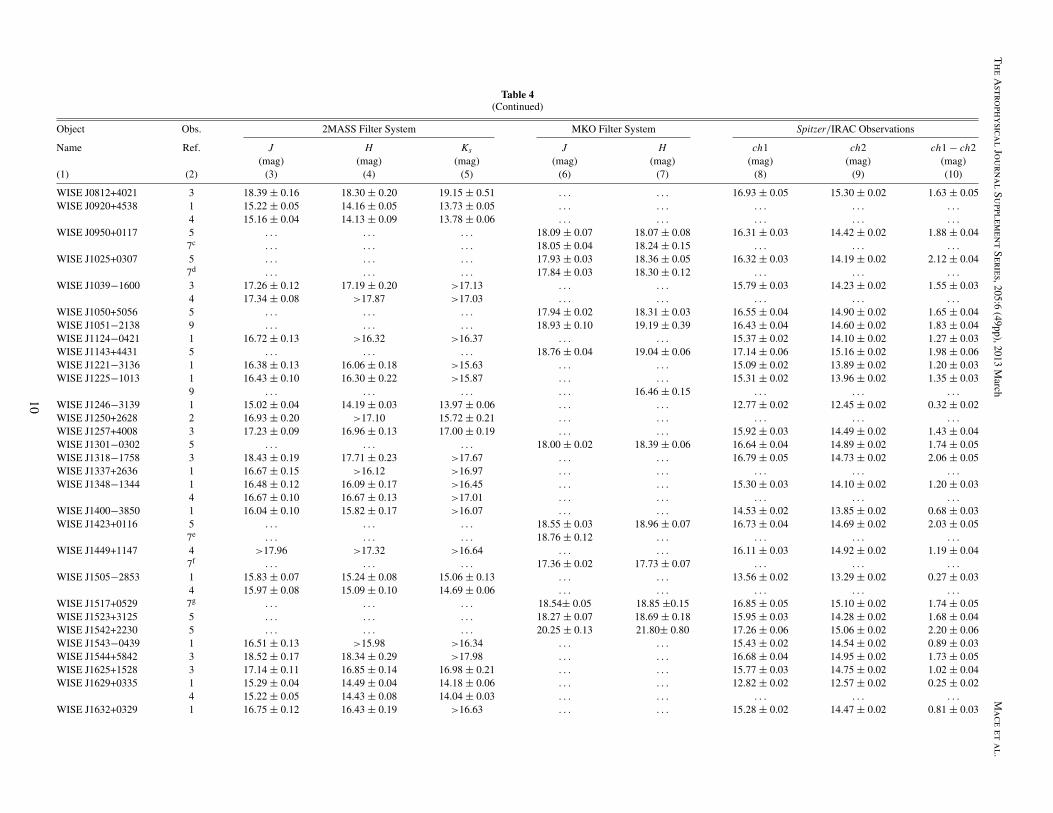
Figures 5, 7, and 8 of Kirkpatrick et al. (2011) specify theJ − H, J − W2, and H − W2 colors of M, L, T, and Y dwarfs.Objects lacking photometry in Table 3 of that paper, but havingfollow-up photometry now, are presented in Table 3 of this paper.Photometry of new T dwarf candidates is listed in Table 4. Forthe figures in this paper we use magnitudes on the 2MASSsystem. MKO magnitudes are depicted in Kirkpatrick et al.(2011, 2012).
The J − H color-type diagram for WISE-discovered T and Ydwarfs is shown in Figure 4. The reversal in the J − H colorshown in Figure 7 of Kirkpatrick et al. (2012) can also be seenin Figure 4 around T7 ± 1. However, the turnaround in the J − Hcolor is driven by only a few objects later than T8 and there arelarge uncertainties in our colors, making a clear identificationof the reversal location difficult.
The J − W2 and H − W2 colors, shown in Figures 5 and 6,of early-type T dwarfs are slightly bluer (or flat) for successivetypes before they become redder for late-type T dwarfs. Thesecolors are complicated as H2 CIA, non-equilibrium CO and
Figure 2. WISE W2 −W3 color vs. spectral type. Same symbols as in Figure 1.
(A color version of this figure is available in the online journal.)
CO2 absorption, and the shift of the Planck peak to longerwavelengths influence the emergent flux (Linsky 1969; Borysowet al. 1997; Frommhold et al. 2010; Saumon et al. 2012; Abelet al. 2012).
The Infrared Array Camera (IRAC; Fazio et al. 2004) on boardthe Spitzer Space Telescope (Werner et al. 2004) was used duringthe warm Spitzer mission to obtain deeper photometry in its3.6 and 4.5 μm channels (hereafter, ch1 and ch2, respectively)allowing the WISE W1 and W2 filters to be robustly measured.These observations were made as part of Cycle 7 and Cycle 8programs 70062 and 80109 (PI: Kirkpatrick). Spitzer/IRACphotometry is listed in Tables 3 and 4 along with our ground-based photometry. The ch1−ch2 color, as a function of spectraltype, is shown in Figure 7. The trend is similar to the WISEW1 − W2 colors (Figure 1), but differences in the WISEand Spitzer/IRAC passbands (Mainzer et al. 2011) result in ashallower slope in the ch1 − ch2 color, as a function of spectraltype, than the W1 − W2 color. Figure 8 directly compares thech1 − ch2 and W1 − W2 colors for T dwarfs. Figure 1 ofGriffith et al. (2012) shows the ch1 − ch2 and W1 − W2 colorsof many WISE candidate and confirmed brown dwarfs, clearlyidentifying the dip in ch1 − ch2 at the L/T transition and thedispersion in colors at later spectral types that are also seen inFigure 8.
3.2. Follow-up Spectroscopic Observations
Summaries of the spectroscopic follow-up observations ofthe 90 new brown dwarfs and 14 known objects from theliterature are given in Tables 5 and 6, respectively. Ourobservation and data reduction procedures are discussed in
7

Th
eA
strophysical
Journ
alSu
pplemen
tSeries,205:6
(49pp),2013M
archM
aceet
al.
Table 3Additional Follow-up 2MASS, MKO, and IRAC Photometry for Discoveries from Kirkpatrick et al. (2011)
Object Obs. 2MASS Filter System MKO Filter System Spitzer/IRAC Observations
Name Ref. J H Ks J H ch1 ch2 ch1 − ch2(mag) (mag) (mag) (mag) (mag) (mag) (mag) (mag)
(1) (2) (3) (4) (5) (6) (7) (8) (9) (10)
WISE J0448−1935 . . . . . . . . . . . . . . . . . . 15.37 ± 0.02 14.16 ± 0.02 1.21 ± 0.03WISE J0656+4205 . . . . . . . . . . . . . . . . . . 13.64 ± 0.02 13.26 ± 0.02 0.38 ± 0.03WISE J0744+5628 . . . . . . . . . . . . . . . . . . 16.27 ± 0.03 14.55 ± 0.02 1.71 ± 0.04WISE J0759−4904 3 . . . . . . . . . 17.38 ± 0.05 17.41 ± 0.04 . . . . . . . . .
WISE J0821+1443 . . . . . . . . . . . . . . . . . . 15.59 ± 0.03 14.51 ± 0.02 1.08 ± 0.03WISE J0836−1859 1 18.99 ± 0.22 18.79 ± 0.26 >18.48 . . . . . . . . . . . . . . .
WISE J1018−2445 1 17.82 ± 0.12 18.00 ± 0.23 17.81 ± 0.31 . . . . . . . . . . . . . . .
WISE J1042−3842 4 . . . . . . . . . 18.98 ± 0.09 19.08 ± 0.11 . . . . . . . . .
WISE J1436−1814 2 17.52 ± 0.13 >17.62 >16.97 . . . . . . . . . . . . . . .
WISE J1612−3420 4 . . . . . . . . . 16.65 ± 0.03 16.96 ± 0.03 . . . . . . . . .
WISE J1812+2721 . . . . . . . . . . . . . . . . . . 16.32 ± 0.03 14.17 ± 0.02 2.15 ± 0.04WISE J1830+4542 . . . . . . . . . . . . . . . . . . 14.29 ± 0.02 14.13 ± 0.02 0.16 ± 0.03WISE J1906+4508 . . . . . . . . . . . . . . . . . . 15.03 ± 0.02 13.82 ± 0.02 1.21 ± 0.03WISE J1959−3338 . . . . . . . . . . . . . . . . . . 15.36 ± 0.02 13.79 ± 0.02 1.58 ± 0.03WISE J2018−7423 4 . . . . . . . . . 16.83 ± 0.03 17.17 ± 0.04 15.28 ± 0.02 13.55 ± 0.02 1.73 ± 0.03WISE J2313−8037 . . . . . . . . . . . . . . . . . . 15.29 ± 0.02 13.68 ± 0.02 1.61 ± 0.03WISE J2343−7418 . . . . . . . . . . . . . . . . . . 15.04 ± 0.02 13.75 ± 0.02 1.28 ± 0.03
Notes. Ref. for JHK instrument or catalog: 2MASS filter system: (1) Bigelow/2MASS, (2) PAIRITEL; MKO filter system: (3) Magellan/PANIC, (4) CTIO-4m/NEWFIRM.
8

Th
eA
strophysical
Journ
alSu
pplemen
tSeries,205:6
(49pp),2013M
archM
aceet
al.
Table 4Follow-up 2MASS, MKO, and IRAC Photometry for New Brown Dwarf Discoveries
Object Obs. 2MASS Filter System MKO Filter System Spitzer/IRAC Observations
Name Ref. J H Ks J H ch1 ch2 ch1 − ch2(mag) (mag) (mag) (mag) (mag) (mag) (mag) (mag)
(1) (2) (3) (4) (5) (6) (7) (8) (9) (10)
WISE J0005+3737 9 . . . . . . . . . 18.33 ± 0.12 18.10 ± 0.08 15.43 ± 0.02 13.28 ± 0.02 2.15 ± 0.03WISE J0038+2758 5 . . . . . . . . . 18.61 ± 0.02 18.92 ± 0.04 16.45 ± 0.04 14.41 ± 0.02 2.04 ± 0.04WISE J0038+8405 4 17.53 ± 0.06 17.06 ± 0.11 >16.50 . . . . . . 16.33 ± 0.04 14.99 ± 0.02 1.34 ± 0.04WISE J0040+0900 1 16.50 ± 0.12 16.54 ± 0.27 >15.74 . . . . . . 15.07 ± 0.02 13.76 ± 0.02 1.31 ± 0.03
7a . . . . . . . . . . . . 16.560.02 . . . . . . . . .
WISE J0045+3611 1 16.15 ± 0.08 16.04 ± 0.15 15.80 ± 0.20 . . . . . . 14.68 ± 0.02 13.75 ± 0.02 0.94 ± 0.03WISE J0049+2151 1 16.72 ± 0.16 >16.51 >15.86 . . . . . . 15.01 ± 0.02 13.04 ± 0.02 1.97 ± 0.03WISE J0135+1715 . . . . . . . . . . . . . . . . . . 16.08 ± 0.03 14.57 ± 0.02 1.51 ± 0.04WISE J0210+4008 2 16.77 ± 0.19 16.06 ± 0.18 >15.88 . . . . . . . . . . . . . . .
WISE J0233+3030 1 16.85 ± 0.14 >17.18 >17.04 . . . . . . 15.63 ± 0.03 14.35 ± 0.02 1.28 ± 0.03WISE J0245−3450 9 . . . . . . . . . 17.77 ± 0.09 . . . 16.05 ± 0.03 14.59 ± 0.02 1.46 ± 0.04WISE J0247+3725 3 18.44 ± 0.17 18.24 ± 0.19 18.37 ± 0.30 . . . . . . 16.70 ± 0.04 14.56 ± 0.02 2.14 ± 0.05WISE J0259−0346 . . . . . . . . . . . . . . . . . . 16.22 ± 0.03 14.88 ± 0.02 1.34 ± 0.04WISE J0316+3820 1 16.06 ± 0.09 15.44 ± 0.11 15.27 ± 0.15 . . . . . . 14.10 ± 0.02 13.52 ± 0.02 0.58 ± 0.03
3 16.21 ± 0.08 15.50 ± 0.08 15.33 ± 0.10 . . . . . . . . . . . . . . .
WISE J0316+4307 5 . . . . . . . . . 19.47 ± 0.04 19.70 ± 0.09 16.64 ± 0.04 14.58 ± 0.02 2.06 ± 0.05WISE J0321−7347 9 . . . . . . . . . 19.13 ± 0.11 19.06 ± 0.12 17.28 ± 0.06 15.36 ± 0.02 1.92 ± 0.06WISE J0325−3854 9∗ . . . . . . . . . ∼19.40 ∼19.30 17.12 ± 0.05 14.99 ± 0.02 2.14 ± 0.06WISE J0325+0831 4 16.54 ± 0.07 16.15 ± 0.08 . . . . . . . . . 14.70 ± 0.02 13.59 ± 0.02 1.11 ± 0.03WISE J0335+4310 3 >19.73 >19.18 >18.56 . . . . . . 16.60 ± 0.04 14.38 ± 0.02 2.21 ± 0.04
5 . . . . . . . . . 20.07 ± 0.30 19.60 ± 0.26 . . . . . . . . .
WISE J0336−0143 4 >19.00 >18.25 . . . . . . . . . 17.26 ± 0.06 14.62 ± 0.02 2.64 ± 0.06WISE J0336+2826 1 16.54 ± 0.12 16.53 ± 0.27 15.77 ± 0.24 . . . . . . 15.31 ± 0.02 14.36 ± 0.02 0.95 ± 0.03
7b . . . . . . . . . . . . 16.28 ± 0.03 . . . . . . . . .
WISE J0413−4750 9 . . . . . . . . . 20.29 ± 0.20 20.12 ± 0.20 17.80 ± 0.09 15.49 ± 0.02 2.32 ± 0.09WISE J0424+0727 3 18.71 ± 0.16 18.76 ± 0.22 18.87 ± 0.40 . . . . . . 16.75 ± 0.04 15.18 ± 0.02 1.56 ± 0.05WISE J0430+4633 5 . . . . . . . . . 19.03 ± 0.05 19.25 ± 0.13 16.13 ± 0.03 14.22 ± 0.02 1.91 ± 0.04WISE J0512−3004 5 . . . . . . . . . 19.21 ± 0.09 19.66 ± 0.41 17.64 ± 0.08 15.58 ± 0.02 2.06 ± 0.08WISE J0540+4832 5 . . . . . . . . . 18.49 ± 0.02 18.62 ± 0.05 16.97 ± 0.05 14.77 ± 0.02 2.20 ± 0.05WISE J0546−0959 1 16.18 ± 0.09 16.27 ± 0.22 >15.47 . . . . . . 15.01 ± 0.02 13.92 ± 0.02 1.09 ± 0.03WISE J0614+0951 3 16.90 ± 0.08 16.82 ± 0.10 16.81 ± 0.14 . . . . . . 15.49 ± 0.03 14.10 ± 0.02 1.39 ± 0.03WISE J0629+2418 1 16.34 ± 0.13 15.47 ± 0.15 15.13 ± 0.15 . . . . . . . . . . . . . . .
4 16.39 ± 0.05 15.58 ± 0.06 15.09 ± 0.07 . . . . . . . . . . . . . . .
WISE J0642+4101 1 16.16 ± 0.10 15.09 ± 0.07 14.28 ± 0.06 . . . . . . 12.94 ± 0.02 12.65 ± 0.02 0.29 ± 0.02WISE J0701+6321 1 15.79 ± 0.06 15.08 ± 0.07 14.88 ± 0.11 . . . . . . 13.65 ± 0.02 13.24 ± 0.02 0.42 ± 0.03WISE J0723+3403 4 18.21 ± 0.14 >18.47 >17.06 . . . . . . 16.77 ± 0.04 14.68 ± 0.02 2.08 ± 0.05WISE J0733+7544 2 17.20 ± 0.21 >17.75 15.81 ± 0.27 . . . . . . 16.00 ± 0.03 14.81 ± 0.02 1.19 ± 0.04WISE J0754+7909 1 16.17 ± 0.11 15.44 ± 0.14 14.93 ± 0.12 . . . . . . 13.81 ± 0.02 13.82 ± 0.02 −0.01 ± 0.03
4 16.24 ± 0.05 15.27 ± 0.06 15.05 ± 0.08 . . . . . . . . . . . . . . .
WISE J0811−8051 9 . . . . . . . . . 19.90 ± 0.18 19.88 ± 0.21 16.82 ± 0.05 14.40 ± 0.02 2.42 ± 0.05
9
Th
eA
strophysical
Journ
alSu
pplemen
tSeries,205:6
(49pp),2013M
archM
aceet
al.
Table 4(Continued)
Object Obs. 2MASS Filter System MKO Filter System Spitzer/IRAC Observations
Name Ref. J H Ks J H ch1 ch2 ch1 − ch2(mag) (mag) (mag) (mag) (mag) (mag) (mag) (mag)
(1) (2) (3) (4) (5) (6) (7) (8) (9) (10)
WISE J0812+4021 3 18.39 ± 0.16 18.30 ± 0.20 19.15 ± 0.51 . . . . . . 16.93 ± 0.05 15.30 ± 0.02 1.63 ± 0.05WISE J0920+4538 1 15.22 ± 0.05 14.16 ± 0.05 13.73 ± 0.05 . . . . . . . . . . . . . . .
4 15.16 ± 0.04 14.13 ± 0.09 13.78 ± 0.06 . . . . . . . . . . . . . . .
WISE J0950+0117 5 . . . . . . . . . 18.09 ± 0.07 18.07 ± 0.08 16.31 ± 0.03 14.42 ± 0.02 1.88 ± 0.047c . . . . . . . . . 18.05 ± 0.04 18.24 ± 0.15 . . . . . . . . .
WISE J1025+0307 5 . . . . . . . . . 17.93 ± 0.03 18.36 ± 0.05 16.32 ± 0.03 14.19 ± 0.02 2.12 ± 0.047d . . . . . . . . . 17.84 ± 0.03 18.30 ± 0.12 . . . . . . . . .
WISE J1039−1600 3 17.26 ± 0.12 17.19 ± 0.20 >17.13 . . . . . . 15.79 ± 0.03 14.23 ± 0.02 1.55 ± 0.034 17.34 ± 0.08 >17.87 >17.03 . . . . . . . . . . . . . . .
WISE J1050+5056 5 . . . . . . . . . 17.94 ± 0.02 18.31 ± 0.03 16.55 ± 0.04 14.90 ± 0.02 1.65 ± 0.04WISE J1051−2138 9 . . . . . . . . . 18.93 ± 0.10 19.19 ± 0.39 16.43 ± 0.04 14.60 ± 0.02 1.83 ± 0.04WISE J1124−0421 1 16.72 ± 0.13 >16.32 >16.37 . . . . . . 15.37 ± 0.02 14.10 ± 0.02 1.27 ± 0.03WISE J1143+4431 5 . . . . . . . . . 18.76 ± 0.04 19.04 ± 0.06 17.14 ± 0.06 15.16 ± 0.02 1.98 ± 0.06WISE J1221−3136 1 16.38 ± 0.13 16.06 ± 0.18 >15.63 . . . . . . 15.09 ± 0.02 13.89 ± 0.02 1.20 ± 0.03WISE J1225−1013 1 16.43 ± 0.10 16.30 ± 0.22 >15.87 . . . . . . 15.31 ± 0.02 13.96 ± 0.02 1.35 ± 0.03
9 . . . . . . . . . . . . 16.46 ± 0.15 . . . . . . . . .
WISE J1246−3139 1 15.02 ± 0.04 14.19 ± 0.03 13.97 ± 0.06 . . . . . . 12.77 ± 0.02 12.45 ± 0.02 0.32 ± 0.02WISE J1250+2628 2 16.93 ± 0.20 >17.10 15.72 ± 0.21 . . . . . . . . . . . . . . .
WISE J1257+4008 3 17.23 ± 0.09 16.96 ± 0.13 17.00 ± 0.19 . . . . . . 15.92 ± 0.03 14.49 ± 0.02 1.43 ± 0.04WISE J1301−0302 5 . . . . . . . . . 18.00 ± 0.02 18.39 ± 0.06 16.64 ± 0.04 14.89 ± 0.02 1.74 ± 0.05WISE J1318−1758 3 18.43 ± 0.19 17.71 ± 0.23 >17.67 . . . . . . 16.79 ± 0.05 14.73 ± 0.02 2.06 ± 0.05WISE J1337+2636 1 16.67 ± 0.15 >16.12 >16.97 . . . . . . . . . . . . . . .
WISE J1348−1344 1 16.48 ± 0.12 16.09 ± 0.17 >16.45 . . . . . . 15.30 ± 0.03 14.10 ± 0.02 1.20 ± 0.034 16.67 ± 0.10 16.67 ± 0.13 >17.01 . . . . . . . . . . . . . . .
WISE J1400−3850 1 16.04 ± 0.10 15.82 ± 0.17 >16.07 . . . . . . 14.53 ± 0.02 13.85 ± 0.02 0.68 ± 0.03WISE J1423+0116 5 . . . . . . . . . 18.55 ± 0.03 18.96 ± 0.07 16.73 ± 0.04 14.69 ± 0.02 2.03 ± 0.05
7e . . . . . . . . . 18.76 ± 0.12 . . . . . . . . . . . .
WISE J1449+1147 4 >17.96 >17.32 >16.64 . . . . . . 16.11 ± 0.03 14.92 ± 0.02 1.19 ± 0.047f . . . . . . . . . 17.36 ± 0.02 17.73 ± 0.07 . . . . . . . . .
WISE J1505−2853 1 15.83 ± 0.07 15.24 ± 0.08 15.06 ± 0.13 . . . . . . 13.56 ± 0.02 13.29 ± 0.02 0.27 ± 0.034 15.97 ± 0.08 15.09 ± 0.10 14.69 ± 0.06 . . . . . . . . . . . . . . .
WISE J1517+0529 7g . . . . . . . . . 18.54± 0.05 18.85 ±0.15 16.85 ± 0.05 15.10 ± 0.02 1.74 ± 0.05WISE J1523+3125 5 . . . . . . . . . 18.27 ± 0.07 18.69 ± 0.18 15.95 ± 0.03 14.28 ± 0.02 1.68 ± 0.04WISE J1542+2230 5 . . . . . . . . . 20.25 ± 0.13 21.80± 0.80 17.26 ± 0.06 15.06 ± 0.02 2.20 ± 0.06WISE J1543−0439 1 16.51 ± 0.13 >15.98 >16.34 . . . . . . 15.43 ± 0.02 14.54 ± 0.02 0.89 ± 0.03WISE J1544+5842 3 18.52 ± 0.17 18.34 ± 0.29 >17.98 . . . . . . 16.68 ± 0.04 14.95 ± 0.02 1.73 ± 0.05WISE J1625+1528 3 17.14 ± 0.11 16.85 ± 0.14 16.98 ± 0.21 . . . . . . 15.77 ± 0.03 14.75 ± 0.02 1.02 ± 0.04WISE J1629+0335 1 15.29 ± 0.04 14.49 ± 0.04 14.18 ± 0.06 . . . . . . 12.82 ± 0.02 12.57 ± 0.02 0.25 ± 0.02
4 15.22 ± 0.05 14.43 ± 0.08 14.04 ± 0.03 . . . . . . . . . . . . . . .
WISE J1632+0329 1 16.75 ± 0.12 16.43 ± 0.19 >16.63 . . . . . . 15.28 ± 0.02 14.47 ± 0.02 0.81 ± 0.03
10

Th
eA
strophysical
Journ
alSu
pplemen
tSeries,205:6
(49pp),2013M
archM
aceet
al.
Table 4(Continued)
Object Obs. 2MASS Filter System MKO Filter System Spitzer/IRAC Observations
Name Ref. J H Ks J H ch1 ch2 ch1 − ch2(mag) (mag) (mag) (mag) (mag) (mag) (mag) (mag)
(1) (2) (3) (4) (5) (6) (7) (8) (9) (10)
WISE J1636−0743 . . . . . . . . . . . . . . . . . . . . . . . . . . .
WISE J1707−1744 1 16.30 ± 0.12 >15.45 >15.85 . . . . . . 14.98 ± 0.02 13.62 ± 0.02 1.35 ± 0.035 . . . . . . . . . 16.35 ± 0.02 17.11 ± 0.03 . . . . . . . . .
8 . . . . . . . . . 16.33 ± 0.02 16.58 ± 0.03 . . . . . . . . .
WISE J1721+1117 1 16.46 ± 0.15 >16.24 >16.12 . . . . . . 15.24 ± 0.02 14.35 ± 0.02 0.89 ± 0.03WISE J1730+4207 2 16.95 ± 0.18 16.00 ± 0.19 >15.65 . . . . . . 14.73 ± 0.02 14.56 ± 0.02 0.17 ± 0.03WISE J1734+5023 1 16.34 ± 0.11 15.85 ± 0.14 >15.37 . . . . . . 15.23 ± 0.02 14.38 ± 0.02 0.84 ± 0.03WISE J1736+6059 4 >18.91 >18.14 >16.96 . . . . . . 16.97 ± 0.05 15.37 ± 0.02 1.60 ± 0.05WISE J1738+6142 2 . . . 16.32 ± 0.22 15.14 ± 0.16 . . . . . . 13.56 ± 0.02 13.33 ± 0.02 0.23 ± 0.03
4 17.82 ± 0.13 16.34 ± 0.08 15.27 ± 0.10 . . . . . . . . . . . . . . .
WISE J1741+1327 . . . . . . . . . . . . . . . . . . 16.01 ± 0.03 14.67 ± 0.02 1.35 ± 0.04WISE J1743+4211 1 15.84 ± 0.06 15.57 ± 0.14 15.43 ± 0.19 . . . . . . 14.72 ± 0.02 13.93 ± 0.02 0.79 ± 0.03
4 15.83 ± 0.06 15.73 ± 0.09 16.03 ± 0.22 . . . . . . . . . . . . . . .
WISE J1745+6459 . . . . . . . . . . . . . . . . . . 17.41 ± 0.07 16.14 ± 0.03 1.27 ± 0.07WISE J1746−0338 3 17.53 ± 0.17 17.57 ± 0.34 >17.08 . . . . . . 16.03 ± 0.03 14.44 ± 0.02 1.59 ± 0.04
8 . . . . . . . . . 17.17 ± 0.03 17.45 ± 0.04 . . . . . . . . .
WISE J1755+1803 1 16.02 ± 0.09 15.22 ± 0.09 14.68 ± 0.13 . . . . . . 14.09 ± 0.02 13.77 ± 0.02 0.32 ± 0.03WISE J1759+5442 5 . . . . . . . . . 17.93 ± 0.01 18.26 ± 0.03 16.64 ± 0.04 15.12 ± 0.02 1.52 ± 0.05WISE J1809+3838 . . . . . . . . . . . . . . . . . . 16.49 ± 0.04 14.90 ± 0.02 1.59 ± 0.04WISE J1809−0448 1 15.14 ± 0.05 14.28 ± 0.05 13.96 ± 0.06 . . . . . . . . . . . . . . .
WISE J1812+2007 5 . . . . . . . . . 18.54 ± 0.02 18.95 ± 0.06 16.96 ± 0.05 15.02 ± 0.02 1.93 ± 0.058 . . . . . . . . . 18.75 ± 0.07 18.94 ± 0.09 . . . . . . . . .
WISE J1813+2835 . . . . . . . . . . . . . . . . . . 15.82 ± 0.03 14.19 ± 0.02 1.63 ± 0.03WISE J1840+2932 5 . . . . . . . . . 17.89 ± 0.01 18.12 ± 0.03 16.67 ± 0.04 15.20 ± 0.02 1.47 ± 0.05WISE J1909−5204 6 . . . . . . . . . 17.35 ± 0.09 17.26 ± 0.06 16.37 ± 0.04 15.21 ± 0.02 1.17 ± 0.04WISE J1913+6444 4 17.32 ± 0.10 16.89 ± 0.14 >16.49 . . . . . . 16.29 ± 0.03 14.99 ± 0.02 1.30 ± 0.04WISE J1928+2356 2 14.34 ± 0.06 14.31 ± 0.06 14.09 ± 0.06 . . . . . . 13.14 ± 0.02 12.06 ± 0.02 1.08 ± 0.02WISE J1954+6915 4 17.73 ± 0.12 17.19 ± 0.16 17.06 ± 0.38 . . . . . . 16.04 ± 0.03 14.83 ± 0.02 1.22 ± 0.04WISE J1955−2540 5 . . . . . . . . . 17.58 ± 0.02 18.00 ± 0.05 16.61 ± 0.04 15.03 ± 0.02 1.58 ± 0.05WISE J2008−0834 1 16.37 ± 0.12 16.69 ± 0.31 >15.66 . . . . . . 15.16 ± 0.02 14.11 ± 0.02 1.06 ± 0.03WISE J2014+0424 3 18.76 ± 0.22 18.66 ± 0.30 17.84 ± 0.29 . . . . . . 16.35 ± 0.04 14.77 ± 0.02 1.58 ± 0.04WISE J2015+6646 4 16.91 ± 0.07 16.50 ± 0.09 >16.43 . . . . . . 16.33 ± 0.03 14.62 ± 0.02 1.71 ± 0.04WISE J2019−1148 4 >14.93 >13.95 >14.11 . . . . . . 16.03 ± 0.03 14.25 ± 0.02 1.78 ± 0.04
8 . . . . . . . . . 18.09 ± 0.06 18.23 ± 0.07 . . . . . . . . .
9 . . . . . . . . . 18.54 ± 0.08 18.32 ± 0.11 . . . . . . . . .
WISE J2030+0749 1 14.23 ± 0.03 13.44 ± 0.03 13.32 ± 0.04 . . . . . . . . . . . . . . .
WISE J2043+6220 1 15.60 ± 0.07 14.70 ± 0.07 14.42 ± 0.07 . . . . . . . . . . . . . . .
WISE J2123−2614 2 17.44 ± 0.26 >17.30 >15.85 . . . . . . 15.94 ± 0.03 14.45 ± 0.02 1.49 ± 0.04WISE J2147−1029 3 17.66 ± 0.22 17.81 ± 0.36 >17.12 . . . . . . 16.55 ± 0.04 14.96 ± 0.02 1.59 ± 0.04WISE J2236+5105 . . . . . . . . . . . . . . . . . . . . . . . . . . .
WISE J2237+7228 1 15.76 ± 0.07 15.94 ± 0.21 >15.99 . . . . . . 14.61 ± 0.02 13.56 ± 0.02 1.05 ± 0.03
11

Th
eA
strophysical
Journ
alSu
pplemen
tSeries,205:6
(49pp),2013M
archM
aceet
al.
Table 4(Continued)
Object Obs. 2MASS Filter System MKO Filter System Spitzer/IRAC Observations
Name Ref. J H Ks J H ch1 ch2 ch1 − ch2(mag) (mag) (mag) (mag) (mag) (mag) (mag) (mag)
(1) (2) (3) (4) (5) (6) (7) (8) (9) (10)
WISE J2301+0216 1 16.71 ± 0.15 >16.09 >17.18 . . . . . . 15.60 ± 0.03 14.37 ± 0.02 1.23 ± 0.037h . . . . . . . . . 16.36 ± 0.01 16.70 ± 0.03 . . . . . . . . .
WISE J2303+1914 1 16.86 ± 0.16 >16.02 >17.10 . . . . . . . . . . . . . . .
WISE J2335+4222 . . . . . . . . . . . . . . . . . . 16.53 ± 0.04 15.30 ± 0.02 1.23 ± 0.05WISE J2342+0856 2 16.73 ± 0.18 16.26 ± 0.23 >15.94 . . . . . . 15.29 ± 0.02 13.99 ± 0.02 1.30 ± 0.03
7i . . . . . . . . . 16.37 ± 0.01 16.73 ± 0.03 . . . . . . . . .
WISE J2357+1227 1 16.52 ± 0.14 >15.75 >16.12 . . . . . . 15.26 ± 0.02 14.10 ± 0.02 1.16 ± 0.037j . . . . . . . . . 16.10 ± 0.01 16.49 ± 0.03 . . . . . . . . .
Notes. Ref. for JHK instrument or catalog: 2MASS filter system: (1) 2MASS All-Sky Point Source Catalog, (2) 2MASS Reject Table, (3) Bigelow/2MASS, (4) PAIRITEL; MKO filter system: (5) Palomar/WIRC,(6) Magellan/PANIC, (7) UKIDSS, (8) CTIO-4m/NEWFIRM, Other filter System: (9) SOAR/OSIRIS.∗ Approximate magnitudes based on images with only three 2MASS sources available for photometric calibration.a K = 16.55 ± 0.05 (mag).b Z = 19.75 ± 0.09 (mag), Y = 17.48 ± 0.02 (mag), K = 16.40 ± 0.04 (mag).c Y = 18.96 ± 0.06 (mag).d Y = 18.92 ± 0.05 (mag).e Y = 19.51 ± 0.14 (mag).f Y = 18.35 ± 0.04 (mag), K = 18.10 ± 0.15 (mag).g Y = 19.57 ± 0.07 (mag).h Y = 17.62 ±0.02 (mag), K = 16.87 ± 0.05 (mag).i Y = 17.42 ± 0.02 (mag), K = 16.98 ± 0.07 (mag).j Y = 17.34 ± 0.02 (mag), K = 16.52 ± 0.04 (mag).
12

The Astrophysical Journal Supplement Series, 205:6 (49pp), 2013 March Mace et al.
Table 5Follow-up Near-IR Spectroscopy and Spectral Classifications for T Dwarf Discoveries
Object Name NIR Sp. Spectrograph Int. Time Tell. Corr. Obs. Dateand J2000 Coordinates Type (s) Star (UT)(1) (2) (3) (4) (5) (6)
WISE J0005+3737 T9 Keck/NIRSPEC-J 2400 HD 9711 2011 Oct 7WISE J0038+2758 T9 Keck/NIRSPEC-J 4800 HD 7215 2011 Sep 8WISE J0038+8405 T6 Keck/NIRSPEC-J 3600 HD 33541 2011 Aug 9WISE J0040+0900 T7 IRTF/SpeX 1200 HD 7215 2011 Nov 30WISE J0045+3611 T5 IRTF/SpeX 1200 HD 9711 2011 Aug 25WISE J0049+2151 T8.5 IRTF/SpeX 1200 HD 9711 2011 Aug 25WISE J0135+1715 T6 IRTF/SpeX 1200 HD 19600 2011 Aug 25WISE J0210+4008 T4.5 IRTF/SpeX 1200 HD 19600 2011 Nov 30WISE J0233+3030 T6 IRTF/SpeX 1200 HD 19600 2011 Aug 25WISE J0245−3450 T8 IRTF/SpeX 1200 HD 18735 2011 Aug 25WISE J0247+3725 T8 Gemini/GNIRS 6000 HD 21038 2012 Jan 5WISE J0259−0346 T5 Keck/NIRSPEC-J 1200 HD 18571 2011 Oct 9WISE J0316+3820 T3 Palomar/TSpec 480 HD 20842 2011 Jul 13WISE J0316+4307 T8 Keck/NIRSPEC-J 2400 HD 21038 2011 Sep 5
T8 Keck/NIRSPEC-H 1800 HD 21038 2011 Sep 6T8 Keck/NIRSPEC-J 3600 HD 9711 2011 Oct 7
WISE J0321−7347 T8 Magellan/FIRE 1775 HD 80885 2012 Jan 5WISE J0325−3854 T9 Keck/NIRSPEC-J 1200 HD 24966 2011 Sep 8
T9 Keck/NIRSPEC-J 2400 HD 24966 2011 Oct 7WISE J0325+0831 T7 IRTF/SpeX 1560 HD 22859 2011 Sep 11WISE J0335+4310 T9 Keck/NIRSPEC-J 2400 HD 21038 2012 Sep 25WISE J0336−0143 T8: Keck/NIRSPEC-J 600 HD 18571 2011 Sep 8WISE J0336+2826 T5 IRTF/SpeX 960 HD 202990 2011 Sep 11WISE J0413−4750 T9 Magellan/FIRE 1775 HD 30252 2012 Jan 5WISE J0424+0727 T7.5 Keck/NIRSPEC-J 2400 HD 31411 2012 Sep 24WISE J0430+4633 T8 Keck/NIRSPEC-J 4200 HD 31069 2012 Sep 24WISE J0512−3004 T8.5 Keck/NIRSPEC-J 2400 HD 36965 2012 Sep 25WISE J0540+4832 T8.5 Keck/NIRSPEC-J 2400 HD 45105 2012 Sep 25WISE J0546−0959 T5 IRTF/SpeX 1200 HD 37887 2012 Feb 1WISE J0614+0951 T7 Palomar/TSpec 2700 HD 35036 2012 Jan 6WISE J0629+2418 T2 sb IRTF/SpeX 1200 HD 43607 2012 Feb 13WISE J0642+4101 extremely red Palomar/TSpec 1080 HD 45105 2012 Jan 7WISE J0701+6321 T3 Palomar/TSpec 1440 HD 33654 2012 Jan 6WISE J0723+3403 T9: Keck/NIRSPEC-J 2400 HD 57208 2012 Apr 9WISE J0733+7544 T6 Palomar/TSpec 3000 HD 43607 2012 Jan 6WISE J0754+7909 extremely red Palomar/TSpec 1440 HD 33541 2012 Jan 7WISE J0811−8051 T9.5: Magellan/FIRE 1268 HD 52364 2012 Jan 5WISE J0812+4021 T8 Gemini/GNIRS 3000 HD 45105 2011 Mar 13WISE J1025+0307 T8.5 Magellan/FIRE 960 HD 84920 2012 May 6WISE J1039−1600 T7.5 IRTF/SpeX 1920 HD 88766 2012 Feb 13WISE J1050+5056 T8 Keck/NIRSPEC-J 1800 HD 99966 2012 Jun 9WISE J1051−2138 T9: Palomar/TSpec 1800 HD 91398 2012 Jan 6WISE J1124−0421 T7 IRTF/SpeX 1680 HD 93346 2012 Jan 31WISE J1143+4431 T8.5 Keck/NIRSPEC-J 2100 HD 99966 2012 Jun 9WISE J1221−3136 T6.5 IRTF/SpeX 1440 HD 112305 2012 May 13WISE J1225−1013 T6 IRTF/SpeX 1200 HD 101122 2012 Jan 13WISE J1250+2628 T6.5 Keck/NIRSPEC-J 1440 HD 122945 2012 Jun 8WISE J1257+4008 T7 IRTF/SpeX 1200 HD 109615 2012 May 13WISE J1301−0302 T8.5 Keck/NIRSPEC-J 1440 HD 118054 2012 Jun 9WISE J1318−1758 T9: Palomar/TSpec 2400 HD 114243 2012 Jan 6WISE J1337+2636 T5 Keck/NIRSPEC-J 1440 HD 122945 2012 Jun 8WISE J1400−3850 T4 IRTF/SpeX 1440 HD 120486 2012 Feb 13WISE J1517+0529 T8 Keck/NIRSPEC-J 2400 HD 140775 2012 Apr 9WISE J1523+3125 T6.5 pec Gemini/GNIRS 2400 HD 136831 2011 Jul 4WISE J1542+2230 T9.5 HST/WFC3 2012 . . . 2012 Mar 4WISE J1544+5842 T7.5 Keck/NIRSPEC-J 900 HD 143187 2011 Aug 8WISE J1632+0329 T5 IRTF/SpeX 1200 HD 145647 2011 Sep 11WISE J1636−0743 T4.5 IRTF/SpeX 1200 HD 148968 2011 Aug 25WISE J1707−1744 T5: Palomar/TSpec 3600 HD 131951 2011 May 12WISE J1721+1117 T6 IRTF/SpeX 960 HD 167163 2011 Aug 25WISE J1730+4207 T0 sb IRTF/SpeX 1200 HD 174567 2011 Jul 29WISE J1734+5023 T4 IRTF/SpeX 1200 HD 184195 2011 Jul 29WISE J1736+6059 T8 Keck/NIRSPEC-J 1800 HD 172728 2012 Sep 3
13

The Astrophysical Journal Supplement Series, 205:6 (49pp), 2013 March Mace et al.
Table 5(Continued)
Object Name NIR Sp. Spectrograph Int. Time Tell. Corr. Obs. Dateand J2000 Coordinates Type (s) Star (UT)(1) (2) (3) (4) (5) (6)
WISE J1738+6142 extremely red Palomar/TSpec 1440 HD 143187 2011 Jul 13extremely red IRTF/SpeX 1200 55 Dra 2012 Jul 23
WISE J1741+1327 T5 IRTF/SpeX 1200 HD 167163 2011 Aug 25WISE J1743+4211 T4.5 Palomar/TSpec 1200 HD 158261 2011 May 12WISE J1745+6459 T7 Keck/NIRSPEC-J 1800 HD 172728 2012 Jun 8WISE J1746−0338 T6 Palomar/TSpec 3600 HD 161868 2011 May 13WISE J1755+1803 T2 Palomar/TSpec 720 HD 165029 2011 Jul 13WISE J1759+5442 T7 Keck/NIRSPEC-J 1440 HD 172728 2012 Jun 8WISE J1809−0448 T0.5 IRTF/SpeX 960 HD 167163 2012 Jul 23WISE J1812+2007 T9 Keck/NIRSPEC-J 1800 HD 199217 2012 Sep 3WISE J1813+2835 T8 Keck/NIRSPEC-J 1800 HD 165029 2012 Jun 8WISE J1840+2932 T6 Keck/NIRSPEC-J 1800 HD 165029 2012 Sep 3WISE J1909−5204 T5.5 Magellan/FIRE 720 HD 182000 2012 Sep 5WISE J1913+6444 T5: Palomar/TSpec 1800 HD 184195 2011 Jul 13WISE J1928+2356 T6 IRTF/SpeX 1200 HD 192538 2011 Sep 11WISE J1954+6915 T5.5 Keck/NIRSPEC-J 1440 HD 172728 2012 Jun 9WISE J1955−2540 T8 Keck/NIRSPEC-J 1440 HD 190285 2012 Jun 9WISE J2008−0834 T5.5 IRTF/SpeX 1200 HD 202990 2011 Sep 11WISE J2014+0424 T6.5 pec Gemini/GNIRS 3600 HD 198070 2011 Aug 28WISE J2015+6646 T8 Palomar/TSpec 2400 HD 214019 2011 Jul 14WISE J2019−1148 T8: Palomar/TSpec 2400 HD 202990 2011 Jul 14WISE J2030+0749 T1.5 IRTF/SpeX 1200 HD 198070 2011 Sep 11WISE J2043+6220 T1.5 IRTF/SpeX 720 HD 192538 2012 May 28WISE J2123−2614 T5.5 IRTF/SpeX 1200 HD 202941 2011 Aug 25WISE J2147−1029 T7.5 Keck/NIRSPEC-J 1400 HD 203769 2012 Jun 9WISE J2236+5105 T5.5 Palomar/TSpec 1440 HD 223386 2012 Jan 6WISE J2237+7228 T6 Keck/NIRSPEC-J 1200 HD 207636 2011 Sep 8WISE J2301+0216 T6.5 IRTF/SpeX 1440 HD 215143 2011 Sep 11WISE J2303+1914 T4: Palomar/TSpec 1440 HD 209932 2012 Jan 7WISE J2335+4222 T7 Keck/NIRSPEC-J 2400 HD 222749 2011 Sep 5
T7 Keck/NIRSPEC-H 1200 HD 222749 2011 Sep 6WISE J2357+1227 T6 IRTF/SpeX 1200 HD 210501 2011 Aug 25
Notes. Classification notes: “pec” - peculiar, “sb” - spectral binary, “:” - low S/N, “extremely red” - discussed in Section 4.2.
Table 6New Near-IR Spectroscopy and Spectral Classifications for Other Brown Dwarfs from the Literature
Object Name NIR Sp. Spectrograph Int. Time Tell. Corr. Obs. Date Published DiscoveryType (s) Star (UT) NIR Sp. Type Paper
(1) (2) (3) (4) (5) (6) (7) (8)
WISE J0920+4538 L9 sb? Palomar/TSpec 1440 HD 89239 2012 Jan 7 L4/5 Candidate Aberasturi et al. (2011)ULAS J095047.28+011734.3 T8 Magellan/FIRE 1080 HD 75159 2012 May 5 T8 Leggett et al. (2012)WISE J1246−3139 T1 Palomar/TSpec 1440 HD 109134 2012 Jan 7 IR Source Andrei et al. (2011)LHS 2803B T5.5 IRTF/SpeX 1440 HD 134013 2012 May 13 T5.5 Deacon et al. (2012)BD +01◦ 2920B T8 Magellan/FIRE 1440 HD 113147 2012 May 5 T8p Pinfield et al. (2012)WISE J1449+1147 T5 pec Palomar/TSpec 3600 HD 131951 2011 May 12 T7 Candidate Scholz (2010)
T5 pec Gemini/GNIRS 2400 HD 147295 2011 Jul 4 . . . . . .
PSO J226.2599−28.8959 T2: Palomar/TSpec 2400 HD 133652 2011 May 13 T1.5 Deacon et al. (2011)VHS J154352.78−043909.6 T5: IRTF/SpeX 720 HD 148968 2011 Aug 25 T4.5 Lodieu et al. (2012)PSO J246.4222+15.4698 T4.5: Palomar/TSpec 2400 HD 145122 2011 May 13 T4.5 Deacon et al. (2011)PSO J247.3273+03.5932 T2 Palomar/TSpec 2400 HD 140775 2011 May 13 T2 Deacon et al. (2011)WISE J1717+6129 T8 Gemini/GNIRS 2400 HD 199217 2011 Jun 14 T8: Kirkpatrick et al. (2011)WISE J1809+3838 T7.5 IRTF/SpeX 1800 HD 174567 2011 Jul 28 T7 Luhman et al. (2012)WISE J2342+0856 T6.5 IRTF/SpeX 1920 HD 210501 2011 Sep 11 T7 Candidate Scholz (2010)WISE J2344+1034 T9 Gemini/GNIRS 6600 HD 222749 2011 Jun 15 T9: Kirkpatrick et al. (2011)
Notes. Classification notes: “pec” - peculiar, “sb?” - possible spectral binary “:” - low S/N.
detail in Kirkpatrick et al. (2011, 2012). The analysis byKirkpatrick et al. (2012) of the low-mass end of the field browndwarf mass function used objects observed prior to 2012 May1 (UT) and spectral types for WISE J152305.10+312537.6,
WISE J180901.07+383805.4, WISE J201404.13+042408.5,and WISE J201920.76−114807.5 have been adjusted by halfspectral types in this paper. An improved spectrum of theT9 dwarf WISE J033515.01+431045.1 has increased the
14

The Astrophysical Journal Supplement Series, 205:6 (49pp), 2013 March Mace et al.
Figure 3. WISE W1 − W2 vs. W2 − W3 color–color diagram. Same symbolsas in Figure 1. Interlopers are marked by black x’s and limits. The dotted lineidentifies our W1 − W2 > 0.96(W2 − W3) − 0.96 selection criterion.
(A color version of this figure is available in the online journal.)
precision of the spectral type provided by Kirkpatrick et al.(2012).
No changes were made in our procedures for spectra acquiredwith SpeX (Rayner et al. 2003) at NASA’s Infrared TelescopeFacility (IRTF), the Triple Spectrograph (TSpec; Herter et al.2008) at Palomar Observatory, or the Wide Field Camera 3(WFC3; Kimble et al. 2008) onboard the Hubble SpaceTelescope (HST). Non-peculiar T dwarf spectra from SpeX andTSpec are sorted by spectral type (see Section 4.1 for clas-sification procedure) and shown in Figures 9 and 10, respec-tively. Figure 11 shows the WFC3 confirmed T9.5 dwarf WISEJ154214.00+223005.2.
We spectroscopically confirmed seven of our candidatesemploying the Gemini Near-InfraRed Spectrograph (GNIRS;Elias et al. 2006) at the Gemini-North Telescope on MaunaKea, HI. We used the cross-dispersed mode with the 32 linesmm−1 grating and a 1′′ wide slit which provided an R of 540 overthe 0.8–2.5 μm wavelength range. A series of 300 s exposureswere obtained at two positions along the 7′′ long slit. An A0 Vstandard star was obtained either before or after each sciencetarget for telluric correction and flux calibration purposes. Thedata were reduced with a modified version of the Spextooldata reduction package (Cushing et al. 2004). The raw frameswere first cleaned of fixed patterns using the cleanir.pyroutine provided by Gemini Observatory. A normalized flat-field image was then generated using the nightly calibrationframes. Pairs of images taken at two different positions alongthe slit were then pair-subtracted and flat-fielded. The spectra
Figure 4. J − H color vs. spectral type. Same symbols as in Figure 1. Aturnaround in the J − H color at T7 ± 1 is seen here, but it is tentative based onthe large dispersion and uncertainties in our photometry.
(A color version of this figure is available in the online journal.)
were then extracted after subtracting off residual backgroundand wavelength calibrated using the night sky OH emissionlines. The raw spectra were corrected for telluric absorptionusing the spectra of the associated A0 V standard star and thetechnique described in Vacca et al. (2003). Finally the spectrafrom the individual orders were merged to produce a continuous0.8–2.4 μm spectrum. The GNIRS spectra of our new T dwarfsare shown in Figure 10 and are colored blue to differentiate themfrom the other instruments.
Since the publication of Kirkpatrick et al. (2011), the reduc-tion procedure has changed for spectra from the Folded-portInfrared Echellette (FIRE; Simcoe et al. 2008, 2010) instrumentat the 6.5 m Walter Baade Telescope on Cerro Manqui at theLas Campanas Observatory, Chile. FIRE reductions in this pa-per make use of the FIREHOSE package for low-dispersiondata following the procedure in the online “cookbook.”21 TheFIREHOSE package uses NeAr arc lines for the calibrator, andOH sky emission lines for target wavelength solutions. For ourfaintest objects, pair subtraction of the 2-D spectra prior to in-sertion into the pipeline greatly improved the accuracy of thebspline sky-line fitting procedure. Although the automated con-tinuum fitting worked well for most of our targets, the faintsources required manual selection of the continuum positionwhen sky-lines were poorly subtracted. Spectra were extractedusing the optimal spectral extraction process, where an iterative,local background model is fit to improve estimates of the skyflux for subtraction. The combined spectrum was then correctedfor telluric absorption and flux calibrated using the observations
21 See http://www.mit.edu/people/rsimcoe/FIRE/ob_data.htm for details.
15

The Astrophysical Journal Supplement Series, 205:6 (49pp), 2013 March Mace et al.
Figure 5. J − W2 color vs. spectral type. Same symbols as in Figure 1.
(A color version of this figure is available in the online journal.)
Figure 6. H − W2 color vs. spectral type. Same symbols as in Figure 1.
(A color version of this figure is available in the online journal.)
Figure 7. Spitzer ch1 − ch2 vs. spectral type. Same symbols as in Figure 1.These colors can nearly be fit by a straight line, but the early-type T dwarfs areall bluer than the fit.
(A color version of this figure is available in the online journal.)
of an A0 V star and the technique described in Vacca et al. (2003)and the XTELLCOR program from SpeXtool (see Cushing et al.2004). FIRE spectra are presented in Figure 10 and are coloredred to differentiate them from the other instruments.
Observations with the Near-Infrared Spectrometer(NIRSPEC; McLean et al. 1998, 2000) at the 10 m W. M. KeckObservatory on Mauna Kea, HI, were made with slit widthsof 0.′′38, 0.′′57, or 0.′′76 to reduce slit-loss for specific seeingconditions. These slit widths result in spectral resolutions at1.27 μm of R ∼ 2250, 1500, and 1100, respectively. Afterbeing confirmed in our J-band (N3) observations, two of ournew T dwarfs were observed with the H-band (N5) filter witha 0.′′76 slit (R ∼ 1400 at 1.58 μm). Observations from multi-ple epochs used the same instrument configurations and werecombined into a single spectrum. Data reduction made use ofthe publicly available REDSPEC package, with modificationsto remove residuals from the sky-subtracted pairs prior to 1-Dspectral extraction. Normalized Keck/NIRSPEC J-band spectraare shown in Figure 12, and objects with both J- and H-bandobservations are shown in Figure 13. The H-band spectra werescaled relative to the J-band data using the ratio of peak fluxesproduced by REDSPEC (McLean et al. 2003).
4. T DWARF SPECTRAL ANALYSIS
After collecting near-IR spectra for each candidate we deter-mined spectral types through comparison to the spectral stan-dards (Burgasser et al. 2006b; Cushing et al. 2011). Some of theobjects are noteworthy for their peculiarity. Fourteen of our can-didates have been published by others since we first identified
16

The Astrophysical Journal Supplement Series, 205:6 (49pp), 2013 March Mace et al.
Figure 8. Spitzer ch1 − ch2 vs. WISE W1 − W2 color–color diagram. Samesymbols as in Figure 1. Interlopers are marked by black x’s and limits.
(A color version of this figure is available in the online journal.)
or confirmed them, and we discuss each one individually. For allthe T dwarfs presented here and in Kirkpatrick et al. (2011), aswell as the Y dwarfs from Cushing et al. (2011) and Kirkpatricket al. (2012), we derive spectral indices using the median fluxmethod.
4.1. Spectral Classification
We derived the spectral types for each of our near-IR spectraby visual comparison to the T0-to-T8 spectral standards ofBurgasser et al. (2006b) and the T9 and Y0 standards definedby Cushing et al. (2011). Classifications are based on thecomplete near-infrared flux when it is available. Normalizationat ∼1.27 μm makes the J-band morphology the easiest tocompare to the standards and emphasizes peculiarities in theY, H, and K bands. Half spectral types are assigned wherethe spectrum falls consistently between two adjacent spectralstandards. In cases where the spectrum deviates from thestandards in a way that is inconsistent with the spectral sequence(e.g., the J band is narrower than a T7 and wider than a T8, but theH- and K-band fluxes are consistent with a T6) we have identifiedthese objects as peculiar. We identify spectral types of low S/Nspectra with “:” to indicate that they are more uncertain than thestandard ±0.5 type uncertainty. The extremely red brown dwarfsdefy classification and are discussed in detail in Section 4.2. Ourbinary candidates are given spectral types and marked as “sb” todenote that they are peculiar and best matched with combinedspectral templates. Assigned spectral types for all the objects inTable 2 are listed in column 2 of Tables 5 and 6.
4.2. Are the Extremely Red Brown Dwarfs L or T Type?
The T dwarf spectral standards from Burgasser et al. (2006b)were chosen for their progressively stronger H2O and CH4absorption features throughout the near-infrared. It is the CH4features in T dwarfs like the prototype Gl 229B (Geballe et al.1996) that makes these objects stand apart from L dwarfs.Kirkpatrick et al. (2010) outlined the procedure for defininga near-infrared L dwarf sequence that varies smoothly betweenspectral types and is tied closely with the optical spectral types.For this L dwarf sequence, spectra are normalized at the J-bandflux peak (∼1.27 μm) and the type is determined from onlythe 0.9–1.4 μm spectral shape. From this initial classification,the spectral morphology from 1.4–2.5 μm identifies the sourceas either “red” or “blue” relative to the spectral standard.Based on these systems, we have identified three objects(WISE J064205.58+410155.5, WISE J075430.95+790957.8,and WISE J173859.27+614242.1) that defy classification.
As the number of red L dwarfs with near-IR spectra has in-creased, classification and physical interpretation of the spectrahas become more complicated. Many of the known red L dwarfsare early-type and have accompanying optical spectra to facili-tate classification and analysis (Looper et al. 2008; Kirkpatricket al. 2006, 2010). At later spectral types, L dwarf J − K col-ors redden by nearly 1.5 mag relative to L0’s (as cloud opacityincreasingly dominates at shorter wavelengths) and the red Ldwarfs mark the upper boundary of these colors (Gizis et al.2012, Figure 4). Recently, as a result of 2MASS proper motionsurveys and the WISE mission, the sample of red, late-type Ldwarfs has been expanded (Kirkpatrick et al. 2011; Gizis et al.2012). Since the reddest L dwarfs are a few magnitudes fainterat visible wavelengths, high-quality optical spectra of these ob-jects are rare.
Infrared spectra of red L dwarfs are primarily influenced bytemperature, metallicity, and gravity differences, but also bypossible binarity and cloud morphology. Looper et al. (2008)discuss the influence of low surface gravity and high metal-licity on reddening near-IR colors, and the unlikely reddeningfrom binarity and interstellar extinction. Allers et al. (2010,Figure 3) show how dust and low surface gravity alters near-IRspectra for adjacent spectral types. Other extremely red ob-jects, like 2MASS J035523.37+113343.7 (Faherty et al. 2013),2MASS 1207b (Patience et al. 2010; Barman et al. 2011a) andthe HR 8799 planets (Bowler et al. 2010; Barman et al. 2011b;Marley et al. 2012) have low surface gravity, appear to be dusty,resemble the L dwarf standards, and lack the methane featuresof T dwarfs. Gizis et al. (2012) present an extremely red Ldwarf (WISEP J004701.06+680352.1) that they can best clas-sify as an L7.5pec based on rough comparison to the spectralstandards and other red L dwarfs in the literature, but they alsodiscuss the difficulty in determining spectral types and estimat-ing surface gravities for such red sources, which may not bevery young. The extremely red objects shown in this paper donot show the “peakiness” associated with youth, but instead dis-play a broader plateau in the H band, and are most similar toWISEP J0047+6803 and 2MASSW J2244316+204343 (Dahnet al. 2002; McLean et al. 2003; Looper et al. 2008).
WISE J0754+7909 is the least red of the three new objects.Figure 14 shows the Palomar/TSpec spectrum of this objectalong with the L9 and T2 spectral standards. Comparison tothe L9 standard produces the best match to the integratedflux, but poorly matches the H2O and CH4 absorption depths.Classification based solely on the J-band peak, as was doneby Kirkpatrick et al. (2010), pushes the classification of this
17

The Astrophysical Journal Supplement Series, 205:6 (49pp), 2013 March Mace et al.
(a) (b)
(c)
Figure 9. IRTF/SpeX spectra of confirmed WISE brown dwarfs with spectral types from T0.5 to T8.5. Spectra have been normalized at 1.27 μm and offset vertically.
18

The Astrophysical Journal Supplement Series, 205:6 (49pp), 2013 March Mace et al.
(a)(b)
(c)
Figure 10. Other spectra of confirmed WISE brown dwarfs with spectral types from T2 to T9.5. Spectra have been normalized at 1.27 μm and offset vertically.Palomar/TSpec spectra are shown in black, Magellan/FIRE spectra in red, and Gemini/GNIRS spectra in blue.
(A color version of this figure is available in the online journal.)
19
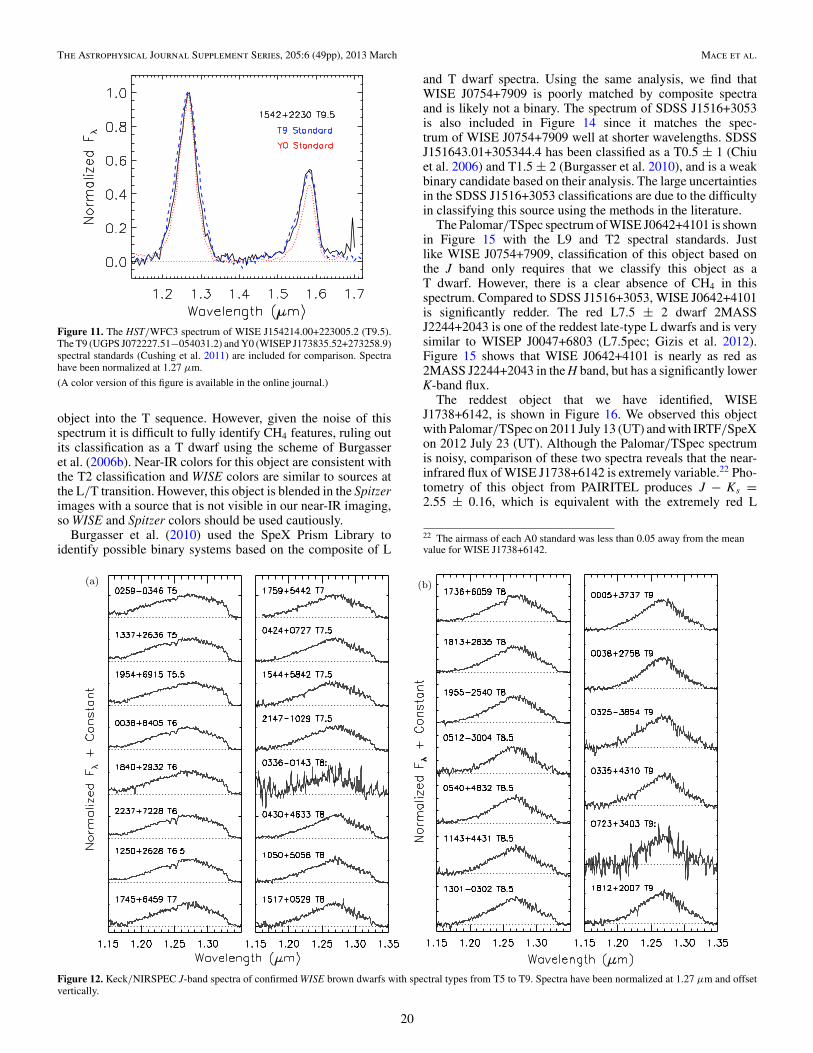
The Astrophysical Journal Supplement Series, 205:6 (49pp), 2013 March Mace et al.
Figure 11. The HST/WFC3 spectrum of WISE J154214.00+223005.2 (T9.5).The T9 (UGPS J072227.51−054031.2) and Y0 (WISEP J173835.52+273258.9)spectral standards (Cushing et al. 2011) are included for comparison. Spectrahave been normalized at 1.27 μm.
(A color version of this figure is available in the online journal.)
object into the T sequence. However, given the noise of thisspectrum it is difficult to fully identify CH4 features, ruling outits classification as a T dwarf using the scheme of Burgasseret al. (2006b). Near-IR colors for this object are consistent withthe T2 classification and WISE colors are similar to sources atthe L/T transition. However, this object is blended in the Spitzerimages with a source that is not visible in our near-IR imaging,so WISE and Spitzer colors should be used cautiously.
Burgasser et al. (2010) used the SpeX Prism Library toidentify possible binary systems based on the composite of L
and T dwarf spectra. Using the same analysis, we find thatWISE J0754+7909 is poorly matched by composite spectraand is likely not a binary. The spectrum of SDSS J1516+3053is also included in Figure 14 since it matches the spec-trum of WISE J0754+7909 well at shorter wavelengths. SDSSJ151643.01+305344.4 has been classified as a T0.5 ± 1 (Chiuet al. 2006) and T1.5 ± 2 (Burgasser et al. 2010), and is a weakbinary candidate based on their analysis. The large uncertaintiesin the SDSS J1516+3053 classifications are due to the difficultyin classifying this source using the methods in the literature.
The Palomar/TSpec spectrum of WISE J0642+4101 is shownin Figure 15 with the L9 and T2 spectral standards. Justlike WISE J0754+7909, classification of this object based onthe J band only requires that we classify this object as aT dwarf. However, there is a clear absence of CH4 in thisspectrum. Compared to SDSS J1516+3053, WISE J0642+4101is significantly redder. The red L7.5 ± 2 dwarf 2MASSJ2244+2043 is one of the reddest late-type L dwarfs and is verysimilar to WISEP J0047+6803 (L7.5pec; Gizis et al. 2012).Figure 15 shows that WISE J0642+4101 is nearly as red as2MASS J2244+2043 in the H band, but has a significantly lowerK-band flux.
The reddest object that we have identified, WISEJ1738+6142, is shown in Figure 16. We observed this objectwith Palomar/TSpec on 2011 July 13 (UT) and with IRTF/SpeXon 2012 July 23 (UT). Although the Palomar/TSpec spectrumis noisy, comparison of these two spectra reveals that the near-infrared flux of WISE J1738+6142 is extremely variable.22 Pho-tometry of this object from PAIRITEL produces J − Ks =2.55 ± 0.16, which is equivalent with the extremely red L
22 The airmass of each A0 standard was less than 0.05 away from the meanvalue for WISE J1738+6142.
(a) (b)
Figure 12. Keck/NIRSPEC J-band spectra of confirmed WISE brown dwarfs with spectral types from T5 to T9. Spectra have been normalized at 1.27 μm and offsetvertically.
20
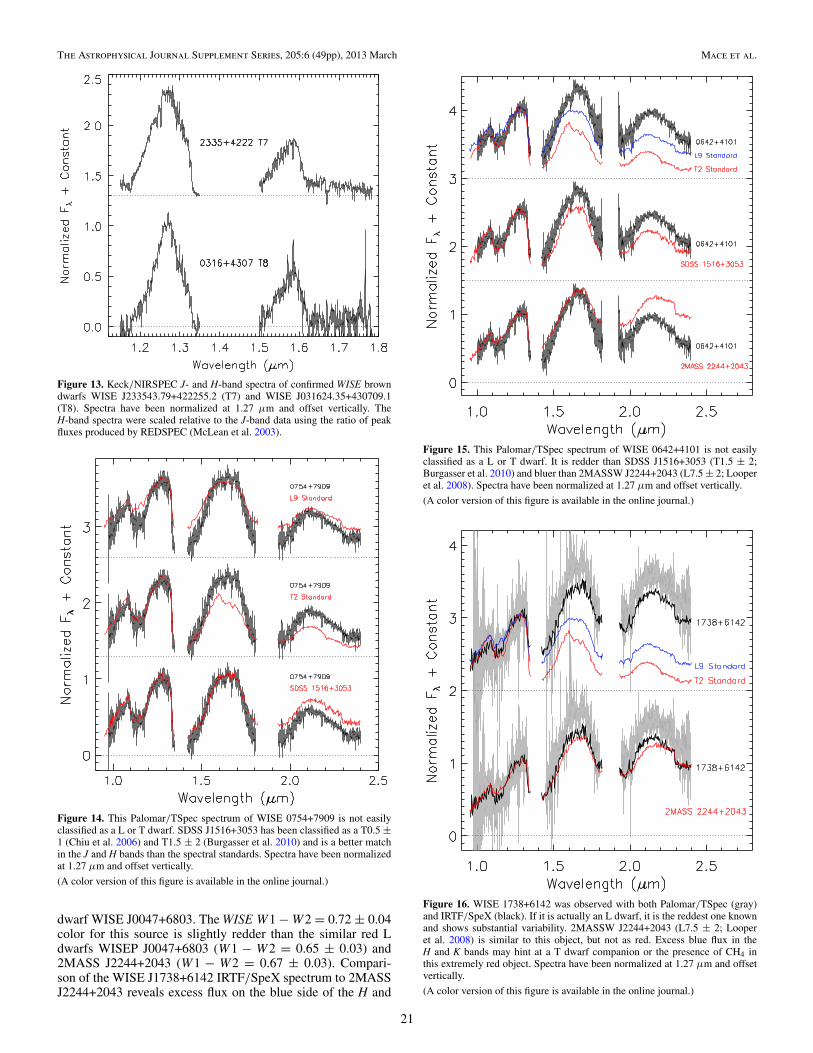
The Astrophysical Journal Supplement Series, 205:6 (49pp), 2013 March Mace et al.
Figure 13. Keck/NIRSPEC J- and H-band spectra of confirmed WISE browndwarfs WISE J233543.79+422255.2 (T7) and WISE J031624.35+430709.1(T8). Spectra have been normalized at 1.27 μm and offset vertically. TheH-band spectra were scaled relative to the J-band data using the ratio of peakfluxes produced by REDSPEC (McLean et al. 2003).
Figure 14. This Palomar/TSpec spectrum of WISE 0754+7909 is not easilyclassified as a L or T dwarf. SDSS J1516+3053 has been classified as a T0.5 ±1 (Chiu et al. 2006) and T1.5 ± 2 (Burgasser et al. 2010) and is a better matchin the J and H bands than the spectral standards. Spectra have been normalizedat 1.27 μm and offset vertically.
(A color version of this figure is available in the online journal.)
dwarf WISE J0047+6803. The WISE W1 − W2 = 0.72 ± 0.04color for this source is slightly redder than the similar red Ldwarfs WISEP J0047+6803 (W1 − W2 = 0.65 ± 0.03) and2MASS J2244+2043 (W1 − W2 = 0.67 ± 0.03). Compari-son of the WISE J1738+6142 IRTF/SpeX spectrum to 2MASSJ2244+2043 reveals excess flux on the blue side of the H and
Figure 15. This Palomar/TSpec spectrum of WISE 0642+4101 is not easilyclassified as a L or T dwarf. It is redder than SDSS J1516+3053 (T1.5 ± 2;Burgasser et al. 2010) and bluer than 2MASSW J2244+2043 (L7.5 ± 2; Looperet al. 2008). Spectra have been normalized at 1.27 μm and offset vertically.
(A color version of this figure is available in the online journal.)
Figure 16. WISE 1738+6142 was observed with both Palomar/TSpec (gray)and IRTF/SpeX (black). If it is actually an L dwarf, it is the reddest one knownand shows substantial variability. 2MASSW J2244+2043 (L7.5 ± 2; Looperet al. 2008) is similar to this object, but not as red. Excess blue flux in theH and K bands may hint at a T dwarf companion or the presence of CH4 inthis extremely red object. Spectra have been normalized at 1.27 μm and offsetvertically.
(A color version of this figure is available in the online journal.)
21

The Astrophysical Journal Supplement Series, 205:6 (49pp), 2013 March Mace et al.
K bands, possibly hinting at the presence of a T dwarf secondary.Since the red L dwarf phenomenon is not entirely understood,having a coeval T dwarf companion with similar metallicity orlow gravity indicators will help reveal the cause of the cloudi-ness in the L dwarfs, should any of these extremely red objectsprove to be an L+T binary.
Although gravity, metallicity, and temperature changes arethe primary variables in modeling these red objects, the vari-ability seen in WISE J1738+6142 hints at considerably rapidchanges in atmospheric conditions. If we assume that the sourceof reddening is common to all these objects, then surface grav-ity and metallicity are not likely the mechanisms at work. Theproper motions of these three objects, determined by compar-ing 2MASS and WISE coordinates [WISE J0642+4101 (0.′′37 ±0.′′03 yr−1), WISE J0754+7909 (0.′′43 ± 0.′′04 yr−1), and WISEJ1738+6142 (0.′′28 ± 0.′′04 yr−1)] are consistent with the redL dwarfs from Kirkpatrick et al. (2010) that are likely part ofan older field population. This is inconsistent with either highmetallicity or low gravity. Although analysis of the underlyingphysical mechanisms will require detailed analysis and model-ing of higher resolution optical and near-IR spectroscopy, iden-tifying companions to these red objects and disentangling theirspectral features are good initial tests. We believe that furtheranalysis (i.e., optical spectroscopy, high-resolution imaging, andtime domain observations) are warranted before final classifi-cations are made for these extremely red objects at the L/Ttransition.
4.3. Comments on Interesting T Dwarf Discoveries
In the following subsection we discuss the peculiar objects in-dividually, along with noteworthy objects that warrant separatediscussion.
4.3.1. WISE J0336−0143—T8
This object is a clear outlier in Figure 7 (ch1 − ch2 =2.64 ± 0.06) and is undetected in the WISE W1 filter (W1−W2> 3.42). These colors are more consistent with a Y dwarfthan a T8, but the Keck/NIRSPEC J-band spectrum is broad.WISE J0336−0143 may be a T+Y binary, with the Y dwarfcontributing more flux at the WISE passbands than in the near-IRbands. Follow-up photometry and broader near-IR spectroscopyof this source are warranted.
4.3.2. WISE J0413−4750—T9
The A nod position of the pair subtracted 2-D spectra forthis source was contaminated by a galaxy. The spectrum of thegalaxy was extracted from the B-position images and fit with aline. This linear fit was then subtracted from the final extractedspectrum of WISE J0413−4750, which is shown in Figure 10.
4.3.3. WISE J0629+2418—T2 sb
The IRTF/SpeX spectrum for this object is presented inFigure 17 along with the T2 standard, which is the best overallmatch to the CH4 and H2O absorption troughs. Relative to theT2 standard, the H band is wider and displays greater CH4absorption redward of the flux peak and the K-band flux is high.Using the statistical method described by Burgasser et al. (2010)we identify WISE J0629+2418 as a strong binary candidatewith a L7 ± 1 primary and T5.5 ± 0.5 secondary (ΔJMKO =0.47 ± 0.28, ΔHMKO = 1.67 ± 0.30). The best composite matchto WISE J0629+2418 is also shown in Figure 17.
4.3.4. WISE J1523+3125—T6.5 pec
Figure 18 shows the Gemini/GNIRS spectrum for this object.Comparison to the T6 standard produces the best match to theH-band flux, while the J band is better matched by the T7standard. The Y- and K-band fluxes are inconsistent with thestandards. These features are similar to the metal-poor T dwarfs2MASSI J0937347+293142 (T6pec; Burgasser et al. 2002) andBD +01◦ 2920B (T8pec; Pinfield et al. 2012). However, we alsoobserved BD +01◦ 2920B (Section 4.4.5) and find that, otherthan a suppressed K band, it matches the T8 standard well andwe do not classify it as peculiar.
4.3.5. WISE J1542+2230—T9.5
The HST/WFC3 spectrum for this object is shown inFigure 11, compared to the T9 and Y0 spectral standardsfrom Cushing et al. (2011). WISE J1542+2230 has a measuredF140W(Vega) magnitude of 20.3. Located 2.′′0 west is a neigh-bor that has a measured F140W(Vega) magnitude of 22.8. Theslitless grism image of this field revealed that the neighbor hasa flux peak coincident with the H-band flux peak in cool browndwarfs, however we detect no flux in the J-band opacity win-dow at 1.27 μm. Additional high-resolution images of WISEJ1542+2230 were obtained using the Keck II LGS-AO system(Wizinowich et al. 2006; van Dam et al. 2006) with NIRC2on 2012 April 14 (UT). Very good seeing (≈0.′′3) and clearskies allowed us to use the relatively faint (R = 18.5) USNO-Bstar 1124-0287738 (Monet et al. 2003) as the tip-tilt referencestar. Observations were obtained in the MKO H filter with thewide camera (nominal plate scale 40 mas pixel−1) on NIRC2.Twenty-one frames with durations of 120 s each were collectedusing a 3 point dither pattern that was repeated seven timeswith position offsets 1.′′5–5′′. The images were dark subtracted,flat-fielded, shifted to a common grid, and median averaged tomake a single mosaic image with a total exposure time of 42minutes in the central region. From this imaging we measuredthe proper motion of WISE J1542+2230 to be μα = −0.82 ±0.07 arcsec yr−1 and μδ = −0.41 ± 0.06 arcsec yr−1, while theneighbor remained stationary, thus ruling out binarity.
4.3.6. WISE J1730+4207—T0 sb
This object’s spectrum is very similar to WISE 0629+2418(Section 4.3.3), with the integrated flux most similar to the T0standard (see Figure 17). This source is matched well by acomposite of L7.5 ± 1 and T3 ± 1 spectra. With ΔJMKO =−0.31 ± 0.27 and ΔHMKO = 0.38 ± 0.36, this system islikely a flux-reversal binary. The best composite match toWISE J1730+4207 is also shown in Figure 17, and is wellwithin the uncertainties of the average fit L7.5+T3.
4.3.7. WISE J2014+0424—T6.5 pec
Much like WISE J1523+3125 (Section 4.3.4), comparison tothe T6 standard produces the best match to the H-band flux,while the J band is better matched by the T7 standard. TheY- and K-band fluxes are inconsistent with the standards.Figure 18 shows the Gemini/GNIRS spectrum for this object.
4.4. Comments on Known and Candidate BrownDwarfs in the Literature
Some of our candidates were identified and/or confirmed butsubsequently published by others as independent discoveries.Table 6 lists these objects along with their discovery papers and
22

The Astrophysical Journal Supplement Series, 205:6 (49pp), 2013 March Mace et al.
1.0 1.2 1.4 1.6 1.8 2.0 2.2 2.4Wavelength (μm)
0.0
0.2
0.4
0.6
0.8
1.0
1.2
Nor
mal
ized
Fλ
WISE J0629+24181044+0429 L7.10325+0425 T5.4
χ2 = 1.07
1.0 1.2 1.4 1.6 1.8 2.0 2.2 2.4Wavelength (μm)
0.0
0.2
0.4
0.6
0.8
1.0
1.2
Nor
mal
ized
Fλ
WISE J1730+42071044+0429 L7.11750+1759 T3.2
χ2 = 2.25
1.0 1.2 1.4 1.6 1.8 2.0 2.2 2.4Wavelength (μm)
0.0
0.2
0.4
0.6
0.8
Nor
mal
ized
Fλ
WISE J0920+45381043+1213 L8.11254-0122 T2.1
χ2 = 11.8
Figure 17. Binary candidates identified using the method of Burgasser et al. (2010). The left side shows the best matching spectral standard and the right side showsthe best composite spectrum (green), along with the constituent templates. Spectra have been normalized at 1.27 μm and offset vertically.
(A color version of this figure is available in the online journal.)
previous spectral classifications. Spectra for these objects areshown in Figure 19 unless noted otherwise.
4.4.1. WISE J0920+4538—L9 sb?
Aberasturi et al. (2011) performed a cross correlation ofthe 2MASS Point Source, SDSS Data Release 7, and WISE
Preliminary Release Catalogs to identify six brown dwarfcandidates based on photometric colors and proper motion.Based on a temperature derived from spectral energy distributionfitting, they estimated the spectral type of this object as L4 orL5. However, comparison to spectral standards reveals that thisobject is best classified as an L9 and a weak binary candidate.
23

The Astrophysical Journal Supplement Series, 205:6 (49pp), 2013 March Mace et al.
Figure 18. Spectra of peculiar early-type T dwarfs, shown in black, alongwith spectral standards. Two different observations of the peculiar T5,WISE J1449+1147, from Gemini/GNIRS and Palomar/TSpec are shown.Spectra have been normalized at 1.27 μm and offset vertically.
(A color version of this figure is available in the online journal.)
Figure 17 shows the Palomar/TSpec spectrum for this sourceand the best-fitting composite spectrum with a L7.5 ± 1.5primary and a T1.5 ± 1.5 secondary (ΔJMKO = −0.17 ±0.33 and ΔHMKO = 0.22 ± 0.33). The composite fit to WISEJ0920+4538 is highly uncertain, but fitting to a single objectspectrum is also a poor fit and binarity may be the source ofthe discrepant photometric colors and spectral features of thissource.
4.4.2. ULAS J095047.28+011734.3—T8
Photometry, and a T8 spectral type, for this object werereported by Leggett et al. (2012). Our Magellan/FIRE spectrumfor this source is consistent with the T8 standard, but displaysa slightly higher flux in the Y and H band, and is slightlysuppressed in the K band. However, these deviations are withinour noise estimates and so we do not classify this object aspeculiar.
4.4.3. WISE J1246−3139—T1
This source was first identified in the literature by Andreiet al. (2011) as one of the targets in their parallax program.Based on preliminary photometry they estimated the spectraltype as T1.0. The Palomar/TSpec spectrum for this source isshown in Figure 19 and we classify this object as a T1.
4.4.4. LHS 2803B—T5.5
This wide separation, common proper motion companion tothe M4.5 ± 0.5 dwarf LHS 2803 was reported by Deacon et al.(2012) and classified as a T5.5. We produce the same T5.5classification from our IRTF/SpeX spectrum.
(a) (b)
Figure 19. Spectra of previously identified T dwarfs from the literature. Spectra have been normalized at 1.27 μm and offset vertically.
24

The Astrophysical Journal Supplement Series, 205:6 (49pp), 2013 March Mace et al.
4.4.5. BD +01◦ 2920B—T8
Pinfield et al. (2012) identify BD +01◦ 2920B as a T8pecdwarf companion to BD +01◦ 2920 (HIP 70319), a metal-poor([Fe/H] = −0.38 ± 0.06) G1 dwarf at a distance of 17.2 pc. Weobserved BD +01◦ 2920B and find that, other than a suppressedK band, the object matches the T8 standard. Since our analysis(Section 4.5.5) shows that suppressed K-band flux is fairlycommon in late-type T dwarfs we do not classify it as peculiar.
4.4.6. WISE J1449+1147—T5 pec
In a search for high proper motion T dwarf candidatesbetween the UKIDSS DR6 and SDSS DR7 databases, Scholz(2010) identified this source as a candidate T7 ± 2 (ULASJ144901.90+114711.3). This object was observed with twoinstruments, Gemini/GNIRS and Palomar/TSpec. Figure 18shows the near-IR spectra from each instrument along with theT5 spectral standard. The J- and H-band flux match the T5standard, but the Y band displays a flux excess and the K band ismore heavily suppressed than the standard. These are the samelow-metallicity features seen in the other peculiar objects.
4.4.7. Repeats from Deacon et al. (2011)
Deacon et al. (2011) identified four new T dwarfs by theirproper motions between the PanSTARRS 1 commissioning dataand 2MASS. We independently identified three of these objectsin the WISE catalog and they were observed prior to publicationby Deacon et al. (2011): PSO J226.2599−28.8959 (WISEJ1505−2853), PSO J246.4222+15.4698 (WISE J1625+1528),and PSO J247.3273+03.5932 (WISE J1629+0335). Our derivedspectral types are consistent with their visually derived types, butwith higher uncertainties. The fourth object observed by Deaconet al. (2011), PSO J201.0320+19.1072, is not included in thepartial sky coverage of the WISE Preliminary Release SourceCatalog and was not observed by us after it was published byDeacon et al. (2011).
4.4.8. VHS J154352.78−043909.6—T5
Our IRTF/SpeX spectrum for this source is fairly low S/N.Lodieu et al. (2012) photometrically selected this object fromthe first data release of the VISTA Hemisphere Survey and theWISE Preliminary Data Release. They derive a spectral type ofT4.5 based on a Magellan/FIRE spectrum of the source, whichis constant with the uncertain T5: classification that we produce.
4.4.9. Repeats from Kirkpatrick et al. (2011)
Two objects from Kirkpatrick et al. (2011), WISEJ1717+6129 and WISE J2344+1034, were observed again withGemini/GNIRS to provide more wavelength coverage than theoriginal Keck/NIRSPEC observations. The classifications fromKirkpatrick et al. (2011) remain unchanged at T8 and T9, re-spectively.
4.4.10. WISE J1809+3838—T7.5
Luhman et al. (2012) used the WISE All-Sky Source Catalogalong with the 2MASS Point Source Catalog to search forproper motion companions. From their IRTF/SpeX spectrumthey produce a type of T7 ± 1, while we classify the object asT7.5 ± 0.5.
4.4.11. WISE J2342+0856—T6.5
This object was also identified by Scholz (2010) as a candidateT7 ± 2 (ULAS J234228.96+085620.1). We classify this objectas a T6.5 based on the IRTF/SpeX spectrum for this object.
4.5. Median Derived Spectral Indices
Burgasser et al. (2006b) defined a number of primary spectralindices that compare the ratio of the integrated J- and H-bandflux peaks to the blueward H2O and redward CH4 absorptionfeatures; H2O−J, CH4−J, H2O−H, and CH4−H. K-band in-dices were also defined, but K-band fluxes reduced by H2 CIAresults in low S/N K-band spectra and highly uncertain K-bandindices. The Y/J and K/J color ratios, defined by Burgasseret al. (2004, 2006a), serve as proxies for the broadband Y − Jand J − K colors. Two additional indices that correlate well withthe T dwarf spectral sequence are WJ (Warren et al. 2007) andNH3−H (Delorme et al. 2008a) which approximate the slope ofthe J- and H-band flux peaks, respectively.
In addition to these indices, we have derived an H/J colorratio as a proxy for the J − H color,
H/J = F1.560−1.600 μm
F1.250−1.290 μm, (1)
and the J-narrow index which is designed to differentiate Ydwarfs from T dwarfs based on their narrow J-band flux peaks,
J − narrow = F1.245−1.260 μm
F1.260−1.275 μm, (2)
where F is the median flux between the subscripted wavelengthsin microns. Figure 20 depicts the wavelengths over which theseindices are derived for a series of Palomar/TSpec spectra fromthis paper.
Although indices in the literature are defined as the integratedflux over the desired wavelength range, this method is unreliablewhen trying to compute indices for low-S/N spectra. Even withmoderate S/N spectra, the flux in the numerator of most indicesis minuscule for late-type T dwarfs and easily modulated bynoisy pixels and poor telluric correction. For this reason, we havecomputed all of our indices over the classical wavelengths butuse the median flux instead of the integrated flux. This methodreduces the scatter in index values as a function of spectral type,especially at later types. Further discussion about using medianfluxes to compute indices is deferred to the Appendix, wherewe also include the integrated flux indices for all our WISEdiscoveries.
We computed the index values using a Monte Carlo model ofeach spectrum. This was accomplished by randomly drawingfrom a normal distribution with means given by the fluxdensities at each wavelength and standard deviations given bythe uncertainty in the flux densities. For 1000 realizations ofeach spectrum, the index is given as the mean and standarddeviation of the distribution of index values. Table 7 lists theindex values for the T and Y dwarf spectra in Kirkpatrick et al.(2011, 2012) and Cushing et al. (2011), the new WISE T dwarfdiscoveries in this paper, and for objects from Table 6.
Spectral indices for the WISE-discovered T and Y dwarfsare shown in Figures 21–25 along with the T0-to-Y0 spectralstandards. Because our sample is mostly T dwarfs later thanT5, indices for the T dwarfs in the SpeX Prism Library (A. J.Burgasser et al., in preparation) are also included in our figures.
25

The Astrophysical Journal Supplement Series, 205:6 (49pp), 2013 March Mace et al.
Figure 20. The wavelengths that define the spectral indices derived in Equations (1)– (10) are depicted for a series of Palomar/TSpec T dwarf spectra.
(A color version of this figure is available in the online journal.)
The average index value and standard deviation for the ∼320unique T and Y dwarfs shown in the figures are listed in Table 8for each half spectral type from T0 to Y0. In the subsectionsbelow we discuss each index in detail.
4.5.1. Primary Indices from Burgasser et al. (2006b)
The primary classification indices for T dwarfs were designedby Burgasser et al. (2002) and Geballe et al. (2002), and thenrevised by Burgasser et al. (2006b). We modify these as followsto incorporate median fluxes:
H2O − J = F1.140−1.165 μm
F1.260−1.285 μm(3)
CH4 − J = F1.315−1.340 μm
F1.260−1.285 μm(4)
H2O − H = F1.480−1.520 μm
F1.560−1.600 μm(5)
CH4 − H = F1.635−1.675 μm
F1.560−1.600 μm. (6)
These indices each show a general trend of having a maximumvalue at the earliest T spectral type and a steady decrease at laterspectral types. However, by the end of the T sequence thesesindices have saturated and are less useful for classification. For Ydwarfs, these indices have highly uncertain and spurious valuessince the numerator in each case has essentially no flux and isdominated by background noise.
4.5.2. WJ and NH3−H Indices for Late-type T Dwarfs
The WJ index was defined by Warren et al. (2007) tocharacterize the J-band width. The original integrated fluxdefinition required that the denominator be multiplied by a factorof two in order to compensate for the larger width numerator.When modified to use the median flux, the index becomes
WJ = F1.180−1.230 μm
F1.260−1.285 μm, (7)
and it is no longer necessary to keep this factor in the denomina-tor. We have chosen to remove it in our analysis. This produces
index values between 0.0 and 0.9, which is consistent with theintegrated flux results in the literature. The flux from 1.180to 1.230 μm gradually and consistently decreases with spectraltype, producing unique index values all the way to the T/Yboundary, as seen by Cushing et al. (2011).
Delorme et al. (2008a) defined the NH3−H index to probethe blue wing of the H band in later T dwarfs. We modify thisindex to incorporate median fluxes,
NH3 − H = F1.530−1.560 μm
F1.570−1.600 μm. (8)
This index is not useful at identifying T dwarfs earlier than T7,but has a large dynamic range for the latest T dwarfs and the Y0s.Cushing et al. (2011) identified the break in the NH3−H indexat Y0, suggesting that near-infrared NH3 absorption begins atthe T/Y boundary. This break is still clearly identified in ourmedian flux index.
4.5.3. Y/J Ratio
The Y/J index was defined by Burgasser et al. (2006b) as apossible tracer of variations in metallicity. We modify this indexto incorporate median fluxes,
Y/J = F1.005−1.045 μm
F1.250−1.290 μm. (9)
The Y-band spectra that we have acquired are from the low-resolution, multi-band spectrographs IRTF/SpeX, Palomar/TripleSpec, Magellan/FIRE, and Gemini/GNIRS. From lower-resolution spectra we derive indices with larger uncertainties.This index shows significant scatter compared to the H/J andK/J ratios and the spectral standards produce a trend withredder Y/J flux ratios relative to the rest of the population.The dispersion in this index is smallest for T4s and later objectsshow the largest scatter.
4.5.4. H/J Ratio
Burgasser et al. (2002) defined a broader version of the H/Jindex that encompasses most of the T dwarf flux contributingto the broadband J − H color, and noted a possible reversal atlater types. It is not one of the indices revised in Burgasser et al.
26

The Astrophysical Journal Supplement Series, 205:6 (49pp), 2013 March Mace et al.
Figure 21. Six spectral indices from Burgasser et al. (2006b), Warren et al. (2007), and Delorme et al. (2008a), computed using the median flux and the integratedflux. The T dwarfs in this paper are marked by red triangles, and the T and Y dwarfs of Kirkpatrick et al. (2011, 2012) and Cushing et al. (2011) are marked as bluehollow circles. Also included are the T dwarfs from the SpeX Prism Library as gray filled circles, and spectral standards as black filled circles.
(A color version of this figure is available in the online journal.)
(2006b) and so we have constructed the H/J index, presentedin Equation (1), employing the wavelengths used by Burgasseret al. (2006b) to define other indices. This index shows a tighttrend with an average dispersion of 0.1 and shows a similar re-versal as the 2MASS J − H colors in Figure 4. As discussed inSection 3.1, the turnaround of the J − H color is evident beforethe T/Y boundary, and appears to occur around T6 ± 1 forthe H/J index. However, Y dwarfs show a significant scatter inH/J. The Y0s break the trend of the T dwarfs, and the H/Jindex drops, possibly due to the onset of NH3 absorption.WISE J182831.08+265037.8 has been typed as � Y2(Kirkpatrick et al. 2012) based on the near-equal heights ofthe J- and H-band flux peaks and has an index value equivalent
to the earliest T dwarfs. This dichotomy of H/J flux ratios hintsat drastically different atmospheric conditions for Y0s and latertype Y dwarfs.
4.5.5. K/J Ratio
The wavelengths used for the K/J ratio were initially definedby Burgasser et al. (2002) to compare the K-band flux peak tothe J-band flux peak, and modified here to incorporate medianfluxes,
K/J = F2.060−2.100 μm
F1.250−1.290 μm. (10)
Models have long predicted dominant H2 CIA of the K-bandflux in cool brown dwarf atmospheres (Saumon et al. 1994,
27

The Astrophysical Journal Supplement Series, 205:6 (49pp), 2013 March Mace et al.
Figure 22. The peak flux ratios defined by Burgasser et al. (2004, 2006b), computed using the median flux instead of the integrated flux. Same symbols as in Figure 21.
(A color version of this figure is available in the online journal.)
Figure 23. Spectral type vs. K/J ratio for the same objects in Figure 22, sortedby spectrograph. The average K/J index for the T5-T9 spectral standards is0.147 ± 0.013, and the 3σ limits are shown here. We find that 54 out of 170(about one third) of T5 or later dwarfs are below this limit, while only 18 out of170 are above this limit.
(A color version of this figure is available in the online journal.)
2012; Marley et al. 1996; Allard et al. 1996) which has beenobservationally verified and is evident in Figure 22. The largedispersion in the late-type T K/J index was pointed out byBurgasser et al. (2006b) and we find that the dispersion is
Figure 24. The J-narrow index for T and Y dwarfs in Figure 22. Undulation inthe T dwarfs is due to changes in the 1.254 μm K i line. Y dwarfs have smallerindices because of a narrowing of the J-band flux peak.
(A color version of this figure is available in the online journal.)
smallest at T4 and flares at both earlier and later types. Althoughthe early-type T dwarf standards fall near the mean of eachspectral bin, the late-type T spectral standards are on the redderside of the mean. Figure 23 shows the K/J indices for T dwarfs,sorted by instrument. We find that the average K/J index for theT5-T9 spectral standards is 0.147 ± 0.013 and only ∼11% (18out of 170; 8 WISE discoveries and 10 from the SpeX PrismLibrary) are redder than the 3σ upper limit. However, 47 of the126 WISE-discovered and 7 of the 44 SpeX Prism Library late-type T dwarfs are below the 3σ lower limit (shown in Figure 23).In total, 54 out of 170, approximately one third, of the T5 orlater dwarfs are blue relative to the standards.
The largest dispersion (∼1.5 mag) in the K/J ratio is in theT7-T8 spectral bins, in which the number of known T dwarfshas been quintupled by WISE. The T dwarf sample prior toWISE peaked at T5 (Kirkpatrick et al. 2011, Figure 28), and
28

The Astrophysical Journal Supplement Series, 205:6 (49pp), 2013 March Mace et al.
Figure 25. The Y/J vs. K/J indices of late-type T dwarfs compared to models. Top: Index values sorted by spectral type. Middle: the Morley et al. (2012) sulfidecloud models (which do not include silicate clouds expected in early-type T dwarfs) are shown for log g = 4, 4.5, 5, 5.5 (solid, dotted, dashed, dot-dashed) and Teff =400 K to 1300 K. Cloudless models are shown in blue, fsed = 5 in orange, and fsed = 4 in red. Bottom: the cloudy (solid lines) and clear (dashed lines) models fromBurrows et al. (2006) with log g = 5 and metallicities of solar and ±0.5 dex with Teff = 800 K to 1700 K. The highest temperature is marked with a square and thelowest temperature is marked with a circle.
(A color version of this figure is available in the online journal.)
WISE discoveries shift this peak to T6, with the number of T8snearly as bountiful. Figure 23 shows that, although the spectralstandards all have similar K/J ratios, the value of the index forlate-type T dwarfs gradually decreases at later types. The smallnumber of late-type T dwarfs in the SpeX Prism Library, and thesteady decrease in the K/J index with spectral type, results in asmaller fraction of blue T dwarfs from the SpeX Prism Library(∼16%) relative to the WISE discoveries (∼37%).
Although ∼32% of the late-type T dwarfs are blue (K bandsuppressed) and ∼11% are red, the current spectral standardsstill provide the best overall match to the bulk of observedspectra. The spectral standards match the mean H/J indices verywell. It is possible that the standards, which were chosen to bebright in order to be easily observed, are also younger. If younger
than the mean of the sample, the standards would generally bemore luminous for their effective temperature (larger), have alower surface gravity (reduced CIA), and be metal-rich. All ofthese factors would result in the redder colors seen in the K/Jindex and bluer Y/J index values. Objects with blue or red K/Jindex values, relative to the J band normalized standards, aremost commonly called peculiar in the literature. Because this isfairly common in our sample, the objects we classify as peculiardeviate from the standards in more than one band.
4.5.6. J-narrow Index
The J-narrow index is defined in Equation (2) and alsopresented in Kirkpatrick et al. (2012). This index was derivedempirically from the spectra presented in this paper in order
29

Th
eA
strophysical
Journ
alSu
pplemen
tSeries,205:6
(49pp),2013M
archM
aceet
al.
Table 7Modified Spectral Indices Based on Median Fluxes
Object Name Instrument NIR Sp. H2O−J CH4−J H2O−H CH4−H WJ NH3−H J-narrowJ2000 Coordinates Type(1) (2) (3) (4) (5) (6) (7) (8) (9) (10)
T and Y Dwarf Standards
SDSS J1207+0244 IRTF/SpeXa T0 0.622 ± 0.005 0.847 ± 0.007 0.622 ± 0.008 0.958 ± 0.006 0.810 ± 0.016 0.864 ± 0.008 0.962 ± 0.008SDSS J0151+1244 IRTF/SpeXa T1 0.654 ± 0.008 0.714 ± 0.015 0.628 ± 0.013 0.954 ± 0.010 0.856 ± 0.020 0.864 ± 0.014 0.955 ± 0.012SDSSp J1254−0122 IRTF/SpeXa T2 0.477 ± 0.008 0.756 ± 0.012 0.476 ± 0.012 0.909 ± 0.010 0.752 ± 0.024 0.778 ± 0.016 0.930 ± 0.0112MASS J1209−1004 IRTF/SpeXa T3 0.415 ± 0.008 0.661 ± 0.014 0.436 ± 0.012 0.715 ± 0.011 0.688 ± 0.024 0.789 ± 0.017 0.897 ± 0.0152MASSI J2254+3123 IRTF/SpeXa T4 0.372 ± 0.005 0.628 ± 0.007 0.377 ± 0.007 0.587 ± 0.008 0.634 ± 0.008 0.766 ± 0.008 0.879 ± 0.0062MASS J1503+2525 IRTF/SpeXa T5 0.242 ± 0.003 0.443 ± 0.011 0.325 ± 0.010 0.412 ± 0.007 0.560 ± 0.012 0.773 ± 0.010 0.885 ± 0.005SDSSp J1624+0029 IRTF/SpeXa T6 0.155 ± 0.002 0.384 ± 0.010 0.278 ± 0.012 0.309 ± 0.007 0.478 ± 0.016 0.740 ± 0.014 0.884 ± 0.0092MASSI J0727+1710 IRTF/SpeXa T7 0.088 ± 0.004 0.304 ± 0.006 0.212 ± 0.014 0.191 ± 0.008 0.426 ± 0.012 0.670 ± 0.019 0.929 ± 0.0132MASSI J0415−0935 IRTF/SpeXa T8 0.042 ± 0.002 0.208 ± 0.004 0.172 ± 0.007 0.109 ± 0.004 0.296 ± 0.012 0.626 ± 0.009 0.904 ± 0.006UGPS J0722−0540 IRTF/SpeX T9 0.041 ± 0.027 0.156 ± 0.026 0.104 ± 0.040 0.086 ± 0.036 0.204 ± 0.052 0.556 ± 0.056 0.862 ± 0.040WISEPA J1738+2732 HST/WFC3 Y0 0.039 ± 0.009 0.052 ± 0.010 0.050 ± 0.011 . . . 0.122 ± 0.028 0.320 ± 0.025 0.839 ± 0.027
T Dwarf Discoveries from Kirkpatrick et al. (2011)
WISE J0008−1739 Keck/NIRSPEC-J T6 0.142 ± 0.033 0.402 ± 0.042 . . . . . . 0.466 ± 0.028 . . . 0.877 ± 0.057WISE J0123+4142 Keck/NIRSPEC-J T7 0.038 ± 0.066 0.282 ± 0.066 . . . . . . 0.418 ± 0.050 . . . 0.849 ± 0.100WISE J0138−0322 IRTF/SpeX T3 0.410 ± 0.008 0.570 ± 0.009 0.539 ± 0.014 0.756 ± 0.010 0.674 ± 0.012 0.858 ± 0.014 0.925 ± 0.012WISE J0148−7202 Magellan/FIRE T9.5 −0.016 ± 0.013 0.076 ± 0.013 0.073 ± 0.015 0.023 ± 0.015 0.124 ± 0.014 0.424 ± 0.024 0.829 ± 0.026WISE J0150+3827 IRTF/SpeX T0 0.665 ± 0.008 0.845 ± 0.010 0.675 ± 0.011 0.975 ± 0.007 0.818 ± 0.010 0.894 ± 0.011 0.927 ± 0.013WISE J0221+3842 Palomar/TSpec T6.5 0.106 ± 0.018 0.256 ± 0.022 0.213 ± 0.031 0.265 ± 0.017 0.346 ± 0.022 0.673 ± 0.034 0.797 ± 0.066WISE J0223−2932 IRTF/SpeX T7.5 0.041 ± 0.009 0.160 ± 0.011 0.139 ± 0.020 0.169 ± 0.014 0.372 ± 0.016 0.689 ± 0.031 0.931 ± 0.015
Keck/NIRSPEC-H T7 . . . . . . 0.216 ± 0.048 0.178 ± 0.027 . . . 0.585 ± 0.038 . . .
WISE J0226−0211 Keck/NIRSPEC-H T7 . . . . . . 0.260 ± 0.063 0.104 ± 0.033 . . . 0.582 ± 0.045 . . .
WISE J0254+0223 IRTF/SpeX T8 0.047 ± 0.004 0.209 ± 0.005 0.175 ± 0.012 0.114 ± 0.006 0.298 ± 0.006 0.627 ± 0.015 0.900 ± 0.008WISE J0305+3954 Palomar/TSpec T6 0.114 ± 0.011 0.351 ± 0.014 0.341 ± 0.016 0.245 ± 0.010 0.420 ± 0.012 0.724 ± 0.017 0.867 ± 0.023WISE J0307+2904 IRTF/SpeX T6.5 0.133 ± 0.043 0.361 ± 0.051 0.316 ± 0.070 0.227 ± 0.060 0.438 ± 0.040 0.822 ± 0.101 0.874 ± 0.057WISE J0313+7807 Palomar/TSpec T8.5 0.125 ± 0.017 0.108 ± 0.012 0.242 ± 0.020 0.147 ± 0.012 0.320 ± 0.012 0.598 ± 0.025 0.906 ± 0.026WISE J0323−6025 Magellan/FIRE T8.5 0.047 ± 0.018 0.170 ± 0.022 0.178 ± 0.021 0.120 ± 0.014 0.260 ± 0.018 0.587 ± 0.030 0.907 ± 0.025WISE J0333−5856 SOAR/OSIRIS T3 . . . 0.558 ± 0.034 0.520 ± 0.021 0.729 ± 0.021 . . . 0.714 ± 0.025 0.905 ± 0.078WISE J0410+1411 IRTF/SpeX T6 0.100 ± 0.036 0.351 ± 0.044 0.268 ± 0.067 0.288 ± 0.055 0.462 ± 0.042 0.742 ± 0.087 0.831 ± 0.048WISE J0448−1935 IRTF/SpeX T5 pec 0.206 ± 0.023 0.469 ± 0.028 0.368 ± 0.049 0.428 ± 0.037 0.588 ± 0.024 0.859 ± 0.059 0.908 ± 0.030WISE J0458+6434 IRTF/SpeX T8.5 0.038 ± 0.016 0.268 ± 0.023 0.136 ± 0.027 0.084 ± 0.026 0.238 ± 0.024 0.471 ± 0.044 0.846 ± 0.026WISE J0500−1223 IRTF/SpeX T8 0.045 ± 0.031 0.206 ± 0.033 0.121 ± 0.049 0.095 ± 0.040 0.332 ± 0.036 0.651 ± 0.070 0.946 ± 0.044WISE J0513+0608 Palomar/TSpec T6.5 0.165 ± 0.006 0.325 ± 0.010 0.282 ± 0.008 0.240 ± 0.007 0.414 ± 0.008 0.707 ± 0.013 0.821 ± 0.012WISE J0525+6739 IRTF/SpeX T6 pec 0.174 ± 0.012 0.368 ± 0.015 0.310 ± 0.032 0.316 ± 0.023 0.482 ± 0.018 0.808 ± 0.038 0.897 ± 0.018WISE J0528−3308 Palomar/TSpec T7 pec 0.009 ± 0.025 0.254 ± 0.019 0.230 ± 0.028 0.210 ± 0.017 0.350 ± 0.016 0.676 ± 0.032 0.842 ± 0.025WISE J0539−1034 Palomar/TSpec T5.5 0.195 ± 0.018 0.373 ± 0.023 0.408 ± 0.027 0.327 ± 0.018 0.484 ± 0.016 0.814 ± 0.029 0.906 ± 0.030WISE J0542−1628 Palomar/TSpec T6.5 0.143 ± 0.007 0.274 ± 0.010 0.230 ± 0.009 0.240 ± 0.008 0.398 ± 0.008 0.694 ± 0.013 0.852 ± 0.012WISE J0611−0410 IRTF/SpeX T0 0.586 ± 0.017 0.727 ± 0.022 0.604 ± 0.021 0.947 ± 0.018 0.776 ± 0.018 0.873 ± 0.020 0.911 ± 0.026WISE J0612−4920 SOAR/OSIRIS T3.5 . . . 0.510 ± 0.057 0.377 ± 0.040 0.684 ± 0.038 . . . 0.749 ± 0.050 0.882 ± 0.131WISE J0612−3036 Palomar/TSpec T6 0.108 ± 0.002 0.312 ± 0.005 0.291 ± 0.003 0.314 ± 0.002 0.446 ± 0.002 0.796 ± 0.005 0.874 ± 0.003WISE J0614+3912 Palomar/TSpec T6 0.137 ± 0.016 0.418 ± 0.020 0.346 ± 0.017 0.301 ± 0.013 0.462 ± 0.014 0.794 ± 0.025 0.889 ± 0.029WISE J0623−0456 IRTF/SpeX T8 0.015 ± 0.030 0.287 ± 0.035 0.178 ± 0.051 0.094 ± 0.039 0.380 ± 0.036 0.722 ± 0.065 0.880 ± 0.044
30

Th
eA
strophysical
Journ
alSu
pplemen
tSeries,205:6
(49pp),2013M
archM
aceet
al.Table 7
(Continued)
Object Name Instrument NIR Sp. H2O−J CH4−J H2O−H CH4−H WJ NH3−H J-narrowJ2000 Coordinates Type(1) (2) (3) (4) (5) (6) (7) (8) (9) (10)
WISE J0625+5646 Palomar/TSpec T6 0.182 ± 0.012 0.310 ± 0.015 0.316 ± 0.016 0.296 ± 0.010 0.418 ± 0.012 0.705 ± 0.018 0.854 ± 0.019WISE J0627−1114 IRTF/SpeX T6 0.162 ± 0.005 0.359 ± 0.007 0.294 ± 0.014 0.310 ± 0.010 0.462 ± 0.008 0.733 ± 0.018 0.871 ± 0.009WISE J0656+4205 IRTF/SpeX T3 0.467 ± 0.012 0.503 ± 0.016 0.491 ± 0.020 0.810 ± 0.018 0.758 ± 0.018 0.851 ± 0.024 0.907 ± 0.021WISE J0744+5628 Palomar/TSpec T8 0.156 ± 0.028 0.256 ± 0.022 0.186 ± 0.038 0.069 ± 0.024 0.380 ± 0.020 0.630 ± 0.044 0.917 ± 0.040WISE J0750+2725 Keck/NIRSPEC-JH T8.5 −0.019 ± 0.016 0.117 ± 0.015 0.239 ± 0.027 0.066 ± 0.008 0.246 ± 0.012 0.576 ± 0.012 0.781 ± 0.021WISE J0751−7634 Magellan/FIRE T9 0.025 ± 0.029 0.119 ± 0.017 0.188 ± 0.041 0.121 ± 0.031 0.148 ± 0.020 0.510 ± 0.048 0.848 ± 0.035WISE J0759−4904 Magellan/FIRE T8 0.034 ± 0.004 0.160 ± 0.007 0.156 ± 0.008 0.122 ± 0.005 0.260 ± 0.008 0.608 ± 0.012 0.889 ± 0.010WISE J0819−0335 IRTF/SpeX T4 0.387 ± 0.006 0.553 ± 0.008 0.387 ± 0.012 0.663 ± 0.010 0.662 ± 0.010 0.781 ± 0.013 0.893 ± 0.011WISE J0821+1443 IRTF/SpeX T5.5 0.203 ± 0.013 0.401 ± 0.021 0.307 ± 0.025 0.385 ± 0.021 0.528 ± 0.022 0.715 ± 0.036 0.893 ± 0.026WISE J0836−1859 Magellan/FIRE T8 pec 0.045 ± 0.017 0.145 ± 0.017 0.154 ± 0.017 0.124 ± 0.012 0.322 ± 0.016 0.606 ± 0.025 0.905 ± 0.021WISE J0857+5604 Palomar/TSpec T8 0.069 ± 0.013 0.150 ± 0.013 0.125 ± 0.018 0.122 ± 0.011 0.296 ± 0.012 0.551 ± 0.023 0.892 ± 0.020WISE J0906+4735 Palomar/TSpec T8 0.065 ± 0.186 0.245 ± 0.092 0.234 ± 0.125 0.125 ± 0.057 0.348 ± 0.074 0.642 ± 0.105 0.912 ± 0.161WISE J0929+0409 Palomar/TSpec T6.5 0.082 ± 0.014 0.244 ± 0.018 0.273 ± 0.022 0.221 ± 0.014 0.364 ± 0.014 0.684 ± 0.026 0.880 ± 0.021WISE J0952+1955 IRTF/SpeX T6 0.159 ± 0.011 0.328 ± 0.014 0.285 ± 0.028 0.346 ± 0.022 0.476 ± 0.018 0.742 ± 0.038 0.915 ± 0.017WISE J1018−2445 Magellan/FIRE T8 0.037 ± 0.005 0.151 ± 0.010 0.163 ± 0.006 0.092 ± 0.004 0.282 ± 0.008 0.613 ± 0.015 0.887 ± 0.008WISE J1019+6529 Palomar/TSpec T6 0.134 ± 0.046 0.331 ± 0.029 0.293 ± 0.044 0.299 ± 0.024 0.472 ± 0.028 0.753 ± 0.045 0.877 ± 0.054
IRTF/SpeX T6 0.126 ± 0.015 0.307 ± 0.020 0.249 ± 0.033 0.326 ± 0.025 0.450 ± 0.022 0.773 ± 0.056 0.887 ± 0.032WISE J1042−3842 Magellan/FIRE T8.5 0.022 ± 0.012 0.147 ± 0.015 0.141 ± 0.014 0.116 ± 0.009 0.294 ± 0.016 0.561 ± 0.021 0.863 ± 0.020WISE J1122+2550 IRTF/SpeX T6 0.139 ± 0.014 0.350 ± 0.017 0.307 ± 0.031 0.234 ± 0.020 0.480 ± 0.022 0.770 ± 0.054 0.897 ± 0.032WISE J1150+6302 Palomar/TSpec T8 0.020 ± 0.013 0.191 ± 0.013 0.133 ± 0.015 0.119 ± 0.011 0.286 ± 0.010 0.604 ± 0.023 0.833 ± 0.019WISE J1217+1626 Palomar/TSpec T9 0.061 ± 0.017 0.083 ± 0.013 0.075 ± 0.022 0.099 ± 0.013 0.232 ± 0.012 0.539 ± 0.027 0.842 ± 0.026WISE J1311+0122 Keck/NIRSPEC-H T9: . . . . . . 0.127 ± 0.038 −0.123 ± 0.012 . . . 0.581 ± 0.015 . . .
WISE J1320+6034 IRTF/SpeX T6.5 0.107 ± 0.009 0.101 ± 0.010 0.350 ± 0.028 0.202 ± 0.017 0.498 ± 0.018 0.842 ± 0.045 0.908 ± 0.017WISE J1322−2340 IRTF/SpeX T8 0.088 ± 0.014 0.293 ± 0.017 0.266 ± 0.026 0.208 ± 0.021 0.366 ± 0.020 0.705 ± 0.037 0.829 ± 0.024WISE J1436−1814 Magellan/FIRE T8 pec 0.061 ± 0.005 0.207 ± 0.009 0.238 ± 0.008 0.161 ± 0.006 0.292 ± 0.008 0.690 ± 0.014 0.855 ± 0.008WISE J1457+5815 IRTF/SpeX T7 0.102 ± 0.011 0.223 ± 0.014 0.257 ± 0.025 0.206 ± 0.017 0.412 ± 0.020 0.736 ± 0.036 0.931 ± 0.024WISE J1506+7027 Palomar/TSpec T6 0.139 ± 0.001 0.336 ± 0.004 0.271 ± 0.003 0.293 ± 0.002 0.436 ± 0.002 0.720 ± 0.005 0.842 ± 0.003
Keck/NIRSPEC-H T6 . . . . . . 0.353 ± 0.016 0.276 ± 0.009 . . . 0.703 ± 0.014 . . .
WISE J1519+7009 Palomar/TSpec T8 0.101 ± 0.200 0.210 ± 0.108 0.181 ± 0.145 0.102 ± 0.069 0.350 ± 0.086 0.654 ± 0.127 0.945 ± 0.178WISE J1612−3420 Keck/NIRSPEC-H T6.5 . . . . . . 0.303 ± 0.022 0.227 ± 0.017 . . . 0.722 ± 0.023 . . .
WISE J1614+1739 Magellan/FIRE T9 0.038 ± 0.031 0.116 ± 0.020 0.107 ± 0.037 0.094 ± 0.024 0.202 ± 0.034 0.513 ± 0.050 0.832 ± 0.032WISE J1617+1807 Magellan/FIRE T8 0.113 ± 0.241 0.167 ± 0.133 0.211 ± 0.110 0.104 ± 0.063 0.336 ± 0.132 0.594 ± 0.108 0.921 ± 0.211WISE J1622−0959 IRTF/SpeX T6 0.177 ± 0.006 0.410 ± 0.009 0.290 ± 0.018 0.328 ± 0.011 0.478 ± 0.012 0.743 ± 0.022 0.866 ± 0.013WISE J1627+3255 IRTF/SpeX T6 0.143 ± 0.005 0.386 ± 0.004 0.279 ± 0.012 0.289 ± 0.007 0.454 ± 0.006 0.746 ± 0.013 0.877 ± 0.006
Keck/NIRSPEC-H T6 . . . . . . 0.372 ± 0.057 0.280 ± 0.035 . . . 0.733 ± 0.049 . . .
WISE J1653+4444 IRTF/SpeX T8 0.035 ± 0.011 0.244 ± 0.016 0.175 ± 0.022 0.160 ± 0.015 0.276 ± 0.018 0.589 ± 0.038 0.867 ± 0.021WISE J1711+3500 IRTF/SpeX T8 −0.009 ± 0.018 0.260 ± 0.025 0.213 ± 0.034 0.181 ± 0.025 0.362 ± 0.026 0.700 ± 0.045 0.900 ± 0.046WISE J1717+6129 Keck/NIRSPEC-JH T8 0.094 ± 0.038 0.174 ± 0.039 0.192 ± 0.042 0.114 ± 0.024 0.288 ± 0.030 0.511 ± 0.030 0.904 ± 0.063WISE J1728+5716 IRTF/SpeX T6 0.136 ± 0.015 0.412 ± 0.021 0.265 ± 0.031 0.284 ± 0.022 0.444 ± 0.024 0.714 ± 0.040 0.871 ± 0.025WISE J1741+2553 Magellan/FIRE T9 0.023 ± 0.071 0.155 ± 0.045 0.123 ± 0.031 0.063 ± 0.019 0.230 ± 0.048 0.578 ± 0.047 0.907 ± 0.069WISE J1804+3117 Keck/NIRSPEC-H T9.5: . . . . . . . . . . . . . . . 0.345 ± 0.042 . . .
WISE J1812+2721 Magellan/FIRE T8.5: 0.042 ± 0.042 0.099 ± 0.033 0.128 ± 0.055 0.188 ± 0.061 0.202 ± 0.030 0.583 ± 0.097 0.930 ± 0.069WISE J1841+7000 Palomar/TSpec T5 0.237 ± 0.016 0.489 ± 0.020 0.436 ± 0.018 0.398 ± 0.010 0.564 ± 0.012 0.818 ± 0.018 0.919 ± 0.019WISE J1852+3537 IRTF/SpeX T7 0.070 ± 0.010 0.235 ± 0.011 0.219 ± 0.025 0.170 ± 0.012 0.382 ± 0.016 0.731 ± 0.029 0.868 ± 0.018WISE J1906+4508 IRTF/SpeX T6 0.184 ± 0.005 0.384 ± 0.006 0.316 ± 0.017 0.333 ± 0.010 0.516 ± 0.008 0.754 ± 0.019 0.907 ± 0.011WISE J1952+7240 Palomar/TSpec T4 0.350 ± 0.005 0.567 ± 0.009 0.384 ± 0.007 0.527 ± 0.006 0.620 ± 0.006 0.788 ± 0.009 0.878 ± 0.009
31
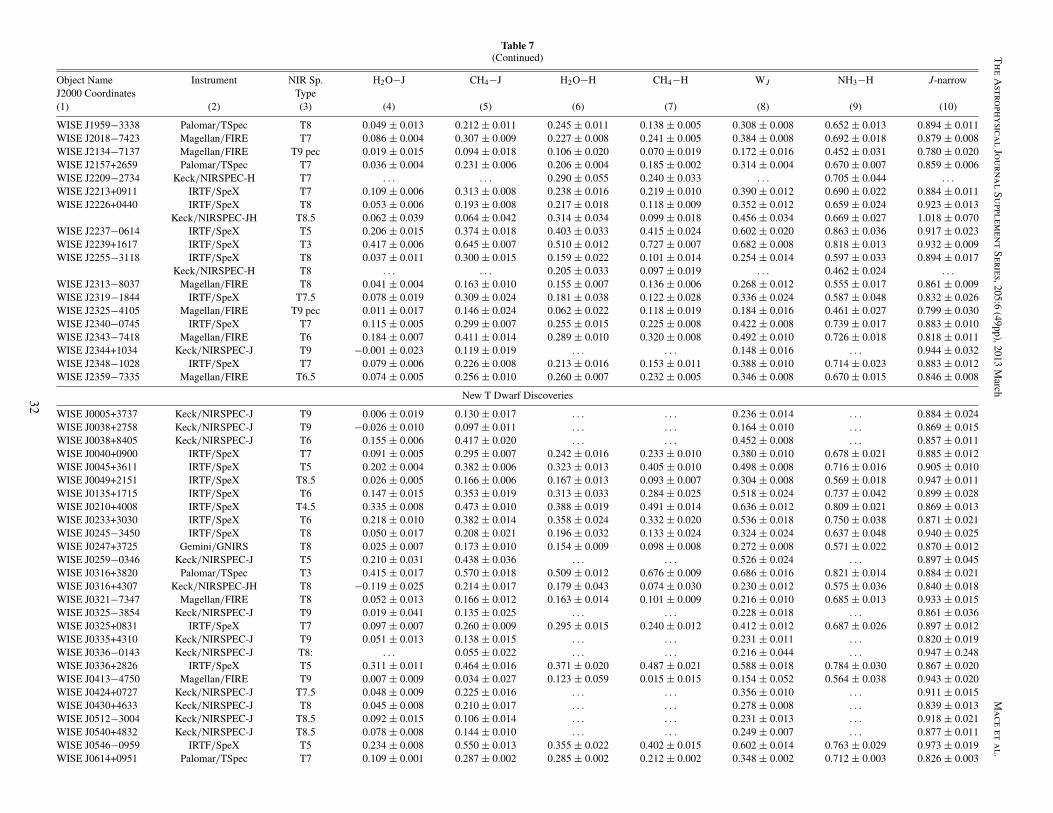
Th
eA
strophysical
Journ
alSu
pplemen
tSeries,205:6
(49pp),2013M
archM
aceet
al.Table 7
(Continued)
Object Name Instrument NIR Sp. H2O−J CH4−J H2O−H CH4−H WJ NH3−H J-narrowJ2000 Coordinates Type(1) (2) (3) (4) (5) (6) (7) (8) (9) (10)
WISE J1959−3338 Palomar/TSpec T8 0.049 ± 0.013 0.212 ± 0.011 0.245 ± 0.011 0.138 ± 0.005 0.308 ± 0.008 0.652 ± 0.013 0.894 ± 0.011WISE J2018−7423 Magellan/FIRE T7 0.086 ± 0.004 0.307 ± 0.009 0.227 ± 0.008 0.241 ± 0.005 0.384 ± 0.008 0.692 ± 0.018 0.879 ± 0.008WISE J2134−7137 Magellan/FIRE T9 pec 0.019 ± 0.015 0.094 ± 0.018 0.106 ± 0.020 0.070 ± 0.019 0.172 ± 0.016 0.452 ± 0.031 0.780 ± 0.020WISE J2157+2659 Palomar/TSpec T7 0.036 ± 0.004 0.231 ± 0.006 0.206 ± 0.004 0.185 ± 0.002 0.314 ± 0.004 0.670 ± 0.007 0.859 ± 0.006WISE J2209−2734 Keck/NIRSPEC-H T7 . . . . . . 0.290 ± 0.055 0.240 ± 0.033 . . . 0.705 ± 0.044 . . .
WISE J2213+0911 IRTF/SpeX T7 0.109 ± 0.006 0.313 ± 0.008 0.238 ± 0.016 0.219 ± 0.010 0.390 ± 0.012 0.690 ± 0.022 0.884 ± 0.011WISE J2226+0440 IRTF/SpeX T8 0.053 ± 0.006 0.193 ± 0.008 0.217 ± 0.018 0.118 ± 0.009 0.352 ± 0.012 0.659 ± 0.024 0.923 ± 0.013
Keck/NIRSPEC-JH T8.5 0.062 ± 0.039 0.064 ± 0.042 0.314 ± 0.034 0.099 ± 0.018 0.456 ± 0.034 0.669 ± 0.027 1.018 ± 0.070WISE J2237−0614 IRTF/SpeX T5 0.206 ± 0.015 0.374 ± 0.018 0.403 ± 0.033 0.415 ± 0.024 0.602 ± 0.020 0.863 ± 0.036 0.917 ± 0.023WISE J2239+1617 IRTF/SpeX T3 0.417 ± 0.006 0.645 ± 0.007 0.510 ± 0.012 0.727 ± 0.007 0.682 ± 0.008 0.818 ± 0.013 0.932 ± 0.009WISE J2255−3118 IRTF/SpeX T8 0.037 ± 0.011 0.300 ± 0.015 0.159 ± 0.022 0.101 ± 0.014 0.254 ± 0.014 0.597 ± 0.033 0.894 ± 0.017
Keck/NIRSPEC-H T8 . . . . . . 0.205 ± 0.033 0.097 ± 0.019 . . . 0.462 ± 0.024 . . .
WISE J2313−8037 Magellan/FIRE T8 0.041 ± 0.004 0.163 ± 0.010 0.155 ± 0.007 0.136 ± 0.006 0.268 ± 0.012 0.555 ± 0.017 0.861 ± 0.009WISE J2319−1844 IRTF/SpeX T7.5 0.078 ± 0.019 0.309 ± 0.024 0.181 ± 0.038 0.122 ± 0.028 0.336 ± 0.024 0.587 ± 0.048 0.832 ± 0.026WISE J2325−4105 Magellan/FIRE T9 pec 0.011 ± 0.017 0.146 ± 0.024 0.062 ± 0.022 0.118 ± 0.019 0.184 ± 0.016 0.461 ± 0.027 0.799 ± 0.030WISE J2340−0745 IRTF/SpeX T7 0.115 ± 0.005 0.299 ± 0.007 0.255 ± 0.015 0.225 ± 0.008 0.422 ± 0.008 0.739 ± 0.017 0.883 ± 0.010WISE J2343−7418 Magellan/FIRE T6 0.184 ± 0.007 0.411 ± 0.014 0.289 ± 0.010 0.320 ± 0.008 0.492 ± 0.010 0.726 ± 0.018 0.818 ± 0.011WISE J2344+1034 Keck/NIRSPEC-J T9 −0.001 ± 0.023 0.119 ± 0.019 . . . . . . 0.148 ± 0.016 . . . 0.944 ± 0.032WISE J2348−1028 IRTF/SpeX T7 0.079 ± 0.006 0.226 ± 0.008 0.213 ± 0.016 0.153 ± 0.011 0.388 ± 0.010 0.714 ± 0.023 0.883 ± 0.012WISE J2359−7335 Magellan/FIRE T6.5 0.074 ± 0.005 0.256 ± 0.010 0.260 ± 0.007 0.232 ± 0.005 0.346 ± 0.008 0.670 ± 0.015 0.846 ± 0.008
New T Dwarf Discoveries
WISE J0005+3737 Keck/NIRSPEC-J T9 0.006 ± 0.019 0.130 ± 0.017 . . . . . . 0.236 ± 0.014 . . . 0.884 ± 0.024WISE J0038+2758 Keck/NIRSPEC-J T9 −0.026 ± 0.010 0.097 ± 0.011 . . . . . . 0.164 ± 0.010 . . . 0.869 ± 0.015WISE J0038+8405 Keck/NIRSPEC-J T6 0.155 ± 0.006 0.417 ± 0.020 . . . . . . 0.452 ± 0.008 . . . 0.857 ± 0.011WISE J0040+0900 IRTF/SpeX T7 0.091 ± 0.005 0.295 ± 0.007 0.242 ± 0.016 0.233 ± 0.010 0.380 ± 0.010 0.678 ± 0.021 0.885 ± 0.012WISE J0045+3611 IRTF/SpeX T5 0.202 ± 0.004 0.382 ± 0.006 0.323 ± 0.013 0.405 ± 0.010 0.498 ± 0.008 0.716 ± 0.016 0.905 ± 0.010WISE J0049+2151 IRTF/SpeX T8.5 0.026 ± 0.005 0.166 ± 0.006 0.167 ± 0.013 0.093 ± 0.007 0.304 ± 0.008 0.569 ± 0.018 0.947 ± 0.011WISE J0135+1715 IRTF/SpeX T6 0.147 ± 0.015 0.353 ± 0.019 0.313 ± 0.033 0.284 ± 0.025 0.518 ± 0.024 0.737 ± 0.042 0.899 ± 0.028WISE J0210+4008 IRTF/SpeX T4.5 0.335 ± 0.008 0.473 ± 0.010 0.388 ± 0.019 0.491 ± 0.014 0.636 ± 0.012 0.809 ± 0.021 0.869 ± 0.013WISE J0233+3030 IRTF/SpeX T6 0.218 ± 0.010 0.382 ± 0.014 0.358 ± 0.024 0.332 ± 0.020 0.536 ± 0.018 0.750 ± 0.038 0.871 ± 0.021WISE J0245−3450 IRTF/SpeX T8 0.050 ± 0.017 0.208 ± 0.021 0.196 ± 0.032 0.133 ± 0.024 0.324 ± 0.024 0.637 ± 0.048 0.940 ± 0.025WISE J0247+3725 Gemini/GNIRS T8 0.025 ± 0.007 0.173 ± 0.010 0.154 ± 0.009 0.098 ± 0.008 0.272 ± 0.008 0.571 ± 0.022 0.870 ± 0.012WISE J0259−0346 Keck/NIRSPEC-J T5 0.210 ± 0.031 0.438 ± 0.036 . . . . . . 0.526 ± 0.024 . . . 0.897 ± 0.045WISE J0316+3820 Palomar/TSpec T3 0.415 ± 0.017 0.570 ± 0.018 0.509 ± 0.012 0.676 ± 0.009 0.686 ± 0.016 0.821 ± 0.014 0.884 ± 0.021WISE J0316+4307 Keck/NIRSPEC-JH T8 −0.119 ± 0.025 0.214 ± 0.017 0.179 ± 0.043 0.074 ± 0.030 0.230 ± 0.012 0.575 ± 0.036 0.840 ± 0.018WISE J0321−7347 Magellan/FIRE T8 0.052 ± 0.013 0.166 ± 0.012 0.163 ± 0.014 0.101 ± 0.009 0.216 ± 0.010 0.685 ± 0.013 0.933 ± 0.015WISE J0325−3854 Keck/NIRSPEC-J T9 0.019 ± 0.041 0.135 ± 0.025 . . . . . . 0.228 ± 0.018 . . . 0.861 ± 0.036WISE J0325+0831 IRTF/SpeX T7 0.097 ± 0.007 0.260 ± 0.009 0.295 ± 0.015 0.240 ± 0.012 0.412 ± 0.012 0.687 ± 0.026 0.897 ± 0.012WISE J0335+4310 Keck/NIRSPEC-J T9 0.051 ± 0.013 0.138 ± 0.015 . . . . . . 0.231 ± 0.011 . . . 0.820 ± 0.019WISE J0336−0143 Keck/NIRSPEC-J T8: . . . 0.055 ± 0.022 . . . . . . 0.216 ± 0.044 . . . 0.947 ± 0.248WISE J0336+2826 IRTF/SpeX T5 0.311 ± 0.011 0.464 ± 0.016 0.371 ± 0.020 0.487 ± 0.021 0.588 ± 0.018 0.784 ± 0.030 0.867 ± 0.020WISE J0413−4750 Magellan/FIRE T9 0.007 ± 0.009 0.034 ± 0.027 0.123 ± 0.059 0.015 ± 0.015 0.154 ± 0.052 0.564 ± 0.038 0.943 ± 0.020WISE J0424+0727 Keck/NIRSPEC-J T7.5 0.048 ± 0.009 0.225 ± 0.016 . . . . . . 0.356 ± 0.010 . . . 0.911 ± 0.015WISE J0430+4633 Keck/NIRSPEC-J T8 0.045 ± 0.008 0.210 ± 0.017 . . . . . . 0.278 ± 0.008 . . . 0.839 ± 0.013WISE J0512−3004 Keck/NIRSPEC-J T8.5 0.092 ± 0.015 0.106 ± 0.014 . . . . . . 0.231 ± 0.013 . . . 0.918 ± 0.021WISE J0540+4832 Keck/NIRSPEC-J T8.5 0.078 ± 0.008 0.144 ± 0.010 . . . . . . 0.249 ± 0.007 . . . 0.877 ± 0.011WISE J0546−0959 IRTF/SpeX T5 0.234 ± 0.008 0.550 ± 0.013 0.355 ± 0.022 0.402 ± 0.015 0.602 ± 0.014 0.763 ± 0.029 0.973 ± 0.019WISE J0614+0951 Palomar/TSpec T7 0.109 ± 0.001 0.287 ± 0.002 0.285 ± 0.002 0.212 ± 0.002 0.348 ± 0.002 0.712 ± 0.003 0.826 ± 0.003
32

Th
eA
strophysical
Journ
alSu
pplemen
tSeries,205:6
(49pp),2013M
archM
aceet
al.
Table 7(Continued)
Object Name Instrument NIR Sp. H2O−J CH4−J H2O−H CH4−H WJ NH3−H J-narrowJ2000 Coordinates Type(1) (2) (3) (4) (5) (6) (7) (8) (9) (10)
WISE J0629+2418 IRTF/SpeX T2 sb 0.451 ± 0.013 0.691 ± 0.019 0.561 ± 0.021 0.839 ± 0.017 0.662 ± 0.022 0.852 ± 0.024 0.925 ± 0.020WISE J0642+4101 Palomar/TSpec extr. red 0.539 ± 0.003 0.881 ± 0.003 0.606 ± 0.002 1.202 ± 0.003 0.738 ± 0.002 0.834 ± 0.002 0.949 ± 0.003WISE J0701+6321 Palomar/TSpec T3 0.390 ± 0.001 0.685 ± 0.002 0.475 ± 0.001 0.790 ± 0.001 0.646 ± 0.002 0.819 ± 0.002 0.914 ± 0.002WISE J0723+3403 Keck/NIRSPEC-J T9: . . . . . . . . . . . . 0.142 ± 0.063 . . . 0.885 ± 0.101WISE J0733+7544 Palomar/TSpec T6 0.141 ± 0.002 0.366 ± 0.003 0.309 ± 0.003 0.323 ± 0.003 0.444 ± 0.002 0.746 ± 0.004 0.845 ± 0.004WISE J0754+7909 Palomar/TSpec extr. red 0.476 ± 0.003 0.800 ± 0.004 0.443 ± 0.003 1.081 ± 0.002 0.774 ± 0.002 0.815 ± 0.003 0.978 ± 0.003WISE J0811−8051 Magellan/FIRE T9.5: 0.034 ± 0.058 0.037 ± 0.030 −0.198 ± 0.067 −0.072 ± 0.047 0.146 ± 0.024 0.584 ± 0.071 0.900 ± 0.052WISE J0812+4021 Gemini/GNIRS T8 0.054 ± 0.005 0.204 ± 0.009 0.221 ± 0.009 0.118 ± 0.008 0.308 ± 0.008 0.671 ± 0.016 0.881 ± 0.011WISE J1025+0307 Magellan/FIRE T8.5 0.025 ± 0.003 0.118 ± 0.004 0.111 ± 0.003 0.079 ± 0.002 0.242 ± 0.004 0.547 ± 0.005 0.877 ± 0.006WISE J1039−1600 IRTF/SpeX T7.5 0.090 ± 0.015 0.296 ± 0.021 0.180 ± 0.032 0.141 ± 0.022 0.314 ± 0.024 0.637 ± 0.046 0.865 ± 0.026WISE J1050+5056 Keck/NIRSPEC-J T8 0.041 ± 0.013 0.210 ± 0.017 . . . . . . 0.321 ± 0.010 . . . 0.842 ± 0.017WISE J1051−2138 Palomar/TSpec T9: 0.138 ± 0.012 0.122 ± 0.008 0.223 ± 0.012 0.081 ± 0.007 0.282 ± 0.006 0.543 ± 0.014 0.941 ± 0.014WISE J1124−0421 IRTF/SpeX T7 0.108 ± 0.006 0.324 ± 0.008 0.235 ± 0.018 0.229 ± 0.011 0.366 ± 0.010 0.623 ± 0.023 0.862 ± 0.011WISE J1143+4431 Keck/NIRSPEC-J T8.5 0.071 ± 0.034 0.165 ± 0.024 . . . . . . 0.238 ± 0.019 . . . 0.839 ± 0.038WISE J1221−3136 IRTF/SpeX T6.5 0.139 ± 0.008 0.341 ± 0.011 0.285 ± 0.026 0.262 ± 0.016 0.424 ± 0.016 0.633 ± 0.034 0.830 ± 0.016WISE J1225−1013 IRTF/SpeX T6 0.161 ± 0.006 0.417 ± 0.008 0.276 ± 0.016 0.303 ± 0.012 0.466 ± 0.010 0.744 ± 0.023 0.875 ± 0.011WISE J1250+2628 Keck/NIRSPEC-J T6.5 0.131 ± 0.004 0.349 ± 0.010 . . . . . . 0.412 ± 0.008 . . . 0.802 ± 0.008WISE J1257+4008 IRTF/SpeX T7 0.100 ± 0.013 0.390 ± 0.019 0.217 ± 0.029 0.188 ± 0.020 0.385 ± 0.021 0.668 ± 0.044 0.801 ± 0.022WISE J1301−0302 Keck/NIRSPEC-J T8.5 −0.002 ± 0.024 0.194 ± 0.022 . . . . . . 0.265 ± 0.015 . . . 0.861 ± 0.026WISE J1318−1758 Palomar/TSpec T9: 0.080 ± 0.006 0.115 ± 0.005 0.146 ± 0.007 0.121 ± 0.005 0.236 ± 0.006 0.652 ± 0.010 0.906 ± 0.009WISE J1337+2636 Keck/NIRSPEC-J T5 0.182 ± 0.007 0.407 ± 0.013 . . . . . . 0.518 ± 0.010 . . . 0.870 ± 0.012WISE J1400−3850 IRTF/SpeX T4 0.402 ± 0.018 0.614 ± 0.022 0.439 ± 0.026 0.553 ± 0.021 0.708 ± 0.020 0.867 ± 0.028 0.910 ± 0.022WISE J1517+0529 Keck/NIRSPEC-J T8 0.079 ± 0.032 0.177 ± 0.026 . . . . . . 0.297 ± 0.018 . . . 0.870 ± 0.036WISE J1523+3125 Gemini/GNIRS T6.5 pec 0.084 ± 0.010 0.334 ± 0.020 0.219 ± 0.014 0.280 ± 0.020 0.380 ± 0.012 0.669 ± 0.027 0.881 ± 0.017WISE J1542+2230 HST/WFC3 T9.5 0.015 ± 0.016 0.100 ± 0.017 0.108 ± 0.016 0.116 ± 0.017 0.166 ± 0.022 0.419 ± 0.031 0.782 ± 0.034WISE J1544+5842 Keck/NIRSPEC-J T7.5 0.086 ± 0.038 0.205 ± 0.037 . . . . . . 0.370 ± 0.028 . . . 0.975 ± 0.060WISE J1632+0329 IRTF/SpeX T5 0.222 ± 0.017 0.421 ± 0.022 0.243 ± 0.031 0.452 ± 0.030 0.536 ± 0.024 0.795 ± 0.050 0.894 ± 0.041WISE J1636−0743 IRTF/SpeX T4.5 0.390 ± 0.024 0.670 ± 0.029 0.363 ± 0.037 0.601 ± 0.030 0.694 ± 0.028 0.794 ± 0.050 0.947 ± 0.037WISE J1707−1744 Palomar/TSpec T5: 0.228 ± 0.014 0.393 ± 0.019 0.307 ± 0.017 0.425 ± 0.013 0.540 ± 0.014 0.789 ± 0.022 0.891 ± 0.023WISE J1721+1117 IRTF/SpeX T6 0.149 ± 0.019 0.435 ± 0.026 0.240 ± 0.039 0.294 ± 0.032 0.444 ± 0.026 0.688 ± 0.058 0.876 ± 0.034WISE J1730+4207 IRTF/SpeX T0 sb 0.551 ± 0.011 0.758 ± 0.016 0.636 ± 0.017 0.832 ± 0.013 0.754 ± 0.016 0.869 ± 0.019 0.890 ± 0.019WISE J1734+5023 IRTF/SpeX T4 0.398 ± 0.007 0.392 ± 0.006 0.449 ± 0.013 0.528 ± 0.010 0.678 ± 0.010 0.840 ± 0.014 0.892 ± 0.011WISE J1736+6059 Keck/NIRSPEC-J T8 0.075 ± 0.010 0.195 ± 0.015 . . . . . . 0.274 ± 0.009 . . . 0.803 ± 0.016WISE J1738+6142 Palomar/TSpec extr. red 0.553 ± 0.040 0.882 ± 0.045 0.647 ± 0.017 1.139 ± 0.016 0.700 ± 0.036 0.829 ± 0.017 0.955 ± 0.066
IRTF/SpeX extr. red 0.572 ± 0.026 0.892 ± 0.036 0.632 ± 0.024 1.087 ± 0.023 0.847 ± 0.031 0.822 ± 0.024 0.992 ± 0.038WISE J1741+1327 IRTF/SpeX T5 0.249 ± 0.020 0.486 ± 0.024 0.362 ± 0.036 0.366 ± 0.030 0.564 ± 0.024 0.726 ± 0.047 0.884 ± 0.029WISE J1743+4211 Palomar/TSpec T4.5 0.380 ± 0.006 0.562 ± 0.011 0.392 ± 0.007 0.511 ± 0.006 0.614 ± 0.008 0.768 ± 0.010 0.871 ± 0.011WISE J1745+6459 Keck/NIRSPEC-J T7 0.155 ± 0.020 0.297 ± 0.023 . . . . . . 0.393 ± 0.015 . . . 0.854 ± 0.026WISE J1746−0338 Palomar/TSpec T6 0.180 ± 0.012 0.348 ± 0.016 0.337 ± 0.015 0.303 ± 0.011 0.470 ± 0.012 0.764 ± 0.020 0.893 ± 0.017WISE J1755+1803 Palomar/TSpec T2 0.531 ± 0.009 0.720 ± 0.012 0.526 ± 0.008 0.857 ± 0.006 0.706 ± 0.010 0.835 ± 0.008 0.906 ± 0.014WISE J1759+5442 Keck/NIRSPEC-J T7 0.111 ± 0.016 0.247 ± 0.019 . . . . . . 0.363 ± 0.012 . . . 0.894 ± 0.021WISE J1809−0448 IRTF/SpeX T0.5 0.622 ± 0.008 0.781 ± 0.009 0.607 ± 0.012 0.948 ± 0.010 0.826 ± 0.010 0.878 ± 0.012 0.925 ± 0.010
33

Th
eA
strophysical
Journ
alSu
pplemen
tSeries,205:6
(49pp),2013M
archM
aceet
al.Table 7
(Continued)
Object Name Instrument NIR Sp. H2O−J CH4−J H2O−H CH4−H WJ NH3−H J-narrowJ2000 Coordinates Type(1) (2) (3) (4) (5) (6) (7) (8) (9) (10)
WISE J1812+2007 Keck/NIRSPEC-J T9 0.014 ± 0.023 0.135 ± 0.021 . . . . . . 0.204 ± 0.016 . . . 0.900 ± 0.035WISE J1813+2835 Keck/NIRSPEC-J T8 0.044 ± 0.005 0.170 ± 0.010 . . . . . . 0.267 ± 0.007 . . . 0.859 ± 0.009WISE J1840+2932 Keck/NIRSPEC-J T6 0.194 ± 0.018 0.339 ± 0.027 . . . . . . 0.467 ± 0.015 . . . 0.895 ± 0.028WISE J1909−5204 Magellan/FIRE T5.5 0.222 ± 0.007 0.484 ± 0.011 0.330 ± 0.009 0.329 ± 0.007 0.504 ± 0.009 0.761 ± 0.012 0.841 ± 0.011WISE J1913+6444 Palomar/TSpec T5: 0.296 ± 0.023 0.509 ± 0.027 0.367 ± 0.027 0.426 ± 0.020 0.538 ± 0.020 0.837 ± 0.033 0.911 ± 0.033WISE J1928+2356 IRTF/SpeX T6 0.175 ± 0.001 0.431 ± 0.002 0.294 ± 0.003 0.357 ± 0.003 0.520 ± 0.002 0.695 ± 0.004 0.912 ± 0.003WISE J1954+6915 Keck/NIRSPEC-J T5.5 0.189 ± 0.011 0.473 ± 0.018 . . . . . . 0.500 ± 0.010 . . . 0.895 ± 0.015WISE J1955−2540 Keck/NIRSPEC-J T8 0.005 ± 0.013 0.151 ± 0.015 . . . . . . 0.266 ± 0.010 . . . 0.875 ± 0.017WISE J2008−0834 IRTF/SpeX T5.5 0.205 ± 0.006 0.318 ± 0.007 0.344 ± 0.022 0.364 ± 0.013 0.552 ± 0.012 0.835 ± 0.025 0.904 ± 0.013WISE J2014+0424 Gemini/GNIRS T6.5 pec 0.083 ± 0.006 0.291 ± 0.013 0.202 ± 0.010 0.275 ± 0.010 0.400 ± 0.008 0.726 ± 0.018 0.919 ± 0.013WISE J2015+6646 Palomar/TSpec T8 0.072 ± 0.013 0.191 ± 0.014 0.167 ± 0.015 0.156 ± 0.010 0.324 ± 0.012 0.604 ± 0.020 0.839 ± 0.019WISE J2019−1148 Palomar/TSpec T8: 0.062 ± 0.036 0.122 ± 0.021 0.162 ± 0.030 0.135 ± 0.020 0.234 ± 0.020 0.649 ± 0.037 0.924 ± 0.042WISE J2030+0749 IRTF/SpeX T1.5 0.603 ± 0.003 0.787 ± 0.003 0.580 ± 0.003 0.885 ± 0.003 0.806 ± 0.004 0.863 ± 0.004 0.916 ± 0.004WISE J2043+6220 IRTF/SpeX T1.5 0.561 ± 0.012 0.639 ± 0.014 0.545 ± 0.017 0.923 ± 0.014 0.800 ± 0.017 0.890 ± 0.020 0.943 ± 0.017WISE J2123−2614 IRTF/SpeX T5.5 0.230 ± 0.022 0.452 ± 0.027 0.266 ± 0.051 0.334 ± 0.040 0.542 ± 0.030 0.840 ± 0.061 0.930 ± 0.031WISE J2147−1029 Keck/NIRSPEC-J T7.5 0.071 ± 0.011 0.212 ± 0.016 . . . . . . 0.339 ± 0.010 . . . 0.888 ± 0.015WISE J2236+5105 Palomar/TSpec T5.5 0.186 ± 0.001 0.406 ± 0.001 0.296 ± 0.001 0.439 ± 0.001 0.474 ± 0.000 0.712 ± 0.002 0.826 ± 0.001WISE J2237+7228 Keck/NIRSPEC-J T6 0.172 ± 0.006 0.389 ± 0.014 . . . . . . 0.478 ± 0.010 . . . 0.881 ± 0.012WISE J2301+0216 IRTF/SpeX T6.5 0.135 ± 0.008 0.308 ± 0.012 0.309 ± 0.021 0.256 ± 0.014 0.440 ± 0.014 0.766 ± 0.029 0.867 ± 0.018WISE J2303+1914 Palomar/TSpec T4: 0.409 ± 0.004 0.557 ± 0.005 0.372 ± 0.005 0.538 ± 0.003 0.664 ± 0.004 0.847 ± 0.005 0.906 ± 0.007WISE J2335+4222 Keck/NIRSPEC-JH T7 0.101 ± 0.011 0.275 ± 0.020 0.295 ± 0.018 0.215 ± 0.014 0.384 ± 0.012 0.674 ± 0.019 0.891 ± 0.019WISE J2357+1227 IRTF/SpeX T6 0.145 ± 0.007 0.452 ± 0.010 0.257 ± 0.017 0.267 ± 0.012 0.408 ± 0.010 0.682 ± 0.025 0.838 ± 0.013
T Dwarfs from Table 6
WISE J0920+4538 Palomar/TSpec L9 sb? 0.603 ± 0.001 0.865 ± 0.002 0.613 ± 0.002 0.998 ± 0.001 0.774 ± 0.002 0.876 ± 0.002 0.949 ± 0.002ULAS J0950+0117 Magellan/FIRE T8 0.050 ± 0.003 0.220 ± 0.006 0.159 ± 0.003 0.160 ± 0.003 0.344 ± 0.005 0.592 ± 0.007 0.936 ± 0.007WISE J1246−3139 Palomar/TSpec T1 0.542 ± 0.002 0.791 ± 0.002 0.548 ± 0.002 0.905 ± 0.001 0.784 ± 0.002 0.877 ± 0.002 0.939 ± 0.002LHS 2803B IRTF/SpeX T5.5 0.168 ± 0.009 0.308 ± 0.012 0.285 ± 0.029 0.432 ± 0.021 0.540 ± 0.017 0.726 ± 0.037 0.920 ± 0.019BD +01◦ 2920B Magellan/FIRE T8 0.052 ± 0.007 0.206 ± 0.007 0.218 ± 0.010 0.156 ± 0.008 0.321 ± 0.007 0.686 ± 0.016 0.862 ± 0.009WISE J1449+1147 Gemini/GNIRS T5 pec 0.223 ± 0.006 0.436 ± 0.012 0.292 ± 0.008 0.415 ± 0.010 0.552 ± 0.010 0.781 ± 0.015 0.915 ± 0.012
Palomar/TSpec T5 pec 0.236 ± 0.015 0.392 ± 0.019 0.310 ± 0.018 0.423 ± 0.013 0.550 ± 0.014 0.792 ± 0.023 0.893 ± 0.023PSOJ226.25−28.89 Palomar/TSpec T2: 0.687 ± 0.014 0.736 ± 0.015 0.571 ± 0.009 0.847 ± 0.007 0.798 ± 0.010 0.842 ± 0.009 0.926 ± 0.012VHS J1543−0439 IRTF/SpeX T5: 0.325 ± 0.024 0.477 ± 0.029 0.372 ± 0.040 0.486 ± 0.037 0.624 ± 0.034 0.681 ± 0.051 0.876 ± 0.050PSOJ246.42+15.46 Palomar/TSpec T4.5: 0.315 ± 0.014 0.500 ± 0.017 0.396 ± 0.014 0.465 ± 0.011 0.602 ± 0.012 0.818 ± 0.018 0.883 ± 0.019PSOJ247.32+03.59 Palomar/TSpec T2 0.443 ± 0.004 0.684 ± 0.007 0.449 ± 0.003 0.909 ± 0.004 0.684 ± 0.004 0.764 ± 0.005 0.935 ± 0.005WISE J1717+6128 Gemini/GNIRS T8 0.036 ± 0.014 0.198 ± 0.017 0.203 ± 0.015 0.134 ± 0.018 0.306 ± 0.014 0.655 ± 0.033 0.912 ± 0.026WISE J1809+3838 IRTF/SpeX T7.5 0.069 ± 0.018 0.266 ± 0.025 0.199 ± 0.032 0.154 ± 0.024 0.348 ± 0.026 0.582 ± 0.053 0.892 ± 0.036WISE J2342+0856 IRTF/SpeX T6.5 0.115 ± 0.006 0.380 ± 0.009 0.221 ± 0.016 0.276 ± 0.010 0.408 ± 0.010 0.672 ± 0.023 0.885 ± 0.012WISE J2344+1034 Gemini/GNIRS T9 0.028 ± 0.009 0.095 ± 0.010 0.144 ± 0.012 0.070 ± 0.014 0.196 ± 0.010 0.522 ± 0.027 0.857 ± 0.020
Y Dwarfs from Cushing et al. (2011) and Kirkpatrick et al. (2012)
WISE J0146+4234 Keck/NIRSPEC-JH Y0 −0.115 ± 0.032 0.070 ± 0.021 −0.019 ± 0.081 −0.032 ± 0.038 0.150 ± 0.014 0.185 ± 0.037 0.805 ± 0.030WISE J0350−5658 HST/WFC3 Y1 −0.055 ± 0.071 0.068 ± 0.049 0.118 ± 0.054 . . . 0.116 ± 0.096 0.401 ± 0.068 0.676 ± 0.095WISE J0359−5401 HST/WFC3 Y0 −0.020 ± 0.055 0.068 ± 0.037 0.144 ± 0.055 0.101 ± 0.058 0.170 ± 0.040 0.483 ± 0.067 0.801 ± 0.074WISE J0410+1502 Magellan/FIRE Y0 −0.002 ± 0.082 0.026 ± 0.040 −0.065 ± 0.424 −0.160 ± 0.375 0.126 ± 0.042 0.349 ± 0.732 0.822 ± 0.074WISE J0713−2917 Keck/NIRSPEC-J Y0 −0.029 ± 0.035 0.016 ± 0.019 . . . . . . 0.046 ± 0.014 . . . 0.724 ± 0.024WISE J0734−7157 Magellan/FIRE Y0 −0.042 ± 0.044 0.037 ± 0.020 0.298 ± 0.047 0.020 ± 0.024 0.162 ± 0.024 0.484 ± 0.040 0.821 ± 0.034WISE J1405+5534 HST/WFC3 Y0 (pec?) −0.056 ± 0.035 −0.008 ± 0.023 0.001 ± 0.020 0.121 ± 0.029 0.068 ± 0.028 0.356 ± 0.040 0.696 ± 0.037WISE J1541−2250 Magellan/FIRE Y0.5 −0.024 ± 0.422 0.061 ± 0.238 0.075 ± 0.276 0.034 ± 0.199 0.088 ± 0.212 0.289 ± 0.246 0.747 ± 0.393
34

Th
eA
strophysical
Journ
alSu
pplemen
tSeries,205:6
(49pp),2013M
archM
aceet
al.
Table 7(Continued)
Object Name Instrument NIR Sp. H2O−J CH4−J H2O−H CH4−H WJ NH3−H J-narrowJ2000 Coordinates Type(1) (2) (3) (4) (5) (6) (7) (8) (9) (10)
WISE J1828+2650 HST/WFC3 �Y2 0.337 ± 0.198 0.254 ± 0.130 0.101 ± 0.123 0.114 ± 0.133 0.522 ± 0.142 0.469 ± 0.154 0.872 ± 0.289WISE J2056+1459 HST/WFC3 Y0 0.052 ± 0.009 0.096 ± 0.010 0.186 ± 0.011 0.223 ± 0.010 0.130 ± 0.014 0.481 ± 0.024 0.755 ± 0.016WISE J2220−3628 Keck/NIRSPEC-H Y0 . . . . . . 0.154 ± 0.032 0.015 ± 0.025 . . . 0.420 ± 0.031 0.742 ± 0.046
Note. a Spectra from Adam Burgasser’s SpeX Prism Spectral Library.
35

Th
eA
strophysical
Journ
alSu
pplemen
tSeries,205:6
(49pp),2013M
archM
aceet
al.
Table 8Average Median-flux Spectral Indices for Each Half Spectral Type
NIR Sp. H2O−J CH4−J H2O−H CH4−H WJ NH3−H J-narrow Y/J H/J K/JType(1) (2) (3) (4) (5) (6) (7) (8) (9) (10) (11)
T0 0.647 ± 0.054 0.841 ± 0.063 0.651 ± 0.036 0.970 ± 0.054 0.803 ± 0.030 0.884 ± 0.021 0.928 ± 0.024 0.579 ± 0.033 0.846 ± 0.051 0.496 ± 0.060T0.5 0.581 ± 0.087 0.802 ± 0.050 0.591 ± 0.074 1.035 ± 0.100 0.790 ± 0.036 0.850 ± 0.039 0.934 ± 0.028 0.567 ± 0.040 0.854 ± 0.037 0.554 ± 0.121T1 0.572 ± 0.079 0.772 ± 0.064 0.582 ± 0.041 0.912 ± 0.068 0.766 ± 0.080 0.853 ± 0.018 0.922 ± 0.028 0.557 ± 0.076 0.814 ± 0.033 0.445 ± 0.053T1.5 0.537 ± 0.068 0.728 ± 0.067 0.518 ± 0.045 0.924 ± 0.059 0.777 ± 0.040 0.840 ± 0.051 0.937 ± 0.017 0.585 ± 0.051 0.734 ± 0.023 0.344 ± 0.033T2 0.490 ± 0.071 0.707 ± 0.077 0.522 ± 0.052 0.861 ± 0.064 0.712 ± 0.055 0.828 ± 0.045 0.916 ± 0.030 0.532 ± 0.039 0.732 ± 0.035 0.370 ± 0.060T2.5 0.457 ± 0.037 0.679 ± 0.055 0.490 ± 0.033 0.813 ± 0.059 0.697 ± 0.040 0.813 ± 0.032 0.914 ± 0.007 0.537 ± 0.023 0.687 ± 0.030 0.314 ± 0.026T3 0.410 ± 0.035 0.625 ± 0.061 0.485 ± 0.038 0.722 ± 0.047 0.685 ± 0.048 0.802 ± 0.042 0.911 ± 0.019 0.563 ± 0.053 0.660 ± 0.030 0.281 ± 0.046T3.5 0.368 ± 0.096 0.604 ± 0.071 0.390 ± 0.042 0.702 ± 0.042 0.621 ± 0.072 0.759 ± 0.038 0.900 ± 0.026 0.510 ± 0.018 0.611 ± 0.027 0.233 ± 0.032T4 0.378 ± 0.026 0.558 ± 0.075 0.393 ± 0.031 0.571 ± 0.045 0.648 ± 0.034 0.801 ± 0.039 0.894 ± 0.022 0.481 ± 0.062 0.583 ± 0.041 0.208 ± 0.029T4.5 0.325 ± 0.041 0.557 ± 0.054 0.376 ± 0.023 0.503 ± 0.059 0.623 ± 0.036 0.788 ± 0.027 0.894 ± 0.032 0.476 ± 0.031 0.533 ± 0.030 0.191 ± 0.029T5 0.238 ± 0.037 0.462 ± 0.047 0.336 ± 0.041 0.416 ± 0.038 0.552 ± 0.039 0.764 ± 0.050 0.887 ± 0.027 0.495 ± 0.054 0.476 ± 0.028 0.152 ± 0.038T5.5 0.197 ± 0.040 0.427 ± 0.087 0.313 ± 0.037 0.365 ± 0.053 0.512 ± 0.050 0.738 ± 0.054 0.888 ± 0.028 0.444 ± 0.048 0.480 ± 0.041 0.160 ± 0.036T6 0.155 ± 0.024 0.379 ± 0.039 0.297 ± 0.031 0.303 ± 0.028 0.467 ± 0.029 0.739 ± 0.030 0.877 ± 0.026 0.458 ± 0.047 0.461 ± 0.021 0.135 ± 0.035T6.5 0.117 ± 0.023 0.320 ± 0.075 0.260 ± 0.044 0.250 ± 0.023 0.398 ± 0.062 0.706 ± 0.058 0.864 ± 0.038 0.448 ± 0.063 0.472 ± 0.018 0.137 ± 0.049T7 0.090 ± 0.032 0.290 ± 0.048 0.241 ± 0.030 0.200 ± 0.033 0.387 ± 0.028 0.676 ± 0.042 0.880 ± 0.033 0.424 ± 0.062 0.477 ± 0.030 0.148 ± 0.026T7.5 0.063 ± 0.017 0.243 ± 0.047 0.183 ± 0.023 0.157 ± 0.026 0.344 ± 0.023 0.637 ± 0.050 0.899 ± 0.037 0.450 ± 0.066 0.489 ± 0.025 0.111 ± 0.044T8 0.056 ± 0.060 0.200 ± 0.047 0.182 ± 0.034 0.126 ± 0.033 0.303 ± 0.044 0.625 ± 0.054 0.890 ± 0.036 0.429 ± 0.089 0.498 ± 0.047 0.118 ± 0.038T8.5 0.051 ± 0.035 0.188 ± 0.056 0.183 ± 0.045 0.122 ± 0.035 0.295 ± 0.047 0.610 ± 0.059 0.884 ± 0.044 0.432 ± 0.082 0.503 ± 0.045 0.116 ± 0.039T9 0.032 ± 0.037 0.117 ± 0.030 0.127 ± 0.045 0.068 ± 0.067 0.203 ± 0.038 0.539 ± 0.054 0.879 ± 0.053 0.448 ± 0.095 0.555 ± 0.030 0.100 ± 0.032T9.5 0.011 ± 0.025 0.071 ± 0.032 0.100 ± 0.253 −0.021 ± 0.116 0.145 ± 0.021 0.443 ± 0.101 0.865 ± 0.071 0.357 ± 0.008 0.504 ± 0.080 0.033 ± 0.083Y0 −0.022 ± 0.050 0.045 ± 0.031 0.116 ± 0.132 0.066 ± 0.133 0.117 ± 0.043 0.385 ± 0.105 0.778 ± 0.050 0.423 ± 0.131 0.467 ± 0.061 0.063 ± 0.031
36

The Astrophysical Journal Supplement Series, 205:6 (49pp), 2013 March Mace et al.
to produce a useful index for classifying Y dwarfs using aspectral index. As discussed above, many of the indices derivedfor T dwarfs have saturated before the T/Y boundary and areno longer useful for Y dwarfs. The K i doublet at 1.243 and1.254 μm is a feature present in M though T dwarfs down to mid-type T. The numerator in this index encloses the red memberof the J-band neutral potassium doublet and the denominatorcaptures the J-band flux peak. Variations in the K i feature arewhat produce the dispersion and undulation seen in Figure 24 forthe T dwarf sequence. Most of our spectra are lower resolutionIRTF/SpeX and Palomar/TSpec spectra and the K i 1.254 μmline is barely resolved. In these data, there is no significantdifference in the J-narrow index when using the median or theintegrated flux. In higher-resolution spectra the integrated fluxproduces slightly lower index values than the median methodwhile increasing the dispersion in each spectral bin by includingmore spectral variation. To minimize this variability we usethe median flux to derive this index. McLean et al. (2003,Figure 15) shows how the K i lines broaden toward later spectraltypes, before also decreasing in strength around T6 (McLeanet al. 2007). It is this broadening that causes the J-narrow indexto decrease from T0-T6, and the disappearance of the line inlate-type T dwarfs that causes the slight increase in the indexbefore falling for the Y dwarfs as a result of the narrowingJ-band flux peak.
As discussed in Kirkpatrick et al. (2012), because our by-eye classification of Y dwarfs requires that the J-band peak benarrower than the Y0 standard, WISE J173835.52+273258.9,all the other Y0s have smaller J-narrow indices. Also, thisindex is only useful for distinguishing very early-type Y dwarfsfrom late-type T dwarfs since it does not appear to work wellfor WISE J1828+2650, which is either much later in type orspectroscopically peculiar. Future use of the J-narrow index forhigher-resolution spectra may provide a means of sorting eachspectral bin by surface gravity by employing the K i feature(McLean et al. 2003), a pursuit that may be aided by computingthe index using the integrated flux.
5. CLOUDS AND METALLICITY ATTHE T/Y BOUNDARY
Burrows et al. (2006) developed a set of brown dwarf modelsthat combined cloudy and cloudless models to reproduce theobserved J − K colors of L and T dwarfs, respectively. Similarsynthetic colors were derived by Saumon & Marley (2008) thatmatched the overall brown dwarf sequence. Both models failedto match the late-type T dwarf dispersion, which they couldmodulate through variations in metallicity and binarity (seeFigure 15 in Saumon & Marley 2008). Burgasser et al. (2011)utilized the Saumon & Marley (2008) models to determine thebest-fit parameters for their five WISE-discovered T dwarfs andfound that cloudy, low surface gravity models provided the bestmatch to observed spectra.
The addition of sulfide clouds to the brown dwarf models byMorley et al. (2012) reproduces the dispersion of the late-typeT dwarf photometry. The flux reversal we see in the J − H color(and the H/J index) around T7 corresponds to the turn-off of thelate-type T dwarfs from the cloudless models of Morley et al.(2012). Based on this turn-off, the spectral sequence beyond T7(Teff � 800 K) is possibly dominated by cloudy atmospheresthat have redder H/J and K/J indices. This includes the T dwarfspectral standards and the Y dwarfs later than Y0. The bluestH/J and K/J indices continue the trend of the early-type Tdwarfs and are still consistent with cloudless atmospheres. The
Y0s in this case stand-out in the H/J index as breaking thetrend, and may be less cloudy than the later Y dwarfs. Thus,the spectral sequence of the late-type T dwarfs and theearly-type Y dwarfs may no longer be correlated directly totemperature, but also to the atmospheric conditions.
The top panel of Figure 25 shows the objects that wehave computed indices for, sorted by spectral type. Early-typeT dwarfs are uniquely identified by their K/J index, while late-type T dwarfs have a larger Y/J dispersion. The T5-T9 spectralstandards all have similar index values, and the T8 dwarfs showthe largest spread in index values.
The middle panel in Figure 25 depicts the index values for theMorley et al. (2012) sulfide cloud models with solar metallicity,and various gravity and condensate sedimentation efficiencies(fsed), between 400 K and 1300 K. These models do not includesilicate clouds, and so they do not replicate the early-typeT dwarfs. The cloudless models predict a range of Y/J indexvalues for the coolest objects when gravity is varied, butrelatively little difference for most T dwarfs. Both the Y andJ bands are impacted by the alkali opacity and small variationsto the broadening produces large changes in the Y/J index, so ourinterpretation here is limited. For fsed = 5, the models predict aslight increase in both the Y/J and K/J indices before they bothdecrease, and this matches our measured index values. However,for fsed = 4 only the log g = 4.5 model remains consistent withour measurements. Smaller fsed values have Y/J � 0.5 and largeK/J values that are inconsistent with our measurements.
In the bottom panel of Figure 25 we show the index values forthe cloudy (Case E) and cloudless models presented in Burrowset al. (2006), for log g = 5.0, Teffs from 800 K to 1700 K, andvarious metallicities. The highest temperature is marked with asquare and the lowest temperature is marked with a circle in thefigure. Here we see that the K/J index produced for the cloudlessmodels, for a specific temperature, do not match the early-typeT dwarfs. This figure shows that the cloudy models trace theearly-type T dwarfs well and identifies a similar cloudy late-typeT population as the Morley et al. (2012) models. Although boththe cloudy and cloudless −0.5 dex tracks enclose the increasingY/J index values, the cloudless sub-solar metallicity model bestmatches our measurements.
Overall, the T dwarf spectral standards occupy a minimumin the Y/J index for the bulk of the late-type T dwarfs. Objectswith Y/J indices below the spectral standards are best matchedto cloudy models and possibly oversolar metallicities. Objectswith a Y/J index greater than the standards are best matched tocloudless models and sub-solar metallicities. The K/J index canbe modulated by temperature, metallically, and surface gravity(Leggett et al. 2007). However, objects with the lowest K/Jvalues also have the highest Y/J indices, which is consistentwith many K band suppressed late-type T dwarfs that are bestmatched to low-metallicity models.
6. INTERLOPERS IN WISE COLOR SPACE
Some of the brown dwarf candidates survived the photometricselection process but were spectroscopically identified as con-taminants in our sample. In cases where the acquired spectrumdid not match a brown dwarf, we saved images at the telescopeto later verify pointing. In the few cases where pointing wasquestioned, the candidate was added back to the candidate listand the observations were attempted again. If pointing was con-firmed, and the observed flux was not that of a brown dwarf, welogged the object as an interloper.
37

The Astrophysical Journal Supplement Series, 205:6 (49pp), 2013 March Mace et al.
Table 9WISE All-Sky Photometry for Interloper Sources
Object Name W1 W2 W3 W4 W1 − W2 W2 − W3(mag) (mag) (mag) (mag) (mag) (mag)
(1) (2) (3) (4) (5) (6) (7)
WISE J004733.81+671834.8 17.00 ± 0.15 14.21 ± 0.06 >12.01 >8.82 2.79 ± 0.16 <2.20WISE J014837.57−104803.0 16.54 ± 0.09 14.56 ± 0.06 12.67 ± 0.40 >9.38 1.98 ± 0.11 1.89 ± 0.41WISE J020110.08+483633.7 17.41 ± 0.22 14.67 ± 0.07 12.05 ± 0.27 >9.13 2.74 ± 0.23 2.62 ± 0.28WISE J022058.58+620236.4 >17.42 13.04 ± 0.03 >11.88 7.18 ± 0.12 >4.39 <1.16WISE J022116.78+590337.7 16.14 ± 0.09 14.07 ± 0.06 11.01 ± 0.10 8.06 ± 0.17 2.07 ± 0.10 3.06 ± 0.11WISE J040450.69+261825.1 14.23 ± 0.03 13.32 ± 0.04 >12.65 8.07 ± 0.22 0.91 ± 0.05 <0.66WISE J042102.74+372125.2 13.72 ± 0.03 13.30 ± 0.04 11.63 ± 0.27 8.59 ± 0.45 0.42 ± 0.05 1.67 ± 0.27WISE J044627.93−072611.6 16.09 ± 0.06 14.22 ± 0.05 . . . . . . 1.87 ± 0.08 . . .
WISE J054319.50+465312.9 16.96 ± 0.19 13.67 ± 0.04 10.61 ± 0.08 8.59 ± 0.32 3.29 ± 0.19 3.06 ± 0.09WISE J054647.84+263946.4 13.11 ± 0.03 12.61 ± 0.03 >12.47 >8.43 0.50 ± 0.04 <0.15WISE J055439.47+245728.8 16.40 ± 0.11 14.20 ± 0.06 11.14 ± 0.14 7.91 ± 0.17 2.21 ± 0.12 3.06 ± 0.15WISE J062748.89−140155.0 13.94 ± 0.03 13.36 ± 0.04 11.49 ± 0.15 8.04 ± 0.14 0.59 ± 0.05 1.87 ± 0.15WISE J071429.04−121239.5 15.67 ± 0.06 13.57 ± 0.04 >12.56 8.31 ± 0.23 2.11 ± 0.07 <1.01WISE J082009.59−761323.1 15.38 ± 0.04 14.50 ± 0.04 12.91 ± 0.34 >9.76 0.89 ± 0.05 1.59 ± 0.34WISE J120854.51−484423.2 17.07 ± 0.13 14.49 ± 0.05 11.33 ± 0.09 8.98 ± 0.27 2.58 ± 0.14 3.16 ± 0.10WISE J150119.95−045329.7 13.87 ± 0.03 13.32 ± 0.03 12.18 ± 0.26 >9.51 0.55 ± 0.04 1.14 ± 0.26WISE J153015.18−261753.5 18.11 ± 0.49 14.23 ± 0.06 10.47 ± 0.09 >8.97 3.89 ± 0.50 3.76 ± 0.11WISE J154500.53−843159.0 17.59 ± 0.19 14.81 ± 0.07 11.16 ± 0.09 8.63 ± 0.26 2.78 ± 0.20 3.65 ± 0.11WISE J164312.53+371535.4 16.56 ± 0.08 13.72 ± 0.04 10.85 ± 0.07 >8.74 2.84 ± 0.09 2.88 ± 0.08WISE J165031.12−001417.8 16.42 ± 0.10 13.88 ± 0.05 9.78 ± 0.05 8.03 ± 0.20 2.54 ± 0.11 4.10 ± 0.06WISE J172256.74+555031.7 16.34 ± 0.05 14.17 ± 0.04 10.85 ± 0.05 >9.27 2.17 ± 0.06 3.32 ± 0.06WISE J175443.93+323332.5 17.22 ± 0.14 15.54 ± 0.12 12.17 ± 0.23 >8.72 1.69 ± 0.19 3.37 ± 0.26WISE J185916.88+362732.5 >18.42 14.53 ± 0.06 11.44 ± 0.12 9.30 ± 0.48 >3.89 3.09 ± 0.13WISE J223204.75+384703.8 17.22 ± 0.16 14.82 ± 0.07 12.28 ± 0.27 9.37 ± 0.52 2.40 ± 0.18 2.55 ± 0.28WISE J224245.85−201511.0 >18.32 15.15 ± 0.13 11.73 ± 0.24 >9.02 >3.16 3.42 ± 0.27WISE J224416.22+433724.7 15.89 ± 0.07 14.36 ± 0.05 12.57 ± 0.39 >9.29 1.54 ± 0.09 1.79 ± 0.39WISE J225144.24+243034.9 16.40 ± 0.10 14.89 ± 0.09 > 12.54 >9.05 1.51 ± 0.13 <2.35WISE J233555.92+650621.2 17.44 ± 0.19 14.30 ± 0.05 >13.01 8.67 ± 0.20 3.15 ± 0.20 <1.28WISE J234847.41+335104.9 14.38 ± 0.03 13.24 ± 0.03 11.74 ± 0.15 >8.82 1.14 ± 0.04 1.50 ± 0.16WISE J235135.76+735746.9 18.43 ± 0.50 14.97 ± 0.08 12.12 ± 0.26 >9.33 3.46 ± 0.51 2.84 ± 0.28WISE J235329.88+801604.3 18.34 ± 0.37 15.26 ± 0.08 >13.09 >9.10 3.08 ± 0.38 <2.18
WISE All-Sky photometry for the interlopers is listed inTable 9. Figure 3 shows where these sources encroach on theWISE W1−W2 versus W2−W3 color space of T and Y dwarfs.Although many are located on the periphery, some look likelegitimate brown dwarf candidates because they fall squarelyin the brown dwarf color–color space. Interlopers that wereobserved with Spitzer are logged in Table 10 and shown inFigure 8. Only a few of the interlopers are distinguishable frombrown dwarfs in this figure.
Spectroscopic observations are listed in Table 11 along withdescriptions of the spectra. In most cases we observe faint near-IR continuum and no discernible spectral features. However,some objects are unique and we discuss those sources in thefollowing subsections.
6.1. Young Stellar Objects
Two of the interlopers, WISE J0421+3721 andWISE J0546+2639, were selected from candidates in ourL-dwarf color selection process (W1−W2 > 0.4 mag and no as-sociation with a 2MASS source). Both objects are missing fromthe 2MASS All-Sky PSC, but are listed in the 2MASS Sur-vey Point Source Reject Table. WISE J0421+3721 has 2MASSmagnitudes J = 17.0 ± 0.2, H = 15.0 ± 0.1, and Ks = 14.1 ±0.1 mag. WISE J0546+2639 is flagged as an artifact contami-nated source with J = 15.88 ± 0.07, H = 14.50 ± 0.06, and Ks =13.26 ± 0.03 mag. These two sources have very similar near-IRcolors, and consistent W1−W2 colors. The IRTF/SpeX spectra
Table 10Spitzer/IRAC Photometry for Interloper Sources
Object Name ch1 ch2 ch1 − ch2(mag) (mag) (mag)
(1) (2) (3) (4)
WISE J0148−1048 16.47 ± 0.04 14.63 ± 0.02 1.84 ± 0.04WISE J0201+4836 16.54 ± 0.04 14.70 ± 0.02 1.84 ± 0.04WISE J0220+6202 14.79 ± 0.02 13.05 ± 0.02 1.75 ± 0.03WISE J0221+5903 15.06 ± 0.02 13.93 ± 0.02 1.13 ± 0.03WISE J0446−0726 15.59 ± 0.03 14.35 ± 0.02 1.25 ± 0.03WISE J0543+4653 15.91 ± 0.03 13.64 ± 0.02 2.27 ± 0.03WISE J0546+2639 12.88 ± 0.02 12.67 ± 0.02 0.21 ± 0.02WISE J0554+2457 14.94 ± 0.02 14.10 ± 0.02 0.84 ± 0.03WISE J0714−1212 15.51 ± 0.03 13.89 ± 0.02 1.63 ± 0.03WISE J0820−7613 15.24 ± 0.02 14.63 ± 0.02 0.61 ± 0.03WISE J1208−4844 15.98 ± 0.03 14.43 ± 0.02 1.55 ± 0.04WISE J1501−0453 13.84 ± 0.02 13.49 ± 0.02 0.35 ± 0.03WISE J1530−2617 16.11 ± 0.03 14.24 ± 0.02 1.87 ± 0.04WISE J1545−8431 16.54 ± 0.04 14.83 ± 0.02 1.71 ± 0.04WISE J1754+3233 16.68 ± 0.04 15.51 ± 0.02 1.17 ± 0.05WISE J1859+3627 16.50 ± 0.04 14.49 ± 0.02 2.01 ± 0.04WISE J2232+3847 15.87 ± 0.03 14.39 ± 0.02 1.47 ± 0.03WISE J2242−2015 17.48 ± 0.07 15.11 ± 0.02 2.37 ± 0.07WISE J2244+4337 15.21 ± 0.02 14.33 ± 0.02 0.88 ± 0.03WISE J2335+6506 15.62 ± 0.03 13.89 ± 0.02 1.73 ± 0.03WISE J2351+7357 16.90 ± 0.05 14.93 ± 0.02 1.97 ± 0.05WISE J2353+8016 16.40 ± 0.04 15.13 ± 0.02 1.26 ± 0.04
38

The Astrophysical Journal Supplement Series, 205:6 (49pp), 2013 March Mace et al.
Table 11Follow-up Near-IR Spectroscopy for Interloper Sources
Object Name Spectrograph Obs. Date Description of SpectrumJ2000 Coordinates (UT)(1) (2) (3) (4)
WISE J0047+6718 Keck/NIRSPEC-H 2010 Jul 18 Faint continuum throughout the H bandWISE J0148−1048 Keck/NIRSPEC-J 2011 Aug 9 Faint continuum; cluster of Spitzer sources within 0.′′5WISE J0201+4836 Keck/NIRSPEC-J 2011 Oct 8/9 Faint continuum; two blended Spitzer sourcesWISE J0220+6202 Palomar/TSpec 2012 Jan 7 Faint K-band continuumWISE J0221+5903 Palomar/TSpec 2011 Nov 8 Faint K-band continuum; no motion between WISE and Spitzer epochsWISE J0404+2618 Palomar/TSpec 2012 Jan 6 K-band and faint H-band continuumWISE J0421+3721 IRTF/SpeX 2012 Feb 1 YSO with high S/N hump throughout NIR; peak flux near 1.8 μm (Figure 26)WISE J0446−0726 Palomar/TSpec 2012 Jan 7 Faint H- and K-band continuum; no motion between WISE and Spitzer epochsWISE J0543+4653 Gemini/GNIRS 2012 Jan 3 Faint continuum throughout near-IR, flux decreases as wavelength increasesWISE J0546+2639 IRTF/SpeX 2012 Jan 31 YSO with high S/N hump throughout NIR; peak flux near 1.9 μm (Figure 26)WISE J0554+2457 Palomar/TSpec 2011 Nov 8 Faint K-band continuumWISE J0627−1401 IRTF/SpeX 2012 Feb 13 Extended object in the guider camera; very faint K-band fluxWISE J0714−1212 IRTF/SpeX 2010 Dec 18 Reddened star in Galactic plane - Upper Canis MajorWISE J0820−7613 Magellan/FIRE 2010 Dec 23 No near-IR flux measured; no motion between WISE and Spitzer epochsWISE J1208−4844 HST/WFC2 2011 May 19 Extended source in HST imageWISE J1501−0453 IRTF/SpeX 2012 Feb 13 Faint continuum throughout near-IRWISE J1530−2617 Keck/NIRSPEC-J 2012 Mar 30 AGN with Hα at 1.3136 μm, z ∼ 1.00 (Figure 27)WISE J1545−8431 HST/WFC3 2011 May 12 Extended source in HST imageWISE J1643+3715 IRTF/SpeX 2010 May 27 No near-IR flux measuredWISE J1650−0014 IRTF/SpeX 2010 May 26 No near-IR flux measuredWISE J1722+5550 IRTF/SpeX 2010 May 26 No near-IR flux measuredWISE J1754+3233 HST/WFC3 2011 Mar 19/20 Hβ and [O iii] (500.7 nm) at 1.4192 and 1.4611 μm for z ∼ 1.92 AGN (Figure 28)WISE J1859+3627 Keck/NIRSPEC-J 2011 Aug 8 Faint continuum; no motion between WISE and Spitzer epochsWISE J2232+3847 HST/WFC3 2011 Sep 21/22 Continuum throughout near-IR; no motion between WISE and Spitzer epochsWISE J2242−2015 Keck/NIRSPEC-J 2012 Sep 25 Faint continuum throughout the J bandWISE J2244+4337 Palomar/TSpec 2012 Jan 7 Faint continuum throughout near-IRWISE J2251+2430 Keck/NIRSPEC-J 2012 Jun 9 Faint continuum; broad emission hump at 1.167 μmWISE J2335+6506 Keck/NIRSPEC-J 2011 Oct 9 Faint continuum; no motion between WISE and Spitzer epochsWISE J2348+3351 IRTF/SpeX 2010 Sep 14 Faint continuum throughout near-IRWISE J2351+7357 Keck/NIRSPEC-J 2012 Sep 25 Faint continuum throughout the J bandWISE J2353+8016 Keck/NIRSPEC-J 2012 Sep 25 Faint continuum throughout the J band
of these sources are shown in Figure 26 with prominent spectralfeatures marked.
We identify these sources as YSOs based on comparisons tothe survey of 110 young stellar objects by Connelley & Greene(2010). We find that a few of their YSO spectra have similarmorphologies to our newly identified YSOs in that they thatlack emission features, peak around 1.8 μm, and show weak Hand CO absorption features. The best spectral match Elias 2-25(16:26:34.167−24:23:28.26 J2000) is a T Tauri star with similarnear-IR colors to the new YSOs (J − H = 1.598, H − Ks =0.943, and J − Ks = 2.542). The other T Tauri objects fromConnelley & Greene (2010) with similar colors and spectralmorphologies are V806 Tau, FS Tau A, and LZK 12.
Employing the α spectral index, defined as the slope oflog(λFλ) versus log(λ) (Lada 1987), over the WISE passbandswe find α = −1.63 and −1.42 for WISE J0421+3721 andWISE J0546+2639, respectively. Inclusion of the Ks and W3magnitudes for WISE J0421+3721 produces α = −1.45. Thesevalues are consistent with evolved T Tauri stars between ClassII and Class III in the proximity of Taurus-Auriga.
6.2. Active Galactic Nuclei
Although many of the interlopers show faint continuumflux, two of them show spectral features indicative of AGN.WISE J1530−2617 and WISE J1754+3233 have Spitzer and
WISE colors consistent with reddened extragalactic sources(Wright et al. 2010; Eisenhardt et al. 2012; Stern et al. 2012).
Figure 27 shows the Keck/NIRSPEC J-band spectrum ofWISE J1530−2617. We identify Hα, [N ii] λ6583, and broad[S ii] λλ6716, 6731 at 1.3136, 1.3158 and 1.3313, 1.3334 μm,respectively. This produces a redshift z = 1.00 and line fluxratio N[II]/Hα = 1.314, which is typical for an AGN (Veilleux& Osterbrock 1987). Also, W1 − W2 = 3.89 ± 0.50 for thissource, which is even redder than the W1W2-dropouts shownin Figure 1 of Eisenhardt et al. (2012).
The HST/WFC3 spectrum of WISE J1754+3233 is shown inFigure 28. We determine that z= 1.92 for Hβ and [O iii] λλ4959,5007 at 1.4192, 1.4471, and 1.4611 μm, respectively. Although[O iii] λ5007/Hβ = 1.129 is not unique to AGN, its WISE colorsidentify it as an AGN (Wright et al. 2010). This object is onethat was initially identified as a candidate in the PreliminaryData Release, but its updated All-Sky Data Release photometrymoved it outside our selection criteria (see Figure 3).
7. CONCLUSIONS
We present the spectra of ∼100 T dwarfs uncovered withWISE. Spectral types were derived by visual comparisonto spectral standards, and modified median-flux spectral in-dices were computed for WISE brown dwarf discoveries. Wealso define the J-narrow index to help better identify future
39

The Astrophysical Journal Supplement Series, 205:6 (49pp), 2013 March Mace et al.
Figure 26. IRTF/SpeX spectra of two YSOs found in the same WISE color spaceas T dwarfs. Both sources lack clear emission features and display photosphericH (dotted and dashed lines) and CO (dash-dotted lines) absorption.
(A color version of this figure is available in the online journal.)
Figure 27. Keck/NIRSPEC spectrum of WISE J153015.18−261753.6, an AGNthat is on the reddest edges of WISE brown dwarf color space. The Hα,[N ii] λ6583, and broad double-peaked [S ii] λλ6716, 6731 lines in the J bandplace this object at z = 1.00.
early-type Y dwarf discoveries. Along with the 89 T dwarfsreported by Kirkpatrick et al. (2011), our follow-up triples thenumber of known brown dwarfs with spectral types later than T5.
Using the classification schemes in the literature, we identifythree extremely red brown dwarfs that cannot easily be classifiedas L or T type. These objects display Y- and J-band spectralmorphologies most similar to T dwarfs, have red J − K colors,and lack distinct CH4 absorption features. Although gravity,metallicity, and temperature variations can all contribute to the
Figure 28. HST/WFC3 spectrum of WISE J175443.93+323332.5, an AGNinterloper. The Hβ and [O iii] λλ4959, 5007 lines in the H band place this objectat z = 1.92.
reddening in these objects, variability seen in WISE J1738+6242hints at rapid (on the order of a year) atmospheric changes.Perhaps the discrepant features we see in these extremely redobjects are due to an unresolved redL + T binary. If the T dwarfcomponent of this system constrains other physical parameters,such as the age or metallicity of the system, this would shedlight on the underlying cause of the red L dwarf phenomenon.Alternatively, these objects may bridge the L dwarf sequenceto the HR 8799 planets and provide a greater understanding ofboth with further investigation.
Along with the spectral indices, we derive the Y/J, H/J,and K/J peak flux ratios for ∼320 T and Y dwarfs. TheH/J ratio traces the J − H color and shows a reversal aroundT7. The Y0s stand-out in the H/J index as breaking the trend,and may be less cloudy than the later Y dwarfs. Thus, the spectralsequence of the late-type T dwarfs and the early-type Y dwarfsmay no longer be correlated directly to temperature, but alsoto other atmospheric conditions like cloud fraction, metallicity,grain size, and surface gravity. The K/J index shows a largedispersion of ∼1.5 mag, which can be matched by the sulfidecloud models presented by Morley et al. (2012) and not byprevious cloudless models used for late-type T dwarfs. Wefind that although most late-type T dwarfs match the J- andH-band morphology of the spectral standards, one-third showsignificantly suppressed K-band flux relative to the standards(smaller K/J values), which implies higher surface gravities,cloudless atmospheres, and/or low metallicities. Comparison toatmospheric models reveals that the small Y/J peak flux ratiosof late-type T dwarfs are best matched to cloudy models and/oroversolar metallicities. Objects with a Y/J index greater thanthe standards are best matched to cloudless models and/or sub-solar metallicities. However, we cannot disentangle the physicalparameters modulating T dwarf colors until model grids areextended to include various cloud species at lower temperaturesand non-solar metallicities.
This publication makes use of data products from the Wide-field Infrared Survey Explorer, which is a joint project of the
40

The Astrophysical Journal Supplement Series, 205:6 (49pp), 2013 March Mace et al.
University of California, Los Angeles, and the Jet PropulsionLaboratory/California Institute of Technology, funded by theNational Aeronautics and Space Administration. We thank theInfrared Processing and Analysis Center at Caltech for fundsprovided by the Visiting Graduate Fellowship. Observations pre-sented here were obtained under programs GN-2011A-Q-67 andGN-2011B-Q-7 at the Gemini Observatory, which is operated bythe Association of Universities for Research in Astronomy, Inc.,under a cooperative agreement with the NSF on behalf of theGemini partnership: the National Science Foundation (UnitedStates), the Science and Technology Facilities Council (UnitedKingdom), the National Research Council (Canada), CONICYT(Chile), the Australian Research Council (Australia), Ministerioda Ciencia, Tecnologia e Inovacao (Brazil), and Ministerio deCiencia, Tecnologıa e Innovacion Productiva (Argentina). Somephotometry in this paper is based on observations obtained atthe Southern Astrophysical Research (SOAR) telescope, whichis a joint project of the Ministerio da Ciencia, Tecnologia, eInovacao (MCTI) da Republica Federativa do Brasil, the U.S.National Optical Astronomy Observatory (NOAO), the Univer-sity of North Carolina at Chapel Hill (UNC), and MichiganState University (MSU). This publication also makes use ofdata products from 2MASS, SDSS, and UKIDSS. 2MASS is ajoint project of the University of Massachusetts and the InfraredProcessing and Analysis Center/California Institute of Tech-nology, funded by the National Aeronautics and Space Admin-istration and the National Science Foundation. SDSS is fundedby the Alfred P. Sloan Foundation, the Participating Institutions,the National Science Foundation, the U.S. Department of En-ergy, the National Aeronautics and Space Administration, theJapanese Monbukagakusho, the Max Planck Society, and theHigher Education Funding Council for England. UKIDSS usesthe Wide Field Camera at the United Kingdom Infrared Tele-scope atop Mauna Kea, HI. We are grateful for the efforts ofthe instrument, calibration, and pipeline teams that have madethe UKIDSS data possible. We acknowledge use of the DSS,which were produced at the Space Telescope Science Insti-tute under U.S. Government grant NAG W-2166. The imagesof these surveys are based on photographic data obtained us-ing the Oschin Schmidt Telescope on Palomar Mountain andthe UK Schmidt Telescope. This research has made use of theNASA/IPAC Infrared Science Archive (IRSA), which is op-erated by the Jet Propulsion Laboratory, California Instituteof Technology, under contract with the National Aeronauticsand Space Administration. Our research has benefited from theM, L, and T dwarf compendium housed at DwarfArchives.org,whose server was funded by a NASA Small Research Grant, ad-ministered by the American Astronomical Society. The BrownDwarf Spectroscopic Survey (BDSS) provided and essentialcomparison library for our moderate-resolution spectroscopy.We are also indebted to the SIMBAD database, operated atCDS, Strasbourg, France. This work is based in part on ob-servations made with the Spitzer Space Telescope, which isoperated by the Jet Propulsion Laboratory, California Instituteof Technology, under a contract with NASA. Support for thiswork was provided by NASA through an award issued to pro-gram 70062 by JPL/Caltech. This work is also based in parton observations made with the NASA/ESA Hubble Space Tele-scope, obtained at the Space Telescope Science Institute, whichis operated by the Association of Universities for Research inAstronomy, Inc., under NASA contract NAS 5-26555. Theseobservations are associated with program 12330. Support forprogram 12330 was provided by NASA through a grant from the
Space Telescope Science Institute. Some of the spectroscopicdata presented herein were obtained at the W. M. Keck Obser-vatory, which is operated as a scientific partnership among theCalifornia Institute of Technology, the University of California,and the National Aeronautics and Space Administration. TheObservatory was made possible by the generous financial sup-port of the W. M. Keck Foundation. In acknowledgement of ourobserving time at Keck and the IRTF, we further wish to rec-ognize the very significant cultural role and reverence that thesummit of Mauna Kea has always had within the indigenousHawaiian community. We are most fortunate to have theopportunity to conduct observations from this mountain.We acknowledge use of PAIRITEL, which is operated bythe Smithsonian Astrophysical Observatory (SAO) and wasmade possible by a grant from the Harvard University Mil-ton Fund, the camera loaned from the University of Vir-ginia, and the continued support of the SAO and UC Berke-ley. The PAIRITEL project is supported by NASA GrantNNG06GH50G. This paper also includes data gathered withthe 6.5 m Magellan Telescopes located at Las Campanas Ob-servatory, Chile. We acknowledge fruitful discussions withTim Conrow, Roc Cutri, and Frank Masci, and acknowl-edge assistance with Magellan/FIRE observations by EmilyBowsher. We thank the anonymous referee for detailed andthoughtful recommendations for improving this paper prior topublication.
APPENDIX
INTEGRATED FLUX INDICES FORWISE-DISCOVERED BROWN DWARFS
Spectral indices from the literature are defined as integratedflux ratios such that
integrated flux index =∫
Fλ1−λ2dλ/∫
Fλ3−λ4dλ,
where the numerator, integrated between λ1 − λ2, covers aspecified absorption region and the denominator, integratedbetween λ3 − λ4, includes the corresponding peak flux. Thisresults in index values generally less than unity and greater thanzero. In this paper we redefine the spectral indices using themedian flux ratios which when defined as
median flux index = Fλ1−λ2/Fλ3−λ4 ,
for the same wavelengths produce consistent index values withthe integrated flux method, but decreased dispersion per spectraltype bin.
For each of the WISE-discovered brown dwarfs listed inTable 7 we first derived the integrated flux ratios from Burgasseret al. (2006b), Warren et al. (2007), and Delorme et al. (2008a).These are listed in Table 12. Indices were derived as described inSection 4.5, using a Monte Carlo method with 1000 realizationsof the spectrum. Figure 29 shows the median flux and integratedflux indices plotted as a function of spectral type, like Figure 21,but color coded by spectrograph. The Y/J, H/J, and K/Jflux ratios computed using the median flux and integratedflux methods are shown in Figure 30, also color coded byspectrograph.
The integrated flux indices show a clear instrumental bias,where the indices from IRTF/SpeX spectra sit distinctly abovethe others. This offset is the result of differences in spectral res-olution between instruments, and between near-infrared bands
41

Th
eA
strophysical
Journ
alSu
pplemen
tSeries,205:6
(49pp),2013M
archM
aceet
al.
Table 12Spectral Indices Using Integrated (not Median) Fluxes
Object Name Instrument NIR Sp. H2O−J CH4−J H2O−H CH4−H WJ NH3−HJ2000 Coordinates Type(1) (2) (3) (4) (5) (6) (7) (8) (9)
T Dwarf Discoveries from Kirkpatrick et al. (2011)
WISE J0008−1739 Keck/NIRSPEC-J T6 0.141 ± 0.025 0.393 ± 0.028 . . . . . . 0.463 ± 0.021 . . .
WISE J0123+4142 Keck/NIRSPEC-J T7 . . . 0.285 ± 0.051 . . . . . . 0.419 ± 0.041 . . .
WISE J0138−0322 IRTF/SpeX T3 0.409 ± 0.006 0.502 ± 0.004 0.536 ± 0.006 0.831 ± 0.007 0.655 ± 0.005 0.846 ± 0.008WISE J0148−7202 Magellan/FIRE T9.5 −0.017 ± 0.011a 0.076 ± 0.006a 0.070 ± 0.013a 0.016 ± 0.012a 0.152 ± 0.006a 0.431 ± 0.015a
WISE J0150+3827 IRTF/SpeX T0 0.665 ± 0.006 0.908 ± 0.006 0.675 ± 0.004 0.979 ± 0.005 0.976 ± 0.006 0.891 ± 0.006WISE J0221+3842 Palomar/TSpec T6.5 0.129 ± 0.019 0.247 ± 0.016 0.179 ± 0.035 0.255 ± 0.022 0.349 ± 0.020 0.660 ± 0.039WISE J0223−2932 IRTF/SpeX T7.5 0.040 ± 0.007 0.156 ± 0.004 0.165 ± 0.012 0.163 ± 0.010 0.383 ± 0.005 0.696 ± 0.016
Keck/NIRSPEC-H T7 . . . . . . . . . 0.177 ± 0.022 . . . 0.580 ± 0.027WISE J0226−0211 Keck/NIRSPEC-H T7 . . . . . . . . . 0.104 ± 0.028 . . . 0.574 ± 0.032WISE J0254+0223 IRTF/SpeX T8 0.047 ± 0.003 0.188 ± 0.002 0.167 ± 0.004 0.111 ± 0.004 0.295 ± 0.002 0.572 ± 0.005WISE J0305+3954 Palomar/TSpec T6 0.111 ± 0.012 0.334 ± 0.008 0.355 ± 0.018 0.225 ± 0.012 0.435 ± 0.009 0.719 ± 0.019WISE J0307+2904 IRTF/SpeX T6.5 0.142 ± 0.042 0.389 ± 0.029 0.302 ± 0.060 0.217 ± 0.045 0.486 ± 0.026 0.821 ± 0.079WISE J0313+7807 Palomar/TSpec T8.5 0.121 ± 0.021 0.114 ± 0.010 0.251 ± 0.030 0.097 ± 0.019 0.341 ± 0.011 0.608 ± 0.029WISE J0323−6025 Magellan/FIRE T8.5 0.052 ± 0.016 0.166 ± 0.008 0.179 ± 0.021 0.121 ± 0.013 0.283 ± 0.008 0.554 ± 0.018WISE J0333−5856 SOAR/OSIRIS T3 . . . 0.511 ± 0.021 0.515 ± 0.018 0.714 ± 0.016 . . . 0.711 ± 0.020WISE J0410+1411 IRTF/SpeX T6 0.083 ± 0.030 0.313 ± 0.022 0.247 ± 0.049 0.269 ± 0.042 0.416 ± 0.020 0.669 ± 0.055WISE J0448−1935 IRTF/SpeX T5 pec 0.196 ± 0.017 0.398 ± 0.013 0.324 ± 0.029 0.417 ± 0.029 0.532 ± 0.012 0.765 ± 0.039WISE J0458+6434 IRTF/SpeX T8.5 0.039 ± 0.015 0.281 ± 0.013 0.125 ± 0.019 0.080 ± 0.018 0.289 ± 0.009 0.477 ± 0.026WISE J0500−1223 IRTF/SpeX T8 0.034 ± 0.026 0.200 ± 0.018 0.112 ± 0.037 0.106 ± 0.034 0.315 ± 0.016 0.576 ± 0.045WISE J0513+0608 Palomar/TSpec T6.5 0.159 ± 0.006 0.315 ± 0.004 0.287 ± 0.009 0.232 ± 0.006 0.420 ± 0.004 0.698 ± 0.010WISE J0525+6739 IRTF/SpeX T6 pec 0.171 ± 0.009 0.323 ± 0.006 0.291 ± 0.017 0.314 ± 0.016 0.455 ± 0.006 0.722 ± 0.022WISE J0528−3308 Palomar/TSpec T7 pec −0.002 ± 0.039 0.272 ± 0.014 0.183 ± 0.048 0.233 ± 0.029 0.377 ± 0.013 0.631 ± 0.044WISE J0539−1034 Palomar/TSpec T5.5 0.177 ± 0.022 0.335 ± 0.013 0.426 ± 0.037 0.302 ± 0.023 0.485 ± 0.014 0.827 ± 0.038WISE J0542−1628 Palomar/TSpec T6.5 0.144 ± 0.009 0.266 ± 0.005 0.215 ± 0.012 0.226 ± 0.008 0.406 ± 0.004 0.686 ± 0.012WISE J0611−0410 IRTF/SpeX T0 0.583 ± 0.013 0.590 ± 0.010 0.657 ± 0.012 1.043 ± 0.014 0.760 ± 0.011 0.985 ± 0.015WISE J0612−4920 SOAR/OSIRIS T3.5 . . . 0.474 ± 0.039 0.357 ± 0.035 0.683 ± 0.030 . . . 0.755 ± 0.042WISE J0612−3036 Palomar/TSpec T6 0.117 ± 0.001 0.311 ± 0.001 0.317 ± 0.001 0.315 ± 0.001 0.443 ± 0.001 0.793 ± 0.001WISE J0614+3912 Palomar/TSpec T6 0.140 ± 0.023 0.401 ± 0.012 0.334 ± 0.023 0.273 ± 0.016 0.465 ± 0.012 0.789 ± 0.026WISE J0623−0456 IRTF/SpeX T8 0.002 ± 0.028 0.293 ± 0.020 0.166 ± 0.039 0.082 ± 0.032 0.425 ± 0.019 0.721 ± 0.052WISE J0625+5646 Palomar/TSpec T6 0.182 ± 0.012 0.312 ± 0.007 0.330 ± 0.020 0.275 ± 0.013 0.425 ± 0.007 0.686 ± 0.020WISE J0627−1114 IRTF/SpeX T6 0.163 ± 0.004 0.315 ± 0.003 0.277 ± 0.005 0.339 ± 0.005 0.454 ± 0.003 0.654 ± 0.007WISE J0656+4205 IRTF/SpeX T3 0.466 ± 0.010 0.436 ± 0.007 0.489 ± 0.011 0.792 ± 0.012 0.738 ± 0.008 0.836 ± 0.014WISE J0744+5628 Palomar/TSpec T8 0.156 ± 0.031 0.266 ± 0.018 0.196 ± 0.061 −0.054 ± 0.041 0.404 ± 0.018 0.695 ± 0.061WISE J0750+2725 Keck/NIRSPEC-JH T8.5 0.036 ± 0.008 0.118 ± 0.008 . . . 0.039 ± 0.004 0.231 ± 0.006 0.578 ± 0.005WISE J0751−7634 Magellan/FIRE T9 0.010 ± 0.023 0.132± 0.013 0.224± 0.042 0.117± 0.029 0.178± 0.012 0.511± 0.042WISE J0759−4904 Magellan/FIRE T8 0.036 ± 0.003 0.160 ± 0.002 0.154 ± 0.004 0.116 ± 0.004 0.279 ± 0.002 0.615 ± 0.006WISE J0819−0335 IRTF/SpeX T4 0.384 ± 0.004 0.474 ± 0.003 0.395 ± 0.005 0.654 ± 0.005 0.642 ± 0.003 0.761 ± 0.006WISE J0821+1443 IRTF/SpeX T5.5 0.199 ± 0.011 0.352 ± 0.009 0.317 ± 0.016 0.383 ± 0.015 0.506 ± 0.009 0.714 ± 0.020WISE J0836−1859 Magellan/FIRE T8 pec 0.046 ± 0.014 0.148 ± 0.005 0.153 ± 0.015 0.118 ± 0.010 0.310 ± 0.007 0.609 ± 0.014WISE J0857+5604 Palomar/TSpec T8 0.065 ± 0.015 0.171 ± 0.008 0.095 ± 0.025 0.094 ± 0.017 0.311 ± 0.008 0.534 ± 0.025
42
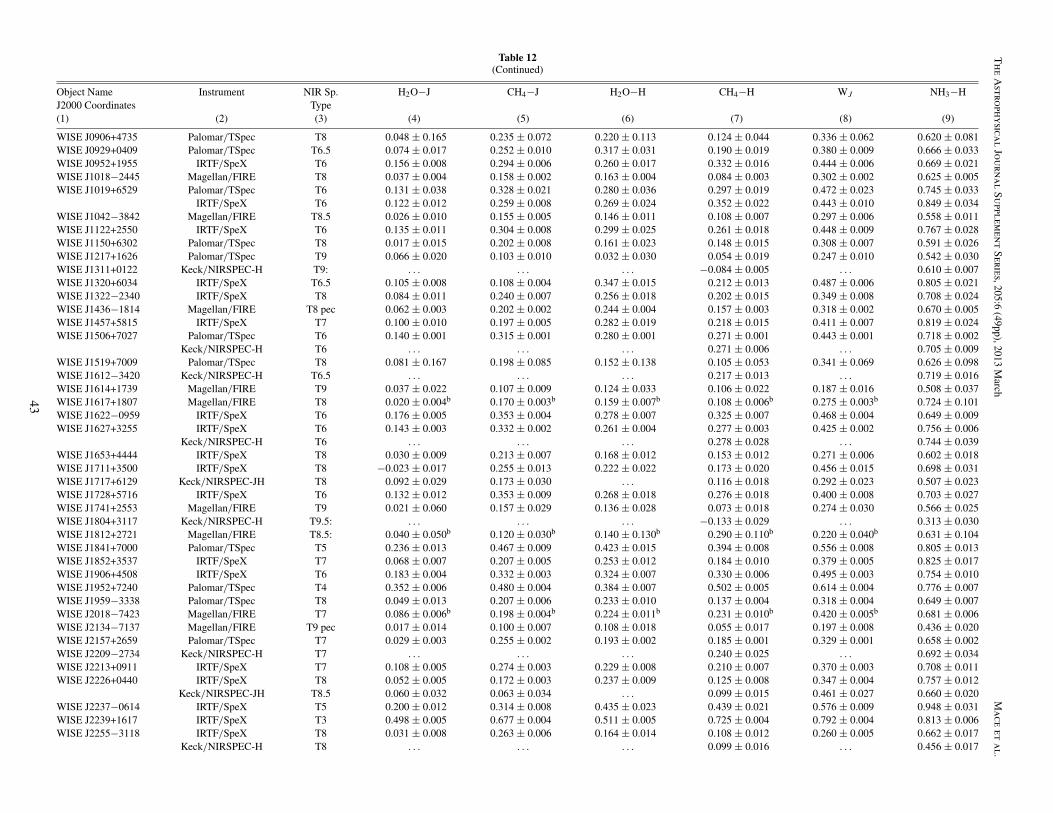
Th
eA
strophysical
Journ
alSu
pplemen
tSeries,205:6
(49pp),2013M
archM
aceet
al.Table 12
(Continued)
Object Name Instrument NIR Sp. H2O−J CH4−J H2O−H CH4−H WJ NH3−HJ2000 Coordinates Type(1) (2) (3) (4) (5) (6) (7) (8) (9)
WISE J0906+4735 Palomar/TSpec T8 0.048 ± 0.165 0.235 ± 0.072 0.220 ± 0.113 0.124 ± 0.044 0.336 ± 0.062 0.620 ± 0.081WISE J0929+0409 Palomar/TSpec T6.5 0.074 ± 0.017 0.252 ± 0.010 0.317 ± 0.031 0.190 ± 0.019 0.380 ± 0.009 0.666 ± 0.033WISE J0952+1955 IRTF/SpeX T6 0.156 ± 0.008 0.294 ± 0.006 0.260 ± 0.017 0.332 ± 0.016 0.444 ± 0.006 0.669 ± 0.021WISE J1018−2445 Magellan/FIRE T8 0.037 ± 0.004 0.158 ± 0.002 0.163 ± 0.004 0.084 ± 0.003 0.302 ± 0.002 0.625 ± 0.005WISE J1019+6529 Palomar/TSpec T6 0.131 ± 0.038 0.328 ± 0.021 0.280 ± 0.036 0.297 ± 0.019 0.472 ± 0.023 0.745 ± 0.033
IRTF/SpeX T6 0.122 ± 0.012 0.259 ± 0.008 0.269 ± 0.024 0.352 ± 0.022 0.443 ± 0.010 0.849 ± 0.034WISE J1042−3842 Magellan/FIRE T8.5 0.026 ± 0.010 0.155 ± 0.005 0.146 ± 0.011 0.108 ± 0.007 0.297 ± 0.006 0.558 ± 0.011WISE J1122+2550 IRTF/SpeX T6 0.135 ± 0.011 0.304 ± 0.008 0.299 ± 0.025 0.261 ± 0.018 0.448 ± 0.009 0.767 ± 0.028WISE J1150+6302 Palomar/TSpec T8 0.017 ± 0.015 0.202 ± 0.008 0.161 ± 0.023 0.148 ± 0.015 0.308 ± 0.007 0.591 ± 0.026WISE J1217+1626 Palomar/TSpec T9 0.066 ± 0.020 0.103 ± 0.010 0.032 ± 0.030 0.054 ± 0.019 0.247 ± 0.010 0.542 ± 0.030WISE J1311+0122 Keck/NIRSPEC-H T9: . . . . . . . . . −0.084 ± 0.005 . . . 0.610 ± 0.007WISE J1320+6034 IRTF/SpeX T6.5 0.105 ± 0.008 0.108 ± 0.004 0.347 ± 0.015 0.212 ± 0.013 0.487 ± 0.006 0.805 ± 0.021WISE J1322−2340 IRTF/SpeX T8 0.084 ± 0.011 0.240 ± 0.007 0.256 ± 0.018 0.202 ± 0.015 0.349 ± 0.008 0.708 ± 0.024WISE J1436−1814 Magellan/FIRE T8 pec 0.062 ± 0.003 0.202 ± 0.002 0.244 ± 0.004 0.157 ± 0.003 0.318 ± 0.002 0.670 ± 0.005WISE J1457+5815 IRTF/SpeX T7 0.100 ± 0.010 0.197 ± 0.005 0.282 ± 0.019 0.218 ± 0.015 0.411 ± 0.007 0.819 ± 0.024WISE J1506+7027 Palomar/TSpec T6 0.140 ± 0.001 0.315 ± 0.001 0.280 ± 0.001 0.271 ± 0.001 0.443 ± 0.001 0.718 ± 0.002
Keck/NIRSPEC-H T6 . . . . . . . . . 0.271 ± 0.006 . . . 0.705 ± 0.009WISE J1519+7009 Palomar/TSpec T8 0.081 ± 0.167 0.198 ± 0.085 0.152 ± 0.138 0.105 ± 0.053 0.341 ± 0.069 0.626 ± 0.098WISE J1612−3420 Keck/NIRSPEC-H T6.5 . . . . . . . . . 0.217 ± 0.013 . . . 0.719 ± 0.016WISE J1614+1739 Magellan/FIRE T9 0.037 ± 0.022 0.107 ± 0.009 0.124 ± 0.033 0.106 ± 0.022 0.187 ± 0.016 0.508 ± 0.037WISE J1617+1807 Magellan/FIRE T8 0.020 ± 0.004b 0.170 ± 0.003b 0.159 ± 0.007b 0.108 ± 0.006b 0.275 ± 0.003b 0.724 ± 0.101WISE J1622−0959 IRTF/SpeX T6 0.176 ± 0.005 0.353 ± 0.004 0.278 ± 0.007 0.325 ± 0.007 0.468 ± 0.004 0.649 ± 0.009WISE J1627+3255 IRTF/SpeX T6 0.143 ± 0.003 0.332 ± 0.002 0.261 ± 0.004 0.277 ± 0.003 0.425 ± 0.002 0.756 ± 0.006
Keck/NIRSPEC-H T6 . . . . . . . . . 0.278 ± 0.028 . . . 0.744 ± 0.039WISE J1653+4444 IRTF/SpeX T8 0.030 ± 0.009 0.213 ± 0.007 0.168 ± 0.012 0.153 ± 0.012 0.271 ± 0.006 0.602 ± 0.018WISE J1711+3500 IRTF/SpeX T8 −0.023 ± 0.017 0.255 ± 0.013 0.222 ± 0.022 0.173 ± 0.020 0.456 ± 0.015 0.698 ± 0.031WISE J1717+6129 Keck/NIRSPEC-JH T8 0.092 ± 0.029 0.173 ± 0.030 . . . 0.116 ± 0.018 0.292 ± 0.023 0.507 ± 0.023WISE J1728+5716 IRTF/SpeX T6 0.132 ± 0.012 0.353 ± 0.009 0.268 ± 0.018 0.276 ± 0.018 0.400 ± 0.008 0.703 ± 0.027WISE J1741+2553 Magellan/FIRE T9 0.021 ± 0.060 0.157 ± 0.029 0.136 ± 0.028 0.073 ± 0.018 0.274 ± 0.030 0.566 ± 0.025WISE J1804+3117 Keck/NIRSPEC-H T9.5: . . . . . . . . . −0.133 ± 0.029 . . . 0.313 ± 0.030WISE J1812+2721 Magellan/FIRE T8.5: 0.040 ± 0.050b 0.120 ± 0.030b 0.140 ± 0.130b 0.290 ± 0.110b 0.220 ± 0.040b 0.631 ± 0.104WISE J1841+7000 Palomar/TSpec T5 0.236 ± 0.013 0.467 ± 0.009 0.423 ± 0.015 0.394 ± 0.008 0.556 ± 0.008 0.805 ± 0.013WISE J1852+3537 IRTF/SpeX T7 0.068 ± 0.007 0.207 ± 0.005 0.253 ± 0.012 0.184 ± 0.010 0.379 ± 0.005 0.825 ± 0.017WISE J1906+4508 IRTF/SpeX T6 0.183 ± 0.004 0.332 ± 0.003 0.324 ± 0.007 0.330 ± 0.006 0.495 ± 0.003 0.754 ± 0.010WISE J1952+7240 Palomar/TSpec T4 0.352 ± 0.006 0.480 ± 0.004 0.384 ± 0.007 0.502 ± 0.005 0.614 ± 0.004 0.776 ± 0.007WISE J1959−3338 Palomar/TSpec T8 0.049 ± 0.013 0.207 ± 0.006 0.233 ± 0.010 0.137 ± 0.004 0.318 ± 0.004 0.649 ± 0.007WISE J2018−7423 Magellan/FIRE T7 0.086 ± 0.006b 0.198 ± 0.004b 0.224 ± 0.011b 0.231 ± 0.010b 0.420 ± 0.005b 0.681 ± 0.006WISE J2134−7137 Magellan/FIRE T9 pec 0.017 ± 0.014 0.100 ± 0.007 0.108 ± 0.018 0.055 ± 0.017 0.197 ± 0.008 0.436 ± 0.020WISE J2157+2659 Palomar/TSpec T7 0.029 ± 0.003 0.255 ± 0.002 0.193 ± 0.002 0.185 ± 0.001 0.329 ± 0.001 0.658 ± 0.002WISE J2209−2734 Keck/NIRSPEC-H T7 . . . . . . . . . 0.240 ± 0.025 . . . 0.692 ± 0.034WISE J2213+0911 IRTF/SpeX T7 0.108 ± 0.005 0.274 ± 0.003 0.229 ± 0.008 0.210 ± 0.007 0.370 ± 0.003 0.708 ± 0.011WISE J2226+0440 IRTF/SpeX T8 0.052 ± 0.005 0.172 ± 0.003 0.237 ± 0.009 0.125 ± 0.008 0.347 ± 0.004 0.757 ± 0.012
Keck/NIRSPEC-JH T8.5 0.060 ± 0.032 0.063 ± 0.034 . . . 0.099 ± 0.015 0.461 ± 0.027 0.660 ± 0.020WISE J2237−0614 IRTF/SpeX T5 0.200 ± 0.012 0.314 ± 0.008 0.435 ± 0.023 0.439 ± 0.021 0.576 ± 0.009 0.948 ± 0.031WISE J2239+1617 IRTF/SpeX T3 0.498 ± 0.005 0.677 ± 0.004 0.511 ± 0.005 0.725 ± 0.004 0.792 ± 0.004 0.813 ± 0.006WISE J2255−3118 IRTF/SpeX T8 0.031 ± 0.008 0.263 ± 0.006 0.164 ± 0.014 0.108 ± 0.012 0.260 ± 0.005 0.662 ± 0.017
Keck/NIRSPEC-H T8 . . . . . . . . . 0.099 ± 0.016 . . . 0.456 ± 0.017
43

Th
eA
strophysical
Journ
alSu
pplemen
tSeries,205:6
(49pp),2013M
archM
aceet
al.
Table 12(Continued)
Object Name Instrument NIR Sp. H2O−J CH4−J H2O−H CH4−H WJ NH3−HJ2000 Coordinates Type(1) (2) (3) (4) (5) (6) (7) (8) (9)
WISE J2313−8037 Magellan/FIRE T8 0.044 ± 0.008b 0.116 ± 0.004b 0.174 ± 0.012b 0.142 ± 0.011b 0.324 ± 0.005b 0.561 ± 0.005WISE J2319−1844 IRTF/SpeX T7.5 0.072 ± 0.015 0.268 ± 0.010 0.167 ± 0.023 0.106 ± 0.021 0.308 ± 0.008 0.599 ± 0.033WISE J2325−4105 Magellan/FIRE T9 pec 0.011 ± 0.014 0.153 ± 0.009 0.047 ± 0.020 0.100 ± 0.015 0.222 ± 0.009 0.450 ± 0.021WISE J2340−0745 IRTF/SpeX T7 0.114 ± 0.004 0.253 ± 0.003 0.295 ± 0.007 0.242 ± 0.006 0.411 ± 0.003 0.827 ± 0.009WISE J2343−7418 Magellan/FIRE T6 0.184 ± 0.005 0.371 ± 0.003 0.297 ± 0.006 0.306 ± 0.005 0.489 ± 0.003 0.697 ± 0.007WISE J2344+1034 Keck/NIRSPEC-J T9 . . . 0.126 ± 0.013 . . . . . . 0.169 ± 0.009 . . .
WISE J2348−1028 IRTF/SpeX T7 0.078 ± 0.005 0.198 ± 0.003 0.252 ± 0.009 0.169 ± 0.008 0.373 ± 0.004 0.817 ± 0.012WISE J2359−7335 Magellan/FIRE T6.5 0.206 ± 0.008b 0.261 ± 0.004b 0.343 ± 0.011b 0.315 ± 0.008b 0.549 ± 0.005b 0.653 ± 0.005
T Dwarf Discoveries from This Paper
WISE J0005+3737 Keck/NIRSPEC-J T9 . . . 0.130 ± 0.016 . . . . . . 0.238 ± 0.019 . . .
WISE J0038+2758 Keck/NIRSPEC-J T9 −0.080 ± 0.020 0.102 ± 0.006 . . . . . . 0.174 ± 0.004 . . .
WISE J0038+8405 Keck/NIRSPEC-J T6 . . . . . . . . . . . . 0.464 ± 0.003 . . .
WISE J0040+0900 IRTF/SpeX T7 0.090 ± 0.004 0.259 ± 0.003 0.246 ± 0.008 0.231 ± 0.006 0.372 ± 0.003 0.661 ± 0.009WISE J0045+3611 IRTF/SpeX T5 0.201 ± 0.003 0.332 ± 0.002 0.304 ± 0.005 0.389 ± 0.005 0.468 ± 0.003 0.631 ± 0.006WISE J0049+2151 IRTF/SpeX T8.5 0.027 ± 0.004 0.179 ± 0.003 0.173 ± 0.006 0.088 ± 0.005 0.379 ± 0.003 0.607 ± 0.008WISE J0135+1715 IRTF/SpeX T6 0.170 ± 0.014 0.360 ± 0.010 0.313 ± 0.021 0.277 ± 0.018 0.570 ± 0.011 0.735 ± 0.028WISE J0210+4008 IRTF/SpeX T4.5 0.334 ± 0.006 0.409 ± 0.004 0.366 ± 0.008 0.535 ± 0.007 0.619 ± 0.005 0.705 ± 0.009WISE J0233+3030 IRTF/SpeX T6 0.216 ± 0.009 0.335 ± 0.006 0.331 ± 0.014 0.319 ± 0.012 0.504 ± 0.006 0.672 ± 0.017WISE J0245−3450 IRTF/SpeX T8 0.042 ± 0.013 0.185 ± 0.009 0.182 ± 0.021 0.126 ± 0.018 0.316 ± 0.009 0.577 ± 0.025WISE J0247+3725 Gemini/GNIRS T8 0.030 ± 0.007 0.164 ± 0.004 0.152 ± 0.008 0.089 ± 0.007 0.289 ± 0.004 0.574 ± 0.012WISE J0259−0346 Keck/NIRSPEC-J T5 . . . 0.414 ± 0.022 . . . . . . 0.526 ± 0.018 . . .
WISE J0316+3820 Palomar/TSpec T3 0.410 ± 0.015 0.516 ± 0.009 0.511 ± 0.012 0.669 ± 0.009 0.680 ± 0.011 0.817 ± 0.013WISE J0316+4307 Keck/NIRSPEC-JH T8 . . . 0.192 ± 0.013 . . . 0.070 ± 0.023 0.233 ± 0.009 0.564 ± 0.027WISE J0321−7347 Magellan/FIRE T8 0.072 ± 0.013 0.148 ± 0.004 0.192 ± 0.006 0.058 ± 0.003 0.302 ± 0.004 0.643 ± 0.005WISE J0325−3854 Keck/NIRSPEC-J T9 . . . 0.128 ± 0.022 . . . . . . 0.245 ± 0.013 . . .
WISE J0325+0831 IRTF/SpeX T7 0.096 ± 0.005 0.234 ± 0.004 0.279 ± 0.008 0.235 ± 0.008 0.406 ± 0.004 0.707 ± 0.012WISE J0335+4310 Keck/NIRSPEC-J T9 . . . 0.138 ± 0.009 . . . . . . 0.226 ± 0.016 . . .
WISE J0336−0143 Keck/NIRSPEC-J T8: . . . 0.147 ± 0.034 . . . . . . 0.344 ± 0.054 . . .
WISE J0336+2826 IRTF/SpeX T5 0.309 ± 0.009 0.403 ± 0.007 0.350 ± 0.011 0.474 ± 0.012 0.546 ± 0.007 0.789 ± 0.018WISE J0413−4750 Magellan/FIRE T9 0.033 ± 0.036 0.102 ± 0.041 0.193 ± 0.069 0.017 ± 0.027 0.284 ± 0.072 0.584 ± 0.235WISE J0424+0727 Keck/NIRSPEC-J T7.5 . . . 0.220 ± 0.006 . . . . . . 0.355 ± 0.005 . . .
WISE J0430+4633 Keck/NIRSPEC-J T8 . . . 0.229 ± 0.006 . . . . . . 0.281 ± 0.004 . . .
WISE J0512−3004 Keck/NIRSPEC-J T8.5 . . . 0.110 ± 0.009 . . . . . . 0.243 ± 0.007 . . .
WISE J0540+4832 Keck/NIRSPEC-J T8.5 . . . 0.161 ± 0.004 . . . . . . 0.278 ± 0.003 . . .
WISE J0546−0959 IRTF/SpeX T5 0.232 ± 0.006 0.484 ± 0.006 0.347 ± 0.012 0.434 ± 0.012 0.571 ± 0.005 0.771 ± 0.016WISE J0614+0951 Palomar/TSpec T7 0.130 ± 0.001 0.278 ± 0.001 0.300 ± 0.001 0.209 ± 0.001 0.347 ± 0.001 0.699 ± 0.001WISE J0629+2418 IRTF/SpeX T2 sb 0.447 ± 0.011 0.626 ± 0.009 0.512 ± 0.011 0.832 ± 0.013 0.607 ± 0.008 0.739 ± 0.014WISE J0642+4101 Palomar/TSpec extr. red 0.544 ± 0.001 0.793 ± 0.001 0.613 ± 0.001 1.197 ± 0.001 0.737 ± 0.001 0.844 ± 0.001WISE J0701+6321 Palomar/TSpec T3 0.385 ± 0.001 0.583 ± 0.001 0.494 ± 0.001 0.777 ± 0.001 0.641 ± 0.001 0.814 ± 0.001WISE J0723+3403 Keck/NIRSPEC-J T9: . . . . . . . . . . . . 0.081 ± 0.027 . . .
WISE J0733+7544 Palomar/TSpec T6 0.139 ± 0.001 0.330 ± 0.001 0.322 ± 0.002 0.301 ± 0.001 0.452 ± 0.001 0.741 ± 0.001WISE J0754+7909 Palomar/TSpec extr. red 0.472 ± 0.001 0.651 ± 0.001 0.469 ± 0.002 1.071 ± 0.001 0.757 ± 0.001 0.792 ± 0.005WISE J0811−8051 Magellan/FIRE T9.5: 0.026 ± 0.041 0.054 ± 0.014 −0.449 ± 0.035 −0.293 ± 0.018 0.201 ± 0.013 0.596 ± 0.026WISE J0812+4021 Gemini/GNIRS T8 0.065 ± 0.006 0.183 ± 0.003 0.207 ± 0.008 0.110 ± 0.007 0.322 ± 0.004 0.649 ± 0.013WISE J1025+0307 Magellan/FIRE T8.5 0.030 ± 0.002 0.112 ± 0.001 0.113 ± 0.001 0.069 ± 0.001 0.308 ± 0.001 0.551 ± 0.001WISE J1039−1600 IRTF/SpeX T7.5 0.084 ± 0.012 0.250 ± 0.009 0.175 ± 0.020 0.135 ± 0.019 0.308 ± 0.008 0.572 ± 0.025WISE J1050+5056 Keck/NIRSPEC-J T8 . . . 0.224 ± 0.007 . . . . . . 0.332 ± 0.005 . . .
WISE J1051−2138 Palomar/TSpec T9: 0.113 ± 0.026 0.132 ± 0.003 0.262 ± 0.008 0.075 ± 0.006 0.254 ± 0.002 0.412 ± 0.007WISE J1124−0421 IRTF/SpeX T7 0.108 ± 0.005 0.269 ± 0.003 0.259 ± 0.010 0.252 ± 0.008 0.366 ± 0.003 0.692 ± 0.012
44

Th
eA
strophysical
Journ
alSu
pplemen
tSeries,205:6
(49pp),2013M
archM
aceet
al.
Table 12(Continued)
Object Name Instrument NIR Sp. H2O−J CH4−J H2O−H CH4−H WJ NH3−HJ2000 Coordinates Type(1) (2) (3) (4) (5) (6) (7) (8) (9)
WISE J1143+4431 Keck/NIRSPEC-J T8.5 . . . 0.170 ± 0.018 . . . . . . 0.248 ± 0.014 . . .
WISE J1221−3136 IRTF/SpeX T6.5 0.136 ± 0.007 0.298 ± 0.005 0.268 ± 0.013 0.258 ± 0.013 0.399 ± 0.005 0.579 ± 0.016WISE J1225−1013 IRTF/SpeX T6 0.160 ± 0.004 0.358 ± 0.004 0.289 ± 0.008 0.301 ± 0.007 0.454 ± 0.003 0.717 ± 0.011WISE J1250+2628 Keck/NIRSPEC-J T6.5 . . . 0.312 ± 0.003 . . . . . . 0.422 ± 0.002 . . .
WISE J1257+4008 IRTF/SpeX T7 0.097 ± 0.010 0.337 ± 0.008 0.206 ± 0.018 0.177 ± 0.016 0.386 ± 0.007 0.670 ± 0.025WISE J1301−0302 Keck/NIRSPEC-J T8.5 . . . 0.191 ± 0.015 . . . . . . 0.273 ± 0.009 . . .
WISE J1318−1758 Palomar/TSpec T9: 0.072 ± 0.020 0.122 ± 0.002 0.113 ± 0.006 0.133 ± 0.004 0.285 ± 0.002 0.637 ± 0.005WISE J1337+2636 Keck/NIRSPEC-J T5 . . . 0.366 ± 0.004 . . . . . . 0.524 ± 0.003 . . .
WISE J1400−3850 IRTF/SpeX T4 0.399 ± 0.013 0.520 ± 0.010 0.437 ± 0.018 0.604 ± 0.017 0.677 ± 0.011 0.850 ± 0.021WISE J1517+0529 Keck/NIRSPEC-J T8 . . . 0.175 ± 0.027 . . . . . . 0.294 ± 0.013 . . .
WISE J1523+3125 Gemini/GNIRS T6.5 pec 0.090 ± 0.011 0.298 ± 0.008 0.222 ± 0.013 0.256 ± 0.020 0.401 ± 0.007 0.652 ± 0.025WISE J1542+2230 HST/WFC3 T9.5 0.008 ± 0.014 0.092 ± 0.009 0.106 ± 0.013 0.136 ± 0.017 0.182 ± 0.009 0.539 ± 0.019WISE J1544+5842 Keck/NIRSPEC-J T7.5 . . . 0.210 ± 0.027 . . . . . . 0.367 ± 0.021 . . .
WISE J1632+0329 IRTF/SpeX T5 0.216 ± 0.013 0.365 ± 0.011 0.239 ± 0.024 0.439 ± 0.021 0.513 ± 0.013 0.741 ± 0.032WISE J1636−0743 IRTF/SpeX T4.5 0.448 ± 0.020 0.698 ± 0.019 0.366 ± 0.024 0.591 ± 0.023 0.807 ± 0.020 0.789 ± 0.035WISE J1707−1744 Palomar/TSpec T5: 0.226 ± 0.016 0.352 ± 0.009 0.301 ± 0.025 0.391 ± 0.018 0.535 ± 0.010 0.794 ± 0.028WISE J1721+1117 IRTF/SpeX T6 0.144 ± 0.015 0.372 ± 0.011 0.236 ± 0.031 0.279 ± 0.026 0.425 ± 0.011 0.688 ± 0.040WISE J1730+4207 IRTF/SpeX T0 sb 0.549 ± 0.008 0.679 ± 0.008 0.622 ± 0.008 0.831 ± 0.008 0.751 ± 0.008 0.870 ± 0.010WISE J1734+5023 IRTF/SpeX T4 0.389 ± 0.004 0.339 ± 0.003 0.498 ± 0.005 0.543 ± 0.005 0.650 ± 0.004 0.936 ± 0.007WISE J1736+6059 Keck/NIRSPEC-J T8 . . . 0.196 ± 0.006 . . . . . . 0.295 ± 0.005 . . .
WISE J1738+6142 Palomar/TSpec extr. red 0.527 ± 0.038 0.792 ± 0.035 0.629 ± 0.020 1.148 ± 0.019 0.719 ± 0.033 0.844 ± 0.022IRTF/SpeX extr. red 0.676 ± 0.026 0.998 ± 0.025 0.635 ± 0.015 1.095 ± 0.017 1.008 ± 0.024 0.821 ± 0.018
WISE J1741+1327 IRTF/SpeX T5 0.244 ± 0.015 0.425 ± 0.011 0.334 ± 0.026 0.357 ± 0.023 0.511 ± 0.011 0.643 ± 0.030WISE J1743+4211 Palomar/TSpec T4.5 0.381 ± 0.007 0.493 ± 0.005 0.397 ± 0.007 0.491 ± 0.006 0.610 ± 0.005 0.759 ± 0.008WISE J1745+6459 Keck/NIRSPEC-J T7 . . . 0.298 ± 0.012 . . . . . . 0.400 ± 0.010 . . .
WISE J1746−0338 Palomar/TSpec T6 0.181 ± 0.015 0.338 ± 0.008 0.369 ± 0.022 0.305 ± 0.014 0.465 ± 0.008 0.755 ± 0.023WISE J1755+1803 Palomar/TSpec T2 0.630 ± 0.009 0.610 ± 0.006 0.533 ± 0.006 0.847 ± 0.006 0.696 ± 0.007 0.827 ± 0.007WISE J1759+5442 Keck/NIRSPEC-J T7 . . . 0.252 ± 0.009 . . . . . . 0.379 ± 0.007 . . .
WISE J1809−0448 IRTF/SpeX T0.5 0.619 ± 0.006 0.694 ± 0.005 0.556 ± 0.005 0.950 ± 0.006 0.757 ± 0.004 0.765 ± 0.006WISE J1812+2007 Keck/NIRSPEC-J T9 . . . 0.138 ± 0.015 . . . . . . 0.216 ± 0.011 . . .
WISE J1813+2835 Keck/NIRSPEC-J T8 . . . 0.172 ± 0.003 . . . . . . 0.287 ± 0.002 . . .
WISE J1840+2932 Keck/NIRSPEC-J T6 . . . 0.325 ± 0.013 . . . . . . 0.465 ± 0.010 . . .
WISE J1909−5204 Magellan/FIRE T5.5 0.292 ± 0.005 0.335 ± 0.002 0.337 ± 0.003 0.270 ± 0.002 0.550 ± 0.003 0.737 ± 0.004WISE J1913+6444 Palomar/TSpec T5: 0.362 ± 0.028 0.481 ± 0.016 0.338 ± 0.034 0.418 ± 0.027 0.550 ± 0.017 0.834 ± 0.039WISE J1928+2356 IRTF/SpeX T6 0.210 ± 0.001 0.447 ± 0.001 0.300 ± 0.001 0.344 ± 0.001 0.605 ± 0.001 0.701 ± 0.001WISE J1954+6915 Keck/NIRSPEC-J T5.5 . . . 0.404 ± 0.007 . . . . . . 0.494 ± 0.005 . . .
WISE J1955−2540 Keck/NIRSPEC-J T8 . . . 0.166 ± 0.007 . . . . . . 0.288 ± 0.005 . . .
WISE J2008−0834 IRTF/SpeX T5.5 0.205 ± 0.005 0.277 ± 0.003 0.351 ± 0.009 0.357 ± 0.008 0.543 ± 0.004 0.829 ± 0.012WISE J2014+0424 Gemini/GNIRS T6.5 pec 0.096 ± 0.006 0.268 ± 0.004 0.214 ± 0.009 0.253 ± 0.009 0.409 ± 0.004 0.715 ± 0.014WISE J2015+6646 Palomar/TSpec T8 0.071 ± 0.015 0.207 ± 0.008 0.138 ± 0.019 0.149 ± 0.014 0.350 ± 0.008 0.594 ± 0.020WISE J2019−1148 Palomar/TSpec T8: 0.063 ± 0.041 0.137 ± 0.018 0.141 ± 0.040 0.122 ± 0.026 0.245 ± 0.018 0.675 ± 0.040WISE J2030+0749 IRTF/SpeX T1.5 0.714 ± 0.002 0.828 ± 0.002 0.585 ± 0.001 0.889 ± 0.001 0.949 ± 0.002 0.854 ± 0.002WISE J2043+6220 IRTF/SpeX T1.5 0.561 ± 0.009 0.520 ± 0.006 0.610 ± 0.011 1.009 ± 0.011 0.793 ± 0.008 0.995 ± 0.013WISE J2123−2614 IRTF/SpeX T5.5 0.223 ± 0.018 0.383 ± 0.012 0.244 ± 0.035 0.297 ± 0.030 0.496 ± 0.013 0.745 ± 0.044
45

Th
eA
strophysical
Journ
alSu
pplemen
tSeries,205:6
(49pp),2013M
archM
aceet
al.
Table 12(Continued)
Object Name Instrument NIR Sp. H2O−J CH4−J H2O−H CH4−H WJ NH3−HJ2000 Coordinates Type(1) (2) (3) (4) (5) (6) (7) (8) (9)
WISE J2147−1029 Keck/NIRSPEC-J T7.5 . . . 0.214 ± 0.006 . . . . . . 0.356 ± 0.004 . . .
WISE J2236+5105 Palomar/TSpec T5.5 0.185 ± 0.001 0.374 ± 0.001 0.312 ± 0.001 0.423 ± 0.001 0.477 ± 0.001 0.708 ± 0.001WISE J2237+7228 Keck/NIRSPEC-J T6 0.170 ± 0.004 0.345 ± 0.005 . . . . . . 0.484 ± 0.004 . . .
WISE J2301+0216 IRTF/SpeX T6.5 0.133 ± 0.006 0.266 ± 0.005 0.343 ± 0.012 0.276 ± 0.010 0.421 ± 0.005 0.844 ± 0.016WISE J2303+1914 Palomar/TSpec T4: 0.412 ± 0.002 0.467 ± 0.001 0.405 ± 0.003 0.525 ± 0.002 0.666 ± 0.001 0.841 ± 0.003WISE J2335+4222 Keck/NIRSPEC-JH T7 . . . 0.274 ± 0.008 . . . 0.208 ± 0.009 0.390 ± 0.010 0.671 ± 0.013WISE J2357+1227 IRTF/SpeX T6 0.143 ± 0.005 0.384 ± 0.004 0.245 ± 0.009 0.295 ± 0.008 0.387 ± 0.004 0.593 ± 0.010
T Dwarfs from Table 6
WISE J0920+4538 Palomar/TSpec L9 sb? 0.588 ± 0.001 0.745 ± 0.001 0.618 ± 0.001 1.003 ± 0.001 0.774 ± 0.001 0.872 ± 0.001ULAS J0950+0117 Magellan/FIRE T8 0.066 ± 0.002 0.187 ± 0.001 0.189 ± 0.001 0.142 ± 0.001 0.394 ± 0.001 0.705 ± 0.002WISE J1246−3139 Palomar/TSpec T1 0.529 ± 0.001 0.682 ± 0.001 0.553 ± 0.001 0.909 ± 0.001 0.776 ± 0.001 0.868 ± 0.001LHS 2803B IRTF/SpeX T5.5 0.168 ± 0.007 0.270 ± 0.005 0.297 ± 0.015 0.415 ± 0.014 0.534 ± 0.006 0.711 ± 0.019BD +01◦ 2920B Magellan/FIRE T8 0.070 ± 0.006 0.182 ± 0.002 0.236 ± 0.004 0.125 ± 0.002 0.393 ± 0.003 0.720 ± 0.004WISE J1449+1147 Gemini/GNIRS T5 pec 0.268 ± 0.006 0.378 ± 0.004 0.301 ± 0.006 0.394 ± 0.009 0.559 ± 0.005 0.767 ± 0.011
Palomar/TSpec T5 pec 0.232 ± 0.016 0.350 ± 0.009 0.303 ± 0.026 0.387 ± 0.017 0.543 ± 0.011 0.796 ± 0.029PSOJ226.25−28.89 Palomar/TSpec T2: 0.699 ± 0.018 0.649 ± 0.008 0.561 ± 0.011 0.831 ± 0.008 0.799 ± 0.008 0.827 ± 0.010VHS J1543−0439 IRTF/SpeX T5: 0.321 ± 0.019 0.381 ± 0.014 0.396 ± 0.034 0.523 ± 0.028 0.621 ± 0.020 0.750 ± 0.040PSOJ246.42+15.46 Palomar/TSpec T4.5: 0.319 ± 0.014 0.441 ± 0.009 0.373 ± 0.019 0.438 ± 0.013 0.604 ± 0.010 0.787 ± 0.019PSOJ247.32+03.59 Palomar/TSpec T2 0.442 ± 0.003 0.589 ± 0.002 0.456 ± 0.002 0.898 ± 0.002 0.677 ± 0.002 0.751 ± 0.003WISE J1717+6128 Gemini/GNIRS T8 0.026 ± 0.017 0.201 ± 0.009 0.207 ± 0.019 0.115 ± 0.018 0.316 ± 0.008 0.651 ± 0.028WISE J1809+3838 IRTF/SpeX T7.5 0.063 ± 0.014 0.232 ± 0.011 0.198 ± 0.024 0.148 ± 0.019 0.345 ± 0.010 0.609 ± 0.031WISE J2342+0856 IRTF/SpeX T6.5 0.114 ± 0.004 0.328 ± 0.004 0.213 ± 0.007 0.274 ± 0.007 0.380 ± 0.003 0.596 ± 0.009WISE J2344+1034 Gemini/GNIRS T9 0.037 ± 0.012 0.107 ± 0.005 0.149 ± 0.015 0.062 ± 0.017 0.233 ± 0.005 0.538 ± 0.025
Notes.a Cushing et al. (2011).b Burgasser et al. (2011).
46

The Astrophysical Journal Supplement Series, 205:6 (49pp), 2013 March Mace et al.
Figure 29. The six spectral indices from Burgasser et al. (2006b), Warren et al. (2007), and Delorme et al. (2008a), computed using the median flux and integratedflux for the T dwarfs in this paper and the T and Y dwarfs of Kirkpatrick et al. (2011, 2012) and Cushing et al. (2011). Objects are marked by instrument with thesymbols and colors in the legend. Also included are the spectral standards as black filled circles and T dwarfs from the SpeX Prism Library as gray circles.
(A color version of this figure is available in the online journal.)
for the same instrument. To properly compare integrated fluxspectral indices between instruments we would first need to in-terpolate the spectra onto similar wavelength scales. Even forthe same instrument, changes in the resolution as a function ofwavelength would need to be removed by interpolation. Usingthe median flux, rather than the integrated flux, sidesteps this is-sue and reduces the likelihood of errors when comparing spectrafrom numerous instruments, like we have done here. Another,
less significant, source of this offset is a negative noise biasof all non-IRTF/SpeX spectra reduced with Spextool. This isclearly seen in Figure 18, where the scatter in the per pixel fluxis more often below the mean. This bias in the reduced spectrumresults in smaller integrated fluxes and consequently, smaller in-dex values. Employing the median flux instead of the integratedflux reduces data reduction and instrumental influences on thecomputed indices.
47

The Astrophysical Journal Supplement Series, 205:6 (49pp), 2013 March Mace et al.
Figure 30. The peak flux ratios defined by Burgasser et al. (2004, 2006b), computed using the median flux and the integrated flux. Same symbols as in Figure 29.
(A color version of this figure is available in the online journal.)
REFERENCES
Abel, M., Frommhold, L., Li, X., & Hunt, K. L. C. 2012, JChPh, 136, 044319Aberasturi, M., Solano, E., & Martın, E. L. 2011, A&A, 534, L7Allard, F., Hauschildt, P. H., Baraffe, I., & Chabrier, G. 1996, ApJL, 465, L123Allen, P. R., Koerner, D. W., Reid, I. N., & Trilling, D. E. 2005, ApJ, 625, 385Allers, K. N., Liu, M. C., Dupuy, T. J., & Cushing, M. C. 2010, ApJ, 715, 561Andrei, A. H., Smart, R. L., Penna, J. L., et al. 2011, AJ, 141, 54Autry, R. G., Probst, R. G., Starr, B. M., et al. 2003, Proc. SPIE, 4841, 525Baraffe, I., Chabrier, G., Allard, F., & Hauschildt, P. 2003, in IAU Symp. 211,
Brown Dwarfs, ed. E. Martinı (San Francisco, CA: ASP), 41Barman, T. S., Macintosh, B., Konopacky, Q. M., & Marois, C. 2011a, ApJL,
735, L39Barman, T. S., Macintosh, B., Konopacky, Q. M., & Marois, C. 2011b, ApJ,
733, 65Beichman, C. A., Gelino, C. R., Kirkpatrick, J. D., et al. 2013, ApJ, 764, 101Bloom, J. S., Starr, D. L., Blake, C. H., Skrutskie, M. F., & Falco, E. E. 2006,
in ASP Conf. Ser. 351, Astronomical Data Analysis Software and Systems
XV, ed. C. Gabriel, C. Arviset, D. Ponz, & E. Solano (San Francisco, CA:ASP), 751
Bochanski, J. J., Burgasser, A. J., Simcoe, R. A., & West, A. A. 2011, AJ,142, 169
Borysow, A., Jorgensen, U. G., & Zheng, C. 1997, A&A, 324, 185Bowler, B. P., Liu, M. C., Dupuy, T. J., & Cushing, M. C. 2010, ApJ, 723, 850Burgasser, A. J. 2004, ApJS, 155, 191Burgasser, A. J., Burrows, A., & Kirkpatrick, J. D. 2006a, ApJ, 639, 1095Burgasser, A. J., Cruz, K. L., Cushing, M., et al. 2010, ApJ, 710, 1142Burgasser, A. J., Cushing, M. C., Kirkpatrick, J. D., et al. 2011, ApJ, 735, 116Burgasser, A. J., Geballe, T. R., Leggett, S. K., Kirkpatrick, J. D., & Golimowski,
D. A. 2006b, ApJ, 637, 1067Burgasser, A. J., McElwain, M. W., Kirkpatrick, J. D., et al. 2004, AJ, 127, 2856Burgasser, A. J., Kirkpatrick, J. D., Brown, M. E., et al. 2002, ApJ, 564, 421Burrows, A., Marley, M., Hubbard, W. B., et al. 1997, ApJ, 491, 856Burrows, A., Sudarsky, D., & Hubeny, I. 2006, ApJ, 640, 1063Burrows, A., Sudarsky, D., & Lunine, J. I. 2003, ApJ, 596, 587Casali, M., Adamson, A., Alves de Oliveira, C., et al. 2007, A&A, 467, 777
48

The Astrophysical Journal Supplement Series, 205:6 (49pp), 2013 March Mace et al.
Chiu, K., Fan, X., Leggett, S. K., et al. 2006, AJ, 131, 2722Connelley, M. S., & Greene, T. P. 2010, AJ, 140, 1214Cushing, M. C., Kirkpatrick, J. D., Gelino, C. R., et al. 2011, ApJ, 743, 50Cushing, M. C., Marley, M. S., Saumon, D., et al. 2008, ApJ, 678, 1372Cushing, M. C., Vacca, W. D., & Rayner, J. T. 2004, PASP, 116, 362Cutri, R. M., Wright, E. L., Conrow, T., et al. 2012, yCat, 2311, 0Dahn, C. C., Harris, H. C., Vrba, F. J., et al. 2002, AJ, 124, 1170Deacon, N. R., Liu, M. C., Magnier, E. A., et al. 2011, AJ, 142, 77Deacon, N. R., Liu, M. C., Magnier, E. A., et al. 2012, ApJ, 757, 100Delorme, P., Delfosse, X., Albert, L., et al. 2008a, A&A, 482, 961Delorme, P., Willott, C. J., Forveille, T., et al. 2008b, A&A, 484, 469Depoy, D. L., Atwood, B., Byard, P. L., Frogel, J., & O’Brien, T. P.
1993, Proc. SPIE, 1946, 667Eisenhardt, P. R. M., Wu, J., Tsai, C.-W., et al. 2012, ApJ, 755, 173Elias, J. H., Joyce, R. R., Liang, M., et al. 2006, Proc. SPIE, 6269, 62694CFaherty, J. K., Rice, E. L., Cruz, K. L., Mamajek, E. E., & Nunez, A. 2013, AJ,
145, 2Fazio, G. G., Ashby, M. L. N., Barmby, P., et al. 2004, ApJS, 154, 39Frommhold, L., Abel, M., Wang, F., et al. 2010, MolPh, 108, 2265Geballe, T. R., Knapp, G. R., Leggett, S. K., et al. 2002, ApJ, 564, 466Geballe, T. R., Kulkarni, S. R., Woodward, C. E., & Sloan, G. C. 1996, ApJL,
467, L101Gelino, C. R., Kirkpatrick, J. D., Cushing, M. C., et al. 2011, AJ, 142, 57Gizis, J. E., Faherty, J. K., Liu, M. C., et al. 2012, AJ, 144, 94Griffith, R. L., Kirkpatrick, J. D., Eisenhardt, P. R. M., et al. 2012, AJ, 144, 148Hambly, N. C., Collins, R. S., Cross, N. J. G., et al. 2008, MNRAS, 384, 637Hayashi, C., & Nakano, T. 1963, PThPh, 30, 460Herter, T. L., Henderson, C. P., Wilson, J. C., et al. 2008, Proc. SPIE, 7014,
70140XHewett, P. C., Warren, S. J., Leggett, S. K., & Hodgkin, S. T. 2006, MNRAS,
367, 454Hodgkin, S. T., Irwin, M. J., Hewett, P. C., & Warren, S. J. 2009, MNRAS, 394,
675Kimble, R. A., MacKenty, J. W., O’Connell, R. W., & Townsend, J. A.
2008, Proc. SPIE, 7010, 70101EKirkpatrick, J. D., Barman, T. S., Burgasser, A. J., et al. 2006, ApJ, 639, 1120Kirkpatrick, J. D., Cushing, M. C., Gelino, C. R., et al. 2011, ApJS, 197, 19Kirkpatrick, J. D., Gelino, C. R., Cushing, M. C., et al. 2012, ApJ, 753, 156Kirkpatrick, J. D., Looper, D. L., Burgasser, A. J., et al. 2010, ApJS, 190, 100Kumar, S. S. 1963, ApJ, 137, 1121Lada, C. J. 1987, in IAU Symp. 115, Star Forming Regions, ed. M. Peimbert &
J. Jugaku (Dordrecht: Reidel), 1Lawrence, A., Warren, S. J., Almaini, O., et al. 2007, MNRAS, 379, 1599Leggett, S. K., Marley, M. S., Freedman, R., et al. 2007, ApJ, 667, 537Leggett, S. K., Saumon, D., Marley, M. S., et al. 2012, ApJ, 748, 74Linsky, J. L. 1969, ApJ, 156, 989Lodieu, N., Burningham, B., Day-Jones, A., et al. 2012, A&A, 548, A53Looper, D. L., Kirkpatrick, J. D., Cutri, R. M., et al. 2008, ApJ, 686, 528
Lucas, P. W., Tinney, C. G., Burningham, B., et al. 2010, MNRAS, 408, L56Luhman, K. L., Loutrel, N. P., McCurdy, N. S., et al. 2012, ApJ, 760, 152Mainzer, A., Cushing, M. C., Skrutskie, M., et al. 2011, ApJ, 726, 30Marley, M. S., Saumon, D., Cushing, M., et al. 2012, ApJ, 754, 135Marley, M. S., Saumon, D., Guillot, T., et al. 1996, Sci, 272, 1919Marsh, K. A., Wright, E. L., Kirkpatrick, J. D., et al. 2013, ApJ, 762, 119Martini, P., Persson, S. E., Murphy, D. C., et al. 2004, Proc. SPIE, 5492, 1653McLean, I. S., Becklin, E. E., Bendiksen, O., et al. 1998, Proc. SPIE, 3354, 566McLean, I. S., Graham, J. R., Becklin, E. E., et al. 2000, Proc. SPIE, 4008, 1048McLean, I. S., McGovern, M. R., Burgasser, A. J., et al. 2003, ApJ, 596, 561McLean, I. S., Prato, L., McGovern, M. R., et al. 2007, ApJ, 658, 1217Monet, D. G., Levine, S. E., Canzian, B., et al. 2003, AJ, 125, 984Morley, C. V., Fortney, J. J., Marley, M. S., et al. 2012, ApJ, 756, 172Nakajima, T., Oppenheimer, B. R., Kulkarni, S. R., et al. 1995, Natur, 378, 463Noll, K. S., Geballe, T. R., Leggett, S. K., & Marley, M. S. 2000, ApJL,
541, L75Patience, J., King, R. R., de Rosa, R. J., & Marois, C. 2010, A&A, 517, A76Pinfield, D. J., Burningham, B., Lodieu, N., et al. 2012, MNRAS, 422, 1922Rayner, J. T., Toomey, D. W., Onaka, P. M., et al. 2003, PASP, 115, 362Saumon, D., Bergeron, P., Lunine, J. I., Hubbard, W. B., & Burrows, A.
1994, ApJ, 424, 333Saumon, D., & Marley, M. S. 2008, ApJ, 689, 1327Saumon, D., Marley, M. S., Abel, M., Frommhold, L., & Freedman, R. S.
2012, ApJ, 750, 74Saumon, D., Marley, M. S., & Lodders, K. 2003, arXiv:astro-ph/0310805Scholz, R.-D. 2010, A&A, 515, A92Scholz, R.-D., Bihain, G., Schnurr, O., & Storm, J. 2011, A&A, 532, L5Simcoe, R. A., Burgasser, A. J., Bernstein, R. A., et al. 2008, Proc. SPIE,
7014, 70140USimcoe, R. A., Burgasser, A. J., Bochanski, J. J., et al. 2010, Proc. SPIE,
7735, 773514Simons, D. A., & Tokunaga, A. 2002, PASP, 114, 169Skrutskie, M. F., Cutri, R. M., Stiening, R., et al. 2006, AJ, 131, 1163Stephens, D. C., Leggett, S. K., Cushing, M. C., et al. 2009, ApJ, 702, 154Stern, D., Assef, R. J., Benford, D. J., et al. 2012, ApJ, 753, 30Tinney, C. G., Burgasser, A. J., Kirkpatrick, J. D., & McElwain, M. W. 2005, AJ,
130, 2326Tokunaga, A. T., Simons, D. A., & Vacca, W. D. 2002, PASP, 114, 180Vacca, W. D., Cushing, M. C., & Rayner, J. T. 2003, PASP, 115, 389van Dam, M. A., Bouchez, A. H., Le Mignant, D., et al. 2006, PASP, 118, 310Veilleux, S., & Osterbrock, D. E. 1987, ApJS, 63, 295Warren, S. J., Mortlock, D. J., Leggett, S. K., et al. 2007, MNRAS, 381, 1400Werner, M. W., Roellig, T. L., Low, F. J., et al. 2004, ApJS, 154, 1Wilson, J. C., Eikenberry, S. S., Henderson, C. P., et al. 2003, Proc. SPIE,
4841, 451Wizinowich, P. L., Le Mignant, D., Bouchez, A. H., et al. 2006, PASP, 118, 297Wright, E. L., Eisenhardt, P. R. M., Mainzer, A. K., et al. 2010, AJ, 140, 1868York, D. G., Adelman, J., Anderson, J. E., Jr., et al. 2000, AJ, 120, 1579
49