A Study of the Cause of Failure of Rotationally Molded ...
132
Brigham Young University Brigham Young University BYU ScholarsArchive BYU ScholarsArchive Theses and Dissertations 2011-03-17 A Study of the Cause of Failure of Rotationally Molded, High- A Study of the Cause of Failure of Rotationally Molded, High- Density Polyethylene, Sodium Hypochlorite Storage Tanks Density Polyethylene, Sodium Hypochlorite Storage Tanks Dixon Harold Abell Brigham Young University - Provo Follow this and additional works at: https://scholarsarchive.byu.edu/etd Part of the Construction Engineering and Management Commons, and the Manufacturing Commons BYU ScholarsArchive Citation BYU ScholarsArchive Citation Abell, Dixon Harold, "A Study of the Cause of Failure of Rotationally Molded, High-Density Polyethylene, Sodium Hypochlorite Storage Tanks" (2011). Theses and Dissertations. 2609. https://scholarsarchive.byu.edu/etd/2609 This Thesis is brought to you for free and open access by BYU ScholarsArchive. It has been accepted for inclusion in Theses and Dissertations by an authorized administrator of BYU ScholarsArchive. For more information, please contact [email protected], [email protected].
Transcript of A Study of the Cause of Failure of Rotationally Molded ...

Brigham Young University Brigham Young University
BYU ScholarsArchive BYU ScholarsArchive
Theses and Dissertations
2011-03-17
A Study of the Cause of Failure of Rotationally Molded, High-A Study of the Cause of Failure of Rotationally Molded, High-
Density Polyethylene, Sodium Hypochlorite Storage Tanks Density Polyethylene, Sodium Hypochlorite Storage Tanks
Dixon Harold Abell Brigham Young University - Provo
Follow this and additional works at: https://scholarsarchive.byu.edu/etd
Part of the Construction Engineering and Management Commons, and the Manufacturing Commons
BYU ScholarsArchive Citation BYU ScholarsArchive Citation Abell, Dixon Harold, "A Study of the Cause of Failure of Rotationally Molded, High-Density Polyethylene, Sodium Hypochlorite Storage Tanks" (2011). Theses and Dissertations. 2609. https://scholarsarchive.byu.edu/etd/2609
This Thesis is brought to you for free and open access by BYU ScholarsArchive. It has been accepted for inclusion in Theses and Dissertations by an authorized administrator of BYU ScholarsArchive. For more information, please contact [email protected], [email protected].

A Study of the Failure Mechanisms in Rotational Molded,
High Density Cross-Linked Polyethylene,
Sodium Hypochlorite Storage Tanks
by
Dixon Harold Abell
A thesis submitted to the faculty of
Brigham Young University
in partial fulfillment of the requirements for the degree of
Master of Science
Michael P. Miles, Chair
Perry W. Carter
A. Brent Strong
School of Technology
Brigham Young University
April 2011
Copyright © 2011 Harold Abell
All Rights Reserved
ABSTRACT
A Study of the Failure Mechanisms in Rotational Molded,
High-Density Cross-Linked Polyethylene,
Sodium Hypochlorite Storage Tanks
Harold Abell
School of Technology
Master of Science
The topic of chemical oxidative degradation in rotational molded polyethylene (high-
density cross-linked) chemical (sodium hypochlorite) storage tanks is an industry problem that
ranks at the top of current business issues for manufacturers of chemical storage tanks. The
degradation of these tanks not only compromises the physical and mechanical properties of the
tank material, but reduces the life expectancy of the tank, eventually resulting in catastrophic
tank failure.
Premature tank failure comes at a hefty cost. The reputation of the manufacturer is
questioned often resulting in immediate loss of customer satisfaction and future business. The
leaking of the chemical from the failed tank serves as a liable environmental hazard that
jeopardizes the safety and welfare of its surroundings – people and environment. And the
associated manufacturer of the failed tank is almost certainly responsible for the repair or
replacement of the tank. All these associated problems and many more related to chemical tank
failure cost this relatively small industry millions of dollars annually.
The need to determine the failure mechanisms of these tanks is critically important. Such
an understanding will provide industry with useful knowledge that will open the door for
improvements in tank performance. There is no question that a deeper understanding of failure
mechanisms will improve a tank manufacturer’s reputation, increase business sales, and assure
environmental safety. The addition of this knowledge will also instill consumer confidence in an
industry that is considered to lack refined manufacturing processes and proven quality controls.
Such advancements are keys to making rotational molding a cutting-edge, technology-driven
process that prepares industry for future growth and development.
The purpose of this research is to provide tested empirical data and proven expert
analysis that can be utilized by companies in understanding the failure mechanisms of these
tanks. The information regarding this topic was collected from various tank samples taken from
Poly Processing, a leading manufacturer of rotationally molded polyethylene chemical storage
tanks and producer of the examined samples, and Odyssey Manufacturing, a manufacturer of
bulk sodium hypochlorite and the end user of the examined samples. In the final chapter of this
research, a summary is presented of the important findings regarding the purpose of the thesis
study.
Keywords: Harold Abell, oxidative degradation, storage tanks, tank failure, failure mechanisms,
Poly Processing, Odyssey Manufacturing

ACKNOWLEDGMENTS
I would like to express my sincere gratitude to Poly Processing Company for providing
me with the opportunity to conduct this research. I contribute and dedicate the success of this
research to Poly Processing Company. Thank you for your interest in my development and your
willingness to provide a meaningful and practical opportunity to grow, not only academically,
but also personally.
I would also like to express my appreciation to BYU, specifically the School of
Technology and the individuals that played an integral role in my development as a contributing
member of society in all facets of life – education, work, community, faith, and family. I owe a
significant portion of my success to date and any future accomplishments to BYU, The School of
Technology, and inspiring individuals who have taken an active role in my development.
In addition, I would like to express my gratitude to my graduate committee for their help,
support, and encouragement.

iv
TABLE OF CONTENTS
LIST OF TABLES ...................................................................................................................... vii
LIST OF FIGURES ................................................................................................................... viii
1 Introduction ........................................................................................................................... 1
1.1 Background ..................................................................................................................... 1
1.2 Objective ......................................................................................................................... 3
1.3 Problem Statement .......................................................................................................... 3
1.4 Hypothesis ...................................................................................................................... 3
1.5 Justification ..................................................................................................................... 4
1.6 Methodology ................................................................................................................... 4
1.7 Delimitations ................................................................................................................... 6
1.8 Definition of Terms ........................................................................................................ 7
2 Review of Literature ........................................................................................................... 10
2.1 Chemical Storage Tanks ............................................................................................... 11
2.2 Rotational Molding ....................................................................................................... 15
2.2.1 Process of Rotational Molding .................................................................................. 16
2.2.2 Advantages and Benefits of Rotational Molding ...................................................... 17
2.2.3 Disadvantages and Limitations of Rotational Molding ............................................ 17
2.2.4 Applications .............................................................................................................. 18
2.2.5 The Future of the Industry ........................................................................................ 19
2.3 Materials ....................................................................................................................... 21
2.3.1 Desirable Characteristics in Rotational Molding Materials ...................................... 21
2.3.2 Range of Available Materials ................................................................................... 22
2.3.3 Polyethylene .............................................................................................................. 22
2.3.4 High-Density Polyethylene (HDPE) ......................................................................... 28

v
2.3.5 Crosslink Polyethylene (XLPE) ................................................................................ 29
2.3.6 Why XLPE for Chemical Storage ............................................................................. 31
2.3.7 Material Standards .................................................................................................... 37
2.4 Sodium Hypochlorite .................................................................................................... 37
2.4.1 Sodium Hypochlorite Degradation ........................................................................... 39
2.4.2 Causes of Sodium Hypochlorite Degradation ........................................................... 39
2.5 Environmental Effects .................................................................................................. 43
2.5.1 Effect of Environment on Performance .................................................................... 44
2.5.2 Environmental Stress Cracking ................................................................................. 44
2.5.3 Polymer Degradation by Chemical Reaction and Environment ............................... 46
2.6 Characterization of Degraded Polymers ....................................................................... 47
2.6.1 Physical Properties .................................................................................................... 48
2.6.2 Mechanical Properties ............................................................................................... 50
2.6.3 Chemical Properties .................................................................................................. 53
3 Methodology ........................................................................................................................ 62
3.1 Samples for Testing ...................................................................................................... 62
3.1.1 Sample Specification and Criteria............................................................................. 62
3.1.2 Sample Request ......................................................................................................... 65
3.1.3 Samples for Testing .................................................................................................. 66
3.2 Sample Preparation ....................................................................................................... 68
3.2.1 Samples for Physical Testing .................................................................................... 68
3.2.2 Samples for Mechanical Testing ............................................................................... 69
3.2.3 Samples for Chemical Testing .................................................................................. 72
3.3 Analytical Methods ....................................................................................................... 76
3.3.1 Physical Testing ........................................................................................................ 76

vi
3.3.2 Mechanical Testing ................................................................................................... 77
3.3.3 Chemical Testing ...................................................................................................... 81
4 Results .................................................................................................................................. 87
4.1 Physical Properties: Surface Morphology Changes ...................................................... 87
4.1.1 Surface Cracks .......................................................................................................... 87
4.1.2 Discoloration ............................................................................................................. 91
4.1.3 Scanning Electron Microscopy (SEM) ..................................................................... 92
4.2 Element and Chemical Composition: Energy Dispersive Spectroscopy ...................... 94
4.3 Mechanical Properties ................................................................................................... 99
5 Conclusions and Recommendations ................................................................................ 108
5.1 Evaluation of EDS Method ......................................................................................... 108
5.2 Important Findings ...................................................................................................... 109
5.3 Contributions .............................................................................................................. 112
5.4 Summary and Future Experimentation ....................................................................... 115
References .................................................................................................................................. 117

vii
LIST OF TABLES
Table 2-1 Market Sectors and Applications for Industry .............................................................. 19
Table 2-2 Primary Plastic Materials Used in Rotational molding ................................................ 22
Table 2-3 Common Stress Cracking Agents ................................................................................. 27
Table 2-4 Impact Performances of Linear and Cross-Link Polyethylene..................................... 34
Table 2-5 Physical Property Comparisons of Linear and Cross-Linked
Polyethylene ...................................................................................................................... 36
Table 2-6 Industry Material Test Standards.................................................................................. 38
Table 3-1 Sample Request ............................................................................................................ 66
Table 3-2 Virgin Sample Descriptions ......................................................................................... 67
Table 3-3 Exposed Sample Descriptions ...................................................................................... 67
Table 3-4 Physical Tests Performed on Samples .......................................................................... 76
Table 3-5 Mechanical Tests Performed on Samples..................................................................... 78
Table 3-6 Virgin Specimens Tested .............................................................................................. 80
Table 3-7 Exposed Specimens Tested .......................................................................................... 80
Table 3-8 Chemical Tests Performed on Samples ........................................................................ 81
Table 3-9 Control Parameters for Chemical Testing .................................................................... 83
Table 3-10 Points Selected for Data Acquisition .......................................................................... 84
Table 3-11 Virgin Specimens Tested ............................................................................................ 85
Table 3-12 Exposed Specimens Tested ........................................................................................ 85

viii
LIST OF FIGURES
Figure 2-1 General effect of material density on the properties of polyethylene ......................... 24
Figure 2-2 General effect of melt index on the properties of polyethylene .................................. 25
Figure 2-3 Typical EDS spectrum ................................................................................................ 60
Figure 3-1 Water Jet Cutter Machine............................................................................................ 71
Figure 3-2 Typical labeling ........................................................................................................... 72
Figure 3-3 Bandsaw cutting samples ............................................................................................ 74
Figure 3-4 Mill polishing samples ................................................................................................ 75
Figure 3-5 Instron tension machine used for mechanical testing .................................................. 81
Figure 3-6 SEM-EDX used for chemical testing .......................................................................... 83
Figure 4-1 Interior surface cracks parallel to lumps, ridges, and wall thickness
discontinuity in exposed samples...................................................................................... 88
Figure 4-2 Interior surfaces of virgin samples showing no surface defects ................................. 89
Figure 4-3 Increase in cracks along ridges and lumps for exposed (left) than
virgin (right) ...................................................................................................................... 90
Figure 4-4 Although virgin samples contain visible surface discontinuity, they
are free from cracks .......................................................................................................... 93
Figure 4-5 Exposed sample visibly illustrate crack initiation and propagation
along ridges and lumps ..................................................................................................... 94
Figure 4-6 EDS C/O Ratio (Net Intensity) ................................................................................... 97
Figure 4-7 EDS O/C Ratio (Atomic Percentage) .........................................................................98
Figure 4-8 Stress-stress curve and associated mechanical properties ..........................................100
Figure 4-9 A typical stress-strain curve for examined samples showing that
the material has high ductility ..........................................................................................101
Figure 4-10 Less ductility in inner layers of material ..................................................................102
Figure 4-11 Intergranular lattices and cracking ...........................................................................104
Figure 4-12 Stress-strain curves for virgin and exposed material ...............................................106

ix
Figure 4-13 Ultimate tensile strength in samples show no significant percent
change that indicates a trend ............................................................................................107

1
1 INTRODUCTION
1.1 Background
Water is an essential element of life. Its purpose varies and it is used in a wide range of
industries in addition to multiple uses in many facets of our lives. Yet in most of these roles for
personal use and in most industry applications, potable water that can be consumed or used
without risk of immediate or long-term harm ranks as one of the world’s major concerns and
priorities.
Water is treated through a variety of processes, one of which is disinfection. Sodium
hypochlorite, the chemical compound, NaClO, has long been recognized as having outstanding
disinfection properties. Thus it is used extensively in the area of water treatment to disinfect
municipal drinking water.
This disinfectant chemical is mixed with water and contained in storage tanks. Storage
tanks are containers that are used to hold liquids, such as water, chemicals, and compressed
gases. Fiberglass, metal, and several varieties of polyethylene (PE) plastic are the primary
material types that are used to make storage tanks.
Although sodium hypochlorite serves beneficially as a water disinfectant, it adversely
affects the material of a storage tank wall. That is, the chemical, through the process of
oxidation, attacks the tank wall and ultimately leads to tank failure. This failure is manifested
through the cracking of the tank wall that leads to the leaking of the fluid.

2
There is no question that water is necessary to all life. But to make water useful and
resourceful for life, it must be treated through a cleansing process or agent, such as sodium
hypochlorite, and stored in durable, economically acceptable, and environmentally friendly,
storage tanks. Therefore the quality of water is dependant upon the storage tanks that contain its
cleansing agent, sodium hypochlorite.
Steel tanks are especially vulnerable to attack from sodium hypochlorite. Since sodium
hypochlorite is such a poor match for steel tanks, the natural alternative choices are either plastic
or fiberglass. Fiberglass tanks offer about the same lifespan as plastic tanks when used for
storage of sodium hypochlorite but cost 30% to 40% more and require great care against damage
in shipping and handling. As a result, polyethylene tanks hold much of the sodium hypochlorite
used by industry and water treatment operations.
Polyethylene tanks that contain sodium hypochlorite have multiple potential failure
modes: defects in design, process error, poor installation, cyclic stress, hoop stress, creep,
environmental factors, photo-oxidation, sodium hypochlorite degradation, and chemical
oxidation. The chemical attack of the oxidizer, sodium hypochlorite, on the polyethylene tank
wall is suspected to be a primary failure mode that results in an annual loss of $10-15 million for
manufactures, distributors, and end users of tanks for sodium hypochlorite.
Currently industry is unable to effectively determine tank failure mechanisms. This lack
of understanding makes it difficult to predict tank life expectancy. As a result, tanks are
frequently failing before reaching warranty.
This topic of research is far-reaching and has immense impact as it relates to multiple
industries and applications. This study is novel in that there isn’t a clear understanding of tank
failure mechanisms. A deeper and more thorough understanding will address an industry
3
problem that could eventually save industry millions of dollars and ultimately improve tank
performance.
1.2 Objective
The purpose of this research is to study tank failure mechanisms. An understanding of
tank failure mechanisms will assist industry in improving tank performance.
1.3 Problem Statement
Industry is currently unable to effectively determine tank failure mechanisms. This lack
of understanding reduces tank life expectancy. As a result of industry’s incapability of
determining tank life expectancy, these tanks fail abruptly and prematurely. This failure is
manifested through cracking that eventually seep chemical and ultimately results in tank rupture.
With a clear understanding of failure mechanisms, industry will not only better
understand tank life expectancy, but will be prepared to repair or replace a tank before failure.
The mechanisms of failure are not well defined. A solution to this problem will not only benefit
the material supplier, tank manufacturer, distributor, and end user, but all mankind as water is
better preserved and distributed.
1.4 Hypothesis
The hypothesis of this research consists of four points. First, the sodium hypochlorite
being stored in polyethylene storage tanks oxidizes the tank wall and thus is a primary cause of
degradation. Second, the oxidation in the tank wall decreases with distance inward interior
surface to the exterior surface. Third, the mechanical properties throughout the tank wall
decrease inward from the interior to exterior surface. Fourth, surface discontinuity on the

4
interior surface creates susceptible stress concentrations, which can cause cracking particularly
when chemical oxidation and creep have degraded the tank material.
1.5 Justification
First, water is an essential element of life. The need for clean water is evident. Sodium
hypochlorite is the most commonly used disinfectant for water and it critically important in the
purification of water.
Second, sodium hypochlorite is considered an aggressive corrosive chemical that is an
active oxidizing agent. As a result, this chemical is difficult to handle and must thus be stored
and secured in a safe reliable manner. The long-term performance of storage tanks is critically
important to not only store sodium hypochlorite, but in the disinfection and purification of water.
Third, the financial impact on industry as a result to premature tank failure is immense.
Industry loses millions of dollars a year to premature tank failure. The potential and scope of this
project is far-reaching because it addresses and potentially solves a crippling and chronic
industry problem that annually reaches millions of dollars for manufacturers and end users
Fourth, this is a novel topic that will provide empirical data and professional analysis in
better understanding tank failure mechanisms and eventually determining tank life expectancy.
1.6 Methodology
The methodology selected for this research consists of a series of experimentations and
tests that will challenge the four points of the hypothesis and their degree of legitimacy and
viability. These experimentations and tests are a series of physical, mechanical, and chemical
(elemental) tests. Note that tank wall sections of virgin (newly processed material that has not yet
been used in the field), rotationally molded high density, cross-linked polyethylene will be

5
compared and contrasted to used (material from failed tanks that contained sodium hypochlorite)
rotationally molded high density, cross-linked polyethylene.
Physical testing will be conducted to monitor the surface morphology of the material.
This will be done macroscopically by the naked human eye and microscopically by the scanning
electron microscope (SEM).
A tensile testing machine will be used to test the mechanical properties of the material
throughout the tested samples of the tank wall. The data that will be collected and analyzed
reported from this experiment will test the third point of the hypothesis – that the mechanical
properties in the tank wall decrease inward from the interior to exterior surface because of cyclic
stress (loading and unloading of liquid/expanding and contracting of tank) and exposure to
sodium hypochlorite, which breaks the bonds chemically and then combines with the broken
bonds to oxidize the material. Note that multiple cross-sections throughout the wall thickness of
the tank will be tested to understand the material’s basic mechanical properties. Both the virgin
and used material of a variety of tanks will be tested in order to have an accurate comparison.
Mechanical testing will provide data that helps determine if the mechanical properties of the
material are reduced under conditions of cyclic stress and sodium hypochlorite.
To test the chemical and elemental composition of the material throughout the tested
samples of the tank wall, a SEM-EDS machine will be used. The data retrieved from this testing
will be interpreted to understand the oxidation levels throughout the tested samples. This
analysis will test the first and second points of the hypothesis – first, the sodium hypochlorite
being stored in polyethylene storage increase the level of oxidation throughout the tank wall and
is thus a primary cause of oxidation degradation; second, the oxidation in the tank wall decreases
with distance inward from the interior to exterior surface. Note that multiple surface areas

6
throughout the wall thickness of the tank will be tested and analyzed. Both virgin and used
material from a variety of tanks will be tested.
1.7 Delimitations
All tanks studied were specific in nature: rotationally molded high-density cross-linked
polyethylene (HDXLPE) tanks that stored sodium hypochlorite. The studied and tested tanks
were manufactured by the sponsor, Poly Processing, and used by Odyssey Manufacturing
Company, a bleach manufacturer, for the production of bulk sodium hypochlorite.
As mentioned earlier, there are many causes for tank failure. However, this area of
research will focus solely and specifically on chemical oxidation and its relationship with the
degradation of HDXPE sodium hypochlorite tanks. To understand this relationship, the four
points of the hypothesis will be tested using only three phases of experimentation – physical
testing (SEM), mechanical testing (tension test), and chemical (elemental) testing (SEM-EDS
machine).
For the purpose of this study, several assumptions will be taken. First, that there were no
processing (material supplier, design, manufacturing, and installation) errors in the examined
tanks. There are too many potential causes of failure to effectively cover for this research.
Eliminating process error by assuming that the tanks were processed correctly allows for a more
detailed examination of the chemical oxidation degradation in HDXLPE sodium hypochlorite
tanks.
Tank manufacturers, end users, and bleach manufacturers were able to supply tank
samples for evaluation and testing. Note that each manufacturing company produces and uses
these tanks with some degree of variance. So as not to create bias and potentially skewed results,

7
several tanks (virgin and used) from one tank manufacturer and bleach manufacturer were
studied. This allows for uniformity and clarity in data when comparing results.
1.8 Definition of Terms
Cross-Linked Polyethylene (XLPE) – It is a form of polyethylene with cross-links. In
this case, the molecules arrange themselves in a specific pattern relative to each other, with an
actual chemical bond being formed between the individual molecules. This, in effect, locks the
molecules into a semi-rigid three-dimensional shape. Heating these materials does not weaken
the bonds between the molecules. As a result, the cross-linked materials retain their physical
properties at elevated temperatures. The primary advantages achieved through cross-linking are
improved creep, low temperature impact strength, and heat and chemical resistance, with a
reduction in permeation. These attributes allow XLPE to be used in demanding applications
such as fuel and chemical tanks.
Linear Low-Density Polyethylene (LLDPE) – Is a substantially linear polymer
(polyethylene), with significant numbers of short branches, commonly made by
copolymerization of ethylene with longer-chain olefins. It differs structurally from conventional
low-density polyethylene because of the absence of long chain branching. This allows these
molecules to retain their low density, while still being able to pack together. The improved
physical properties allowed LLDPE to be used in applications that had previously only been
satisfied by HDPE and XLPE. Due to its advantages, this material has become the largest
volume in PE being rotationally molded.
Odyssey Manufacturing Company – A manufacturer of bleach and the provider of tank
material samples used in this research.

8
Oxidation – The interaction between an atom that loses electrons (the atom being
oxidized) and another atom that accepts the electrons (the oxidizing agent). The most common
oxidizing agent is oxygen but other atoms, such as chlorine, are also widely used. Therefore,
oxidation is the loss of at least one electron when two or more substances interact. Oxidation is a
chemical reaction that can be destructive to materials.
Polyethylene (PE) – A type of polymer that consists of long chains of ethylene, a
monomer that provides the ability to bond with other carbon-based monomers to form polymers.
PE is considered the workhorse of the rotational molding industry. PE accounts for
approximately 85% of the material being rotationally molded. PE is actually not a specific
material, but a whole family of materials. The commonly molded members of this versatile
family of plastics are LLDPE, LDPE, MDPE, HDPE, XLPE, and ethylene vinyl acetate (a PE
copolymer).
Polyethylene upright storage tanks – Polyethylene upright storage tanks are flat-
bottom, cylindrical tanks molded in one-piece seamless construction by rotational molding.
These tanks are molded from the resin, polyethylene, for above ground, vertical installation and
are capable of containing aggressive chemicals at atmospheric pressure. One of these aggressive
chemicals is sodium hypochlorite.
Poly Processing Company (PPC) – A manufacturer of large rotational molded high-
density cross-linked polyethylene chemical storage tanks. PPC is also the sponsor of this
research.
Rotational Molding – A high-temperature, low-pressure, open-molding plastic forming
process that uses heat and biaxial rotation to produce hollow, one-piece seamless parts.
9
Scanning Electron Microscope (SEM) – A type of electron microscope that images the
sample surface by scanning it with a high-energy beam of electrons in a raster scan pattern. The
electrons interact with the atoms that make up the sample producing signals that contain
information about the sample’s surface topography, elemental compositions, and other
properties. The analysis of elemental compositions is called EDX. This is an attachment
instrument that can be added to an SEM for the purpose of obtaining an elemental analysis of the
surface of the material being scanned.
Sodium Hypochlorite – Sodium hypochlorite, often referred to as liquid bleach, is the
most widely used of the hypochlorites in both potable water and wastewater treatment as a
disinfectant and/or bleaching agent. Sodium hypochlorite is manufactured in either a continuous
or batch type process by reacting sodium hydroxide or caustic soda with chlorine gas. Sodium
hypochlorite is inherently unstable, thereby providing a significant source of reactive oxygen.
This chemical is a very strong oxidizing agent. Its chemical formula is NaOCl.
10
2 REVIEW OF LITERATURE
A review of literature related to this topic revealed the current challenges that companies
are facing and the impact that technological advances can have in the field of rotational molding.
Multiple electronic databases were queried for papers on topics related to this area of research.
Other sources include books and pamphlets recommended by colleagues and industry
professionals. More than 80 articles, books, and previous studies were reviewed in total for this
study.
In the review of literature, the topics that relate to and influence this area of research will
be presented and summarized. First, an overview of rotational molding–the plastic forming
process that produces the examined rotationally molded high-density cross-linked (HDXPE)
chemical (sodium hypochlorite) storage tanks. Second, an analysis of the resins used to
manufacture the examined tanks. Third, the nature and characteristics of sodium hypochlorite,
the chemical liquid that was stored in the examined tanks. Fourth, a description of polymer
degradation as it relates to rotationally molded HDXPE sodium hypochlorite storage tanks.
Finally, the current industry tests used to measure and predict polymer degradation in
rotationally molded HDXPE sodium hypochlorite storage tanks.
The discussions of these topics and issues help generate an understanding of the
previously researched aspects of this study and will help direct and support the ultimate findings
of the research.

11
2.1 Chemical Storage Tanks
For environmental reasons, municipal wastewater treatment facilities have switched from
chlorine gas to sodium hypochlorite (NaOCl) solution to treat water. Sodium hypochlorite is an
oxidizing agent that is stabilized for storage with sodium hydroxide (NaOH). Even through
stabilized, it is strongly corrosive to many materials used to construct storage tanks. Several
factors can affect the stability of sodium hypochlorite, including concentration, pH, temperature,
and impurities. The standard solution used in industry now ranges from 9% to 15% available
chlorine. Hard water will make the solution less stable because of metal contaminants such as
iron and calcium. The presence of the oxidizing chemical agent, sodium hypochlorite, and metal
contaminants in the hard water, create an aggressive environment toward the material of the tank
construction that eventually may lead to tank failure (Stevens, 2008).
Many materials of tank construction have been used to store sodium hypochlorite.
However, the primary materials currently used are linear, high-density polyethylene (LHDPE),
cross-linked polyethylene (XLPE), fiber-reinforced plastics (FRP), and titanium. These tank
materials offer unique advantages and important tank properties that include chemical
compatibility, impact resistance, weatherability, cost, high temperature performance, pressurized
applications, stress crack resistance, processing capability, and environmental resistance.
Titanium is an excellent choice for the storage of sodium hypochlorite from some
considerations. It is resistant to sodium hypochlorite chemical attack and its structural properties
are similar to those of more common metals such as carbon steel and stainless steel (Zarnitiz,
1999). It is also the only material for sodium hypochlorite tanks that has a service life of 30
years or longer. However, titanium is very expensive, and therefore it is not usually used for
sodium hypochlorite tanks (White, 2010).

12
Fiber reinforced plastic (FRP) tanks can have good resistance to sodium hypochlorite.
Depending on the resin used, the temperature rating may vary between 120 and 150F. A
correctly designed and fabricated FRP tank will have an estimated life of 10-20 years. FRP
tanks that are improperly constructed are subject to immediate chemical attack by the sodium
hypochlorite, which will cause the interior surface of the tank to partially liquefy. The loss of
resin integrity will eventually lead to tank failure manifested as a leak. Replacing the interior
lining will only give temporary relief from leaks (White, 2010). Furthermore, FRP tanks are
very brittle and thus are subject to mechanical damage during shipment, installation, and use.
Such damage, even if only small cracks develop, will seriously compromise the ability of the
tank to store the sodium hypochlorite. Therefore, FRP tanks are used only sparingly in industry.
The two types of polyethylene used in high-density polyethylene (HDPE) tanks are linear
and cross-linked. Linear polyethylene consists of long chains of polyethylene molecules that are
not bonded together. Cross-linked polyethylene consists of molecule chains that are
intermittently bonded at various intervals. Cross-linked HDPE tanks are typically the more
expensive of the two types because of the higher cost of cross-linked resin material and the more
complex fabrication process (White, 2010).
The service life of HDPE tanks depends on the manufacturer, resin material, and service
conditions. Many manufacturers estimate the service life of HDPE tanks to be about 5-7 years.
Regardless of the tank manufacturer and resin material used, sodium hypochlorite is a strong
oxidizing agent that adversely affects the polyethylene being directly exposed to the chemical.
The sodium hypochlorite oxidizes the antioxidants and plasticizers that may have been added to
make the polyethylene flexible, causing the inner layer of the tank wall to become brittle and
eventually crack (White, 2010).

13
Although HDPE tanks may be considered a practical, economical solution for storing
sodium hypochlorite, these tanks have some challenges and limitations. HDPE tanks can be
made from a variety of colored resins, the most common of which are black pigment and a
natural translucent pigment. Some fabricators have a special resin, an opaque white resin,
specifically for sodium hypochlorite service. The color of the resin affects the temperature (white
being cooler) and also has some effect on the action of the oxidizer.
Translucent HDPE is a transmitter of UV light, which is a major contributor to the
degradation of both the sodium hypochlorite and the structural integrity of the HDPE tanks. This
type of oxidation is known as photo-oxidation. It is the oxidation of a polymer surface while in
the presence of oxygen or ozone facilitated by radiant energy such as UV or artificial light. This
process is often the most significant component of weather degradation of polymers. Photo-
oxidation results in chemical changes and normally a reduction in the polymer’s molecular
weight. Consequently, the material becomes weaker and more brittle coinciding with a reduction
in tensile strength, impact strength, and elongation to break. Often discoloration and loss of
gloss accompany photo-oxidation. High temperature, stress concentrations, and the presence of
an aggressive chemical component such as sodium hypochlorite are several significant factors
that increase the reaction of photo-oxidation (George, 2006; Wu, 200; Rabek, 1990; Pospisil,
1995).
Therefore, in order to limit the degree of photo-oxidation, HDPE tanks must use a resin
that contains a UV inhibitor. The problem is that certain resins contain the adequate UV
inhibitor to protect the physical properties of the tank, but do not provide additional UV
[oxidation] protection for the sodium hypochlorite (White, 2010).
14
Black HDPE tanks will absorb heat from the sunlight, which will cause the temperature
of the liquid inside the tank to rise. Thus black is not a recommended color for sodium
hypochlorite tanks outdoors if thermal considerations are critical. Some tank fabricators will
provide their tanks in a light colored outer shell that reflects heat and blocks UV rays, which
effectively reduces the influence of heat and UV rays, but it adds to the cost of the tanks (White,
2010).
All HDPE tanks should be manufactured accordingly to the American Society for Testing
and Materials (ASTM) D-1998-2006 standard. They should be designed for a specific gravity of
1.9. Although this value is much higher than the specific gravity of commercial sodium
hypochlorite, it translates into a thicker tank wall as a safety factor. ASTM calls for a 0.942
density resin (White reference 10).
Comparing FRP and HDPE tanks, HDPE tanks are generally less expensive than FRP
tanks, which offsets their shorter life cycles. However, when taking into account the accessories
such as integrally molded outlets, UV protection, insulation, and HDPE liners, prices of tanks in
the 3000- to 10,000-gal size range are comparable to the cost of FRP tanks. Above 10,000gal,
FRP tanks are more economical, and below 3000gal, HDPE tanks are more economical. HDPE
tanks are more difficult to repair than FRP tanks and they do not share the same mechanical and
structural strength of FRP. As a result, it is not uncommon for HDPE tank walls to distort in
shape (bulge) after several years of service with a dense liquid such as 12.5% sodium
hypochlorite. Due to the distortion, it is critical to have flexibility in the piping systems. It is
necessary to have flexible connections to allow the tank to bulge and flex during filling and
emptying cycles. Failure to use flexible connections could result in stress and failure of the
piping or the tank (White, 2010).

15
HDPE tanks, especially cross-linked HDPE tanks with an oxidation resistant liner
material, provide superior chemical resistivity to oxidizing chemicals such as sodium
hypochlorite. And unlike FRP tanks, they have no highly reactive chemical attack points and
have no reinforcement where the resin and glass fiber interface. These chemical attack points in
FRP tanks are inherently weak areas and are thus highly susceptible to chemical failure.
Mechanically, FRP tanks tend to be stiffer than HDPE tanks but their resistance to impact
damage is much less than HDPE tanks. This problem with impact damage in FRP tanks is
magnified by common variations in the manufacturing process. Improper techniques can cause
the tank to delaminate and crack, which in turn compromises the mechanical properties,
specifically strength, stiffness, and impact resistance of FRP tanks. Note that a high percentage
of damage amongst FRP tanks is during handling; the loading and unloading of the tank from
one site to the next.
2.2 Rotational Molding
Rotational molding is a plastic forming process that is used to produce hollow, seamless,
low stress parts (Beall, 1998). Rotational molding is unique among other plastic forming
processes in that the heating, forming, and cooling of the material occurs within a mold without
the use of pressure (Nugent, 2001). This unique process is used to produce parts as small as
ping-pong balls and as large as 22,000-gallon industrial storage tanks.
As an industry, rotational molding has the reputation of being a friendly, small
community, with information and ideas flowing between competitors across the globe. Many of
those involved in this industry are free-spirited entrepreneurs that find job satisfaction through
the freedom of design and the ease-of-use found in the process. There are estimated to be 2,000

16
rotational molders worldwide with roughly 400 of these located in the United States of America
(Nugent, 2001).
Although rotational molding has existed for 50 years, the process remains in the infant
stages of development. The apparent simplicity of the process and the various low-tech markets
it serves are contributing factors to its lack of technological advancement (Nugent, 2001).
Because of the absence of advanced process controls and cutting-edge equipment combined with
the presence of traditional operators that solely share the technical knowledge of the process,
rotational molding is generally regarded as “black art.”
Rotational molding is a unique process and developing industry. Rotational molding
provides a wonderful learning experience for those individuals interested in exploring a territory
of research that is novel and virgin and that offers the friendship of a close-knit friendly
community. There is no question that this growing field awaits bright minds that can lead the
industry through continuous innovation and cutting-edge technology.
2.2.1 Process of Rotational Molding
Rotational molding consists of four basic steps: loading, heating, cooling, and unloading.
The following is a brief overview of these steps.
During the loading process, a specific pre-weighed amount of powdered or liquid plastic
(resin) is placed in one half of a thin-walled hollow metal mold that is mounted on the arm of a
molding machine. Once the resin is placed in one half of the metal mold, the mold is then closed
using clamps or bolts.
The heating phase occurs when the mold is rotated bi-axially about perpendicular axes
and moved into an oven where it is heated. As the mold is heated and the tumbling plastic inside
17
the mold rises in temperature, the plastic begins to melt and stick to the mold. As a result,
multiple successive layers of plastic are formed, eventually resulting in the desired part.
Once the material has melted and consolidated, the cooling phase can begin. The mold is
moved to the cooling station where forced air or water mist is applied to bring the temperature
down to a point slightly below the crystallization or solidification of the material. To avoid the
molten material from sagging, uniaxial or biaxial rotation may continue.
Unloading is the final stage of the process. It is during this step that the part is removed.
Before removal, the part must be sufficiently cooled. Once the part is removed, the mold is
ready to begin the process again.
2.2.2 Advantages and Benefits of Rotational Molding
Rotational molding is a popular process in the molding of plastics. The main advantages
and primary benefits of this process are the following:
1. Low capital investment compared to the production capacity (Waigaonkar, 2008).
2. Complex parts can be obtained without need of post-assembly (Waigaonkar, 2008)
3. Two or more parts can be produced simultaneously, resulting in moderately high
production rates (Waigaonkar, 2008)
4. Ease of color or resin change (Nugent, 2001)
5. Double-walled items can be produced conveniently (Wigotsky, 1998)
6. Minimum wastage of resin (Nugent, 2001)
2.2.3 Disadvantages and Limitations of Rotational Molding
Although rotational molding has come a long way in the last 10 years, most plastics experts
agree that a substantial effort is required before the process can realize its full potential

18
(Wigotsky, 1998). As a result, there currently exist several disadvantages and process
limitations. These include the following:
1. Limited number of materials suited for the process (Waigaonkar, 2008)
2. Lack of automation, including machines possessing state-of-art capabilities, thus
increasing labor intensiveness (Beall, 1998)
3. Material costs tend to be higher due to the need for grinding pellets of raw materials to a
fine powder for molding (Nugent, 2001)
4. Difficulty in incorporating bosses and ribs for stiffening (Waigaonkar, 2008)
5. Parts are subject to shrinking during the cooling phase thus making it difficult to predict
dimensional accuracy (Nugent, 2001)
6. Release agents must be used to ensure that the part does not stick to the mold. This
requires constant attention by the operator (Nugent, 2001)
7. Loading of molds and unloading of parts is labor intensive in comparison to other
processes
8. Cycle times are much longer than other processes as both the mold and material must be
heated and cooled
9. The process is not capable of very long production runs of smaller parts (Nugent, 2001)
2.2.4 Applications
Rotational molding is ideally suited to production of hollow parts. The seamless plastic
parts can be as small as a doll’s eye or as large as 22,000-gallon storage tank. Complex
geometries, which cannot be produced by other hollow-part processes, are routinely being made
as one-piece parts by rotational molding (Beall, 1998). This process is able to produce a wide

19
range of products in an equally wide range of markets. Table 2-1 shows the various market
sectors and applications used in industry (Nugent, 2001).
Table 2-1 Market Sectors and Applications for Industry
Market Sector Application
Agriculture Storage Tanks
Spraying Equipment Tanks
Automotive Arm Rests
Motorcycle Fuel Tanks
Building/Construction Water Tanks
Septic Tanks
Electrical/Electronic Above-Ground Pedestals
Background Chambers
Medical Equipment Medicine Balls
Spine Boards
Sports/Recreation Toys
Playballs
The versatility of rotational molding is often cited as one of its greatest benefits.
However, this versatility remains largely unknown in the design community. Hence much work
is being done to properly educate these groups who have not yet seen the potential from
rotational molding. As this awareness widens, new areas of development will open and grow
(Crawford, 1996).
2.2.5 The Future of the Industry
The future expansion of rotational molding as an industry solely depends on the creation
and greater availability of high-performance engineering plastic materials that are able to meet
challenging property requirements (Beall, 1998). Other factors required for future expansion are
improved processes, quality controls, and equipment.

20
Although it may be impossible to predict the future, a number of major themes and
developments are expected to take place (Nugent, 2001):
Consolidations will continue to benefit the overall marketplace
Specialization will become prevalent as companies focus resources on what they do best
and seek business entities to act as specialized co-operation partners.
Mass production will lead to mass customization.
Shorter product life cycles will result in faster lead times and changeover times.
Processes will become more lean and flexible.
Recent and ongoing technical advances in rotational molding have placed the industry in
an ideal position to take advantage of marketplace trends that are conducive to rotational
molding. However, the opportunity is limited by the failure of the material manufacturing
industry to provide high-performance engineering plastics that can be rotationally molded.
For obvious reasons, material producers focus their efforts on large markets. Note that
rotational molding, by comparison to other plastic forming processes in terms of material
consumption, is small. However, it is interesting to note that blow molding and thermoforming
had even smaller markets until all players of the industry: machine builders, tool makers,
processors, and especially, material manufactures started collaborating to develop the necessary
processes to expand their markets (Beall, 1998).
The future, as it pertains to rotational molding, is challenging in that its success depends
on its ability to develop suitable material. And although the industry is known to be small and
friendly, it is not united in purpose to create the key ingredient and driving force behind future
success; a suitable materials.

21
With a few notable exceptions, academia has not given the rotational molding process the
attention it deserves and demands. The number of students being trained to staff this industry
has not kept pace with the industry’s growth. Some praiseworthy university research is under
way, but more is needed (Beall, 1998). Note that Queens University in Belfast, Ireland along
with Pennsylvania College of Technology are the two leading academic and research institutions
that are committed to the study and continuous development of rotational molding.
For the future, the need exists for a farsighted plastics material manufacturer, specialty
compounder, or university researcher to create new materials that are suitable for the rotational
molding process (Beall, 1998). It is safe to predict that if the plastics material manufacturing
industry provides the necessary materials, the rotational molding industry will develop new
markets, and everyone, as a result, will prosper together (Crawford, 1996).
2.3 Materials
The optimum material for industrial storage tanks produced by rotational molding is
plastic, specifically polyethylene.
2.3.1 Desirable Characteristics in Rotational Molding Materials
The optimum material for rotational molding should contain the following desirable
properties. Note that these properties apply directly to the properties required for a rotationally
molded HDXPE sodium hypochlorite storage tank.
1. Thermal stability
2. Shear melt viscosity control
3. Impact strength
4. Environmental stress crack resistance (ESCR)

22
5. Flexural and tensile strength
6. Elongation to failure
7. Chemical resistance
2.3.2 Range of Available Materials
As discussed earlier, there is a narrow group of materials that can easily be processed by
rotational molding. However, this group is expanding as more material suppliers and end-
markets recognize the potential of the process and industry. The Association of Rotational
Molders (ARM) provides an excellent guide to the majority of commercially available materials
offered to molders (Crawford, 2006).
From a market perspective, the main materials in use today are ranked as follows in Table
2-2 (Nugent, 2001).
Table 2-2 Primary Plastic Materials Used in Rotational molding
Material Material Usage
Polyethylene (LDPE, LLDPE, HDPE, XLPE, mLLDPE, EVA,
EBA)
85%
PVC 13%
Nylons 0.5%
Polycarbonate <0.5%
Polypropylene <0.5%
Fluoropolymer <0.1%
2.3.3 Polyethylene
Polyethylene is the most widely used material for rotational molding, specifically
chemical storage tanks (Crawford, 2006). Polyethylene represents 85% of all material used in
rotational molding (Crawford, 1996). The high level of usage of polyethylene is attributed to

23
this material’s relative low cost, ease of processing, thermal stability, as well as its excellent
physical and chemical resistance (Bray, 2005). Polyethylene is a diverse polymer material used
in many products and applications.
Polyethylene is comprised of a long backbone of an even number of covalently bonded
carbon atoms with a pair of hydrogen atoms attached to each carbon.
The general properties of polyethylene include the core primary measures used to define,
measure, and compare polyethylene materials. They are the following:
Density
Melt Index (MI)
Molecular Weight Distribution (MWD)
Environmental Stress Crack Resistance (ESCR)
When selecting a material for a specific application, all of these measures should be
considered since a slight change in one parameter to improve one specific property will almost
certainly affect another property in an undesirable manner (Voldner, 2000). Note that each of
these measurements is critically important to the durability of a HDXPE sodium hypochlorite
storage tank.
Density
Density is defined as weight or mass per unit volume. Basically, it is a measure of how
closely packed the molecules are. It is measured using grams per cubic centimeter (g/cc). The
industry standard to test the density of plastics is the density-gradient technique (ASTM D1505,
10).
As the density of the polyethylene increases, the following properties improve: stiffness,
tensile strength, hardness, and heat deflection (Crawford, 1996). However, with the increase in

24
density, properties such as impact strength, ductility, toughness, and Environmental Stress Crack
Resistance are compromised. Figure 2-1 illustrates the relationship between material density and
key properties.
Figure 2-1 General Effect of Material Density on the Properties of Polyethylene
Melt Index
Melt index (MI) is a measure of the material viscosity or ease of flow. The higher the
melt index number, the easier the material flows and therefore has a lower viscosity. Melt index
is directly related to the average molecular weight of polyethylene. The higher the molecular
weight, the lower the melt index is.
Melt index can be used as an indication of moldability. Low melt index will typically
require longer cycle times and possibly higher processing temperatures than high melt index
Impact Strength
ESCR
Ductility
Toughness
Weatherability
Material Density
Mat
eria
l P
roper
ty

25
materials. The most common range of polyethylene for rotational molding is 2 to 8 g/10min.
(Nugent, 2001). The industry standard used to gauge melt flow rates of plastics is the extrusion
plastometer (ASTM D 1238, 2010).
As melt index increases, the moldability of the material improves allowing the material to
reproduce fine surface detail in a mold. However, as Figure 2-2 shows, properties such as
impact strength, ESCR, weatherability, and chemical resistance will decrease as the melt index
increases.
Figure 2-2 General Effect of Melt Index on the Properties of Polyethylene
Flow Properties
Gloss
Stiffness
Hardness
Barrier Properties
Impact Strength
ESCR
Weatherability
Ductility
Chemical Resistance Material Density (MI)
Mat
eria
l P
roper
ty

26
Molecular Weight Distribution
Molecular weight distribution is a measure of the size of molecules present in a given
material (Churchward, 1995). Molecular weight distribution can be measured by a combination
of several techniques such as osmometry, laser light scattering, ultracentrifuge, viscometry and
sedimentation. As the molecular weight distribution broadens, the properties of the material are
subject to change. The resistance to impact and the ESCR decrease, while the melt index
increases.
Environmental Stress Crack Resistance
Environmental stress cracking can be defined as failure in surface-initiated brittle fracture
of a plastic specimen or part under stress in contact with a medium in the absence of which
fracture does not occur under the same conditions of stress (Graham, 1995). Environmental
stress cracking is the failure of a plastic in the presence of certain types of chemicals, but is not a
result of chemical attack. Simultaneous presence of three factors cause stress cracking: tensile
stress in plastic, the material’s inherent stress-cracking susceptibility, and a stress-cracking agent.
A common stress-cracking agent as well as an oxidizer is sodium hypochlorite. Thus ESCR
directly pertains to chemical storage tanks and can obviously be a problem in the storage of the
harsh and aggressive chemical, sodium hypochlorite.
ESCR is characterized as the following (ExxonMobil, 1997):
A stress crack agent is present. If the ESC agent were not present, the failure would not
have occurred.
Failure is always nonductile, even in plastics that would normally exhibit a ductile
yielding failure mechanism
The failure is surface initiated.

27
The surface at which cracking initiated was in contact with a chemical reagent.
The failure is accelerated by stress on the part (molded in or applied). The plastic was
mechanically stressed in some way.
The stress level is below the yield stress of the material.
Some common stress-cracking agents are listed in Table 2-3 (Nugent, 2001).
Table 2-3 Common Stress Cracking Agents
Stress Cracking Agents Non-Stress Cracking Agents
Acids
Soups
Alcohols
Silicones
Detergents (Sodium Hypochlorite)
Hydrocarbons
Organic Esters
Water
Sugars
Proteins
Mineral Oil
Inorganic Salts
There are several main classes of chemicals stored in polyethylene tanks: environmental
stress crack (ESC) agents, oxidizing agents, and solvents or fuels. ESC agents (detergents) cause
cracking by the separation of adjacent crystalline regions. Oxidizers cause cracking by the
breaking of chemical bonds. Solvents cause failure by softening which is not technically
considered ESC (Nugent, 2001).
It is believed that ESC agents penetrate the polymer primarily in the areas between the
crystalline areas where the polymer chains take on a random order. The ESC agents are able to
enter these areas and weaken the linkage between the crystalline areas by causing slippage of the
tie molecules. Cracking predominately occurs along the crystalline borders. Typically ESC
agents are classified as surfactants and include detergents such as sodium hypochlorite and high-
purity, de-ionized water (Nugent, 2001).

28
The two current industry standards used for evaluating ESCR are constant strain testing
using the bent strip test (ASTM D1693-70, 2010) and constant tensile load testing using the
notched constant tensile load test (ASTM D5397, 2010).
The following are a few additional points that relate to ESCR and polyethylene
(Crawford, 1999).
Linear polyethylene has better resistance than highly branched low density materials
ESCR can be improved by decreasing the melt-flow index (i.e. increasing molecular
weight)
ESCR can be improved by decreasing the density of the material
Dry blending of colors will typically reduce ESCR performance
Melt compounding colors and additives will typically not reduce ESCR
Thermal oxidation can affect ESCR dramatically by affecting chain length and creating
reactive sites susceptible to chemical attack
Note that cross-linked polyethylene has improved ESCR performance due to the presence of
the cross-links between molecules. These cross-linked molecules prevent slipping and softening
of the molecules so that detergent and solvent resistance is improved. Cross-linked materials are
affected in a similar way to regular polyethylene by oxidizers (Nugent, 2001).
2.3.4 High-Density Polyethylene (HDPE)
As mentioned earlier, polyethylene is a polymer – a material composed of many long
molecules that are highly entangled about each other. The molecules of polyethylene are made
of a backbone or chain of carbon atoms with hydrogen atoms attached to each carbon on the
backbone. Occasionally short carbon and hydrogen branches can also be attached to some of the

29
backbone carbons. This material, the first type of polyethylene made, is called branched
polyethylene. If only a moderate number of branches are present and the branches are relatively
short, the polyethylene molecule is called linear polyethylene, reflecting the general domination
of the linear backbone. If the branches are even scarcer, the material is called high-density
polyethylene (HDPE) because the molecules form extensive crystalline regions and that
increases density (Strong, 2000).
HDPE is the most widely used material for rotational molding. Its stiffness ranges from
flexible to medium and it has high resistance to impacts, chemicals, and environmental stress
cracking. HDPE is easy to process and commonly available with UV stabilizers (ARM, 2000).
Today HDPE is the material of choice for rotational molders.
HDPE has good structural rigidity and impact resistance. It is resistant to a broad range
of chemicals including sodium acid, sodium hypochlorite, and sodium hydroxide. Due to its
ability to withstand high levels of impact combined with its resistance to chemicals, HDPE is a
common material used for storage tanks. HDPE storage tanks have a maximum storage
temperature of 130F (ASTM D1998-06, 2010).
2.3.5 Crosslink Polyethylene (XLPE)
Generally, the greater the interactions, the better the properties. This is understood by
realizing that as the polymer chains interact, they are separated less easily, thus making it more
difficult for cracks to form between them; the force needed to pull them apart is increased, thus
increasing strength and stiffness; and their ability to dissipate impact energies is improved, thus
increasing toughness. Other properties are increased as well. Therefore, to improve overall
material performance, polymer resin manufactures and molders have consistently worked to
increase the amount of interactions between the chains (Strong, 2000).

30
Cross-linked polyethylene is the formation of polyethylene with cross-links. It is simply
the formation of bonds between the polymer chains. These bonds, equal in strength and stability
to the principal bonds along the polymer backbone, tie the polymers together, thus dramatically
increasing molecular weight (Strong, 2000). The physical and mechanical properties of
polyethylene are controlled by the interactions or intermingling between the polymer chains.
And in fact, the length of the polymer chains and, therefore, the physical properties, are much
better than can ever be achieved without the process of cross-linking.
One method to increase chain interactions is to increase the length of the chains. When
the length of the chains is increased, the molecular weight as well as the amount of entanglement
between the polymers is increased. Theoretically, the idea is great but polymer manufacturers
were unable to achieve high molecular weight during polymerization without adversely
compromising the polymer performance. Although this problem was eventually solved, another
problem arose making it apparent that if the molecular weight was increased too high, then the
ease of processing became a challenge. As a result, a compromise was made between property
performance and processing capability.
For many rotationally molded products, this compromise was acceptable. However, for
applications, such as sodium hypochlorite storage tanks, where long-term performance and
withstanding strenuous stresses and aggressive chemicals are required, the compromise between
property performance and processing capability invited a serious industry problem. Long-term
exposure subject to multiple environmental conditions often resulted in stress cracks and
catastrophic product failure.
The problem was simply that the polymer chains did not have the amount of interaction
required for long-term performance (Strong, 2000). The dilemma was to find a way to increase

31
polymer interactions that would improve physical properties while maintaining processing
capabilities. The breakthrough that provided the solution to the problem was to cross-link the
polymer after the polyethylene had been formed.
XLPE resins contain a cross-linking agent that reacts with the material during molding.
They exhibit a cross-linked molecular structure similar to that in thermoset resins. Properly
cross-linked resins provide good impact strength, environmental stress crack resistance, and
weatherability. They also tend to stand up well during cold conditions. Cross-linked
polyethylene is widely used in the manufacturing of rotationally molded tanks for the agriculture,
petroleum, and chemical industries (Bray, 2005). However, most XLPEs don’t meet FDA,
USDA, or NSF requirements (ARM, 2000).
2.3.6 Why XLPE for Chemical Storage
Cross-linked polyethylene is the material of choice for sodium hypochlorite storage
applications. In this cross-linked material, the polymer chains are covalently bonded through a
chemical reaction. It is this chemical reaction that produces a dramatic increase in molecular
weight, which increases environmental stress crack resistance, making this material ideal for
strong oxidizing chemicals like sodium hypochlorite (Bray, 2006).
When evaluating the performance of cross-linked polyethylene and linear polyethylene,
cross-linked polyethylene is the preferred material for long-term performance during sodium
hypochlorite storage. The following tested points provide reasons why cross-linked polyethylene
is preferred.
Moldability. The initial low molecular weight of the non-crosslinked resin is a great
advantage during the early stages of processing that helps the resin particles uniformly
fill the mold, melt, and fuse together. Once the part is fully formed, the cross-linking

32
occurs, thus building molecular weight and improving the physical and mechanical
properties. However, when using linear polyethylene, processing compromises must be
made. Unlike cross-linked polyethylene, it is impossible to begin with short polymers for
processing and then end with long polymers in the final part because the molecular
weight of the polymer does not change during processing. Therefore, if the initial
molecular weight is increased to meet the long-term performance demands, problems in
processing will be encountered with filling the mold, achieving part definition, and fusing
the particles together so that no porosity is present (Strong, 2000).
Overcuring. During rotational molding, the polymer is subject to relatively high
temperatures for long periods of time in the presence of air. This can lead to degradation
of the polymer at the inner free surface of the molded article. This degradation that is a
result of being overcured leads to deterioration of the mechanical properties of the part
(Crawford, 2001). Overcuring is when a part is overcooked. It represents thermal
degradation and oxidation of the plastic material (Beall, 1998). The only way to control
the thermal oxidation of polymers is by the addition of antioxidants (Crawford, 2001).
When these antioxidants are consumed as a result of overcooking the material, the
material then becomes subject to oxidation even before the part reaches the field.
Overcuring is not an issue with cross-linked polyethylene while linear polyethylene must
be molded within an acceptable window of time and temperature limits (ExxonMobil,
2000). Linear polyethylene is susceptible to degradation if held at high temperatures for
extended periods, as is typically the case if heated too long in rotational molding (Strong,
2000).

33
Stress crack resistance. Cross-linked parts resist environmental stress cracking more
than 15 times longer than linear and non-cross-linked parts (Strong, 2000). Two tests that
clearly show the difference are bent strip ESCR (ASTM D-1963, 2010) and the notch test
(ASTM F-1473, 2010). Using the bent strip test with 10% Igepal (a common ESC
agent), the cross-link does not fail in over 1000 hours compared to typical values for
HDPE of <100 hours (Exxon Mobil, 2000). Using the notch test, the cross-link does not
fail in over 1000 hours and the HDPE fails in less than 50 hours (Phillips Petroleum
Company, 2000). Even though linear grades with improved ESCR have become
available over the past 10 to 15 years, they still do not match cross-link in stress crack
resistance. Stress crack resistance is an important property that can affect the long-term
performance of a tank.
Impact strength. Impact toughness is more than five times better in cross-linked parts
when compared to linear parts (Strong, 2000). Under notched impact conditions, linear
polyethylene fails like a zipper (ExxonMobil, 2000). Once a crack starts, there is a
possibility that the tank could actually fail by zippering all the way around (Crager,
2005). But cross-link polyethylene is notch resistant. That is, if a cross-link tank is
dropped or is hit by forklift creating a notch in the tank, it is likely that the notch will
terminate and the stress will stabilize. But in a linear tank, under the same scenario, it is
likely that the crack will unzip to failure.
Table 2-4 illustrates the impact performance and notched-impact strength of linear resins
and cross-link (ExxonMobil, 2000).

34
Table 2-4 Impact Performances of Linear and Cross-Link Polyethylene
HDPE LLDPE XLPE
P50, 1/8”@-40F, ft-lb 56 57 60
Tensile Impact, ft-lb/in^2 86 90 92
Notched Izod, ft-lb 3.3 4.1 17
Resistance to crack growth. The resistance to crack growth is 10 times better in cross-
link than linear (Strong, 2000). Cross-links act as crack arrestors (Al-Zubi, 2002), thus
avoiding the un-zipping of the material due to crack propagation. Cross-linking, as
discussed earlier, forms a continuous three-dimensional structure that allows the energy
upon impact to be dispersed or dissipated throughout the chain of molecules, or three-
dimensional structure. However, in the case of linear polyethylene, the impact energy is
localized and as a result generates higher levels of stress. Note that un-zipping of the
polymer chains in a rotationally molded part containing a chemical such as sodium
hypochlorite can lead to catastrophic failure.
Chemical compatibility. Generally speaking, the range of chemical compatibility of
linear polyethylene and cross-linked polyethylene are similar in that they both have
excellent compatibility. Although some may argue that they have excellent chemical
resistivity, the point is still debated due to industry failures of rotationally molded
chemical storage tanks. One industry expert suggests that cross-link polyethylene is
more resistant to sodium hypochlorite than linear polyethylene. He argues that cross-
linked polyethylene has a molecular structure where all molecules are linked together
making a stronger tank for harsh chemical services. Sodium hypochlorite is a chemical
that hardens the tank wall and attacks the UV stabilizer compounded and anti-oxidants in
the material. Using high-density polyethylene that is already a hard material may cause

35
the tank to prematurely fail. Since all of the molecules in a cross-link polyethylene are
linked together, the tank is suggested to better withstand abuse from not only impact, but
also a chemical attack (Crager, 2005). However, another study tends to refute this point.
Other industry experts conducted research arguing that fractographic, mechanical, and
chemical evidence indicate that under certain conditions XLPE can be severely oxidized
and degraded when concentrated industrial bleach (sodium hypochlorite) or oxidizing
acids decompose or react with the XLPE. In summary, the observed behavior of cross-
linked polyethylene suggest that caution should be used in establishing the long-term
storage capability of such materials in direct contact with chemically active substances.
Under most environmental conditions, XLPE can provide outstanding performance.
However, the observed oxidation behavior of cross-linked polyethylene suggests that
attention should be given to the details of potential chemical degradation when
establishing long-term storage capability of such materials in direct contact with
chemically active substances (Wachob, 1993).
Performance under heat. Due to the cross-linking that takes place at end of the rotational
molding cycle, larger or thicker-walled tanks can be fabricated out of cross-link
compared to linear. Cross-linked polyethylene resin suppliers have developed over
50,000 hours of hoop strength data on cross-linked resins at both 73 and 140F and have
found cross-link resin reacts better in high temperatures than linear resin.
Table 2-5 compares the physical properties of linear polyethylene and cross-linked
polyethylene (ExxonMobil, 2000).

36
Table 2-5 Physical Property Comparisons of Linear and Cross-Linked Polyethylene
Property Linear Polyethylene Cross-linked Polyethylene
Range of Chemical
Compatibility
Excellent Excellent
Performance between 130-
150F
Fair Excellent
Impact Resistance Good Excellent
Weatherability Excellent Excellent
Stress Crack Resistance Fair Excellent
Initial Material Cost Excellent Good
Recyclability Poor Poor
Abrasion Resistance Good Excellent
In summary, linear polyethylene and cross-linked polyethylene are the two commonly
used resins in making rotomolded polyethylene parts. One resin type lends itself to being cross-
linked and is used where high performance is the driving issue. The other resin type, linear,
deserves appropriate attention where initial cost is the driving issue.
For high performance applications where environment, containment, and health and
safety are issues, cross-linkable resins are a better choice than linear. If the consequences of a
potential spill, such as sodium hypochlorite, are significant, the performance margins offered by
a cross-linkable resin are well worth the price difference.
Circumstances and environments that often require high performance as cross-link resin
include:
Severe chemical attack
Strong oxidation
Containment of high-value materials
Environmental sensitivity
Worker safety

37
Possibility of impacts and damage resulting in small cuts or notches
Extended useful life
Three key advantages of cross-linked resins for these types of applications are the
following:
Stress crack resistance
Impact toughness
High temperature endurance
2.3.7 Material Standards
ASTM International (ASTM), originally known as the American Society for Testing and
Materials, is an international standards organization that develops and publishes voluntary
consensus technical standards for a wide range of materials, products, systems, and services.
Although the rotational molding industry may not be as advanced technologically as other plastic
forming processes, material suppliers and molders are subject to comply to recognized industry
standards.
Table 2-6 shows the material test standards referenced (Tredwell, 1995).
2.4 Sodium Hypochlorite
Sodium hypochlorite, often referred to as bleach, is the most widely known and used of
the hypochlorites for treating potable water and wastewater. Bleach, which can be manufactured
in either a continuous or batch type process, is produced by reacting sodium hydroxide or caustic
soda with chlorine gas. The final products of this reaction are sodium hypochlorite, sodium
chloride, and water (Wachob, 1993). Sodium hypochlorite is the chemical liquid being stored in
the examined tanks of this study.

38
Table 2-6 Industry Material Test Standards
Test Standards ASTM or ARM Reference
Brookfield Viscosity ASTM D-2824
Brittleness Temperature ASTM D746-73
Bulk Density ASTM D-1895
Crosslink Gel Content ASTM D-2765
Density (Specific Gravity) ASTM D-1505
ASTM D-792
Drop Weight Impact Strength ASTM D5628-96
Dry Flow ASTM D-1895
Elongation Break ASTM D-638
Environmental Stress Crack Resistance
(ESCR)
ASTM D-1693-70
ASTM D-5397
Falling Weight Impact Test ASTM D-5420
Flexural Strength ASTM D-790
Flexural Modulus ASTM D-790
Heat Deflection Temperature ASTM D-648
Izod Impact Strength ASTM D-256
Particle Size Distribution ASTM D-1921
Melt Index (MI) ASTM D-1238
Melting Point ASTM D-789
Rockwell Hardness ASTM D-785
Shore Hardness ASTM D-2240
Shrinkage ASTM D-955
Thermal Coefficient of Expansion ASTM D-696
Thermal Conductivity ASTM C-518
V-Tear ASTM D-624
Vicat Softening Temperature ASTM D-1525
Water Absorption ASTM D-570
Weathering/UV Resistance ASTM D-2565
Yield Strength ASTM D-638
Strength of the resulting bleach is dependant upon the amount of sodium hypochlorite
that is formed per unit volume of solution (Wachob, 1993). Trade percent is commonly used to
express the concentration of sodium hypochlorite (White, 1992). Due to the precipitation of
sodium chloride at higher strength levels, bleach manufacturers typically limit the strength of the
commercial bleach to 15%. Note that 12.5% is the most typical (White, 2010). Although the
chlorine is the primary component in the production reaction, the active bleach ingredient is the
39
oxygen, which is available to provide the sterilization or bleaching action (Wachob, 1993). And
it is this component along with other factors that oxidizes the material and leads to failure.
2.4.1 Sodium Hypochlorite Degradation
Sodium hypochlorite degrades slowly over time to form sodium chloride, sodium
chlorate, and oxygen. The degradation process reduces the available chlorine content and
produces undesirable byproducts, specifically HDXPE tank failures. The decomposition and
degradation of the chemical, sodium hypochlorite, releases oxygen that degrades and oxidizes
the HDPE tank walls.
In general, the reaction is slow and occurs over time at ambient conditions. This is a
major problem with this type of chlorination system. It is also important for the end user to
understand the degradation process, mechanisms, and rate because the major decomposition
pathway produces the undesired chlorate ion that leads to tank failure. The end user should
dedicate time for research to monitor the degradation rate in order to understand the tank life.
The degradation will continue until the bleach is completely degraded to chlorides,
chlorates, and oxygen; however, the rate of degradation is greatly influenced by physical and
chemical conditions such as initial concentration, temperature, exposure to UV light, pH, and the
presence of heavy metal ions (White, 2010). Proper purchasing specifications for sodium
hypochlorite as well as proper storage and handling of sodium hypochlorite will help maintain its
stability.
2.4.2 Causes of Sodium Hypochlorite Degradation
Potential causes of sodium hypochlorite degradation can include initial concentration, PH
levels, UV light, impurities, and oxidation.

40
Initial Concentration
As mentioned earlier, there are several factors that contribute to degradation. First, the
rate of decomposition is dependant on the initial concentration of the sodium hypochlorite
solution. The higher initial concentrations of sodium hypochlorite deteriorate more rapidly than
lower initial concentrations (White, 2010). This means that the oxygen release is more rapid
(Wachob, 1993) thus leading to oxidation degradation.
Temperature
Second, temperature affects sodium hypochlorite degradation. Temperature appears to
have the greatest effect on the rate of decomposition (Wachob, 1993). Like all chemical
reactions, sodium hypochlorite requires energy to initiate and sustain the sodium hypochlorite
degradation reaction. Heat will increase the rate of the reaction. And a change in heat will
change the reaction rate. Thus an increase in the reaction will increase the degradation rate.
High levels of heat increase the rate of chemical oxidation degradation.
To put in prospective, chemists generally predict that a 18F rise in temperature will
double the rate of most chemical reactions. However, studies with sodium hypochlorite have
proven that for every 18F rise in temperature, the decomposition rate increases by a factor of 3-
4 in a solution of 15-16 weight percent hypochlorite (White, 2010). Additionally, at a
temperature of 41F, in the absence of heavy metal contamination, degradation is almost
completely eliminated (Odyssey Manufacturing, 2007). Thus there is great importance is
controlling and managing the storage temperature of sodium hypochlorite solutions. Note that
HDXPE sodium hypochlorite tanks are subject to heat exposure while outdoors. This heat
accelerates the chemical reaction, which leads to an increase in the degradation rate of the liquid
and tank.

41
It is suggested that sodium hypochlorite tanks be stored in air-conditioned environments
where lower temperatures can be maintained. Uncovered tanks being exposed to direct sunlight
will increase the temperature of the solution, which increases the degradation rate. If indoor
storage where temperatures can be maintained cannot be provided, the tanks should be coated,
painted, or processed using a resin that gives a light color to reduce the amount of heat from the
sunlight being exposed to the tank. And as a practical guide, the average daily temperature of
the hypochlorite tanks should be used in calculating the degradation rate.
PH
Third, pH affects the degradation rate. The pH of sodium hypochlorite is a sensitive issue
and an important factor in its stability. The subject of excess sodium hydroxide is a source of
great discussion regarding the stability of sodium hypochlorite. Earlier recommendations state a
minimum pH of 11. Later studies recommend a minimum pH of 11.86 (Chlorine Institute, 2006).
Extensive studies on sodium hypochlorite stability indicate that a minimum of 0.025%
caustic is necessary to keep sodium hypochlorite stable, which corresponds to pH 11.86. Thus,
the study recommends pH levels between 11.86 and 13 for the most stable range of storage. At
pH higher than 13 (0.4% caustic and higher), sodium hypochlorite degradation is accelerated
because of the increased ionic strength of the solution with excess sodium hydroxide, which is
also directly proportional to the degradation rate (Chlorine Institute, 2006).
UV
Fourth, ultraviolet (UV) light is known to increase the degradation rate of sodium
hypochlorite by photolysis. This rate of photolysis is directly proportional to the amount of light
absorbed by the sodium hypochlorite solution. For sodium hypochlorite, this process is greatly
dependent on the pH (Gordon, 1995).

42
The exposure of direct sunlight on HDXPE hypochlorite tanks will have a double effect
on the stability of the tank: (a) the sun’s heat will increase degradation reaction rates as
discussed above (note it only takes a 18F rise in temperature to triple or quadruple the reaction
rate), and (b) the direct sunlight will provide UV light, which also increases the degradation rate
through photolysis. Also, UV light is the leading contributor to photo-oxidation.
Impurities
The final major factor leading to sodium hypochlorite degradation is impurities.
Minimizing impurities, both during the manufacture and in the storage, is very critical to the
chemical stability of sodium hypochlorite solutions. These impurities, such as heavy metals,
accelerate the decomposition. Such metals are iron, nickel, copper, cobalt, and manganese.
The predominant reaction by metal catalysts is the oxygen formation reaction, which
cause the greatest operational trouble. Higher temperatures, low pH, and higher solution strength
will usually follow the chlorate ion formation reaction (American Water Works Associate,
1992). Thus impurities with high metal content should be avoided to protect the structural
properties of the HDPE sodium hypochlorite tank.
Oxidation
Sodium hypochlorite is inherently unstable, thereby providing a significant source of
reactive oxygen. In the absence of any accelerators, it will decompose and release oxygen even
when stored in dark containers at room temperature (Wachob, 1993). And as discussed earlier,
there are multiple environmental and manufacturing variables that influence bleach quality and
stability. These factors accelerate the oxygen release of the solution. This release of oxygen
creates a highly concentrated oxidized environment that severely degrades and oxidizes the
HDXPE tanks. As a result, the physical and mechanical properties of the tank are compromised.

43
Sodium hypochlorite is an aggressive chemically active solution that oxidizes cross-
linked and linear polyethylene. Therefore, proper attention should be given to the details of
potential chemical degradation when establishing the long-term storage capacity of such
materials in direct contact with a chemically active substance like sodium hypochlorite.
2.5 Environmental Effects
Environmental effects on polymer materials cover a wide range of different behaviors
and attributes. For example, plasticization, solvation, and swelling, occur due to the diffusion of
the chemicals into the polymer. These chemical alterations of the molecular structure are not
necessarily irreversible, as the effects can be reversed if the chemical is removed from the
material (ASM, 2003).
Environmental stress cracking also can occur without significant absorption of an
environmental reagent by the polymer. Environmental conditions can promote brittle fracture in
normally ductile plastics at levels of stress or strain well below those that would usually cause
failure at all. Actual degradation of a polymer, which reduces molecular weight and therefore
mechanical properties, does not need to be particularly pervasive in order to be problematic. For
example, degradation of a thin surface layer of material on a plastic part can facilitate premature
failure or brittle failure under conditions where ductile failure would normally occur. The effects
of changing temperature and strain rate accelerate all of this. All of these conditions may need to
be considered in preventing or determining cause of failure in a polymeric material (ASM,
2003).

44
2.5.1 Effect of Environment on Performance
The mechanical properties of polymer materials are often divided into short-term and
long-term properties. Short-term properties includes tensile and impact strengths. Long-term
properties include creep, stress relaxation, and creep rupture. Both of these categories of
properties are affected by exposure to external chemical environments.
Chemical exposure in polymer materials can have multiple effects. Some chemicals act
as plasticizers, changing the polymer from one that is hard, stiff, and brittle to one which is
softer, more flexible, and tougher. Often these chemicals can dissolve the polymer if they are
present in large enough quantity and if the polymer is not cross-linked. Other chemicals can
induce environmental stress cracking, an effect in which brittle facture of a polymer will occur at
a level of stress well below that required to cause failure in the absence of the ESC reagent.
Finally, there are some chemicals that cause actual degradation of the polymer, breaking the
macromolecular chains, reducing molecular weight, and compromising the mechanical
properties as a result (ASM, 2003). Sodium hypochlorite is an aggressive oxidizing agent that
induces environmental stress cracking and causes material degradation.
2.5.2 Environmental Stress Cracking
Virtually all plastics are stress cracked by aggressive chemical environments. The
biggest problem with this is that each plastic has its own set of stress cracking reagents, and
those chemicals that stress crack one type of plastic will have no effect on others. Thus, the
potential stress cracking effect of a specific chemical on a specific plastic must be known from
prior work or be determined by experimentation in order to know whether the problem exists or
not (ASM, 2003). Rotationally molded XLPE storage tanks that store sodium hypochlorite are

45
susceptible to the material degradation; however, the degree to which the chemical environment
leads to tank failure is left undetermined.
Chemicals alone that spur environmental stress cracking have no apparent effect on the
plastic. Without the absence of a mechanical stress, the environmental stress-cracking chemical
has no discernable effect on the plastic. Conversely, the magnitude of stress that will cause
environmental stress cracking will not cause fracture if imposed in the absence of the stress-
cracking reagent (ASM, 2003).
Therefore detecting by analytical methods the physical or chemical changes in a plastic
that has only been exposed to a stress-cracking reagent such as sodium hypochlorite is irrelevant.
For it is only in the presence of both mechanical stress and chemical environment that
environmental stress cracking occurs. Thus conventional chemical resistance tests run on
plastics, in which unstressed tensile bars are soaked in a chemical and withdrawn periodically for
testing, give absolutely no indication of the possibility of environmental stress cracking for any
polymer-reagent system (ASM, 2003).
Stress corrosion cracking in metals is the result of a combination of three factors – a
susceptible material, exposure to a corrosive environment, and tensile stresses above a threshold.
If you eliminate one of these factors, stress corrosion cracking becomes impossible. Although
stress corrosion cracking in metals is different than environmental stress cracking in polymers,
the combination of factors that leads to degradation is similar between the two. For
environmental stress cracking to occur in XLPE storage tanks, the combination of these three
factors must be present.
Failures from ESC may occur early or late in the life of a product. In some cases,
environmental stress cracking will occur as soon as a part is loaded, if the chemical is already
46
present on the surface of a previously unstressed part. Stress cracking reagents also impact the
creep rupture properties of plastics by shortening the time for brittle fracture to occur over that
which exists in the absence of the reagent. Sometimes environmental stress cracking reagents
will create brittle fracture at a low stress level in a polymer such as polyethylene that normally
fails in a highly ductile manner. High-density polyethylene exhibits ductile failure at stresses
near to its reported yield stress. At lower stresses and longer failure times, a different molecular
mechanism controls failure, and brittle fracture occurs at elongation of less than 5%. Presence of
an ESC reagent on the surface of a plastic can dramatically shorten the time for failure to occur
at a given stress level and change the failure mechanism from highly ductile to macroscopically
brittle (ASM, 2003).
2.5.3 Polymer Degradation by Chemical Reaction and Environment
Chemical environments degrade polymers. That is they break down the polymer chains
into lower molecular weight compounds that no longer have the desirable strength or toughness
properties of the original. Certain polymer types are more susceptible than others to specific
degradation mechanisms, but all polymers can be degraded by at least one mechanism. The most
common degradation mechanisms are hydrolysis, thermal degradation, photodegradation, and
oxidation (ASM, 2003). For purpose of this study, oxidation is the only degradation mechanism
that will be examined.
Many polymers, including XLPE and linear polyethylene, will oxidize when exposed to
oxygen-containing environments. As with thermal degradation, oxidation usually commences by
formation of a free radical on the polymer chain. An oxygen atom from the environment will
then react with the unpaired electron to form a hydroperoxy radical. This will then degrade by
one of several reactions, some of which result in chain scission and property loss (Scott, 1985).

47
As with thermal degradation, chemical additive stabilizers and antioxidants can be added
to the polymer that will break the chain reaction in a variety of ways, preserving polymer
properties at least until the additives have been consumed. If oxidation degradation is a possible
contributing factor to a premature failure, it becomes necessary to determine what allowed it to
occur. It may be that stabilizers were not present originally in the proper types or amounts. If
the polymer resin did contain antioxidants, then what caused them to become ineffective must be
determined. In some cases, stabilizers can bloom to the surface of a plastic part and be removed
by ablation, dissolution, or evaporation into the environment (Gedde, 1994). In other cases, the
additives may simply have been consumed doing the job for which they were intended, and
premature oxidation occurred because the service environment was at a higher temperature than
the design engineer anticipated (ASM, 2003). All of these can lead to an oxidized polymer with
reduced mechanical properties, unacceptable appearance, or other deficiencies.
Although most plastic materials react slowly with oxygen alone, elevated temperature
and UV radiation will accelerate the oxidation process. Oxygen that is aided by heat (thermal
oxidation) will attack the bonds in a polymer chain. Oxidation can also occur when certain
materials are exposed to ozone.
2.6 Characterization of Degraded Polymers
The challenge to oxidation testing is answering these two questions (Randy, 1975):
1. What should the experimental conditions be to replicate the desired exposure?
2. How can the changes that occur to the sample be best characterized, i.e., how should
the chemical/mechanical changes be evaluated?
The literature related to this topic contains a variety of methods and procedures used to
answer these questions. The latter question, characterization and testing of the degradation, is

48
the subject of this section. The need to answer this complex question has lead to the application
of many standard mechanical property tests on plastics and has prompted the creation of new
tests to more effectively monitor a specific change in the characterization of the degraded
polymer.
That which is to be characterized, the changes to a plastic during degradation, can be
summarized by the combination of physical, mechanical, chemical, and structural changes. The
physical manifestations of oxidation degradation include loss of transmissivity and discoloration
(Strong, 2006). The loss of mechanical properties involves embrittlement, stiffening, and
cracking (Schoolengerg, 1998a). Chemical property changes include crystallinity and molecular
weight changes and the evolution of oxidation products (Gulmine, 2003). Structural and stress
analysis using the finite element method illustrates and characterizes stress concentrations at
susceptible points of degradation.
2.6.1 Physical Properties
Many analytical techniques are available for the study and characterization of surfaces.
These techniques provide data about the physical topography, physical properties, chemical
composition, and chemical structure of the surfaces under study. Most of these techniques are
based on bombarding the surface with photons, x-rays, ions, neutrons, or electrons and analyzing
the radiation emitted or reflected from the surface (ASM, 2003). Other techniques used other
interactions, such as physical probing or the naked human eye as an instrument to monitor
physical properties.
One result of oxidation degradation is the discoloration or “yellowing” on the surface.
This is the easiest way to detect degradation in a plastic. This can be done with a simple visual

49
glance at the surface of the polymer if the color is intense enough and the plastic is light enough
in color.
Inexpensive spectrophotometers are available, which can quantify the discoloration and
measure the color shift on sample surfaces over time of degradation to show a profile of
“yellowness.” This test is called a “Yellowness” Index Test (Makowsik, 1995). This, however,
only applies to white or other similarly bright colors of material as the yellowness is
overwhelmed by dark colorants.
The other physical property change during degradation that can be characterized by the
naked eye is surface cracking. This is usually described in literature as length and concentration
of cracks, which are determined through the aid of simple light microscopy or scanning electron
microscopy.
The SEM is one of the most versatile instruments for investigating the topology and
chemistry of surfaces. Scanning electron microscopes have been found particularly useful in
failure analysis investigations, particularly because the SEM has the ability to image large,
nonflat samples from low to high magnifications. A conventional SEM typically uses a heated
filament to produce electrons and also requires that the sample be electrically conductive to
prevent buildup in the sample that affects the incoming primary and emitted secondary electrons,
resulting in a poor, distorted image that is constantly changing in contrast and location. Because
most polymers are not electrically conductive, they must be coated with a thin conductive layer,
such as carbon, gold, or metal, to allow examination using a standard SEM (ASM, 2003).
When an electron beam of the SEM strikes a solid surface, electrons and x-rays are
emitted from the surface. An image of the scanned surface region can be generated from any
signal generated by the electron beam (ASM, 2003).

50
2.6.2 Mechanical Properties
Elongation
Tensile elongation-to-break has been found to be the most sensitive mechanical property
to oxidation degradation in polyethylene and has thus been used extensively as the property to
monitor oxidation in a variety of polymers (Bruijin, 1996).
Testing is usually done according to ASTM D 638 (ASTM D 638, 2001). Failure of a
sample is usually considered as the “half-time” of the property, i.e. the degradation time at which
a 50% decrease of some property is observed. The half-time rule is frequently applied to
elongation profiles to compute tfail (time to failure) (Schoolenberg, 1998a; Strong, 2002).
Impact Strength
Although elongation is the most sensitive property in monitoring oxidation degradation,
and therefore the most widely known, it isn’t critical in determining service life, as long as the
yield point doesn’t change. As already mentioned, failure of a plastic product is more often
determined by decrease in impact strength (higher deformation rates) as its behavior changes
from ductile to brittle (Schoolenberg, 1998a). Therefore, impact strength testing is considered
the principle of failure and a good property-candidate to monitor (Strong, 2002).
The tests used to gage the polymer’s impact strength can either be done by ASTM D 256
(“Izod” or “Charpy” methods) or by ASTM D 3763 (with a “Dynatup” tester).
Molecular Weight
Molecular weight (MW) is the most direct measure of the loss of mechanical properties
(Strong, 2002). High molecular weight materials exhibit high mechanical properties as low
molecular weight materials exhibit low mechanical properties. Chain scission during
degradation will cause a general trend of decreasing molecular weight (Lemaire, 1996).

51
Molecular weight can be measured by a variety of instruments. A simple yet effective
method of measurement is through a melt index test (ASTM D 1238). It is during this test that
the sample is heated and the rate of melting extrude falling from the solid is inversely
proportional to the molecular weight, as the melting point is a direct consequence of molecular
weight.
The degradation monitoring of the molecular weight can cause a degree of confusion,
however, because it typically decreases over time (chain scission, it can also increase due to
cross-linking or other reaction mechanisms) (Onyiriuka, 1993). As a result, the test can show
different profiles with different mechanisms of degradation.
Density
During oxidation, density has been reported to increase due to the phenomenon know as
“chemi-crystallization” (Winslow, 1979), the increase in polar groups (Reich, 1971) and oxygen
uptake (Bruijn, 1996). Chemi-crystallization occurs when molecular chain scissions in the
amorphous phase at the sample surface (chemical degradation) initiate the process of rearranging
of cut molecular chains into a crystalline phase (Winslow, 1979). It has been attributed to
account for a portion of the acceleration phase in the property profiles during oxidation
degradation (Yakimets, Lai, and Guigon, 2004).
Density of polymers has been tested using ASTM D 792 or ASTM C 693. Density
profiling has been reported to mirror the changes in crystallinity during degradation (Gulmine,
2003), thus making difficult and expensive differential scanning calorimetry (DSC)
measurements of crystallinity unnecessary.

52
Tensile Strength
The tensile strength has been profiled through degradation but has frequently proven to
not show consistent trends (Gillen, Clough, and Wise, 1996). Slight, linear increases in tensile
strength have been reported (Yakimets, Lai, and Guigon, 2004), but so have slight increases at
first followed by slight decreases (Carrasco, 2001).
Tensile strength depends on the collected strength of the entire sample more than the
surface dependence in elongation failure. And the mechanisms behind its profile are different
with time (either cross-linking or chain-scission), causing both increases and decreases in the
property. Therefore, tensile strength is not a recommended property to profile with degradation
Modulus
The tensile modulus, or Young’s modulus, measures the stiffness of the material. It is
simply the slope of the stress-strain curve in tensile testing according to ASTM D 638. Modulus
can be inferred from the changes in elongation and tensile strength. Most polymers undergo
rapid changes in elongation and slight changes in tensile strength during oxidation, which infers
an increase in the slope of the stress-strain curve and thus an increase in modulus. The stiffening
of polymers has been substantiated by a number of studies (Tavares, 2003; Carrasco, 2001;
Gillen, 1996).
Hardness
The surface hardness of a sample is directly related to the modulus. Oxidation of plastics
has been shown to cause an increase in hardness similar to that of the modulus (Gulmine, 2003).
Such studies have shown a 3x increase in surface hardness in LDPE and 5x increase in modulus
after the same duration of UV exposure (George, 2006).

53
Measurements of polymer hardness are made using Shore D Durometer by ASTM D
2240.
2.6.3 Chemical Properties
The analysis of the chemical changes in a polymer is far less standardized than
mechanical testing. This is due to the continual development and advancement in technology
that continues to enable better analysis and characterization of chemical changes (Bataillard,
2001). To understand what methods have been used in the literature, the technologies are
presented here in order of complexity and chronology of development.
Chromatography
Chromatography refers to a family of tests used to separate mixtures. A mixture
containing the analyte is passed through a stationary phase that separates and isolates the analyte
from the rest of the mixture. All chromatography methods require an extraction method
specifically chosen for a particular functionality chosen as a “target” for analysis (Vanderburg,
1997). Polymers which are solidified after processing need to first be dissolved in an organic
solvent and then precipitating it momentarily along the separation path in the analyzer, leaving
the specific compounds with particular chemical functionalities. Note that this method requires
an understanding of the probable degradation mechanisms in order to choose what reaction
products to look for. This becomes more difficult as the number of examined products increases.
In thin-layer chromatography (TLC), the material is chromatographed on a glass plate
coated with a stationary phase. When the edge of this plate is placed in a solvent, each
compound present migrates up the plate a distance known as the reference value. The distance
migrated by a particular compound depends upon its chemical functionality and therefore can
differentiate between compound types. This method uses inexpensive equipment and is easy to

54
analyze. The limitations and drawbacks to this method are that the sample generation can take a
long time and analysis produces a very low resolution. And it is difficult to differentiate between
the oxidized products of the same family (Bataillared, 2001). TLC is not currently used as a
quantification tool by itself (Airaudo, 1998).
High performance liquid chromatography (HPLC) is the most common technique for
additive analysis (Bataillard, 2001). A solvent system is pumped through a column packed with
a stationary phase. The compounds are separated according to their affinity/partition between
the mobile phase and the stationary phase. HPLC is a commonly used analytic in profiling the
molecular weight changes in photooxidation (Piton, 1997). HPLC is more expensive and more
difficult to analyze then TLC (Dorsey, 1996). And much like TLC, HPLC is not well suited for
quantification.
The following are all types of HPLC: reverse phase, normal phase, and gel permeation
chromatography (GPC). In GPC the separation mechanism is by the molecular weight or
apparent size of the analytes (Marcato, 1991). As a result, GPC has been commonly used to
monitor changes in molecular weight (Karlsson, 1997). Industry experts have described it as the
simplest and most effective way to monitor molecular weight during artificial weathering, but
with inherent shortcoming to reproducibility (O’Donnel, 1994). GPC has also been used to
monitor oxygen uptake during degradation (Gijsman, 1999; Gillen, 1996). One major
disadvantage in using GPC profiling is that the extraction required before analysis makes it a
very slow test compared to other characterization methods. And the samples must be extremely
clean being free from any oligomeric material or soluble polymeric material. This makes the
process expensive and frustrating for the tester (Bataillard, 2001).

55
Spectroscopy
Spectroscopic analysis involves the interactions between energy and the analyzed matter.
Spectroscopic characterization includes chemical structure, molecular environment, polymer
tacticity and conformation, and to monitor changes in these properties following external
perturbations (Ghiggino, 1989).
This type of testing is considered to be more expensive and specialized than other
methods, especially the commonly used chromatography methods. The primary advantage of
spectroscopy is its ability to not only quantifies chemical changes with good resolution, but also
to provide qualitative or structural analysis of all the compounds contained in the sample
(Bataillard, 2001). Another advantage over other methods of polymer chemical characterization
is that spectroscopic measurements are non-destructive and generally quicker to perform
(Ghiggino, 1989).
Fourier Transform Infrared (FTIR) Spectroscopy
FTIR spectroscopy has a very detailed spectral analysis and is useful for the
characterization (quantitative and qualitative) of samples with much functionality. Its high
resolution has made FTIR spectroscopy a frequently used tool in profiling the effects of polymer
degradation (McKelvy, 1996; Ghiggino, 1989). The extent of oxidation is usually expressed as
the absorbance of carbonyl end-groups, and is reported as the carbonyl index. The comparison
of absorbance across time has been expressed as the profile of crystallinity in the degradation of
the polymer (Yakimets, 2004).
FTIR spectroscopy requires a thin layer of material for transmission. Polymer pellets can
be flattened into thin films to be analyzed by the variety of IR and “Raman” microscopes that
employ FTIR (Bataillard, 2001). An advantage of FTIR is that the sample preparation is

56
minimal compared to previously discussed methods of characterization. A disadvantage of FTIR
is that samples containing very strong absorbing chromophores, such as carbon black or other
pigments, are not suitable for direct IR analysis as the absorbance of the matrix overcomes any
absorbance from the additive (Bataillard, 2001). Another disadvantage is the time requirement
to do the microtoming and readings for depth profiles (Schoolenberg, 1991).
Attenuated Total Reflectance (FTIR-ATR)
FTIR spectroscopy can be modified to pay particular attention to the surface of a sample
through the use of attenuated total reflectance (ATR) cells. When using ATR, infrared light
penetrates only into the top 20 microns of the sample. So while characterization resolution is
higher than for any other of the methods described, it is not employed to characterize the bulk of
any non-film sample. Infrared signals acquired with an ATR can measure very small levels of
chemical functional groups on the surface of a sample with low noise and relatively good
resolution (Bataillard, 2001).
The problem with this method is the expense of the machine, the required peak
identification knowledge, and the rigidity of plastics. FTIR works best when you can spread the
material over the viewing crystal for high contact area. Most products made from the
commodity plastics are rigid enough to cause problems with repeatability using this method.
This often becomes the challenge in ATR and requires time and creativity (Kupper, 2004).
Despite these challenges, FTIR-ATR is the most common tool in polymer oxidation
degradation studies because of the surface-limited nature of oxidation as slow diffusivity hinders
UV and oxygen from causing changes deeper into the bulk. The indication of oxidative
degradation of polymers in FTIR-ATR, like FTIR, is usually the observation of carboxyl end-
groups. A comparison can be made between the relative intensity of the carbonyl absorption

57
band, and then for vinyl groups and other groups associated with the end products of oxidative
reactions. In this way, the degradation profiling is not limited to the detection of one particular
chemical reaction mechanism (Kupper, 2004).
One advantage of FTIR-ATR is the ease with which it can do profiling by depth or some
other sample. By varying the angle of incidence in ATR, it is possible to detect variations in
composition of distinct layers from the surface to a specific depth (Gulmine, 2003).
A disadvantage to all transmission spectroscopy is that analysis relies on an
understanding of the reaction mechanism, enough so to predict which functionalities to look for.
The carbonyl index has shown to monitor degradation with suitable correlation to accompanying
mechanical changes, but it relies on the assumption that all mechanisms of oxidation degradation
that occur will be equally represented by carbonyl formation. Perhaps the reason why it
sometimes does not show resolution or clear trends when profiling degradation (Bruijn, 1996) is
that the mechanism is producing a different reactive product.
Mass Spectroscopy (MS)
In MS, molecules in a sample are ionized with energy and then separated according to the
mass of each molecule. In this method, molecules fragment under this ionization into
reproducible patterns. This allows for determination of the original structure of the molecule
from the spectrum of the fragment ions (Bataillard, 2001). MS is considered to primarily be a
quantitative tool, but has advantages in quantification as it requires very little sample and has
very low detection limits. Direct analysis of stabilized polymers may be achieved by electron
impact mass spectroscopy (EI/MS). Static secondary ion mass spectroscopy (SIMS) has been
used to monitor the extent and degree of oxidation (Onyiriuka, 1993).
58
X-Ray Photoelectron Spectroscopy (XPS)
In XPS, the ratio of oxygen atoms to carbon atoms for the microscopic area on the
sample surface can be reported as the extent of oxidation (Onyiriuka, 1993). The limitation with
this method is that XPS can only report the oxygen number corresponding to the top 100
angstroms of the sample. Anything deeper than this value and the XPS is unable to report the
desired oxygen number. As a result, the resolution may be better than FTIRS-ATP, but XPS
may not be able to look deep enough to take accurate tests on the majority of polymer products
that may have experienced oxidation degradation (Favez, 2000; Brewis, 2000). But an
advantage that XPS does have over FTIR-ATP is that its analysis incorporates all possible
functional groups of oxidative products at once – the accompanying disadvantage is that without
separation of functionalities, no analysis of reaction mechanisms based on particular end-
products can be made (George, 2006).
Energy Dispersive X-Ray Spectroscopy (EDS)
Scanning electron microscopes operate by “scanning” an electron beam across the
sample. This electron beam produces a signal that can be detected and processed into an image.
Several types of detectors can be installed on the microscope to detect the different available
signals. One such detector is the energy dispersive x-ray spectroscopy (EDS) detector. EDS
looks at the characteristic x-rays being fluoresced from the sample and determines the elements
in the sample based on the energy of x-ray line produced (George, 2006).
Chemical analysis is performed by measuring the wavelength and intensity distribution of
the x-ray signals generated by a focused electron beam on the specimen. Much like XPS, the
surface is mapped to see relative concentrations of atomic elements (Gulmine, 2003).

59
Oxidation characterization can be reported comparing the ratio of oxygen atoms to
carbon atoms for a given microscopic area. EDS is more effective than XPS because of its
ability to report the oxygen number for deeper areas. This is accomplished by simply increasing
the voltage of the electron beam.
EDS is also a powerful tool for qualitative x-ray chemical analysis. The fact that the total
spectrum of interest, from 0.1 to the beam energy (e.g. 29 kV) can be acquired in a short time
(10-100 s) allows for a rapid evaluation of the specimen elements (Goldstein, 2003). The
resultant spectra can be easily analyzed with computer programs for other trace elements from
impurities or additives. Surface mapping by Gulmine and others (Goldstein, 2003) of
polyethylene samples deduced the presence of sodium chloride (NaCl), silicon oxide (SiO2), and
aluminum oxide (Al2O3), and all salts from the water sprayed on the samples, showing the need
for thorough sample cleaning (Gulmine, 2003).
A typical EDS spectrum for a lightly oxidized XLPE sample from a bleach manufacturer
study is presented in Figure 2-3. The large peak represents the high concentration of carbon, and
the only other significant peak is represented by the small amount of oxygen present.
Scanning Electron Microscopy (SEM)
To understand the value of the EDS analysis, the recent development of environmental
scanning electron microscopy (ESEM) must be understood. Three unusual challenges to the
SEM analysis of polymers are: bond breakage, mass loss, and a decrease of crystallinity. All of
these changes are incident to the ionizing radiation and thermal effects of the high vacuum
electron bombardment (Sawyer, 1996). ESEM is capable of minimizing these three problems by
focusing the incident beam to only affect a very small area of the sample and also by leaving the
environment in the sample chamber similar to the ambient. Both of these differences from

60
Figure 2-3 Typical EDS Spectrum
The high pressure of the sample chamber allows water to be kept as mist in the chamber.
This is impossible in traditional SEM’s because the high vacuum makes pressures that always
are below the triple point of the water phase chart – no liquid phase, only solid to gaseous.
Allowance of a water mist in the chamber is influential in helping prevent the drying of the
sample during the pumping of the chamber (Goldstein, 2003).
This suggests that the hydrogen and oxygen of the water vapor might adversely affect
elemental analysis of the sample surface, especially when small amounts of oxygen are being
profiled. But the amount of water vapor is insignificant. As long as the concentration of water
vapor in the chamber remains constant, this will not affect oxygen content profiles during
degradation (George, 2006).
Energy (kV)
Counts

61
Polyethylene, as well as most other commodity-resins, is a poor conductor. Traditional
SEM beam electrons therefore impinge on the surface and cannot be retransmitted from the
surface, creating a differential charge in relation to the chamber environment vacuum, thus
distorting the image. This is why SEM studies of polymers usually require the time and
resources of sputter coating a thin layer of conductive material (gold/silver/copper) on the
sample. EDS analysis in this manner for one study thus had to explain the presence of a strong
gold (Au) peak due this sputter coating (Gulmine, 2003).
The ESEM allows for good surface analysis of polymers having making them more
conductive because of the gas that is left in the chamber (low vacuum). Electrons ionize some of
the gas particles in the chamber, helping maintain the charge balance at the surface during
electron impingement from the incident beam (Goldstein, 2003). This is a tremendous
development as it minimizes the time and resources needed for sample preparation.

62
3 METHODOLOGY
The purpose of the study is to answer the question – What is the tank life expectancy of a
rotationally molded polyethylene (high-density cross-linked) chemical (sodium hypochlorite)
storage tank as it specifically relates to chemical oxidation? The methods and procedures used to
explore answers to this question are described in this chapter. The research included the
collection of data through a series of tests-physical, mechanical, chemical, and structural-on
newly processed high-density cross-linked polyethylene and exposed high-density cross-linked
polyethylene that has failed while storing sodium hypochlorite.
3.1 Samples for Testing
3.1.1 Sample Specification and Criteria
In order to conduct an accurate study, it was determined that exposed material needed to
be analyzed against virgin material. To eliminate bias and avoid skewed experimental results,
samples were acquired that shared the same material and processing specifications and similar
tank characteristics. The following is a list of specifications, characteristics, and elements that
had to be meet to fit the objectives of the study.
Processing. The sponsor, Poly Processing Company, manufactured the samples,
virgin and exposed, under the same manufacturing process and process controls.

63
Material of tank. All examined samples, virgin and exposed, were made of the same
material, high-density cross-linked polyethylene with an OR (oxygen resistant) liner.
This material is a medium-density, linear-resin with a large amount of antioxidant
added for increase oxidization resistance.
Wall thickness of tank. All examined samples, virgin and exposed, ranged from 1” to
1.25”, respectively. Due to the difficulty in gaining uniform wall thickness in
rotationally molded plastic parts of this size, the wall thickness of each sample varied
slightly.
Size of tank. The tank size was measured in gallon capacity. The tank size of the
examined samples, both virgin and exposed, ranged from 6,100 to 12,150 gals
respectively.
Color of tank. The color of each tank, both virgin and exposed, was natural.
Liquid (chemical) of tank. The liquid stored in the exposed tanks was sodium
hypochlorite. Note that the examined virgin tanks were manufactured for the storage
of sodium hypochlorite, but had not yet been exposed.
Liquid (chemical) concentration (%). The percentage of available NaOCl is 12.25 to
12.50. The weight percent of the NaOCl is 11.10 to 11.25. The grams per liter of the
NaOCl ranges from 122.5 to 125.0. The specific gravity of the NaOCl is 1.160 to
1.170.
Additives. All examined samples, virgin and exposed, contained the similar additive
packages consisting of antioxidants, heat stabilizers, and UV stabilizers. The
following are the specific packages used in the examined tanks: Luperox mix
64
peroxide, Irganox 1076 antioxidant, DLTDP heat stabilizer, and Cyasorb UV 531
stabilizer.
Service life. The examined tanks, virgin and exposed, used for sodium hypochlorite
storage was guaranteed through the manufacturer, Poly Processing Company, for 5
years. Note that the majority of the examined exposed tanks all failed before reaching
their guaranteed service life. For industry, the guaranteed service life ranges from 1
to 5 years. Thou Poly Processing Company has a guarantee service life of 5 years,
many of the commodity type producer’s range from a 1 to 2.
Number of cycles (loading/unloading of liquid). Cycles were the loading and
unloading of the stored liquid. Each tank, specifically tanks used for the production
of bulk bleach, undergoes many cycles in a short period of time. Although it is
difficult to specifically gauge the exact number of cycles for a given tank, the
examined exposed tanks experienced roughly 1,000 cycles per year.
Cause of failure. The potential causes of failure for the examined exposed tanks
include the following: processing error (material and manufacturing), shipping and
handling, environmental causes (weathering, heat, and UV exposure), cyclic stress
(the internal distribution of forces that changes over time in a repetitive fashion – the
loading and unloading of liquid), and chemical oxidation. Note for this study,
chemical oxidation, cyclic stress, and the effect of processing error will be examined.
Section of tank used for testing. The examined samples, virgin and exposed, were cut
from the same sections of the tank, the lower tank wall.

65
3.1.2 Sample Request
The process of acquiring samples that met the required criteria was difficult. As
mentioned in Section 2-2, rotational molding is a primitive process with few manufacturers,
especially companies that produce industrial tanks for the processing and storage of sodium
hypochlorite. Not only is this industry small, but a prospective tank or bleach manufacturer had
to be willing to donate sections of the tank for research. Supplying sections of a tank for research
would require a company to virtually destroy their tank by cutting out sections of the tank wall.
As a result, the vast majority of these companies were naturally hesitant or unwilling to
participate.
With companies unwilling to destroy a useful tank for research, the practical solution was
to locate failed tanks. This endeavor was equally challenging in that failed tanks are typically
immediately scrapped or recycled. Thus, finding a failed tank that meets the tank criteria for
research and has not yet been destroyed was extremely challenging.
Fortunately, Poly Processing Company was a key contact that eased the burden by
locating and acquiring the necessary samples for research. Although many tank and bleach
manufacturers were identified as potential candidates for partnership, Poly Processing Company
surfaced as the partner of choice. From project initiation, Poly Processing Company has been
supportive and influential in supplying this research with the necessary material for testing and
associated data.
Table 3-1 represents the sample request form that was sent to Poly Processing Company
for the purpose of acquiring samples for testing.

66
Table 3-1 Sample Request
3.1.3 Samples for Testing
The following tables (Table 3-2 and 3-3) describe the examined samples. One virgin
sample was taken from each of two different virgin tanks. One exposed sample was taken from
each of two different exposed tanks. Thus a total of four samples were examined from four
different tanks.
Poly Processing Company manufactured the examined tanks, virgin and exposed, and the
examined exposed tanks were used by and acquired from Odyssey Manufacturing.
All acquired samples from Poly Processing Company and Odyssey Manufacturing were
received as one square foot (sq. ft.) sections.
Sample Request
Type Description
Quantity 3-5 samples (minimum)
Size Square foot
Material Cross-link
Wall Thickness Any size
Exposure Time Understand how long samples have been
exposed to bleach
Number of Cycles Understand how many times tank has been
loaded/unloaded
Liquid Bleach

67
Table 3-2 Virgin Sample Descriptions
Virgin
Serial # Mfr. Prod.
Yr.
Tank Size
(Gal.)
Tank
Diam.
Tank
Ht.
Tank
Material
Additives Tank
Color
Wall Thk.
(in.)
Sample
Location
L-10-
02754
Poly
Processing
2010 6,100 8’6” 16’4” HDXLPE Yes Yellow 1.07 Manway
Opening (top)
L-10-
02786
Poly
Processing
2010 6,100 8’6” 16’4” HDXLPE Yes Yellow 1.07 Manway
Opening (top)
Table 3-3 Exposed Sample Descriptions
Exposed
Serial
#
Mfr. Prod.
Yr.
Fail
Yr.
Tank Size
(Gal.)
Tank
Diam.
Tank
Ht.
Resin
Material
Additives Tank
Color
Wall Thk.
(in.)
Liquid
Stored
Weight % of
NaOCL
# of
Cycles
Sample
Location
L-03-
04778
Poly
Processing
2003 2009 12,150 11’11” 16’8” HDXLPE Yes Yellow 1.39 NaOCl 11.10 to
11.25
10,000 Lower
sidewall
L-06-
05896
Poly
Processing
2006 2010 12,150 11’11” 16’8” HDXLPE Yes Yellow 1.39 NaOCl 11.10 to
11.25
2,920 Lower
sidewall

68
3.2 Sample Preparation
As mentioned in Section 3, four types of tests – physical, mechanical, chemical, and
structural - were performed to determine the characterization of examined HDXPE samples,
virgin and exposed. And as discussed in Section 3-1-1, two sets of HDXPE material were
examined – virgin and exposed. Virgin material is referred to as newly processed material that
has not yet been used in industry. Exposed material is processed material that has been used in
industry.
For purpose of this study, sections of virgin and exposed material from rotationally
molded HDXLPE sodium hypochlorite storage tanks were examined to understand the
characterization of the degraded material as it specifically relates to chemical oxidation. To
sufficiently understand the nature of degradation, samples were properly prepared for physical,
mechanical, chemical, and structural tests.
As noted in Section 3-1-3 and depicted in Tables 3-2 and 3-3, a total of four samples
were tested, two virgin and two exposed. The virgin samples were taken from virgin tanks while
the exposed samples were taken from exposed tanks. And one sample was taken from each tank.
Thus a total of four samples were taken and examined from four tanks.
3.2.1 Samples for Physical Testing
The process of preparing samples for physical testing was simple and was the same for
all samples. Since the easiest way to detect degradation in a plastic is the discoloration or
“yellowing” of the surface, the most important condition for noticing this subtle change is to
create a testing environment where a visual observation of the surface of the material can
recognize the discoloration. The other physical property change due to degradation is detectable

69
by the naked eye is surface cracking. Sample preparation to detect physical degradation, such as
discoloration and surface cracking, primary includes sufficient lighting.
3.2.2 Samples for Mechanical Testing
Unlike the sample preparation for physical testing, preparing the samples for mechanical
testing was more complex as it included more involved and intricate planning and processes.
The processes used for sample preparation were divided into three steps: measuring, cutting, and
organizing. Note that all samples were prepared the same.
As discussed in Section 1-4, the second point of the hypothesis is that the level of
oxidation in a HDXLPE sodium hypochlorite storage tank is dependant on time. Hence, the tank
wall oxidizes and thus degrades from the inside out as time continues. And if this is true, then
point three of the hypothesis must be correct – the tank’s mechanical properties will
progressively degrade from the inside out.
It was determined that an efficient way of testing these points (2 and 3) of the hypothesis
would be to test multiple points throughout the tank wall. This was done by cutting multiple
dog-bone tension bars throughout the wall thickness of a tank, starting from the inside and
moving out, and testing them using a tension machine.
Measure
As stated in Section 3-1-3, all samples were received in sq. ft. sections. And according to
ASTM D 638 – 03 (Standard Test Method for Tensile Properties of Plastics), samples must fit
specific dimensions, the sample specimen shape being a dog bone tensile bar. The dimensions
were defined using the ASTM 638 – 03 and measured using the 3D CAD design software,
SolidWorks. Once the model with the appropriate dimensions was created, the sq. ft. samples
were prepared for cutting.

70
Cutting
Cutting multiple dog-bone tension bars from various sections of a tank’s wall thickness
was no easy feat. Finding a machine that could cut multiple bars from one tank sample with the
right dimensions was essential to having functioning samples for testing. After evaluating the
mechanical cutting equipment in BYU labs, it was concluded that BYU’s School of Technology
water jet cutter was the optimum machine for the task.
The BYU waterjet (Figure 3-1) is a 7s model made by Flow International. The pressure
was set at 55,000 psi. Garnet, the precious stone used to cut the samples, was 6,080 grit. The
feed rate used was 40 in/min. GibbsCAM is a state-of-the-art, PC based computer-aided
manufacturing (CAM) system that was used for programming the computer numerically
controlled (CNC) machine tool for the cutting of my samples.
The cutting process included two separate parts and cuts: (1) cutting the initial shape of
the dog-bone tension bar. This is done by cutting the shape of the dog-bone tension bar through
the entire wall thickness of the tank sq. ft. section. (2) Cutting multiple (4-6) dog bone tension
bars throughout the wall thickness of the first cut (accomplished by cutting multiple cross-
sectional cuts throughout the wall thickness of the first cut, the initial dog bone tension bar).
These two cuts, done to dimension, gave an adequate number of samples from each tank wall to
be tested.
Due to the difference in wall thickness from the virgin material to exposed material
(1.07” and 1.39”, respectively), four dog bone tension bars were cut from each virgin tank and
six dog bone tension bars were cut from each exposed tank.

71
Figure 3-1 Water Jet Cutter Machine
Organization
To avoid disorganization that leads to confusion and loss of data results, the efficient
labeling of samples was not only helpful, but also key to the success and validity of the research.
Each sample was labeled individually and specifically according to the following topics: tank
serial number (e.g. L-10-0274), type of testing (mechanical or chemical), material nature (virgin
or exposed), tank number (1, 2, or 3), and sample number (e.g. 1.1). Each sample included each
of these topics and was stored in an airtight zip lock bag.
The following Figure 3-2 is an example of the labeling followed throughout the testing
and analysis of the research.

72
Figure 3-2 Typical Labeling
3.2.3 Samples for Chemical Testing
As discussed in Section 1-4, the first and second points of the hypothesis are (1) that
sodium hypochlorite is an aggressive chemical that leads to the oxidation degradation of an
HDXLPE tank wall and (2) that the level of oxidation throughout the tank wall is dependant on
time, thus oxidizing from the inside out as time continues.
It was determined that an efficient way of testing these points (1 and 2) of the hypothesis
would be by fractography, specifically Energy Dispersive X-Ray spectroscopy (EDX), a form of
EDS that was discussed in Chapter 2. This form of testing allows for very small areas of a
sample to be analyzed for their elemental distribution and chemical composition. Oxidation
characterization is reported by interpreting the ratio of oxygen atoms to carbon atoms for a
microscopic area on the sample surface.
Material Nature Sample Number Serial Number
Type of Testing Tank Number
73
Due to the sensitivity of the spectroscopy, samples with clean polished surfaces were
required to collect accurate data. And in order to characterize the degree of oxidation
degradation throughout the tank wall, samples were prepared so that incremental surface areas
could be tested, starting from the inside of the tank shell moving to the outside surface.
The sample preparation for chemical testing included the following steps: measuring,
cutting, polishing, and organizing. All samples were prepared the same. Three samples were
taken from each tank, resulting in a total of 12 samples.
Measure
As stated in Section 3-1-3, all samples were received in sq. ft. sections. Since there is no
industry standard or test method for spectroscopy of plastics, the following dimensions were
determined for testing: 0.25” x 0.25” x “wall thickness of tank”. The dimensions were defined
using two criteria: (1) the sample properly fits in the SEM-EDX (energy disperse X-ray
spectroscopy analysis conducted by means of SEM – scanning electron microscope), and (2) the
sample contains necessary material (includes an entire section of the wall thickness in order to
take sufficient testing points from the inside out) for testing.
Once the dimensions were defined, a basic 3D CAD model was designed to visually
illustrate the structure. SolidWorks, 3D CAD design software, was used for the design. Upon
completion of the 3D model, the appropriate dimensions for cutting were marked on the sq. ft.
samples so that the sections could be mechanically cut into the desired samples.
Cut
A power bandsaw (Figure 3-3) from BYU’s School of Engineering was used to
mechanically cut the samples. The cutting speed was set at 850 ft/min. The samples were cut
without the used of a cutting fluid as a coolant. The width of the blade was ½ inch. The blade

74
thickness was .025 inches. The TPI (teeth per minute) was 8. And set type was Raker. The
manufacturer of the bandsaw was DoALL. And the model number was 2013-10.
Since the bandsaw lacked automated tools and processes, the quality of the samples from
the bandsaw was initially compromised as flash, rough surfaces, and irregularities were common.
To create the needed surface finish for the spectroscopy, polishing was needed.
Figure 3-3 Bandsaw Cutting Samples
Polish
To create the desired clean surface finish for testing, the excess flash, rough surface, and
irregularities had to be removed, smoothed, and evened. This was done with aid of a mill
(Figure 3-4). The samples were surface milled with a high-positive rake made out of high-speed
steel. The name of the milling cutter used was a fly cutter. This homemade cutter had a positive
rake angle with a 1/8 of an inch radius. This positive rake angle makes the fly cutter sharp and
thus helps minimize heat in the cutting process. Heat, if not carefully monitored, may cause the
heat to melt. The cutting speed was between 12-13,000 rpm. The manufacturer was Ultima.
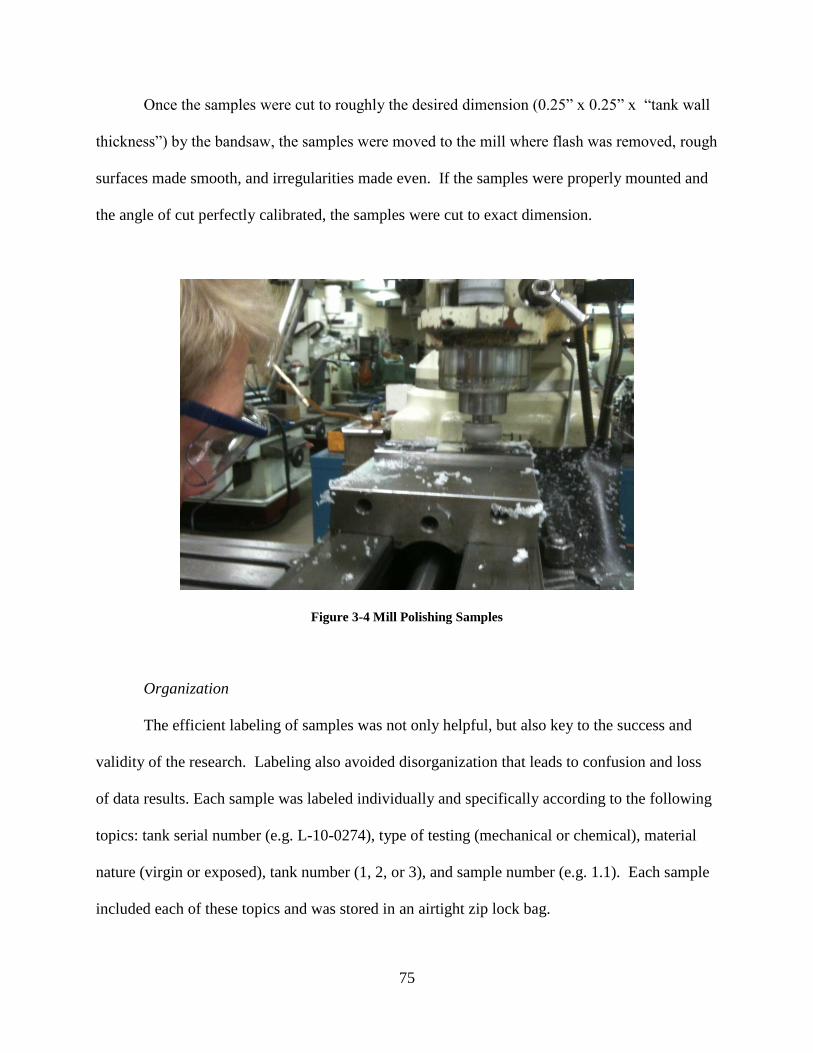
75
Once the samples were cut to roughly the desired dimension (0.25” x 0.25” x “tank wall
thickness”) by the bandsaw, the samples were moved to the mill where flash was removed, rough
surfaces made smooth, and irregularities made even. If the samples were properly mounted and
the angle of cut perfectly calibrated, the samples were cut to exact dimension.
Figure 3-4 Mill Polishing Samples
Organization
The efficient labeling of samples was not only helpful, but also key to the success and
validity of the research. Labeling also avoided disorganization that leads to confusion and loss
of data results. Each sample was labeled individually and specifically according to the following
topics: tank serial number (e.g. L-10-0274), type of testing (mechanical or chemical), material
nature (virgin or exposed), tank number (1, 2, or 3), and sample number (e.g. 1.1). Each sample
included each of these topics and was stored in an airtight zip lock bag.

76
3.3 Analytical Methods
3.3.1 Physical Testing
The physical property changes on the surface of the samples were detected according to
each of the tests presented in Table 3-4. All samples were tested the same.
Table 3-4 Physical Tests Performed on Samples
Property to Monitor Test ASTM Equivalent
Surface Cracking Human Eye
SEM-EDX
N/A
Surface Irregularities Human Eye
SEM-EDX
N/A
Pinholes Human Eye
SEM-EDX
N/A
Discoloration Human Eye
SEM-EDX
N/A
Equipment
Two tools were utilized to detect oxidation degradation on the surface of the samples: the
naked human eye and scanning electron microscopy. Several sets of expert and experienced
eyes visually characterized the physical changes on the surface of the samples. The human eye,
although subject to human error and inability to detect microscopically, is a capable tool for
noting noticeable physical changes –surface cracking, irregularities, pinholes, and discoloration –
on the surface of HDXPE sodium hypochlorite storage tanks. Also the human eye, even at a
quick visual glance, is able to detect oxidation degradation on the surface of white, opaque, or
yellow tanks. The result of oxidation degradation is discoloration or “yellowing” on the surface.
The SEM-EDX was used as an aid in detecting the physical changes and oxidation
degradation.

77
Control Parameters
The only applied parameters included defining, marking and recording the type and
location of the visible physical changes on the surface of the samples. Any visible substantial
physical change, either macroscopically (naked eye) or microscopically (SEM-EDX), was
recorded for future evaluation and analysis.
Procedure
The procedure to conduct the physical test by the human eye consisted of several
individuals examining surfaces of the samples for each of the noted physical changes in Table …
Each physical change was recorded by defining the change as either a surface crack, surface
irregularity, pinhole, or discoloration. Along with defining the physical change, the location of
the change on the sample surface was marked and recorded.
The procedure to conduct the physical test using the aid of the SEM-EDX consisted of
collecting surface images from a variety of randomly selected surface areas. The images were
analyzed to define, mark, and record the type and location of physical change.
Results
Refer to Section 4-1 for results. Fractagraphy pictures are found throughout Section 4-1
visually illustrating the results.
3.3.2 Mechanical Testing
The mechanical properties were according to each of the tests presented in Table 3-5.
ASTM standards were followed according to the indicated tests (“ASTM Reference Manual”,
2001). All samples were monitored using the same test methods under the same conditions,
controls, and parameters.
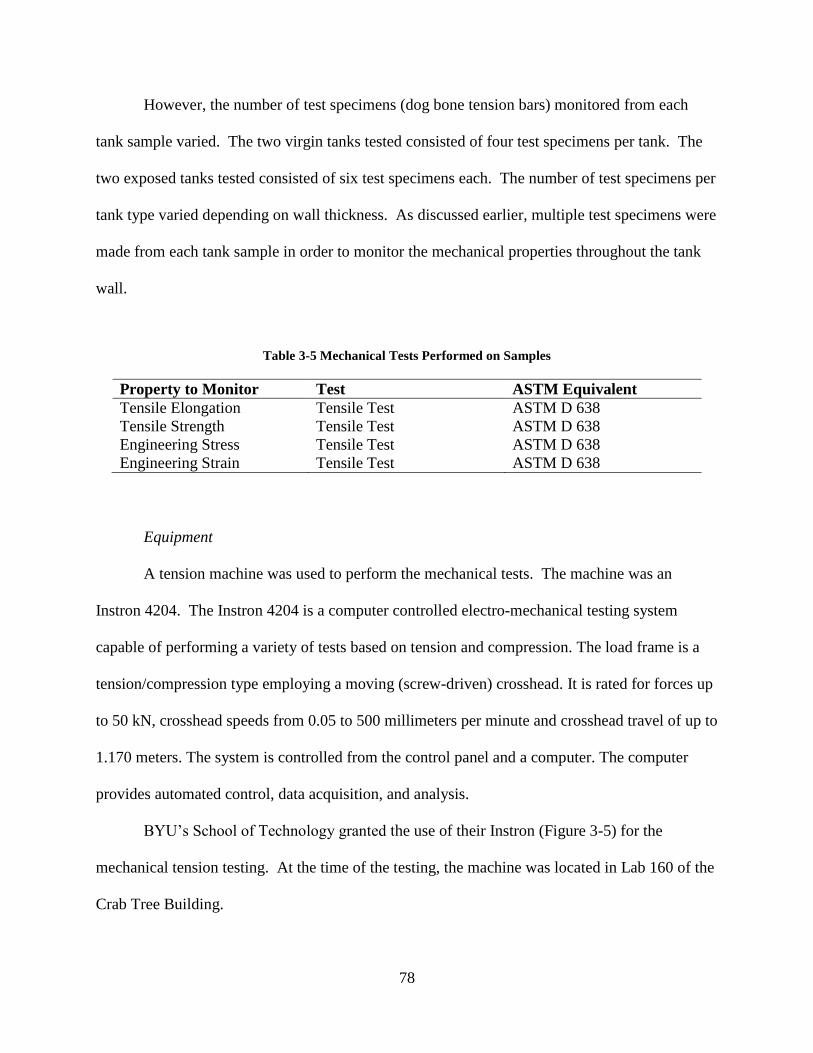
78
However, the number of test specimens (dog bone tension bars) monitored from each
tank sample varied. The two virgin tanks tested consisted of four test specimens per tank. The
two exposed tanks tested consisted of six test specimens each. The number of test specimens per
tank type varied depending on wall thickness. As discussed earlier, multiple test specimens were
made from each tank sample in order to monitor the mechanical properties throughout the tank
wall.
Table 3-5 Mechanical Tests Performed on Samples
Property to Monitor Test ASTM Equivalent
Tensile Elongation Tensile Test ASTM D 638
Tensile Strength Tensile Test ASTM D 638
Engineering Stress Tensile Test ASTM D 638
Engineering Strain Tensile Test ASTM D 638
Equipment
A tension machine was used to perform the mechanical tests. The machine was an
Instron 4204. The Instron 4204 is a computer controlled electro-mechanical testing system
capable of performing a variety of tests based on tension and compression. The load frame is a
tension/compression type employing a moving (screw-driven) crosshead. It is rated for forces up
to 50 kN, crosshead speeds from 0.05 to 500 millimeters per minute and crosshead travel of up to
1.170 meters. The system is controlled from the control panel and a computer. The computer
provides automated control, data acquisition, and analysis.
BYU’s School of Technology granted the use of their Instron (Figure 3-5) for the
mechanical tension testing. At the time of the testing, the machine was located in Lab 160 of the
Crab Tree Building.

79
Control Parameters
The number of test specimens, speed of testing, load calibration, conditioning the test
specimens and test conditions, and selected output data were the control parameters set for this
testing. ASTM D 638 – 03 was strictly followed to properly control these parameters.
The number of test specimens tested was four for each virgin tank sample and six for
each exposed tank sample. Any specimens that broke at some flaw or that broke outside the
narrow cross-sectional test section were discarded.
According to ASTM D 638 – 03, the sample specimen type called for a testing speed 0.2
in./min for all samples. The speed of testing was determined by the specification for the material
being testing.
The load calibration was set at 50 kN load cell.
In order to satisfy ASTM D 638 – 03, all test specimens were conditioned and tested at
23 +/- 2 oC.
The output data selected for data acquisition and analysis was the following: load (N),
tensile extension (nm), and tensile stress (MPa).
Procedure
All samples – virgin and exposed – were tested and monitored until rupture at the narrow
cross-sectional test section by the Instron. Table 3-6 and Table 3-7 describe the specimens tested.

80
Table 3-6 Virgin Specimens Tested
Virgin
Tank
Serial
Number
Samples
per tank
Sample
location
Specimens
(dog bone
tension bars)
per sample
Specimen
#
Machine Procedure
L-10-
02754
2 Manway 4 1
2
3
4
Tension Testing order
according to
specimen
number.
Number
represents
position in tank
wall (inside out)
L-10-
02786
2 Manway 4 1
2
3
4
Tension Testing order
according to
specimen
number.
Number
represents
position in tank
wall (inside out)
Table 3-7 Exposed Specimens Tested
Exposed
Tank
Serial
Number
Samples
per tank
Sample
location
Specimens
(dog bone
tension bars)
per sample
Specimen
number
Machine Procedure
L-03-
04778
2 Lower
sidewall
6 1
2
3
4
5
6
Tension Testing order
according to
specimen
number. Number
represents
position in tank
wall (inside out)
L-06-
05896
2 Lower
sidewall
6 1
2
3
4
5
6
Tension Testing order
according to
specimen
number. Number
represents
position in tank
wall (inside out)

81
Figure 3-5 Instron Tension Machine Used for Mechanical Testing
Results
Refer to Figures 4-10, 4-12, and 4-23 for the resultant data. These figures are graphs that
visually illustrate significant trends in the data.
3.3.3 Chemical Testing
The SEM and EDS monitored the property changes of all the samples according to each
of the tests presented in Table 3-8. All samples were monitored using the same test methods
under the same conditions, controls, and parameters.
Table 3-8 Chemical Tests Performed on Samples
Property to Monitor Test ASTM Equivalent
Oxidation Degradation SEM-EDX N/A
Equipment
The microscope used for this testing was a SEM-EDX. SEM-EDX is the name of the
energy-dispersive X-ray spectroscopy analysis conducted by means of SEM. Its primary

82
purpose is to determine the chemical composition of a particular specimen. For purpose of this
research, the SEM-EDX was used to not only understand the chemical and elemental
composition of the HDXPE samples, but to serve as a tool to detect oxidation throughout a given
sample. This is done by chemical analysis comparing the reported carbon and oxygen levels.
BYU’s School of Technology granted the use of their SEM-EDX (Figure 3-6) for the
chemical testing. At the time of the testing, the machine was located in Lab 135 of the Cluff
Building. FEI, a world leader in electron microscopy technologies and applications,
manufactured this XL30 ESEM-FEG. The XL30 is a fully computerized microscope and offers
a wide range of image acquisition, analysis, and storage possibilities. Edax, a global leader in
energy dispersive X-ray microanalysis, manufactured the associated operating system for the
microscope, Phoenix hardware and Genesis software.
However, the number of test specimens (dog bone tension bars) monitored from each
tank sample varied. The two virgin tanks tested consisted of four test specimens per tank. The
two exposed tanks tested consisted of six test specimens each. The number of test specimens per
tank type varied depending on wall thickness. As discussed earlier, multiple test specimens were
made from each tank sample in order to monitor the mechanical properties throughout the tank
wall.
Control Parameters
The following Table 3-9 states the control parameters set for the testing for all the
samples:

83
Figure 3-6 SEM-EDX Used for Chemical Testing
Table 3-9 Control Parameters for Chemical Testing
Control Setting Description
Area 300 x 400 microns (1200 sq.
microns
Area that detector is able to test
per sample collection
Acceleration voltage 15 kV Voltage between a cathode and
accelerating electrode of an
electron tube. Determines the
energy and wavelength of
electrons in the electron beam
Spot size 5 (arbitrary number that
represents beam size)
The general size range of the final
spot that strikes the sample
Account rate 5000 X-ray counts/minute Number of X-ray counts over an
area
Live time 50 seconds/area Amount of time detector is active
during the acquisition (acquiring
the spectrum). How long sample
is being exposed per area.
Dead time 30% Time it takes for detector to
measure the X-ray that has been
collected, send to computer, and
be ready for next test
Resolution 2nm Shortest distance that is found
between two specimens that can
be distinguished by the observer
and the camera system.

84
Procedure
Points along the specimen to gather data were selected by appearance. PDF plots showed
spectra of elements in the specimen. Focus was on two primary elements, the carbon and oxygen
ratios. The strategy of selecting points was pre-determined and strictly followed to allow for
consistency of results and ease of comparison from one specimen to the next.
As mentioned earlier, the objective is to determine if chemical oxidation degradation in
HDXPE tanks starts from the inside of a tank and moves outwardly throughout the wall
thickness as a function of time (exposure to sodium hypochlorite). To test this hypothesis, it was
proposed that multiple selected points be monitored with the aid of scanning electron
microscopy. The selected points and examined areas moved incrementally from the inside out of
a tank sample.
Table 3-10 shows the points selected in each sample specimen.
Table 3-10 Points Selected for Data Acquisition
Point Distance
1 200 microns from the end surface with OR
2 200 microns to left of OR end point
3 200 microns to right of OR end point
4+ Every 5 millimeters (500 microns) from
each previous point until reaching outer
surface
All samples were tested using this point selection procedure. Three specimens were
tested per exposed tank (two exposed tanks were used) while two specimens were tested per
virgin tank.

85
Due to the complex nature of the XL30 ESEM-FEG, BYU requires that an operator be
sufficiently trained. This formal training requires that one take a semester long course called
Botany 530 Scanning Electron Microscopy.
Table 3-11 and Table 3-12 describes the specimens tested.
Table 3-11 Virgin Specimens Tested
Virgin
Tank
Serial
Number
Specimen
per tank
Sample
location
Specimen
number
Machine Procedure
L-10-
02754
2 Manwa
y
1
2
XL30 SEM-
FEG
Test points
across wall
thickness
from inside
out.
L-10-
02786
2 Manwa
y
1
2
XL30 SEM-
FEG
Test points
across wall
thickness
from inside
out.
Table 3-12 Exposed Specimens Tested
Exposed
Tank
Serial
Number
Specimen
per tank
Sample
location
Specimen
number
Machine Procedure
L-10-
02754
3 Manway 1
2
3
XL30 SEM-
FEG
Test points
across wall
thickness
from inside
out.
L-10-
02786
3 Manway 1
2
3
XL30 SEM-
FEG
Test points
across wall
thickness
from inside
out.

86
Result
Refer to Figures 4-6 and 4-7 for the resultant data. These figures are graphs that visually
illustrate significant trends in the data.

87
4 RESULTS
4.1 Physical Properties: Surface Morphology Changes
The two visually monitored physical changes to surface morphology were surface crack
development and discoloration. The effects of oxidative degradation in plastics are
discoloration, embitterment, and eventually cracking. Sodium hypochlorite is one of the most
commonly used chemicals in industry, and one of the most difficult to handle and control. The
relationship between this aggressive oxidizing agent and its potentially adverse effect on
rotationally molded XLPE storage vessels is critical to understanding tank failure. Monitoring
surface morphology where surface crack development and discoloration initiate is key.
4.1.1 Surface Cracks
Surface cracks on the PE sample surfaces were an easily identifiable sign of oxidation.
Surface cracking of an oxidized degraded surface is one cause of failure in plastic parts
(Schoolenberg, 1998a). Monitoring the development of surface cracks associated with oxidation
allows the inspector to note when oxidation has made a product readily susceptible to failure.
The exposed PE samples show visible inner surface defects after only one year of
exposure to sodium hypochlorite and cyclic stress. The concentration and magnitude of these
surface defects can be visibly seen by the naked eye. The inner surface cracks in the exposed PE
samples examined for this research are predominately located parallel to lumps and wall

88
thickness discontinuity (Figure 4-1). Surface discontinuity refers to variance and changes in tank
wall thickness from one point or area to the next.
Figure 4-1 Interior Surface Cracks Parallel to Lumps, Ridges, and Wall
Thickness Discontinuity in Exposed Samples
The virgin PE samples (Figure 4-2) do not show visible surface defects attributable to
chemical oxidation or cyclic stress – only minor scratches from handling, testing, etc.

89
Figure 4-2 Interior Surfaces of Virgin Samples Showing no Surface Defects
Inner surface cracking was not only inspected macroscopically by the unaided natural
eye, but also examined with the aid of SEM magnification. The exposed material shows a higher
concentration of cracks than the virgin material. High amounts of surface cracks were noticed on
the exposed material near surface discontinuity and ridges. It is there at the surface discontinuity
and at ridges that cracks tend to initiate and propagate. These susceptible points become stress
concentrations that are attacked by sodium hypochlorite and intensified by the continuous
loading and unloading of the liquid. As noticed macroscopically, these surface cracks run
parallel to the surface discontinuity. They are short, linear longitudinal cracks with
perpendicular transverse cracks appearing between the longitudinal cracks at the surface
discontinuity.
The SEM images of the virgin material show very little cracks throughout the samples.
Although the virgin material visibly contains surface discontinuity, there are no cracks at or
along these points.

90
The SEM photomicrographs show the difference in surface cracking between the virgin
and exposed material (Figure 4-3).
Figure 4-3 Increase in Cracks Along Ridges and Lumps for Exposed (left)
than Virgin (right)
On cutting and examing the tank sections, significant stress relief, in form of distortion,
was evident. This indicated a high level of molded-in stress within the part. The fracture surface
was further inspected using SEM. The observed features of exposed material included a
relatively smooth morphology within the crack orign location, which was indicative of slow
crack initiation. Some features in the exposed material associated with more rapid crack
extension, including hackle marks, were found at the fracture areas. The entirety of the fracture
surface features indicated that the cracking had initiated along the interior wall of the tanks. The
cracking then extended transversely through the wall initially, and subsequently,
circumferentially around the wall.

91
4.1.2 Discoloration
The PE samples showed minimal visible yellowing. Evidence of oxidation in natural
colored PE samples can easily be detected visually by the yellow-discoloration of the exposed
samples. After a year of exposure, the examined exposed PE samples had been yellowed, but
only minimally. To understand the degree of discoloration, the virgin material was
macroscopically compared to the exposed material using the naked human eye. Upon
comparison, it was noted that the innermost layer of the exposed material was subject to higher
levels of yellow-discoloration. The slight change of yellow-discoloration between the virgin and
exposed material suggests that oxidation has taken place in the exposed material. Since the inner
surface of the tank is not exposed to photoxidation through UV rays, the only reasonable
conclusion is that the material showed a yellow discoloration as a result of the oxidation of the
sodium hypochlorite.
Many times, a yellow color is observed at sites of degradation. Due to the natural
colorant of the resin, a visual inspection at the surface with the natural eye was sufficient to
detect degradation in the plastic.
The small degree of discoloration in the PE samples shows that the UV-stabilizer
additives in the exposed PE samples do indeed stabilize the UV-induced degradation to an
extent. Although these additive packages may stabilize photo-oxidation and meet usual
customer expectations in the cosmetics of chemical storage tanks, discoloration after a brief
exposure duration suggests that a significant amount of the UV-stabilizer additives have been
consumed.
92
4.1.3 Scanning Electron Microscopy (SEM)
Many previous studies have used SEM to micro-analyze the surface morphology,
especially the evolution of cracks, in degraded polymer surfaces. The spontaneous initiation of
cracks (without an applied load) during oxidation has been detected according to the following
studies:
Crack initiation detected at 5 days of UV exposure (xenon lamp) in thick PP
(Yakimets, Lai and Guigon, 2004).
Comparison of WOM (weather-o-meter) and QUV exposure in PE: after 1600 hrs of
WOM exposure, the surface was covered with micro-cracks in one direction. After
only 800 hrs of QUV exposure, the photographed damage was much more severe,
showing a mosaic pattern with no preferential propagation tendency (Gulmine and
others, 2003).
Comparison of the surface cracking in PE and PP, where failure in PP was reported to
be more influenced by cracking of the photo-degraded surface layer than in PE (Kelly
and White, 1997).
In the WOM exposure of the compression-molded PP, cracks became visible in the
surface between 250 and 300 hrs, and at 1300 hrs the surface was completely
crumbled and powdery (Schoolenberg, 1998a).
Only small fissure-cracks were observed in similar WOM exposure of PP using
injection-molded samples (Qayyum and White, 1986).
SEM images were taken from a variety of samples for this study. The SEM
photomicrographs of the unexposed samples for virgin PE, show new, non-degraded material
(Figure 4-4). Although it is free from cracks, it contains defects. The surface is irregular

93
consisting of lumps and ridges. And multiple small microscopic porous holes are scattered
throughout. Since the material is new, it can only be concluded that these defects are a result of
material or processing error. These defects, however small, become active stress concentrations
in the field where sodium hypochlorite combined with stresses and strains are able to attack these
weak areas.
Figure 4-4 Although Virgin Samples Contain Visible Surface Discontinuity,
They Are Free from Cracks
The exposed samples shows used, degraded material (Figure 4-5) at two magnifications,
400x and 100x. The following characterizes this material:
Surface discontinuity
Lumps
Ridges

94
Holes and voids
Surface cracks
The exposed material, when compared to virgin material, shows a higher extent of
degradation and visual sign of crack initiation and propagation. In Figure 4-5 at 400x, crack
initiation and propagation is seen at surface ridges and lumps. Microvoids and holes are also
observed along with surface discontinuity. Figure 4-5 at 100x is a closer view of these ridges
and microvoids that include cracking.
Figure 4-5 Exposed Sample Visibly Illustrate Crack Initiation and
Propagation along Ridges and Lumps
4.2 Element and Chemical Composition: Energy Dispersive Spectroscopy
SEM scans across the thickness of the tank wall specimens did not show a trend or a
gradient in the oxygen content or the chlorine content of the PE. One hypotheses of this research
was that there would be a gradient, with oxidation or chlorination increasing from the exterior to

95
the interior surface. Although conclusive data was gathered that describes interesting trends,
neither trend nor gradient was found supporting the initial hypothesis.
The data that were profiled over distance from the inside of the tank wall moving
outwardly to the outside surface are shown in Figure 4-6 and Figure 4-7. The first figure set
includes the O/C ratios of the net intensities. Net intensity is the number of X-ray events that
have occurred for that element minus the background. An event is a single X-ray being emitted
from an element and being detected by the detector. Background is non-specific X-ray events.
And a count indicates an individual X-ray event. Net intensity is basically the area underneath
the peak curve and it is the best representation of peak height.
The second figure set includes the O%/C% ratio of the atomic percentages. Assuming
that disregarding the other elements does not significantly affect the O/C profiles, the O-percent
was subtracted from unity (100 percent) to determine the carbon atomic percentage, and the O/C
ratios were subsequently calculated.
The vertical line illustrated in the graphs represents the point at which the OR ends.
Everything to the left of the line includes the OR, which is a medium-density, linear-resin with a
large amount of antioxidant added for increased oxidation resistance. Everything to the right of
the line is the high-density cross-linked polyethylene. The purpose of this line is to visibly
distinguish between the two materials, since they each have different mechanical properties and
thus are suspected to been affected by oxidation differently.
The application of these ratios’ allowed for an intuitive analysis of not only increasing
with time, but in this case, decreasing with distance inward. This study’s O/C ratio profiles have
value in explaining the phenomena; however, this study analyzing O/C ratios does not report a
consistent definite trend of decreasing linear profiles with distance inward.

96
Although there is difficulty in reporting a trend that illustrates oxidative degradation with
distance inward, several interesting occurrences may be concluded. First, the lowest O/C ratios
are found at the first tested point of each examined specimen. This point is .2 mm from the
inside surface of the OR. This low O/C ratio compared to other points suggest that the OR liner
is more resistant to oxidative degradation. That is a medium-density linear-resin with high levels
of antioxidants may be more resistant to an aggressive chemical such as sodium hypochlorite
than high-density cross-linked polyethylene.
Second, an interesting phenomenon in the data is that the lowest O/C ratios in the high-
density cross-linked polyethylene are at the middle of the specimens. Therefore, the middle
layers are less oxidized than the inner and outward surfaces of the high-density cross-linked
polyethylene. The sodium hypochlorite is less able to permeate throughout the wall thickness
into these middle layers. Also, other factors contributing to oxidation, such as UV light, is less
able to pass through the substance and degrade these middle layers.
Slow surface oxidation on the side opposite to that exposed in UV-degradation
experiments has been described as the effects of limited UV transmission combined with easy
oxygen diffusion (Gijsman, Meijers and Vitarelli, 1999). Polyolefins do not absorb UV light
with wavelength greater than 290 nm. Therefore, the UV light will pass through the substance
and degrade both the front and backsides of PE, being limited by oxygen diffusion on either side.
The backside oxidation will, of course, be less than on the exposed side because of the higher
energy, low wavelength radiation that reaches only the exposed surfaces. In this case, the
unexposed sides are suspected to have degraded a small amount from this limited UV
transmission and available oxygen, and not from oxidation by other means besides UV
acceleration (George, 2006).

97
Figure 4-6 EDS C/O Ratio (Net Intensity)

98
Figure 4-7 EDS O/C Ratio (Atomic Percentage)

99
Third, each specimen, virgin and exposed, follows a similar trend in that the O/C ratios
increase from the OR to the start of the high-density cross-linked polyethylene. This occurrence
shows the difference of chemical resistance in the two separate materials. At the change in
material, the oxidation generally increases not typically decreasing until the middle layers of the
specimens.
As illustrated, there is no trend suggesting that oxidation or chlorination occur through
the tank wall thickness. This is not to say that oxidation and chlorination does not take place;
however, it confirms that that the use of the EDS-SEM is unable to draw conclusive data
supporting the null hypothesis.
4.3 Mechanical Properties
Engineering stress-strain curves, strain to failure, and ultimate tensile strength (UTS)
were used to compare the mechanical properties of the exposed and virgin PE samples. Tensile
specimens that were cut from the tank wall samples were pulled in tension in order to determine
whether the strength of the material changed when exposed to sodium hypochlorite and sunlight.
As described in Section 3-3-2, the two virgin tanks tested consisted of four test specimens per
tank while the two exposed tanks tested consisted of six test specimens per tank. Multiple data
profiles and graphs were created to show the stress-strain curves, strain to failure curves, and
UTS curves for each sample and tank.
The strain to failure curves showed several notable trends. First, the exposed and virgin
PE samples are ductile materials that undergo ductile fracture. Ductility of plastic refers to the
extent to which a solid material can be drawn into a thinner cross section. One of the most
important and key concepts in the field of Materials Science and Engineering is fracture. In its
simplest form, fracture can be described as a single body being separated into pieces by an
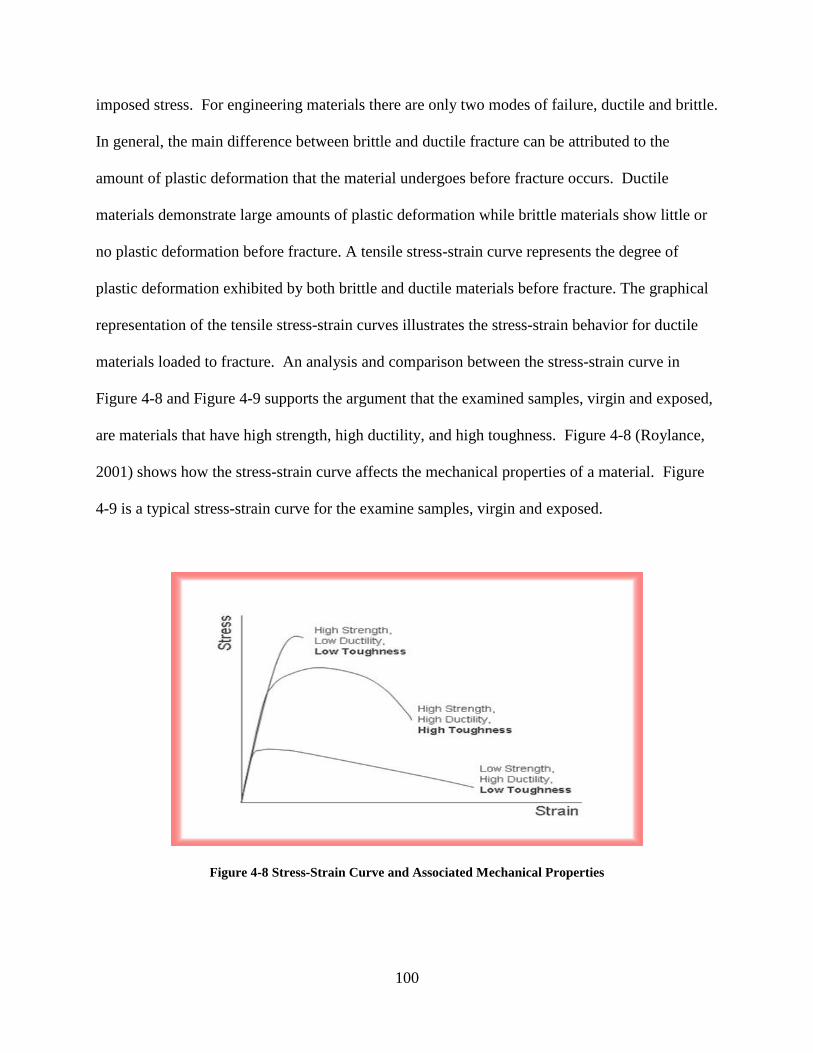
100
imposed stress. For engineering materials there are only two modes of failure, ductile and brittle.
In general, the main difference between brittle and ductile fracture can be attributed to the
amount of plastic deformation that the material undergoes before fracture occurs. Ductile
materials demonstrate large amounts of plastic deformation while brittle materials show little or
no plastic deformation before fracture. A tensile stress-strain curve represents the degree of
plastic deformation exhibited by both brittle and ductile materials before fracture. The graphical
representation of the tensile stress-strain curves illustrates the stress-strain behavior for ductile
materials loaded to fracture. An analysis and comparison between the stress-strain curve in
Figure 4-8 and Figure 4-9 supports the argument that the examined samples, virgin and exposed,
are materials that have high strength, high ductility, and high toughness. Figure 4-8 (Roylance,
2001) shows how the stress-strain curve affects the mechanical properties of a material. Figure
4-9 is a typical stress-strain curve for the examine samples, virgin and exposed.
Figure 4-8 Stress-Strain Curve and Associated Mechanical Properties
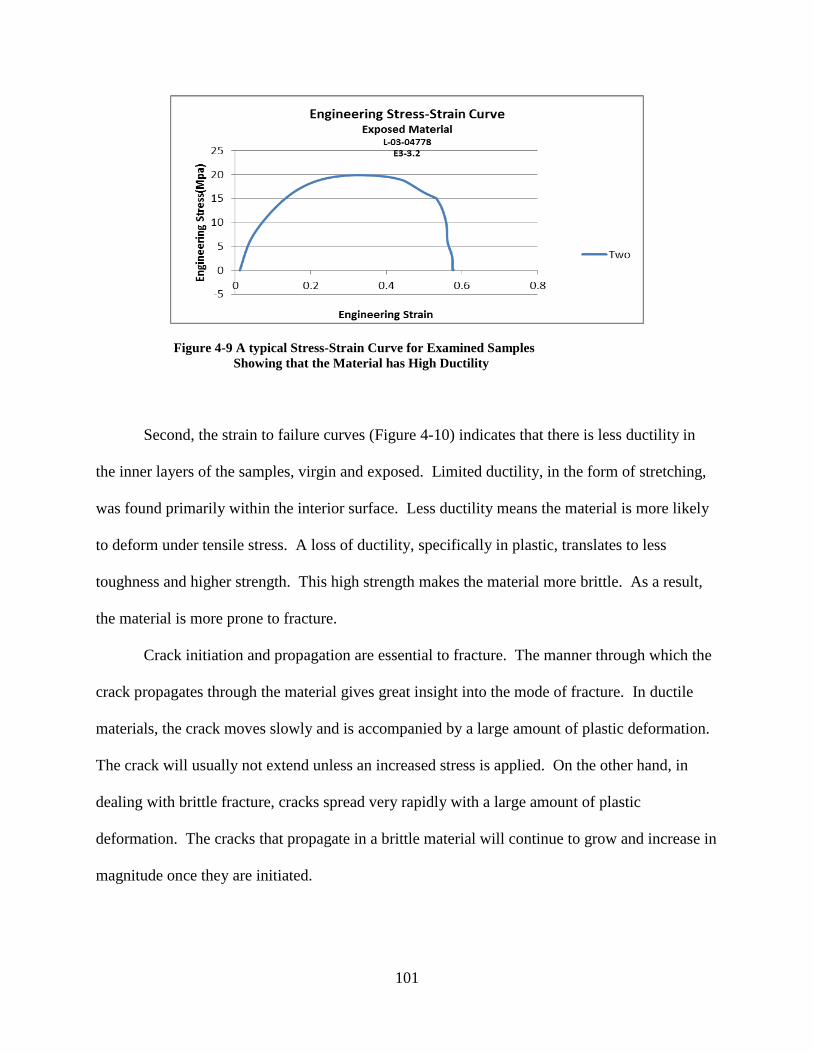
101
Figure 4-9 A typical Stress-Strain Curve for Examined Samples
Showing that the Material has High Ductility
Second, the strain to failure curves (Figure 4-10) indicates that there is less ductility in
the inner layers of the samples, virgin and exposed. Limited ductility, in the form of stretching,
was found primarily within the interior surface. Less ductility means the material is more likely
to deform under tensile stress. A loss of ductility, specifically in plastic, translates to less
toughness and higher strength. This high strength makes the material more brittle. As a result,
the material is more prone to fracture.
Crack initiation and propagation are essential to fracture. The manner through which the
crack propagates through the material gives great insight into the mode of fracture. In ductile
materials, the crack moves slowly and is accompanied by a large amount of plastic deformation.
The crack will usually not extend unless an increased stress is applied. On the other hand, in
dealing with brittle fracture, cracks spread very rapidly with a large amount of plastic
deformation. The cracks that propagate in a brittle material will continue to grow and increase in
magnitude once they are initiated.

102
Figure 4-10 Less Ductility in Inner Layers of Material
As discussed in Section 2-5-2, a susceptible material in the presence of a corrosive
environment that is under high levels of tensile stresses leads to environmental stress cracking.
These samples fit the description of a susceptible material, XLPE, in the presence of a corrosive
environment, such a sodium hypochlorite, under high levels of tensile stress, cyclic stress. The
innermost layers of the tank wall are the most likely to be exposed to the aggressive chemical
agent, sodium hypochlorite, and the rigors of cyclic stress. It is there, at the inner surface of the
tank that the material is most susceptible to environmental stress cracking.
As noted in Section 2-3-6, sodium hypochlorite is a chemical that is known to harden the
tank wall and aggressively attacks the UV stabilizer compound and antioxidants in the tank
material. The reduction of ductility in the inner layers of the exposed tank walls suggest that the
material has become more brittle as the material has been hardened by the sodium hypochlorite.
As a result, a cracks initiate on the inner surface and ultimately leads to crack propagation.
Another important mannerism of crack propagation is the way in which the advancing
crack travels through the material. A crack that passes through the grains within the material is

103
undergoing transgranular fracture. However, a crack that propagates along the grain boundaries
is termed intergranular fracture. The SEM images taken confirmed that the cracks were
intergranular (Figure 4-11). This results in a fairly jagged looking fracture with bumpy edges.
Several processes lead to intergranular cracking or fracture. The following are a few processes
observed in the samples that may have led to this type of crack.
Cyclic loading that leads to plastic deformation between contiguous grains along
grain boundaries. The examined XLPE sodium hypochlorite storage tanks
underwent heavy levels of cyclic stress.
Microvoid nucleation located along grain boundaries. Multiple voids were
located in all samples using the SEM.
Stress corrosion cracking associate with chemical dissolution along grain
boundaries. Sodium hypochlorite was the aggressive oxidizing agent stored in
these examined tanks for extended periods of time.
On both the macroscopic and microscopic levels, ductile fracture surfaces have distinct
features. Macroscopically, ductile fracture surfaces have larger necking regions and an overall
rougher appearance than a brittle fracture surface.
On a microscopic level, ductile fracture surfaces also appear rough and irregular. The
surface consists of many microvoids and dimples.
Third, the virgin material is more ductile than the exposed material. This shows that the
physical and mechanical properties of the exposed material have reduced with cyclic stress and
exposure to sodium hypochlorite. The reduction of ductility in the exposed material to the virgin
material supports the argument that factors such as oxidation must be considered as a cause of
the material degradation. The comparison between the virgin and the exposed clearly illustrates

104
that something is happening that causes the material to alter mechanical properties and
eventually result in tank failure.
Figure 4-11 Intergranular Lattices and Cracking
Ductility is more commonly known as the ability of a material to deform easily upon the
application of tensile force, or as the ability of a material to withstand plastic deformation
without rupture. Ductility may also be thought of in terms of bendability and crushability.
Ductile materials show large deformation before fracture. The lack of ductility is often termed
brittleness. Usually, if two materials have the same strength and hardness, the one that has the
higher ductility is more desirable.
The following diagrams (Figure 4-12) illustrate the stress-strain behavior of the samples,
virgin and exposed, in terms of the engineering stress and engineering strain where the stress and
strain are calculated based on the original dimensions of the sample not the instantaneous values.

105
They are a graphical representation of the relationship between stress, derived from measuring
the load applied on the sample, and strain, derived from measuring the deformation of the
sample. The area under the elastic portion of the curve is known as the modulus of resilience.
Stress-strain curves are an extremely important graphical measure of a material’s
mechanical properties. The analysis of these stress-strain curves illustrates the mechanical
properties of the samples, virgin and exposed. Two keys observations are made on inspection of
the resultant data.
First, the area underneath the curve of the innermost specimen layer is significantly
smaller than the remaining outer specimen layers. The area underneath the stress-strain curve is
toughness. Therefore, if the area underneath the curve for the innermost layers is smaller than
the remaining curves, the innermost layer must be less tough. This means that this layer absorbs
less energy before it breaks. PE sodium hypochlorite storage tanks undergo multiple stresses and
strains while in service. The inner layer being less tough than the outer layers suggests that crack
initiation and propagation is more likely to begin at that weaker point and at an earlier time than
the outer layers.
Second, the ability of a plastic to deform is what keeps a part from breaking. The initial
modulus of all the specimens is steep. If the slope is steep, then the sample has a high tensile
modulus, which means it resists deformation. Although this material resists deformation well, it
has an adverse effect in that it lacks the flexibility needed to deform without breaking. PE
sodium hypochlorite tanks are constantly expanding and contracting as tank load and unload
liquid. If the material of the tank is unable to flex and blend, the tank wall will eventually break.

106
Figure 4-12 Stress-strain Curves for Virgin and Exposed Material
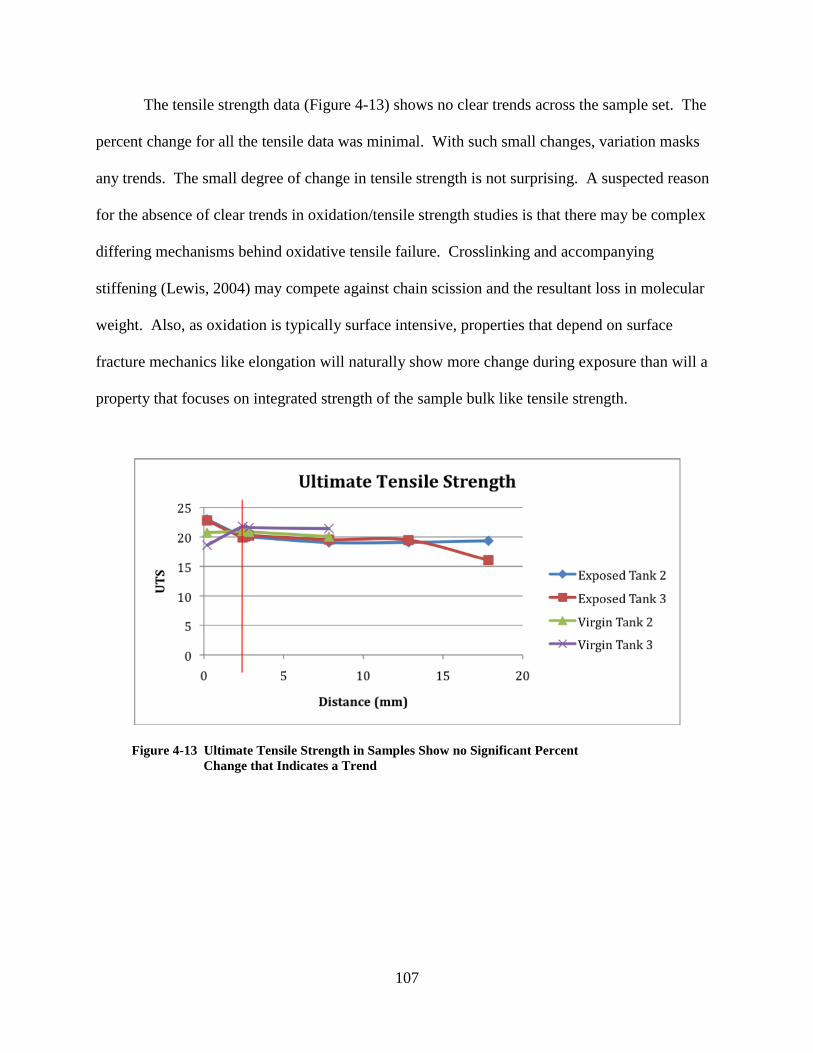
107
The tensile strength data (Figure 4-13) shows no clear trends across the sample set. The
percent change for all the tensile data was minimal. With such small changes, variation masks
any trends. The small degree of change in tensile strength is not surprising. A suspected reason
for the absence of clear trends in oxidation/tensile strength studies is that there may be complex
differing mechanisms behind oxidative tensile failure. Crosslinking and accompanying
stiffening (Lewis, 2004) may compete against chain scission and the resultant loss in molecular
weight. Also, as oxidation is typically surface intensive, properties that depend on surface
fracture mechanics like elongation will naturally show more change during exposure than will a
property that focuses on integrated strength of the sample bulk like tensile strength.
Figure 4-13 Ultimate Tensile Strength in Samples Show no Significant Percent
Change that Indicates a Trend

108
5 CONCLUSIONS AND RECOMMENDATIONS
5.1 Evaluation of EDS Method
In accordance with the primary purpose of this study, as presented in Section 1, EDS
analysis was implemented with the intention of being a rapid, useful method of characterization
of the oxidation in rotational molded XLPE sodium hypochlorite storage tanks. The two
requirements in Section 1 for qualification of this method of analysis were:
1. Quantification of the extent of oxidation in degraded polyethylene should yield
clear and concise profiles of increasing levels of oxidation with distance inward
from the outside of the tank wall to the inside surface.
2. The profile of increasing oxidation should be able to be systematically correlated
(matched up and agree) to the corresponding profiles of the mechanical properties
of degraded polyethylene.
Very good results were seen in respect to the firs requirement, but the EDS analysis did
not provide successful characterization of the extent of oxidation over distance in the tested
samples. The oxidation profiles (of most samples) yielded by the EDS method did not show a
clear increasing trend with distance inward toward the inside surface. According to this test
method, oxidation in high-density, cross-linked polyethylene that has been exposed to sodium
hypochlorite is not time-and-depth dependant.

109
Good results were also achieved in respect to the second requirement, but neither trend
nor gradient were observed as it specifically relates and corresponds to requirement one.
However, the tension results under the graphical representation of stress-strain curves, strain to
failure, and ultimate tensile strength produced profiles that provided a good understanding of
how a loss of basic mechanical properties in a polyethylene material leads to material
degradation, particularly when being exposed to high levels of cyclic stress and sodium
hypochlorite.
As mentioned in Section 1, the effectiveness of EDS analysis was to be compared
between newly processed material and exposed material that has failed while in service. The
effectiveness of the analysis is the degree to which it meets the two requirements listed in
Section 5-1 for the establishment of the method. EDS analysis showed no clear oxidative
distinction between the virgin and exposed samples. That is the profiles between the two were
similar with neither material exhibiting regularly increasing oxidation profiles.
5.2 Important Findings
Below is a list of the important findings from this study.
Physical
1. Interior macroscopic surface cracks of exposed PE are vertically parallel to lumps and
ridges while no interior surface cracks were seen on the virgin PE. This indicates that
macroscopic cracks initiate and propagate vertically parallel to surface discontinuities.
2. SEM fractography showed interior microscopic surface cracking of exposed PE near
material discontinuity and specifically parallel to lumps and ridges Section (4-1-1). This
indicates that microscopic cracks initiate and propagate vertically parallel to surface
discontinuities.

110
3. SEM fractography showed interior microscopic voids and material discontinuity in not
only exposed PE, but also in virgin PE (4-1-3). This suggests that there is some degree of
process error in either material or manufacturing process.
4. A higher degree of yellow discoloration was macroscopically noted by the naked natural
eye on the interior surface of the exposed PE than virgin PE (Section 4-1-2). This
indicates that there has been some level of oxidation due to sodium hypochlorite.
Chemical/Elemental
5. EDS analysis showed that the lowest level of oxidation was found at the first test pointed
(innermost interior surface layer) of each examined PE specimen, virgin and exposed.
This tested point is .2 mm from the inside interior surface of the oxidation resistant layer
(OR), medium-density linear-polyethylene that contains high levels of antioxidants
making this material more resistance to oxidative degradation (Section 4-2). This means
that the innermost interior surface layer has experienced lower levels of oxidation than
the remaining layers. Thus it is concluded that the OR has more resistance to oxidation
and the chemical attack of sodium hypochlorite than the high-density cross-linked
polyethylene.
6. EDS analysis showed that the lowest level of oxidation in the high-density cross-linked
polyethylene was in the middle layers of the examined PE specimens, virgin and exposed
(Section 4-2).
7. EDS analysis showed that each examined PE specimen, virgin and exposed, followed a
similar trend in that the oxidation levels increase from the OR to the start of the high-
density cross-linked polyethylene (Section 4-2).

111
8. EDS analysis did not provide successful characterization of oxidative degradation or
chlorination increasing with distance inward from the outside surface to the interior
surface. The reason it cannot be done still remains unclear (Section 4-2). However, it is
possible that exterior surface has experienced oxidization as a result of photo-oxidation
and that the interior surface has experienced oxidization as a result of chemical oxidation.
Mechanical
9. The virgin PE samples are more ductile than the exposed PE samples. This indicates that
the exposed PE samples have experienced material degradation as a result of the potential
failure mechanisms: degradation of sodium hypochlorite, photo-oxidation, chemical
oxidation, creep, hoop stress, and cyclic stress.
10. There is less ductility in the inner layers of the examined PE samples, virgin and exposed
(Section 4-3). The innermost interior surface layer of the samples is the OR. This is a
medium-density linear polyethylene that contains high levels of antioxidants. If this layer
is less ductile than the remaining layers that are made of high-density cross-linked
polyethylene, it can be noted that the OR is more brittle and is thus more susceptible to
crack initiation and propagation as a result of creep.
11. The innermost interior surface specimen layer of the examined PE samples, virgin and
exposed, was less tough than subsequent layers (Section 4-3). This means that the
innermost interior surface layer is less resistant to impact.
12. The innermost interior surface layer of the examine PE samples, virgin and exposed, has
a higher tensile modulus, which means it resists deformation and thus is less, able to flex
and blend (Section 4-3). This supports the argument that the innermost interior surface
layer is more brittle than subsequent layers.

112
Although it is not conclusive, it is likely that the the sodium hypochlorite XLPE storage
tanks failed due to a creep mechanism associated with the exertion of relatively low stress that
occurred over extended periods of time. Given the lack of apparent ductility in the interior
layers, the stresses responsible for the failure appear to have been below the yield strength of the
material. The reduction of tensile modulus of the exposed material combined with the saturation
of the resin with the aggressive chemical sodium hypochlorite, decreased the creep resistance of
the material and accelerated the failure. Thus dramatic effects of the associated stresses
combined with the solvent are causes of crack initiation in the innermost interior surface layer of
the tanks. Once a crack initiates in the degraded brittle layer, the crack is then able to propagate
through the entire wall thickness.
5.3 Contributions
First, this research builds upon and adds to the thesis of Andrew George. His area of
research used EDS for the non-destructive characterization of weathering damage in plastic.
This thesis included EDS as a non-destructive method for characterizing oxidation degradation in
polyethylene. While George’s research proved that EDS is a viable means of monitoring the
oxidation in a plastic-weathering system, this research concludes that EDS is unreliable as a
method that determines the oxidation in a plastic-oxidized system. Although not statistically
proven as a result of this research, it is possible that the discrepancy in the EDS is from the
double effect of internal and external oxidation.
It is proven that photo-oxidation due to weathering occurs on the exterior surface of
polyethylene (George, 2006). HDXLPE sodium hypochlorite storage tanks are typically outside
and are thus frequently exposed to UV and heat. As a result, they are subject to photo-oxidation
on the exterior surface. Internally these tanks are being exposed to the aggressive oxidizing

113
agent, sodium hypochlorite. Due to the reactive nature of this corrosive chemical and the
material susceptibility of polyethylene, oxidation must be considered as a failure mechanism.
One of the intentions of this research was to take EDS and apply the method to
understand sodium hypochlorite oxidative degradation in polyethylene. Characterizing the
plastic as it specifically relates to oxidation and chlorination would help determine the cause of
failure and tank life longevity. Since George’s research stated that EDS was not only a rapid,
useful method of characterization of the oxidation in weathered plastic materials, but proved that
oxidation in these materials increases with time, it was suggested that EDS be also used to
examine the hypothesis of this research. Thus it is through the expansion of EDS application
that this research has added upon George’s. Academia and industry, as a result, have a broader
breath of knowledge regarding EDS as a potential test method for the characterization of
oxidative degraded plastic.
Second, this is the first documented research that contains resultant empirical data under
these test methods that examined the entire tank wall thickness. For the monitoring of oxidation
and elemental and chemical composition, EDS tested specific points throughout the tank wall
thickness. For the monitoring of mechanical properties, tension tests were conducted throughout
specific cross-sectional tension bar layers of the tank wall thickness. This method of testing not
only monitored degradation at the tank surfaces, but throughout the entire wall thickness.
Analyzing the change from one point or section of the tank to the next not only made the
research novel, but also allowed for meaningful comparative analysis.
Third, Wachob (1993) reported that physical, mechanical, and chemical evidence
strongly indicate that cross-linked polyethylene can be severely oxidized and degraded upon
long-term exposure to concentrated oxidizing environments. The combination of elevated

114
temperatures, stress, the rapid rate of bleach degradation and the evolution of reactive oxygen,
and the frequent refilling of storage tanks with newly manufactured concentrated bleach are
contributing factors to tank failure and the reason behind XLPE degrading at a quicker rate than
XLPE under normal laboratory testing conditions. Wachob also concluded that interior surfaces
had reduced mechanical properties as a result of oxidation and areas of concentrated stress,
which resulted in premature cracking. And that that surface cracks initiated along these stress
concentrations, such as corners, ridges, and lumps.
The physical, mechanical, and chemical testing of this research supports Wachob’s
findings. The SEM fractographic images displayed in this research showed macroscopic voids
and interior surface cracking. The mechanical testing showed less ductility in the interior
surfaces of the tank wall, indicating signs of embrittlement. And although the chemical testing
via the EDS does not state that oxidation increases inwardly toward interior surface, it does
oxidation does exist throughout the tank wall thickness. Therefore, upon analysis of the
physical, mechanical, and chemical tests, it can be suggested that the combination of an
oxidizing environment and cyclic stress degrades the tank material thus jeopardizing the long-
term performance of XLPE sodium hypochlorite tanks.
Cracks are generated from stressing the polymer chains. The presence of sodium
hypochlorite, a very reactive chemical, aids in the polymer chain breaking or degrading in the
presence of stress and in this case, it is fatigue stress due to the loading and unloading of
chemicals. The concluded assumption is that sodium hypochlorite does not attack or degrade PE
in the absence of stress.

115
5.4 Summary and Future Experimentation
EDS is therefore presented as an unreliable means of monitoring the oxidation in a
plastic-chemically oxidized system. The reason it cannot be done still remains unclear. No
comparisons were made in this study to other methods, suggesting further experimentation.
Other characterization methods (e.g. FTIR-ATR and XPS) for the same oxidizing system could
be tested as not only a viable means, but also the best means of oxidation-characterization. This
can be done by directly comparing the resultant oxidation profiles to the newly tested oxidation
profiles. The oxidation profiles for all the methods could then be matched to the mechanical
property profiles of the system to see which method shows the best correlation (most agreement).
Further experimentation is also recommended to understand the primary cause of failure
for rotationally molded, high-density cross-linked polyethylene, sodium hypochlorite tanks.
Testing should include a variety of variables and potential failure modes. Controlled accelerated
testing that includes variables such temperature and time. The controlled environment that
simulates a tank in the field should monitor, evaluate, and analysis potential failure modes:
material and processing error, sodium hypochlorite, environment, and associated stresses and
strains.
The last area of recommended future experimentation applies to the service-life
predication method. A non-destructive method of service life prediction could be proposed
based on the behavior of studied samples which does not require any testing other than effective
characterization methods. The correlation upon which this predication method is based requires
further testing to determine the test and its applicability and practicality for industry. Testing
should involve a variety of environments (both virgin and exposed, natural and accelerated) as

116
well as resin colors and additive packages to determine how broadly the correlation may be
applied.
117
REFERENCES
Airaudo, C. B., (1998) “Thin-Layer Chromatography of Amine Antioxidants and Antiozonants
Used in Elastomers.” Journal of Chromatography 437, 59-82.
Al-Zubi, R., (2002) “Cross-Linked Rotomolded Polyethylene Storage Tanks Offer Superior
Resistance to Rupture.” Poly Processing Technical Paper, 1-3.
American Water Works Association. (1992) “AWWA Standard for Hypochlorite’s.” Denver,
CO: AWWA.
ASM. (2003) “Characterization and Failure Analysis of Plastics.” Collection of Articles from
ASM International Handbooks, 87-427.
Association of Rotational Molders, (2000) “The Right Plastic for Rotationally Molded Designs.”
Plastics: Basics of Design, 136-138.
Bataillard, P., (2001) “21: Analytics.” Plastics Additives Handbook.
Beall, G. L., (1998) “Rotational Molding: Design, Material, Tooling, and Processing.” 1-58.
Bray, D. E., (2005) “Stress and Temperature Effects of Ultrasonic Properties in Cross-Linked
and High Density Polyethylene.” ASME, 220.
Brewis, D. M., (2000) “Electrochemical Pretreatment of Polymers with Dilute Nitric Acid Either
Alone or in the Presence of Silver Ions.” Journal of Adhesion 72, 373-386.
Bray, Don E., (2006) “Evaluating Ultraviolet Degradation in Cross-Linked Polyethylene Storage
Tanks Using Ultrasound.” Materials Evolution, 285.

118
Bruijn, J.C.M., (1996) “Degradation Profiles of Thick High-Density Polyethylene Samples After
Outdoor and Artificial Weathering.” Polymer Durability: Degradation, Stabilization and
Lifetime Prediction: Advances in Chemistry Series No. 249.
Carrasco, F., (2001) “Artificial Aging of High-Density Polyethylene by Ultraviolet Irradiation.”
European Polymer Journal 37, no. 7, 1457-1464.
Churchward, G., (1995) “Linear Low Density Polyethylene for Rotational Moulding.” ARM
Australasia Conference.
Crager, D., (2005) “Failure is Not an Option: Cross-Link Polyethylene Tanks Can Provide Safety
and Reliability.” Pollution Engineering, 14-17.
Crawford, R. J., (1996) “Recent Advances in the Manufacture of Plastic Products by Rotational
Molding.” Journal of Material Processing Technology, 263-271.
Crawford, R. J., (2001) “Optimization of Rotational Moulding of Polyethylene by Predicting
Antioxidant Consumption.” Polymer Degradation and Stability, 321-327.
Crawford, R. J., (2006) “Rotational Molding: The Basics for Designers.” The University of
Waikato, New Zealand & JSJ Productions, Inc. 61-64.
Dorsey, J. G., (1996) “Liquid Chromatography: Theory and Methodology.” Analytical
Chemistry 68, 515R-568R.
ExxonMobil, (1997) “Tip from Technology, Chemical Resistance: Part 1-Environmental Stress
Crack Agents.” ExxonMobil Chemical Corporation.
ExxonMobil, (2000) “Performance of Metallocene Cross-Linked Resin and High Performance
Linear Resins in Rotational Molding Applications.”
Favez, D. D. G., (2002) “RF-Plasma Deposition and Surface Characterization of a Biodegradable
Thin Film Coating.” European Cells and Materials 3, Supplement 1, 20-21.
119
Gedde et al, U.W., (1994) “Stabilizers in Plastics.” Polymer Engineering Science, 1773.
George, A. R., (2006) “A New Spectroscopic Method for the Non-Destructive Characterization
of Weathering Damage in Plastics.” Brigham Young University Thesis.
Ghiggino, K. P., (1989) “Spectroscopic Methods in Polymer Studies.” The Effects of Radiation
on High-Technology Polymers: ACS Symposium Series No. 381, 27-42.
Gijsman, P., (1999) “Comparison of the UV-Degradation Chemistry of Polypropylene,
Polyethylene, Polymaide 6 and Polybutylene Terephthalate.” Polymer Degradation and
Stability 65, 433-441.
Gillen, K. T., (1996) “Prediction of Elastomer Lifetimes from Accelerated Thermal-Aging
Experiments.” Polymer Durability: Degradation, Stabilization and Lifetime Prediction:
Advances in Chemistry Series No. 249.
Goldstein, J. D., (2003) Scanning Electron Microscopy and X-Ray Microanalysis. 3rd ed. New
York: Kluwer Academic/Plenum.
Gordon, G., (1995) “Minimizing Chlorate Ion Formulation in Drinking Water When
Hypochlorite Ion Is the Chlorinating Agent.” Denver, CO: AWWA.
Graham, B. A., (1999) “What Does Stress Cracking Resistance Mean for Rotational Molding.”
ARM Spring Conference, Scottsdale, Arizona.
Gulmine, J.V., (2003) “Degradation Profile of Polyethylene After Artificial Accelerated
Weathering.” Polymer Degradation and Stability 79, 385-397.
Karlsson, S., (1997) “Dicarboxylic Acids and Ketoacids Formed in a Degradable Polyethylenes
by Zip Depolymerization Through a Cyclic Transition State.” Macromolecules 30, 7721-
7728.

120
Kupper, L., (2004) “Attenuated Total Reflection Infrared Spectroscopy for Micro-Domain
Analysis of Polyethylene Samples After Accelerated Ageing Within Weathering
Chambers.” Vibrational Spectroscopy 34, 63-72.
Lemaire, J., (1996) “Mechanisms of Photoxidation of Polyolefins: Prediction of Lifetime in
Weathering Conditions.” Polymer Durability: Degradation, Stabilization and Lifetime
Prediction: Advances in Chemistry Series No. 249.
Makowsik, M., (1995) “Effect of Environmental Pollutants on the Discoloration of
Polyoleefins.” Proceedings of the 17th Annual International Conference on Advances in
Stabilization and Degradation of Polymers Held in Luzern, Switzerland.
Marcato, B. C., (1991) “Determination of Polymeric Hindered Amine Light Stabilizers in
Polyolefins by High-Performance Liquid Chromatography.” Journal of Chromatography
553, 415.
McKelvy, M. L., (1996) “Infrared Spectroscopy.” Analytical Chemistry 68, 93R-160R
Nugent, P., (2001) “Rotational Molding: A Practical Guide.” 17-82.
O’Donnell, B., (1994) “Molecular Weight Measurement in Weathered Polymers.” Journal of
Applied Polymer Science 52, 16-7-1618.
Odyssey Manufacturing Co., (2007) “Sodium Hypochlorite General Information for the
Consumer.” 1-25.
Chlorine Institute., (2006) “Sodium Hypochlorite Safety and Handling.” Pamphlet No 96,
Edition 3. Washington, DC: Chlorine Institute.
Onyiriuka, E.C., (1993) “Effects of High-Energy Radiation on the Surface Chemistry of
Polystyrene: A Mechanistic Study.” Journal of Applied Polymer Science 47, 2187-2194
Phillips Petroleum Company, (2002) “Phillips on XLPE.”

121
Pospisil, J., (1995) “Aromatic and Heterocyclic Amines in Polymer Stabilization.”
Polysoaps/Stabilizers/Nitrogen-15 NMR: Advances in Polymer Science, 124
Rabek, J.F., (1990) Photostabilisation of Polymers. London: Elsevier.
Randy, B., (1975) “Photodegradation of Polypropylene Containing a Nucleating Agent.” Journal
of Applied Polymer Science, 2505-2517.
Reich, L., (1971) Elements of Polymer Degradation. New York: McGraw-Hill.
Winslow, F.H. (1979) “Recent Studies of Polymer Degradation and Stabilization.” Die
Makromolekulare Chemie 2, no. S19791 (supplement), 27-34.
Sawyer, L. C., Polymer Microscopy. 2nd ed. London: Chapman and Hall, 1996.
Schoolenberg, G. E., (1991) “Ultra-Violet Degradation of Polypropylene: 1. Degradation Profile
and Thickness of the Embrittled Surface Layer.” Polymer 32, 432-437.
Schoolenberg, G.E., (1998) “A Fracture Mechanics Approach to the Effects of UV-Degradation
on Polypropylene.” Journal of Materials Science 23, 1580-1590.
Stevens, Michael G., (2008) “What is the Best Resin for FRP Sodium Hypochlorite Storage
Tanks.” Corrosion 2008, March 16-20, 2008, New Orleans LA, 524.
Strong, A. Brent, (2000) “Judging Performance of a Polyethylene Product.” Brigham Young
University, 1-2.
Strong, A. B., (2002) Plastics Materials and Processing. 3rd ed. Upper Saddle River, New Jersey:
Prentice Hall.
Strong, A.B., (2002) “Los Angeles Public Report on Task Directive, Weatherometer Testing for
Garage Cans.” Technical Report, Brigham Young University.
Synder Industries, Inc. (2007) “Sodium Hypochlorite Storage.” Lincoln, NE: Synder Industries,
Inc.

122
Tavares, A.C., (2003) “The Effect of Accelerated Aging on the Surface Mechanical Properties of
Polyethylene.” Polymer Degradation and Stability 81, no.2, 367-373.
Tredwell, S., (1995) “Interpretation of ASTM Standards.” ARMA Conference, Christchurch,
New Zealand.
Vanderburg, H. J., (1997) “Critical Review: Analytical Extraction of Additives From Polymers.”
Analyst 122, 101R-115R.
Voldner, E., (1999) “Crosslinked Polyethylene Scrap ca be Recycled.” Rotational Molding SIG
RETEC.
“ASTM Reference Manual.” Philadelphia: American Society for Testing and Materials, 2001
Wachob, H. F., (1993) “Effect of Oxidizing Environments on Long-Term Performance of
Rotationally Molded XLPE Storage Tanks.” ASTM Special Technical Publication, 132-
144.
Waigaonkar, S., (2008) “A New Approach for Resin Selection in Rotational Molding.” Journal
of Reinforced Plastics and Composites, 1021.
White, G. C., (2010) “White’s Handbook of Chlorination and Alternative Disinfectants.” Black
and Veatch Corporation, 452-521.
Wigotsky, V., (1998) “Rotational Molding-An Industry in Motion.” Plastics Engineering, 18.
Wu, Q., B. Qu, Y. Xu, and Q. Wu, (2000) “Surface Photo-oxidation and Photostablisation of
Photocross-linked Polyethylene.” Polymer Degradation and Stability 68, no. 1, 97-102.
Yakimets, I., (2004) “Effect of Photo-oxidation Cracks on Behavior of Thick Polypropylene
Samples.” Polymer Degradation and Stability 86, 59-67.
Zarnitz, C. E., (1999) “Chemical-Resistant Tanks and Linings.” Metal Finishing, 667-668.