A study of Sensorless Control of Induction Motor at Zero...
11
EPE-PEMC 2002 Dubrovnik & Cavtat P. 1 A study of Sensorless Control of Induction Motor at Zero Speed Utilizing High Frequency Voltage Injection Dušan Drevenšek University of Maribor, Faculty of Electrical Engineering and Computer Science Smetanova 17, 2000 Maribor, Slovenia Phone: +386 2 220 7309, Fax: +386 2 220 7315 e-mail: [email protected] Damir Žarko, Thomas A. Lipo University of Wisconsin – Madison Department of Electrical and Computer Engineering 2557 Engineering Hall, 1415 Engineering Drive Madison, WI 53706-1691, USA Phone: +1 608 262 0287, Fax: +1 608 262 5559 e-mail: [email protected] , [email protected] Keywords Sensorless control, induction motors, measurements, modelling Abstract A detailed investigation of sensorless control of induction motor at zero and very low speed based on injection of a pulsating high frequency voltage signal is presented. A sensing technique used to measure air gap flux position in a squirrel cage induction motor is based on the secondary effect of magnetic spatial nonlinearity caused by saturation of the stator laminations. The physical insight into the motor excited by high frequency test signals is given by means of experiment and finite element simulation. It is shown that it is possible to control the motor torque using the proposed technique, but with low bandwidth and with the necessity to perform special tests and measure special characteristics for each new motor prior to utilization. 1. Introduction A key requirement for sensorless control of an induction motor is the ability to determine the position of the flux in the machine without measuring the speed or position of the rotor. Methods for sensorless control focused on exploitation of saturation effects in a squirrel cage induction motor have been the subject of research in the recent years. These methods can be divided into two groups, depending on whether they use the fundamental excitation of the machine or a separate high frequency excitation. The methods based on fundamental excitation [1-4] fail at low and zero speed, but methods with high frequency excitation do not have such a problem. Methods from the second group can be further divided with regard to the measured signal. This signal can be either the neutral terminal voltage [5], which is less convenient because of the need for additional sensor, or phase currents [6-9], where current sensors already exist, so there is no need for additional hardware. Moreover, there are two different methods that can be used to apply a high frequency signal to the motor. One can utilize either a high frequency signal producing rotating field [6-7] or a high frequency pulsating signal [8-9]. This paper is focused on a method based on injection of a high frequency pulsating voltage vector that rotates in the synchronous d-q reference frame and scans the spatial high frequency admittance image. This method allowed one to control the motor torque, but with very limited bandwidth. An injection of a high frequency current signal is also possible, but it demands very fast acting digital current control. Such a fast control becomes increasingly difficult to achieve when the ratio between the sampling frequency and the high frequency signal becomes small.
Transcript of A study of Sensorless Control of Induction Motor at Zero...
EPE-PEMC 2002 Dubrovnik & Cavtat P. 1
A study of Sensorless Control of Induction Motor at Zero Speed UtilizingHigh Frequency Voltage Injection
Dušan DrevenšekUniversity of Maribor, Faculty of Electrical Engineering and Computer Science
Smetanova 17, 2000 Maribor, SloveniaPhone: +386 2 220 7309, Fax: +386 2 220 7315
e-mail:[email protected]
Damir Žarko, Thomas A. LipoUniversity of Wisconsin – Madison
Department of Electrical and Computer Engineering2557 Engineering Hall, 1415 Engineering Drive
Madison, WI 53706-1691, USAPhone: +1 608 262 0287, Fax: +1 608 262 5559
e-mail:[email protected], [email protected]
KeywordsSensorless control, induction motors, measurements, modelling
AbstractA detailed investigation of sensorless control of induction motor at zero and very low speed based oninjection of a pulsating high frequency voltage signal is presented. A sensing technique used tomeasure air gap flux position in a squirrel cage induction motor is based on the secondary effect ofmagnetic spatial nonlinearity caused by saturation of the stator laminations. The physical insight intothe motor excited by high frequency test signals is given by means of experiment and finite elementsimulation. It is shown that it is possible to control the motor torque using the proposed technique, butwith low bandwidth and with the necessity to perform special tests and measure special characteristicsfor each new motor prior to utilization.
1. IntroductionA key requirement for sensorless control of an induction motor is the ability to determine the positionof the flux in the machine without measuring the speed or position of the rotor. Methods for sensorlesscontrol focused on exploitation of saturation effects in a squirrel cage induction motor have been thesubject of research in the recent years. These methods can be divided into two groups, depending onwhether they use the fundamental excitation of the machine or a separate high frequency excitation.The methods based on fundamental excitation [1-4] fail at low and zero speed, but methods with highfrequency excitation do not have such a problem. Methods from the second group can be furtherdivided with regard to the measured signal. This signal can be either the neutral terminal voltage [5],which is less convenient because of the need for additional sensor, or phase currents [6-9], wherecurrent sensors already exist, so there is no need for additional hardware. Moreover, there are twodifferent methods that can be used to apply a high frequency signal to the motor. One can utilize eithera high frequency signal producing rotating field [6-7] or a high frequency pulsating signal [8-9].
This paper is focused on a method based on injection of a high frequency pulsating voltage vector thatrotates in the synchronousd-q reference frame and scans the spatial high frequency admittance image.This method allowed one to control the motor torque, but with very limited bandwidth. An injection ofa high frequency current signal is also possible, but it demands very fast acting digital current control.Such a fast control becomes increasingly difficult to achieve when the ratio between the samplingfrequency and the high frequency signal becomes small.

EPE-PEMC 2002 Dubrovnik & Cavtat P. 2
The traceable saliencies in the motor which appear due to saturation are mainly concentrated in thestator and rotor teeth. The highest saturation occurs along the axis of the rotating flux and changesdynamically with the rate that corresponds to the double fundamental frequency. In other words, theperiod of the spatial distribution of saliency is equal to one pole pitch of the machine.
In the case when the fundamental voltage (or current) and the high frequency pulsating signal aresimultaneously applied the classical model of the induction machine cannot provide useful insight intomotor behavior. With FEM analysis a better understanding of the motor behavior under suchconditions has been obtained. However, the results of the FEM analysis have demonstrated thatbecause of the variety of motor designs and magnetic non-linearity the suitable control laws could notbe designed from conventional motor parameters. Although it has been demonstrated that it is possibleto close the torque loop at zero and very low stator frequencies (with very low bandwidth), it is onlypossible to do so by making special tests on the motor and measure special characteristics which arethen used on-line as look-up tables.
All experiments were carried out on a motor: Reliance Electric Company, 3HP, 230/460V, 8.4/4.2 A,60Hz, 3 phase, 1750 rpm. Since detailed geometric data of the motor necessary for the FE analysiswere not available, the simulations were carried out using the data for the motor: Reliance ElectricCompany, 30 HP, 460 V, 34.6 A, 60 Hz, 3phase, 1765 rpm. The experiments could not be conductedon this particular motor due to the power limit of the available inverter.
2. Method With Injection of High Frequency Pulsating VoltageThe basic principle of this method is to inject a high frequency pulsating voltage signal into the motorand then rotate this pulsating signal in order to obtain a saliency image which is caused by saturation.Since the injected signal is voltage and the measured signal is current, the saliency can be representedby the admittance corresponding to the high frequency signal.
In Fig. 1 the vector diagram presents the principle of this method. The entire processing is performedin the synchronousd-q reference frame which rotates with the fundamental frequency. The injectedhigh frequency voltage signal is marked ashfv . This signal is actually a pulsating signal (this is
marked with arrows) and could also be represented by two vectors rotating in opposite directions. Theangle of this pulsating vector which also rotates with the frequency of 50 Hz relative to thed-q frameis marked asε where t502πε = . The consequence of this injected high frequency voltage signal isthe high-frequency current
xhfi , which is pulsating in the direction of the voltage vectorvhf. There is
also a smaller pulsating current componentyhfi present in the perpendicular direction.
i s
d
vhf
scan
q
ihf x
i hf y ε
Fig. 1 Vector diagram for pulsating voltage vector injection ind-q synchronous reference frame

EPE-PEMC 2002 Dubrovnik & Cavtat P. 3
There are two low-pass filters for the current control loop which decouple the current control of thefundamental signal from the high frequency signal. A band-pass filter is utilized for the high frequencysignal processing which transfers only the high-frequency signal and blocks the low frequency.
If the injected pulsating voltage signal also rotates, the measured high frequency current componentspatially parallel to the injected voltage changes. Hence, the result is amplitude modulation of thecurrent signal, so that the envelope of the high frequency signal can now be interpreted as theadmittance. This signal can be presented in a polar diagram. Figs. 2 and 3 show spatial distribution ofadmittance for zero torque and torque of +5 Nm, both at zero speed.
An important measurement limitation is that very slow rotation (scanning) of the injected highfrequency signal is not very useful because it results in a very slow updating rate. With an appropriatefilter design it was experimentally determined that it is possible to increase the scanning frequency ofthe pulsating vector up to 50 Hz without significant loss of information. With the frequency increasethe band-pass filter introduces certain phase shift, but for fixed frequency this phase shift is constantand can be corrected. The phase shift for the 4th order Butterworth band-pass filter with cut-offfrequencies 460 Hz and 760 Hz is 220. A moving average filter used for amplitude demodulationintroduces the additional phase shift of 17.10.
0.02
0.04
0.06
0.08
0.1
30
210
60
240
90
270
120
300
150
330
180 0
0.05
0.1
0.15
30
210
60
240
90
270
120
300
150
330
180 0
Fig. 2 Measured admittance saliency at scanningfrequency 50 Hz for zero torque
Fig. 3 Measured admittance saliency at scanningfrequency 50 Hz for torque +5 Nm
Fig. 4 shows a typical ellipse orientation with stator current vector for positive torque. Angleγrepresents the rotation angle of the ellipse,δ is ellipse rotation angle relative to the stator currentvector andY is admittance magnitude. The relationship between the anglesγ, δ, the admittancemagnitudeY and the torque were measured by test for the steady state condition.
d
q
is
ψrd
γ δ
Y
Fig. 4 Ellipse orientation with anglesγ, δ and admittance magnitudeY

EPE-PEMC 2002 Dubrovnik & Cavtat P. 4
From the results of steady state measurements shown in Figs. 5 and 6 it is obvious that anglesγ andδare nonlinear functions of torque. These measured steady state data can be used as feedback signals forclosed loop torque control. Angleδ was selected as a better candidate for that purpose. Since therealways exists a pair of different torque levels which result in only one angleδ, the admittancemagnitudeY had to be used as well to form the look-up tables which were then used to calculateestimated torque. The angleγ was not convenient for feedback because the slope of this signal wassmall for torque levels above±3 Nm.Two look-up tables were generated from the results shown in Fig. 6. These two-look-up tables wereactually used to calculate estimated torque from previously measured steady state data. The look-uptables are shown in Fig. 7.
−15 −10 −5 0 5 10 15−20
0
20
40
60
80
100
120
140
T (Nm)
γ (d
eg
) −15 −10 −5 0 5 10 150
20
40
60
80
100
Torque (Nm)
δ (
de
g)
−15 −10 −5 0 5 10 151200
1400
1600
1800
2000
2200
2400
Torque (Nm)
Y
Fig. 5 Relationship betweenγ and torque Fig. 6 Relationship betweenδ, admittancemagnitudeY and torque
0 20 40 60 80 100 120−3
−2
−1
0
1
2
3lookup table I
δ (deg)
T (
Nm
)
0 20 40 60 80 100 120−30
−20
−10
0
10
20
30lookup table II
δ (deg)
T (
Nm
)
Fig. 7. Look-up tables for torque estimation
An attempt was made to close the loop with only the described torque estimation. In Fig. 8 theproposed control scheme for variable speed sensorless control is presented. The current referenceref
sdi is
considered as a constant andrefsqi is calculated in the same manner as in the case of indirect rotor flux
oriented control. The mechanical rotor frequencymω is calculated from the stator frequencyeω and
from estimated slip frequency slω as
psle
m
ωωω −= (1)
wherep is the number of pole pairs.
EPE-PEMC 2002 Dubrovnik & Cavtat P. 5
LPF
LPF
PW
M
BPFAmpl i t ude
demod.
HFGene r at or
+−
+
e−j ε
Admi tt ance peak sea r ch
Tor que est i mat or
Tor que r egul at or
Speed r egul at or
Y
1p
+
−
−
−
+
I M
I NVERTER
V dc
T re f
i sdre f
i sqre f
i sd
i sq
0
−
ωm
r ef
ωm
isqcal c
ωs l cal c . ω
s l
ωe
ejε
ε
ejρ
e−j ρ
ρωe
ε
δ
T
ε
i sa
i sb
i hfx
vhf
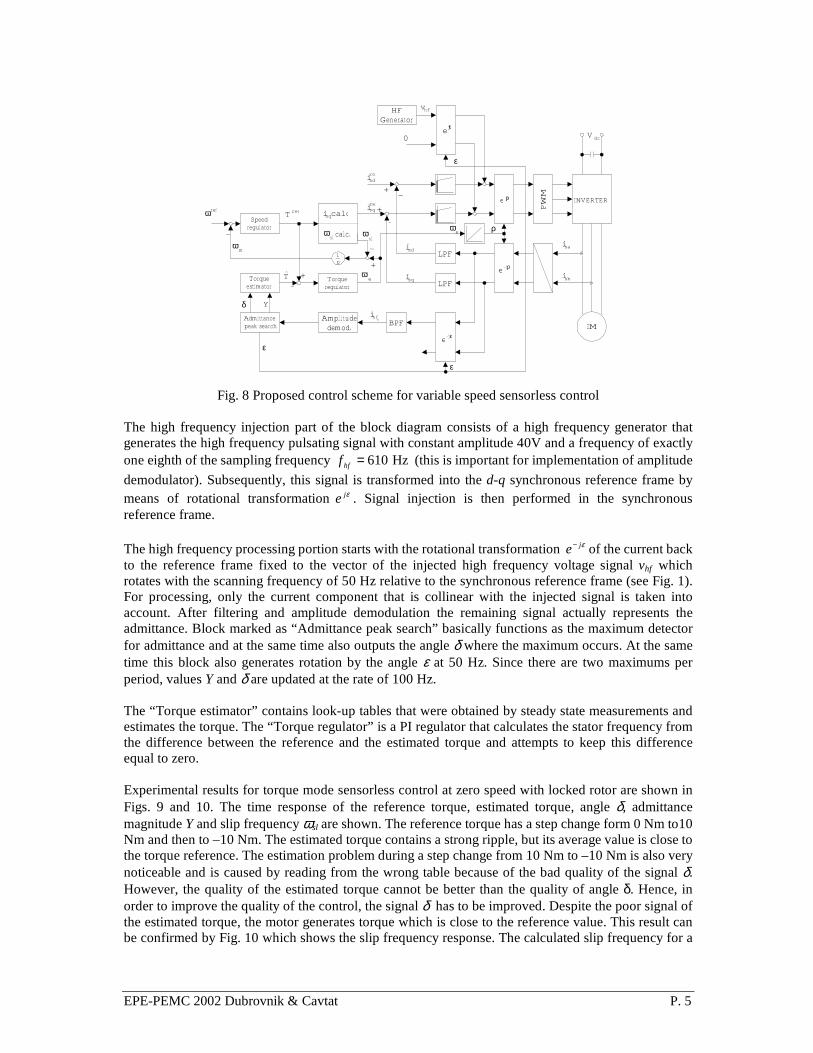
Fig. 8 Proposed control scheme for variable speed sensorless control
The high frequency injection part of the block diagram consists of a high frequency generator thatgenerates the high frequency pulsating signal with constant amplitude 40V and a frequency of exactlyone eighth of the sampling frequency Hz610=hff (this is important for implementation of amplitude
demodulator). Subsequently, this signal is transformed into thed-q synchronous reference frame bymeans of rotational transformationεje . Signal injection is then performed in the synchronousreference frame.
The high frequency processing portion starts with the rotational transformationεje− of the current backto the reference frame fixed to the vector of the injected high frequency voltage signalvhf whichrotates with the scanning frequency of 50 Hz relative to the synchronous reference frame (see Fig. 1).For processing, only the current component that is collinear with the injected signal is taken intoaccount. After filtering and amplitude demodulation the remaining signal actually represents theadmittance. Block marked as “Admittance peak search” basically functions as the maximum detectorfor admittance and at the same time also outputs the angleδ where the maximum occurs. At the sametime this block also generates rotation by the angleε at 50 Hz. Since there are two maximums perperiod, valuesY andδ are updated at the rate of 100 Hz.
The “Torque estimator” contains look-up tables that were obtained by steady state measurements andestimates the torque. The “Torque regulator” is a PI regulator that calculates the stator frequency fromthe difference between the reference and the estimated torque and attempts to keep this differenceequal to zero.
Experimental results for torque mode sensorless control at zero speed with locked rotor are shown inFigs. 9 and 10. The time response of the reference torque, estimated torque, angleδ, admittancemagnitudeY and slip frequencyωsl are shown. The reference torque has a step change form 0 Nm to10Nm and then to –10 Nm. The estimated torque contains a strong ripple, but its average value is close tothe torque reference. The estimation problem during a step change from 10 Nm to –10 Nm is also verynoticeable and is caused by reading from the wrong table because of the bad quality of the signalδ.However, the quality of the estimated torque cannot be better than the quality of angleδ. Hence, inorder to improve the quality of the control, the signalδ has to be improved. Despite the poor signal ofthe estimated torque, the motor generates torque which is close to the reference value. This result canbe confirmed by Fig. 10 which shows the slip frequency response. The calculated slip frequency for a

EPE-PEMC 2002 Dubrovnik & Cavtat P. 6
torque of 10 Nm was 7.7 rad/s, so one can observe that the controller generates the proper slipfrequency.One source of the torque ripple is the detection of the angleδ, which is implemented with a simplepeak detector at this stage. The other source is the nonlinearity of the inverter, which causes theinjected high frequency voltage signal to not possess exactly the desired reference amplitude andangle. The third ripple source could be the motor itself.
0 1 2 3 4 5 6
−20
−10
0
10
20
t (s)
T (
Nm
)
Testimated
Treference
0 1 2 3 4 5 6−50
0
50
100
t (s)
δ (d
eg
)
0 1 2 3 4 5 60.08
0.1
0.12
0.14
0.16
t (s)
Y (
A/V
)
0 1 2 3 4 5 6−10
−5
0
5
10
15
t (s)
ωsl (
rad
/s)
Fig. 9 Closed loop control – Reference torque ischanged from 0 Nm to 10 Nm and then to–10 Nm
Fig. 10 Closed loop control – step response ofslip frequency
Fig. 11 shows the phase current response for a step change of torque from 0 Nm to 10 Nm. The qualityof this current waveform is satisfactory. It should be mentioned again that parameters for the torquecontroller were experimentally determined and the result presented is in the range of the best resultsobtained with different parameter settings.
Fig. 12 shows typical high frequency waveforms of the phase current for described experiment. A highfrequency carrier at 610 Hz can be seen, which has an amplitude modulation of 100 Hz .
Fig. 11 Closed loop control – phase current(vertical: 5A/div)
Fig. 12 Phase current - 610 Hz high frequencywith 100 Hz amplitude modulation(vertical: 5A/div)
3. Saliency Detection ProblemIn the previous section an attempt to close the torque control loop was presented. This section willconsider an example of a different 3HP motor (GENERAL ELECTRIC, MODEL 5K182BC218A,230/460 V, 9/4.5 A, 60 Hz, 1755 rpm) with the same rated power, but from different manufacturer. It

EPE-PEMC 2002 Dubrovnik & Cavtat P. 7
is shown that implementation feasibility for such a control greatly depends on the design of the appliedmotor.
0.005
0.01
0.015
0.02
0.025
30
210
60
240
90
270
120
300
150
330
180 0
y
Fig. 13 Admittance saliency for 3HP GE motor
Fig. 13 was recorded for the case of a locked rotor and a torque of +5 Nm and shows the admittancesaliency. This result can be directly compared to the result in Fig. 3. It can be seen from Fig. 13 that incontrast to Fig. 3 this particular motor practically shows no admittance change influenced bysaturation. Therefore it can be concluded that the proposed method cannot provide useful results in thiscase. In order to understand this contradictory phenomenon additional research would be required.
4. Finite Element AnalysisExperimental results demonstrated that the position of the minimum inductance obtained from the highfrequency component of the armature current does not match well the position of the rotor flux.Moreover, it became apparent that the position of the minimum inductance is a nonlinear function ofthe torque, so it is almost impossible to predict where the rotor flux will be located only by using theinformation obtained from the high frequency signal. The finite element method has been used in anattempt to explain this phenomenon.
In order to evaluate these influences a special approach to the FE simulation was taken which allowsone to eliminate the influences of fundamental component stator and rotor currents and still obtain theinformation about the position of the minimum inductance using the envelope of the HF signal. Thebasic principle is to carry out the simulation for the selected operating point and then “freeze” thedistribution of permeances in the nodes of the finite element mesh. These permeances are then usedagain in a new simulation where only high frequency current is present without the fundamentalcomponent. In this way the fundamental component of the flux is eliminated. The HF signal will nowscan the machine giving information about the admittance distribution embedded in the nodal valuesof permeances. To simulate the influence of the squirrel cage, the currents that would normally beinduced in the rotor bars due to the HF rotating and pulsating field are replaced by the potential barriergenerated by defining Dirichlet’s boundary conditions on the outline of each bar, thus turning theirsurfaces into equipotential lines. The field generated by the armature currents cannot penetrate therotor bars because they are now acting as perfect conductors, but without any actual currents flowingthrough them. Since the fundamental component has been eliminated from the simulation, the voltagesources for all three phases contain only high frequency components that define the voltage vectorwhich rotates with the scanning frequency of 50 Hz and pulsates with the frequency of 500 Hz. Thevoltage equations are
( ) ( ) ( )ttVtv schfhfas ωω cossin= (2)
( ) ( ) )3
2cos(sin
πωω −= ttVtv schfhfbs (3)

EPE-PEMC 2002 Dubrovnik & Cavtat P. 8
( ) ( ) )3
4cos(sin
πωω −= ttVtv schfhfcs (4)
where50=scf Hz
500=hff Hz
40=hfV V
The time step used in the transient simulations is T=10-4 s. The flux lines of the field simulated in thismanner for rated torque (TR=121 Nm) at zero speed are shown in Fig. 14. The “frozen” permeancesused in this simulation were taken from the results of the initial simulation carried out for rated torqueat zero speed using only fundamental components of voltages and currents. The results of this initialsimulation are shown in Fig. 15. The positions of the armature voltage vectorVabcs, armature currentvectorIabcsand the air gap fluxλg are also shown in Fig. 15. Armature current waveforms consisting ofhigh frequency components at 500 Hz with an amplitude modulation of 100 Hz are shown in Fig. 16.
abcsV
abcsI
gλA-
A-
A- B+
B+
B+
B+B+
B+ C-C-C-
C-C-C-A+A+A+
Fig. 14 Flux lines with frozen permeances androtor bars acting as a potential barrier
Fig. 15 Flux lines for rated torque (Vs= 8.725 V -phase rms,ω r= 0, TR= 121 Nm,fe= 0.9823 Hz)
0 0.05 0.1 0.15 0.2 0.25 0.3-5
0
5
10
i A[A
]
0 0.05 0.1 0.15 0.2 0.25 0.3-4
-2
0
2
4
i B[A
]
0 0.05 0.1 0.15 0.2 0.25 0.3-4
-2
0
2
4
i C[A
]
t [s]
Fig. 16 Simulated armature current waveforms

EPE-PEMC 2002 Dubrovnik & Cavtat P. 9
Since there is no fundamental component in the simulation, only demodulation without filtering can beperformed on the simulated armature current waveform. Hence, the ellipse that shows the admittancesaliency will be phase shifted by additional 17.10. The shape and the position of the ellipse are shownin Figs 17 and 18. The initial 100 ms represents the transient period that exists because the voltagesdefined by equations (2), (3) and (4) were suddenly applied to the phase windings, so there exists atime period until the armature current reaches steady state. This period should be neglected.
Results of the simulation show that the position of the ellipse is at the angle of 18.60 (Fig. 18) which,after subtracting the phase shift of 17.10 due to demodulation of the numerically calculated HF current,gives one an angle of 1.50. This angle matches the position of the minimum inductance (maximumadmittance) shown in Fig. 19. The values of inductance in Fig. 19 were calculated for differentpositions of the flux vector. The position of the flux vector was varied fromϕ = -900 to ϕ = 900 tocover one pole pitch. The angleϕ = 00 marks the position of theq axis which is also the initial positionof the voltage vector as shown in Fig. 15.
1
2
3
30
210
60
240
90
270
120
300
150
330
180 0
0 0.05 0.1 0.15 0.2 0.25 0.30
10
20
30
40
50
60
70
γ[d
eg]
t [s]
Fig. 17 Simulated envelope of the HF current Fig. 18 Position of the envelope relative to thearmature voltage
In order to calculate the inductance the first step is to obtain the finite element solution for the selectedoperating point. The next step is to freeze the permeances and to describe the Dirichlet’s boundaryconditions on the surfaces of the rotor bars. The angleϕ selected between –900 and +900 is markingthe position of the current vector. That position, i.e. the angleϕ is actually the phase shift of thecurrents in phases A, B and C relative to theq axis. Instantaneous values of phase currents are thengiven by
( )ϕcosma Ii = (5)
( )0120cos −= ϕmb Ii (6)
( )0240cos −= ϕmc Ii (7)
Maximum currentIm can be selected arbitrarily because after freezing the permeances the finiteelement model becomes linear. The calculated currentsia, ib and ic are now data input formagnetostatic simulation. If these currents are used to form a fixed vectorabci , the result is a complex
number whose absolute value equalsIm and the phase shift isϕ.
( ) 3
22 ,
3
2 π
ϕj
mcbaabc eaIiaaiii =∠=++= (8)
During post-processing the flux linkagesλa, λb andλc are calculated. These flux linkages are used toform the fixed flux vector abcλ which has the absolute valueλm and the phase shiftϕλ. The angleϕλ is
different fromϕ because of the non-uniform distribution of permeances. The flux vector is then

EPE-PEMC 2002 Dubrovnik & Cavtat P. 10
( ) λϕλλλλλ ∠=++= mcbaabc aa 2
3
2(9)
The inductance for the calculated position of the flux is therefore
λϕλ ∠=m
m
IL (10)
The same procedure is repeated for different values of the angleϕ. Fig. 20 shows the values ofminimum inductance for different values of torque at zero speed. The shape of the curve that onewould obtain after inverting the values of the inductance shown in Fig. 20 is comparable to the shapeof the measured curve in Fig. 6 which shows the admittance as a function of torque. These resultsconfirm the assumption that the envelope of the HF component of the current actually shows theposition of the minimum inductance, but that position is not the same as the position of the flux.Fig. 21 shows the difference between the position of the ellipse and the position of the air gap flux.The angle of 00 in Fig. 21 marks the position of the voltage vector which is also the position of theqaxis. The experimental results shown in Fig. 5 are comparable with the ones shown in Fig. 21 eventhough the measurements and simulations were performed on different motors. In order to doquantitative comparison one must subtract the angle of 39.10 from the result in Fig. 5 because this isthe phase shift due to filtering of the original current signal and demodulation process of the filteredhigh frequency signal.
-100 -80 -60 -40 -20 0 20 40 60 80 1004
4.5
5
5.5
6
6.5
7
7.5
φ [deg]
L[m
H]
-150 -100 -50 0 50 100 1500
5
10
15
20
25
30
T [Nm]
L[m
H]
Fig. 19 Inductance distribution for one pole pitchat rated torque and zero speed
Fig. 20 Minimum inductance for different valuesof torque at zero speed
-150 -100 -50 0 50 100 150-80
-60
-40
-20
0
20
40
60
80
T [Nm]
[deg
]
φΨ
gγ=φ- Ψ
g
Fig. 21 Positions of the envelope (φ ) and air gap flux (ψg) relative to thearmature voltage(00) and relative to each other (γ )

EPE-PEMC 2002 Dubrovnik & Cavtat P. 11
ConclusionResearch results concerning sensorless control of an induction motor at zero speed have beenpresented. The method based on injection of high frequency voltage signal utilizing spatial admittanceimage tracking has led to useful results where it was possible to close the torque control loop withoutan encoder at zero speed. The method proved to be capable of controlling the torque, but the dynamicswere very poor and the control was not 100% reliable.
For application of this method a series of tests would probably be needed in order to tune the controllerfor the specific motor (or maybe only the motor type). There is a need for development of an automatictest procedure as a result. Until now all experiments have been done on a 3 HP induction motor withlocked rotor. Further research should be done on a motor test bed with torque transducer.
The results of the finite element analysis confirm that the envelope of the HF current is, in reality,showing the position of the minimum inductance. The problem is that the minimum inductance isnotat the point where the highest saturation in the motor is, i.e. where the air gap flux is positioned.Therefore the position of the minimum inductance is a nonlinear function of torque and this procedurecannotbe used directly to determine the position of the flux.
The only way to use this method for sensorless control in a closed control loop is to determine inadvance the position of the envelope relative to the flux so that an appropriate correction can be carriedout on-line. Such a position determination can be either measured or simulated. The main disadvantageof the simulation approach is the duration of the entire process and the necessity to know the detailedgeometry of the machine, which in most cases is not available.
AcknowledgmentsThe authors wish to thank the Allen-Bradley and Reliance divisions of Rockwell Automation for theirsupport during this study.
References[1] D. S. Zinger, T. A. Lipo, and D. W. Novotny,Using Induction Motor Stator Windings to Extract Speed
Information, Proc. IEEE-IAS Annu. Meeting, San Diego, CA, Oct. 1989, pp. 213–218
[2] R. M. Cuzner, R. D. Lorenz, and D. W. Novotny,Application of Nonlinear Observers for Rotor PositionDetection on an Induction Motor Using Machine Voltages and Currents, Proc. IEEE-IAS Annu. Meeting,Oct. 1990, pp. 416–421
[3] A. Ferrah, K. G. Bradley, and G. M. Asher,Sensorless Speed Detection of Inverter Fed Induction MotorsUsing Rotor Slot Harmonics and Fast Fourier Transform, Proc. PESC’92, 1992, pp. 280–286
[4] K. J. Binns, D. W. Shimmin, and K. M. Al-Aubidy,Implicit Rotor Position Sensing Using Motor Windingsfor a Self-Commutating Permanent Magnet Drive System, Proc. Inst. Elect. Eng., vol. 138, Jan. 1991., pt. B,No. 1, pp. 28–34
[5] Alfio Consoli, Giuseppe Scarcella, Antonio Testa, A New Zero-Frequency Flux-Position DetectionApproach for Direct-Field-Oriented-Control Drives,IEEE Trans. Ind. Applicat., Vol. 36, May/June 2000,No. 3, pp. 797-804
[6] Fernando Briz, Alberto Diez, Michael W. Degner, Dynamic Operation of Carrier-Signal-Injection-BasedSensorless Direct Field-Oriented AC Drives,IEEE Trans. Ind. Applicat., Vol. 36, Sep./Oct. 2000, No. 5,pp. 1360-1368
[7] Michael W. Degner, Robert D. Lorenz,Using Multiple Saliencies for the Estimation of Flux, Position, andVelocity in AC Machines, IEEE Trans. Ind. Applicat., Vol. 34, Sep./Oct. 1998, No. 5, pp. 1097-1104
[8] Jung-Ik Ha, Seung-Ki Sul, Kozo Ide, Ikuma Murokita, Kohjiro Sawamura,Physical Understanding of HighFrequency Injection Method to Sensorless Drives of an Induction Machine, Proceedings of IEEE IndustryApplications Society, Annual Meeting, Rome, Italy, October 8 – 12, 2000
[9] Jung-Ik Ha, Seung-Ki Sul,Sensorless Field-Orientation Control of an Induction Machine by High-Frequency Signal Injection, IEEE Trans. Ind. Applicat., Vol. 35, Jan./Feb. 1999, No. 1, pp. 45-51