A Study of Plant Species and Soils in Different Vegetation ...
169
A STUDY OF PLANT SPECIES AND SOILS IN DIFFERENT VEGETATION ZONES IN AN INDONESIAN MOIST FOREST A DISSERTATION SUBMITTED TO THE GRADUATE DIVISION OF THE UNIVERSITY OF HAWAII IN PARTIAL FULFILLMENT OF THE REQUIREMENTS FOR THE DEGREE OF DOCTOR OF PHILOSOPHY IN AGRON01:1Y A.'ID SOIL SCIENCE DECEMBER 1977 By Richard Pellek Dissertation Corrnnittee: Yusuf N. Tamimi, Chairman Haruyoshi Ikawa Charles H. Lamoureux Peter P. Rotar James A. Silva
Transcript of A Study of Plant Species and Soils in Different Vegetation ...

A STUDY OF PLANT SPECIES AND SOILS IN DIFFERENT VEGETATION ZONES IN
AN INDONESIAN MOIST FOREST
A DISSERTATION SUBMITTED TO THE GRADUATE DIVISION OF THE UNIVERSITY OF HAWAII IN PARTIAL FULFILLMENT
OF THE REQUIREMENTS FOR THE DEGREE OF
DOCTOR OF PHILOSOPHY
IN
AGRON011Y AID SOIL SCIENCE
DECEMBER 1977
By
Richard Pellek
Dissertation Corrnnittee
Yusuf N Tamimi Chairman Haruyoshi Ikawa
Charles H Lamoureux Peter P Rotar James A Silva
We certify that we have read this dissertation and that in our
opinion it is satisfactory in scope and quality as a dissertation for
the degree of Doctor of Philosophy in Agronomy and Soil Science
DISSERTATION COMMITTEE
iii
r I
I Imiddot I
ABSTRACT
The vegetation and soils of selected vegetation zones in peninshy
sular Ujung Kulon a tropical lowland moist forest in Indonesia were
investigated Eight 25 x SO m sites exhibiting distinctive forest
associations andor soils were chosen for study
Vegetation sites were sampled for tree height diameter at
breast height (dbh) tree and sapling count and basal area Species
identification of trees on the sites was made
Soil morphological properties were described Samples from each
site were analyzed chemically for cation exchange capacity (CEC) pH
exchangeable cations (Na Ca Mg Kand Mn) P Si N organic C and
carbonates Physical properties investigated included bulk and parshy
ticle density particle size distribution and volumetric water content
on an oven-dry basis
Primary and clay minerals were identified from X-ray diffraction
traces and total oxides analysis
Vegetation results depict a heterogeneous forest of wide species
diversity suggesting many unique associations which form a large
mosaic Some associations appear to be perpetuated as a result of
edaphic factors
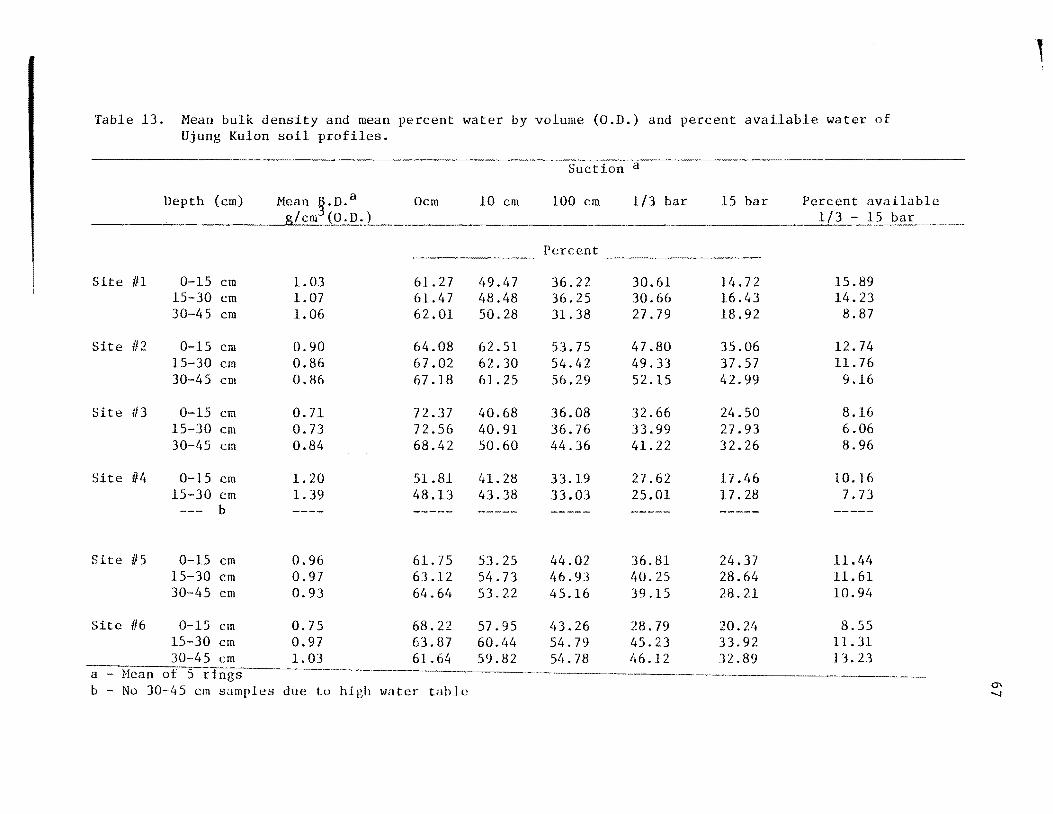
It is thought that excessive drainage on site 1 on level ground
along the south coast combined with a porous shallow soil leads to
draughtiness which in turn results in open forest in which few tree
stems are present
Site 2 along a minor drainage in central Ujung Kulon is low in
volume of stems and in species diversity partially as a result of
repeated stream erosion which favors the establishment of the pioneer
iv
bamboo Schizostachyum blumei over other forest species
Sites 3 and 5 are examples of lowland moderately sloping well
drained fully stocked forest stands that do not show evidence of
either excessive draughtiness of soils or of waterlogging The sites
are somewhat comparable in regard to frequency of trees and saplings
and average dbh but differ in basal area and average height Site 3
trees have on the average 7m2ha greater total basal area and 6 m
greater height than site 5 trees These sites are floristically
different except for the common occurrence of Arenga obtisifolia the
most common tree found in lowland niches not affected by brackish
water Arenga is absent above approximately 50 m elevation
Sites 4 and 8 are influenced by a seasonal water table which
restricts species composition to plants able to withstand prolonged
waterlogging The species differences between these sites may also
be affected by soil pH Site 8 is typical of the Corypha utan -
Ardisia humilis association which is the largest in Ujung Kulon
Sites 6 and 7 are found in steep mountainous terrain They
exhibit the greatest frequency of stems and total basal area
Establishment and eventual perpetuation of Arenga dominance may
have been faciliated by the partial destruction of the overstory by
tidal wave action following the eruptions of the volcano Krakatau in
1883
Soil chemical and physical properties of the 1883 tuff attest to
a nutrient-poor material with low ion exchange capacity and soil
structure properties that probably impeded normal water infiltration
and root proliferation for some decades following deposition
Numerous chemical nutrient determinations of the soils
V
supplemented by leaf tissue analysis failed to establish definite
relationships between nutrient status and apparent site productivity
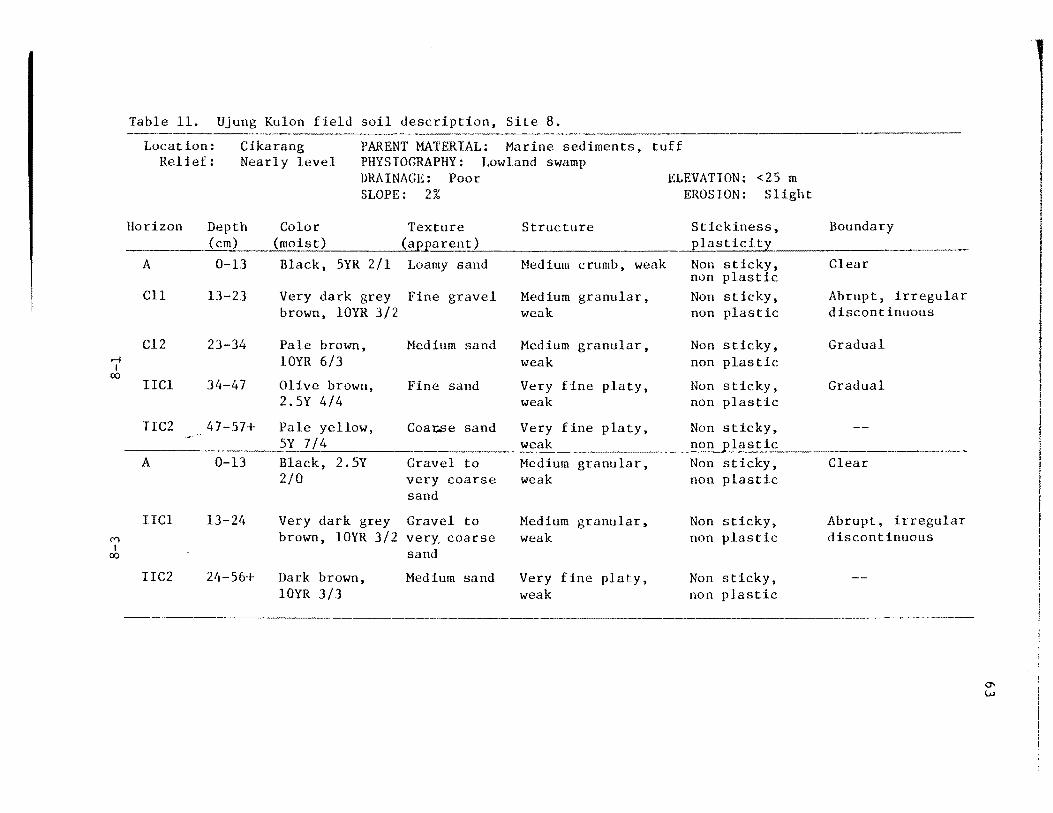
Newly mineralized soil horizons overlying the tuff show evidence
of a rapid rate of soil development The overlying horizons closely
resemble the residual subsoils in most chemical and physical propershy
ties conversely they only weakly resemble the tuff layer
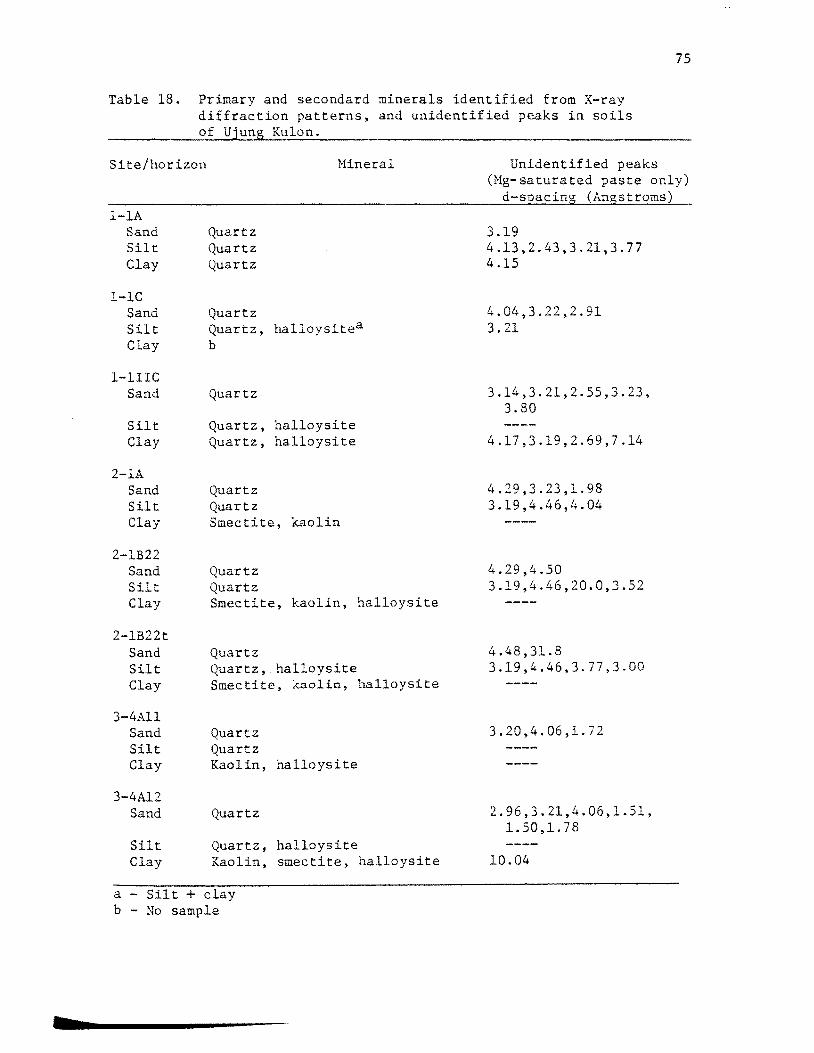
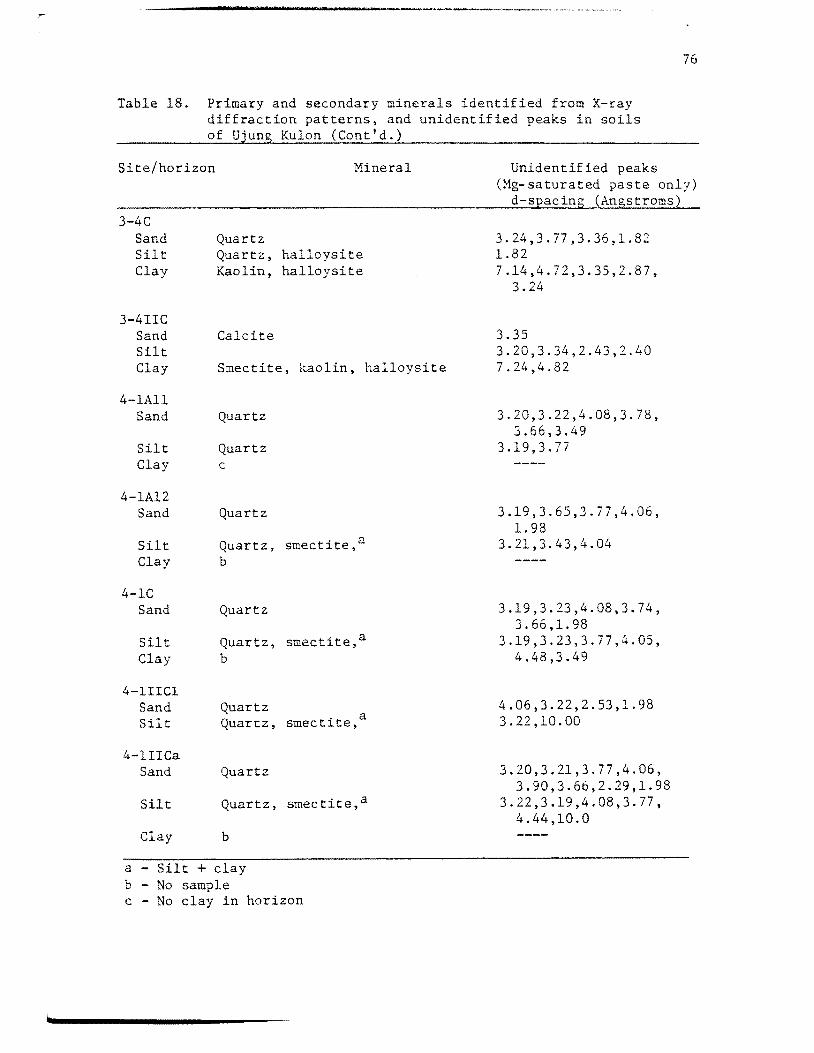
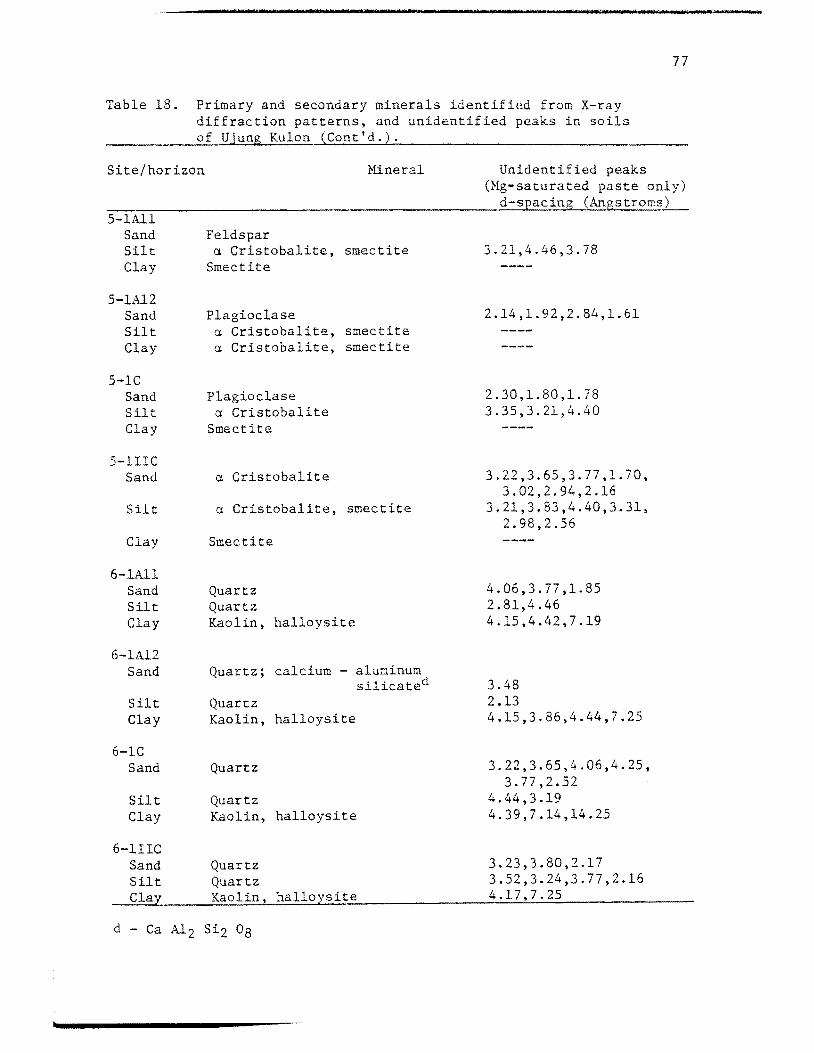
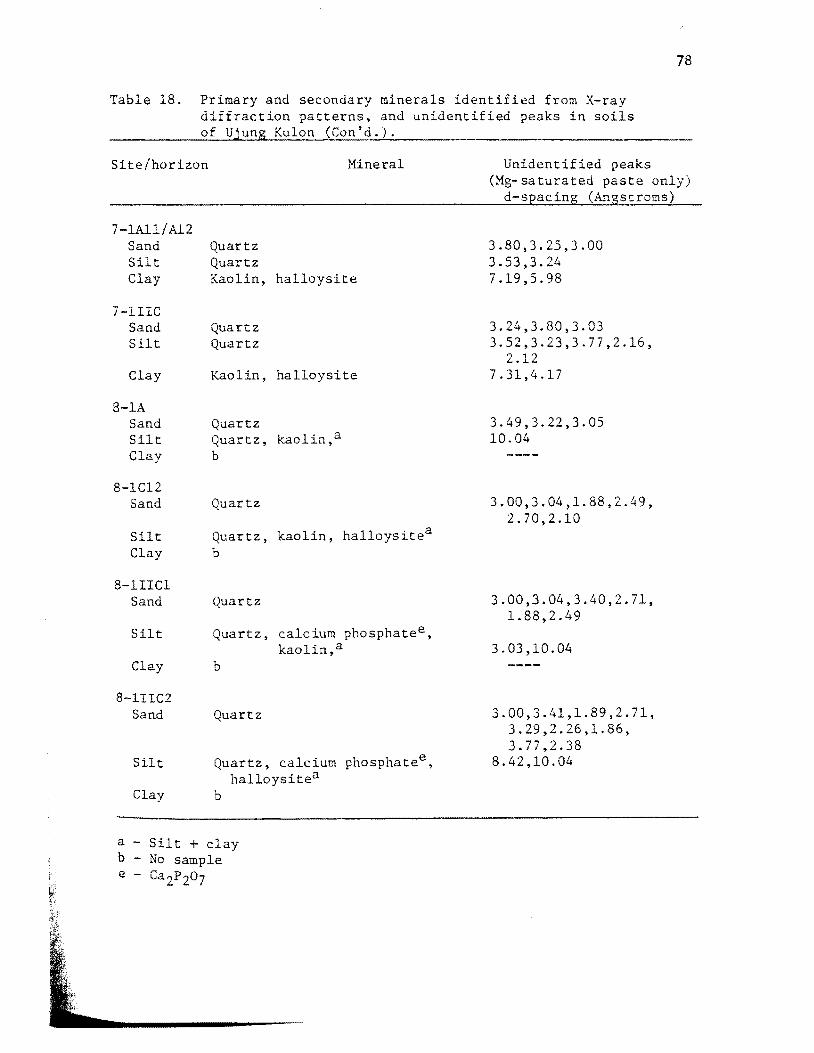
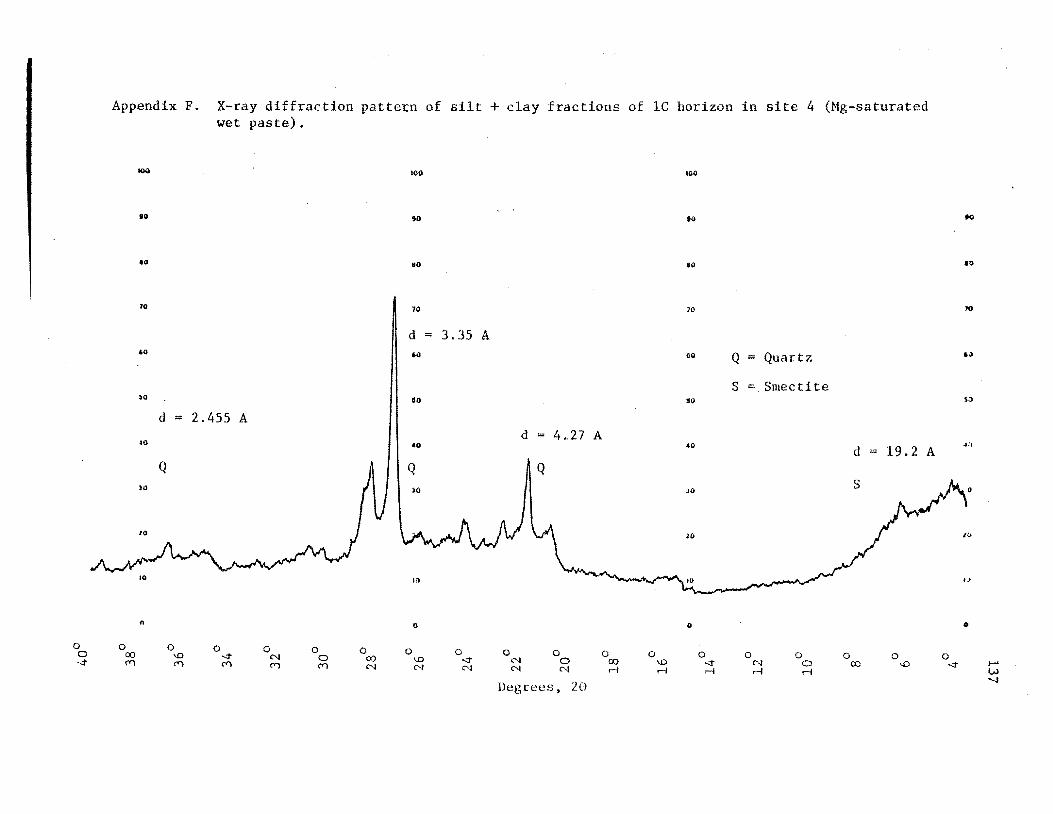
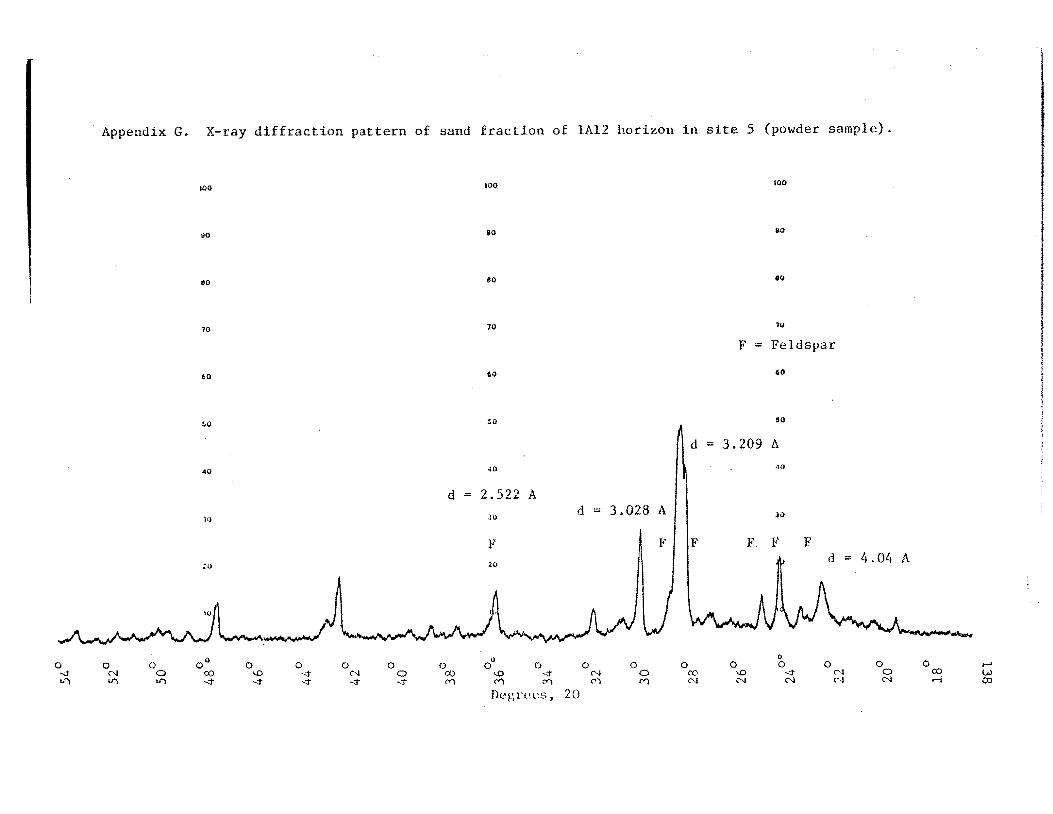
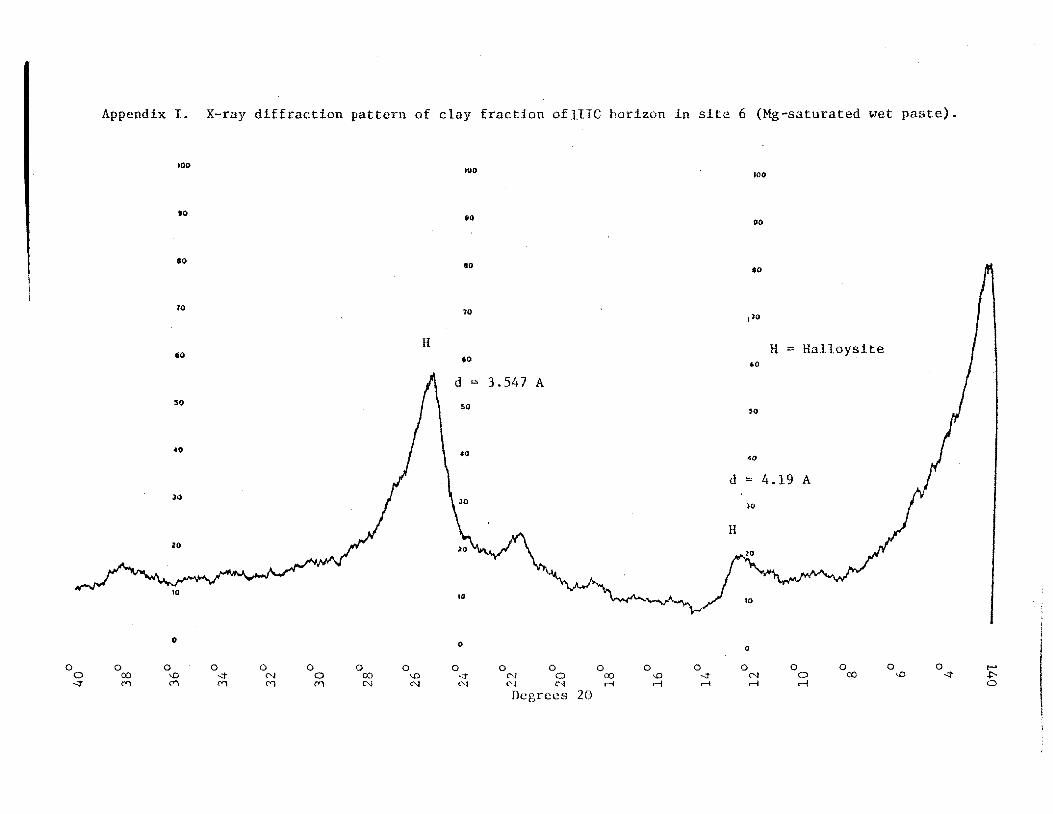
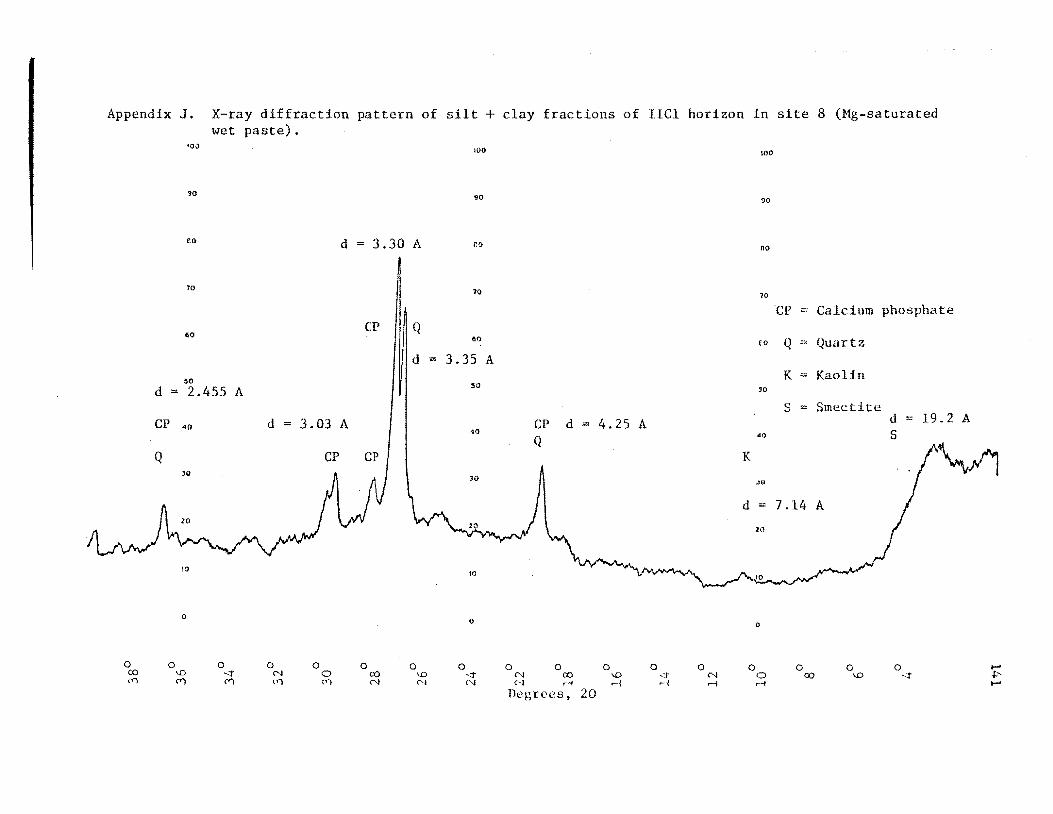
Primary minerals are dominated by quartz in most cases crisshy
tobalite calcite pyrophosphate feldspars and silicates are also
found Clay minerals are smectite and kaolins
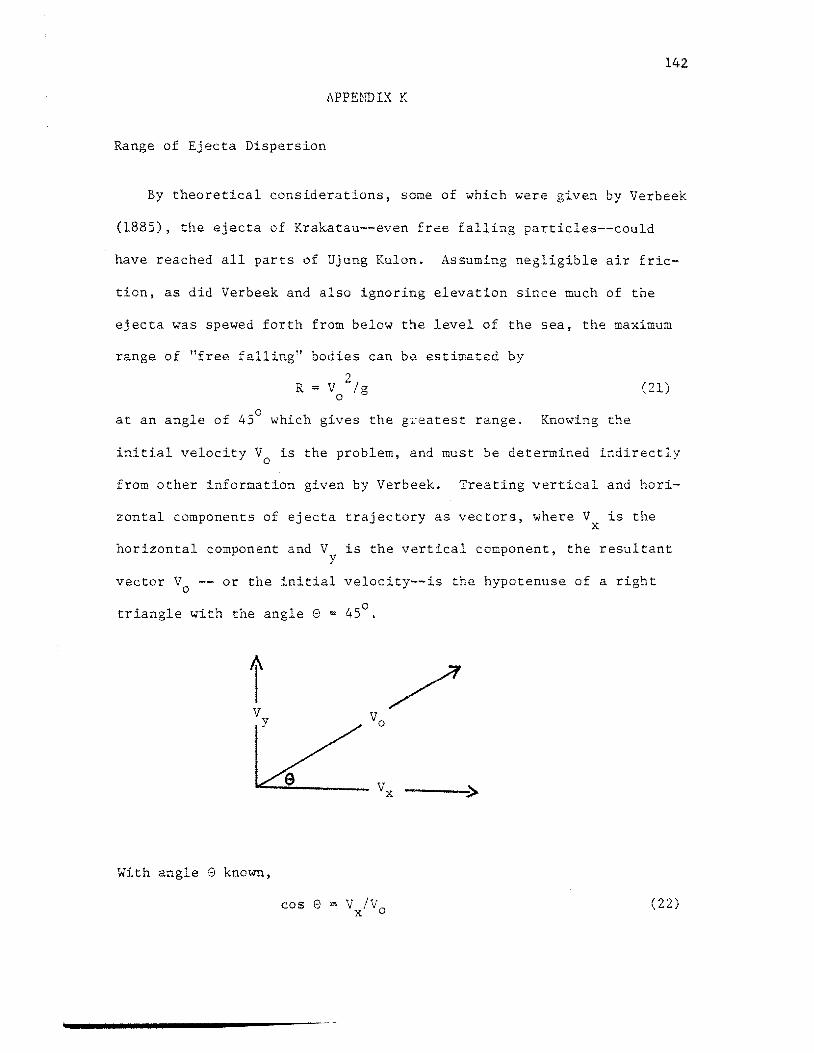
A reconsideration of the theoretical range of the Krakatau
ejecta is explained in an appendix
vi
TABLE OF CONTENTS
-middot
Page
LIST OF TABLES bull bull bull bull bull bull bull bull bull bull bull bull bull bull bull bull bull bull bull bull bull bull bull bull bull bull bull bull bull bull bull bull bull bull bull bull bull bull bull bull bull bull bull bull bull bull bull bull bull bull X
LIST OF FIGURES xii
INTRODUCTION bull bull bull bull bull bull bull bull bull bull bull bull bull bull bull bull bull bull bull bull bull bull bull bull bull bull bull bull bull bull bull bull bull bull bull bull bull bull bull bull bull bull bull bull bull bull bull bull bull bull 1
LITERATURE REVIEW bullbullbullbullbullbullbullbullbullbullbullbullbullbullbullbullbullbullbullbullbullbullbullbullbullbullbullbullbullbull bullbullbull bull bull bull bull bull bull bull bull bull bull bull bull bull bull 4
Physiography bull bull bull bull bull bull bull bull bull bull bull bull 4
Climate middot 7
Vegetation Disturbance History bull 10
Krakatau and its Aftermath 11
Scientific Research in Ujung Kulon 19
The Issue of Vegetation Classification 21
MATERIALS AiD METHODS bull bull bull bull bull bull bull bull bull bull bull bull bull bull bull bull bull bull bull bull bull bull bull bull bull bull bull bull bull bull bull bull bull bull bull bull bull bull bull bull bull bull 23
Phase I Field Observations and Data Collection 23
Determination of Sampling Sites bullbullbull 24
Size and Configuration of Sampling Sites bullbullbullbullbullbullbullbullbull 24
Vegetation Data Sites 26
Field Soil Data Sites 26
Phase II Laboratory Determinations bull 29
Plant Tissue Samples 29
Soil Preparation and Handling 29
Soil Physical Properties bull bull bull bull bull bull bull bull 30
a Particle density 30
b Particle size distribution bull 30
c Supplemental color coding by size fraction bull 31
vii
TABLE OF CONTENTS (continued)
Page
Soil Chemical Analyses bull bullbullbull ~ bullbullbullbullbullbullbullbullbullbullbull bull bullbullbullbullbullbullbull t t bullbullbullbullbullbullbullbullbullbullbullbull 31
a Cation exchange capacity 33
b Exchangeable bases bull 35
c Organic carbon 35
d Carbonate 36
e Total nitrogen bull 37
f Extractable phosphorus 37
g Water-soluble silicon bullbull 38
h Other chemical analyses 38
Mineralogical Analyses bullbull bull bullbull 39
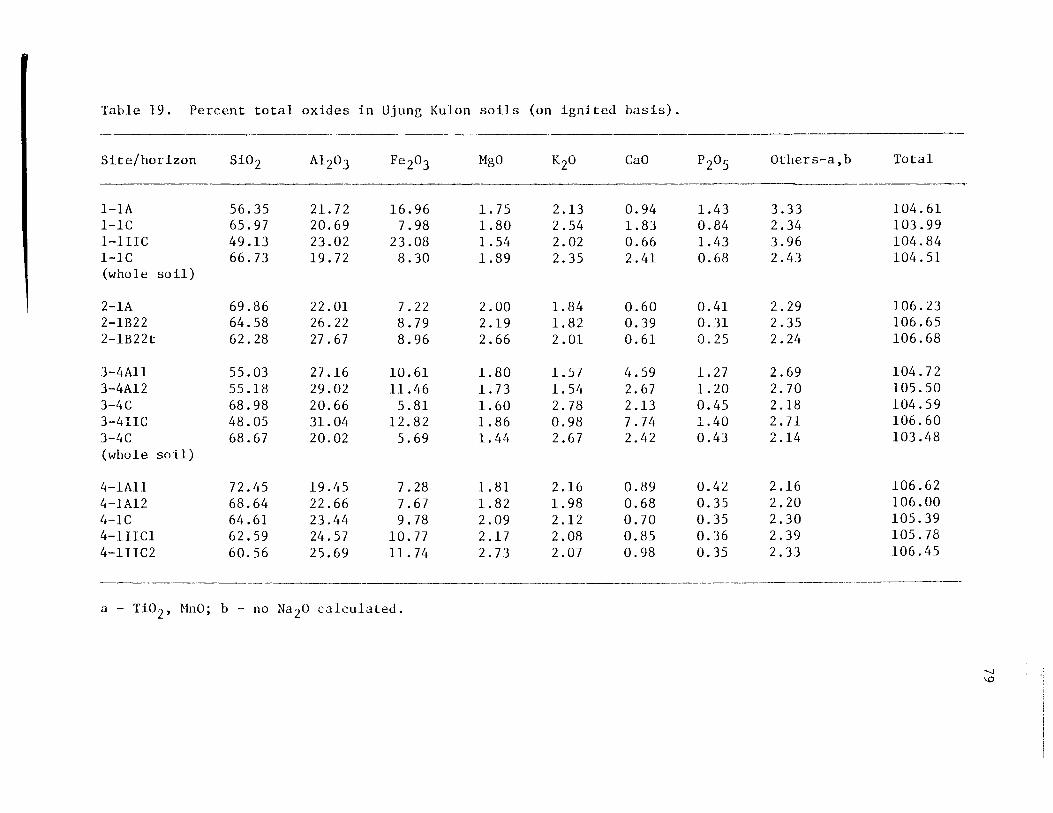
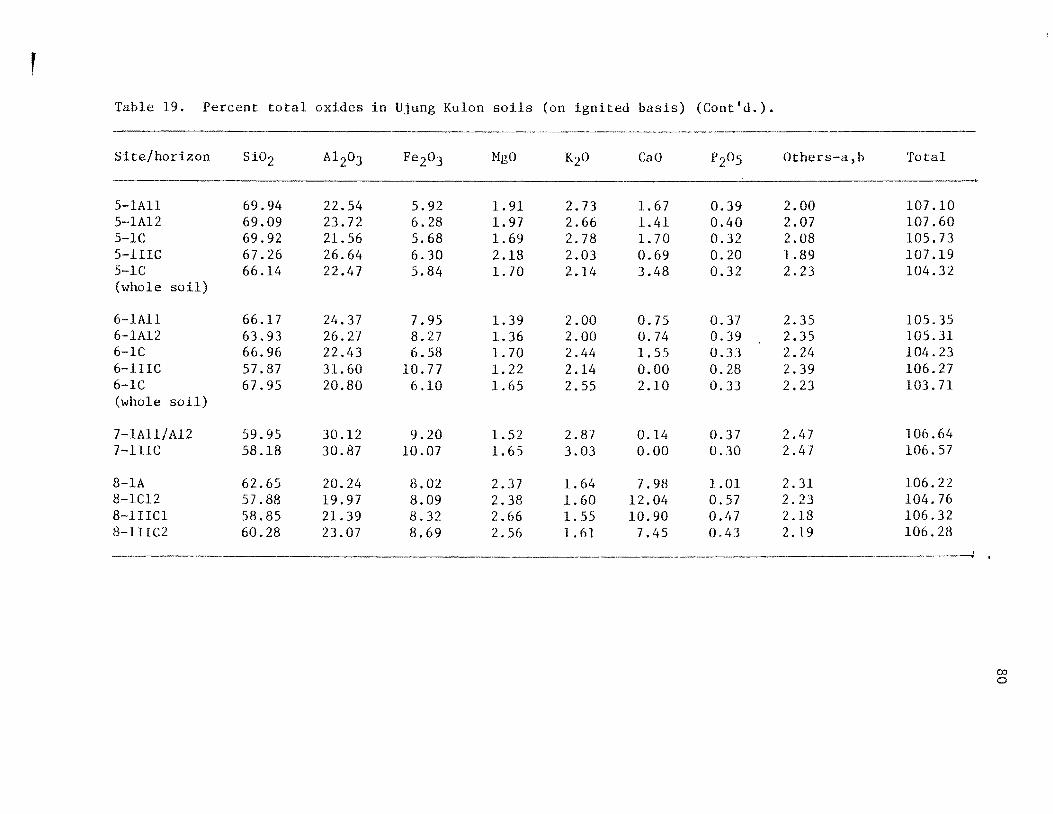
Total Oxide Analyses 40
RESULTS bullbullbullbullbullbullbullbullbullbull bullbullbullbullbullbull bullbullbullbullbullbullbull bullbull 42
Vegetation 42
Description of Vegetation Sites 42
Site 4 Cidaun 49
Site 1 Cibunar 49
Site 2 Cikendeng bull 50
Site 5 Cankeuteuk 51
Site 8 Cikarang 52
Site 3 G Telanca 53
Site 6 G Pajung 53
Site 7 Guhamasigit 54
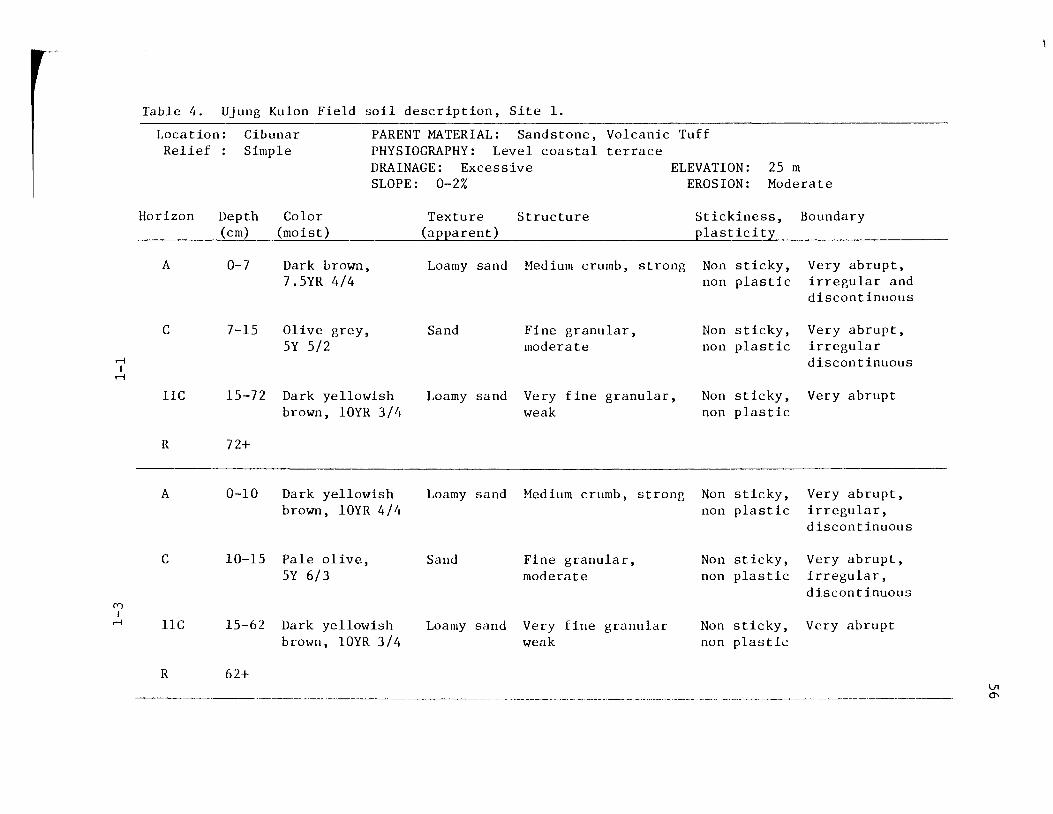
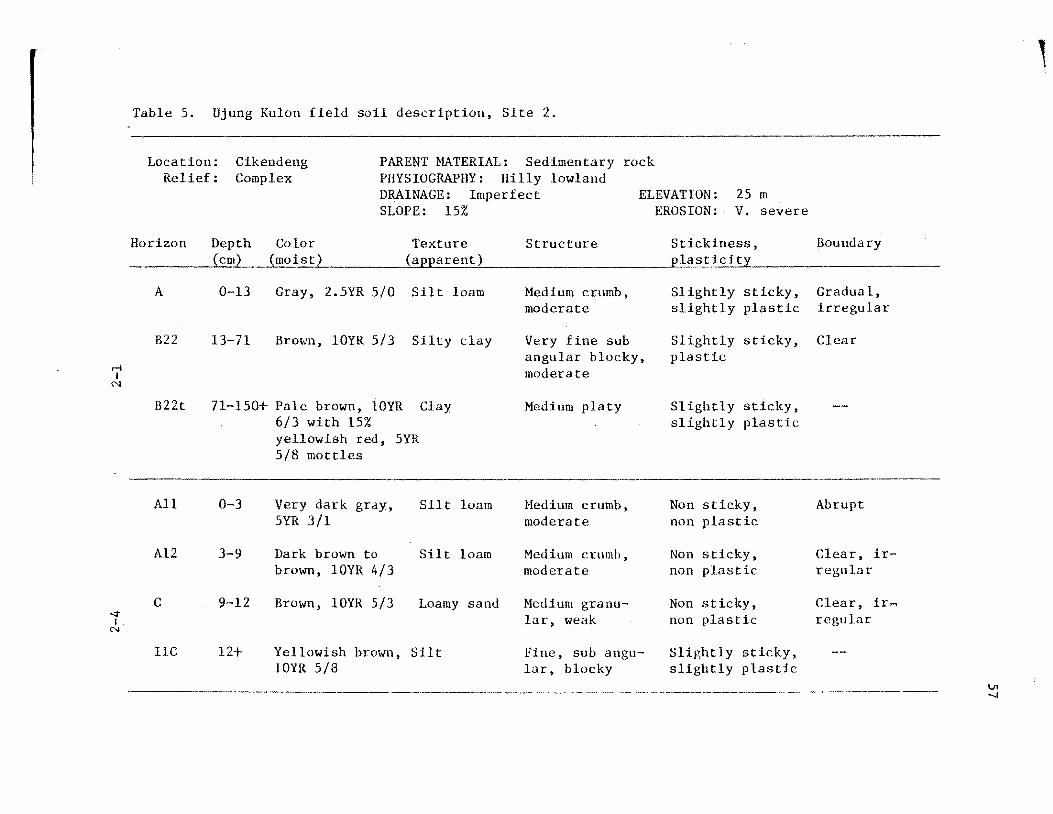
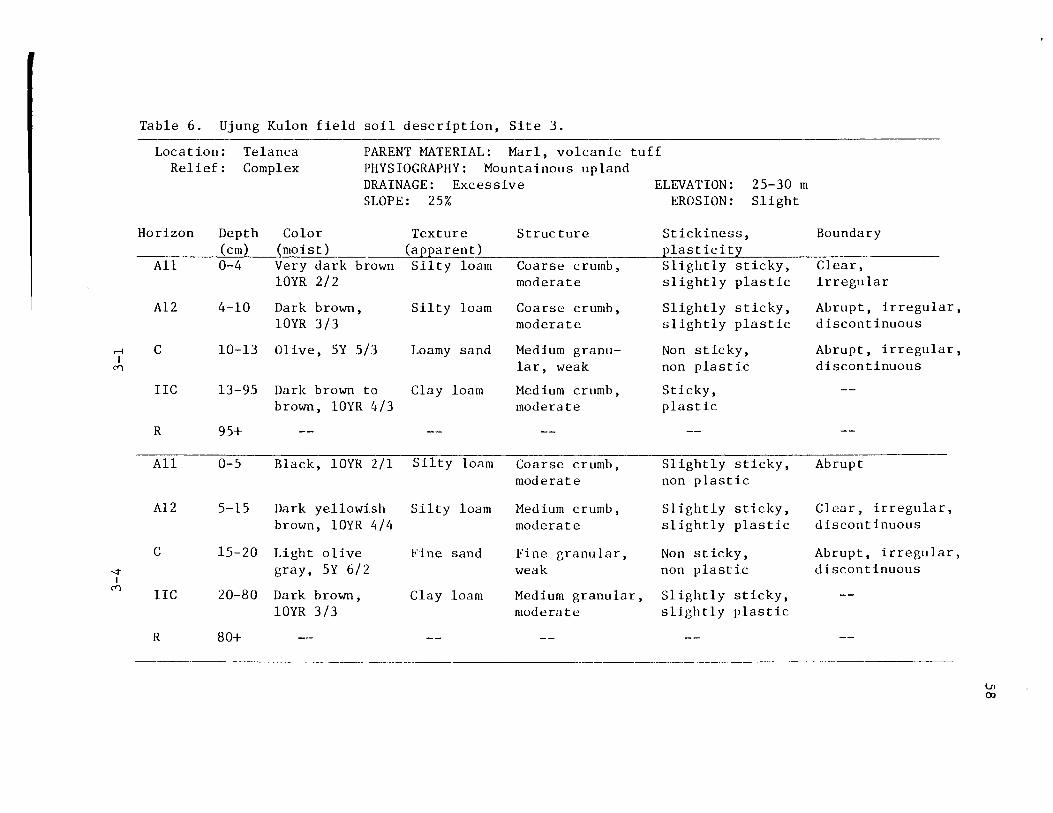
Soils 55
1 i
I
---viii
TABLE OF CONTENTS (continued)
Page
DISCUSSION bull bull 81
Density Stocking and Site Utilization 81
Preliminary Biomass Estimation 85
Interruption in Plant Succession bull 89
Physical Effects of the Tuff Layer 91
Chemical Properties of Soil 93
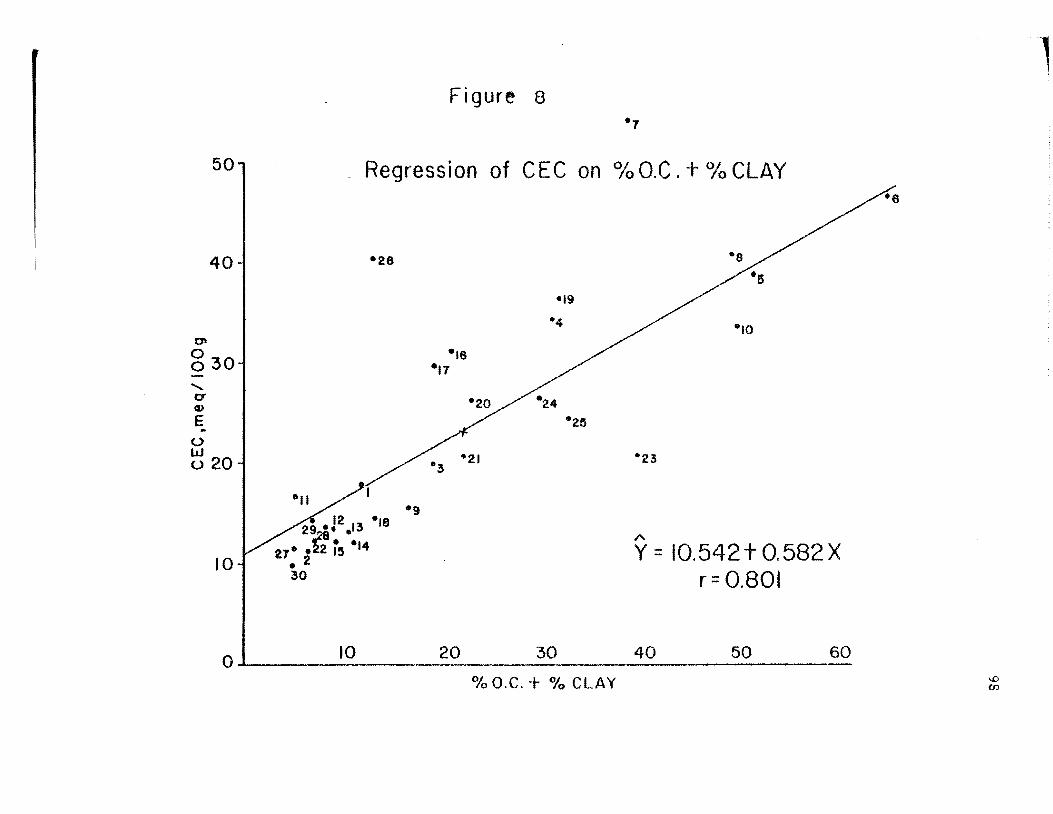
a Effective CEC 93
b Organic carbon bull 94
Mineralization and Soil Genesis Theories 97
The CN Ratio 101
Forms of Silicon in the Soil 103
Soil Genesis in Ujung Kulon bull 108
The Tuff Layer bull bull bull 111
Mineralogical Properties 122
SUMMARY AND CONCLUSIONS 126
Vegetation bullbullbullbullbullbullbullbullbullbullbullbull 126
Soils and Their Properties 127
APPEt-IDIX Abullbull 130
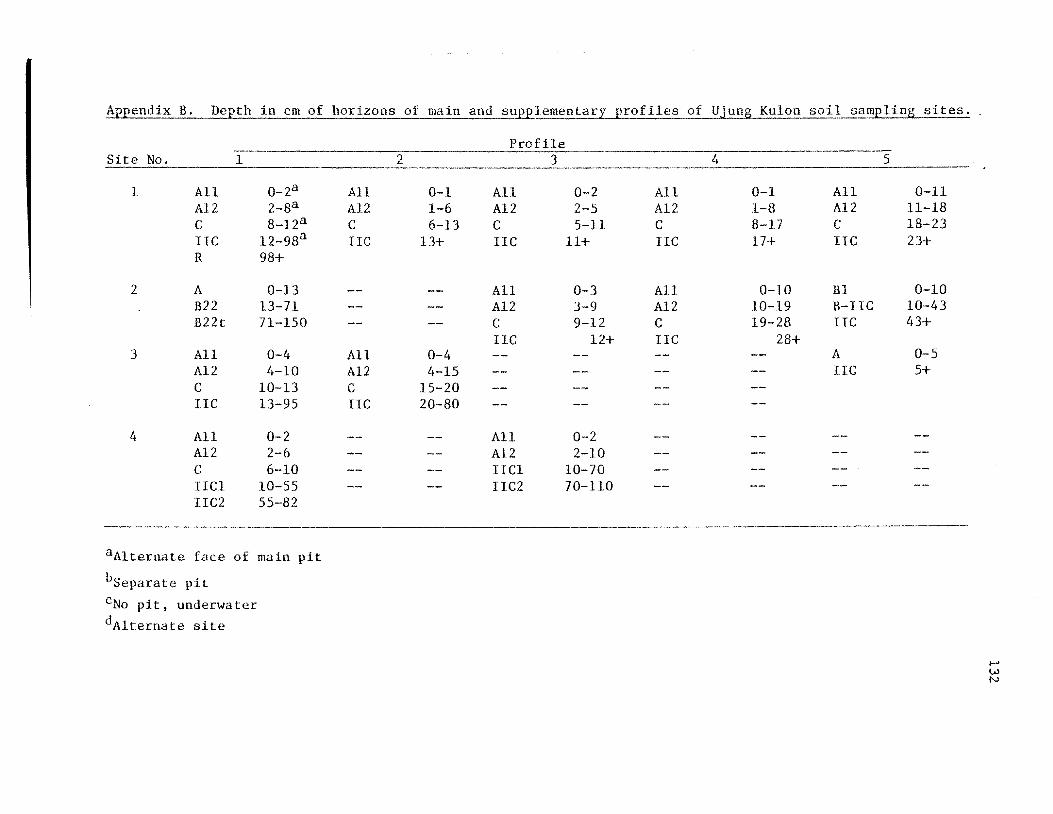
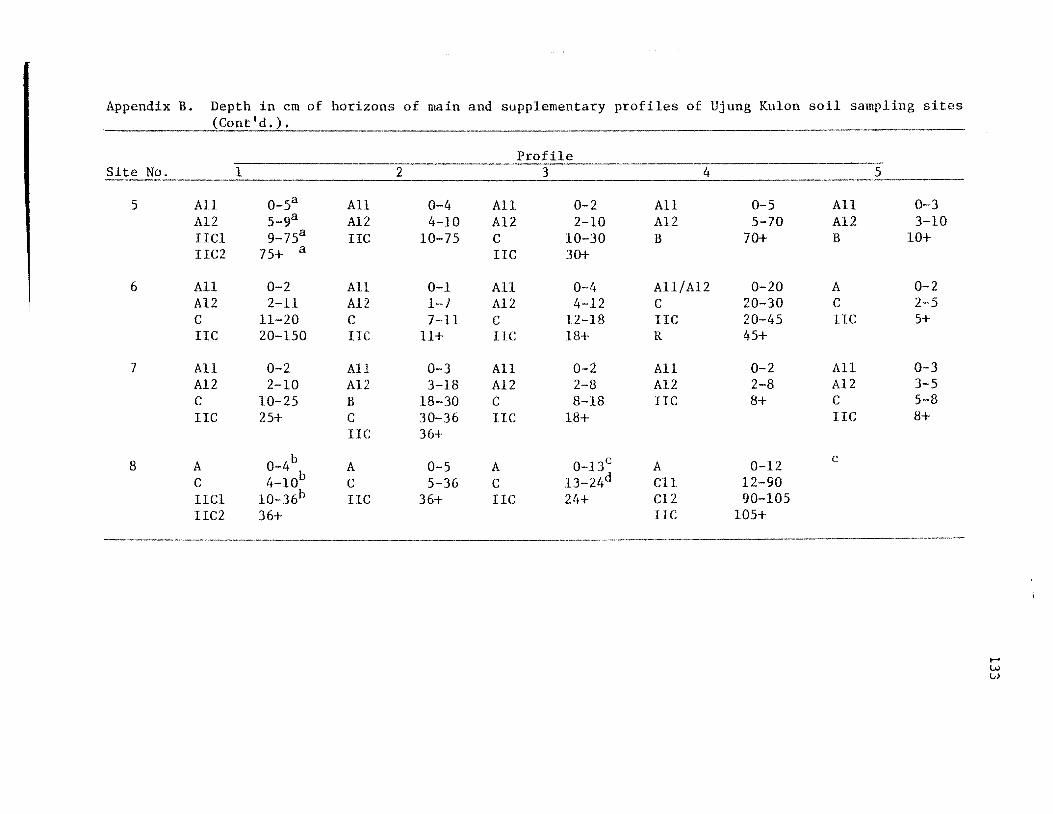
APPENDIX B 132
APPENDIX C bull bull 134
APPENDIX D bull 135
APPENDIX E bull 136
APPENDIX F bull bull 13 7
r ix
TABLE OF CONTENTS (continued)
Page
APPENDIX Gbullbullbull 138
APPENDIX Hbullbullbullbull 139
APPENDIX I 140
APPENDIX J 141
APPENDIX K 142
LITERATURE CITED bull bull bull bull bull bull bull bull bull bull bull bull bull bull bull bull bull bull bull bull bull bull bull bull bull bull bull bull bull bull bull bull bull 14 9
X
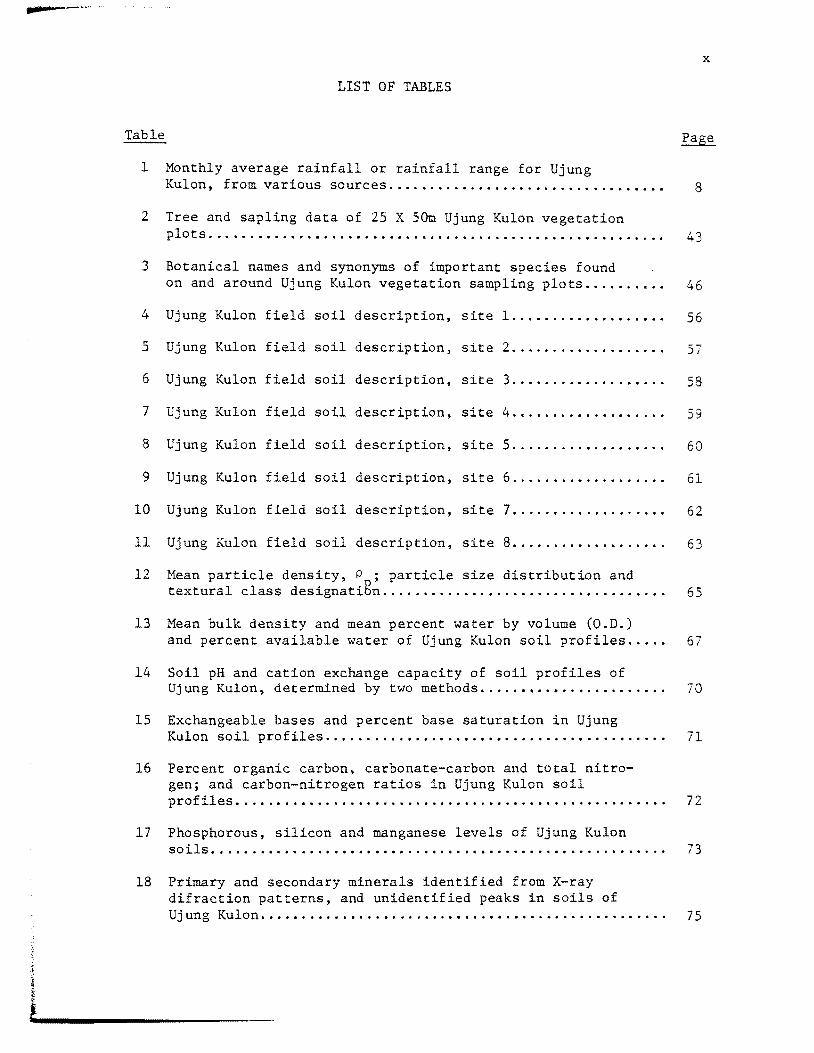
----middot-middot-LIST OF TABLES
Table
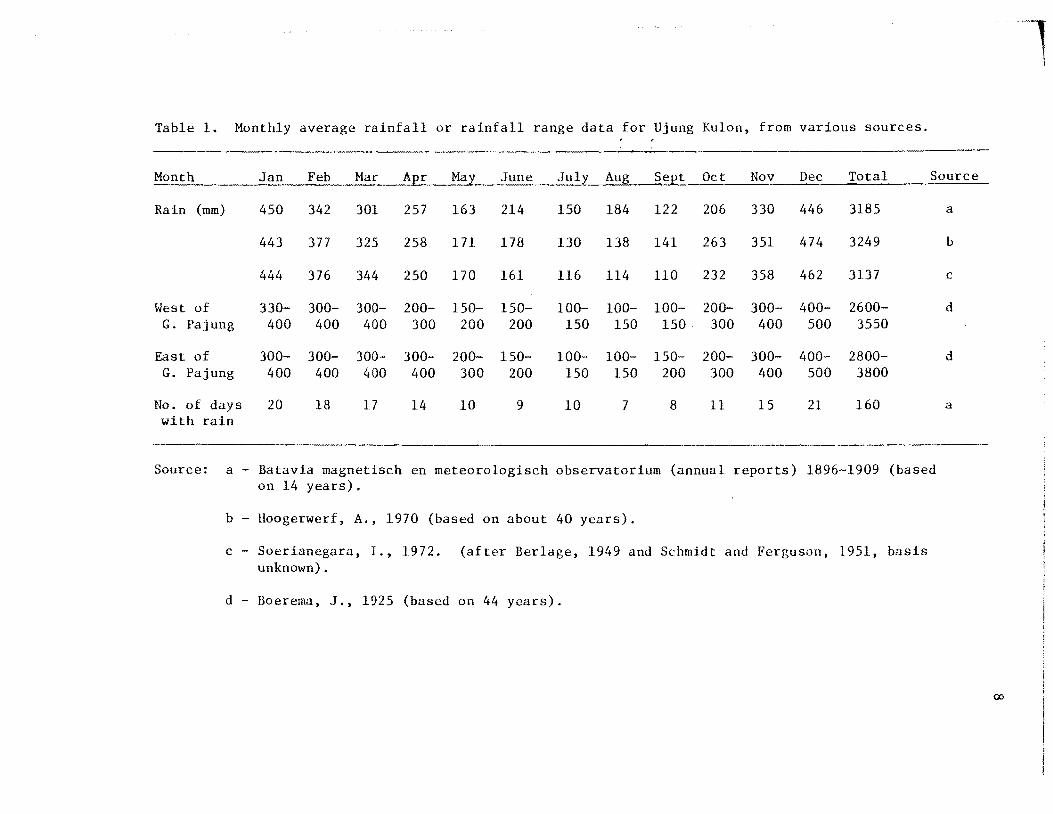
1 Monthly average rainfall or rainfall range for Ujung Kulon from various sources 8
2 Tree and sapling data of 25 X 50m Ujung Kulon vegetation plots 43
3 Botanical names and synonyms of important species found on and around Ujung Kulon vegetation sampling plots 46
4 Ujung Kulon field soil description site 1 56
57
bullbullbullbull 58
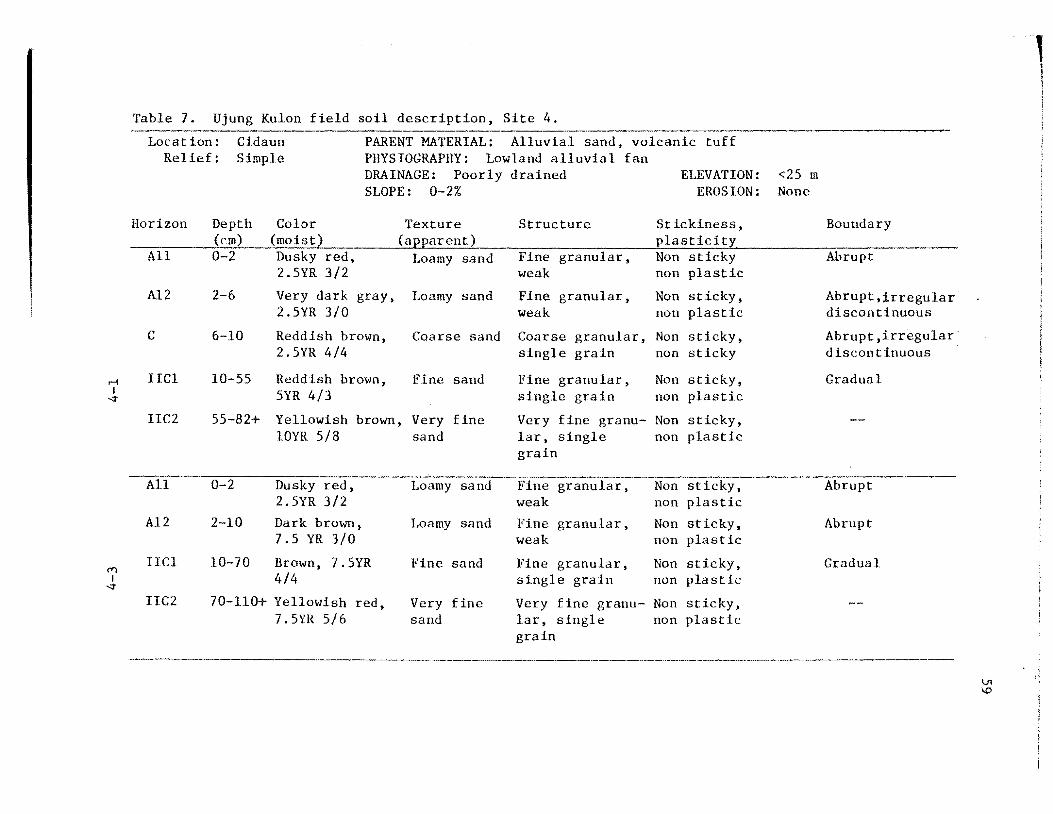
bull bull 59
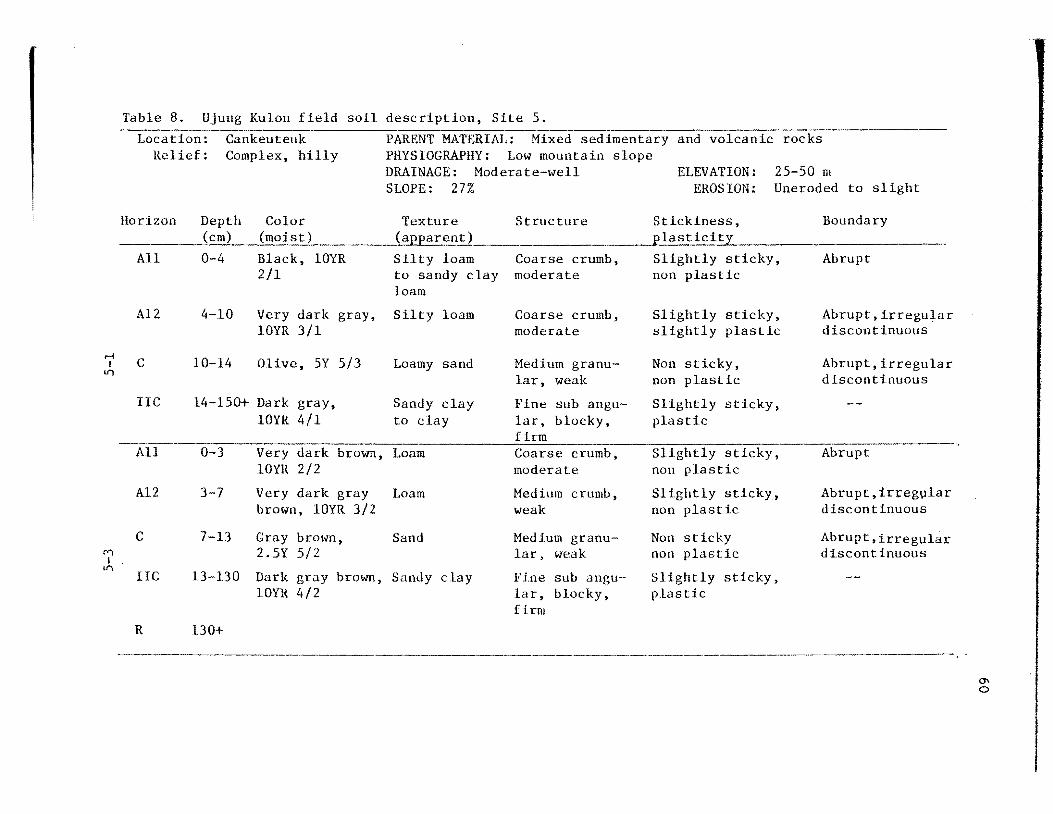
60
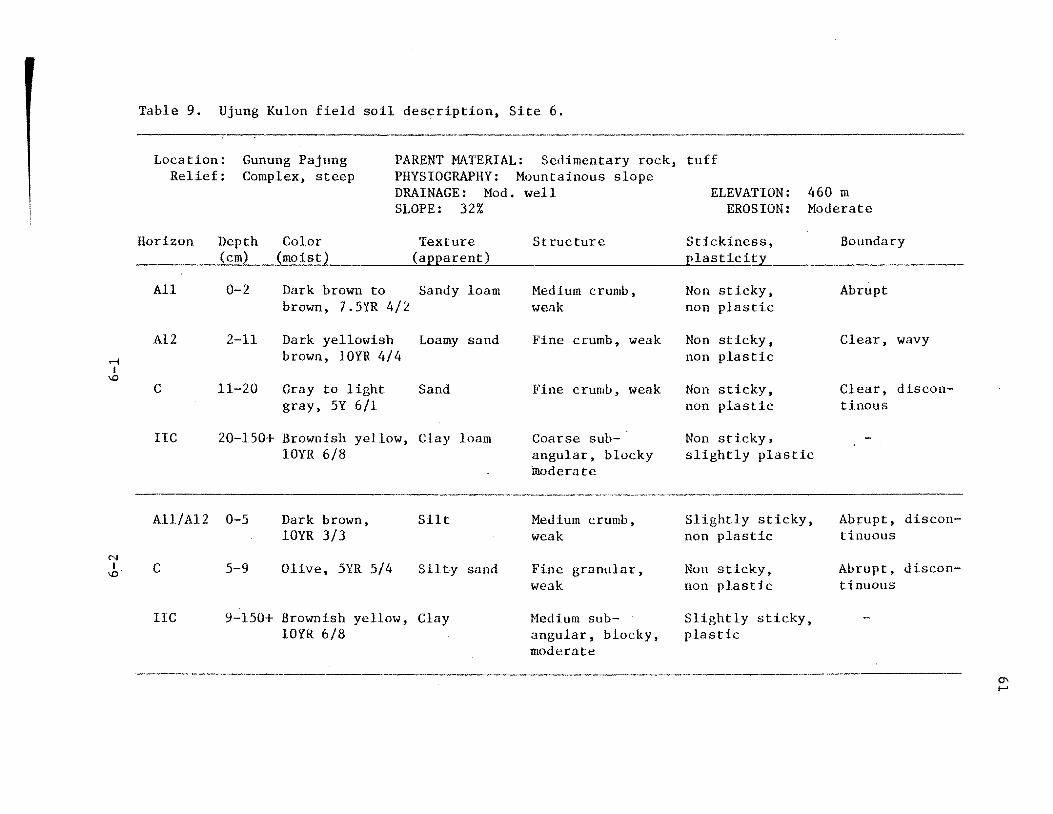
61
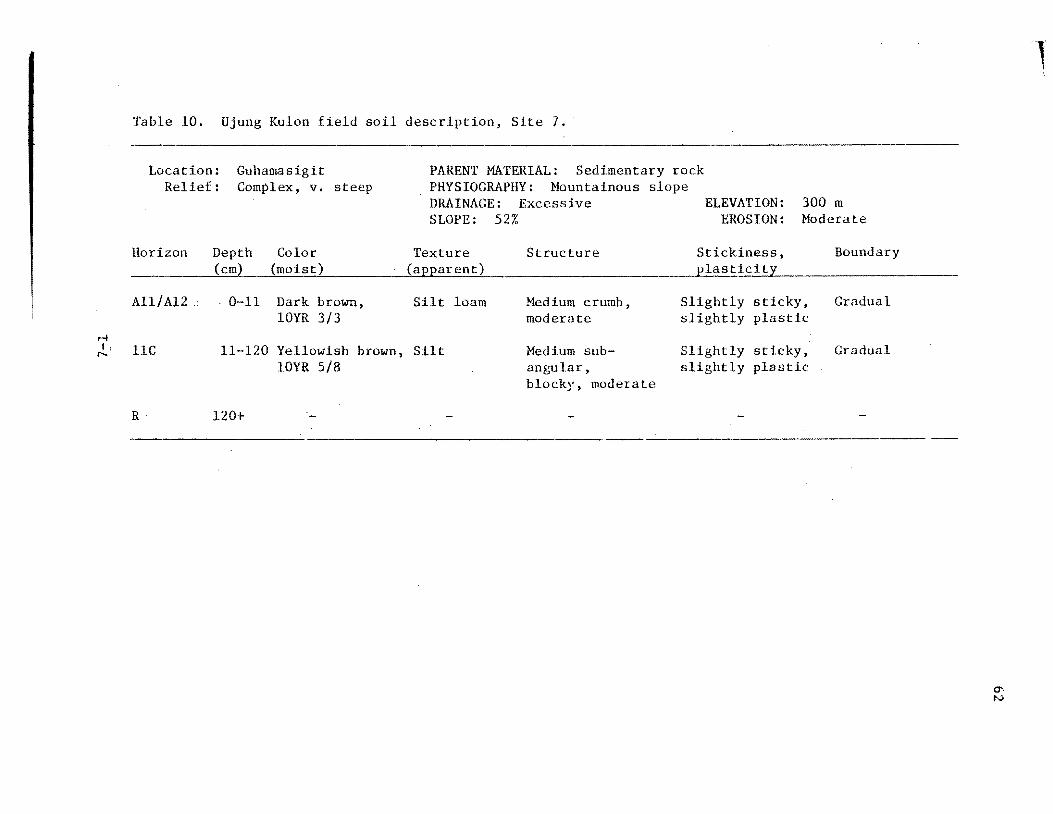
bullbullbull bullbull 62
bullbullbull 63
5 Ujung Kulon field soil description site 2
6 Ujung Kulon field soil description site 3
7 Ujung Kulon field soil description site 4
8 Ujung Kulon field soil description site 5
9 Ujung Kulon field soil description site 6
10 Ujung Kulon field soil description site 7
11 Ujung Kulon field soil description site 8
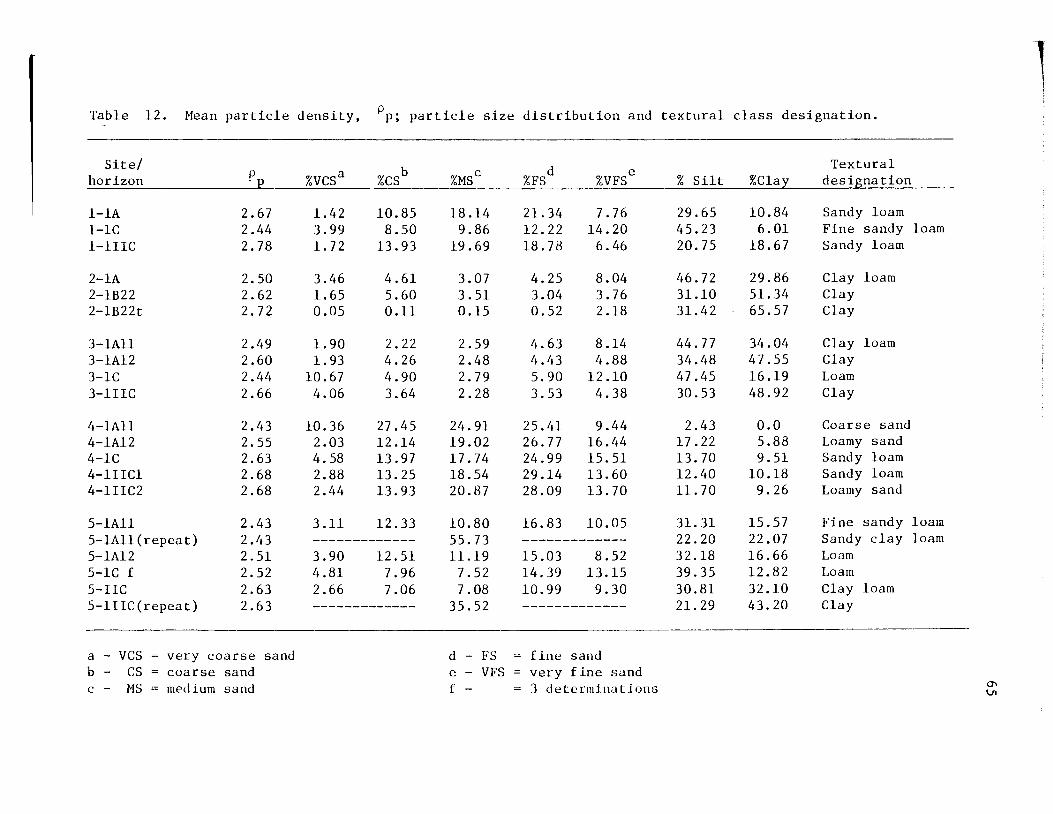
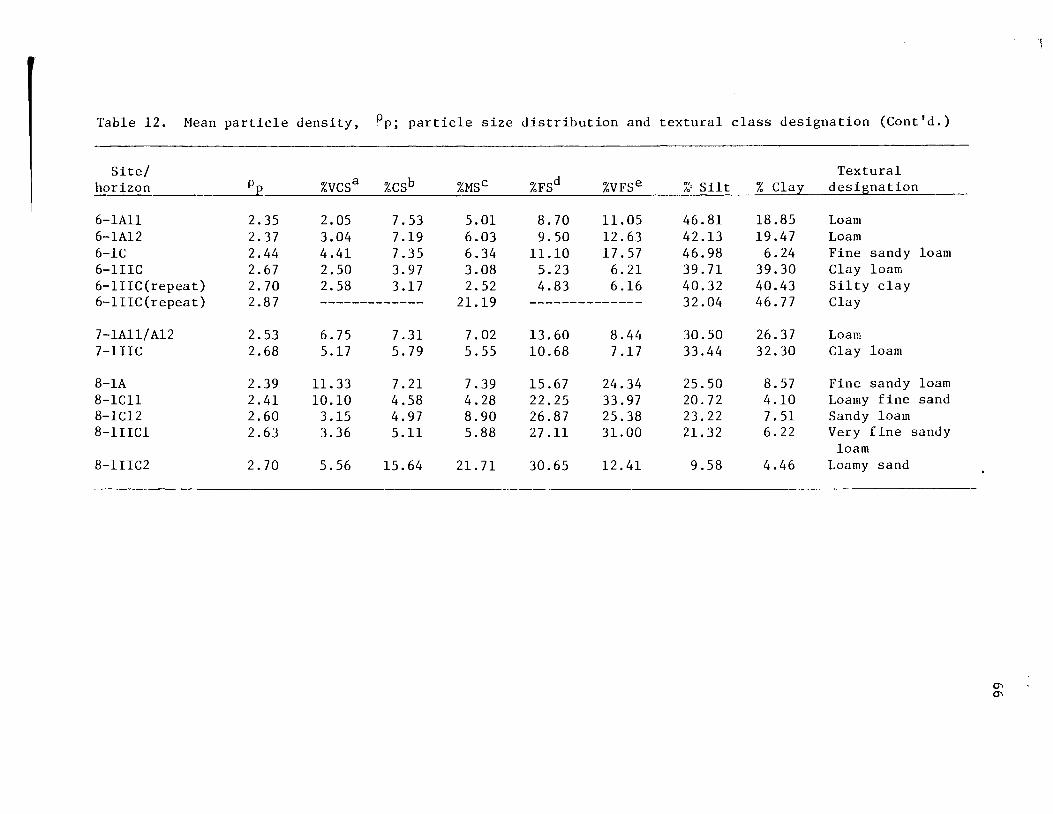
12 Mean particle density P particle size distribution and textural class designatign bullbullbullbullbullbullbull bullbullbull 65
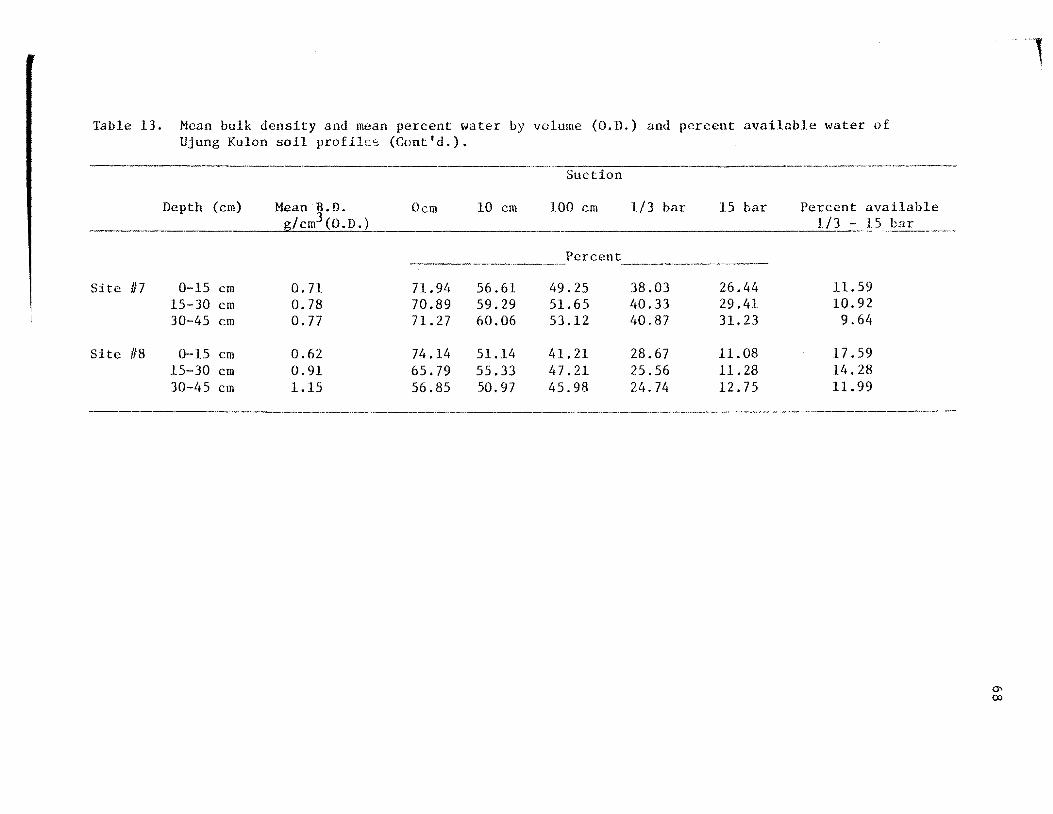
13 Mean bulk density and mean percent water by volume (OD) and percent available water of Ujung Kulon soil profiles 67
14 Soil pH and cation exchange capacity of soil profiles of Ujung Kulon determined by two methods 70
15 Exchangeable bases and percent base saturation in Ujung Kulon soil profiles bull bull bull bull bull bull bull bull bull bull bull bull bull 71
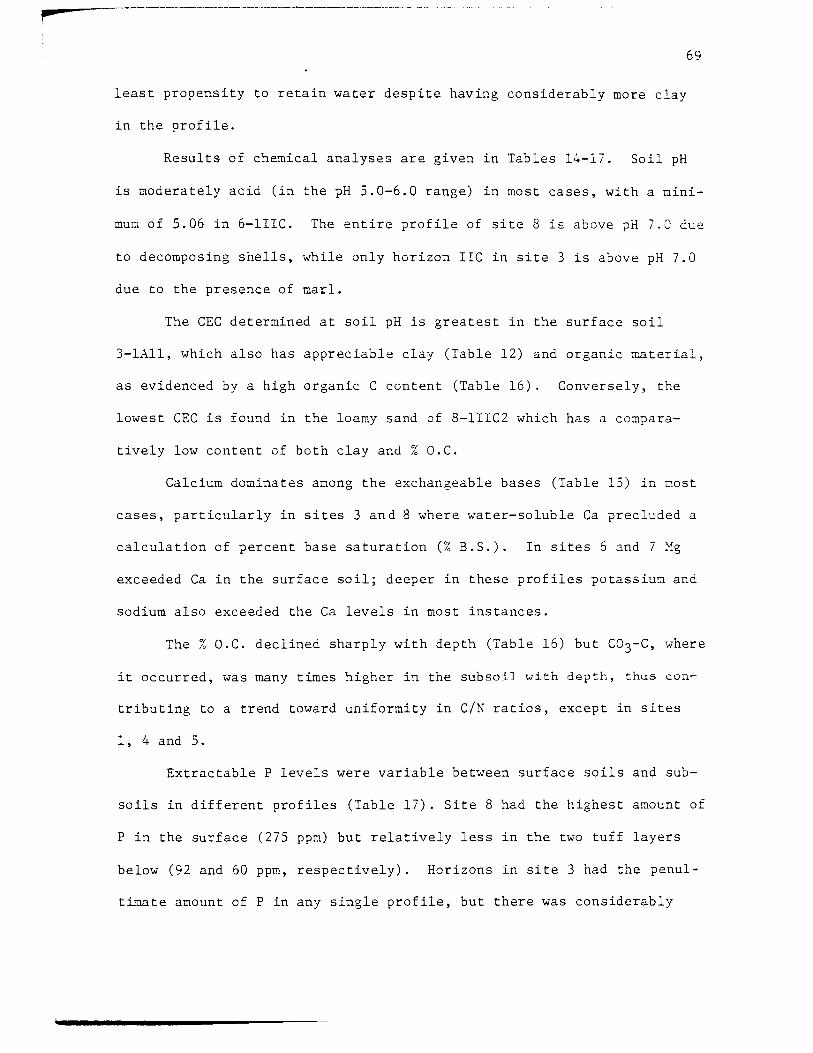
16 Percent organic carbon carbonate-carbon and total nitroshygen and carbon-nitrogen ratios in Ujung Kulon soil profiles 72
17 Phosphorous silicon and manganese levels of Ujung Kulon soils 73
18 Primary and secondary minerals identified from X-ray difraction patterns and unidentified peaks in soils of Uj ung Kulon bull 75
xi
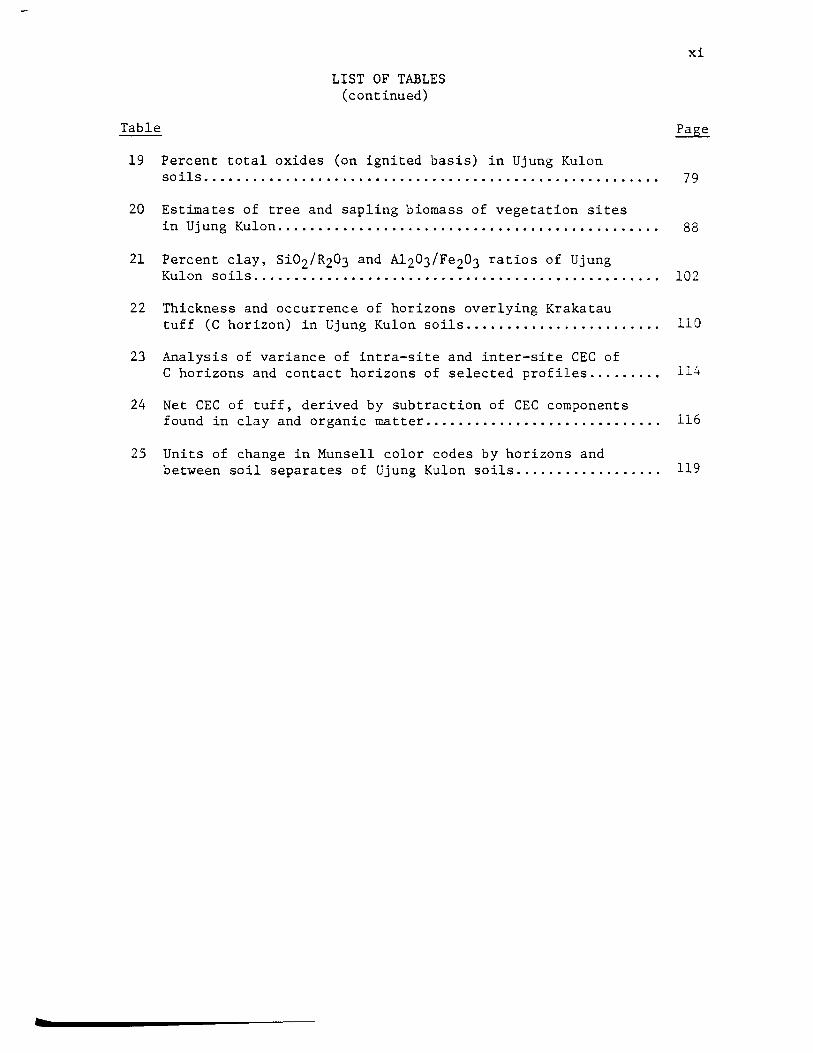
LIST OF TABLES (continued)
Table Page
19 Percent total oxides (on ignited basis) in Ujung Kulon soils 79
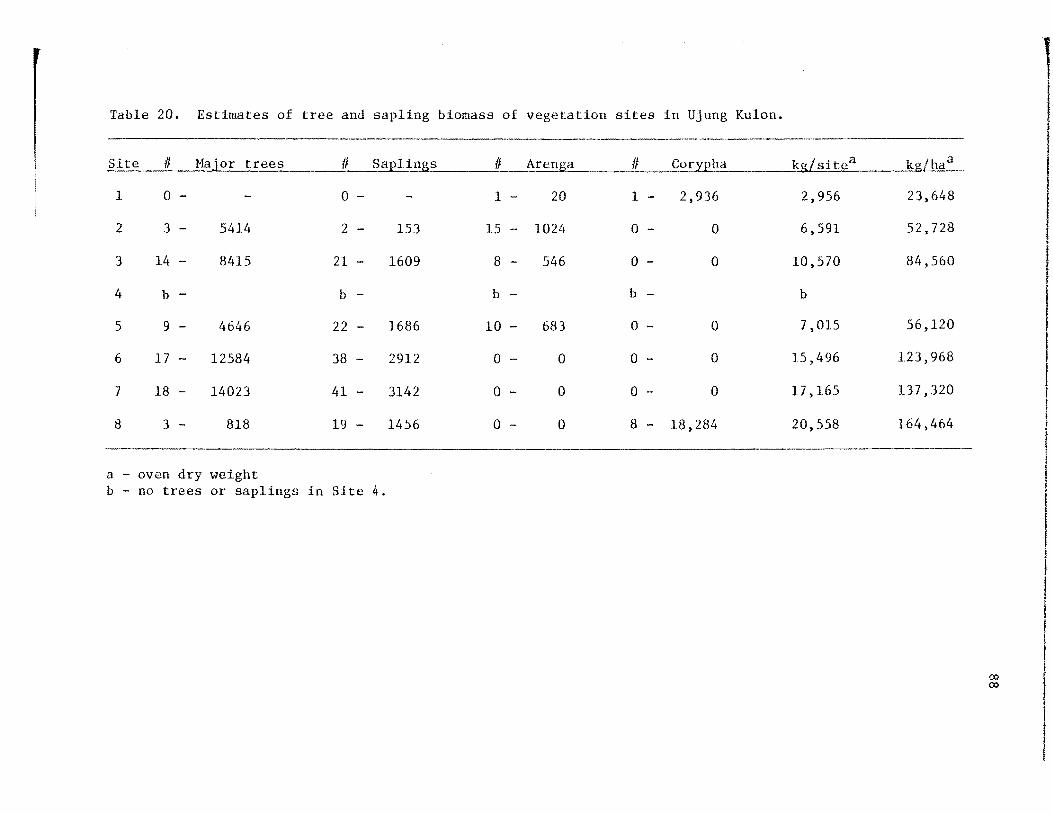
20 Estimates of tree and sapling biomass of vegetation sites in Uj ung Kulon 88
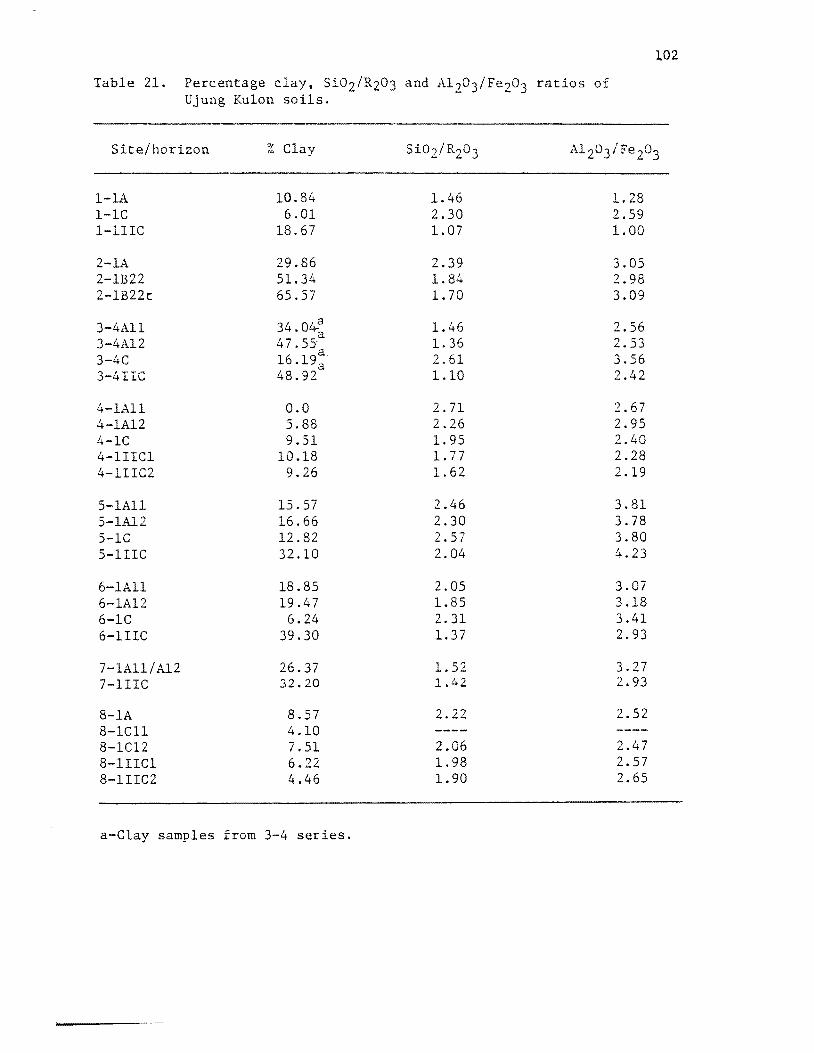
21 Percent clay Si02R203 and Al203Fe203 ratios of Ujung Kulon soils 102
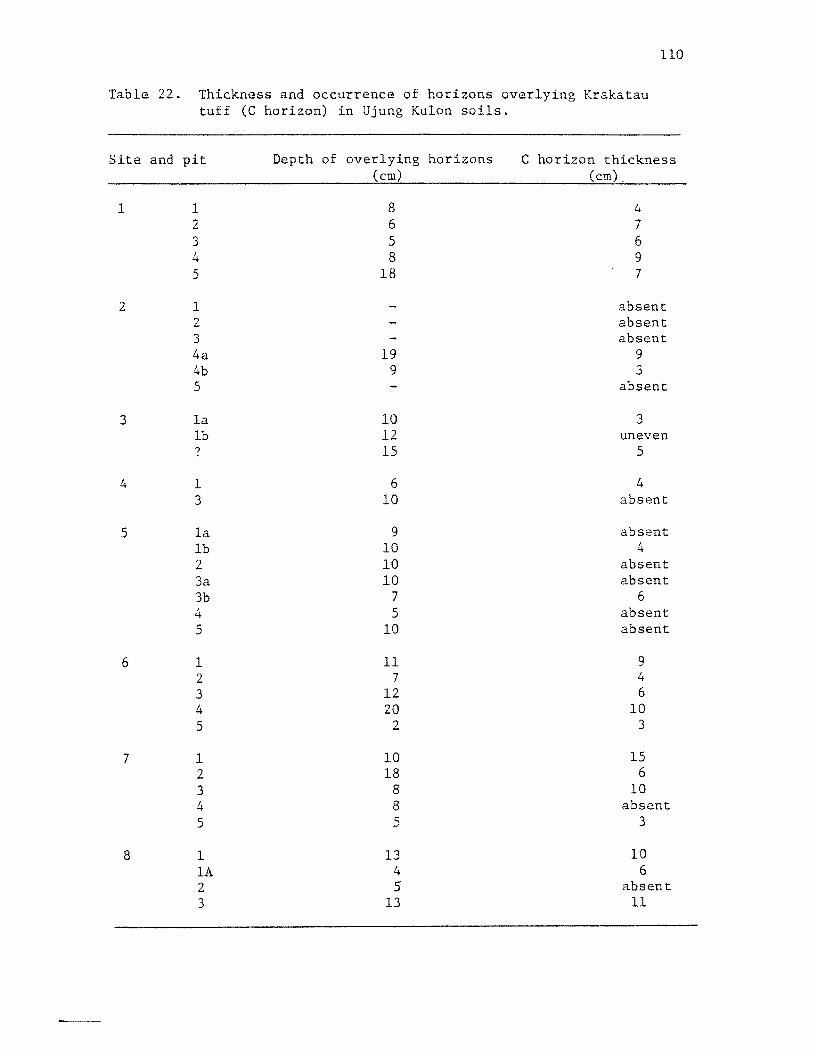
22 Thickness and occurrence of horizons overlying Krakatau tuff (C horizon) in Ujung Kulon soils llO
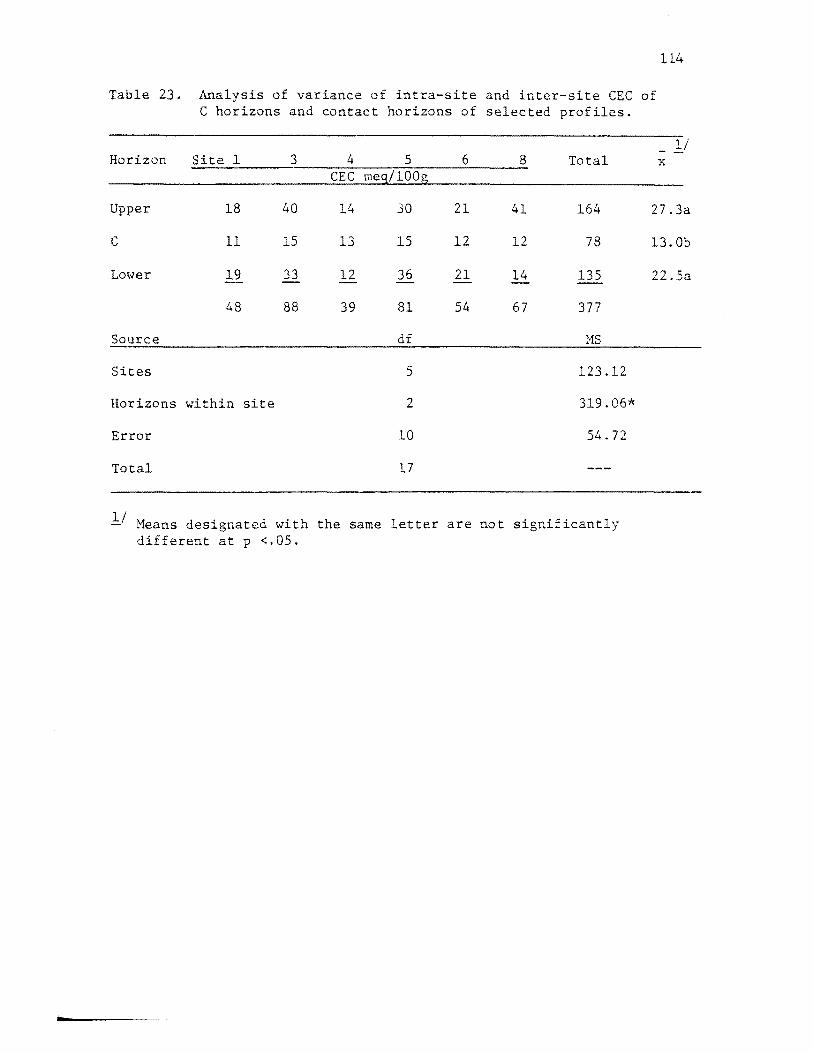
23 Analysis of variance of intra-site and inter-site CEC of C horizons and contact horizons of selected profiles 11~
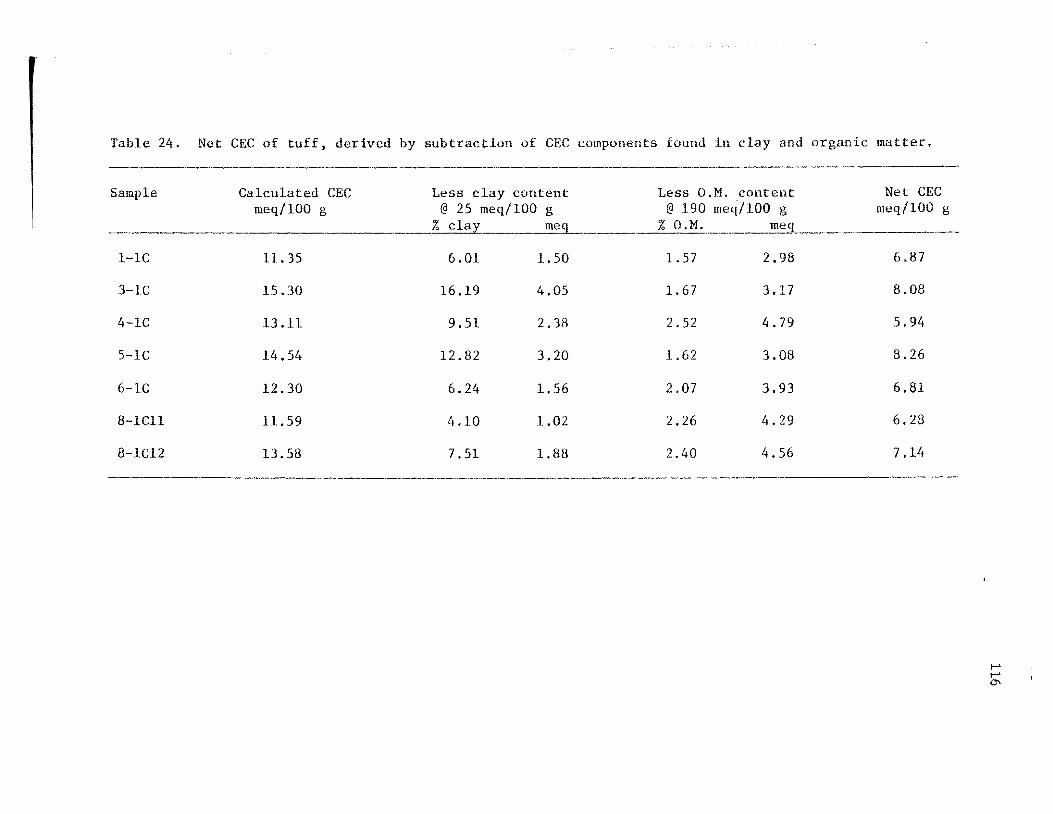
24 Net CEC of tuff derived by subtraction of CEC components found in clay and organic matter bull 116
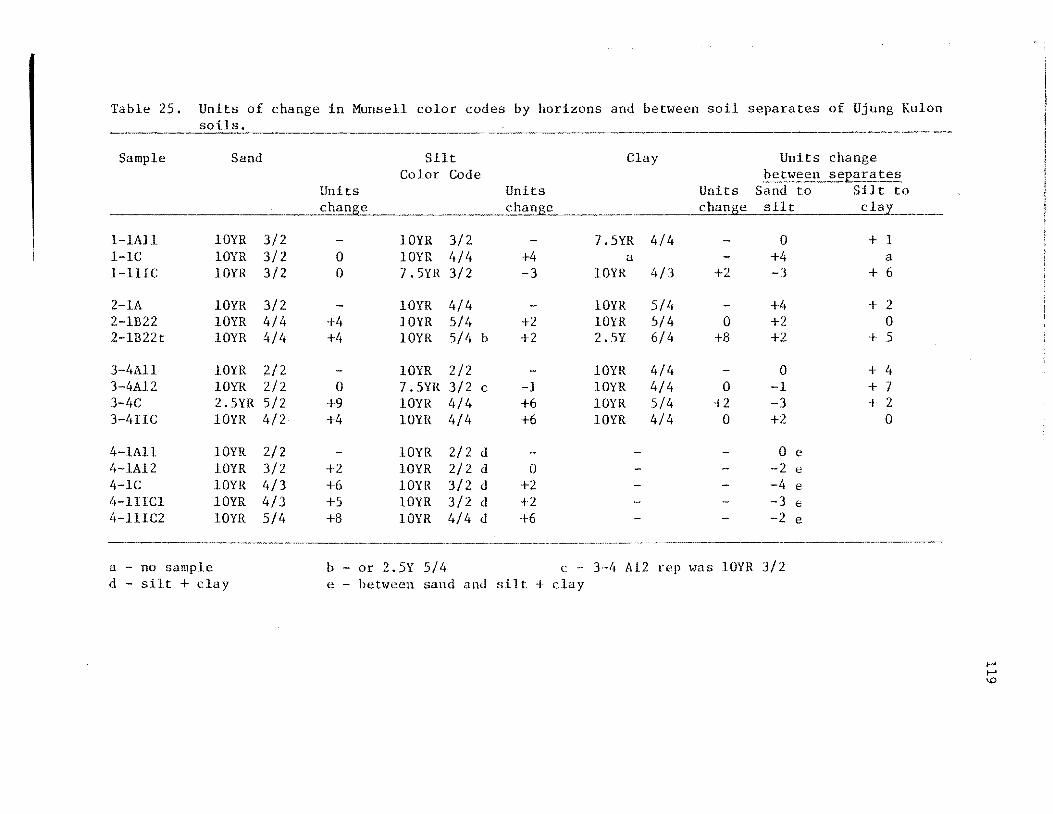
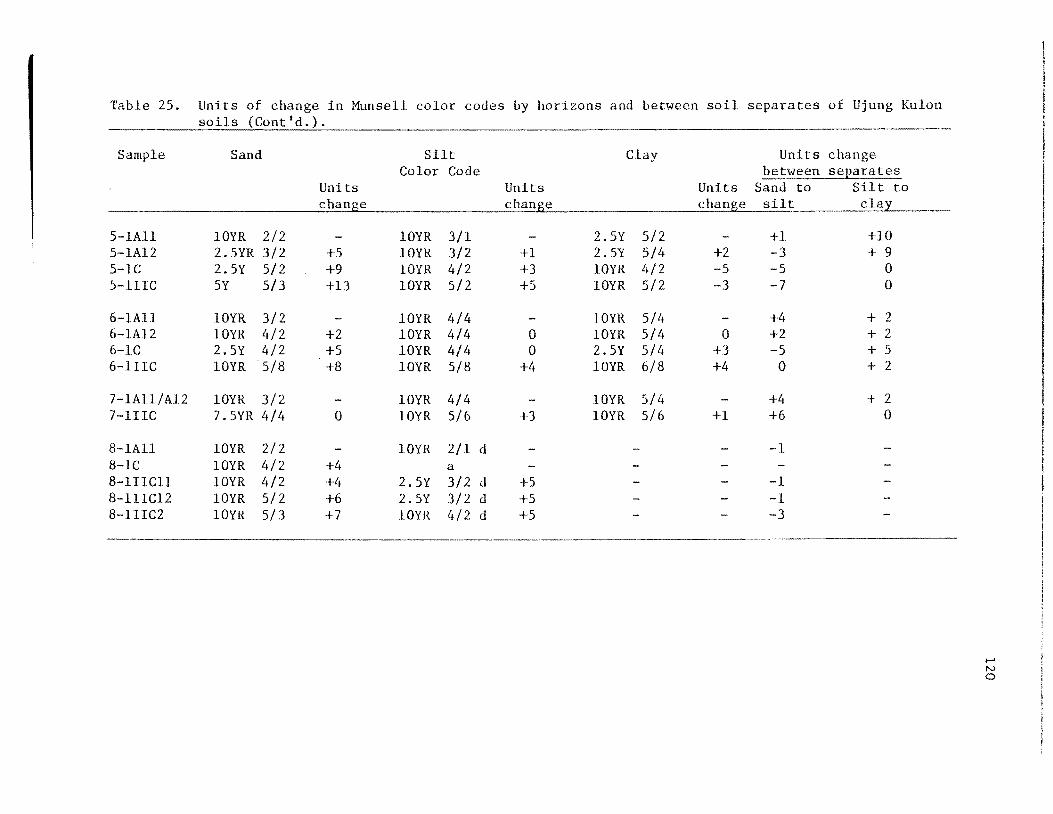
25 Units of change in Munsell color codes by horizons and between soil separates of Ujung Kulon soils 119
xii
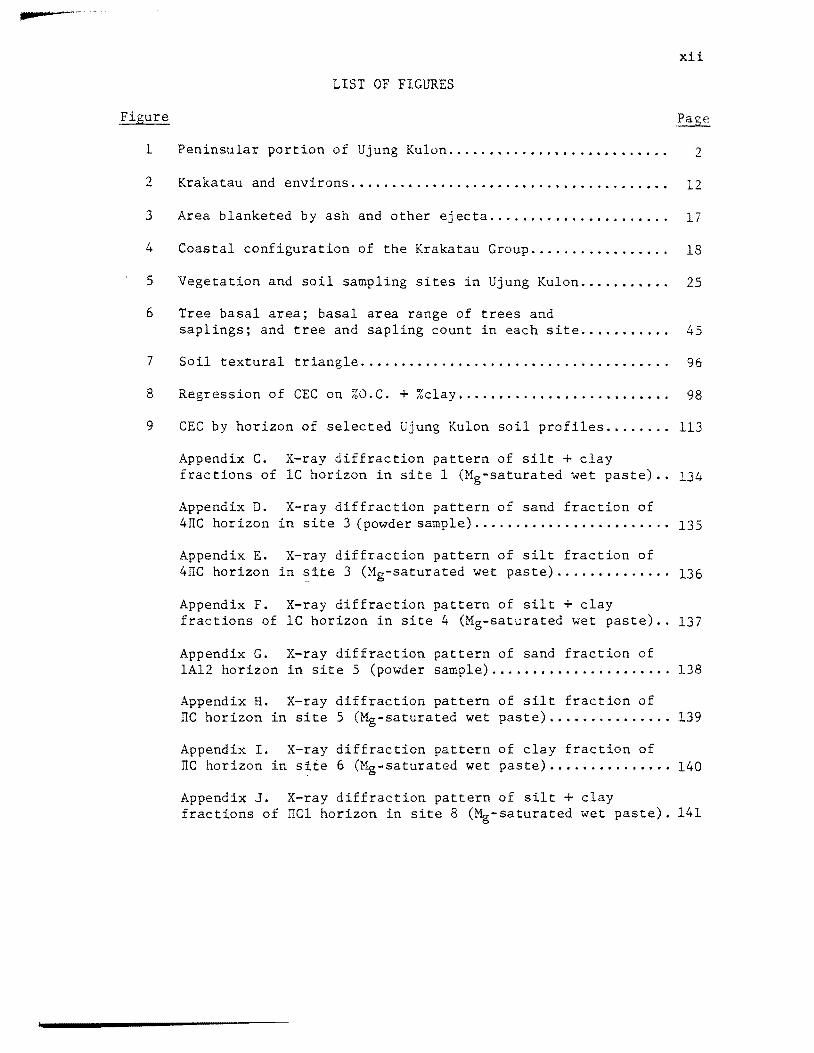
LIST OF FIGURES
Figure
1 Peninsular portion of Ujung Kulon 2
2 Kraka tau and environs bull bull bull bull bull 12
3 Area blanketed by ash and other ejecta bull 17
4 Coastal configuration of the Krakatau Group 18
5 Vegetation and soil sampling sites in Ujung Kulon bullbull 25
6 Tree basal area basal area range of trees and saplings and tree and sapling count in each sitebullbull 45
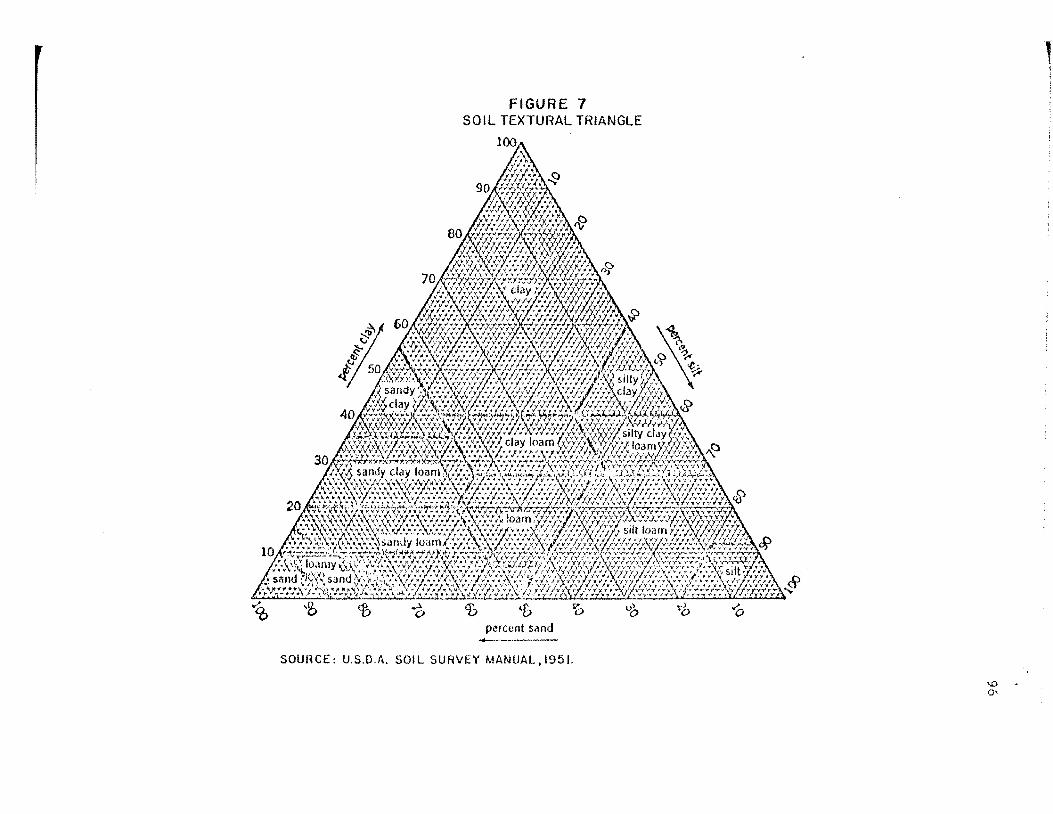
7 Soil textural triangle 96
8 Regression of CEC on 0C +clay bull 98
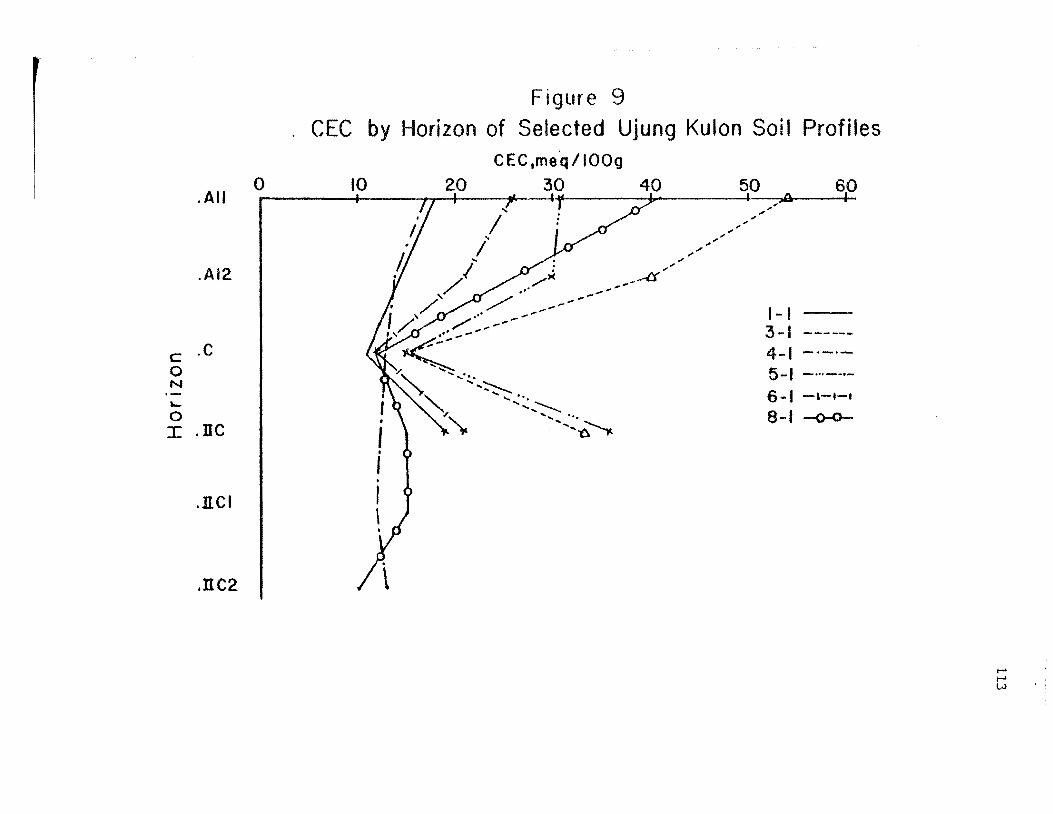
9 CEC by horizon of selected Ujung Kulon soil profiles 113
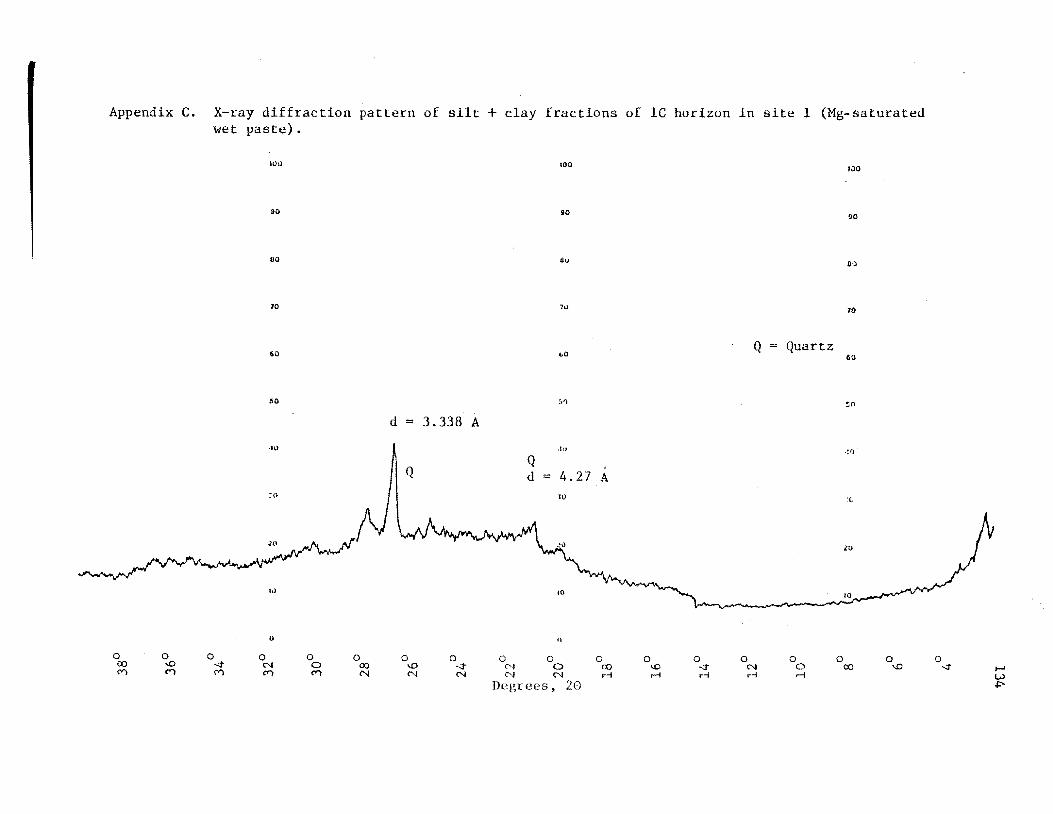
Appendix C X-ray diffraction pattern of silt+ clay fractions of lC horizon in site 1 (Mg-saturated wet paste) 134
Appendix D X-ray diffraction pattern of sand fraction of 4IIC horizon in site 3 (powder sample) bullbullbull 135
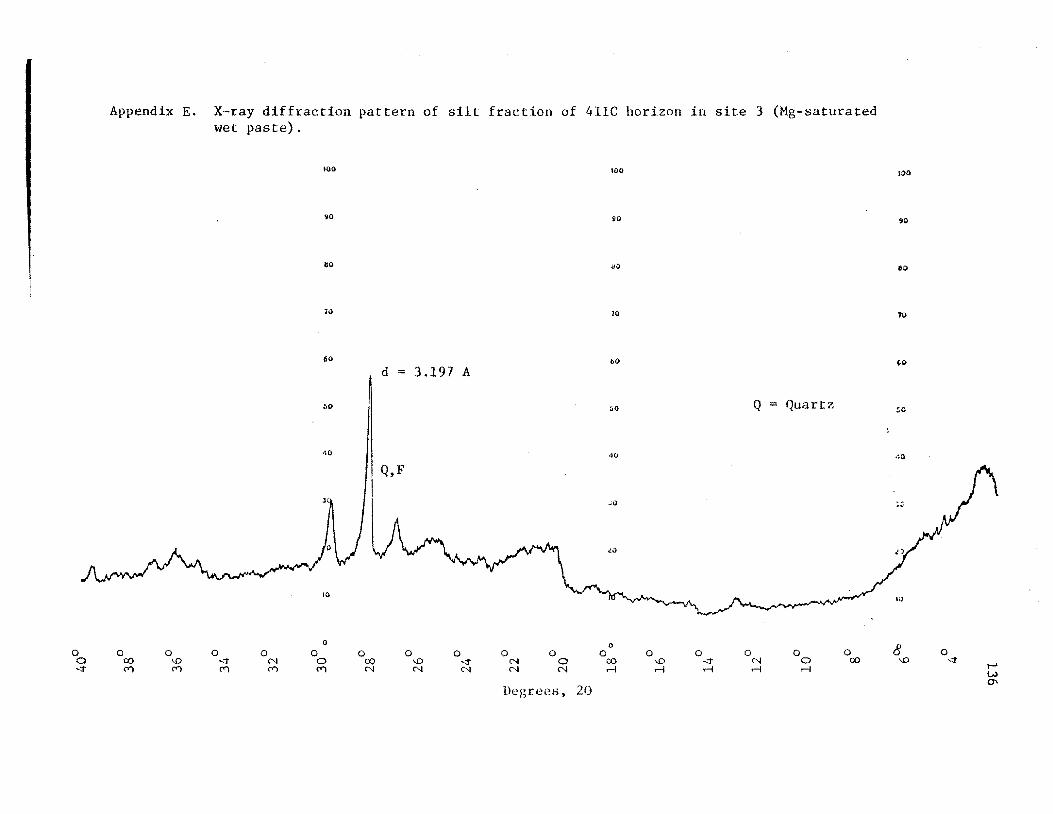
Appendix E X-ray diffraction pattern of silt fraction of 4IIC horizon in site 3 (Mg-saturated wet paste) bullbull 136
Appendix F X-ray diffraction pattern of silt+ clay fractions of lC horizon in site 4 (Mg-saturated wet paste) 137
Appendix G X-ray diffraction pattern of sand fraction of 1Al2 horizon in site 5 (powder sample) bullbull 138
Appendix H X-ray diffraction pattern of silt fraction of ITC horizon in site 5 (Mg-saturated wet paste) bullbull 139
Appendix I X-ray diffraction pattern of clay fraction of ITC horizon in site 6 (Mg-saturated wet paste) bullbullbullbull 140
Appendix J X-ray diffraction pattern of silt+ clay fractions of TICl horizon in site 8 (Mg-saturated wet paste) 141
--1
INTRODUCTION
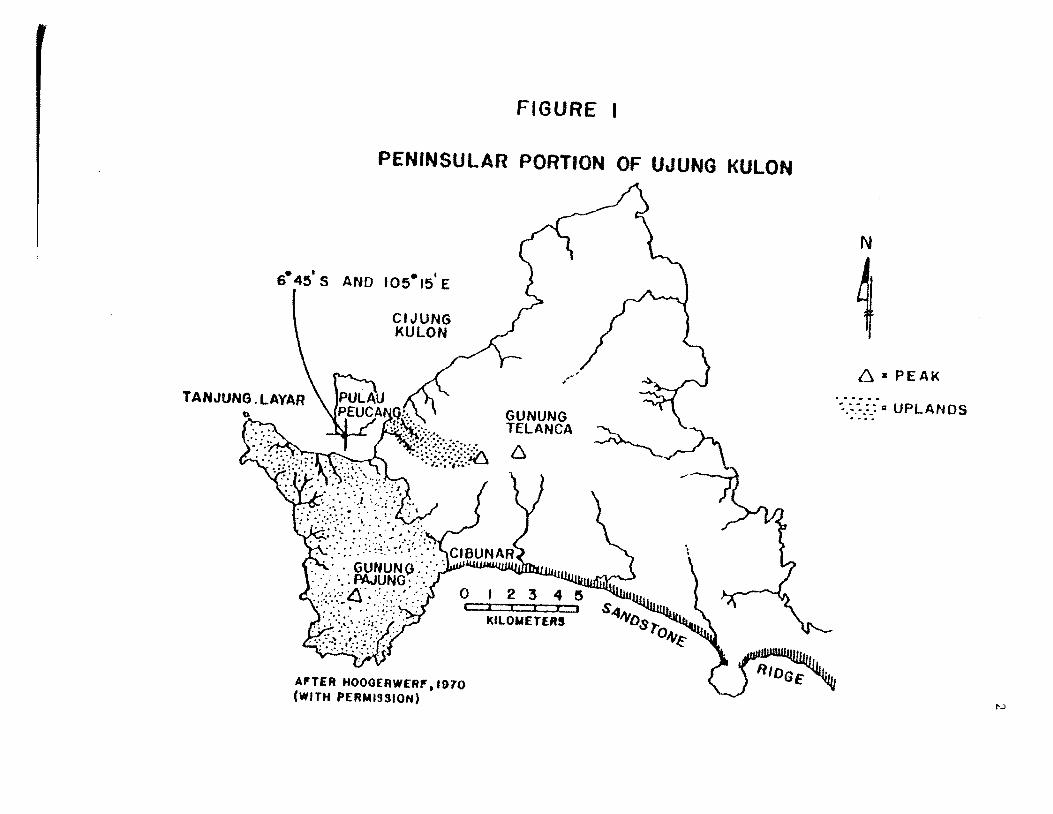
Ujung Kulon Nature Reserve at the extreme western tip of Java
was chosen as the site of this study as an example of one of the few
remaining and relatively undisturbed tropical lowland forests on
populous Java The name Ujung Kulon means West Point or Western
Tiplf in the Indonesian language but the entire nature reserve of the
same name encompasses some 41120 hectares of land including several
islands (see Figure 1) For the purpose of this study the name
Ujung Kulon refers only to the peninsular part of Java between 6deg 38
and 6deg 52 South Latitude and 105deg 12 and 105deg 30 East Longitude
Pulau Peucang a small island 05 km north of Ujung Kulon served as
the field headquarters
Names and spellings of locations show considerable variation
between archaic and modern Dutch and Indonesian languages As late
as 1973 Bahasa Indonesia the national language of Indonesia was
undergoing major spelling changes Hence most of the literature
references are at variance with the current usage found herein
As the first basic research venture of its kind in Ujung Kulon
an essentially virgin forest the study was broad in scope but rather
narrow in interpretation A few working objectives however
preceded the commencement of the investigations The objectives were
1 To describe the vegetation in selected plots which represent
different vegetation zones in Ujung Kulon
2 To characterize the soils in the selected plots
3 To investigate the inter-relationships which may exist between
the vegetation and soil parameters within the study areas
FIGURE I
PENINSULAR PORTION OF UJUNG KULON
Cl JUNG KULON
N
____ = UPLANDS
middot 6 bull PEAK
GUNUNG TELANCA
6
0 I 2 C I I I I
klLOMETERS
ATER HOOOERWERP 1 1970 (WITH PERMISSION)
3
Perhaps Hilgard (1912) stated the overall objectives of the basic
research approach best when he wrote Since the native vegetation
normally represents the result of secular or even millenial adaptation
of plants to climatic and soil-conditions this use of the native
flora seems eminently rational Moreover it is obvious that if we
were able to interpret correctly the meaning of such vegetation with
respect not only to cultural conditions and crops but also as regards
the exact physical and chemical nature of the soil so as to recognize
the causes of the observed vegetative preferences we should be enabled
to project that recognition into those cases where native vegetation
is not present to serve as a guide and we might thus render the
physical and chemical examination of soils as useful practically
everywhere as is locally the observation of the native growths
4
LITERATURE REVIEW
The entire western tip of Java except for a brief period of
Japanese occupation during World War II has remained in a wild state
since 1883
At that time the eruption of the volcano Gunung Krakatau and two
subsequently generated tidal waves destroyed several small villages
along the coast of Ujung Kulon in West Java (Hoogerwerf 1970) In
1923 the area was set aside as a nature reserve (Satmoko 1961)
Today Ujung Kulon is best known as a last stronghold of the one-horned
Javan rhinoceros Rhinoceros sondaicus sondaicus
Physiography
Pennisular Ujung Kulon covers approximately 26600 hectares (ha)
which can be divided into three broad physiographic regions
The steep uplands of the western third of the peninsula located west
of the streams Cibunar and Cijung Kulon a lower dissected marl
plateau in the middle of the Reserve and a vast lowland in the
northern and eastern sectors (Figure 1)
The western uplands are formed by an obtuse conical trachyte dome
(Indonesian Forest Service 1957) with ridges which finger out along
from the summit of the Gunung Pajung (Gunung meaning mountain 1 is
abbreviated as G) range It is commonly thought that the 480 m summit
of G Pajung is the highest peak in Ujung Kulon (Hoogerwerf 1970)
however the summit of G Guhabendang at 500 mis the highest point
in the Reserve Nevertheless G Pajung is a well-known landmark
inasmuch as the massif carries its name because of the existence of
5
a triangulation point marker on its sum~it and because of a narrow
but permanent trail connecting the suannit with Tanjung Sangjangsirah
on the west and Cibunar on the east
Terrain of the G Pajung massif is characterized by many short
but steep ridges formed from mixed volcanic and sedimentary rocks
Intermountain valleys are numerous but have rather shallow and
infrequent streambeds owing to rapid infiltration of rain water into
highly permeable soil Major streams are few in the G Pajung area
numbering 10-12 None are very wide or deep even as they empty into
the sea after following a dendritic course
A roughly plateau-like region in the middle of the Reserve is
generally known as the G Telanca area which has a less abrupt
topography It consists of low escarpments of 80-100 m elevation
with a maximum elevation of 140 m The escarpments slope outward
in all directions to form broad fans Rapid decomposition of the
erodable marl parent material the backbone of the Telanca formation
is chiefly responsible for the development of narrow and deep stream
beds between escarpments Vesicular marl outcroppings are common
in the Telanca area Rock outcroppings are otherwise uncommon throughshy
out Ujung Kulon except along ridge lines
Streambeds may be dry throughout the rainy season as a result of
excessive internal drainage except during and after torrents One
permanent and deep stream near the northern periphery of the Telanca
area has a visible length of only 400 m although the watershed feed-
ing it is comparatively extensive As reported by Schenkel and
Schenkel~Hulliger (1969) streams which originate in the G Telanca area
deposit lime sinter in their streambeds while still in their upper
6
reaches however the streams of the G Pajung massif do not deposit
lime On the other hand they reported that fossilized wood can be
found in the streambeds west of Cibunar and Cijungkulon whereas fosshy
silized wood had not been reported in eastern rivers of Ujung Kulon
The present author found many pieces of fossilized wood in the Cidaun
streambed midway between the Telanca and G Pajung formations
About half of Ujung Kulon is low-lying land rising to less than
50 min elevation and is located north and east of G Telanca Here
slow moving rivers are broad and moderately deep Some are navigable
by small boat for several kilometers inland During the rainy season
the ground is often inundated with brackish or tidal swamp water of a
meter or more in depth
Marine sands shells and coral are the chief geologic parent
materials in the northeast but there are also extensive pockets of
coarse pumice which has a pronounced effect on soil morphology Large
rounded pumice remnants are common even on the south coast of the
isthmus which connects Ujung Kulon with West Java These pumice
stones were apparently deposited in 1883 and after as tidal waves
washed over the isthmian lowland
Along the south coast a prominent sandstone ridge arises where
the G Pajung eastern drainage and the G Telanca western drainage
spill into the Indian Ocean at Cibunar The ridge follows the coast
south-easterly for several kilometers however the width of the
mostly level ridge never exceeds one-half km and the ridge is
usually not recognized as a major physiographic feature Schenkel
and Schenkel-Hulliger (1969) did however recognize the formation
and its characteristic vegetation
7
Climate
Ujung Kulon has a seasonal perhumid climate with a humidity index
of over 100 and a mean annual temperature of 26deg C according to
work by Schmidt and Ferguson (Soerianegara 1972) Rainfall inforshy
mation varies somewhat according to source (Table 1) As early as
1876 meteorological records were kept for Tanjung Layar It is
assumed that all rainfall data come from Tanjung Layar records there
being no other meteorological stations in the vicinity No data
for the area however have been published since 1944 Hoogerwerf
(1970) gave monthly rainfall averages covering a period of some ~O
years He reported a yearly average of 3249 mm Soerianegara (1972)
gave a 3137 mm yearly average Boerema (1925) published rainfall
maps of the Ujung Kulon peninsula using rainfall ranges of certain
months to show the transition of rainfall from west to east as a
result of monsoonal effects Yearly range of 2600-3550 mm west of
G Pajung and 2800-3800 mm east of G Pajung in Boeremas publishy
cation was based on the period 1879-1922
Hoogerwerfs (1970) averages of rainfall and Boeremas (1925)
ranges were in agreement in all months except April May and
September -- the months singled out by Boerema for illustration
In those months Boeremas maps showed 50-100 mm greater rainfall
east of G Pajung than west of the mountain leading to a higher
total yearly rainfall range east of G Pajung On the other hand
Hoogerwerf claimed just the opposite the authors (Hoogerwerfs)
long experience indicates that in the mountain range in question
considerably more rain falls than in the more eastern parts of the
l i
Table 1 Monthly average rainfall or rainfall range data for Ujung Kulon from various sources
Month Jan Feb Mar Apr May June July Aug Sept Oct Nov Dec Total Source
Rain (mm) 450 342 301 257 163 214 150 184 122 206 330 446 3185 a
443 377 325 258 171 178 130 138 141 263 351 474 3249 b
444 376 344 250 170 161 116 114 110 232 358 462 3137 C
West of 330- 300- 300- 200- 150- 150- 100- 100- 100- 200- 300- 400- 2600- d G Pajung 400 400 400 300 200 200 150 150 150 300 400 500 3550
East of 300- 300- 300- 300- 200- 150- 100- 100- 150- 200- 300- 400- 2800- d G Pajung 400 400 400 400 300 200 150 150 200 300 400 500 3800
No of days 20 18 17 14 10 9 10 7 8 11 15 21 160 a with rain
Source a - Batavia magnetisch en meteorologisch observatoriurn (annual reports) 1896-1909 (based on 14 years)
b - Hoogerwerf A 1970 (based on about 40 years)
C - Soerianegara I 1972 (after Berlage 1949 and Schmidt and Ferguson 1951 basis unknown)
d - Boerema J 1925 (based on 44 years)
9
peninsula Differences however are not large enough to be
significant from an overall climatic viewpoint
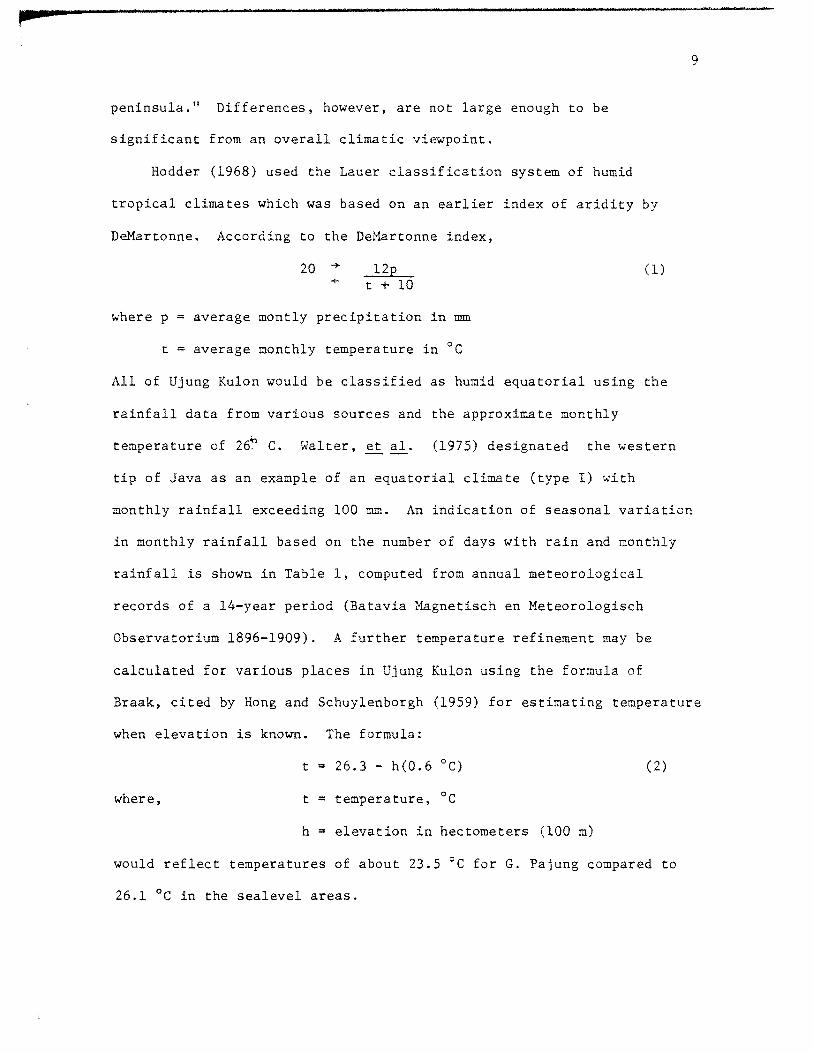
Hodder (1968) used the Lauer classification system of humid
tropical climates which was based on an earlier index of aridity by
DeMartonne According to the DeMartonne index
20 12p (1) t + 10
where p = average montly precipitation in mm
t = average monthly temperature in degC
All of Ujung Kulon would be classified as humid equatorial using the
rainfall data from various sources and the approximate monthly
temperature of 26~ C Walter~ al (1975) designated the western
tip of Java as an example of an equatorial climate (type I) with
monthly rainfall exceeding 100 mm An indication of seasonal variation
in monthly rainfall based on the number of days with rain and monthly
rainfall is shown in Table 1 computed from annual meteorological
records of a 14-year period (Batavia Magnetisch en Meteorologisch
Observatorium 1896-1909) A further temperature refinement may be
calculated for various places in Ujung Kulon using the formula of
Braak cited by Hong and Schuylenborgh (1959) for estimating temperature
when elevation is known The formula
t = 263 - h(06 degC) (2)
where t = temperature degC
h = elevation in hectometers (100 m)
would reflect temperatures of about 235 degC for G Pajung compared to
261 degC in the sealevel areas
10
Vegetation Disturbance History
The earliest recorded intrusions by man into Ujung Kulon were
made in 1807 Attempts were made to establish a naval port opposite
Pulau Peucang (abbreviated to P Peucang) to take advantage of its
strategic location (Hoogerwerf 1970) at the tip of Java Fortificashy
tions were built there but because many workmen succumbed to noxious
vapours from the newly worked ground they fled in large numbers
Nothing came of the port construction
In 1853 another expedition initiated by the Organization for
Scientific Research in the Netherlands Indies landed off the village
of Djungkulan (sic) at the time the only inhabited place in Javas
western corner according to Veth as cited by Hoogerwerf (1970)
The purpose of the expedition was to investigate the possibility of
developing the coal seams found there In the exeditions report
of 1854 it was also noted that palms and Indiarubber (sic) trees
thrive in their thousands there is a wealth of timber for ships
and shore bull Although the coal seams were never exploited large
quantities of Indiarubber taken from Ficus elastica and other trees
were exported from Djungkulan
According to Hoogerwerf (1970) the extended village of
Djungkulan apparently comprised no more than 40 huts and its inshy
habitants were probably dependent upon both fishing and subsistance
agriculture It may be presumed that foraging in the forest for
fruit nuts berries and pot herbs was also practiced Two smaller
villages named Cikuya and Rumah Tiga sprang up later on P Peucang
but were destroyed along with Djungkulan in the tidal waves following
11
the eruption of G Krakatau in 1883 Survivors escaped by fleeing
to the high ground at Tandjung Layar (Hoogerwerf 1970) where a
lighthouse was maintained at Javas First Point Mans activities
then have had some influence on species distribution particularly
in the more accessible areas
Although the Krakatau eruption and related occurrences have had
the most profound consequences in regard to vegetational disturbances
in Ujung Kulon and elsewhere most discussions on the matter are
largely speculative Accordingly the issue of post-Krakatau changes
is left for the DISCUSSION section of this study It would be helpful
at this stage to describe the Krakatau phenomena in an isolated conshy
text as a means by which one may better assess the results and
observations which were outgrowths of this study
Krakatau and its Aftermath
The several small islands which comprise the Krakatau Group are
located in the Sunda Strait midway between South Sumatra and West
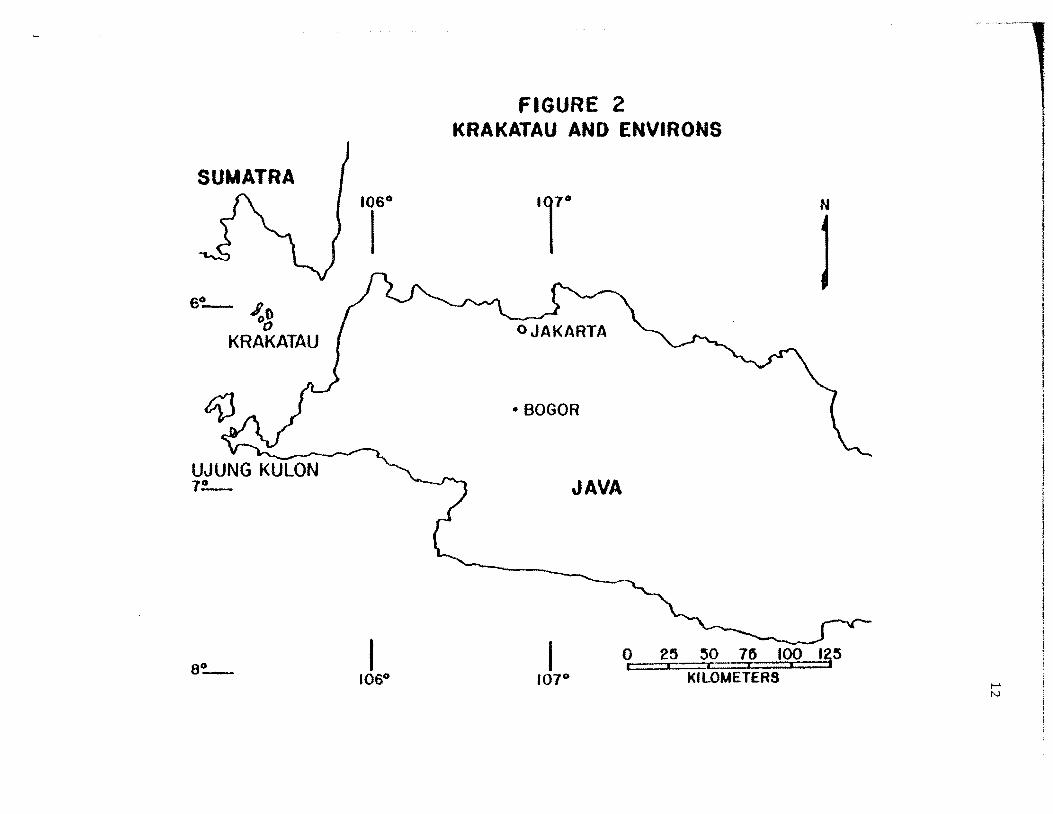
Java and NNE of Ujung Kulon at a distance of 56-84 km (Figure 2)
The cataclysmic events by which Krakatau attained world prominence
and which are important considerations in this study date from
August 26-28 1883 At that time heightened volcanic activity on
the island of Krakatau which had commenced earlier that year climaxed
in a series of severe eruptions including submarine eruptions They
produced the loudest sound ever heard by human ears (Furlong and
Furlong 1974) spewed forth an estimated 13 cubic miles (54 cu km)
of material (Wexler 1951) and killed about 36000 people (Furneaux
1964) shortly thereafter as a result of two tidal waves which
FIGURE 2 KRAKATAU AND ENVIRONS
SUMATRA
6~ _oO 0
KRAKATAU
UJUNG KULON 7__
106deg
I
bull BOGOR
JAVA
N
l
I I ~ 25 ~o 1p 1qo 1~51
106deg 107deg KILOMETERS I- N
--
13
were generated
Volcanic activity in the Krakatau Group was known prior to and
after the 1883 paroxysm Stehn (1929) outlined four phases of
activity beginning with a coalescence of two andesitic volcanos
Danan and Perboewatan with the basaltic cone of Rakata to form the
island of Krakatau during Pleistocene time
Note A considerable portion of West Java is covered by dacitic
tuff expelled by the now disappeared Danau volcano of Pleistocene
age (Schuylenborgh 1956) The original location of the Danau was
probably in Bantam Province West Java near the present-day city of
Pandeglang It was alluded to by Mohr (1930) who discussed a lake
named Danau di Bawah as being formed from a sunken crater The Danau
source of the Bantam tuffs should not be confused with the Danan
volcano one of three active craters which disappeared in August 1883
Andesitic flows via a fissure also penetrated Rakata In May
1680 ending 203 years of quietude fresh andesite flowed from
Krakatau (Kruger 1971) It was the only other known eruption in
historic times (Stehn 1929) A more recent period of volcanism
began early in 1928 with the emergence of Anak Krakatau (the child
of Krakatau) from a seamount astride Rakata Though both Danan and
Perboewatan disappeared in their entirety in 1883 half of Rakata
remained The island is therefore sometimes referred to as
Rakata rather than Krakatau
Steam gases and ash which are currently being emitted from Anak
Krakatau are localized within the vicinity of the crater in the
same manner by which Stehn (1929) wrote of the products of the period
May to August 1883 remaining localized Only the August 26-28 ejecta
14
then is considered as a source of soil parent material as will be
discussed in this study To what extent the Krakatau phenomena
affected the vegetation of Ujung Kulon and the ected material
served as a source of soil parent material is a key issue
The products of the Krakatau eruptions consisted of a broad
range of materials Near the eruption point obsidian and dark glassy
rock formed the principal components according to Stehn (1929)
Other strata showed a slow change from rough bombs to fine ashes
Most investigators agree that sorting of materials by weight took
place in the air Lighter colored materials which were also of lower
density were usually found in upper strata However deposits of
pumice and ash of 100 m thickness were found in the vicinity of the
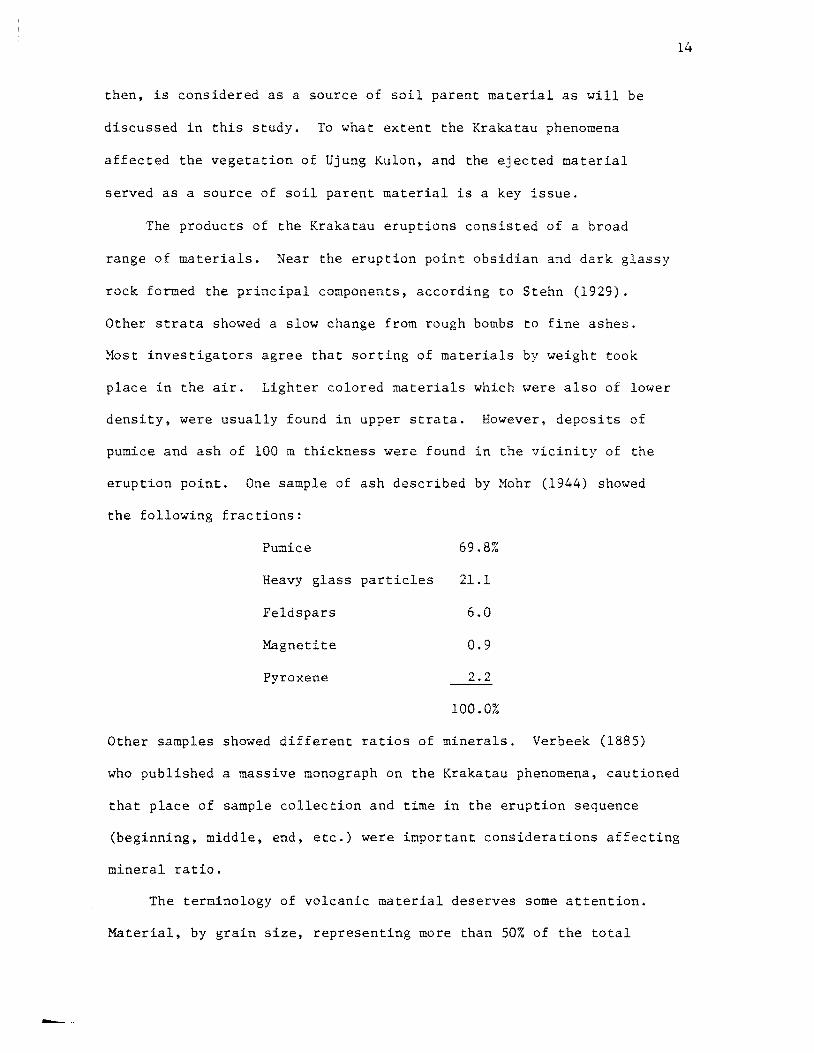
eruption point One sample of ash described by Mohr (1944) showed
the following fractions
Pumice 698
Heavy glass particles 211
Feldspars 60
Magnetite 09
Pyroxene 22
1000
Other samples showed different ratios of minerals Verbeek (1885)
who published a massive monograph on the Krakatau phenomena cautioned
that place of sample collection and time in the eruption sequence
(beginning middle end etc) were important considerations affecting
mineral ratio
The terminology of volcanic material deserves some attention
Material by grain size representing more than 50 of the total
15
volume normally determines the classification (Wedepohl 1969)
Composition of the parent lava of the ejecta is included as an
adjective in the combined name Tuffs which are compacted ash
deposits (Macdonald 1972) or other pyroclastic material of
small grain size (Wedepohl 1969) are the indurated equivalents
of volcanic ash and dust deposits A grain size classification
by Wentworth and Williams (1932) however described as fine ash
and dust all pyroclastics lt025 mm coarse ash gt025 mm to lt4 rnn
and lapilli anything gt4 mm and up to 260 mm The term pumice
apparently is not favored among contemporary geochemists since
no mention of pumice can be found in a number of texts on the
general subject of pyroclastics Earlier literature however
makes frequent reference to the term pumice to mean stone-sized
volcanic glass of light weight and color which contains numerous
cavities resulting from expulsion of water vapor at high temperature
during eruption
All Krakatau ejecta irrespective of size covered an area of
827000 sq km (Stehn 1929) Little information is available on
distribution range according to particle size or weight Furneaux
(1964) summarized some of Verbeeks (1885) observations in a popular
account of the Krakatau story He reported that according to
Verbeek some 43 cu miles (1791 cu km) of material had been
ejected Wexler (1951) and others thought it was a gross undershy
estimate Of Verbeeks estimate he assigned 286 cu miles
(1191 cu km) of material falling within a radius of 93 miles
(15 km) partly on the islands of the Krakatau Group where pumice lay
in banks 100 ft (305 m) thick pumice layers of 3-5 ft (9-15 m)
16
thickness at 12 miles (192 km) distance 1 foot (30 m) at 13-24
miles (21-39 km) and 2-8 inches (51 - 203 cm) at 31 miles (SO km)
Unfortunately the word pumice was the only one used to describe
the ejecta in the Furneaux account The map (Figure 3) of the
Krakatau ejecta included all particulate matter irrespective of
size or weight as transcribed by Furneaux
The effects of prevailing winds caused the ejecta downfall
pattern to be elliptical rather than circular If most heavy
particles were returned to earth near the craters could one expect
to find any material other than ash or dust in Ujung Kulon - at least
56 km away If so how much And most importantly to what extent
did it affect the existing vegetation or alter the soil environment
causing concurrent andor future manifestations Several documented
accounts about Krakatau debris suggest that the composition of ejecta
reaching Ujung Kulon was not solely limited to wind borne ash and
dust
The violently explosive Vulcanian or Pelean-type eruption of
Krakatau (Thornbury 1954) may have showered bombs lapilli and
pumice stones in all directions Except for that deposited on the
islands of the Krakatau Group most disappeared into the sea so that
an eruptive pattern could not be reconstructed with accuracy Only
5 of the ejected material has been accounted for in the enlargement
and reshaping of Verlaten and Lang islands (Figure 4)
Several reports placed ejecta at great distances A brief
account by Verbeek (1884) told of pumice and ashes of up to 03 m
thickness at a radius of 225 - 40 km 02 m thickness at 40 - 50 km
and down to 2 1 and half a centimeter at still greater distances
li
-bullmiddotmiddot--middot--middotmiddot- ____________ ~
FIGURE 3 AREA BLANKETED BY ASH AhD OTtER EJECTA
1200
EQUATOR
bullIbull Ibull I
I--- _________ -I_
AFTER FURNEAUX 1964
18
FIGURE 4 COASTLINE CONFIGURATICN OF THE tltRAKATAU GROUP HATCHED AREA- PRIOR TO 1883 DASHED LINE- SHORTLY AFTER 1683 ERUPTIONS SOLID LINE - PRESENT DAY
N
j
AFTER LEE UWEN 1936
0 2 4 6
KILOMETERS
19
He noted however that pumice stones the size of a fist were
thrown at a distance of 40 km Several ships in the Sunda Strait also
logged reports of falling ash and hot pumice among them the~pound
Naples 100 miles (161 km) to the west of Krakatau Leeuwen (1936)
reported that large blocks of pumice burned holes in clothes and sails
on the ship Berbice at a distance of 70 - 80 km from Krakatau Those
ships logs showed moderate to strong winds from SSW to WSW although
Verbeek (1885) noted that prevailing winds in the area were SE and NE
during that time of year
Pumice stones also fell in other directions A telegram froo
Batavia (Jakarta) told of stones which fell in Serang (Anon 1883)
a town 78 km E of Krakatau Verbeek (1885) wrote of blocks the size
of a human head which apparently fell in Ujung Kulon As for tuff and
ash Verbeek also tabulated data for several locations in West Java
and South Sumatra with corresponding thickness of occurrence He
himself measured a thickness of 10 mm at Javas First Point in Ujung
Kulon
Scientific Research in Ujung Kulon
Due to its remoteness from the populated areas of Java few
people have had occasion to traverse the peninsula Bantam Province
in general has a low population density compared to the rest of Java
With rough terrain and seasonal flooding in the lowlands Ujung
Kulon had little to offer except its strategic location and its
plethora of wildlife
Besides the one-horned Javan rhinoceros Rhinoceros sondaicus
sondaicus as the chief attraction Ujung Kulon has numerous other
20
animal species Some of the more interesting include the banteng
Bos javanicus javanicus leopard Panthera pardus melas crocodile
Crocodylus porosus reticulated python Python reticulatus and three
species of deer the Javan deer Rusa timorensis russa the barking
deer Muntiacus muntjak muntjak and the mouse deer Tragulus
javanicus javanicus In former times the Javan tiger Panthera tigris
sondaica was found extensively throughout Ujung Kulon but its
presence there now is in dispute Grazing animals therefore have
an influence on some sections of Ujung Kulon
Entry into the area has been restricted since 1921 when a 300 sq
km nature reserve was promulgated (Satmoko 1961) Consequently
most scientific interest has been on the part of zoologists
ornithologists and others interested in the wildlife Some notably
Hoogerwerf (1970) Schenkel and Schenkel-Hulliger (1969) and Satmoko
(1961) have also described some aspects of vegetation and physiography
Wirawan (unpublished) and Dransfield (unpublished) have also conducted
botanical expeditions in Ujung Kulon but An inventory of the plant
species and communities of Ujung Kulon does not yet exist nor has a
study of its plant ecology been made so far according to Schenkel
and Schenkel-Hulliger (1969) No published quantitative studies of
the vegetation of the peninsula have ever been made
Some quantitative and considerable descriptive information on
the vegetation of nearby P Peucang by Hoek and Kostermans (1950)
Kartawinata (1965) and SEAMEO BIOTROP (1972) is available Due
however to the destruction of vast forest areas on P Peucang during
the tidal waves of 1883 the forest associations of P Peucang and
Ujung Kulon are not comparable
21
No known soil studies have been undertaken in Ujung Kulon A
general soils map of the peninsula has been published but without
accompanying data by the Soils Research Institute of Indonesia
(Lembaga Penelitian Tanah 1966) Soerianegara (1972) undertook a
study of four soil profiles on nearby P Peucang He also studied
soils (1970) of the Mount Honje Forest Reserve 10-20 km to the east
of and adjacent to Ujung Kulon Schuylenborgh (1957) investigated
soil genesis processes in several locations in West Java and South
Sumatra over a period of years but none very close to Ujung Kulon
The Issue of Vegetation Classification
Based on temperature rainfall and overall physiognomy Ujung Kulon
would likely be classified as tropical rain forest by most naturalists
The SEAMEO BIOTROP study (1972) did just that in regard to the
forest on P Peucang Beard (1942 1949) and Wadsworth and Bonnet
(1951) described forests in Puerto Rico having only 2030-3203 mm yearly
rainfall as montane rain forest Cain et al (1956) and in part
the classical text The Tropical Rain Forest by Richards (1952) dealt
with Brazilian forest much of which was about 2500 mm annual rain-
fall Even the monsoonal forests of Thailand were discussed by
Kira (1969) as tropical rain forest Perhaps the assessment of the
nature of rain forest which was most uncritical was given by McPherson
and Johnston writing in Southworth and Johnston (1967) They implied
that rain forest could exist in areas with as little as 75 inches
(1905 mm) annual rainfall so long as the evergreen nature of the
forest prevailed
22
-----middot-
In the Life Zone System of Holdridge (1967) Ujung Kulon would
properly be called a Tropical Lowland Moist Forest The Holdridge
system makes use of temperature rainfall and potential evapotransshy
piration as major parameters for classification of vegetation within
latitudinal regions and altitudinal belts which also modify the
classification nomenclautre To be called a tropical (lowland) rain
forest an area in a tropical latitude and in a basal altitudinal
belt (below 500 m) must have at least 8000 mm of annual rainfall
according to the Holdridge system
The acceptance of the Holdridge classification is justified in
this study primarily because West Java has areas of much higher
rainfall than does Ujung Kulon and consequently much greater species
complexity that is inherent in the system Holdridge (1967) found
that species complexity varied proportionally with the rainfall within
the tropical zone of the Americas Soil conditions however also
affect species diversity and height growth Tschirley ~ al (1970)
noted that an increase in soil moisture retention beyond the point of
adequate aeration decreased species diversity Aphysiological
drought in Talparo clay caused by premature swelling shut of surface
soils during early monsoon rains in Trinidad (Chenery and Hardy
1945) was confirmed by Pellek (1971) who measured highly significant
differences in tree height of similar aged Tectona grandis on Talparo
clay and adjacent soils with more moisture Beard (1942 1949) and
Wadsworth and Bonnet (1951) also found physiological drought under wet
conditions at high elevations due to impeded drainage Excessive
aeration also leads to draughty soils examples of low moisture
retention in sandy soils are commonplace
23
MATERIALS AND METHODS
This study was divided into two main phases
I Field Observations and Data Collection
A ground reconnaisance of salient vegetation associashy
tions and soil groups was made to complement or replace preshy
selected sites from a map transect The work included vegetation
data collection soil profile descriptions and soil and plant
material collection
II Laboratory Determinations
Chemical physical and mineralogical properties of the
soil from each horizon were determined Replication of all detershy
minations was carried through for several samples which were chosen
at random Chemical analysis of plant material was performed on
leaves of the most common species found in the study sites
24
PHASE I Field Observations and Data Collection
1 Determination of Sampling Sites
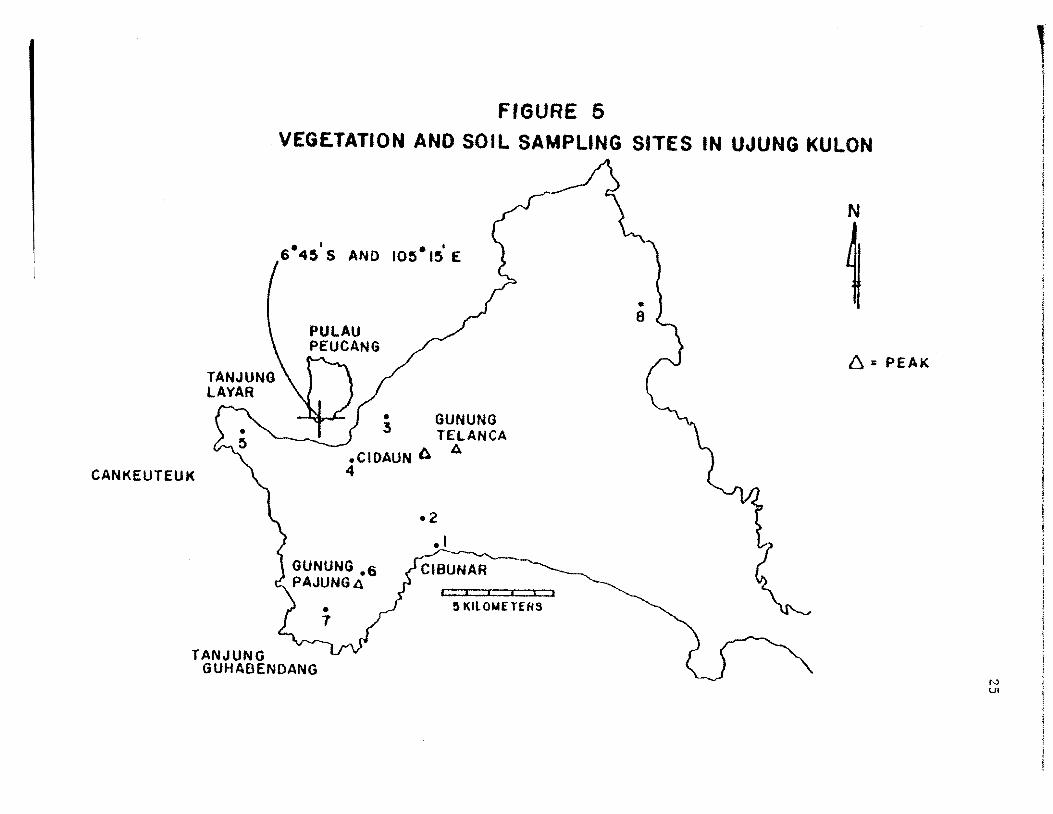
Four sampling points were pre-selected from a map transect line
(Figure 5) running N 45deg E from Tanjung Guhabendang on the SW to its
termination just south of the mouth of Cikarang on the NE coast of
Ujung Kulon Transect alignment was chosen on the basis of best
representation of altitudinal zones and terrain features in conshy
junction with prevailing wind information given by Satmoko (1961) and
rainfall data from Soerianegara (1972) These pre-selected sites
designated sites 7 6 2 and 8 respectively were 2 4 8 and 17 km
respectively from the initial point at Tanjung Guhabendang Other
sites initially chosen along the transect were eliminated due to
excessive time needed to cut access trails and make other preparatory
arrangements Instead additional sa~pling sites designated 1 3 4
and 5 were chosen near Cibunar G Telanca Cidaun and Cankeuteuk
respectively
2 Size and Configuration of Sampling Sites
All sampling sites were 25 x 50 m rectangular plots They were
somewhat larger than the most efficient size of 10 x 20 m to estimate
the density of major species (Lang et al 1971) but nonetheless
efficient when species are aggregated (Cain and Castro 1959
Smith 1965) The major axis was parallel with the slope or if on
level ground the major axis was oriented E-W Approximate elevation
of the plots was taken from a topographic map with 25 m contour intershy
vals while slope within plots was determined by the use of an altimeter
FIGURE 5 I l
VEGETATION ANO SOIL SAMPLING SITES IN UJUNG KULON I
TANJUNG LAYAR
TANJUNG GUHAOENOANG
bull GUNUNG3 TELANCA
CIOAUN A A 4
bull2 I I I I I I
KILOMETERS
N I
6 s PEAK
CANKEUTEUK
N VI
26
------middotmiddot
3 Vegetation Data Sites
Within each site data were collected on trees and saplings only
Trees were defined as single-stemmed perennial plants measuring
greater than 25 cm in diameter at breast height (dbh) 137 m above
the ground at mid-slope Saplings were defined as single-stemmed
perennial plants having tree-like form but 10-25 cm dbh Total
counts of trees and saplings in each site were made Trees were
measured in cm at dbh using a steel diameter tape Total top hei
of trees were determined to the nearest meter with a Blume-Leiss altimeter
fitted with a range finder device Species identification was nade on
site or by verification of specimens with herbarium sheets and staff
personnel at Herbarium Bogoriense in Bogor
Leaf samples of the major species within each site whether
shrubs saplings or trees were collected for subsequent chemical
analysis Leaf material from a maximum of four species in each site
was taken and analyzed using ennnission spectrography (Appendix A)
Bearing and distance between sites were determined by hand-held
compass and pacing respectively Within-plot lateral distances were
regulated with a cloth meter tape
Basal area the cross-sectional stem area at dbh was subsequently
calculated as m2ha for trees and as basal area range of trees and
saplings - at low range and upper range
4 Field Soil Data Sites
A was dug to a depth of 15 min the approximate center of
each 25 x 50 m site If less than 15 m the depth was either to the
27
water table or to the bedrock The number and depth of soil horizons
were recorded Coding of horizons adopted was similar to that of
Parsons and Herriman (1975) Soil color of moist soil was determined
by means of Munsell Soil Color Charts while soil texture (apparent
soil texture) and structure were recorded according to the procedure
prescribed in the USDA Soil Survey Manual (Soil Survey Staff
1951) An adequate sample from each horizon of the central pit and
from an alternate pit was collected and stored in triple-thickness
plastic bags for subsequent chemical physical and mineralogical
analyses The soil samples were identified by labeling them accord
to their relationship to others in the same profile and the spatial
location of profiles in each site Samples were labeled consecutively
clockwise with respect to the transect bearing starting with the
central pit Thus the sample marked 6-lAll designated the All
horizon of the central pit in site No 6 6-2All was a correspond
horizon found at the NE plot periphery 6-3All from the SE 6-4All
from the SW and 6-5All from the NW
Although most analyses were conducted on samples taken from the
central pit some were limited to samples collected from the
peripheral pits Bulk density PB and soil moisture tension
were obtained from mean values of five bulk density rings per plot
one from the central pit and the others from peripheral pits Due
to the thinness of some horizons and the existence of rocks and roots
PB and soil moisture tension determinations were limited to only
three depths 0-15 cm 15-30 cm and 30-45 cm The number of
horizons and horizon depth were also recorded for the shallower
pheral pits No attempt was made to determine the lower limit of
28
the deepest horizons encountered because the subsoils appeared to be
very thick in most cases Small samples from each horizon of the
central pits were taken for pH and field moisture content determinshy
ations Bulk density by core ring method pH in water and KC by
glass electrode using watersoil ratio of 51 moisture content by
constant weighing in a Brabander dry stove and soil moisture
tension at 10 cm 100 cm 13 bar and 15 bar suction were all
determined at the Soils Research Institute in Bogor
29
PHASE II Laboratory Determinations
1 Plant Tissue Samples
Leaf samples collected in each site were oven dried and ball
milled in preparation for chemical analysis Only three plant species
represented sites 1 and 4 all other sites had leaf material from
4 species Due to lack of sampling control the number of plant
species represented and most importantly -- the lack of duplication
of most species among all the sites -- the usefulness of the samples
in overall interpretations were precluded Results of the analyses
are found in Appendix A
2 Soil Preparation and Handling
Upon arrival in Honolulu the bagged soil samples were ventilated
then fumigated with methyl bromide to destroy any pathogens present
After repacking the samples were divided into lots of approximately
equal weight One lot was repacked in triple-thickness plastic bags for
storage The other lot was passed through a 20-mesh sieve in a wet
condition before repacking in plastic bags Fresh samples as needed
were taken from the sealed bags For most chemical and mechanical
analyses fresh sub-samples of air-dried soil were used Three
20 gram samples of sieved air-dried soil were oven-dried at 105deg C
for 24 hours to determine the moisture factor of air-dried samples
A mean calculated moisture factor was henceforth used to express
analytical results on an oven-dry basis
30
3 Soil Physical Properties
In addition to the pB and soil moisture tension data determined
at the Soil Research Institute in Bogar particle density pp and
particle size distribution were also completed to permit verification
of apparent texture
a Particle density
Particle density pp was determined by the pycnometer
method on three replicates which had passed a 20-mesh sieve Subshy
samples of approximately 10 g were used and weighed to the nearest mg
The dimensions mass and density of pumice fragments which were larger
than soil-sized separates were also recorded
b Particle size distribution
Approximately 25 g of sieved soil were dispersed with
50 ml of 10 sodium hexametaphosphate (Calgon) solution and 100 ml of
water in plastic breakers a modification of the method described by
Kilmer and Alexander (1949) The mixture was sonicated at factor
60 - HiSpeed for 10 minutes using a BIOSONIK IV unit Silt and clay
were separated by washing into liter cylinders by wet sieving through
a 325-mesh sieve The sand fractions remaining on the sieve were
subsequently dried and separated into fractions of very coarse sand
(VCS) coarse (CS) medium (MS) fine (FS) and very fine sand (VFS)
by passing through nested sieves of mesh numbers 18 35 60 and 150
respectively The fraction passing the 150-mesh sieves was collected
31
on absorbant paper All sand fractions were then determined gravishy
metrically
Aliquots of 25 ml of the silt+ clay suspension were
taken by the pipette method from the liter cylinders made up to 1000 ml
volume Aliquots were taken at various times corresponding to
sedimentation times of particles of 20 10 5 and 2 micro in diameter
A Calgon blank was taken with each series of soils tested Textural
class names were designated according to the USDA textural triangle
(Figure 7) In some cases the determination was repeated to achieve a
clearcut textural designation When two different textures were deshy
termined both textural designations were given
c Supplemental color coding by size fraction
In the process of separating the whole soil into sand
silt and clay fractions for mineralogical analysis it was observed
that samples of soil from disparate profiles often appeared similar in
color when grouped into similar particle size classes Munsell color
code comparisons were therefore made of samples after they had been
grouped into size separates Comparisons among silt and clay
separates were made on wet paste which had been collected in 50 ml
centrifuge tubes Sands were powdered with mortar and pestle passed
through a 200-mesh sieve then wetted before the color comparisons
were made
4 Soil Chemical Analyses
The lack of data on Ujung Kulon soils dictated that several fundashy
mental determinations of nutrient status be conducted Modifications
32
as seemed warranted were made to increase the precision in the
physical conduct of the determinations or to enhance the applicashy
bility of the results This latter point was especially true in
regard to the determination of cation exchange capacity CEC
By universal standards the pH of the extracting solution in the
B NH40Ac method (Chapman 1965) is adjusted with either ammonium
hydroxide NH40H or acetic acid to a pH of 70 The CEC is then
determined by titration of excess NH3+ ions which are displaced from
the exchange complex by designated replacement ions Other basic
ions including calcium (Ca++) magnesium (Hg++) potassium (K+)
and sodium (Na+) were concurrently leached from the exchange sites
and determined separately as milliequivalents per 100 g of soil
++ ++ + -I-(meq100 g) The sum of the Ca Mg K and Na in meg100 g
divided by the CEC also expressed in meq100 g is commonly known as
percentage base saturation BS More fully the expression is
BS =ca+++ Mg+++ K+ + Na+ x 100 (3) CEC
Current classification of soils depends in part on both CEC
and BS derived by B NH40Ac extraction at pH 7 in most cases
Yet Tamimi et al (1972) and Uchida (1973) have found that CEC
changes if the NH40Ac is not at pH 7 If the pH of the soil surroundshy
ing plant roots is other than pH 7 they reasoned then the CEC would
likewise differ accordingly Solubility and uptake of nutrients in
the soil are affected by the soil pH accordingly the exchangeable
cations and CEC should be determined at the soil pH and not at pH 7
Uchida (1973) determined that exchangeable bases did not differ
33
significantly between extraction at pH 7 or at soil pH for soils with
pH - dependent charge Soils with pH - dependent charges can be
recognized by either increase or decrease (~ pH) in pH that occurs
between measurement of the hydrogen ion activity in water vs its
activity in N unbuffered KCl Keng and Uehara (1973) illustrated
that a soil material possesses a net negative charge when the pH in
N KCl is more acid than the pH in water In this study CEC was deshy
termined with~ NH40Ac at pH 7 and with NH40Ac adjusted to the pH
of the soil The BS however was determined only on those
samples whose cations were also extracted at soil pH -- the latter
technique
a Cation exchange capacity
1 ~ NH40Ac adjusted to soil pH
Freshly air-dried 1000 g (oven-dried basis) soil
samples passing a 20-mesh sieve were shaken intermittantly with 200
ml of N NH40Ac which had been adjusted to the soil pH (plusmn 001 pH
unit) After 24 hours the solution was filtered through ff6 filter
paper in a 70 mm Buchner funnel with suction into a 500 ml Erlenmeyer
flask Four successive leachings with the above N NH40Ac in 50 ml
aliquots were collected in labeled flasks whose contents were later
analyzed for exchangeable bases
A clean suction flask was attached and 15-20 ml of the
NH40Ac were added to the leached soil The presence of Ca in the
leachate was checked by adding a few drops of 1 ~ NH4Cl 10 ammonium
oxalate and dilute NH40H to ca 10 ml of the leachate in a Pyrex test
34
--middot tube as described by Chapman (1965) Upon heating to near the boilshy
ing point the presence of Ca was indicated by turbidity or by a
white precipitate All soils from sites 3 and 8 showed positive
Ca tests but additional leaching with NH40k failed to result in
calcium depletion from the soil All samples from other sites showed
negative Ca tests
Three further leachings with 50 ml aliquots of N NHCl - 4
and once with 025 li_ NH4Cl were followed by 200 ml of 99 isopropyl
alcohol in successive 50 ml aliquots A test for chloride was made
by adding a few drops of 010 N silver nitrate (AgN0 ) in a test tube3
containing ca 10 ml of the leachate The presence of chloride
was indicated by a white precipitate None was detected
The washed soil was transferred to another flask and
shaken for 30 minutes with 200 ml of 4 KCl and filtered An additional
200 ml KCl was added in 50 ml aliquots then the leachate
was made up to 500 ml volume with KCl A 100 ml aliquot was transshy
ferred to a Kjeldahl flask to which was added 25 ml of 50 NaOH and
a few pieces of zinc A reagent blank was also prepared for
distillation on the Kjeldahl apparatus About 60 ml of distillate
was collected in 100 ml of 3 boric acid and 10 drops of bromocresol
green-methyl red mixed indicator The distillate containing NH4+ ions
was then titrated with 0038 li_ H2so4 CEC of the soil was determined
by the formula
CEC(meqlOO g) = ml of H2so4 x li_ of H2so4 x 10 x 5 (4)
35
2 CEC with i NH 40Ac at pH 7
The procedure used was similar to the one above however
no test for Ca or Cl was made The procedure was carried out primarishy
ly to establish a CEC based on saturating the soil with N NH40Ac at pH
7 -- the standard method used in soil classification work There were
wide discrepancies between the results using the two procedures
Since no cations were determined in the leachate of the pH 7 extracshy
tant calculation of the BS and pertinant discussions were preshy
cluded and such information was limited to Ntl40Ac extraction at soil
pH
b Exchangeable bases
The filtered NH40Ac extract that was made up to a volume
of 500 ml with NH40~ adjusted to soil pH was used for Ca Mg Kand
Na determinations Ca Mg and K were analyzed along with approshy
priate standard solutions and reagent blanks using a Perkin-Elmer
Model 303 atomic absorption spectrophotometer Sodium was determined
with a Beckman DU flame spectrophotometer
c Organic carbon
The Walkley-Black method (Walkley and Black 1934) was
used but further modified in this study when it was observed that the
prescribed volumes of potassium dichromate K2Crz07 were consumed beshy
fore a titration end point was reached Accordingly 20 ml of N
K2Cr207 was used instead of 10 ml as prescribed Ten ml of 85 phosshy
phoric acid were also used
3
36
Due to their proximity to sea water and salt spray when
in situ the surface soils of sites 1 4 and 8 were tested with AgN0
for the presence of chloride ion before beginning the experiment
All tests for chloride were negative A 1000 g sample of soil
passing a 100-mesh sieve was used in the determination Organic matter
content was also estimated by using OM = OC X 1724 as disshy
cussed by Jackson (1958)
d Carbonate
A semi-quantitative determination of the presence of
carbonates in the soil was made by saturating small amounts of soil
with 4 N HCl Carbonates when found in significant amounts are
mainly associated with calcium in marl limestone or coral deposits
with all forms being chemically the same -- calcium carbonate Caco 3
Only the soils of sites 3 and 8 showed consistantly
moderate to strong effervesence and were threfore the only samples
chosen for quantitative co 3-c determination Weak effervesence of
samples 1-lC and 2-1B22t was noted but this was attributed to lack
of precision in the method since the other horizons represented in
those sites showed negative tests
The method described by the US Soil Salinity Laborashy
tory (Allison and Moodie 1965) for determining co -c was attempted3
In that method 05 N HCl was titrated against 025 N NaOH with 1
phenolphthalein in 60 ethanol as an indicator Due to probable
precipitation of iron as the pH changed all samples became turbid
Also the end point could not be detected with phenolphthalein as an
indicator Better results were obtained with the Piper (1942) rapid
37
middot-middot-middot -middotmiddotmiddot -~--------------
titration technique which called for 1 M HCl and 1 M NaOH and
bromthymol blue as an indicator Despite a caution in the method
that water soluble carbonates must be accounted for in interpreting
the experimental results no water soluble carbonates could be
detected in selected samples Repeated titrations with blanks of
standardized reagents demonstrated however that the test was very
sensitive -- sharp equivalence points being repeatedly attained
withinplusmn 005 ml of titer
e Total nitrogen
Two grams of freshly air-dried soil passing through a
100-mesh sieve were analyzed for total nitrogen content by the
Kjeldahl method The collected distillate was titrated with 0038 N
H2so4 and the content of nitrogen was expressed in percent by the
formula
ml middot x N of d x O 014titer - aci N=---------------- X 100 (5)g of OD soil
Reagent blanks were also prepared and titrated Carbon-nitrogen
ratios were computed using the results of determinations of OC
and total N
f Extractable phosphorus
Two grams of 20-mesh soil were extracted with 200 ml of
002 N H2so4 which had 03 ammonium sulfate (NH4) 2so4 in a modified
Truog (Ayers and Hagihara 1952) method Aliquots of 25 ml of the
centrifuged extract were made up to 50 ml volume by adding 2 ml of
freshly prepared sulfomolybdate extracting solution and a few drops
38
of stannous chloride (SnClz) in a sequence which included the addition
of ca 5 ml of water after each reagent
The samples were analyzed colorimetrically using a Coleshy
man Jr colorimeter at wavelength of 600 mmicro In some cases 10 ml
aliquots were used in lieu of 25 ml aliquots if absorbance was beyond
the range of the standards used
g Water-soluble silicon
Although silicon is not an essential element for plant
nutrition the high content of SiOz in the ash and tuff of the
Krakatau eruption may have altered the SiOz content of the soil in
important ways Significant differences in the amount of watershy
soluble silicon particularly in the tuff layer among sites might be
taken as one index of physico-chemical change resulting from differshy
ences in relief rainfall or biotic factors
Three grams of lt20-mesh soil were shaken continuously for
4 hours in a stoppered flask with 30 ml of H2o according to the
method of Fox~ al (1967) After centrifuging at high speed 10
ml aliquots were made up to 50 ml volume with 1 ml of disodium sulshy
fite Na 2S03 sodium bisulfate + H2S04 reducing solution and water
Silicon content was analyzed colorimetrically at 600 mmicro with a Coleman
Jr colorimeter Results were expressed as ppm in solution
h Other chemical analyses
Exchangeable manganese Mn was detennined with the atomic
absorption spectrophotometer from the N ~H 40Ac extract used for
39
determining Ca K Mg and Na
The results were taken from a standard curve of values charted on
log-log graph paper
The effects of fumigation partial drying or prolonged storage
of samples on soil pH were checked by comparison of pH readings with
those obtained in Indonesia No major changes were noted
5 Mineralogical Analyses
a The soils were separated into sand silt and clay fractions
Sands were collected on a 325-mesh sieve Clay was separated from
silt after washing through the sieve either by pipetting the susshy
pended clay from a glass cylinder after overnight sedimentation or
by decanting off after being centrifuged at 750 rpm for more than 3
minutes Attempts were made to minimize the clay contamination of the
silt fraction by stirring and centrifuging silt samples and decanting
off the clay Due to insufficient clay content in the soils of sites
4 and 8 no attempt was made to separate silt from the clay in those
samples Also due to insufficient soil no silt+ clay separation of
sample 8-lCll was conducted
b A few grams of unseparated silt+ clay for total elemental
analysis were collected from the cylinders The samples were centrishy
fuged at high speed then dried at 70deg C before other total analysis
preparations were made as described below Whole soil samples of
1-lC 3-4C 5-lC and 6-lC were also prepared for total analysis by
crushing air-dried samples with mortar and pestle and passing the
samples through a 200-mesh sieve
In preparation for X-ray diffraction (XRD) studies the silt
40
and clay fractions were divided into two lots one was saturated with
_i KCl and the other with _i MgC1 2 After three centrifuge runs with
the saturating salts followed by three more runs with water the
supernatant was checked for chloride ion with _i AgN03 Further washshy
ing was conducted as needed Air-dried sand samples were powdered
with mortar and pestle and passed through a 200-mesh sieve
A Phillips X-ray diffractometer using copper K-a radiation with
wavelength A= 15418 A was used Xg-saturated wet paste samples of
both silt and clay on glass slides were prepared and analyzed from
2deg 28 to 64deg 28 goniometer reading Mg-saturated ethylene glycol
solvated samples were traced from 20 2S to 160 26 K-saturated silt
and clay samples were analyzed from 2deg 28 to 16deg 29 after heating
for over two hours at temperatures of 110deg C 300deg C and 525deg C
Untreated powder samples (sand) were prepared in slotted aluminum
slides and traced from 16deg 28 to 64deg 26
Total Oxide Analyses
Sufficient sample (about 5 g) of silt+ clay was oven-dried to
110deg C Exactly 0500 g of the OD soil was blended with 1500 g of
lithium tetraborate (Li2B4o7) and fused in a furnace at 1000deg C for
about one hour The fused pellets were then ground and pressed into
wafers for total oxides analyses by an Applied Research Laboratories
Model 72000 X-ray quantometer
Due to the large discrepancies in loss of weight on ignition
(LOI) determination among some samples the quantometer results were
recalculated on an ignited basis No Na 2o readings were obtained
41
because the tube with Na wavelength was not in operation Also all
results totaled more than 100 due to positive deviation from the
regression equations used in calibration of quantometer standard
samples
In addition to the regular samples whole soil samples from
1-lC 3-4C 5-lC and 6-lC were also analyzed by the quantometer
42
RESULTS
Vegetation
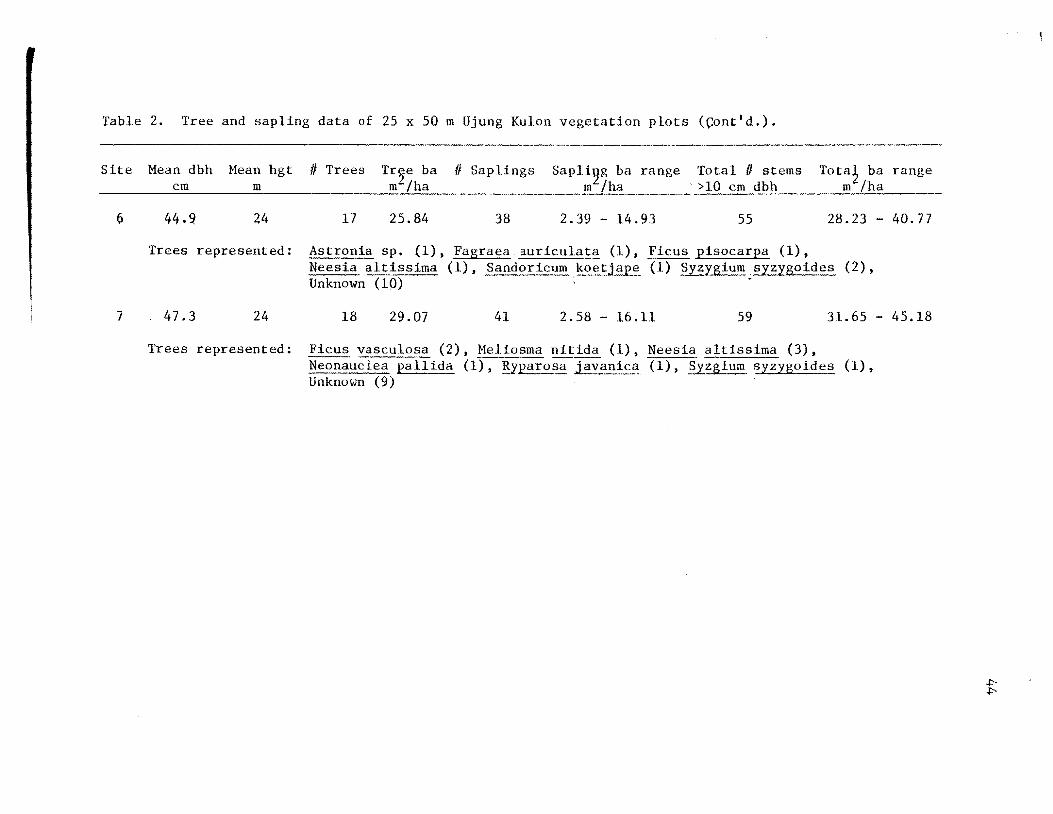
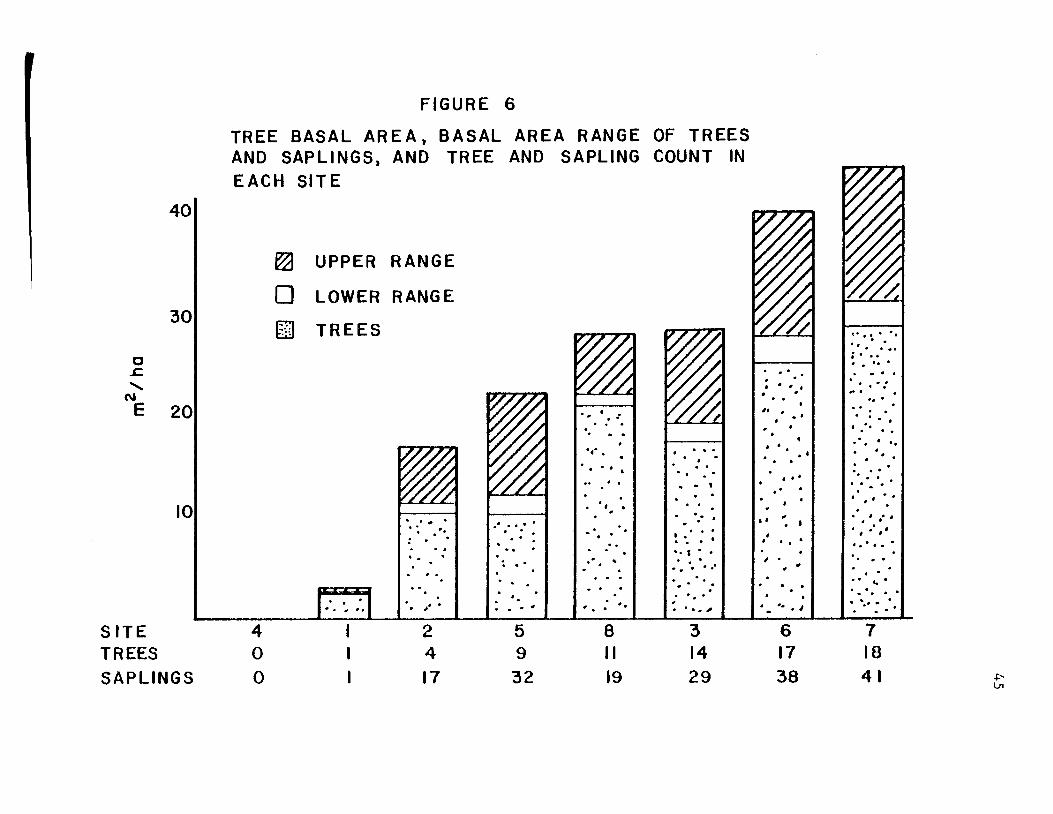
The data in Table 2 summarize the counts of trees and saplings
the mean diameter at breast height (dbh) of trees basal area (ba)
of trees ba range of saplings (from a minimum of 10 cm dbh to a
maximum of 25 cm dbh) and total ba range of both trees and saplings
Because precise dbh of saplings was not measured both lower and upper
ba range is given Table 2 is arranged in order of ascending ba upper
range Comparisons of tree ba between sites and range of total ba of
trees and saplings are shown in Figure 6
The great range in ba among forested sites reaching a maximum
of 452 m2ha in site 7 indicates a very heterogeneous forest in ung
Kulon Inasmuch as basal area utilizes stem diameter at 137 m above
the ground those sites which were composed of primarily grassy or
herbaceous vegetation (sites 4 and 1 respectively) yielded little
information It was necessary therefore to supplement the withinshy
site data with descriptions of the understory species and their feashy
tures also to include some general descriptions of physiognomic
features outside the sites Accordingly a more complete listing of
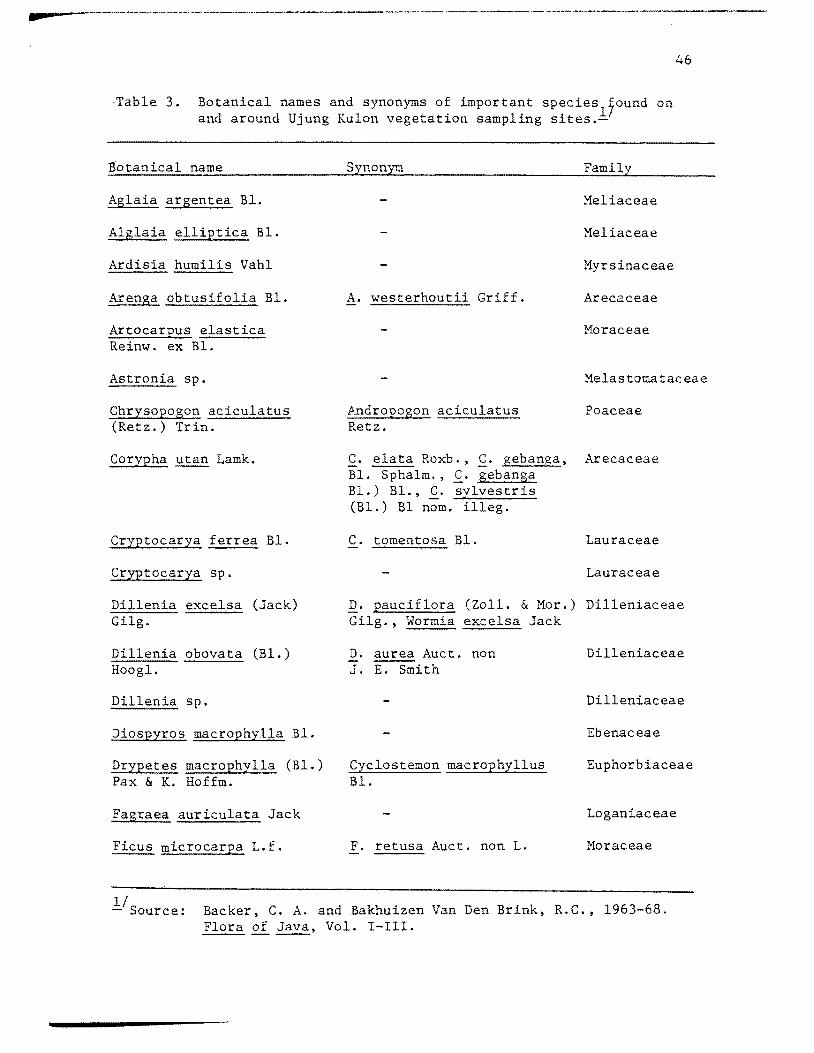
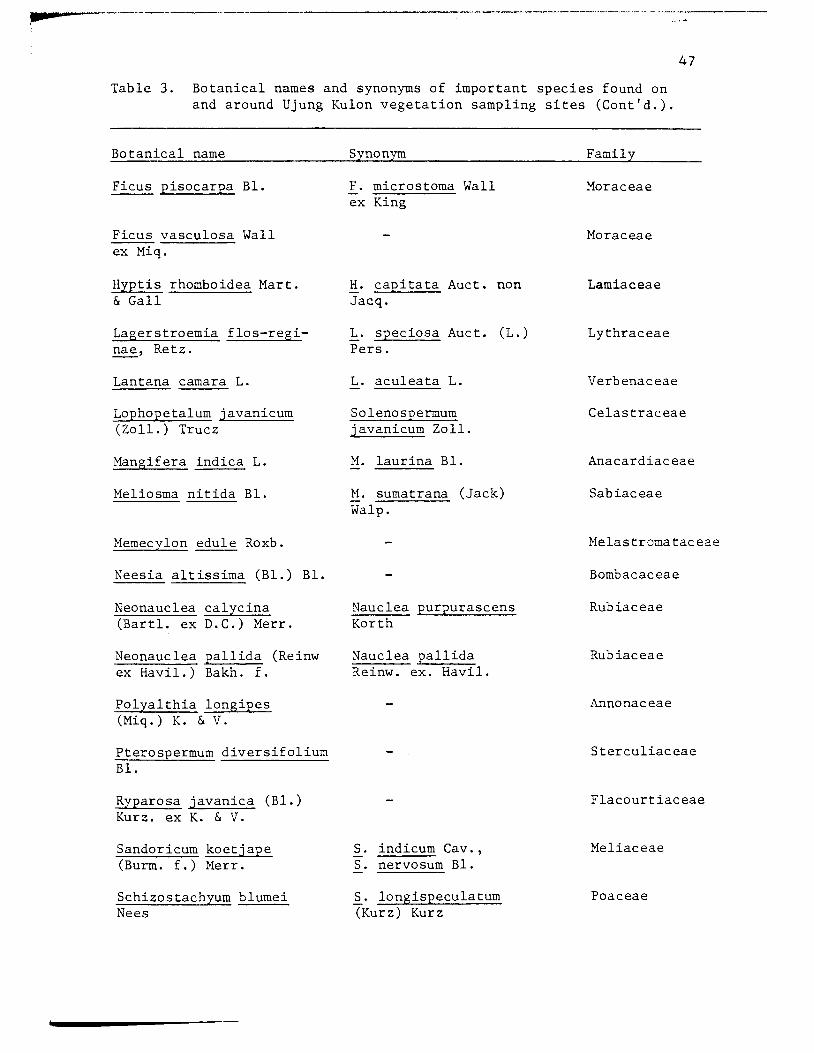
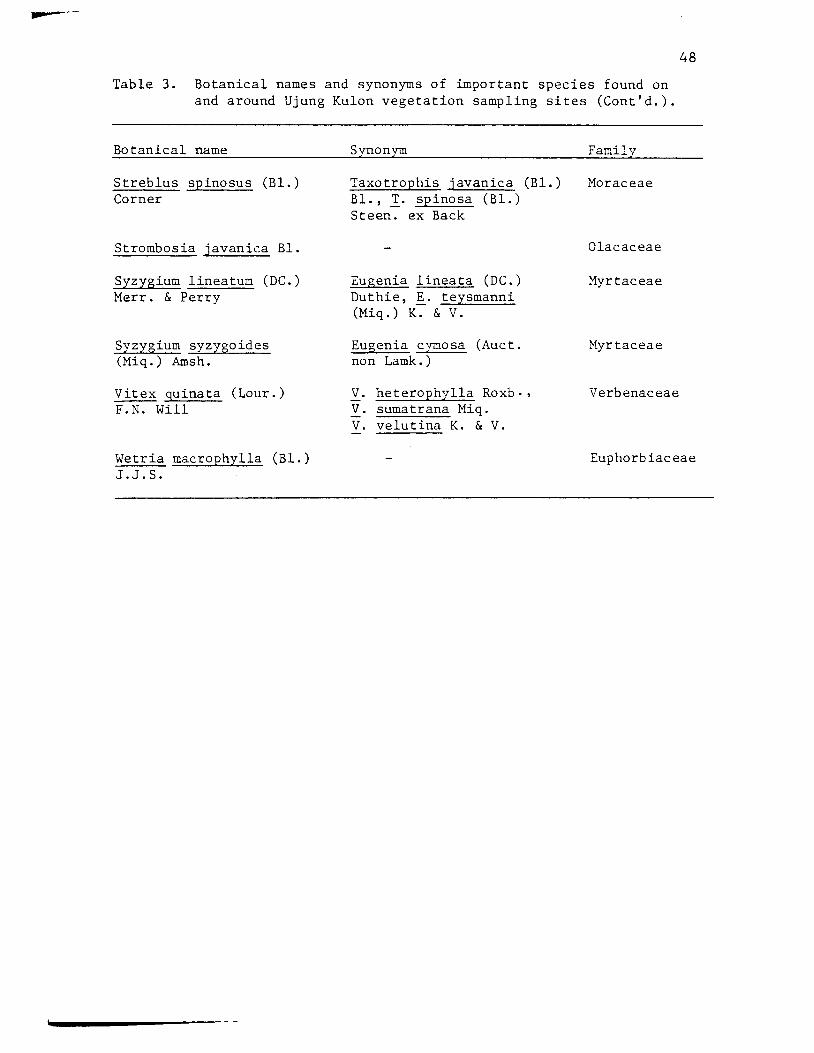
vegetation found on and around the sites is given in Table 3 To
facilitate identification their synonyms are also given
Description of Vegetation Sites
One criterion for selection of sites 1 3 4 and 5 which were
not on the N 45deg E transect was the apparent internal homogeneity of
vegetation exhibited therein Gerard (1965) noted that such homoshy
geneous entities are often dissected from their surroundings and may be
Table 2 Tree and sapling data of 25 x 50 m Ujung Kulon vegetation plots
Site Mean dbh Mean hgt ti Trees Tree ba ti Saplings Sapling ba range Total ti stems Total ba range cm m m2ha m2ha gt10 cm dbh m2ha
4 a a
1 670 10
Trees represented
2 602 19
Trees represented
5 406 22
Trees represented
8 538 18
Trees represented
3 409 28
Trees represented
0 a 0 a 0 a
1 282 1 006 - 039 2 288 - 321
Corypha utan (1)
4 1066 17 107 - 668 21 11 73 - 1734
Arenga obtusifolia (1) Artocarpus elastica (2) Dillenia excelsa (1)
9 1036 32 201 - 1258 41 1237 - 2294
Diospyros macrophylla (1) Drypetes macrophylla (5) Mangifera indica (1) Memecylon edule (1) Pterospernum diversifolium (1)
11 21 30 19 120 - 747 30 2250-2877
Corypha ~tan (8) Neonauclea calcinia (2) Vitex quinata (1)
14 1774 29 182 - 1140 43 1956 - 2914
Aglaia argentia (2) Aglaia elliptica (1) Cryptocarya sp (2) Cryptocarya ferrea (1) Dillenia sp (1) Lophopetalum javanicum (1) Polyalthea longipes (1) Strombosia ~vanica (1) Syzygfom lineatum (1) Wetria macrophylla (3)
a - no trees or saplings
Table 2 Tree and sapling data of 25 x 50 m Ujung Kulon vegetation plots (Contd)
Site Mean dbh Mean hgt Trees Tr2e ba II Saplings Sapliog ha range Total II stems Tota~ ba range cm m m ha m1 ha gt10 cm dbh m ha
6 449 24 17 2584 38 239 - 1493 55 2823 - 4077
Trees represented Astronia sp (1) Fagraea ~uriculata (1) Ficus pisocarpa (1) Neesia altissima (1) Sandoricum koetjape (1) Syzygium syzygoides (2) Unknown (10)
7 473 24 18 2907 41 258 - 1611 59 3165 - 4518
Trees represented Ficus vasculosa (2) Meliosma nitida (1) Neesia altissima (3) Neonauclea pallida (1) ~parosa javanica (1) Syzgium syzygoides (1) Unknown (9)
bullN E 20 I bull bull bull I bull I bull
I
I bull bull I
I bull bull bull 10 bullbull bull bull bull ~ I bull ~middot I -SITE 4 2 5 8 3 6 7 TREES 0 4 9 I I 14 17 18
i-SAPLINGS 0 17 32 19 29 38 4 I ln
FIGURE
TREE BASAL AREA BASAL AND SAPLINGS AND TREE
EACH SITE
40
~ UPPER RANGE
0 LOWER RANGE 30
[] TREES
0 amp
6
AREA RANGE OF TREES AND SAPLING COUNT IN
~ Ibull
I
bull bull I
46
----- ----------middotmiddotmiddotmiddotmiddot--------
Table 3 Botanical names and synonyms of important species 7ound on and around Ujung Kulon vegetation sampling sitesl
Botanical name Synonym Family
Aglaia argentea Bl
Alglaia elliptica Bl
Ardisia humilis Vahl
Arenga obtusifolia Bl
Artocarpus elastica Reinw ex Bl
Astronia sp
Chrysopogon aciculatus (Retz) Trin
Corypha ~ Lamk
Cryptocarya ferrea Bl
Cryptocarya sp
Gilg
Dillenia obovata (Bl) Hoogl
sp
Diospyros macrophylla Bl
Drypetes macrophylla (Bl) Pax amp K Hoffm
Meliaceae
Meliaceae
Myrsinaceae
A westerhoutii Griff Arecaceae
Moraceae
Melastomataceae
Andropogon aciculatus Poaceae Retz
C elata Roxb gebanga Arecaceae Bl Sphalm gebanga Bl) Bl _g_ sylvestris (Bl) Bl nom illeg
C tomentosa Bl Lauraceae
Lauraceae
D pauciflora (Zoll amp Mor) Dilleniaceae Gilg Wormia Jack
D aurea Auct non Dilleniaceae J E Smith
Dilleniaceae
Ebenaceae
Cyclostemon macrophyllus Euphorbiaceae Bl
Loganiaceae
F retusa Auct non L Moraceae
1- Source Backer C A and Bakhuizen Van Den Brink RC 1963-68 Flora of Java Vol I-III
47
-----middot------middotmiddot---
Table 3 Botanical names and synonyms of important species found on and around Ujung Kulon vegetation sampling sites (Contd)
Botanical name Synonym Family
Ficus pisocarpa Bl
Ficus vasculosa Wall ex Miq
Hyptis rhomboidea Mart amp Gall
Lagerstroemia flos-regishynae Retz
Lantana camara L
Lophopetalum javanicum (Zoll) Trucz
Mangifera indica L
Meliosma nitida Bl
Memecylon edule Roxb
Neesia altissima (Bl) Bl
Neonauclea calycina (Bartl ex DC) Merr
Neonauclea pallida (Reinw ex Havil) Bakh f
Polyalthia longipes (Miq) K amp V
Pterospermum diversifolium Bl
Ryparosa javanica (Bl) Kurz ex K amp V
Sandoricum koetjape (Burm f) Merr
Schizostachyum blumei Nees
F microstoma Wall ex King
middot capitata Auct non Jacq
_ speciosa Auct (L) Pers
L aculeata L
Solenospermum j avanicum Zoll
M laurina Bl
M sumatrana (Jack) Walp
Nauclea purpurascens Korth
Nauclea pallida Reinw ex Havil
S indicum Cav S nervosum Bl
S longispeculatum (Kurz) Kurz
Moraceae
Moraceae
Lamiaceae
Lythraceae
Verbenaceae
Celastraceae
Anacardiaceae
Sabiaceae
Melastromataceae
Bombacaceae
Rubiaceae
Rubiaceae
Annonaceae
Sterculiaceae
Flacourtiaceae
Meliaceae
Poaceae
48
Table 3 Botanical names and synonyms of important species found on and around Ujung Kulon vegetation sampling sites (Contd)
Botanical name Synonym Family
Streblus spinosus (Bl) Corner
Strombosia javanica Bl
Syzygium lineatum (DC) Merr amp Perry
Syzygium syzygoides (Miq) Amsh
Vitex quinata (Lour) FN Will
Wetria macrophylla (Bl) JJS
Taxotrophis javanica (Bl) Bl _I spinosa (Bl) Steen ex Back
Eugenia lineata (DC) Duthie~- teysmanni (Miq) K amp V
Eugenia cymosa (Auct non Lamk)
V heterophylla Roxbmiddot V sumatrana Miq V velutina K amp V
Moraceae
Olacaceae
Myrtaceae
Myrtaceae
Verbenaceae
Euphorbiaceae
49
variously described as stands samples communities or associations
Sites 1 3 4 and 5 then were selected as examples of salient
associations within the forest Sites 2 6 7 and 8 represent preshy
selected sites without regard to the vegetation association they may
have represented
Site 4 Cidaun
On the low end of the tree biomass scale site 4 was chosen as
representative of a grazing ground of the banteng Bos javanicus
javanicus Since the site center was chosen at random it was only
coincidental that the site contained no trees or saplings Scattered
trees do exist those of Dillenia obovata being favored in management
practices because the soft fruits are eaten by the animals Heavy
grazing by the banteng and other animals restricts the growth of
vegetation to mostly grasses Chrysopogon being the chief
one Also found are seasonal aquatic plants like Hyptis rhomboidea
which grows in shallow depressions with a high water table during the
rainy season The basal area of an alternate but typical grazing ground
site (not described) was 068 m2ha and restricted to only trees and
saplings able to withstand the grazing pressure
Site 1 Cibunar
The area along the coast east of Cibunar is also an abandoned
banteng grazing ground but it is not maintained in the same manner
as the grazing ground at Cidaun Consequently a primary successional
growth of chest-high
only an occasional Corypha or Arenga palm emerging through the under-
50
growth The Lantana effectively inhibits the establishment of shade
intolerant species Occasional grassy patches are connected by
narrow game trails Toward the inland periphery of the narrow sandshy
stone plateau on which site 1 is located the Lantana gives way to
nearly pure stands of obtusifolia the most common palm found
in lowland Ujung Kulon (Dransfield unpublished) The Arenga are
associated with deeper soils where they occur just north of the site
Site 2 Cikendeng
Located astride two minor drainages site 2 is unique among the
sites studied as the only one containing a bamboo stand Nearly the
entire understory is dominated by the bamboo Schizostachyum
which grows horizontally in some places excluding light and all other
forms of vegetation Although bamboo thickets are found elsewhere in
Ujung Kulon they are not commonplace and may be seen along ridges as
well as along stream beds
The low basal area in site 2 is the result of a bamboo stand in
contact with another forest association in which Artocarpus
and Arenga obtusifolia are well represented Although Artocarpus is
quite common in the lowland flats of Ujung Kulon the only two
representatives recorded were found on site 2 belying its actual
frequency of occurrence Another tree typical of the flats is
Lagerstroemia flos-reginae but it was not found on any of the sample
sites
51
Site 5 Cankeuteuk
The basal area range of site 5 is rather broad A fuller lower
canopy of saplings in site 5 makes a difference in stocking of this
site If upper ba range of saplings were added to the measured ba
of trees in site 5 and lower ba range of saplings in site 8 were comshy
pared the total ba would be about the same -- 229 m2ha in site 5
2and 225 m ha in site 8 The high frequency of the small diameter
Ardisia humilis in site 8 tends to skew the mean ba toward the lower
end of the range there The common Arenga palm in site 5 tends to skew
the range toward the higher end of the scale Of 32 saplings counted
in site 5 10 were Arenga Because the monocotyledonous palms have
considerable diameter when they achieve sufficient height to be counted
at dbh they measure closer to 25 cm dbh than to 10 cm dbh
The high frequency of Arenga in the lowlands of Ujung Kulon has
an effect which is not evident in the limited vegetation site data in
this study As Schenkel and Schenkel-Hulliger (1967) put it These
palms are responsible for such poor light conditions in the lower
stratum that no saplings can grow apart from young Arenga
Accordingly the inter-species relationships are a necessary part of
the site descriptions Tree andor sapling number and size alone
cannot adequately describe the overall physiognomy of the forest
Except for the Arenga palm no tree species found in site 5 was
also found in other sites The several Drypetes macrophylla contrishy
buted the greatest to ba with 5 of the 9 trees representing 60 of
the ba of all the trees Drypetes was also well represented in the
sapling and pre-sapling categories although the short stout and
52
barbed Streblus spinosus is so dense in places that passage through
the lowest canopy required cutting a tunnel
A single representative of Diospyros macrophylla was recorded
yet this species is found extensively in uplands and in lowlands that
are not subjected to flooding
Site 8 Cikarang
The canopy of the seasonal swamps in the northeastern section of
Ujung Kulon is singularly dominated by the palmate fronds of the
Corypha utan Few species are found here that grow tall enough to
even be considered as co-dominants of Corypha The tallest of the
competitors in the sample site Neonauclea calycina and Vitex quinata
approach the shortest Corypha in height but are spatially separated
so that the Corypha have no restrictive influence over their growth
Corypha trees along constitute 74-95 of the ba and number 8 of the
11 trees in the site
The vast majority of the middle canopy is composed of Ardisia
humilis trees and saplings Because Ardisia is so widespread in the
vast seasonal swamplands of the Northeast but does not often achieve
large diameter more saplings than trees were counted The ba distrishy
bution consequently is likely to be skewed toward the lower end of
the range
It is probable that the Corypha-Ardisia association is one of the
largest in Ujung Kulon although most of the evidence results from
empirical observations rather than sample plot data Inasmuch as the
northeast side was subjected to direct inundation by the 1883 tidal
waves (Hoogerwerf 1970) it is presumed that the entire association
53
is largely post-successional dating from that time High soil pH
(about 81) and thick tuffaceous layers in the area also contribute
to the formation of the essentially edaphic mosaic with few species
present
Site 3 G Telanca
The species complexity of trees in site 3 is more evident than
for any other site by virtue of the more complete identification of
its tree representatives Ten taxa were identified by genus andor
species and numerous unidentified saplings add to the complexity
index of the site Basal area of site 3 is nearly double that of
site 2 although both are inland forest sites only a few kilometers
apart and relatively undisturbed by animal grazing Heights of the
tallest trees Syzygium lineatum Lophopetalum javanicum and
Cryptocarya ~- at 39 37 and 32 m respectively are comparabe to
the 38-40 m heights and 20-30 m average overstory heights of the
trees studied on nearby P Peucang (SEAMEO BIOTROP 1972)
Site 6 G Pajung
Located in one of the remotest sections of Ujung Kulon the
G Pajung massif has been little influenced by man and not at all by
tidal waves The elevation of site 6 contributes to the increased
1complexity index CI = 10-3 (hbds) after Holdridge (1967) h = hgt of 3 tallest trees in m for 110 ha plot b = ba in sq m for trees over 10 cm dbh for 110 ha plot d = number of tree stems over 10 cm dbh for 110 ha plot s = number of species of trees over 10 cm dbh for 110 ha plot
54
rainfall there which is presumed to be the highest in Ujung Kulon
The apparent disagreement between Boerema (1925) and Hoogerwerf (1970)
in regard to the amount of rainfall east and west of the summit notwithshy
standing this author agrees with the latter that more rainfall
occurs on the western side Orographic uplift on the windward side
at least during the rainy season seems to result in greater rain-
fall on the western slopes
In site 6 the vegetation is considered as primary and an example
of the favorable composition noted by Hoogerwerf (1970) in the
Pajung Range Only two trees exceeded 80 cm in dbh however The
mean height of trees was only 242 m with the tallest dominants of
41 39 and 38 m comparable with the heights of trees on low-lying
P Peucang
The ba range of saplings is thought to be normally distributed
here since no Arenga palms were encountered Dransfield (unpublished)
noted that Arenga is not found at elevations over 150 m On the
basis of normal distribution of saplings the mean ba of site 6 would be
731 m2ha for saplings combined with measured tree ba giving a
mean total of 3315 m2h~ This is about the 145 sq ftA (3329
m2ha) of ba attained by a primary tropical high forest under favorshy
able conditions as cited by Dawkins (1959)
Site 7 Guhamasigit
On the western slope of the G Pajung massif the Guhamasigit
site has rainfall which approaches that found on top of G Pajung
From the ba data and the number of trees found in the site it appears
that the complexity of the site exceeds all others investigated
55
Nevertheless mean height and dbh did not vary appreciably from the
values found in site 6
Only one tree is outstandingly large an unknown with a dbh of
102 cm and a height of 30 m The penultimate diameter is only 70 cm
dbh Mean tree height in site 7 is only slightly less than that found
in site 6 Both sites are completely within a large upland high
forest community and both would probably be mapped as identical
units on any large scale vegetation map
Sites 6 and 7 resemble each other in volume of stems length of
boles and the type of understory vegetation which is lacking in
Arenga palm Some of the tree and sapling species which occur in
site 6 also occur in site 7 including Neesia
Syzygium syzygoides ~he data are too scanty to make close comparisons
but it is safe to say that whereas all the other sites investigated
are notable for the heterogeneity among them sites 6 and 7 exhibit
several homogeneous physiognomic features
Soils
Data on soil profiles of Ujung Kulon soils are presented in
Tables 4-11 Verification of textural designation by particle size
distribution is given in Table 12
Depth of solum varied from a minimum of 72 cm in 1-1 to well over
the maximum depth limit adopted for convenience of 150 cm in 2-1
5-1 6-1 and 6-2 In sites 4 and 8 the sampling depth was limited
by the water table Bedrock R in site 1 appeared to be sandstone
in site 3 a marl in site San unconsolidated conglomerate containing
dissimilar rocks and in site 7 a soft pink-gray saprolitic siltstone
Table 4 Ujung Kulon Field soil description Site 1
Location Cibunar PARENT MATERIAL Sandstone Volcanic Tuff Relief Simple PHYSIOGRAPHY Level coastal terrace
DRAINAGE Excessive ELEVATION 25 m SLOPE 0-2 EROSION Moderate
Horizon Depth Color Texture Structure Stickiness Boundary (cm) (moist) (apparent) plasticity
A 0-7 Dark brown 7SYR 44
Loamy sand Medium crumb strong Non non
sticky plastic
Very abrupt irregular and discontinuous
I
C 7-15 Olive grey SY 52
Sand Fine granular moderate
Non non
sticky plastic
Very abrupt irregular discontinuous
IIC 15-72 Dark yellowish brown lOYR 34
Loamy sand Very weak
fine granular Non non
sticky plastic
Very abrupt
R 72+
A 0-10 Dark yellowish Loamy sand Medium crumb strong Non sticky brown lOYR 44 non plastic
C 10-15 Pale olive Sand Fine granular Non sticky SY 63 moderate non plastic
llC 15-62 Dark yellowish Loamy sand Very fine granular Non sticky brown lOYR 3 4 weak non plastic
R 62+
Very abrupt irregular discontinuous
Very abrupt irregular discontinuous
Very abrupt
V1 ------------------------------------------middot-middot --- ------middot --------------- ----------------- ------- ------ ----------- ------------------
Table 5 Ujung Kulon field soil description Site 2
Location Cikendeng PARENT MATERIAL Sedimentary rock
Relief Complex PHYSIOGRAPHY Hilly lowland DRAINAGE Imperfect ELEVATION 25 m SLOPE 15 EROSION V severe
Horizon Depth Color Texture Structure Stickiness Boundary (cm) (moist) (apparent) plasticity
A 0-13 Gray 25YR 50 Silt loam Medium crumb Slightly sticky moderate slightly plastic
B22 13-71 Brown lOYR 53 Silty clay Very fine sub Slightly sticky angular blocky plastic
r-1 I moderate
N
B22t 71-150+ Pale brown iOYR Clay Medium platy Slightly sticky 63 with 15 slightly plastic yellowish red 5YR 58 mottles
Gradual irregular
Clear
All 0-3
Al2 3-9
C 9-12 -t I
N
IIC 12+
Very dark gray 5YR 31
Silt loam
Dark brown to brown lOYR 43
Silt loam
Brown lOYR 53 Loamy sand
Yellowish brown lOYR 58
Silt
Medium crumb moderate
Medium crumb moderate
Medium granushylar weak
Fine sub angushylar blocky
Non sticky non plastic
Non sticky non plastic
Non sticky non plastic
Slightly sticky slightly plastic
Abrupt
Clear irshyregular
Clear ir regular
IJI---------------------------middot--middot----------------middot---------
-----------------------------
Table 6 Ujung Kulon field soil description Site 3
Location Telanca PARENT MATERIAL Marl volcanic tuff Relief Complex PHYSIOGRAPHY Mountainous upland
DRAINAGE Excessive ELEVATION 25-30 m SLOPE 25 EROSION Slight
Horizon Depth Color Texture Structure Stickiness Boundary (cm) (moist) (apparent) plasticity
All 0-4 Very dark brown Silty loam Coarse crumb Slightly sticky Clear lOYR 22 moderate slightly plastic irregular
Al2 4-10 Dark brown Silty loam Coarse crumb Slightly sticky Abrupt irregular lOYR 33 moderate slightly plastic discontinuous
-i C 10-13 Olive SY 53 Loamy sand Medium granushy Non sticky Abrupt irregular (I) I lar weak non plastic discontinuous
IIC 13-95 Dark brown to Clay loam Medium crumb Sticky brown lOYR li3 moderate plastic
R 95+
All
Al2
-j
I (I)
C
IIC
R
0-5
5-15
15-20
20-80
80+
Black lOYR 21
Dark yellowish brown lOYR 44
Light olive gray SY 62
Dark brown lOYR 33
Silty loam
Silty loam
Fine sand
Clay loam
Coarse crumb moderate
Medium crumb moderate
Fine granular weak
Medium granular moderate
Slightly sticky non plastic
Slightly sticky slightly plastic
Non sticky non plastic
Slightly sticky slightly plastic
Abrupt
Clear irregular discontinuous
Abrupt irregular discontinuous
Ln Ol
1 l
Table 7 Ujung Kulon field soil description Site 4
Location Cidaun PARENT MATERIAL Alluvial sand volcanic tuff Relief Simple PHYSIOGRAPHY Lowland alluvial fan
DRAINAGE Poorly drained ELEVATION lt25 m SLOPE 0-2 EROSION None
Horizon Depth Color Texture Structure Stickiness Boundary (cm) (moist) (aEearent) plastic it
All 0-2 Dusky red Loamy sand Fine granular Non sticky Abrupt 25YR 32 weak non plastic
Al2 2-6 Very dark gray Loamy sand Fine granular Non sticky Abruptirregular 25YR 30 weak non plastic discontinuous
C 6-10 Reddish brown Coarse sand Coarse granular Non sticky Abruptirregular 25YR 44 single grain non sticky discontinuous
-1 IICl 10-55 Reddish brown Fine sand Fine granular Non sticky Gradual
r I 5YR 43 single grain non plastic
IIC2 55-82+ Yellowish brown Very fine Very fine granu- Non sticky lOYR 58 sand lar single non plastic
grain
All 0-2 Dusky red Loamy sand Fine granular Non sticky Abrupt 25YR 32 weak non plastic
Al2 2-10 Dark brown Loamy sand Fine granular Non sticky Abrupt 75 YR 30 weak non plastic
(I)
I r
IICl 10-70 Brown 44
75YR Fine sand Fine granular single grain
Non non
sticky plastic
Gradual
IIC2 70-110+ Yellowish red Very fine Very fine granu- Non sticky 75YR 56 sand lar single non plastic
grain
middot--------middotmiddot---middot
Table 8 Ujung Kulon field soil description Site 5
Location Relief
Cankeuteuk Complex hilly
PARENT MATERIAL Mixed sedimentary and volcanic rocks PHYSIOGRAPHY Low mountain slope DRAINAGE Moderate-well ELEVATION 25-50 m SLOPE 27 EROSION Uneroded to slight
Horizon Depth (cm)
Color (moist)
Texture (aE~arent)
Structure Stickiness Elasticity
Boundary
All 0-4 Black lOYR 21
Al2 4-10 Very dark gray lOYR 31
-t I C 10-14 Olive SY 53
Lf)
IIC 14-150+ Dark gray lOYR 41
Silty loam to sandy clay loam
Silty loam
Loamy sand
Sandy clay to clay
Coarse crumb moderate
Coarse crumb moderate
Medium granu-lar weak
Fine sub angu-lar blocky firm
Slightly sticky non plastic
Slightly sticky slightly plastic
Non sticky non plastic
Slightly sticky plastic
Abrupt
Abruptirregular discontinuous
Abruptirregular discontinuous
All 0-3 Very dark brown lOYR 22
Loam Coarse crumb moderate
Slightly sticky non plastic
Abrupt
Al2 3-7 Very dark gray brown lOYR 32
Loam Medium crumb weak
Slightly sticky non plastic
Abruptirregmicrolar discontinuous
()
I Lf)
C
IIC
7-13
13-130
Gray brown 25Y 52
Dark gray brown lOYR 42
Sand
Sandy clay
Medium granu-lar weak
Fine sub angu-lar blocky firm
Non sticky non plastic
Slightly sticky plastic
Abruptirregular discontinuous
R 130+
middot---middot-----middot------
(1
0
Table 9 Ujung Kulon field soil description Site 6
Location Gunung Pajung PARENT MATERIAL Sedimentary rock Relief Complex steep PHYSIOGRAPHY Mountainous slope
DRAINAGE Mod well SLOPE 32
Horizon Depth Color Texture Structure (cm) (moist) (apparent)
All 0-2 Dark brown to Sandy loam Medium crumb brown 75YR 42 weak
Al2 2-11 Dark yellowish Loamy sand Fine crumb weak r--l brown lOYR 44 I
C 11-20 Gray to light Sand Fine crumb weak gray SY 61
IIC 20-150+ Brownish yellow Clay loam Coarse sub-lOYR 68 angular blocky
moderate
AllA12 0-5 Dark brown Silt Medium crumb lOYR 33 weak
N
5-9 Olive 5YR 54 Silty sand Fine granular
I C weak
IIC 9-150+ Brownish yellow Clay Medium sub-lOYR 68 angular blocky
moderate
tuff
ELEVATION 460 m EROSION Moderate
Stickiness Boundary plasticity
Non sticky Abrupt non plastic
Non sticky Clear wavy non plastic
Non sticky Clear disconshynon plastic tinous
Non sticky slightly plastic
Slightly sticky Abrupt disconshynon plastic tinuous
Non sticky Abrupt disconshynon plastic tinuous
Slightly sticky plastic
Table 10 Ujung Kulon field soil description Site 7
Location Relief
Guhamasigit Complex v steep
Horizon Depth (cm)
Color (moist)
-4
rmiddot
AllAl2
llC
middot 0-11 Dark brown lOYR 33
11-120 Yellowish brown lOYR 58
R 120+
PARENT MATERIAL Sedimentary rock PHYSIOGRAPHY Mountainous slope DRAINAGE Excessive ELEVATION 300 m SLOPE 52 EROSION Moderate
Texture (apparent)
Structure Stickiness plasticity
Boundary
Silt loam Medium crumb moderate
Slightly sticky slightly plastic
Gradual
Silt Medium subshy Slightly sticky Gradual angular slightly plastic blocky moderate
CJ N
Table 11 Ujung Kulon field soil description Site 8
Location Cikarang PARENT MATERIAL Marine sediments tuff Relief Nearly level PHYSIOGRAPHY Lowland swamp
DRAINAGE Poor ELEVATION lt25 m SLOPE 2 EROSION Slight
Horizon Depth Color Texture Structure Stickiness (cm) (moist) (apparent) plasticity
A 0-13 Black 5YR 21 Loamy sand Medium crumb weak Non sticky non plastic
Cll 13-23 Very dark grey Fine gravel Medium granular Non sticky brown lOYR 32 weak non plastic
Cl2 23-34 Pale brown Medium sand Medium granular Non sticky lOYR 63 weak non plastic
IICl 34-47 Olive brown Fine sand Very fine platy Non sticky 25Y 44 weak non plastic
IIC2 47-57+ Pale yellow Coaise sand Very fine platy Non sticky
A 0-13 Black 25Y Gravel to Medium granular Non sticky 20 very coarse weak non plastic
sand
IICl 13-24 Very dark grey Gravel to Medium granular Non sticky brown lOYR 32 very coarse weak non plastic
sand
IIC2 24-56+ Dark brown Medium sand Very fine platy Non sticky lOYR 33 weak non plastic
Boundary
Clear
Abrupt irregular discontinuous
Gradual
Gradual
Clear
Abrupt irregular discontinuous
64
Few soil horizons were observed Those sites where slope permits
continuous removal of both excess rain water and surface soil (sites
1 2 3 5 6 and 7) had only 3 or 4 horizons and a relatively uni-shy
form deep subsoil Differentiation of subsoil horizonation in sites
4 and 8 may reflect past changes in sedimentation deposition patterns
The precisely dated age of the C horizon (1883) obviates the
rapid rate of soil development above it Also the usually abrupt
boundary between the surface soil horizon(s) points to rapid alterashy
tion The All surface horizon when distinguished averaged 31 en in
thickness (Tables 4-11) An Al2 when visible as a separate entity
averaged 66 cm in thickness (also refer to Appendix B) The absence
of the All Al2 sequence in site 2 is thought to be due to erosion
In sites 6 and 7 the AllAl2 horizon indicates that normal All Al2
horizonation is distinguishable but due to slope effects there is
considerable soil mixing Morphological properties of the various
horizons highlight the dissimilarities of the tuffaceous C horizon in
particular
Table 12 shows that most profiles are rather loamy or sandy
Clay texture for the most part is found only in the subsoil In
site 2 the whole profjle is more clayey due perhaps to repeated
erosion of the surface layers resulting in a truncated soil The C
horizons are more finely textured than the field soil descriptions in
Tables 4-11 would indicate
Bulk density and soil moisture information are given in Table 13
With soil pores completely filled (at O cm suction) site 3 has
slightly greater percentage water volume than site 7 which has the
next highest water percentage The site 3 profile however has the
l I I
Table 12 Mean particle density pp particle size distribution and textural class designation
Site horizon
1-lA 1-lC 1-lIIC
2-lA 2-1B22 2-lB22t
3-lAll 3-1Al2 3-lC 3-lIIC
4-lAll 4-1Al2 4-lC 4-lIICl 4-1IIC2
5-lAll 5-lAll(repeat) 5-1Al2 5-lC f 5-IIC 5-1 IIC (repeat)
p-p
267 244 278
250 262 2 72
249 260 244 266
243 255 263 268 268
243 243 251 252 263 263
CSbVCSa
142 1085 399 850 1 72 1393
346 461 165 560 005 011
190 222 1 93 426
1067 490 406 364
1036 2745 203 1214 458 13 97 288 13 25 244 1393
311 1233 -------------390 1251 481 7 96 266 706 -------------
MSc
1814 986
1969
307 351 015
259 248 279 228
2491 1902 1774 1854 2087
1080 55 73 1119
752 708
3552
dFS
eVFS
21 34 776 1222 1420 1878 646
425 804 304 376 052 218
463 814 443 488 590 1210 353 438
2541 944 26 77 1644 2499 1551 2914 1360 2809 13 70
1683 1005 -------------1503 852 1439 1315 1099 930 -------------
Silt
2965 4523 2075
4672 3110 3142
44 77 3448 4745 3053
243 1722 13 70 1240 11 70
3131 2220 3218 3935 3081 2129
Clay
1084 601
1867
2986 5134 6557
3404 4755 1619 4892
00 588 951
1018 926
1557 2207 1666 1282 3210 4320
Textural designation
Sandy loam Fine sandy loam Sandy loam
Clay loam Clay Clay
Clay loam Clay Loam Clay
Coarse sand Loamy sand Sandy loam Sandy loam Loamy sand
Fine sandy loam Sandy clay loam Loam Loam Clay loam Clay
a b C
vcs cs MS
= very coarse coarse sand medium sand
sand d e f
FS VFS
fine sand very fine sand 3 detcrrninations deg J1
Table 12 Mean particle density Pp particle size distribution and textural class designation (Contd)
Site horizon Pp VCSa csb MSc FSd VFSe ~ Silt Clay
Textural designation
6-lAll 235 205 753 501 8 70 1105 4681 1885 Loam 6-1Al2 237 304 719 603 950 1263 4213 1947 Loam 6-lC 244 441 735 634 1110 1757 4698 624 Fine sandy loam 6-lllC 267 250 397 308 523 621 39 71 3930 Clay loam 6-lIIC(repeat) 270 258 317 252 483 616 4032 4043 Silty clay 6-lIIC(repeat) 287 ------------- 2119 -------------- 3204 46 77 Clay
7-1AllAl2 253 675 731 702 1360 844 3050 2637 Loam 7-llIC 268 517 579 555 1068 717 3344 3230 Clay loam
8-lA 239 11 33 7 21 739 1567 2434 2550 857 Fine sandy loam 8-lCll 241 1010 458 428 2225 3397 2072 410 Loamy fine sand 8-1Cl2 260 315 497 890 2687 2538 2322 751 Sandy loam 8-lIICl 263 336 511 588 27 11 3100 21 32 622 Very fine sandy
loam 8-1IIC2 270 556 1564 21 71 3065 1241 958 446 Loamy sand
Table 13 Mean bulk density and mean percent water by volume (OD) and percent available water of Ujung Kulon soil profiles
Suction a
Depth (cm) 0cm 10 cm 100 cm 13 bar 15 bar Percent available 1 3 - 15
Percent
Site Ill 0-15 15-30 30-45
cm cm cm
103 107 1 06
6127 6147 6201
4947 4848 5028
3622 3625 3138
3061 3066 2779
1472 1643 1892
1589 1423 887
Site IJ2 0-15 15-30 30-45
cm cm cm
090 086 086
6408 6702 6718
6251 6230 61 25
5375 5442 5629
4780 4933 5215
3506 3757 4299
1274 11 76
916
Site 113 0-15 15-30 30-45
cm cm cm
o 71 0 73 084
72 37 7256 6842
4068 4091 5060
3608 3676 l4 36
3266 3399 41 22
2450 2793 3226
816 606 8 96
Site 14 0-15 cm 15-30 cm --- b
1 20 1 39
5181 4813
41 28 4338
3319 3303
2762 2501
1746 1728
1016 7 73
Site 115 0-15 15-30 30-45
cm cm cm
o 96 097 093
61 75 6312 6464
5325 5473 5322
4402 4693 4516
3681 4025 3915
2437 2864 2821
1144 11 61 1094
Site IJ6
a
0-15 15-30 30-45
cm cm cm
0 75 097 103
6822 6387 6164
5795 6044 5982
4326 5479 5Lt 78
2879 4523 16 12
2024 3392 3289
855 1131 n23
Cb - No J0-45 cm samples due to high water tuble _
~ble 13 Mean bulk density and mean percent water by volume (OD) and percent available water of Ujung Kulon soil profil~s (Contd)
Depth (cm) 0cm 10 cm 100 cm 13 bar 15 bar Percent available _________________________________ - 15 bar________________ ________ middot----middotmiddot--
Site 117 0-15 cm 0 71 7194 5661 4925 3803 2644 1159 15-30 cm 078 7089 5929 5165 4033 2941 1092 30-45 cm o 77 7127 6006 5312 4087 31 23 964
Site 118 0-15 cm 062 7414 5114 4121 2867 1108 1759 15-30 cm 091 6579 5533 4721 2556 1128 14 28 30-45 cm 115 5685 5097 4598 21 7 4 1275 1199
p
69
least propensity to retain water despite having considerably more clay
in the profile
Results of chemical analyses are given in Tables 14-17 Soil pH
is moderately acid (in the pH 50-60 range) in most cases with a minishy
mum of 506 in 6-lIIC The entire profile of site 8 is above H 70 due
to decomposing shells while only horizon IIC in site 3 is above pH 70
due to the presence of marl
The CEC determined at soil pH is greatest in the surface soil
3-lAll which also has appreciable clay (Table 12) and organic material
as evidenced by a high organic C content (Table 16) Conversely the
lowest CEC is found in the loamy sand of 8-1IIC2 which has a comparashy
tively low content of both clay and OC
Calcium dominates among the exchangeable bases (Table 15) in ~ost
cases particularly in sites 3 and 8 where water-soluble Ca precluded a
calculation of percent base saturation( BS) In sites 6 and 7 ~g
exceeded Ca in the surface soil deeper in these profiles potassium and
sodium also exceeded the Ca levels in most instances
The OC declined sharply with depth (Table 16) but C03-C where
it occurred was many times higher in the subsoil with depth thus conshy
tributing to a trend toward uniformity in CN ratios except in sites
1 4 and 5
Extractable P levels were variable between surface soils and subshy
soils in different profiles (Table 17) Site 8 had the highest amount of
Pin the surface (275 ppm) but relatively less in the two tuff layers
below (92 and 60 ppm respectively) Horizons in site 3 had the penulshy
timate amount of Pin any single profile but there was considerably
70
Table 14 Soil pH and cation exchange capacity of soil profiles of Ujung Kulon determined by two methods
Sitehorizon Soil pH At CEC melOOg Soil
soil pH At pH 7
1-lA 1-lC 1-lIIC
578 598 633
1786 1135 1990
1501 959
1492
2-lA 2-1B22 2-1B22t
512 517 526
3410 3886 4636
2822 4372 4675
3-lAll 3-1Al2 3-lC 3-lIIC
649 684 682 7 73
5406 4066 1530 3349
4812 4182 1100 32 77
4-lAll 4-1Al2 4-lC 4-lIICl 4-1IIC2
5 41 532 528 533 552
1658 1354 1311 1240 1292
1800 1433 1115 817 895
5-lAll 5-1Al2 5-lC 5-lIIC
573 528 524 564
3116 2959 1454 36 24
2964 2049 1208 3101
6-lAll 6-1Al2 6-lc 6-lIIC
563 556 539 506
2617 20 71 1230 2080
18 24 1545
616 1528
7-lAllAl2 7-lIIC
572 519
2612 2422
2240 2074
8-lA 8-lCll 8-1Cl2 8-lIICl 8-1IIC2
713 799 793 794 799
4056 11 59 1358 1439
988
4441 1232 1262 1139
797
-middotmiddot-middotmiddotmiddot ------middotmiddotmiddotmiddot
71
Table 15 Exchangeable bases and percent base saturation in Ujung Kulon soil profiles
meq100~ Sitehorizon Ca Mg K Na lBases CEC a1
lo BS at soil pH
1-lA 454 250 041 o 71 816 1786 4569 1-lC 276 091 056 096 519 1135 4573 1-lIIC 1115 1 93 091 048 1447 1990 7656
2-lA 648 674 200 065 1587 3410 4654 2-1B22 11 94 787 234 041 2256 3886 5805 2-1B22t 2120 811 108 029 3086 4636 6618
3-lAll 4638 354 219 054 5265 5406 9739 3-1Al2 3306 319 094 059 3778 40 66 9292 3-lC 1319 097 045 050 1511 1530 9876 3-lIIC 6840 051 115 046 7052 3349 gt100 a
4-lAll 331 118 040 068 557 1658 3359 4-1Al2 344 098 019 063 529 1354 3870 4-lC 352 116 014 060 542 1311 41 34 4-lIICl 622 242 012 o 77 953 1240 7685 4-1IIC2 684 206 023 052 965 12 92 7469
5-lAll 2246 676 247 061 3230 3116 10366 5-1Al2 1492 486 221 o 70 2269 2959 7668 5-lC 690 301 1 23 054 1168 1454 8033 5-lIIC 1570 957 1 78 130 2835 3624 7823
6-lAll 135 1 66 133 065 499 2617 1907 6-1Al2 034 055 091 052 232 2071 11 20 6-lC 028 018 066 067 1 79 1230 1455 6-lIIC 004 085 016 047 1 52 2080 731
7-1AllAl2 7-lIIC
3 96 056
432 186
058 032
052 067
938 341
2612 2422
3591 1408
8-lA 10700 278 052 047 110 77 4056 gt100 a 8-lCll 4568 128 040 030 4766 11 59 gt100 a 8-1Cl2 5362 293 032 050 5737 1358 gt100 a
8-lIICl 4359 247 015 046 4667 1439 gt100 a 8-1IIC2 5062 354 018 040 5474 988 gt100 a
a - Due to water soluble Ca
72
Table 16 Percent organic carbon carbonate-carbon and total nitrogen and carbon-nitrogen ratios in Ujung Kulon soil profiles
CaSitehorizon oc Co N CN ratio3 -
1-lA 1-lC 1-lIIC
2-lA 2-1B22 2-1B22t
3-lAll 3-1Al2 3-lC 3-lIIC
4-lAll 4-1Al2 4-lC 4-lIICl 4-1IIC2
5-lAll 5-1Al2 5-lC 5-lIIC
6-lAll 6-1Al2 6-lC 6-lIIC
7-1AllAl2 7-lIIC
8-lA 8-lCll 8-1Cl2 8-lIICl 8-1IIC2
124 091 102
189 1 20 047
561 270 096 1 88
581 329 1 46 091 051
5 73 330 094 072
481 341 1 20 094
414 111
528 1 31 139 088 080
388 269 275
275
975 235 2625 345
480
016 012 068
027 016 007
052 030 009 023
050 033 018 014 007
044 037 011 007
036 029 009 008
039 012
052 012 012 009 008
78 76 1 5
70 75 67
11 0 90
107 82
116 100
81 65 73
130 89 85
103
13 4 118 13 3 11 8
108 92
102 109 116
98 100
a - Mean of replicate determinations
----------------middot--- middot-----middot--middot--middot -----middot--middotmiddot ---middot
73
Table 17 Phosphorous silicon and manganese levels of Ujung Kulon soils
eem Sitehorizon p Si Mn
1-lA 85 281 029 1-lC 160 381 0 a 1-lIIC 26 261 0 a
2-lA 34 373 1 75 2-1B22 8 414 075 2-1B22t 3 421 tr b
3-lAll 122 1034 tr b 3-1Al2 122 731 tr b 3-lC 170 756 0 a 3-lIIC 34 655 0 a
4-lAll 10 181 036 4-1Al2 6 166 030 4-lC 4 190 031 4-lIICl 4 236 007 4-1IIC2 4 291 tr b
5-lAll so 362 061 5-lA--12 42 281 049 5-lC 68 346 046 5-lIIC 4 655 028
6-lAll 16 241 224 6-1Al2 8 342 044 6-lC 23 331 tr b 6-lIIC 19 251 078
7-lAllAl2 8 221 033 7-lIIC 4 196 162
8-lA 275 666 007 8-lCll 92 640 021 8-1Cl2 60 576 066 8-lIICl 26 651 028 8-1IIC2 26 41 6 048
a - Non detectable in 8 readout counts b - tr= trace detectable but below 005 ppm mean
74
high Pin the C horizon (170 ppm) Sites 1 5 and 6 had the greatest
amount of Pin the C horizon
Water-soluble Si was extremely high in 3-lAll and substantially
higher in the entire profile than in other sites except the site 8
profile and in 5-lIIC By contrast Mn levels were low In oany
cases Yin was not detectable or detectable at a mean level of less
than 005 ppm Only 3 horizons showed Mn in excess of 10 ppm
Mineralogical information is given in Tables 18 and 19 Quartz
predominates in the sand and silt fractions of most horizons of each
profile (Table 18) and in most profiles In site 5 plagioclase reshy
places quartz in the sand fraction of all horizons except in 5-lIIC
where plagioclase has not been identified in the silt and clay fracshy
tions cristobalite and smectite predominate The subsoil sand and
silt of 3-4IIC contain calcite At the deepest levels of site 8
the presence of calcium phosphate is indicated Moderate amounts of
smectite halloysite and kaolin occur commonly in the silt and clay
fractions of most profiles
Total oxides are given in Table 19 Reported percentage totals
are several percent high due to positive deviation from regression
equations used in internal standards employed in calibration of the
X-ray quantometer Also some error exists due to the absence of
Na 2o values
75
Table 18 Primary and secondard minerals identified from X-ray diffraction patterns and unidentified peaks in soils of Ujung Kulon
Sitehorizon Mineral Unidentified peaks (Mg-saturated paste only)
d-soacing (Angstroms) 1-lA
Sand Silt Clay
1-lC Sand Silt Clay
1-lIIC Sand
Silt Clay
2-lA Sand Silt Clay
2-1B22 Sand Silt Clay
2-1B22t Sand Silt Clay
3-4All Sand Silt Clay
3-4Al2 Sand
Silt Clay
Quartz Quartz Quartz
Quartz Quartz halloysitea b
Quartz
Quartz halloysite Quartz halloysite
Quartz Quartz Smectite kaolin
Quartz Quartz Smectite kaolin halloysite
Quartz Quartz halloysite Smectite kaolin halloysite
Quartz Quartz Kaolin halloysite
Quartz
Quartz halloysite Kaolin smectite halloysite
319 413243321377 415
404322291 321
314321255323 380
417319269714
429323198 319446404
429450 319446200352
448318 319446377300
3 20 4 06 i 7 2
296321406151 1501 78
1004
a - Silt + clay b - No sample
76
Table 18 Primary and secondary minerals identified from X-ray diffraction patterns and unidentified peaks in soils of Ujung Kulon (Contd)
Sitehorizon Mineral Unidentified peaks (Mg-saturated paste only)
cl-spacing (Angstroms)
3-4C Sand Silt Clay
3-4IIC Sand Silt Clay
4-lAll Sand
Silt Clay
4-1Al2 Sand
Silt Clay
4-lC Sand
Silt Clay
4-1IIC1 Sand Silt
4-lIICa Sand
Silt
Clay
Quartz Quartz halloysite Kaolin halloysite
Calcite
Smectite kaolin halloysite
Quartz
Quartz C
Quartz
Quartz smectitea b
Quartz
Quartz smectitea b
Quartz Quartz smectitea
Quartz
Quartz smectitea
b
324377336182 182 714472335287
324
335 320334243240 724482
320322408378 366349
319377
319365377406 1 98
321343404
319323408374 3 66 l 98
319323377405 448349
406322253198 3221000
320321377406 390366229198
322319408377 444100
a - Silt + clay b - No sample c - No clay in horizon
77
Table 18 Primary and secondary minerals identified from X-ray diffraction patterns and unidentified peaks in soils of Ujung Kulon (Contd)
Sitehorizon Mineral Unidentified peaks
5-lAll Sand Feldspar Silt a Cristobalite smectite Clay Smectite
5-1Al2 Sand Plagioclase Silt a Cristobalite smectite Clay a Cristobalite smectite
5-lC Sand Plagioclase Silt a Cristobalite Clay Smectite
5-lIIC Sand a Cristobalite
Silt a Cristobalite smectite
Clay Smectite
6-lAll Sand Quartz Silt Quartz Clay Kaolin halloysite
6-1Al2 Sand Quartz calcium - aluninum
silicated Silt Quartz Clay Kaolin halloysite
6-lC Sand Quartz
Silt Quartz Clay Kaolin halloysite
6-lIIC Sand Quartz Silt Quartz Clay Kaolin halloysite
(Mg-saturated paste only) cl-spacing (Angstroms)
321446378
214192284161
230180178 335321440
322365377170 302294216
321383440331 298256
4 06 3 77 1 85 281446 415442719
348 213 415386444725
322365406425 3 77 252
444319 4397141425
323380217 352324377216 417725
d - Ca Al2 Si2 Og
78
Table 18 Primary and secondary minerals identified from X-ray diffraction patterns and unidentified peaks in soils of Ujung Kulon (Cond)
Sitehorizon Mineral Unidentified peaks (Mg-saturated paste only)
cl-spacing (Angstroms)
7-1AllAl2 Sand Silt Clay
7-lIIC Sand Silt
Clay
8-lA Sand Silt Clay
8-1Cl2 Sand
Silt Clay
8-lIICl Sand
Silt
Clay
8-lIICZ Sand
Silt
Clay
-
Quartz Quartz Kaolin halloysite
Quartz Quartz
Kaolin halloysite
Quartz Quartz kaolina b
Quartz
Quartz kaolin halloysitea b
Quartz
Quartz calcium phosphatee kaolina
b
Quartz
Quartz calcium phosphatee halloysitea
b
380325300 353324 719598
324380303 352323377216
212 731417
349322305 1004
300304188249 270210
300304340271 188249
3031004
300341189271 329226186 377238
8421004
a - Silt+ clay b - No sample e - Ca2P207
Table 19 Percent total oxides in Ujung Kulon soils (on ignited basis)
Sitehorizon Si02 Al203 Fe 2o3 MgO K20 Cao P205 Others-ab Total
1-lA 5635 21 7 2 1696 l 75 213 094 143 333 10461 1-lC 6597 2069 798 180 254 183 084 234 10399 1-llIC 49 13 2302 2308 154 202 066 143 396 10484 1-lC 6673 1972 830 189 235 241 068 243 10451 (whole soil)
2-lA 6986 2201 722 200 184 060 041 229 10623 2-1B22 6458 2622 879 219 182 039 031 235 10665 2-1B22t 6228 2767 896 266 201 061 025 224 10668
3-4All 5503 2716 1061 1 80 157 1 59 1 27 269 104 72 3-4Al2 5518 2902 1146 1 73 1 54 267 120 270 10550 3-4C 6898 2066 581 1 60 278 213 045 218 10459 3-4IIC 4805 3104 12 82 1 86 098 774 140 271 10660 3-4C 6867 2002 569 1 41 267 242 043 214 10348 (whole soil)
4-lAll 7245 1945 728 1 81 216 089 042 216 10662 4-1Al2 6864 2266 767 182 1 98 068 035 220 10600 1-lC 6461 2344 978 209 212 0 70 035 230 10539 4-lIICl 6259 2457 10 77 217 208 085 036 239 10578 4-1IIC2 6056 2569 11 74 2 73 207 098 035 233 10645
----------~~---- ~---middot----middot-----middot
a - Ti0 2 MnO b - no Na 2o calculated
r
Table 19 Percent total oxides in Ujung Kulon soils (on ignited basis) (Contd)
Sitehorizon Si02 Al203 Fe2o3 MgO K20 Cao P2D5 Others-ab Total
5-lAll 5-1Al2 5-lC 5-llIC 5-lC (whole soil)
6-lAll 6-1Al2 6-lC 6-lIIC 6-lC (whole soil)
7-1AllAl2 7-lIIC
8-lA 8-1Cl2 8-lIICl 8-1IIC2
6994 6909 6992 6726 6614
6617 6393 66 96 5787 6795
5995 5818
6265 5788 5885 6028
2254 2372 2156 2664 2247
2437 2627 2243 3160 2080
3012 3087
2024 1997 2139 2307
592 628 568 630 584
795 827 658
10 77 610
920 1007
802 809 832 869
1 91 1 97 169 218 1 70
139 136 1 70 1 22 165
152 165
237 238 266 256
273 266 278 203 214
200 200 244 214 255
287 303
1 64 1 60 1 55 1 61
167 141 1 70 069 348
075 074 1 55 000 210
014 000
798 1204 10 90
745
039 040 032 020 032
037 039 033 028 033
037 030
101 057 047 043
200 207 208 189 223
235 235 224 239 223
247 247
231 223 218 219
10710 10760 105 73 107 19 10432
10535 10531 10423 10627 103 71
10664 10657
10622 10476 10632 10628
---J
0 0
81
DISCUSSION
Density Stocking and Site Utilization
Numerical abundance and spatial distribution of species must be
taken into account before an understanding of plant community organizshy
ation can be obtained in the viewpoint of Hairston (1958) In the
opinion of Gause (1936) the most important structural feature of a
community is a definite quantitative relationship between abundant
and rare species The plant community can best be described as a
spatial and temporal organization of organisms (Dansereau 1963)
with differing degrees of integration Despite close interrelationshy
ships the ultimate unit of vegetation is not the plant community
but the individual plant type whose representatives show similar
ecological behavior (Mueller-Dombois and Ellenberg 1974)
Abundancy contributes to homogeneity whereas rarity is a sign of
heterogeneity within a particular community Spatial homogeneity
however requires that a species be distributed equally in all parts
of an area ie the probability of encountering the species in
all parts is the same Tests of homogeneity in a statistical sense
are rarely applied in multi-species communities (McIntosh 1967)
and usually homogeneity is determined subjectively
The paucity of information within each site and the inadequate
number of sample sites in this study compound the problem of drawing
meaningful inferences from the Ujung Kulon vegetation data Attempts
to delimit the various community boundaries by investigating only
selected associations was done at the sacrifice of randomness Comparishy
sons of site utilization among associations was not possible because
82
no true replication of conditions existed
Density of trees and saplings ie the number of stems per unit
area is generally greater in the well drained uplands than in lower
elevation sites (see Figure 6) having less relief Sites 6 and 7 as
typical of the upland situation exhibit good drainage They contain
43 and 41 stems respectively Site 8 on poorly drained flat ground
contains 30 stems Sites 1 and 2 have low stem counts
There is apparently greater site utilization in the uplands on ~
the basis of stocking as well Stocking is a relative rather than
an absolute measure of site utilization and often employs the detershy
mination of dbh and ba The use of dbh alone has serious drawbacks
because mean dbh depends upon the number of trees in each site as
well as tree size Exceptionally large or small trees tend to greatly
affect mean dbh since sample size is small Site 5 with 9 trees and
mean dbh of 406 cm appears to be comparable to Site 7 with 18 trees
and 473 cm mean dbh a dbh change of 165 between the two sites
Median dbh in Sites 5 and 7 were 35 cm and 39 cm respectively Fron
the standpoint of total ba per site however from 1237 - 2294 m2ha
in site 5 to 3165 - 4518 m2ha in Site 7 the percent change of the
ba range is 854 - 427
This grouping of total baby sites also suggests greater site
utilization in the uplands Basal area alone does not constitute an
index of site productivity Productivity is measured against some age
standards but lacking true growth rings in most species actual age
of trees in undisturbed forests of the tropics is mostly a matter of
conjecture In mixed forest of multi-aged species there is as yet
no precedent for the concept of site index The use of basal area
83
assumes some maximum tree crown capacity as a function of stem dia-
meter Penetration of light is thus limited and some equilibrium be-
tween canopy trees and understory species comes about perhaps one
reason why Dawkins (1959) assigned a maximum value for primary tropishy
cal high forest of about 3327 m2ha Even higher ba in sites 6 and
7 may be due to more compact crowns of species found there At any
rate the differences in elevation alone would suggest the possibilishy
ty that lower basal areas in the lowlands may be due in part to the
destruction of part of the overstory by the tidal waves of 1883
Traditional parameters of dbh and tree height have limited useshy
fulness as indices of site utilization Although Hoogerwerf (1970)
attested to the primary nature of the forest in the G Pajung Range
he seemed skeptical that much primary forest existed elsewhere in
Ujung Kulon because few trees of large diameter are encountered Only
two specimens in the 80-100 cm dbh range were neasured in site 6 and
one in site 7 both in the G Pajung Range In the lowlands Artoshy
carpus elastica of 83 and 86 cm dbh were recorded in site 2 and a 93
cm dbh Syzygium lineatum was measured in site 3 Other equally large
trees were found near and around sites 2 3 and 5 but with the same
low frequency as those encountered within the sites Cain et al
(1956) also noted that although very large trees do occur in tropical
rain forest their studies in Brazil gave them the impression of a
forest composed of moderate to small trunks with long unbranched boles
and relatively small crowns Holdridge (1970) also reported a maxishy
mum dbh of 957 cm and a penultimate dbh of 800 cm in a primary
forest in Puerto Rico The long boles and small crowns of trees in
-
---
---
84
sites 6 and 7 contributed to the present authors inability to get
leaf samples for identification
Taxonomic differences among the sampling sites were striking
since few of the same tree species were found in other sites Method
of seed dispersal is suspected to be one of the important factors in
species homogeneity within sites and similarly a factor in causing
heterogeneity between sites Many primary tree species of the
tropics have large seeds which restrict rapid widespread establishshy
ment (Gomez-Pompa~ al 1972) The Neesia altissima found only in
sites 6 and 7 for example is quite widespread in the G Pajung Range
and would presumably grow in the vicinity of sites 3 and 5 Its heavy
seed pods however are cast quite close to the parent trees and it is
probable that the spread of the species is restricted to slow expanshy
sion On the other hand floatable seeds especially those of Arenga
obtusifolia may predominate in the drained soils of the lowlands in
voids created there by the tidal wave destruction of 1883 Otherwise
Arenga is limited to vegetative propagation of suckering of underground
parts of parent trees Although Arenga may have been established by
seed floatation apparently the trees dont tolerate prolonged exshy
posure to salt water No Arenga were found in site 8
Other edaphic conditions are thought largely responsible for reshy
striction of plant species to various associations The draughtiness
of the soil in site 1 is thought to be largely a feature of the undershy
lying sandstone parent material After 10 days of continuous rain
during March 1973 there was no sign of puddling in site l and soil
moisture content was only about 25 Also the apparent excessive
drainage may be due to fissured rocks in the fairly shallow soil
85
An analogous situation seems to exist in the northern periphery
of the Telanca area at least in the upper part of the solum The
rapid infilitration of rain water into the soil in wuch of the watershy
shed results in movement of water in underground streams Where a
high water table exists near sea level the trees establish shallow
root systems and are readily blown down by waterspouts and high winds
which occur in the coastal areas The secondary appearance of the
forest in the northeastern sections of Ujung Kulon may be a conseshy
quence of both high water table and wind blowdown of species not
adapted to a wet soil regime Mangroves and other species found in
the littoral zone are better able to withstand those influences
because of their adaptation of mechanical support
On the basis of ground reconnaissance the northeastern lowlands
seem to have more clear-cut vegetation mosaic patterniag than other
areas The tidal waves in 1883 may have been most destructive there
thus altering species succession However the thick ash fall itself
in terrain above the high water line was also an important factor in
post-Krakatau succession
Preliminary Biomass Estimation
Total biomass production is a useful indicator in describing
site utilization A reasonable post facto approximation can be made
by applying the concepts of other investigators Ovington and Olson
(1970) calculated regression equations of oven dry weight of various
plant parts (roots boles stems and leaves) in standing trees by
direct weighing of typical representatives when they were removed
-
86
and weighed by sections The regression equations they employed for
major trees which are also used here were
g (OD wgt) leaf ln y 1 =a+ b x + b2ln x2 (6)1 1
where a= 29254 = 00012 b = 13277b1 2
and x was hgt in m and x was dbh in cm Coefficients a b and b1 2 1 2
were different for various parts thus
bole ln y1 = 43821 0001 x1 + 19379 ln x 2 (7)
branches ln y1 = 27453 + 00004 x1 + 22401 ln (8)x2
rootslt 05 cm ln Yl = 13583 - 00003 x + 08582 (9)1
ln x 2
and rootsgt 05 cm ln y = 3002 + 25538 ln x (10)1 2
Minor trees were best represented by regression of biomass on dbh
alone and put into their Group C Ovington and Olson (1970 also
developed regressions for minor trees as follows
g (OD wgt) leaf ln y = 40243 + 15726 ln (11)1
x 2
bole ln Yi= 53717 + 18010 ln (12)x2
branch ln y1 = 411894 + 19357 ln (13)x 2
rootslt 05 cm ln y1 = 15415 + 09779 ln x (14)2
and rootsgt 05 cm ln y 1 = 42850 + 19367 ln (15)x 2
Since saplings in this study were counted only the mean dbh of 175 cm
was used in all cases and the results rounded to the nearest kg A
different plant geometry exists for palms therefore the regression
equation of Bannister (1970) for Euterpe globosa Gaertn was
Total biomass (OD wgt) ln y1 = 384629 + 2912322 ln (16)x 2
1II r Pi rrmrr 71 F7i1 5 I rttta fttHt zttrrwnmt
87
and is used to compute the biomass of Arenga obtusifolia Both palms
belong to the same sub-family Arecoideae and have quite similar morshy
phological features
The Corypha _utan on the other hand belongs to the sub-family
Coryphoideae so the use of Bannisters (1970) regression may not be
appropriate Tomlinson and Soderholm (1975) measured a single Corypha
elata Roxb in Florida and gave several oven-dry weights of the plant
parts By using proportional weights of various parts the total bioshy
mass of the smaller Corypha utan in Ujung Kulon was estimated Bioshy
mass of boles however was computed by considering the bole as an unshy
tapered cylinder with an estimated specific gravity of 095 and a dry
matter content of 25 Oven dry weight may be computed by first de-
termining the volume of a cylinder V = TI r 2 h (17)
and then substituting in the specific gravity of the wood g8 the
weight of dry wood wd and 100212 kgm3 the weight of a cubic
meter of water Oven dry weight in kg is thus
W = Tir 2hgswd X 100212 kgm3 (18)
All biomass estimates for this study have been summarized in
Table 20 Lacking any other estimate and although completely conshy
trived the biomass estimates made for Ujung Kulon are probably not in
serious error except for site 4 In theory the overall morphologshy
ical characteristics of forest trees and shrubs found in the same life
zones are similar according to Holdridge (1967) Inasmuch as rainshy
fall and elevation are key parameters in the Holdridge system the El
Verde Puerto Rico sites of the Ovington and Olson (1970) and
Bannister (1970) studies should be comparable The El Verde sites are
Table 20 Estimates of tree and sapling biomass of vegetation sites in Ujung Kulon
Site II Major trees IJ Saplings II Arenga II Corypha kgsitea kghaa
1 0 - 0 - 1 20 1 2936 2956 23648
2 3 - 5414 2 - 153 15 - 1024 0 - 0 6591 52728
3 14 - 8415 21 - 1609 8 - 546 0 - 0 10570 84560
4 b - b - b - b - b
5 9 - 4646 22 - 1686 10 - 683 0 - 0 7015 561120 I6 17 - 12584 38 - 2912 0 - 0 0 - 0 15496 123968 I
l7 18 - 14023 41 - 3142 0 - 0 0 - 0 17165 137320
I
8 3 - 818 19 - 1456 0 - 0 8 - 18284 20558 164464
a - oven dry weight I b - no trees or saplings in Site 4 I
I
00 00
89
at 424 m elevation with 3120-4650 mm annual rainfall (Odum 1970)
Although no true mean rainfall has been established the lower value
seems more likely and is close to that of Ujung Kulon The average
biomass estimate (excluding site 4) of 91830 kgha for Cjung Kulon
is less than the average given by Ovington (1965) or Sanchez (1973)
for tropical forests However it is above the minimum of 71900
kgha of live vegetation biomass given by Ovington (1965) even withshy
out changing the regression coefficients or any of the other assumpshy
tions
Some of the low biomass estimates may be attributed to the
effects of the coarse tuff Warnaars and Eaves (1972) presented exshy
perimental evidence that excessive aeration and erratic water stress
in coarse aggregates led to restricted root growth of emerging seedshy
lings Taylor (1974) demonstrated that rate of seedling emergence
plant height and weight of aerial and subterranean vegetative comshy
ponents of maize and sorghum were generally correlated with soil
aggregate size -- root development was significantly more pronounced
in soils with finer aggregates
Interruption in Plant Succession
Except where erosion bared the soil to a mineral surface the
tuff layer may have been responsible for a prolonged interruption in
plant succession The interruption lasted perhaps a decade or longer
until biocycled organic residue of sufficient depth and water-holding
capacity resumed its full role as a medium of seed germination and
development Normal development in a downward direction had to take
place through a nutrient-poor and structurally inhospitable tuff layer
--
--
90
Seeds which were cast prior to tuff deposition may have experienced
little difficulty in emerging upward through the tupoundpound In spite of
Verbeeks (1885) sole measurement of 10 mm tuff thickness at Javas
First Point this study indicates a tuff layer that is on the
average 667 rrun in thickness for 24 observations (Table 21 also see
Appendix B)
Differences in tuff thickness resulted in some part by
re-distribution by wind gravity and stream flow Also the greater
tuff thickness may have resulted from directional eruption as disshy
cussed by Colmet-Daage and Gautheyrou (1974) or due to localized
wind currents andor eddy effects The work of Schuylenborgh (1954)
inexplicably made no mention of the Krakatau tuff in soils that are
61 - 139 km SE of Krakatau in Bantam Province Curiously he was
studying classification and genesis of soils derived from tupoundpound (the
G Danau tupoundpound) -- which he did identify deep in the profiles
Many seeds particularly those dispersed by the wind or light
seeds with limited carbohydrate reserves may have succumbed in greater
numbers and were subject to greater establishment problems than seeds
in soil with little or no tuff layer Consequently spatial patterns
of some species may have been permanently altered and successional
changes may have resulted
Existing trees and shrubs probably did not suffer species
extinction as a result of a decade or more of unfavorable gennination
medium but they probably declined in growth rate and overall vigor
due to water stress In places where the tuff layer was thick enough
to prevent normal seed germination it probably also caused seasonal
91
water stress by simulation of a long capillary fringe on the
surface of the soil
Physical Effects of the Tuff Layer
The granular sandy apparent texture of the tuff was one of many
physical properties which affected plant succession At the outset it
is felt the sandy nature of the tuff layer was more permeable to
water but like sands in general had low water holding capacity I~
periods of low rainfall it tended to dry out to a greater extent than
the underlying litter layer andor surface soil having more organic matshy
ter In time organic residues from the forest canopy gradually buried
the tuff The water balance problem then became one cf inability of
water to percolate to lower depths until the entire tuff layer was
nearly saturated
Unsaturated flow of water through soil under suction is linited by
the size number and arrangement of the pores Large pores fill last
and empty first In site 3 horizon 3-1Al2 with 47 clay would be ex-
pected to exert a greater pressure gradient than in 3-lAll with 34 clay
The theoretically greater pressure potential in the subsoil 3-lIIC with
49 cannot be realized because there is a relatively low pressure
potential under unsaturated flow conditions in the tuff above it which
has only 16 clay From that standpoint the data in Table 13 are misshy
leading since they do not represent continuous column simulation Un-
fortunately the realization came no soil moisture ten-
sion data were collected for the C horizons alone
The available water supply as presented in Table 13 is an overshy
simplification Available water capacity (AWC) of Salter (1967) as
given by Williams and Joseph (1970) takes into account the depth of
92
soil (d) and its apparent specific gravity (ASG) -- also known as bulk
density -- expressed as wgtvol in addition to the conventional upper
limits (UL) for water availability at 13 bar tension and the lower
limits (LL) at 15 bar--the permanent wilting point AWC is then ~alshy
culated as
AWC = (UL-LL) x d x ASG (19) 100
and expressed as either inches per foot or cm perm Although availshy
able water percentage in Table 13 seems to vary little with depth the
AWC by equation 19 varies nearly 20-fold between surface soils and
subsoils Moreover the field capacity in sandy soils is closer to
110 bar than to 13 bar (Williams and Joseph 1970) hence the
coarser textured tuff and overlying horizons are not accurately repre-
sented by substitution into UL of 13 bar tension data Salter (1967)
found that 110 bar tension for UL was also ~ore accurate for soils
with good infiltration characteristics
By equation (19) for example the AWC of 0-15 cm depth in 6-1
(from Table 13) would yield only 096 cmm because dis 15 cm and ASG
is 075 On the other hand the AWC of 6-lIIC is at least 1771 beshy
cause the measured dis at least 130 cm (Table 9) and ASG of 103
points to a greater storage capacity The tuff layer of 6-1 with
mean ASG of between 0505 for pumice and about 080 for finer
separates could be expected to hold very little water
During the first decades after tuff deposition the combination
of the long capillary fringe followed by a disjunction of pressure
gradient in the tuff may have meant that little or no water percoshy
lated to the root zone during the driest months Schenkel and
Schenkel (1973) reported one instance in which almost no rain fell
93
for more than a month in Ujung Kulon Table 1 attests to a decidedly
dry season in terms of the frequency of rainfall occurrence
Another physical effect of the tuff layer is the poor structural
stability it possesses as a medium for mechanical support of roots
The apparent sandiness of the tuff in the upland sites borders on a
gravelly texture in the lowland swales Colmet-Daage and Gautheyrou
(1974) also remarked on the single grain deceptiveness of fresh
volcanic ash in Martineque which nevertheless was texturally a clay
by mechanical analysis
The problems of root establishment and water percolation are
probably no longer noticeable in Ujung Kulon because the soil horizons
are now sufficiently thick to contain enough roots for adequace water
uptake
Chamical Properties of Soil
a Effective CEC
Uchida (1973) had previously determined that there were no
statistical differences in exchangeable bases when extracted at both
soil pH and pH 7 but that CEC determination was much more dependent
upon extractant pH Gross differences in CEC by the two methods used
in this study were too large to ignore Consequently percentage base
saturation calculations were affected The BS exceeded 100
only in sample 5-lAll when the NH40Ac was adjusted to soil pH--
except for the calcareous soils of sites 3 and 8 as noted at the
bottom of Table 15 The BS of 10366 in 5-lAll probably reshy
flects experimental error due to the sizeable quantity of Ca present
94
middot-middotlioiftr----------------middot------middot-----------middotmiddotmiddot----middotmiddot -middotmiddotmiddot- -------middot-
It could be due to error in CEC determination as well but the CEC as
determined with neutral NH40Ac is even lower and would result in a
larger BS of 10897 Using neutral NH40Ac the percent BS
exceeds unity in samples 4-1 IICl 4-1 IIC2 5-lAll and 5-1Al2 if all
other factors remain the same
Effective CEC is reputed to increase with increase in pH in soils
having a pH dependent charge (Tamimi et al 1972 Keng and Uehara
1973) Yet CEC decreased in all samples from sites 1 5 6 and 7 when
it was determined with neutral N NH40Ac Lowering of the pH of the
extractant for samples 3-1 IIC and all samples of site 8 had varied
effects on CEC It lowered the value of CEC of samples 3-1 IIC but
raised it for 8-1 A and 8-1 Cll whereas the rest of site 8 soils
showed lower CEC values
b Organic carbon
carbon expressed as percent decline
rapidly from the surface soil to subsoil horizons (Table 16) A
conventional conversion of OC x 1724 =organic matter was
used in this study Soil organic matter contributes significantly
to the CEC as evidenced from sample 4-lAll This horizon has an exshy
change capacity of 1658 meq100 g despite having 243 silt and no
clay at all Most chemical activity takes place in the 20 micro or
smaller size fraction as suggested by Witt and Baver (1937) They
indicated that 20 - 5 micro diameter silt had 110 the surface reactivity
of coarse clay and less than 120 of the adsorptive capacity of
colloidal clay (lt 100 m micro diameter)
The levels of
95
In the pipette method of mechanical analysis virtually all un-
explained error goes into the silt fraction and only a loss of sand
in the various sieving and weighing operations could increase the value
for silt A part of the 243 silt presumably included some experishy
mental error also some of the silt was of the relat~vely inactive
size fraction above 20 micro Therefore the CEC in sample 4-lAll nay
be predominantly attributed to its organic matter content
Dead roots leaves branch material animal wastes and all other
sources of organic C which contribute to the high organic matter level
of 4-lAll may also contribute to the CEC By Rodes (1962) estimate
the CEC of soil humus is 180-200 meq100 g and fresher organic
residues show an exchange capacity of about 100 meq100 g With 1002
OM in sample 4-lAll it could have a CEC between 1804 and 2004
meq100 g which could be ascribed to OM matter alone The detershy
mined CEC of 1658 meq100 gin a soil which is 9757 sand shows
that virtually all of the exchange capacity arises from the organic
matter In site 8 also where most horizons have coarse textured
soils the organic matter plays an important role in the establishment
and survival of vegetation There as elsewhere organic matter
contributes to water holding capacity and is a source of nutrients
Most of the soils of Ujung Kulon are not very high in clay
Of 33 samples tested only 4 were clearly clay in texture and two other
samples were borderline (see Figure 7) To account for the
surprisingly high CEC of the coarse soils it seems evident that both
OC and clay content must be considered Using data obtained in
this study a regression equation incorporating both OC and clay
-----
FIGURE 7 SOIL TEXTURAL TRIANGLE
percent sand
SOUHCE USDA SOIL SURVEY MANUAL1951
97
was worked out to predict CEC for the diverse soil conditions found
within Ujung Kulon The equation
Y = 0582X + 10542 (20)
where X = OC +clay
Y = predicted CEC in meq100 g soil
and gave a better prediction of CEC than if either OC or clay
alone were substituted for the X values Regression coefficients of
r = 080 039 and 076 respectively were obtained when X = OC +
clay X = OC and X =clay respectively Figure 8 shows a comshy
parison of actual CEC values and the computed regression line for the
relationship between CEC and OC +clay
Mineralization and Soil Genesis Theories
A soil genesis theory (Tan and Schuylenborgh 1961) developed
largely by Schuylenborgh (Schuylenborgh and Rummelen 1955
Schuylenborgh 1957 1958 1959) which was propounded by Mohr (1922)
and Joffe (1931 1936) holds that
Under suitable conditions of high base status adequate air
water and temperature regimes the organic matter decomposes comshy
pletely so that the soil forming agent (which is the most important)
is carbonic acid Products of decomposition are CO2 and water
The differential rate of mineralization of soil organic matter
was held to be of extreme importance for the process of soil formashy
tion (Hong and Schuylenborgh 1959) A rapid mineralization of
Ujung Kulon soils is supported by the findings of Schuylenborgh
(1957) who reported litter layers of only one leaf thickness and
whole descriptions of profiles elsewhere generally lacked humus
50
Figure 8
Regression of C EC on dego OC +0o CLAY
40 bull2e
bull19
bull4 bull10
D
g 30 bulls
bull11 O ltIgt
E bull25 0 w 0 20 bull21 bull23
bull9 12 bullre29 bullbull 13
27bull i bull14 A
Y= I0542t0582X10
r= 0801 bull 2 30
10 20 30 40 50 600L----------------------------0o OC + 0o CLAY
99
layers In Ujung Kulon the absence of a buried A horizon under the
Krakatau tuff suggests that mineralization has gone to completion in
all sites investigated
Despite the lack of humus in surface soils of the lowland
tropics OC is considerable Jenny~ al (1949) found total
nitrogen organic matter and CN ratios to be higher in Colombian
forests than in similar well-drained upland soils of temperate areas
They estirr~ted an average mineralization rate of 3 of the organic
matter They calculated that less than a decade was required to reach
a near-equilibrium accumulation of forest litter in tropical crests
compared to 100-200 years under Ponderosa Pine in North America
Elevation and temperature however play strong roles in litter
accumulation within a narrow geographical region Schuylenborgh
(1958) showed that higher elevation soils have somewhat thicker
humus layers and consequently higher OM values than lowland soils
in Indonesia He proposed 5 belts of soil development based somewhat
on elevation
1 - 1600m - 1300m elevation
2 - 1300m - 1000m
3 - 1000m - 600m
4 - 600m - 300m
5 - lt300m
with considerations for pH morphology CN ratios and R203SiOz
ratios All of Ujung Kulon would be included in belts 4 and 5 and
the soils therein he described as podzolized brown latosols and latoshy
solic soils respectively In an earlier work however Schuylenborgh
-----------------middot--middot----------middot-----middotmiddot-----middot-middot-- ---~ ___ - middot-
100
and Rummelen (1955) considered soils formed from andesitic tuff at
an elevation of 1000-1500m as grey-brown podzolics ie true
Spodosols due to clay accumulation in the B horizon while Tan and
Schuylenborgh (1961) classified as brown podzolics the Sumatran soils
found at 500-llOOm with red-yellow podzols at less than 500 m eleva-
tion
The Schuylenborgh classification postulates were explained
(Schuylenborgh 1957) more fully for West Javan profiles derived from
dacitic tuff of the Danau volcano which disappeared in the Pleistocene
era Four profiles at an elevation of ca 70 m were examined hy
Schuylenborgh and classified into either
(1) Podzolized Reddish-Brown Latosolic soil--on the basis of
marked increase in clay content (indicating podzolization processes)
and increase in Si0 2R2o3 ratio with depth or
(2) Red-Yellow Podzolic--increase in clay and a decrease in
Si02R203
Schuylenborgh concluded (1957) that in the humid tropical region
the CN quotient of the podzolic soils is practically constant while
the molar Al 2o3 Fe2o3 ratio of the clay fraction increases with depth
In latosolic soils the CN quotient and the Al 2o3 Fe 2o3 ratio in the
clay decrease with depth
The decreasing Si0 2 R2o3 ratios with depth and the increasing
clay content (Table 21) in Ujung Kulon support the Schuylenborgh
(1957) characterization of Red-Yellow Podzolic soils The C horizon
is seen as an anomaly The CN ratios in Ujung Kulon however do
not seem to decrease with depth in all profiles -- one of the
Schuylenborgh criteria for latosolic soils
----middot-middotmiddot-middotmiddotmiddotmiddotmiddot---middotmiddot-middotmiddotmiddotmiddot _- middot-middot----
101
Soerianegara (1972) considered the buried clayey soils of marl
origin of nearby P Peucang as podzolized grumusol in accordance with
earlier criteria of Dudal and Soepraptohardjo (1961) and
Soepraptohardjo sect al (1966) for grumusols He recognized that
many of the properties did not agree because the upperuiost horizons
lack dark coloration of grumusols (Vertisols) and the Peucang soils
did show eluvial and illuvial differentiation
c The CN ratio
The near uniformity of CN ratio found by Schuylenborgh and
Rurnmelen (1955) Jenny~ al (1949) and in this study (see Table 16)
indicate near equilibrium in soil development as discussed by the
various authors In the Schuylenborgh and Rummelen study the unishy
formity of CN ratio throughout the profile was true despite a 10-fold
decrease in both 0 C and ~ N with depth The study by Jenny ~ al
(1949) suggests that uniform CN ratios may be an indicator of virgin
forest conditions They found a CN ratio of 96-110 in one virgin
forest site in Costa Rica and 100-143 in another site Results of
the present study show a greater CN range but there was a trend
towards uniformity
The overall virgin forest status of Ujung Kulon has already been
established at least for the less accessible areas--sites 3 5 6 and
7 Alluvial accretions in sites 4 and 8 preclude them from considershy
ation in the same manner and due to probable extensive destruction
of the vegetation in those sites in 1883 designation of virgin forest
102
Table 21 Percentage clay Si02R203 and Al 2o3Fe2o3 ratios of Ujung Kulon soils
Sitehorizon Clay
1-lA 1-lC 1-lIIC
2-lA 2-1B22 2-1B22t
3-4All 3-4Al2 3-4C 3-4 IIC
4-lAll 4-1Al2 4-lC 4-lIICl 4-1IIC2
5-lAll 5-1Al2 5-lC 5-lIIC
6-lAll 6-1Al2 6-lC 6-lIIC
7-1AllA12 7-lIIC
8-lA 8-lCll 8-1Cl2 8-lIICl 8-1IIC2
1084 601
1867
2986 5134 6557
34 Otiaa
4755 1619a
a
4892
oo 588 951
1018 926
15 57 1666 1282 3210
1885 1947
624 3930
2637 3220
857 410 751 622 446
146 230 107
239 184 1 70
146 1 36 261 110
271 226 1 95 1 77 1 62
246 230 257 204
205 185 231 137
1 52 142
222
206 198 190
l 28 259 1 00
305 298 309
256 253 356 242
267 295 240 228 219
381 378 380 423
307 318 341 293
327 293
252
247 257 265
a-Clay samples from 3-4 series
103
in those sites is inappropriate As discussed earlier the mosaic of
which sites 4 and 8 are representatives may be due in part to a
residual pattern of succession first initiated by tidal wave action
andor piecemeal destruction of overstory vegetation by water spouts
Richards (1952) thought that tropical savannas of which site 4 oight
be considered an example are due to edaphic factors or are stages i~
a hydrosere It seems that the latter reason is more valid in the
case of site 4 inasmuch as a high water table exists for much of the
year
Although site 1 may be considered to be in near-equilibrium froo
a soil development standpoint the predominance of herbaceous vegeshy
tation is not comparable to other sites studied The site however
is representative of the open shrub found along Ujung Kulons south
coast In any case additions of organic residue are not expected to
be as great as in fully stocked forest sites Site 2 which may be
close to other forested sites in organic matter production may
however be more representative of organic matter depletion rather
than accretion due to evidence of moderate to severe erosion
Forms of Silicon in the Soil
Water soluble silicon levels in soil profiles varied appreciably
between sites but showed only small increases with depth (Table 17)
The C horizon showed a sharp increase in Si but the level normally
decreased in the horizon below it A typical laterization process
whereby SiOz is leached downward leaving only sesquioxides at the
surface cannot be discerned from the results obtained Slightly
104
higher content of Si in the C horizon may be due to a greater SiOz
content of the tuff at the time of its deposition as well as some
desilication of the over horizons -1ohr (1944) reported about
66 Si0 2 in the Krakatau ash The extremely high 1034 ppm value for
Si in 3-lAll is beyond what can be found for soil Si in the literature
(Dr R L Fox personal communication) but not beyond theoretical
limits of Si solubility Chan (1972) presented a graph of Si02
solubility at various pH levels crystalline quartz at pH 2-4 was
soluble to about 2 m mole1 or about 56 ppm of Si in solution at up
to pH 8 the solubility increased to nearly 3 m mole1 or 84 ppm
of Si Other forms of Si are even more soluble Cristobalite the
least crystalline form of Si0 found in nature (Iler 1955) also has2
the greatest solubility Tridymite a form of Sio2 between quartz
and cristobalite in solubility was known to be in the Krakatau ecta
(Stehn 1929) but was not found in the X-ray diffraction patterns
(XRD) Cristobalite on the other hand exists in site 5 Amorphous
silica in the form of gel has a solubility of 001 - 0015 (100-150
ppm) at ordinary temperatures and the gel is thought to be abundant in
organic matter German researchers cited by Iler (1955) produced a
solution of colloidal silica containing 200 mg of Si02 per liter (220
ppm) which later stabilized at about 165 ppm comparing favorably with
the findings of Iler (1955)
In all probability the soil silicon in the sites is a combinashy
tion of several forms found in nature An accurate assessment is
difficult because of the impurity of minerals found in nature when
compared to the values of published standard end-members (Garrels
and Christ 1965) A compounding error may result from failure to
---------------------------middot------middot-middot--middot-----middotmiddot--middot--middotmiddotmiddot middotmiddotmiddot------middotmiddot-middot--middotmiddot---
105
recognize the silica that may result from ing of decomposing
plant parts
Several tree species found in Ujung Kulon are know-u to contain
amorphous silica Sharma and Rao (1970) found silica in vessels
fibers ray cells or vertical parenchyrma in about half of 134 species
of Indian timbers Many of the silica bear genera inclucied in
their findings are also found in Ujung Kulon among them Vitex
Cryptocarya Dillenia
tent of these genera was 006 - 082 for Syzygium to Artocarpus
respectively In the Philippines the Forest Products Research
Institute (1961) found 83 of 161 listed species contained silica
inclusions Streblus ____ and Artocarpus elastica were highest among
the 10 species found also in ejung Kulon with 482 and 396 silica
respectively No attempt was CTade however to determine the silica
content in Ujung Kulon tion Nevertheless it may be nore than
coincidence that the subsoil profiles of 5-1 where Streblus is
elastica is growing have corresponding-
ly high water-soluble silicon levels
It would seem that the most important factor for the high Si conshy
tent of sites 3 and 8 is the presence of carbonates in the soil The
work of Dienert and Wandenbulche reported by Iler (1955) demonstrated
that alkaline salts accelerate the formation of soluble silica Inasshy
much as the solubility of silica rises sharply with a rise in pH
(Iler 1955) there is concurrent cause-effect condition within these
sites Although the pH of the soils in site 3 varied from 649 -
773 the pH of the marl rock itself was 81
106
Silica may be the chief cementing agent in the marl of site 3
and de-silication may lead to formation of the lime sinter as
reported by Schenkel and Schenkel-Hulliger (1967) in streams of the
Telanca area The 11 sinter 11 is probably a combination of calcium
carbonate and highly hydrated silica Smooth surface crusts on rocks
found in the downstream reaches of the Telanca watershed are probably
a result of gradual evaporation of water rich in silica and calcium
Presumably as long as the water head has sufficient pressure the
silica and calcium are discharged into the sea When rainfall
diminishes however the width of streams decreases and the flow of
water declines Evaporation then takes place in isolated pools ard
along the peripheries of the water line Once dehydration has taken
place to a sufficient extent the crust hardersand becomes relatively
insoluble
Although the carbonates responsible for catalysis of soluble
silica are also found in site 8 and where high soil silica is
evident the lime sintering does not appear to take place On the
contrary the seasonal flooding tends to cause broad lateral disshy
persion of the solutes When drying occurs the solutes are
re-deposited in place resulting in high values for Si in surface
soils The dissolved solutes within site 3 may likewise lead to
high Si levels in the surface but owing to internal drainage
in the upper part of the Telanca escarpment the crusting effect on
rocks in the upper reaches of the streambeds is not evident
Another feature shared by the soils in sites 3 and 8 is an
apparent silicon-phosphate interaction Limestone may be phosphashy
tized (Clarke 1924) and the highest levels of extractable Pare
107
found in the calcareous soils of sites 3 and 8 In site 8 the sharp
reduction of Pin the subsoil (Table 17) may be due to seasonal
effects Reduction of Fe++-+ to Fe-++ apparently releases mobile phosshy
phate (Russell 1950)which riay be largely absorbed and stored in plant
tissue as discussed by Johnson (1976) When sampling is done in the
dry season the P levels might seem erroneously low Leaf P was
highest in sites 4 1 and 8 respectively (see Appendix A) Although
it is not known what species if any have norrrally high leaf P
levels the higher than average leaf P levels in site 4 may also be
a result of seasonal reducing conditions in the soil
Another apparent interrelationship exists between silicates
carbonates and phosphates It is thought that the carbonate andor
bicarbonate ion is the cause of greater Si solubility and P solubility
as well In sites 3 and 8 high Si and P levels (Table 17) go hand
in hand for the whole profile however Si decreases only gradaully
between hozizons except for the C and P decreases quite sharply in
the subsoils Since most plant roots go deeper than the shallow All
Al2 and C or corresponding overlying horizons efficient plant exshy
traction of P from subsoil is not unexpected Normally high amounts
of organically-bonded Pis typical in surface residues but may be
significantly more so in these sites due to the presence of carbonate
bicarbonate ions On the other hand Si could reduce P uptake below
its normal level Schollenberger (1922) found an inverse relationship
of P level and yield of wheat He speculated that silicon as CaSi03
lime could have had a P uptake ameliorating effect when substituted
for Caco 3 which produced the lowest yields but had the highest P
108
levels More recent data do not support this idea (Dr J A Silva
personal communication) Since both Si and P were high in the soils
of sites 3 and 8 no definite conclusion can be reached about the
nature of the relationship
Soil Genesis in Ujung Kulon
The study of the processes of soil development in Ujung Kulon is
facilitated by the presence of the precisely dated Krakatau tuff horishy
zon in the soil As a parent material the tuff has been designated
where it was found as the C horizon Soil formation atop the C subshy
sequent to tuff deposition must therefore represent either the
weathering products and alteration of the C horizon alluvial andor
colluvial accretions soil genesis due to mineralization of organic
matter or accretions due to inverted or partially-inverted horizons
resulting from upturned tree roots during wind blow-down Lack of a
C horizon would on the other hand indicate that erosion obliterated
the tuff Consequently nothing could be said about the rate of soil
formation in absolute terms Approximations could be made however
if the properties of the subsoils and other existing horizons were
sufficiently identified by comparing them with adjacent pedons conshy
taining the C horizon
weathering is a well known feature of tropical soils It
stands to reason that if weathering were the rule there must be
a correspondingly high rate of new soil formation In an attempt to
determine the factors which affect that rate Jenny (1941) focused on
weathering rate of a variety of materials of known age ranging from
tombstones to natural soil profiles The greatest weathering he
109
recorded was to a depth of 80 mm over 568 years in natural soil an
average development rate of 0141 mm per year Tamm as cited by
Jenny (1941) estimated that a podzol with 4 inches (102 cm) of raw
humus 4 inches of A and 10-20 inches (254-508 cm) of B horizon
requires 1000-5000 years to develop in Sweden an average rate of
0305-0711 mm per year Baren as reported by Jenny (1941) measured
350 mm of new soil developed on Lang Island in the Krakatau Group only
45 years after the 1883 eruption an astounding average of 778 mm
per year
Weathering of parent materials does not proceed uniformly over
the years however It takes place slowly at first in coarse textured
materials which have srr~ll surface area proceeds more rapidly as surshy
face area increases and again declines after most chemical dissolutiorshy
has been completed Temperature rainfall biota and the nature of
the parent materials all play important roles in the rate according
to the celebrated integral soil development concept first expounded
by Dokachiev Since all factors operate along a continuum each
factor representing a differential component true integration in the
mathematical sense is not possible It is more appropriate to say
therefore that in this study an average of about 98 mm of soil was
formed in the interim 90 years since the Krakatau eruptions Average
thickness of combined All and Al2 or corresponding horizons when they
occurred above an intact C horizon was 98 rrnn over 33 observations
Table 22 shows depth of overlying horizons and the relationship of
depth to site
The wide range in the thickness of horizons above the C horizon
within each site are manifestations of microsite differences Slope
110
Table 22 Thickness and occurrence of horizons overlying Krakatau tuff (C horizon) in Ujung Kulon soils
Site and pit Depth of overlying horizons C horizon thickness (cm) (cm)
1 1 8 4 2 6 7 3 5 6 4 8 9 5 18 7
2 1 absent 2 absent 3 absent 4a 19 9 4b 9 3 5 absent
3 la 10 3 lb 12 uneven 15 5
4 1 6 4 3 10 absent
5 la 9 absent lb 10 4 2 10 absent 3a 10 absent 3b 7 6 4 5 absent 5 10 absent
6 1 11 9 2 7 4 3 12 6 4 20 10 5 2 3
7 1 10 15 2 18 6 3 8 10 4 8 absent 5 5 3
8 1 13 10 lA 4 6 2 5 absent 3 13 11
111
perhaps is the most important factor playing a role in horizon thickshy
ness in Ujung Kulon inasmuch as slope influences or facilitates
erosion Localized difference in slope would be manifested in the
horizons which overlie the C as well as the C horizon itself Colmetshy
Daage and Gautheyrou (1974) noted the effects of steep slope on
differences in the thickness of ash deposits in Hartinque and
Guadeloupe Absence of the C horizon in 4 of 6 borings in site 2 and
in 5 of 7 borings in site 5 attest to conditions of localized erosion
Measurement of the thickness of overlying horizons however was done
when both the overlying horizons and subsoils were identified It is
noted that in site 2 even the overlying horizons were eroded off due
perhaps to periodic minor flooding of this site which lies astride a
small streambed
Any attempt to estimate the rate of soil formation would best be
made on flat rather than sloping ground Only sites 1 4 and 8 are
sufficiently level to qualify but it is thought that alluvial accreshy
tion predominates in site 4 while lateral transport of materials inshy
fluences soil building in site 8 (where organic residues seem to conshy
centrate in small hummocks) Only in site 1 does normal weathering
with depth appear to be least influenced by outside conditions
Colluvial accretion effects can be seen however in pit 1-5 which is
located near the base of a minor hump in an otherwise nearly level
site
The Tuff Layer
Identity of the Krakatau tuff layer is well established from the
disparaties of chemical and physical properties it possesses in
112
comparison with adjacent horizons Some results must be viewed with
reservations however In particular many ionic species which are
mobile in the soil may seem to cause abnormally high or low base stashy
tus in the C horizon Large differences may reflect ionic migration
upward or downward in the solum at a given point in time and be more
related to capillary or gravitational forces at different seasons
rather than relate to properties of the tuff itself The CEC it is
felt is a more nearly static and intrinsic chemical characteristic
of the tuff than is the status of exchangeable bases or other imporshy
tant nutrients The CEC of the C horizon has a standard deviation of
only 167 meqlOOg in the 6 sites where it was found and determined
compared to 1148 meqlOOg in the immediately adjacent overlying
horizons and 989 meqlOOg in horizons irrnnediately below Illustrashy
tion of CEC differences by horizon is shown in Figure 9 Furthermore
differences in CEC are not significant among site profiles considered
in their entirety but are significant at about a 2 level for various
horizons within each site (Table 23)
By a Duncan multiple range test (Duncan 1955 Harter 1960) a
significant difference of intra-profile CEC occurs between the C
horizon and the contact horizons but not between the contact horishy
zons Due to absence of Al2 horizons in sites 1 and 8 the immediate
contact horizons in Table 23 have been designated as upper and
lower
Differences in Munsell color values of the C horizon among the
sites suggest that the original color of the tuff is being altered to
more nearly that of the contact horizons It is thought that color
changes from dark to light reflect mostly organic matter and clay
Figure 9
CEC by Horizon of Selected Ujung Kulon Soi I Profiles
All
Al2
0 40 50
~A
~-Cr
C
0 N
0 I
C
DC
1-1 --3-1 ------4-1 -middot-middot-5-1 -middotmiddotmiddot-~middot-6-1 ---middot 8-1 -o-o-
nc1
nc2
CECmeqlOOg
10 20 30----1----+--_-vr ---- __ _
114
X
Table 23 Analysis of variance of intra-site and inter-site CEC of C horizons and contact horizons of selected profiles
Horizon Site 1 3 4 6 8 Total CEC me
Upper 18 40 14 30 21 41 164 273a
C 11 15 13 15 12 12 78 130b
Lower 19 33 36 21 14 135 22Sa
48 88 39 81 54 67 377
Source df MS
Sites 5 12312
Horizons within site 2 31906
Error 10 5472
Total 17
1 Means designated with the same letter are not significantly different at p lt05
115
eluviation Indeed most of the clay found in the C horizon appears
to be coatings on the tuff particle surfaces
If the organic matter and clay illuviates are mainly responsible
for fluctuations in the CEC then a closer approximation of the CEC
of pure tuff could be determined by subtracting the relative proporshy
tions of OM and clay Table 24 attempts to show this proposishy
tion It was assumed however that for all samples 1724 x OC =
OM all OM had 190 meqlOOg of exchange capacity and all clay
had 25 meqlOOg of exchange capacity The higher values obtained for
sites 3 and 5 would be further reduced if some proportion of the CEC
were ascribed to smectite which was found in both sites Xontshy
morillonite according to Rode (1962) has a CEC of 60-100 meqlOOg
Some color changes are also attributed to indirect effects of the
lower contact horizon Most noticeable in this respect was in site 1
where ant and termite movement through the soil resulted in intershy
mittant discoloration of the C horizon around well-travelled passageshy
ways Both upper and lower contact horizons soil colors could be
seen in the vicinity of the passageways Again however the color
as well as the chemical properties are thought to be transported
rather than situ features Nye (1961) suggested that considerable
fertility may be ascribed to the activity of termites inasmuch as inshy
creased crop yields have been reported in the vicinity of termite
mounds
Because the relatively fresh Krakatau tuff may be considered as
point zero in soil genesis any changes within a particular profile
since deposition may be more manifested in the C horizon than elseshy
where Relative change among profiles might also be reflected in
Table 24 Net CEC of tuff derived by subtraction of CEC components found in clay and organic matter
Sample Calculated CEC Less clay content Less OM content Net CEC meq100 g 25 rneq100 g 190 meq100 g meq100 g
0 M
1-lC 11 35 601 150 157 298 687
3-lC 1530 1619 405 167 317 808
4-lC 1311 951 238 252 479 594
5-lC 1454 1282 320 162 308 826
6-lC 1230 624 1 56 207 393 681
8-lCll 1159 410 102 226 429 628
8-1Cl2 1358 751 188 2 40 456 714
117
correspondingly greater change in the C horizon Where erosion is
severe however no comparisons are possible
The light hues of the deep subsoils in sites 2 5 6 and 7 suggest
that as weathering progresses soil color becomes increasingly lighter
over much of Ujung Kulon Decrease in particle size from sand to silt
to clay fractions should be from darker to lighter hues ifmiddot particle
size reduction and lighter coloration proceed simultaneously The data
in Table 25 demonstrate a semi-quantitative technique for expressing
the relationship of particle size separates and their corresponding
color changes In application the surface soil is the reference
color inasmuch as it has the darkest hue and lowest values and chroma
Departures of one unit in hue have arbitrarily been assigned a 3-count
departure in value of one unit a 2-count and departure of one chroma
unit a 1-count Scoring is based on positional change rather than
numerical unit change since chroma units assigned to different hues
are currently inconsistent
Intra-site and inter-site changes should reflect to some degree
the extent and rate of weathering Sharp color changes between soil
horizons do occur especia between the fresh C and the residual sub-
soils but it is because the tuff layer is an anomalous intrusion that
inter-site color changes may reflect soil neo-genesis processes most
clearly
It is recognized that a dark surface layer of organic residue is
the norm It is further recognized that not all soils would lend
themselves to analysis in this manner Spodosols for instance have
abrupt color changes from light to dark between the elluviated A2 horishy
zon and the diagnostic spodic horizon The proposed technique herein
118
used for Ujung Kulon soils must therefore be tested and refined to
account for differences among other dissimilar soils
Nevertheless the arrangement of color chips in Munsell color
coding is based on a logically progressive sequence which is supported
by the consistance of within-profile changes as seen in Table 25 On
the other hand the reasons for inconsistancy of change between soil
separates is not understood at this time Any change at all demonshy
strates that soil color is not uniformly shared among sand silt and
clay fractions The change in color is indicative of a weathering proshy
cess albeit here expressed in a form which depends upon quantum change
by discrete units rather than movement in a continuum The very coarse
sand fraction of 2-1B22t was found to contain only red mottles whereas
cylinders of the clay suspensions of that horizon resembled 6-lIIC and
7-lIIC For the most part progressive lightening of intra-profile
color change is clearly demonstrated in Table 25 because the bold conshy
trasts of the mottle colors are not easily detected in the whole soil
matrix also the very coarse sand fraction of 2-1B22t represented less
than 1 of the matrix Neither do drastic color changes occur in the
tuff horizon even though it is an anomoly because of the migration of
silt and clay through the profile
The effects of slope and consequent erosion are perhaps more
important in obliterating regular horizonation than any other factors
because of the speed with which the obliteration may be achieved A
notable example is the absence of All and Al2 horizons in much of site
2 although supplementary horizon descriptions (2-3 and 2-4 in Appendix
B) indicate they did exist Steep slope in 7-1 obscured differentiashy
tion of the All from Al2 in the main soil pit but ample evidence of
Table 25 Units of change in Munsell color codes by horizons and between soil separates of Ujung Kulon soils
Sample Sand
Units change
Silt Color Code
Units change
Clay
Units change
Units change between seearates
Sand to Silt to silt clay
1-lAll 1-lC 1-llIC
lOYR lOYR lOYR
32 32 32
0 0
lOYR 32 lOYR 44 75YR 32
+4 -3
75YR a
lOYR
44
43 +2
0 +4 -3
+ 1 a
+ 6
2-lA 2-1B22 2-1B22t
lOYR lOYR lOYR
32 44 44
+4 +4
lOYR lOYR lOYR
44 54 54 b
+2 +2
lOYR lOYR 25Y
54 54 64
0 +8
+4 +2 +2
+ 2 0
+ 5
3-4All 3-4Al2 3-4C 3-4IIC
lOYR 22 lOYR 22 25YR 52 lOYR 42
0 +9 +4
lOYR 22 75YR 32 lOYR 44 lOYR 44
c -1 +6 +6
lOYR lOYR lOYR lOYR
44 44 54 44
0 +2
0
0 -1 -3 +2
+ 4 + 7 + 2
0
4-lAll 4-1Al2 lt-lC 4-lllCl 4-1IIC2
lOYR lOYR lOYR lOYR lOYR
22 32 43 43 54
+2 +6 +5 +8
lOYR lOYR lOYR lOYR lOYR
2 2 d 22 d 32 d 32 d 44 d
0 +2 +2 +6
0 -2 -4 -3 -2
e e e e e
a d
- no sample - silt + clay
b e
- or 25Y - between
54 sand and
C -
silt + clay 3--11 Al2 rep was lOYR 3 2
Table 25 Units of change in Munsell color codes by horizons and between soil separates of Ujung Kulon so d
Sample Sand Silt Clay Units change Color Code between seEarates
Units Units Units Sand to Silt to
5-lAll 5-1Al2 5-lC 5-lIIC
lOYR 22 2SYR 32 2SY 52 SY 53
+s +9 +13
lOYR lOYR lOYR lOYR
31 32 42 52
+l +3 +s
2SY 2 SY lOYR lOYR
52 54 42 52
+2 -5 -3
+l -3 -5 -7
+10 + 9
0 0
6-lAll 6-1Al2 6-lC 6-lIIC
lOYR lOYR 25Y lOYR
32 42 42
58
+2 +5 +8
lOYR lOYR lOYR lOYR
44 44 44 58
0 0
+4
lOYR lOYR 2SY lOYR
54 54 54 68
0 +3 +4
+4 +2 -5
0
+ 2 + 2 + 5 + 2
7-1AllAl2 7-llIC
lOYR 32 75YR 44 0
lOYR lOYR
44 56 +3
lOYR lOYR
54 56 +l
+4 +6
+ 2 0
8-lAll 8-lC 8-lIICll 8-1IIC12 8-1IIC2
lOYR lOYR lOYR lOYR lOYR
22 42 42 5 2 53
+4 +4 +6 +7
lOYR
2SY 2SY lOYR
21 d a 32 d 32 d 42 d
+s +s +s
-1
-1 -1 -3
I- N 0
121
the horizons was seen in other borings Unfortunat the overall
steep slope within the sample plot precluded selection of a more
representative main pit On the other hand truncation of the proshy
file emphasizes the effects of slope At the opposite extreme of
slope no Al2 was distinguishable in 1-1 even though the ground was
level An irregular discontinuous Al2 was recorded however in
alternate faces of 1-1 and was seen in other borings throughout Ujung
Kulon The amount of soil available for multipurpose sampling was
insufficient however to maintain sampling integrity
Absence of a C horizon in some areas of Ujung Kulon possibly may
be attributed to removal of the tuff downfall by the action of the
tidal waves which followed the eruptions of August 1883 Since the
expulsion of the tuff from Krakatau preceded the last tidal wave the
washing action of the waves may have scoured the ground surface and
re-arranged the tuff deposits in sites which were less than 20 min
elevation Much water-borne tuff was also deposited in the lowlands
below the tidal wave crests Also since much pumaceous material was
expelled from beneath sea level large floatable pumice stones were
part of the cresting waters Average density of 4 samples of pumice
taken from the vicinity of Cidaun was 0505 gcm3 ranging in weight
from 552 g to 3052 g
Despite the fact that volcanic dust remained in the air currents
for 25 years (Furneaux 1964) local rain showers undoubtedly preshy
cipitated most of the ash in a short period of time so that the
ejecta as a source of soil parent material may be considered as
laid down at one time
Particles of tuff which were not water borne ostensibly those
122
heavier than air that descended in spots above the high water line
were composed of both wind blown fine and coarse materials Assuming
the 20 m was the actual high water mark sites 2 4 and 8 were defishy
nitely affected by wave action Sites 1 3 and 5 were borderline in
elevation (refer to Tables 4 6 and 8) and sites 6 and 7 were unshy
affected by the tidal waves It is felt that site 1 was also unshy
affected by tidal waves inasmuch as it is on the south coast of
Ujung Kulon and protected somewhat by G Kendeng which rises to about
100 m elevation in a blocking position north of site 1
Mineralogical Properties
Evaluation of the minerals present in Ujung Kulon soils is given
in Table 18 In most cases the primary mineral found is low-temperashy
ture quartz aSi0 2 occurring in the sand and silt fractions (see
X-ray powder diffraction file Sets 1-5 catalogue No 5-0490) A
few exceptions do exist The calcite parent material of the Telenca
formation (site 3) is clearly evident in the sand fraction of 3-4IIC
(see Appendix D) but inexplicably the major peak for calcite is
missing in the silt fraction of 3-4IIC (Appendix E)
In site 5 the crystalline a quartz cannot be positively identishy
fied in any size fraction or in any horizon Plagioclase appears to
be present in the X-ray traces of sand and silt and small amounts
of tridymite or cristobalite in the silt and clay fractions (Appendix
H) Since tridymite cristobalite and a quartz are all species of
Si0 2 identification in the traces is hampered probably by mixture
with primary plagioclase and with smectite which is also found in the
clay fraction As Garrels and Christ (1965) cautioned The most
123
serious error likely to be made is in forgetting how far minerals
do deviate from pure end-member composition bullbullbull
In addition to a quartz in site 8 calcium phosphate was found in
8-lIICl and i-1IIC2 silt+ clay Perhaps the calcium phosphate did
not appear in other X-ray traces owing to differences in oxidation
states The normally wet subsoils of site 8 also contain visably
greater percentages of marine shell fragments in the soil fabric In
8-1IIC2 shells composed about half of the whole soil Phosphorus reshy
moved from skeletal structures of marine organisms may replace carshy
bonates in calcareous sediments (Rankama and Sahama 1950) but the
transition is so rapid that unlike the formation of calcite as in
site 3 as discussed by Clarke (1924) no transition to aragonite is
evident
Various Ca Kand Na silicates in the soils of Ujung Kulon can
be seen in some X-ray traces but apparently they are so poorly
crystalline that positive identification has not been established
Secondary minerals which are found in the clay fraction -- and
in the silt+ clay where separation was not attempted -- seem to be
limited to kaolin smectite and halloysite for the most part
Selected examples of some primary and secondary minerals are given in
Appendix C-J Surface soils tend to have less secondary mineral
content in the clay although no attempt was made to quantify the
amount in each horizon A general lack of clay in the C horizon is
an indication that no substantial amount of clay has been eluviated
to the C horizon over the past 93 years The X-ray diffraction
pattern of the clay fraction of samples from 3-4C and 6-lC show
traces of only kaolin whereas 5-lC and 4-lC have smectite If the
124
soils of the Telanca area were grumusols (Vertisols) as mapped by the
Indonesian Soils Research Institute (Lembaga Penelitian Tanah 1966)
then the smectite rather than kaolin should be found in 3-4C
Soerianegara (1972) perhaps recognized the anomaly and classified
sandy soils over similar marl derived profiles on Pulau Peucang as
latosolized tuffaceous regosols over podzolized grumusols On the
other hand quartz and srnectite are seen in 4-lC (Appendix F) and
other horizons of site 4 Displacenent of 21 clays from upper
elevations in the terrain is the norm in soil transport and rapid
eluviation through the alluvial profile of site 4 apparently supershy
cedes any genesis of kaolin clays
Relative weathering by horizons can be deduced by the data given
on Table 19 The total Si02 decreases with th in all horizons
except the C In samples 1-lC 3-4C 5-lC and 6-lC the Si02 was
higher than in the upper horizons in sample 4-lC it was lower
Elevated Si02 levels in the tuff layer are attributed to the residual
of the original tuff composition which Mohr (1944) reported averaged
about 65 Sio2 Where found in the Ujung Kulon sites the tuff
ranged from 6406 - 6962 in total Si02 Si02 levels in the
surface horizons are due perhaps primarily to biocycling of silica
bodies in the litter Nevertheless plant roots in the lower horizons
are thought to re-absorb soluble silica as it becomes available so
that sequence de-silication except in the anomalous C horizon is a
true indication of soil
In site 8 however there is no apparent de-silication with
depth--in fact the reverse appears to be the case It can only be
suspected that excess SiOz accumulates at lower depths in response to
125
a normally high water table Even though site 4 also has a high
water table during the rainy season increase in its level is due to
downward percolation of water vertically through the profile Inshy
creases in water-soluble Si tend to bear out that leaching is the
mode of action On the other hand in site 8 the water table may
actually rise predominantly by vertical upward movement of ground
water rather than by direct filling by rain water once widespread
lateral movement of overflowed streams has infiltrated the lowest
spots in the terrain No trend can be seen in the data however
Lateral transport presumably enriches the ground water and the flucshy
tuating water table then becomes an important agent of transportashy
tion (Buol~ al 1973) within the profile
126
SUMMARY AND CONCLUSIONS
Ujung Kulon is an example of a tropical lowland moist forest
The evidence from eight sites investigated in this study points to
wide range in species composition tree frequency and basal area
among sites The heterogeneous forest thus described is composed of
many distinct vegetation associations composing a large mosaic Some
associations appear to be perpetuated as a result of edaphic factors
It is thought that excessive drainage in site 1 on level ground
along the south coast combined with a porous shallow soil leads to
draughtiness which precludes the establishment of many species which
are found elsewhere in Ujung Kulon Also the high density of
Lantana camara found there inhibits shade intolerant species from
becoming established
Site 8 in the northeast lowlands and to some extent site 4
between two promontories are influenced by a seasonal water table
which restricts species composition to plants able to withstand proshy
longed waterlogging Species composition differences between sites
4 and 8 may also be affected by soil pH In site 4 management
activities favor a cleared grazing area and the grazing itself keeps
the volume of vegetation at a low level
Site 2 along a minor drainage in central Ujung Kulon is low in
volume of stems and in species diversity probably as a result of
repeated erosion of the surface soil The presence of dense patches
of bamboo in a broad-leaved species-bamboo association probably reshy
sulted from pioneer establishment of the bamboo Schizostachyum
127
blumei in the eroded soil Subsequent establishment of other
species except near the association peripheries was inhibited
Sites 3 5 6 and 7 are examples of inland sloping and wellshy
drained forested areas that do not show evidence of either excessive
draughtiness of soils or of waterlogging The frequency of tree
stems the number of saplings present and the range of total basal
area of trees plus saplings suggest that the absence of limiting
soil physical factors results in markedly greater site utilization
in those areas Species heterogeneity among sites persists however
Greater homogeneity of intra-site speciation in sites 1 and 8
may be due to the effect of wind blowdown in addition to edaphic
factors Much of the northeast sector of Ujung Kulon including the
periphery of the Telanca area has a high water table where trees are
typically shallow-rooted and subject to blowdown by wind and watershy
spouts~
Soils and Their Properties
Numerous chemical nutrient determinations of the soils suppleshy
mented by leaf tissue analysis failed to establish definite relashy
tionships between nutrient status and apparent site productivity
Due to high content of organic matter and the presence of smectite
clay the cation exchange capacity of most soil profiles is moderateshy
ly high
Calcium predominates among the exchangeable bases of surface
soils especially in sites 3 and 8 which have high soil pH readings
and free Caco3 In subsoils of sites 6 and 7 the amount of exshy
changeable Kand Na exceeds Ca The volume of vegetation on the
128
bullgtbullbull-bullbullrnbullmiddotbullmbullillMillitrllilitlllSUMIMISill_ ________ ___ _____ middot- ____________ bull 4 -
sites could not be correlated with the amounts of exchangeable bases
or with the percentage base saturation The greatest numbers and
basal areas of trees and saplings occur in sites 6 and 7 which have
among the lowest total of exchangeable bases and the lowest BS
Organic carbon levels exceed 5 in about half of the surface
soils investigated but decrease sharply with depth Those soils
which have high organic C also have the greatest amount of total
nitrogen which is a maximum of about 05 Lower percentages of
organic C and Nin other surface soils and in deeper horizons of all
profiles except 1-lIIC generally correspond with one another so that
the CN ratio is relatively uniform
Amounts of extractable soil phosphorous detected vary widely
from a low of 3 ppm to a high of 275 ppm Although the highest P
levels are found in surface soils in some profiles high levels (up
to 170 ppm) are also found in the C horizon
The amount of water-soluble silicon detected is appreciable
thus reflecting the presence of a-quartz an important primary
mineral found in Ujung Kulon and other forms of silicon which
include silica bodies found in decomposing organic residues
cristobalite found in the silt and clay fractions and residual
Si0 2 in the Krakatau tupoundpound A probable P Si and carbonate-bicarshy
bonate ion interaction may explain the high values of those ions
in the calcareous soils of sites 3 and 8
In addition to a-quartz and cristobalite the Ujung Kulon
mineralogy also includes plagioclase calcite and calcium phosphate
among primary minerals and smectite and kaolin among secondary
minerals
--------------------------------------middot-- middotmiddot---middot-middot-----------middotmiddot-
129
This investigation showed evidence of a rapid rate of soil
development in the area of study Indications of clay increase with
depth and a decrease of Si02 R2o3 ratios with depth point to a podshy
zolization process of soil formation
It is speculated that the anomalous C horizon may have been reshy
sponsible for decreased tree growth and vigor for some time followshy
ing deposition in 1883 Species distribution patterns of some plants
may have also been affected The low biomass estimates obtained may
be partly due to the resultant stresses to the edaphic considerashy
tions described and to the natural limitations of productivity of
a moist tropical forest
Appendix A Plant tissue analysis data of selected species of Ujung Kulon vegetation
Site Species p
K
Ca
Mg
Na
Cu ppm
Fe ppm
Zn ppm
B ppm
Mn ppm
Al ppm
Ba ppm
1 Arenga obtusifolia Corypha utan Lantana camara
013 017 047
063 119 227
053 059 183
029 024 101
001 004 013
83 72
258
80 66
168
7 11 62
27 23 84
63 181 174
50 50
150
03 00 94
2 Arenga obtusifolia Artocarpus elastica Dillenia excelsa Schizostachyum blumei
013 014 016 012
074 086 095 069
078 125 143 015
025 013 022 018
001 004 006 001
84 72 76 73
168 204
71 63
10 10 20
220
25 33 49
4
32 54 21
282
210 300 120
90
92 441 465 108
3 Aglaia elliptica Arenga obtusifolia Strombosi~ javanica Wetria macrophylla
014 011 033 017
051 063 073 066
1 26 094 212 236
o 34 024 046 026
015 002 006 002
152 95
127 85
ll5 61 68 84
15 10 13 13
145 27 50 61
44 26 30 49
170 80 90
100
36 1 7 24 39
4 Chrysopogon aciculatus 021 Dillenia obovata 022 Ilyptis o 43
1 63 110 522
027 141 1 73
025 048 068
003 006 009
82 91
147
316 146
1183
28 21 97
39 60
108
218 589 664
290 140 950
47 53
341
5 Arenga obtusifolia Drypetes macrophylla Mangifera indica Memecylon edule
012 009 010 009
040 091 045 0 45
087 203 238 o 73
030 051 040 031
001 005 002 022
83 86
126 111
59 54 63
107
8 11 10 8
27 53 26 39
28 43
239 21
110 100 llO 170
169 876
1053 446
6 Fagraea auriculata Fkus pisocarpa Neesia altissima ~~ium syzygoides
009 007 012 009
1 58 1 39 098 090
136 083 103 1 54
055 033 042 0 41
004 002 006 006
114 110
91 108
149 57
116 85
24 10 15 21
29 67 56 70
165 34
474 593
250 100 230 160
861 178 298 290
t- w 0
Appendix A Plant tissue analysis data of selected species of Ujung Kulon vegetation (Contd)
I Site Species p K Ca Mg Na Cu Fe Zn B Mn Al Ba
m ppm ppm ppm ppm ppm ppm
7 Ficus vasculosa Meliosma nitida Neesia altissima Ryparosa javanica
015 014 014 031
015 202 049 138
080 054 1 38 073
1 23 060 067 085
038 005 012 006
94 128 113 123
442 224 153
82
16 10
9 14
149 91 67 67
432 202 467 140
810 800 470 193 270 594 150 373
I I I
8 Ardisia humilis Corypha ut-an Neonauclea calycina Vitex quinata
018 020 015 042
239 190 106 054
220 050 1 52 097
086 023 029 037
057 006 009 009
116 85
114 75
81 38 46
177
22 11 16 20
113 21
155 132
37 73 30 57
140 60 80
190
22 00 31 37
I I
I i I
I I
I
w
Appendix B Depth in cm of horizons of main and supplementary erofiles __of Ujung Kulon soil sampling sites
Site
1 All Al2 C IIC R
o-2a 2-Ba 8-12a
12-98a 98+
All Al2 C IIC
0-1 1-6 6-13
13+
All Al2 C IIC
0-2 2-5 5-11
11+
All Al2 C IIC
0-1 1-8 8-17 17+
All Al2 C IIC
0-11 11-18 18-23 23+
2
3
A B22 B22t
All Al2 C IIC
0-13 13-71 71-150
0-4 4-10
10-13 13-95
All Al2 C IIC
0-4 4-15
15-20 20-80
All A12 C IIC
0-3 3-9 9-12
12+
All Al2 C IIC
0-10 10-19 19-28
28+
Bl B-IIC IIC
A IIC
0-10 10-43 43+
0-5 5+
4 All Al2 C IICl I1C2
0-2 2-6 6-10
10-55 55-82
All Al2 IICl IIC2
0-2 2-10
10-70 70-110
aAlternate face of main pit
bseparate pit
cNo pit underwater
dAlternate site
Appendix B Depth in cm of horizons of main and supplementary profiles of Ujung Kulon soil sampling sites
No
5 All Al2 IICl IIC2
0-5a 5-9a 9-75a
75+ a
All Al2 IIC
0-4 4-10
10-75
All Al2 C nc
0-2 2-10
10-30 30+
All Al2 B
0-5 5-70
7o+
All Al2 B
0-3 3-10
10+
6 All Al2 C nc
0-2 2-11
11-20 20-150
All Al2 C IIC
0-1 1-7 7-11
11+
All Al2 C nc
0-4 4-12
12-18 18+
AllAl2 C IIC R
0-20 20-30 20-45 45+
A C UC
0-2 2-5 5+
7 All Al2 C IIC
0-2 2-10
10-25 25+
All Al2 B C IIC
0-3 3-18
18-30 30-36 36+
All Al2 C IIC
0-2 2-8 8-18
18+
All Al2 IIC
0-2 2-8 8+
All Al2 C IIC
0-3 3-5 5-8 8+
8 A C IICl IIC2
0-4b 4-lOb
10-36b 36+
A C IIC
0-5 5-36
36+
A C IIC
0-13c 13-24d 24+
A Cll Cl2 IIC
0-12 12-90 90-105
105+
C
Appendix C X-ray diffraction pattern of silt+ clay fractions of lC horizon in site l (Mg-saturated wet paste)
l()IJ IOO IJO
110 90
00 eu OU
10 70 70
Q = Quartz60 bO 60
l
d = 3338 A
IU l1gt
Q Q d = 427 A
10 c
0 0 00 CI
0 N C)
0 0 C)
0 00 N
0
deg N
0 -t N
0 N N
0 O N
0 00 -I
0
deg-I 0
-t rl
0 N rl
0 0 rl
0 00
0
deg 0
-r
Degrees 20
Appendix D X-ray diffraction pattern of sand fraction of 4IIC horizon in site 3 (powder sample)
1)0 I())=3038A100 10
I oto o WQ
110 60 II
70 10
~o 60
$0 ~o ~
40
d = 2094 A d = 2 495 A 1 )(1 pd 1877 A
C C C C C w d = 2287 A
10 d = L 914 i
10 Ilt) 0
0 0 00 N co 0 ONO 0 0 0 0 0 odt 0 00 -t N
If) t -t deg -t -t t M degr) r) r) r)
Degrees 20
llltJ
C = Calcite
70
60
o
40
C
d
C
386 A ~
h)
0 OC N
0
deg N
0 t (~
0 N N
0 0 N
oc8 i-1
t-J w VI
Appendix E X-ray diffraction pattern of silt fraction of 4IIC horizon in site 3 (Mg-saturated wet paste)
100 100 100
iO IJO 90
JO eo
lO 70
60 60
d == 3197 A
50 Q == Quartz ~o
40 40 o
QF
0 0 0 0 0 0 0 0 0 0 0 0 0 0 0 0 a 0 0 8 0 0 CX) -er N 0 CX) -t N 0 CX) -t N 0 CX) 4
t--t ltI Ci Ci Ci ltI N CI N N N rl rl rl deg deg rl rl deg deg w 0
Degrees 20
Appendix F X-ray diffraction patte~n of silt+ clay fractions of lC horizon in site 4 (Mg-saturated wet paste)
100 100
to 90
10 oeo
10 10 10
d = 335 A 60 60 tiil Q = Quartz
S = Smectite 50 50 so bullo
d = 2455 A
bullo 40 d 427 A
40 d = 192 A Q
lO
10
Q
lO
0 0 0
0 0 -t
0 a) ()
0
deg(Y)
0 -t ()
0 N ()
0 0 C1
0 co N
0
deg N
0 -t N
0
N
0 0 N
0 IX)
rl
0
deg rl
0 I rl
0 N r-l
0 0 rl
0 00
0 -t
Degrees 20
Appendix G X-ray diffraction pattern of sand fraction of 1Al2 horizon in site 5 (powder sample)
100100100
110110~o
1080uo
707010
F = Feldspar
606060
10toso
I
d = 3209 A 104040
d = 2522 A d 3028 A
lo = JO10
F F F F 1 F
20 d = 404 A
=o
~ 0 0 0 00 0 0 0 0 0 0
0 0 0 0 0
0 0 0 0 0
-ct N 0 co ct N 0 co -t N 0 00 ct N 0 co l) LJ) LJ) ct deg-t -t ct -ct M degM M M M N N N N -j
DegnLS 20
Appendix H X-ray diffraction pattern of silt fraction of lIIC horizon in site 5 (Mg-saturated wet paste)
100 100 100
90 to 90
IQ 1080
10 707Q
CR = Cristohalite 60 eo6Q
s = Smectite
so 50 $0
40 40 d = 404 A d = 201 A40
CR s CR
JO
d = 2481 A 10
d == 421 A JO
lO lO
0 0 0
0 0 0 0 0 0 0 0 0 0 0 0 0 0 0 0 0 0 co () deg ()
t ()
N (yen)
0 ()
co N deg N
-1 N
N N
0 N
co -j deg -
middot1 rl
N rl
0 r-l
co 0 -1
Degrees 20
Appendix I X-ray diffraction pattern of clay fraction oflIIC horizon in site 6 (Mg-saturated Yet paste)
100 100
100
10 o 00
80 bullo
70 10
H H = Halloystte110
60
d = 3547 A
511
40 bullo
d = 419 A
10 10
0 0 0
0 0 -t
0 00 ()
0
deg ()
0 t ()
0 N ()
0 0 M
0 co N
0
deg N
0 -r N
0 N N
0 0 01
0 0) r-l
0
deg bull-i
0 --t rl
0 N -j
0 0 rl
0 00
0
deg 0
-t t- +0
Degrees 20
Appendix J X-ray diffraction pattern of silt + clay fractions of IICl horizon in site 8 (Mg-saturated wet paste)
bulloo 100 IOO
o 90 ~lt)
00 d = 330 A ro Olt)
70
CP 60
so d = 2455 A
CP d = 303 AAO
Q CP CP
lO
0
0 0 0 0 0 0 co 0 -t N 0 co 01 01 01 tlti 0) N
7() 70
middotcp = Calcium phosphate Q
60 Q = QuartzfO
d = 335 A K - KaoUn
50 30
s = Smectite d = 192 ACP d = 425 A
40 40 sQ K
JO
d = 714 A l(I
10
0 0
0 0 0 0 0 0 0 0 0 0 0 0 -r N co -t N 0 00 -t J-(1 N 01 rl rldeg rl rl rl deg
Degrees 20
142
APPENDIX K
Range of Ejecta Dispersion
By theoretical considerations some of which were given by Verbeek
(1885) the ejecta of Krakatau--even free falling particles--could
have reached all parts of Ujung Kulon Assuming negligible air fricshy
tion as did Verbeek and also ignoring elevation since much of the
ejecta was spewed forth from below the level of the sea the maximum
range of free falling bodies can be estimated by
2R = V g (21)
0
at an angle of 45deg which gives the greatest range Knowing the
initial velocity V is the problem and must be determined indirectly0
from other information given by Verbeek Treating vertical and hori-
zontal components of ejecta trajectory as vectors where V is the X
horizontal component and V is the vertical component the resultant y
vector V -- or the initial velocity--is the hypotenuse of a right0
triangle with the angle e = 45deg
i
With angle e known
(22)
143
and V X
= V 0
Cos 0 (23)
Likewise Vy= V0
Sin G (24)
Actual height y depends upon time of flight The time to reach height
y is designated as Ty and height y at any time Ty is determined froru
the gravatation expression
2 y = VyTy - l2gt y ( )
2where g is the force of gravity 981 msec Height y is a maximum
at a point where the first derivative of (25) is equal to zero so
that with respect to time
2Y = Vy - gTy (26)dt
at dydt = 0 equation (26) becomes
0 = Vy - gTy (27)
re-arranging to g Ty= Vy (28)
and Ty= (29) g
We can now solve for Vy by information given by Verbeek (1885) who
assigned Ty as 15 minutes (90 sec) Substituting in values in
equation (28)
2981 msec x 90sec = Vy
Vy= 8829 msec
It is also seen that Vx = 8829 msec Rewriting equation (24) to
(30)
and substituting
V = 8829 msec o 0707
V = 12486 msec0
144
The total lateral distance V within the right triangle wouldX
however put ejected particles at the top of their trajectory Total
range R must be twice the time to rise Ty The formula then becomes
R = V 2Ty (31)X
Substituting into (31)
R = 8829 msec x 2 X 90 sec
R = 158922 m
which rounds off to 159 km Equation (21) gives the same result once
the V has been established 0
As was stated earlier all of Ujung Kulon is between 56-84 km
distance from Krakatau Given sufficient force many various sized
particles could reach the remotest parts of Ujung Kulon Actual trashy
jectory is much less in air due to air resistance as well as gravity
Large dense projectiles travel proportionally further in air than do
smaller particles Air resistance varies with form of projectiles
cross sectional area and the velocity of the projectile An adaptashy
tion of the air resistance formula of Lissack (1907)
D=r_g_ (32) w
where Dis drag or retardation r is air resistance g is force of
gravity and w is weight of projectile in kilograms can be used to
show that small particles of tuff had very limited range in air
First an approximation must be made of a particle of known size
and sufficient weight to be relatively unaffected by wind A fistshy
sized particle of pumice reported at Ketembang some 40 km from
Krakatau (Verbeek 1885) would have a diameter of perhaps 10 cm
145
Considered as a sphere its volume
3Vol= 43 n r (33)
3is 5236 cm An average density of pumice as previously computed
3 was 0505 gcm Weight of the pumice stone (technically its mass)
is
Mass= Density x Volume
= 0505 g 3 x 5236 cm3 cm
= 2644 g
Air resistance acting upon the pumice can now be compared with lighter
and heavier particles Ignoring the shape of projectile air resisshy
tance varies with the square of projectile velocity at velocities over
1350 ftsec (411 msec) and up to the 6th power of velocity at veloshy
cities under 900 ftsec (274 msec) according to experimental evishy
2dence (Lissack 1907) Using only v as a substitute for r in equashy
tion (32) a new equation
D = (34) w
may be written Using the initial velocity of eruption from equation
(30) above and ignoring units in the answer the air resistance facshy
tor for the Ketembang pumice is then
D = 12486 (msec) 2 981 msec 2644 kg
= 58 X 107
compared to 11 x 105 for a 300 pound (13636 ) artillery shell and
58 x 109 for a 264 g tuff particle How then according to Verbeek
(1884) was pumice the size of a fist bull still thrown at a disshy
tance of 40 kilometers and did pumice stones fall on Serang (Anon
146
1883) some 78 km E of Krakatau as well as 70-80 km in the opposite
direction (Leeuwen 1936) How did tuff particles of 0146 g appear
in the C layer of 6-1 in still another quadrant According to equashy
tion (34) the retardation factor D of these small particles is about
1110 x 10 but the distance at which they were found is about 78 km
SSW of Krakatau
The solution to the seeming paradox in which light vescicular
tuff particles are carried to comparable distance as heavy particles
may be related to movement of all particles in the ascending phase of
flight Perret a volcanologist quoted by Holmes (1965) described a
nuee ardente (glowing cloud) as an avalance of an exceedingly dense
mass of hot highly gas-charged and constantly gas-emitting fragmental
lava much of it finely divided extra-ordinarily mobile and pracshy
tically frictionless because each particle is separated from its
neighbors by a cushion of compressed gas Although movement of true
nuees ardentes is primarily downward in response to gravity the lack
of friction and rapidly expanding gas characteristics could well apply
to particles in the ascending phase
If the ascent is also assisted by thermal currents and by virtue
of the gas overcoming air resistance within the mass of ascending
gases the free fall 11 of cinders and ash may not actually commence
until the individual particles are beyond the effects of the gases in
their particular trajectories Holmes (1965) wrote of incadescent
pumice of Krakatau which rose to 50 miles (80 km) in the air but
Wexler (1951) gave a 32 km maximum which seems more accurate
Thus it is that neither normal ballistics formulae nor trajectory
in formulae adequately describe the kinetics of volcanic ejecta
14 7
Heavy particles may behave more nearly like ordnance in flight because
they are less affected by the gas propulsion thus ballistics formulae
for trajectory in air would seem more appropriate Vescicular tuffs
however of considerable cross-sectional area but low density would
appear to conform more closely with the trajectory in vacuo concept
Accordingly the trajectory estimations using both methods have been
presented here The difference in range between ballistics trajectory
and in vacuo trajectory does not vary by more than a factor of 2
Wind-assisted pumice would have a greater lateral range than in
the examples used contra-wind pumice would have lesser range August
jet-stream direction over the Sunda Strait is ENE its velocity about
10 msec its height about 12 km and its vertical depth about 3000 n
(Dr C S Ramage personal communication) Thus falling pumice
cinders and ash of various sizes and descent angles would be displaced
to the WSW on encountering the jet-stream
Since most of the Krakatau ejecta was over water in the SW quadshy
rant the sole Verbeek (1885) measurement of 10 mm thickness in Ujung
Kulon does not seem to be at all representative The ENE jet-stream
notwithstanding cinders of 06 mm average diameter descended in
Bogar some 150 km ESE of Krakatau between 11 AM and 3 PM of
August 27 reported by Verbeek (1885) Mohr (1944) seemed to confirm
the role of wind dispersion near ground-level as well as within the
jet-stream however his exact wording was somewhat confusing
toward Bantam the ash was blown back eastwards (sic) by the high
counter-trade winds so that all the coarser ash had already fallen
to the west before such material as reached greater heights began its
148
journey eastwards By convention wind directional notations refer
to point of origin and not to path of destination as Mohr seemed to
have implied
149
LITERATURE CITED
Allison L E and Moodie C D 1965 Carbonate pp 1379-1396 Black et al (Eds) Methods~ soil analysis Part II
ASA No 9 Amer Soc Agron Madison Wisconsin
American Society for Tes and Materials 1967 X-ray powder data file sets 1-5 (inorganic) Vol PDIS SIRB
Anonymous 1961 Occurrence of silica inclusions in Philippines woods Forest Products Research Institute Tech Note No 24 College Laguna Philippines unpaged
Anonymous 1883 Notes Nature 28425
Ayres A S and Hagihara H H 1952 Available phosphorous in Hawaiian soil profiles Hawaiian Planters Record 52(2) 81-99
Backer C A and Bakhuizen van den Brink R C 1963-68 Flora Java Vol I-III Walters-Noordhoff N V Groningen
Netherlands
Bannister B A 1970 Ecological life cycle of Euterpe globosa Gaertn pp B299-314 In Odum H T and Pigeon R F (Eds)_ tropical forest Div of Tech Info US Atomic Energy Comm
Batavia Magnetisch en Meteorologisch Observatorium 1896-1909 Regen waarne mingen in Nederlandsch-Indie
Beard J S 1949 The natural vegetation of the Windward and Leeward Islands Oxford Forestry Memoirs No 21 Clarendon Press Oxford
1942 Montane vegetation in the Antilles Carib For 361-74
Black C A Evans D D White J L Ensminger L E and Clark F E (Eds) 1965 Methods of analvsis Part II ASA No 9 Amer Soc Agron Madison Wisconsin
Boerma J 1925 Regenval in Nederlandsch-Indie Koninklijk Magnetisch en Meteorologisch Observatorium te Batavia Landsdrukkerij-Weltevreden (Netherlands)
Buol S W Hole F D and McCracken R J 1973 Soil and classification Iowa State Univ Press Ames Iowa 360 p
150
Cain S A Castro de Olivera G M Pires JM and da Silva N T 1956 Application of some phytosociological techniques to Brazilian rain forest Amer Jour Botany 43911-941
Chan J K 1972 Chemical and morphological characterization of the noncrystalline fraction in the Hilo soil (Typic Hydrandepts) MS Thesis Univ of Hawaii Honolulu Hawaii
Chapman H D 1965 Cation-exchange capacity pp 891-901 In Black et al (Eds) Methods of soil analysis Part II A S A No 9 Amer Soc Agron Madison Wisconsin
Clarke F W 1924 The data of geochemistry US Govt Print Office Washington DC 841 p
Chenery E M and Hardy F 1945 The moisture profile of some Trinidad forest and cacao soils Trop Agric 22100-115
Colmet-Daage F and Gautheyrou J 1974 Soil associations on volcanic material in tropical America with special reference to Martinique and Guadeloupe Trop Agric 51121-128
Dansereau P 1963 The barefoot scientist Colorado Quarterly 12113
Dawkins H C 1959 The volume increment of natural tropical high forest and limitations on its improvement Empire For Review 38175-180
Decker R W and Hadikusmo D 1961 Results of the 1960 expedishytion to Krakatau J Geophys Research 663497-3511
Dudal R and Soepraptohardjo M 1961 Soil classification and soil survey Bogor Institute of Agricultural Sciences Bogor Indonesia 94 p
Duncan D B 1955 Multiple range and multiple F tests Bioshymetrics 111-42
Fox R L Silva J A Younge O R Plucknett D L and Sherman GD 1967 Soil and plant silicon and silicate response by sugar cane Soil Sci Soc Amer Proc 31775-779
Furlong W and Furlong J 1974 Volcanoes mavericks of the mountains Holiday Magazine AprilMay 1974 p 29 64 66
Furneaux R 1964 Krakatoa Prentice-Hall Englewood Cliffs New Jersey
Garrels R M and Christ C L 1965 Solutions minerals and equilibria Harper and Row New York 450 p
151
Gause R W 1934 Principles of biocoenology Quart Rev Biol 11320-336
Gerard R W 1965 Intelligence information and education Science 148762-765
Grieg-Smith P 1965 Notes on the quantitative description of humid tropical forest In Symposium on Ecological Research in Humid Tropics Vegeta Govt of Sarawak and UNESCO
Hairston N G 1959 Species abundance and community organizashytion Ecology 40404-416
Harter H L 1960 Critical values for Duncans new multiple range test Biometrics 16671-685
Hilgard E 1912 Soils their formation properties comuosition and relations~ climate and plant growth in the humid and arid regions MacMillian Co New York 563 p
Hodder B W 1968 Economic development tropics Methuen and Co Ltd London 246 p
Hock M and Kostermans A 1950 Verslag over sen bozoek aan het Wildreservaat Udjung Kulon in juni 1950 Dienstrapport ( )
Holdridge L R 1970 A system for representing structure in tropical forest associations pp Bl47-150 In Odum H T and Pigeon R F (Eds) A tropical rain for Div of Tech Info US Atomic Energy Comm
1967 Life~ ecology Tropical Science Center San Jose Costa Rica 198 p
Holmes A 1965 Principles of physical geology Ronald Press New York 1250 p
Hong T K and v Schuylenborgh J 1959 On the classification and genesis of soils derived from andesitic volcanic material under a monsoon climate Neth Jour Agric Sci 71-21
Hoogerwerf A 1970 Ujung Kulon - the land of the last Javan rhinoceros E J Brill Leiden Netherlands 512 p
and silicates Cornell Univ Press Ithaca New York
Iler R K 1955 The colloid chemistry of
Indonesian Forest Service 1957 Nature park Ujung-Kulon Bogar Indonesia unpaged
Jackson M L 1958 chemical analysis Prentice-Hall Englewood Cliffs New Jersey 498 p
152
Jenny H Gessel S P and Bingham F T 1949 Comparative study of decomposition rates of organic matter in temperate and tropishycal regions Soil Sci 68419-432
Jenny H 1941 Factors of soil formation McGraw-Hill New York 281 p
Joffe J S 1936 Pedology Rutgers Univ Press New Brunswick New Jersey 545 p
1931 Soil profile studies III The process of podolization Soil Sci 32303-323
Johnson N E 1976 Biological opportunities and risks associated with fast-growing plantations in the tropics J For 74206-211
Kartawinata E K 1965 Notes on the vegetation of the Peutjang Island (SW Java) In Symposium on Ecological Research in Humid Tropics Vegetation Govt of Sarawak and UNESCO
Keng J C W and Uehara G 1973 Chemistry mineralogy and taxonomy of Oxisols and Ultisols Soil and Crop Sci Soc of Florida Proc 33119-126
Kilmer V J and Alexander L T 1949 Methods of making mechanishycal analyses of soils Soil Sci 6815-24
Kira T 1969 Primary productivity of tropical rain forest Malayan Forester 32375-384
Krliger C (Ed) 1971 Volcanoes G P Putnams Sons New York 163 p
Lang G E Knight D H and Anderson D A 1971 Sampling the density of tree species with quadrats in a species-rich tropishycal forest Forest Sci 17395-400
Lembaga Penelitian Tanah 1966 Peta tanah tindjau Kabupaten Pendeglang Bogor Indonesia
Lissack O M 1907 Ordnance and gunnery John Wiley amp Sons New York 594 p
Leeuwen dv W M 1936 Krakatau E J Brill Leiden Netherlands 506 p
Macdonald G A 1972 Volcanoes Prentiss-Hall Englewood Cliffs New Jersey 510 p
McIntosh R P 1967 An index of diversity and the relation of certain concepts of diversity Ecology 48392-404
~--------bullbullbullrrbullttMrllillmiddotiii___erbullmiddot1110--- -----------middot__ __________ ~---t middot--middotmiddot-- ___ ___ ~
153
McPherson WW and Johnston B F 1967 Distinctive features of agricultural development in the tropics pp 184-230 In Southworth H M and Johnston B F (Eds) Agricultural~ development and economic growth Cornell Univ Pres Ithaca New York 583 p
Mohr E C J 1944 The soils of equatorial regions Translated from Dutch by R L Pendleton J W Edwards (Publ) Washington DC 694 p
1930 De grond van _Iava en Suplatra J H DeBussy Amsterdam 258 p
1922 De bodem van Java en Sumatra
Mueller-Dombois D and Ellenberg H 1974 Aims and methods poundi vegetation ecology John Wiley and Sons New York 547 p
Nye P H 1961 Organic matter and nutrient cycles under moist tropical forest Plant and Soil 13333-346
Odum H T 1970 The El Verde study area and the rain forest systems of Puerto Rico pp B3-32 In Odum H T and Pigeon R F (Eds) _ tropical rain forest Div of Tech Info US Atomic Energy Comm
Ovington J D and Olson J S 1970 Biomass and chemical conshytent of El Verde lower montane rain forest plants pp H53-78 In Odum H T and Pigeon R F (Eds) _ tropical rain forest Div of Tech Info US Atomic Energy Comm
Parsons R B and Herriman R C 1975 A lithosequence in the mountains of Southwestern Oregon Soil Sci Soc Amer Proc 39943-948
Pellek R 1971 A study of site factors associated with the growth and management of teak plantations in Trinidad M S Thesis Univ of Florida Gainesville Fla
Rankama K and Sahama T G 1950 Geochemistry Univ of Chicago Press Chicago 912 p
Richards P W 1952 The tropical rain forest Cambridge Univ Press Cambridge 450 p
Rode A A 1962 Soil science Translated from Russian Natl Science Foundation 517 p
Russell E J 1912 Soil conditions and plant growth 8th ed (1950) Longmans Green amp Co London 606 p
Salter P J 1967 Methods of determining the moisture charactershyistics of soils Expl Agric 33163-173
154
Sanchez PA 1973 Review of soils research in tropical Latin America N C Agric Exp Sta Tech Bul 219
Satmoko K P 1961 Udjung Kulon Nature Park Java Nature Cons in W Malaysia 1-25
Schenkel R and Schenkel L 1973 Protection and management of the Udjung Kulon National Park for the Javan rhinoceros and other species World Wildlife Yearbook 1972-73 p 128-132
~~~~~- and Schenkel-Hulliger L 1969 The Javan rhinoceros (Rh sondaicus Desm) in Udjung Kulon Nature Reserve Its ecology and behavior Acta Tropica 2698-133
Schollenberger C J 1922 Silica and silicates in relation to plant growth and composition Soil Sci 14347-362
Schofield R K 1949 Effect of pH on electric charges carried by clay particles J Soil Sci 11-8
Schuylenborgh J v 1958 On the genesis and classification of soils derived from andesitic tuffs under humid tropical conshyditions Neth J Agric Sci 699-111
1957 Investigations on the classification and genesis of soils derived from acid tuffs under humid tropical condishytions Neth J Agric Sci 5195-206
and Rummelen F F F E v 1955 The genesis and classification of mountain soils developed on tuffs in Indonesia Neth J Agric Sci 3192-215
SEAMEO BIOTROP 1972 Quantitative vegetational study of a tropical rain forest in the Peucang Island S W Java Tech Report of Train Course in For Ecol May 26 - July 6 1972 Bogor Indonesia 32 p
Sharma M and Rao K R 1970 Investigations on the occurrence of silica in Indian timbers Ind For 96740-754
Soerianegara I 1972 Soils of Peutjang Island Southwest Java SEAMEO BIOTROP Bogor Indonesia 15 p
1970 Soil investigation in Mount Hondje Forest Reserve West Java Rimba Indonesia 251-16
Soepraptohardjo M Soewardjo and Dudal R 1966 Exploratory soil map of Java and Madura scale 1250000 Soil Research Insti-tute Bogar Indonesia
155
Stehn C E 1929 Krakatau Part I the geology and volcanism of the Krakatau Group Fourth Pacific Science Congress 118 p
Tamimi Y N Matsuyama D T and El-Swaify S A 1972 Effect of CaC03 CaSi03 on Pon pH-dependent charges and cation reshytention in an Hydric Dystrandept in Hawaii Agron Abst 197289
Tan K H and Schuylenborgh J v 1961 On the classification and genesis of soils developed over volcanic material under humid tropical conditions II Neth J Agric Sci 941-54
Taylor M S 1974 The effect of soil aggregate size on seedling emergence and early growth East Afric Agric For J 40204-213
Thornbury W D 1954 Principles of geomorphology John Wiley amp Sons (New York) 576 p
Tomlinson P B and Soderholm P K 1975 The flowering and fruiting of Corypha elata in South Florida Principes 1983-99
Tschirley F H Dowler C C and Duke J A 1970 Species diversity in two plant communities of Puerto Rico In Odum H T and Pigeon R F (Eds) A tropical rain forest Div of Tech Info US Atomic Energy Comm
Uchida R S 1973 The effect of calcium silicate on cation exshychange cpacity and on exchangeable potassium calcium and magnesium in a field trial on a Hydric Dystrandept MS Thesis Univ of Hawaii Honolulu Hawaii
US Department of Agriculture 1951 Soil survey manual US Govt Print Office Washington DC 503 p
Verbeek R D M 1885 Krakatau Batavia
1884 Notes Nature 3010-15
Wadsworth F H and Bonnet J A 1951 Soil as a factor in the occurrence of two types ofmiddot montane forest in Puerto Rico Carib For 1267-70
Walker A 1947 A critical examination of a rapid method for deshytermining organic carbon in soils - effect of variations in digestion conditions and of inorganic soil constituents Soil Sci 63251-264
Walker H Harnickell E and Mueller-Dombois D 1975 Climateshydiagram maps of the individual continents and the ecological climatic regions of the earth Translated from German Springer-Verlag Stuttgart 36 p
156
Warnaars B C and Eavis B W1972 Soil physical conditions affecting seedling root growth II Mechanical impedence aeration and moisture availability as influenced by grainshysize distribution and moisture content in silica ponds Plant and soil 36623-634
Wedepohl K H (Ed) 1969 Handbook of geochemistry SpringershyVerlag (New York) 411 p
Wentworth C K and Williams H 1932 The classification and terminology of the pyroclastic rocks Nat Res Council Bul 8919-53
Wexler H 1951 Spread of the Krakatau volcanic dust cloud as related to the high-level circulation Bul Amer Xeteor Soc 3248-51
Whitt P M and Baver L D 1937 Particle size in relation to base exchange and hydration properties in Putnam clay J Amer Soc Agron 29905-916
Williams C N and Joseph K T 1970 Climate soil and crop production in the humid tropics Oxford Univ Press Kuala Lumpur 177 p
- Pelleck_2017-08-10_163515_0001
- Pelleck_2017-08-10_163515_0002
- Pelleck_2017-08-10_163515_0003
- Pelleck_2017-08-10_163515_0004
- Pelleck_2017-08-10_163515_0005
- Pelleck_2017-08-10_163515_0006
- Pelleck_2017-08-10_163515_0007
- Pelleck_2017-08-10_163515_0008
- Pelleck_2017-08-10_163515_0009
- Pelleck_2017-08-10_163515_0010
- Pelleck_2017-08-10_163515_0011
- Pelleck_2017-08-10_163515_0012
- Pelleck_2017-08-10_163515_0013
- Pelleck_2017-08-10_163515_0014
- Pelleck_2017-08-10_163515_0015
- Pelleck_2017-08-10_163515_0016
- Pelleck_2017-08-10_163515_0017
- Pelleck_2017-08-10_163515_0018
- Pelleck_2017-08-10_163515_0019
- Pelleck_2017-08-10_163635_0001
- Pelleck_2017-08-10_163635_0002
- Pelleck_2017-08-10_163635_0003
- Pelleck_2017-08-10_163635_0004
- Pelleck_2017-08-10_163635_0005
- Pelleck_2017-08-10_163635_0006
- Pelleck_2017-08-10_163635_0007
- Pelleck_2017-08-10_163635_0008
- Pelleck_2017-08-10_163635_0009
- Pelleck_2017-08-10_163635_0010
- Pelleck_2017-08-10_163635_0011
- Pelleck_2017-08-10_163635_0012
- Pelleck_2017-08-10_163635_0013
- Pelleck_2017-08-10_163635_0014
- Pelleck_2017-08-10_163635_0015
- Pelleck_2017-08-10_163635_0016
- Pelleck_2017-08-10_163635_0017
- Pelleck_2017-08-10_163635_0018
- Pelleck_2017-08-10_163635_0019
- Pelleck_2017-08-10_163635_0020
- Pelleck_2017-08-10_163635_0021
- Pelleck_2017-08-10_163635_0022
- Pelleck_2017-08-10_163759_0001
- Pelleck_2017-08-10_163759_0002
- Pelleck_2017-08-10_163759_0003
- Pelleck_2017-08-10_163759_0004
- Pelleck_2017-08-10_163759_0005
- Pelleck_2017-08-10_163759_0006
- Pelleck_2017-08-10_163759_0007
- Pelleck_2017-08-10_163759_0008
- Pelleck_2017-08-10_163759_0009
- Pelleck_2017-08-10_163759_0010
- Pelleck_2017-08-10_163759_0011
- Pelleck_2017-08-10_163759_0012
- Pelleck_2017-08-10_163759_0013
- Pelleck_2017-08-10_163759_0014
- Pelleck_2017-08-10_163759_0015
- Pelleck_2017-08-10_163759_0016
- Pelleck_2017-08-10_163759_0017
- Pelleck_2017-08-10_163759_0018
- Pelleck_2017-08-10_163759_0019
- Pelleck_2017-08-10_163759_0020
- Pelleck_2017-08-10_163759_0021
- Pelleck_2017-08-10_163759_0022
- Pelleck_2017-08-10_163759_0023
- Pelleck_2017-08-10_163759_0024
- Pelleck_2017-08-10_163759_0025
- Pelleck_2017-08-10_163924_0001
- Pelleck_2017-08-10_163924_0002
- Pelleck_2017-08-10_163924_0003
- Pelleck_2017-08-10_163924_0004
- Pelleck_2017-08-10_163924_0005
- Pelleck_2017-08-10_163924_0006
- Pelleck_2017-08-10_163924_0007
- Pelleck_2017-08-10_163924_0008
- Pelleck_2017-08-10_163924_0009
- Pelleck_2017-08-10_163924_0010
- Pelleck_2017-08-10_163924_0011
- Pelleck_2017-08-10_163924_0012
- Pelleck_2017-08-10_163924_0013
- Pelleck_2017-08-10_163924_0014
- Pelleck_2017-08-10_163924_0015
- Pelleck_2017-08-10_163924_0016
- Pelleck_2017-08-10_163924_0017
- Pelleck_2017-08-10_163924_0018
- Pelleck_2017-08-10_163924_0019
- Pelleck_2017-08-10_163924_0020
- Pelleck_2017-08-10_163924_0021
- Pelleck_2017-08-10_163924_0022
- Pelleck_2017-08-10_163924_0023
- Pelleck_2017-08-10_163924_0024
- Pelleck_2017-08-10_163924_0025
- Pelleck_2017-08-10_164045_0001
- Pelleck_2017-08-10_164045_0002
- Pelleck_2017-08-10_164045_0003
- Pelleck_2017-08-10_164045_0004
- Pelleck_2017-08-10_164045_0005
- Pelleck_2017-08-10_164045_0006
- Pelleck_2017-08-10_164045_0007
- Pelleck_2017-08-10_164045_0008
- Pelleck_2017-08-10_164045_0009
- Pelleck_2017-08-10_164045_0010
- Pelleck_2017-08-10_164045_0011
- Pelleck_2017-08-10_164045_0012
- Pelleck_2017-08-10_164045_0013
- Pelleck_2017-08-10_164045_0014
- Pelleck_2017-08-10_164045_0015
- Pelleck_2017-08-10_164045_0016
- Pelleck_2017-08-10_164045_0017
- Pelleck_2017-08-10_164045_0018
- Pelleck_2017-08-10_164045_0019
- Pelleck_2017-08-10_164045_0020
- Pelleck_2017-08-10_164045_0021
- Pelleck_2017-08-10_164045_0022
- Pelleck_2017-08-10_164045_0023
- Pelleck_2017-08-10_164206_0001
- Pelleck_2017-08-10_164206_0002
- Pelleck_2017-08-10_164206_0003
- Pelleck_2017-08-10_164206_0004
- Pelleck_2017-08-10_164206_0005
- Pelleck_2017-08-10_164206_0006
- Pelleck_2017-08-10_164206_0007
- Pelleck_2017-08-10_164206_0008
- Pelleck_2017-08-10_164206_0009
- Pelleck_2017-08-10_164206_0010
- Pelleck_2017-08-10_164206_0011
- Pelleck_2017-08-10_164206_0012
- Pelleck_2017-08-10_164206_0013
- Pelleck_2017-08-10_164206_0014
- Pelleck_2017-08-10_164206_0015
- Pelleck_2017-08-10_164206_0016
- Pelleck_2017-08-10_164206_0017
- Pelleck_2017-08-10_164206_0018
- Pelleck_2017-08-10_164206_0019
- Pelleck_2017-08-10_164206_0020
- Pelleck_2017-08-10_164206_0021
- Pelleck_2017-08-10_164206_0022
- Pelleck_2017-08-10_164206_0023
- Pelleck_2017-08-10_164206_0024
- Pelleck_2017-08-10_164206_0025
- Pelleck_2017-08-10_164339_0001
- Pelleck_2017-08-10_164339_0002
- Pelleck_2017-08-10_164339_0003
- Pelleck_2017-08-10_164339_0004
- Pelleck_2017-08-10_164339_0005
- Pelleck_2017-08-10_164339_0006
- Pelleck_2017-08-10_164339_0007
- Pelleck_2017-08-10_164339_0008
- Pelleck_2017-08-10_164339_0009
- Pelleck_2017-08-10_164339_0010
- Pelleck_2017-08-10_164339_0011
- Pelleck_2017-08-10_164339_0012
- Pelleck_2017-08-10_164339_0013
- Pelleck_2017-08-10_164339_0014
- Pelleck_2017-08-10_164339_0015
- Pelleck_2017-08-10_164339_0016
- Pelleck_2017-08-10_164339_0017
- Pelleck_2017-08-10_164339_0018
- Pelleck_2017-08-10_164339_0019
- Pelleck_2017-08-10_164339_0020
- Pelleck_2017-08-10_164339_0021
- Pelleck_2017-08-10_164339_0022
- Pelleck_2017-08-10_164339_0023
- Pelleck_2017-08-10_164339_0024
- Pelleck_2017-08-10_164339_0025
- Pelleck_2017-08-10_164339_0026
- Pelleck_2017-08-10_164339_0027
- Pelleck_2017-08-10_164339_0028
- Pelleck_2017-08-10_164339_0029
-
We certify that we have read this dissertation and that in our
opinion it is satisfactory in scope and quality as a dissertation for
the degree of Doctor of Philosophy in Agronomy and Soil Science
DISSERTATION COMMITTEE
iii
r I
I Imiddot I
ABSTRACT
The vegetation and soils of selected vegetation zones in peninshy
sular Ujung Kulon a tropical lowland moist forest in Indonesia were
investigated Eight 25 x SO m sites exhibiting distinctive forest
associations andor soils were chosen for study
Vegetation sites were sampled for tree height diameter at
breast height (dbh) tree and sapling count and basal area Species
identification of trees on the sites was made
Soil morphological properties were described Samples from each
site were analyzed chemically for cation exchange capacity (CEC) pH
exchangeable cations (Na Ca Mg Kand Mn) P Si N organic C and
carbonates Physical properties investigated included bulk and parshy
ticle density particle size distribution and volumetric water content
on an oven-dry basis
Primary and clay minerals were identified from X-ray diffraction
traces and total oxides analysis
Vegetation results depict a heterogeneous forest of wide species
diversity suggesting many unique associations which form a large
mosaic Some associations appear to be perpetuated as a result of
edaphic factors
It is thought that excessive drainage on site 1 on level ground
along the south coast combined with a porous shallow soil leads to
draughtiness which in turn results in open forest in which few tree
stems are present
Site 2 along a minor drainage in central Ujung Kulon is low in
volume of stems and in species diversity partially as a result of
repeated stream erosion which favors the establishment of the pioneer
iv
bamboo Schizostachyum blumei over other forest species
Sites 3 and 5 are examples of lowland moderately sloping well
drained fully stocked forest stands that do not show evidence of
either excessive draughtiness of soils or of waterlogging The sites
are somewhat comparable in regard to frequency of trees and saplings
and average dbh but differ in basal area and average height Site 3
trees have on the average 7m2ha greater total basal area and 6 m
greater height than site 5 trees These sites are floristically
different except for the common occurrence of Arenga obtisifolia the
most common tree found in lowland niches not affected by brackish
water Arenga is absent above approximately 50 m elevation
Sites 4 and 8 are influenced by a seasonal water table which
restricts species composition to plants able to withstand prolonged
waterlogging The species differences between these sites may also
be affected by soil pH Site 8 is typical of the Corypha utan -
Ardisia humilis association which is the largest in Ujung Kulon
Sites 6 and 7 are found in steep mountainous terrain They
exhibit the greatest frequency of stems and total basal area
Establishment and eventual perpetuation of Arenga dominance may
have been faciliated by the partial destruction of the overstory by
tidal wave action following the eruptions of the volcano Krakatau in
1883
Soil chemical and physical properties of the 1883 tuff attest to
a nutrient-poor material with low ion exchange capacity and soil
structure properties that probably impeded normal water infiltration
and root proliferation for some decades following deposition
Numerous chemical nutrient determinations of the soils
V
supplemented by leaf tissue analysis failed to establish definite
relationships between nutrient status and apparent site productivity
Newly mineralized soil horizons overlying the tuff show evidence
of a rapid rate of soil development The overlying horizons closely
resemble the residual subsoils in most chemical and physical propershy
ties conversely they only weakly resemble the tuff layer
Primary minerals are dominated by quartz in most cases crisshy
tobalite calcite pyrophosphate feldspars and silicates are also
found Clay minerals are smectite and kaolins
A reconsideration of the theoretical range of the Krakatau
ejecta is explained in an appendix
vi
TABLE OF CONTENTS
-middot
Page
LIST OF TABLES bull bull bull bull bull bull bull bull bull bull bull bull bull bull bull bull bull bull bull bull bull bull bull bull bull bull bull bull bull bull bull bull bull bull bull bull bull bull bull bull bull bull bull bull bull bull bull bull bull bull X
LIST OF FIGURES xii
INTRODUCTION bull bull bull bull bull bull bull bull bull bull bull bull bull bull bull bull bull bull bull bull bull bull bull bull bull bull bull bull bull bull bull bull bull bull bull bull bull bull bull bull bull bull bull bull bull bull bull bull bull bull 1
LITERATURE REVIEW bullbullbullbullbullbullbullbullbullbullbullbullbullbullbullbullbullbullbullbullbullbullbullbullbullbullbullbullbullbull bullbullbull bull bull bull bull bull bull bull bull bull bull bull bull bull bull 4
Physiography bull bull bull bull bull bull bull bull bull bull bull bull 4
Climate middot 7
Vegetation Disturbance History bull 10
Krakatau and its Aftermath 11
Scientific Research in Ujung Kulon 19
The Issue of Vegetation Classification 21
MATERIALS AiD METHODS bull bull bull bull bull bull bull bull bull bull bull bull bull bull bull bull bull bull bull bull bull bull bull bull bull bull bull bull bull bull bull bull bull bull bull bull bull bull bull bull bull bull 23
Phase I Field Observations and Data Collection 23
Determination of Sampling Sites bullbullbull 24
Size and Configuration of Sampling Sites bullbullbullbullbullbullbullbullbull 24
Vegetation Data Sites 26
Field Soil Data Sites 26
Phase II Laboratory Determinations bull 29
Plant Tissue Samples 29
Soil Preparation and Handling 29
Soil Physical Properties bull bull bull bull bull bull bull bull 30
a Particle density 30
b Particle size distribution bull 30
c Supplemental color coding by size fraction bull 31
vii
TABLE OF CONTENTS (continued)
Page
Soil Chemical Analyses bull bullbullbull ~ bullbullbullbullbullbullbullbullbullbullbull bull bullbullbullbullbullbullbull t t bullbullbullbullbullbullbullbullbullbullbullbull 31
a Cation exchange capacity 33
b Exchangeable bases bull 35
c Organic carbon 35
d Carbonate 36
e Total nitrogen bull 37
f Extractable phosphorus 37
g Water-soluble silicon bullbull 38
h Other chemical analyses 38
Mineralogical Analyses bullbull bull bullbull 39
Total Oxide Analyses 40
RESULTS bullbullbullbullbullbullbullbullbullbull bullbullbullbullbullbull bullbullbullbullbullbullbull bullbull 42
Vegetation 42
Description of Vegetation Sites 42
Site 4 Cidaun 49
Site 1 Cibunar 49
Site 2 Cikendeng bull 50
Site 5 Cankeuteuk 51
Site 8 Cikarang 52
Site 3 G Telanca 53
Site 6 G Pajung 53
Site 7 Guhamasigit 54
Soils 55
1 i
I
---viii
TABLE OF CONTENTS (continued)
Page
DISCUSSION bull bull 81
Density Stocking and Site Utilization 81
Preliminary Biomass Estimation 85
Interruption in Plant Succession bull 89
Physical Effects of the Tuff Layer 91
Chemical Properties of Soil 93
a Effective CEC 93
b Organic carbon bull 94
Mineralization and Soil Genesis Theories 97
The CN Ratio 101
Forms of Silicon in the Soil 103
Soil Genesis in Ujung Kulon bull 108
The Tuff Layer bull bull bull 111
Mineralogical Properties 122
SUMMARY AND CONCLUSIONS 126
Vegetation bullbullbullbullbullbullbullbullbullbullbullbull 126
Soils and Their Properties 127
APPEt-IDIX Abullbull 130
APPENDIX B 132
APPENDIX C bull bull 134
APPENDIX D bull 135
APPENDIX E bull 136
APPENDIX F bull bull 13 7
r ix
TABLE OF CONTENTS (continued)
Page
APPENDIX Gbullbullbull 138
APPENDIX Hbullbullbullbull 139
APPENDIX I 140
APPENDIX J 141
APPENDIX K 142
LITERATURE CITED bull bull bull bull bull bull bull bull bull bull bull bull bull bull bull bull bull bull bull bull bull bull bull bull bull bull bull bull bull bull bull bull bull 14 9
X
----middot-middot-LIST OF TABLES
Table
1 Monthly average rainfall or rainfall range for Ujung Kulon from various sources 8
2 Tree and sapling data of 25 X 50m Ujung Kulon vegetation plots 43
3 Botanical names and synonyms of important species found on and around Ujung Kulon vegetation sampling plots 46
4 Ujung Kulon field soil description site 1 56
57
bullbullbullbull 58
bull bull 59
60
61
bullbullbull bullbull 62
bullbullbull 63
5 Ujung Kulon field soil description site 2
6 Ujung Kulon field soil description site 3
7 Ujung Kulon field soil description site 4
8 Ujung Kulon field soil description site 5
9 Ujung Kulon field soil description site 6
10 Ujung Kulon field soil description site 7
11 Ujung Kulon field soil description site 8
12 Mean particle density P particle size distribution and textural class designatign bullbullbullbullbullbullbull bullbullbull 65
13 Mean bulk density and mean percent water by volume (OD) and percent available water of Ujung Kulon soil profiles 67
14 Soil pH and cation exchange capacity of soil profiles of Ujung Kulon determined by two methods 70
15 Exchangeable bases and percent base saturation in Ujung Kulon soil profiles bull bull bull bull bull bull bull bull bull bull bull bull bull 71
16 Percent organic carbon carbonate-carbon and total nitroshygen and carbon-nitrogen ratios in Ujung Kulon soil profiles 72
17 Phosphorous silicon and manganese levels of Ujung Kulon soils 73
18 Primary and secondary minerals identified from X-ray difraction patterns and unidentified peaks in soils of Uj ung Kulon bull 75
xi
LIST OF TABLES (continued)
Table Page
19 Percent total oxides (on ignited basis) in Ujung Kulon soils 79
20 Estimates of tree and sapling biomass of vegetation sites in Uj ung Kulon 88
21 Percent clay Si02R203 and Al203Fe203 ratios of Ujung Kulon soils 102
22 Thickness and occurrence of horizons overlying Krakatau tuff (C horizon) in Ujung Kulon soils llO
23 Analysis of variance of intra-site and inter-site CEC of C horizons and contact horizons of selected profiles 11~
24 Net CEC of tuff derived by subtraction of CEC components found in clay and organic matter bull 116
25 Units of change in Munsell color codes by horizons and between soil separates of Ujung Kulon soils 119
xii
LIST OF FIGURES
Figure
1 Peninsular portion of Ujung Kulon 2
2 Kraka tau and environs bull bull bull bull bull 12
3 Area blanketed by ash and other ejecta bull 17
4 Coastal configuration of the Krakatau Group 18
5 Vegetation and soil sampling sites in Ujung Kulon bullbull 25
6 Tree basal area basal area range of trees and saplings and tree and sapling count in each sitebullbull 45
7 Soil textural triangle 96
8 Regression of CEC on 0C +clay bull 98
9 CEC by horizon of selected Ujung Kulon soil profiles 113
Appendix C X-ray diffraction pattern of silt+ clay fractions of lC horizon in site 1 (Mg-saturated wet paste) 134
Appendix D X-ray diffraction pattern of sand fraction of 4IIC horizon in site 3 (powder sample) bullbullbull 135
Appendix E X-ray diffraction pattern of silt fraction of 4IIC horizon in site 3 (Mg-saturated wet paste) bullbull 136
Appendix F X-ray diffraction pattern of silt+ clay fractions of lC horizon in site 4 (Mg-saturated wet paste) 137
Appendix G X-ray diffraction pattern of sand fraction of 1Al2 horizon in site 5 (powder sample) bullbull 138
Appendix H X-ray diffraction pattern of silt fraction of ITC horizon in site 5 (Mg-saturated wet paste) bullbull 139
Appendix I X-ray diffraction pattern of clay fraction of ITC horizon in site 6 (Mg-saturated wet paste) bullbullbullbull 140
Appendix J X-ray diffraction pattern of silt+ clay fractions of TICl horizon in site 8 (Mg-saturated wet paste) 141
--1
INTRODUCTION
Ujung Kulon Nature Reserve at the extreme western tip of Java
was chosen as the site of this study as an example of one of the few
remaining and relatively undisturbed tropical lowland forests on
populous Java The name Ujung Kulon means West Point or Western
Tiplf in the Indonesian language but the entire nature reserve of the
same name encompasses some 41120 hectares of land including several
islands (see Figure 1) For the purpose of this study the name
Ujung Kulon refers only to the peninsular part of Java between 6deg 38
and 6deg 52 South Latitude and 105deg 12 and 105deg 30 East Longitude
Pulau Peucang a small island 05 km north of Ujung Kulon served as
the field headquarters
Names and spellings of locations show considerable variation
between archaic and modern Dutch and Indonesian languages As late
as 1973 Bahasa Indonesia the national language of Indonesia was
undergoing major spelling changes Hence most of the literature
references are at variance with the current usage found herein
As the first basic research venture of its kind in Ujung Kulon
an essentially virgin forest the study was broad in scope but rather
narrow in interpretation A few working objectives however
preceded the commencement of the investigations The objectives were
1 To describe the vegetation in selected plots which represent
different vegetation zones in Ujung Kulon
2 To characterize the soils in the selected plots
3 To investigate the inter-relationships which may exist between
the vegetation and soil parameters within the study areas
FIGURE I
PENINSULAR PORTION OF UJUNG KULON
Cl JUNG KULON
N
____ = UPLANDS
middot 6 bull PEAK
GUNUNG TELANCA
6
0 I 2 C I I I I
klLOMETERS
ATER HOOOERWERP 1 1970 (WITH PERMISSION)
3
Perhaps Hilgard (1912) stated the overall objectives of the basic
research approach best when he wrote Since the native vegetation
normally represents the result of secular or even millenial adaptation
of plants to climatic and soil-conditions this use of the native
flora seems eminently rational Moreover it is obvious that if we
were able to interpret correctly the meaning of such vegetation with
respect not only to cultural conditions and crops but also as regards
the exact physical and chemical nature of the soil so as to recognize
the causes of the observed vegetative preferences we should be enabled
to project that recognition into those cases where native vegetation
is not present to serve as a guide and we might thus render the
physical and chemical examination of soils as useful practically
everywhere as is locally the observation of the native growths
4
LITERATURE REVIEW
The entire western tip of Java except for a brief period of
Japanese occupation during World War II has remained in a wild state
since 1883
At that time the eruption of the volcano Gunung Krakatau and two
subsequently generated tidal waves destroyed several small villages
along the coast of Ujung Kulon in West Java (Hoogerwerf 1970) In
1923 the area was set aside as a nature reserve (Satmoko 1961)
Today Ujung Kulon is best known as a last stronghold of the one-horned
Javan rhinoceros Rhinoceros sondaicus sondaicus
Physiography
Pennisular Ujung Kulon covers approximately 26600 hectares (ha)
which can be divided into three broad physiographic regions
The steep uplands of the western third of the peninsula located west
of the streams Cibunar and Cijung Kulon a lower dissected marl
plateau in the middle of the Reserve and a vast lowland in the
northern and eastern sectors (Figure 1)
The western uplands are formed by an obtuse conical trachyte dome
(Indonesian Forest Service 1957) with ridges which finger out along
from the summit of the Gunung Pajung (Gunung meaning mountain 1 is
abbreviated as G) range It is commonly thought that the 480 m summit
of G Pajung is the highest peak in Ujung Kulon (Hoogerwerf 1970)
however the summit of G Guhabendang at 500 mis the highest point
in the Reserve Nevertheless G Pajung is a well-known landmark
inasmuch as the massif carries its name because of the existence of
5
a triangulation point marker on its sum~it and because of a narrow
but permanent trail connecting the suannit with Tanjung Sangjangsirah
on the west and Cibunar on the east
Terrain of the G Pajung massif is characterized by many short
but steep ridges formed from mixed volcanic and sedimentary rocks
Intermountain valleys are numerous but have rather shallow and
infrequent streambeds owing to rapid infiltration of rain water into
highly permeable soil Major streams are few in the G Pajung area
numbering 10-12 None are very wide or deep even as they empty into
the sea after following a dendritic course
A roughly plateau-like region in the middle of the Reserve is
generally known as the G Telanca area which has a less abrupt
topography It consists of low escarpments of 80-100 m elevation
with a maximum elevation of 140 m The escarpments slope outward
in all directions to form broad fans Rapid decomposition of the
erodable marl parent material the backbone of the Telanca formation
is chiefly responsible for the development of narrow and deep stream
beds between escarpments Vesicular marl outcroppings are common
in the Telanca area Rock outcroppings are otherwise uncommon throughshy
out Ujung Kulon except along ridge lines
Streambeds may be dry throughout the rainy season as a result of
excessive internal drainage except during and after torrents One
permanent and deep stream near the northern periphery of the Telanca
area has a visible length of only 400 m although the watershed feed-
ing it is comparatively extensive As reported by Schenkel and
Schenkel~Hulliger (1969) streams which originate in the G Telanca area
deposit lime sinter in their streambeds while still in their upper
6
reaches however the streams of the G Pajung massif do not deposit
lime On the other hand they reported that fossilized wood can be
found in the streambeds west of Cibunar and Cijungkulon whereas fosshy
silized wood had not been reported in eastern rivers of Ujung Kulon
The present author found many pieces of fossilized wood in the Cidaun
streambed midway between the Telanca and G Pajung formations
About half of Ujung Kulon is low-lying land rising to less than
50 min elevation and is located north and east of G Telanca Here
slow moving rivers are broad and moderately deep Some are navigable
by small boat for several kilometers inland During the rainy season
the ground is often inundated with brackish or tidal swamp water of a
meter or more in depth
Marine sands shells and coral are the chief geologic parent
materials in the northeast but there are also extensive pockets of
coarse pumice which has a pronounced effect on soil morphology Large
rounded pumice remnants are common even on the south coast of the
isthmus which connects Ujung Kulon with West Java These pumice
stones were apparently deposited in 1883 and after as tidal waves
washed over the isthmian lowland
Along the south coast a prominent sandstone ridge arises where
the G Pajung eastern drainage and the G Telanca western drainage
spill into the Indian Ocean at Cibunar The ridge follows the coast
south-easterly for several kilometers however the width of the
mostly level ridge never exceeds one-half km and the ridge is
usually not recognized as a major physiographic feature Schenkel
and Schenkel-Hulliger (1969) did however recognize the formation
and its characteristic vegetation
7
Climate
Ujung Kulon has a seasonal perhumid climate with a humidity index
of over 100 and a mean annual temperature of 26deg C according to
work by Schmidt and Ferguson (Soerianegara 1972) Rainfall inforshy
mation varies somewhat according to source (Table 1) As early as
1876 meteorological records were kept for Tanjung Layar It is
assumed that all rainfall data come from Tanjung Layar records there
being no other meteorological stations in the vicinity No data
for the area however have been published since 1944 Hoogerwerf
(1970) gave monthly rainfall averages covering a period of some ~O
years He reported a yearly average of 3249 mm Soerianegara (1972)
gave a 3137 mm yearly average Boerema (1925) published rainfall
maps of the Ujung Kulon peninsula using rainfall ranges of certain
months to show the transition of rainfall from west to east as a
result of monsoonal effects Yearly range of 2600-3550 mm west of
G Pajung and 2800-3800 mm east of G Pajung in Boeremas publishy
cation was based on the period 1879-1922
Hoogerwerfs (1970) averages of rainfall and Boeremas (1925)
ranges were in agreement in all months except April May and
September -- the months singled out by Boerema for illustration
In those months Boeremas maps showed 50-100 mm greater rainfall
east of G Pajung than west of the mountain leading to a higher
total yearly rainfall range east of G Pajung On the other hand
Hoogerwerf claimed just the opposite the authors (Hoogerwerfs)
long experience indicates that in the mountain range in question
considerably more rain falls than in the more eastern parts of the
l i
Table 1 Monthly average rainfall or rainfall range data for Ujung Kulon from various sources
Month Jan Feb Mar Apr May June July Aug Sept Oct Nov Dec Total Source
Rain (mm) 450 342 301 257 163 214 150 184 122 206 330 446 3185 a
443 377 325 258 171 178 130 138 141 263 351 474 3249 b
444 376 344 250 170 161 116 114 110 232 358 462 3137 C
West of 330- 300- 300- 200- 150- 150- 100- 100- 100- 200- 300- 400- 2600- d G Pajung 400 400 400 300 200 200 150 150 150 300 400 500 3550
East of 300- 300- 300- 300- 200- 150- 100- 100- 150- 200- 300- 400- 2800- d G Pajung 400 400 400 400 300 200 150 150 200 300 400 500 3800
No of days 20 18 17 14 10 9 10 7 8 11 15 21 160 a with rain
Source a - Batavia magnetisch en meteorologisch observatoriurn (annual reports) 1896-1909 (based on 14 years)
b - Hoogerwerf A 1970 (based on about 40 years)
C - Soerianegara I 1972 (after Berlage 1949 and Schmidt and Ferguson 1951 basis unknown)
d - Boerema J 1925 (based on 44 years)
9
peninsula Differences however are not large enough to be
significant from an overall climatic viewpoint
Hodder (1968) used the Lauer classification system of humid
tropical climates which was based on an earlier index of aridity by
DeMartonne According to the DeMartonne index
20 12p (1) t + 10
where p = average montly precipitation in mm
t = average monthly temperature in degC
All of Ujung Kulon would be classified as humid equatorial using the
rainfall data from various sources and the approximate monthly
temperature of 26~ C Walter~ al (1975) designated the western
tip of Java as an example of an equatorial climate (type I) with
monthly rainfall exceeding 100 mm An indication of seasonal variation
in monthly rainfall based on the number of days with rain and monthly
rainfall is shown in Table 1 computed from annual meteorological
records of a 14-year period (Batavia Magnetisch en Meteorologisch
Observatorium 1896-1909) A further temperature refinement may be
calculated for various places in Ujung Kulon using the formula of
Braak cited by Hong and Schuylenborgh (1959) for estimating temperature
when elevation is known The formula
t = 263 - h(06 degC) (2)
where t = temperature degC
h = elevation in hectometers (100 m)
would reflect temperatures of about 235 degC for G Pajung compared to
261 degC in the sealevel areas
10
Vegetation Disturbance History
The earliest recorded intrusions by man into Ujung Kulon were
made in 1807 Attempts were made to establish a naval port opposite
Pulau Peucang (abbreviated to P Peucang) to take advantage of its
strategic location (Hoogerwerf 1970) at the tip of Java Fortificashy
tions were built there but because many workmen succumbed to noxious
vapours from the newly worked ground they fled in large numbers
Nothing came of the port construction
In 1853 another expedition initiated by the Organization for
Scientific Research in the Netherlands Indies landed off the village
of Djungkulan (sic) at the time the only inhabited place in Javas
western corner according to Veth as cited by Hoogerwerf (1970)
The purpose of the expedition was to investigate the possibility of
developing the coal seams found there In the exeditions report
of 1854 it was also noted that palms and Indiarubber (sic) trees
thrive in their thousands there is a wealth of timber for ships
and shore bull Although the coal seams were never exploited large
quantities of Indiarubber taken from Ficus elastica and other trees
were exported from Djungkulan
According to Hoogerwerf (1970) the extended village of
Djungkulan apparently comprised no more than 40 huts and its inshy
habitants were probably dependent upon both fishing and subsistance
agriculture It may be presumed that foraging in the forest for
fruit nuts berries and pot herbs was also practiced Two smaller
villages named Cikuya and Rumah Tiga sprang up later on P Peucang
but were destroyed along with Djungkulan in the tidal waves following
11
the eruption of G Krakatau in 1883 Survivors escaped by fleeing
to the high ground at Tandjung Layar (Hoogerwerf 1970) where a
lighthouse was maintained at Javas First Point Mans activities
then have had some influence on species distribution particularly
in the more accessible areas
Although the Krakatau eruption and related occurrences have had
the most profound consequences in regard to vegetational disturbances
in Ujung Kulon and elsewhere most discussions on the matter are
largely speculative Accordingly the issue of post-Krakatau changes
is left for the DISCUSSION section of this study It would be helpful
at this stage to describe the Krakatau phenomena in an isolated conshy
text as a means by which one may better assess the results and
observations which were outgrowths of this study
Krakatau and its Aftermath
The several small islands which comprise the Krakatau Group are
located in the Sunda Strait midway between South Sumatra and West
Java and NNE of Ujung Kulon at a distance of 56-84 km (Figure 2)
The cataclysmic events by which Krakatau attained world prominence
and which are important considerations in this study date from
August 26-28 1883 At that time heightened volcanic activity on
the island of Krakatau which had commenced earlier that year climaxed
in a series of severe eruptions including submarine eruptions They
produced the loudest sound ever heard by human ears (Furlong and
Furlong 1974) spewed forth an estimated 13 cubic miles (54 cu km)
of material (Wexler 1951) and killed about 36000 people (Furneaux
1964) shortly thereafter as a result of two tidal waves which
FIGURE 2 KRAKATAU AND ENVIRONS
SUMATRA
6~ _oO 0
KRAKATAU
UJUNG KULON 7__
106deg
I
bull BOGOR
JAVA
N
l
I I ~ 25 ~o 1p 1qo 1~51
106deg 107deg KILOMETERS I- N
--
13
were generated
Volcanic activity in the Krakatau Group was known prior to and
after the 1883 paroxysm Stehn (1929) outlined four phases of
activity beginning with a coalescence of two andesitic volcanos
Danan and Perboewatan with the basaltic cone of Rakata to form the
island of Krakatau during Pleistocene time
Note A considerable portion of West Java is covered by dacitic
tuff expelled by the now disappeared Danau volcano of Pleistocene
age (Schuylenborgh 1956) The original location of the Danau was
probably in Bantam Province West Java near the present-day city of
Pandeglang It was alluded to by Mohr (1930) who discussed a lake
named Danau di Bawah as being formed from a sunken crater The Danau
source of the Bantam tuffs should not be confused with the Danan
volcano one of three active craters which disappeared in August 1883
Andesitic flows via a fissure also penetrated Rakata In May
1680 ending 203 years of quietude fresh andesite flowed from
Krakatau (Kruger 1971) It was the only other known eruption in
historic times (Stehn 1929) A more recent period of volcanism
began early in 1928 with the emergence of Anak Krakatau (the child
of Krakatau) from a seamount astride Rakata Though both Danan and
Perboewatan disappeared in their entirety in 1883 half of Rakata
remained The island is therefore sometimes referred to as
Rakata rather than Krakatau
Steam gases and ash which are currently being emitted from Anak
Krakatau are localized within the vicinity of the crater in the
same manner by which Stehn (1929) wrote of the products of the period
May to August 1883 remaining localized Only the August 26-28 ejecta
14
then is considered as a source of soil parent material as will be
discussed in this study To what extent the Krakatau phenomena
affected the vegetation of Ujung Kulon and the ected material
served as a source of soil parent material is a key issue
The products of the Krakatau eruptions consisted of a broad
range of materials Near the eruption point obsidian and dark glassy
rock formed the principal components according to Stehn (1929)
Other strata showed a slow change from rough bombs to fine ashes
Most investigators agree that sorting of materials by weight took
place in the air Lighter colored materials which were also of lower
density were usually found in upper strata However deposits of
pumice and ash of 100 m thickness were found in the vicinity of the
eruption point One sample of ash described by Mohr (1944) showed
the following fractions
Pumice 698
Heavy glass particles 211
Feldspars 60
Magnetite 09
Pyroxene 22
1000
Other samples showed different ratios of minerals Verbeek (1885)
who published a massive monograph on the Krakatau phenomena cautioned
that place of sample collection and time in the eruption sequence
(beginning middle end etc) were important considerations affecting
mineral ratio
The terminology of volcanic material deserves some attention
Material by grain size representing more than 50 of the total
15
volume normally determines the classification (Wedepohl 1969)
Composition of the parent lava of the ejecta is included as an
adjective in the combined name Tuffs which are compacted ash
deposits (Macdonald 1972) or other pyroclastic material of
small grain size (Wedepohl 1969) are the indurated equivalents
of volcanic ash and dust deposits A grain size classification
by Wentworth and Williams (1932) however described as fine ash
and dust all pyroclastics lt025 mm coarse ash gt025 mm to lt4 rnn
and lapilli anything gt4 mm and up to 260 mm The term pumice
apparently is not favored among contemporary geochemists since
no mention of pumice can be found in a number of texts on the
general subject of pyroclastics Earlier literature however
makes frequent reference to the term pumice to mean stone-sized
volcanic glass of light weight and color which contains numerous
cavities resulting from expulsion of water vapor at high temperature
during eruption
All Krakatau ejecta irrespective of size covered an area of
827000 sq km (Stehn 1929) Little information is available on
distribution range according to particle size or weight Furneaux
(1964) summarized some of Verbeeks (1885) observations in a popular
account of the Krakatau story He reported that according to
Verbeek some 43 cu miles (1791 cu km) of material had been
ejected Wexler (1951) and others thought it was a gross undershy
estimate Of Verbeeks estimate he assigned 286 cu miles
(1191 cu km) of material falling within a radius of 93 miles
(15 km) partly on the islands of the Krakatau Group where pumice lay
in banks 100 ft (305 m) thick pumice layers of 3-5 ft (9-15 m)
16
thickness at 12 miles (192 km) distance 1 foot (30 m) at 13-24
miles (21-39 km) and 2-8 inches (51 - 203 cm) at 31 miles (SO km)
Unfortunately the word pumice was the only one used to describe
the ejecta in the Furneaux account The map (Figure 3) of the
Krakatau ejecta included all particulate matter irrespective of
size or weight as transcribed by Furneaux
The effects of prevailing winds caused the ejecta downfall
pattern to be elliptical rather than circular If most heavy
particles were returned to earth near the craters could one expect
to find any material other than ash or dust in Ujung Kulon - at least
56 km away If so how much And most importantly to what extent
did it affect the existing vegetation or alter the soil environment
causing concurrent andor future manifestations Several documented
accounts about Krakatau debris suggest that the composition of ejecta
reaching Ujung Kulon was not solely limited to wind borne ash and
dust
The violently explosive Vulcanian or Pelean-type eruption of
Krakatau (Thornbury 1954) may have showered bombs lapilli and
pumice stones in all directions Except for that deposited on the
islands of the Krakatau Group most disappeared into the sea so that
an eruptive pattern could not be reconstructed with accuracy Only
5 of the ejected material has been accounted for in the enlargement
and reshaping of Verlaten and Lang islands (Figure 4)
Several reports placed ejecta at great distances A brief
account by Verbeek (1884) told of pumice and ashes of up to 03 m
thickness at a radius of 225 - 40 km 02 m thickness at 40 - 50 km
and down to 2 1 and half a centimeter at still greater distances
li
-bullmiddotmiddot--middot--middotmiddot- ____________ ~
FIGURE 3 AREA BLANKETED BY ASH AhD OTtER EJECTA
1200
EQUATOR
bullIbull Ibull I
I--- _________ -I_
AFTER FURNEAUX 1964
18
FIGURE 4 COASTLINE CONFIGURATICN OF THE tltRAKATAU GROUP HATCHED AREA- PRIOR TO 1883 DASHED LINE- SHORTLY AFTER 1683 ERUPTIONS SOLID LINE - PRESENT DAY
N
j
AFTER LEE UWEN 1936
0 2 4 6
KILOMETERS
19
He noted however that pumice stones the size of a fist were
thrown at a distance of 40 km Several ships in the Sunda Strait also
logged reports of falling ash and hot pumice among them the~pound
Naples 100 miles (161 km) to the west of Krakatau Leeuwen (1936)
reported that large blocks of pumice burned holes in clothes and sails
on the ship Berbice at a distance of 70 - 80 km from Krakatau Those
ships logs showed moderate to strong winds from SSW to WSW although
Verbeek (1885) noted that prevailing winds in the area were SE and NE
during that time of year
Pumice stones also fell in other directions A telegram froo
Batavia (Jakarta) told of stones which fell in Serang (Anon 1883)
a town 78 km E of Krakatau Verbeek (1885) wrote of blocks the size
of a human head which apparently fell in Ujung Kulon As for tuff and
ash Verbeek also tabulated data for several locations in West Java
and South Sumatra with corresponding thickness of occurrence He
himself measured a thickness of 10 mm at Javas First Point in Ujung
Kulon
Scientific Research in Ujung Kulon
Due to its remoteness from the populated areas of Java few
people have had occasion to traverse the peninsula Bantam Province
in general has a low population density compared to the rest of Java
With rough terrain and seasonal flooding in the lowlands Ujung
Kulon had little to offer except its strategic location and its
plethora of wildlife
Besides the one-horned Javan rhinoceros Rhinoceros sondaicus
sondaicus as the chief attraction Ujung Kulon has numerous other
20
animal species Some of the more interesting include the banteng
Bos javanicus javanicus leopard Panthera pardus melas crocodile
Crocodylus porosus reticulated python Python reticulatus and three
species of deer the Javan deer Rusa timorensis russa the barking
deer Muntiacus muntjak muntjak and the mouse deer Tragulus
javanicus javanicus In former times the Javan tiger Panthera tigris
sondaica was found extensively throughout Ujung Kulon but its
presence there now is in dispute Grazing animals therefore have
an influence on some sections of Ujung Kulon
Entry into the area has been restricted since 1921 when a 300 sq
km nature reserve was promulgated (Satmoko 1961) Consequently
most scientific interest has been on the part of zoologists
ornithologists and others interested in the wildlife Some notably
Hoogerwerf (1970) Schenkel and Schenkel-Hulliger (1969) and Satmoko
(1961) have also described some aspects of vegetation and physiography
Wirawan (unpublished) and Dransfield (unpublished) have also conducted
botanical expeditions in Ujung Kulon but An inventory of the plant
species and communities of Ujung Kulon does not yet exist nor has a
study of its plant ecology been made so far according to Schenkel
and Schenkel-Hulliger (1969) No published quantitative studies of
the vegetation of the peninsula have ever been made
Some quantitative and considerable descriptive information on
the vegetation of nearby P Peucang by Hoek and Kostermans (1950)
Kartawinata (1965) and SEAMEO BIOTROP (1972) is available Due
however to the destruction of vast forest areas on P Peucang during
the tidal waves of 1883 the forest associations of P Peucang and
Ujung Kulon are not comparable
21
No known soil studies have been undertaken in Ujung Kulon A
general soils map of the peninsula has been published but without
accompanying data by the Soils Research Institute of Indonesia
(Lembaga Penelitian Tanah 1966) Soerianegara (1972) undertook a
study of four soil profiles on nearby P Peucang He also studied
soils (1970) of the Mount Honje Forest Reserve 10-20 km to the east
of and adjacent to Ujung Kulon Schuylenborgh (1957) investigated
soil genesis processes in several locations in West Java and South
Sumatra over a period of years but none very close to Ujung Kulon
The Issue of Vegetation Classification
Based on temperature rainfall and overall physiognomy Ujung Kulon
would likely be classified as tropical rain forest by most naturalists
The SEAMEO BIOTROP study (1972) did just that in regard to the
forest on P Peucang Beard (1942 1949) and Wadsworth and Bonnet
(1951) described forests in Puerto Rico having only 2030-3203 mm yearly
rainfall as montane rain forest Cain et al (1956) and in part
the classical text The Tropical Rain Forest by Richards (1952) dealt
with Brazilian forest much of which was about 2500 mm annual rain-
fall Even the monsoonal forests of Thailand were discussed by
Kira (1969) as tropical rain forest Perhaps the assessment of the
nature of rain forest which was most uncritical was given by McPherson
and Johnston writing in Southworth and Johnston (1967) They implied
that rain forest could exist in areas with as little as 75 inches
(1905 mm) annual rainfall so long as the evergreen nature of the
forest prevailed
22
-----middot-
In the Life Zone System of Holdridge (1967) Ujung Kulon would
properly be called a Tropical Lowland Moist Forest The Holdridge
system makes use of temperature rainfall and potential evapotransshy
piration as major parameters for classification of vegetation within
latitudinal regions and altitudinal belts which also modify the
classification nomenclautre To be called a tropical (lowland) rain
forest an area in a tropical latitude and in a basal altitudinal
belt (below 500 m) must have at least 8000 mm of annual rainfall
according to the Holdridge system
The acceptance of the Holdridge classification is justified in
this study primarily because West Java has areas of much higher
rainfall than does Ujung Kulon and consequently much greater species
complexity that is inherent in the system Holdridge (1967) found
that species complexity varied proportionally with the rainfall within
the tropical zone of the Americas Soil conditions however also
affect species diversity and height growth Tschirley ~ al (1970)
noted that an increase in soil moisture retention beyond the point of
adequate aeration decreased species diversity Aphysiological
drought in Talparo clay caused by premature swelling shut of surface
soils during early monsoon rains in Trinidad (Chenery and Hardy
1945) was confirmed by Pellek (1971) who measured highly significant
differences in tree height of similar aged Tectona grandis on Talparo
clay and adjacent soils with more moisture Beard (1942 1949) and
Wadsworth and Bonnet (1951) also found physiological drought under wet
conditions at high elevations due to impeded drainage Excessive
aeration also leads to draughty soils examples of low moisture
retention in sandy soils are commonplace
23
MATERIALS AND METHODS
This study was divided into two main phases
I Field Observations and Data Collection
A ground reconnaisance of salient vegetation associashy
tions and soil groups was made to complement or replace preshy
selected sites from a map transect The work included vegetation
data collection soil profile descriptions and soil and plant
material collection
II Laboratory Determinations
Chemical physical and mineralogical properties of the
soil from each horizon were determined Replication of all detershy
minations was carried through for several samples which were chosen
at random Chemical analysis of plant material was performed on
leaves of the most common species found in the study sites
24
PHASE I Field Observations and Data Collection
1 Determination of Sampling Sites
Four sampling points were pre-selected from a map transect line
(Figure 5) running N 45deg E from Tanjung Guhabendang on the SW to its
termination just south of the mouth of Cikarang on the NE coast of
Ujung Kulon Transect alignment was chosen on the basis of best
representation of altitudinal zones and terrain features in conshy
junction with prevailing wind information given by Satmoko (1961) and
rainfall data from Soerianegara (1972) These pre-selected sites
designated sites 7 6 2 and 8 respectively were 2 4 8 and 17 km
respectively from the initial point at Tanjung Guhabendang Other
sites initially chosen along the transect were eliminated due to
excessive time needed to cut access trails and make other preparatory
arrangements Instead additional sa~pling sites designated 1 3 4
and 5 were chosen near Cibunar G Telanca Cidaun and Cankeuteuk
respectively
2 Size and Configuration of Sampling Sites
All sampling sites were 25 x 50 m rectangular plots They were
somewhat larger than the most efficient size of 10 x 20 m to estimate
the density of major species (Lang et al 1971) but nonetheless
efficient when species are aggregated (Cain and Castro 1959
Smith 1965) The major axis was parallel with the slope or if on
level ground the major axis was oriented E-W Approximate elevation
of the plots was taken from a topographic map with 25 m contour intershy
vals while slope within plots was determined by the use of an altimeter
FIGURE 5 I l
VEGETATION ANO SOIL SAMPLING SITES IN UJUNG KULON I
TANJUNG LAYAR
TANJUNG GUHAOENOANG
bull GUNUNG3 TELANCA
CIOAUN A A 4
bull2 I I I I I I
KILOMETERS
N I
6 s PEAK
CANKEUTEUK
N VI
26
------middotmiddot
3 Vegetation Data Sites
Within each site data were collected on trees and saplings only
Trees were defined as single-stemmed perennial plants measuring
greater than 25 cm in diameter at breast height (dbh) 137 m above
the ground at mid-slope Saplings were defined as single-stemmed
perennial plants having tree-like form but 10-25 cm dbh Total
counts of trees and saplings in each site were made Trees were
measured in cm at dbh using a steel diameter tape Total top hei
of trees were determined to the nearest meter with a Blume-Leiss altimeter
fitted with a range finder device Species identification was nade on
site or by verification of specimens with herbarium sheets and staff
personnel at Herbarium Bogoriense in Bogor
Leaf samples of the major species within each site whether
shrubs saplings or trees were collected for subsequent chemical
analysis Leaf material from a maximum of four species in each site
was taken and analyzed using ennnission spectrography (Appendix A)
Bearing and distance between sites were determined by hand-held
compass and pacing respectively Within-plot lateral distances were
regulated with a cloth meter tape
Basal area the cross-sectional stem area at dbh was subsequently
calculated as m2ha for trees and as basal area range of trees and
saplings - at low range and upper range
4 Field Soil Data Sites
A was dug to a depth of 15 min the approximate center of
each 25 x 50 m site If less than 15 m the depth was either to the
27
water table or to the bedrock The number and depth of soil horizons
were recorded Coding of horizons adopted was similar to that of
Parsons and Herriman (1975) Soil color of moist soil was determined
by means of Munsell Soil Color Charts while soil texture (apparent
soil texture) and structure were recorded according to the procedure
prescribed in the USDA Soil Survey Manual (Soil Survey Staff
1951) An adequate sample from each horizon of the central pit and
from an alternate pit was collected and stored in triple-thickness
plastic bags for subsequent chemical physical and mineralogical
analyses The soil samples were identified by labeling them accord
to their relationship to others in the same profile and the spatial
location of profiles in each site Samples were labeled consecutively
clockwise with respect to the transect bearing starting with the
central pit Thus the sample marked 6-lAll designated the All
horizon of the central pit in site No 6 6-2All was a correspond
horizon found at the NE plot periphery 6-3All from the SE 6-4All
from the SW and 6-5All from the NW
Although most analyses were conducted on samples taken from the
central pit some were limited to samples collected from the
peripheral pits Bulk density PB and soil moisture tension
were obtained from mean values of five bulk density rings per plot
one from the central pit and the others from peripheral pits Due
to the thinness of some horizons and the existence of rocks and roots
PB and soil moisture tension determinations were limited to only
three depths 0-15 cm 15-30 cm and 30-45 cm The number of
horizons and horizon depth were also recorded for the shallower
pheral pits No attempt was made to determine the lower limit of
28
the deepest horizons encountered because the subsoils appeared to be
very thick in most cases Small samples from each horizon of the
central pits were taken for pH and field moisture content determinshy
ations Bulk density by core ring method pH in water and KC by
glass electrode using watersoil ratio of 51 moisture content by
constant weighing in a Brabander dry stove and soil moisture
tension at 10 cm 100 cm 13 bar and 15 bar suction were all
determined at the Soils Research Institute in Bogor
29
PHASE II Laboratory Determinations
1 Plant Tissue Samples
Leaf samples collected in each site were oven dried and ball
milled in preparation for chemical analysis Only three plant species
represented sites 1 and 4 all other sites had leaf material from
4 species Due to lack of sampling control the number of plant
species represented and most importantly -- the lack of duplication
of most species among all the sites -- the usefulness of the samples
in overall interpretations were precluded Results of the analyses
are found in Appendix A
2 Soil Preparation and Handling
Upon arrival in Honolulu the bagged soil samples were ventilated
then fumigated with methyl bromide to destroy any pathogens present
After repacking the samples were divided into lots of approximately
equal weight One lot was repacked in triple-thickness plastic bags for
storage The other lot was passed through a 20-mesh sieve in a wet
condition before repacking in plastic bags Fresh samples as needed
were taken from the sealed bags For most chemical and mechanical
analyses fresh sub-samples of air-dried soil were used Three
20 gram samples of sieved air-dried soil were oven-dried at 105deg C
for 24 hours to determine the moisture factor of air-dried samples
A mean calculated moisture factor was henceforth used to express
analytical results on an oven-dry basis
30
3 Soil Physical Properties
In addition to the pB and soil moisture tension data determined
at the Soil Research Institute in Bogar particle density pp and
particle size distribution were also completed to permit verification
of apparent texture
a Particle density
Particle density pp was determined by the pycnometer
method on three replicates which had passed a 20-mesh sieve Subshy
samples of approximately 10 g were used and weighed to the nearest mg
The dimensions mass and density of pumice fragments which were larger
than soil-sized separates were also recorded
b Particle size distribution
Approximately 25 g of sieved soil were dispersed with
50 ml of 10 sodium hexametaphosphate (Calgon) solution and 100 ml of
water in plastic breakers a modification of the method described by
Kilmer and Alexander (1949) The mixture was sonicated at factor
60 - HiSpeed for 10 minutes using a BIOSONIK IV unit Silt and clay
were separated by washing into liter cylinders by wet sieving through
a 325-mesh sieve The sand fractions remaining on the sieve were
subsequently dried and separated into fractions of very coarse sand
(VCS) coarse (CS) medium (MS) fine (FS) and very fine sand (VFS)
by passing through nested sieves of mesh numbers 18 35 60 and 150
respectively The fraction passing the 150-mesh sieves was collected
31
on absorbant paper All sand fractions were then determined gravishy
metrically
Aliquots of 25 ml of the silt+ clay suspension were
taken by the pipette method from the liter cylinders made up to 1000 ml
volume Aliquots were taken at various times corresponding to
sedimentation times of particles of 20 10 5 and 2 micro in diameter
A Calgon blank was taken with each series of soils tested Textural
class names were designated according to the USDA textural triangle
(Figure 7) In some cases the determination was repeated to achieve a
clearcut textural designation When two different textures were deshy
termined both textural designations were given
c Supplemental color coding by size fraction
In the process of separating the whole soil into sand
silt and clay fractions for mineralogical analysis it was observed
that samples of soil from disparate profiles often appeared similar in
color when grouped into similar particle size classes Munsell color
code comparisons were therefore made of samples after they had been
grouped into size separates Comparisons among silt and clay
separates were made on wet paste which had been collected in 50 ml
centrifuge tubes Sands were powdered with mortar and pestle passed
through a 200-mesh sieve then wetted before the color comparisons
were made
4 Soil Chemical Analyses
The lack of data on Ujung Kulon soils dictated that several fundashy
mental determinations of nutrient status be conducted Modifications
32
as seemed warranted were made to increase the precision in the
physical conduct of the determinations or to enhance the applicashy
bility of the results This latter point was especially true in
regard to the determination of cation exchange capacity CEC
By universal standards the pH of the extracting solution in the
B NH40Ac method (Chapman 1965) is adjusted with either ammonium
hydroxide NH40H or acetic acid to a pH of 70 The CEC is then
determined by titration of excess NH3+ ions which are displaced from
the exchange complex by designated replacement ions Other basic
ions including calcium (Ca++) magnesium (Hg++) potassium (K+)
and sodium (Na+) were concurrently leached from the exchange sites
and determined separately as milliequivalents per 100 g of soil
++ ++ + -I-(meq100 g) The sum of the Ca Mg K and Na in meg100 g
divided by the CEC also expressed in meq100 g is commonly known as
percentage base saturation BS More fully the expression is
BS =ca+++ Mg+++ K+ + Na+ x 100 (3) CEC
Current classification of soils depends in part on both CEC
and BS derived by B NH40Ac extraction at pH 7 in most cases
Yet Tamimi et al (1972) and Uchida (1973) have found that CEC
changes if the NH40Ac is not at pH 7 If the pH of the soil surroundshy
ing plant roots is other than pH 7 they reasoned then the CEC would
likewise differ accordingly Solubility and uptake of nutrients in
the soil are affected by the soil pH accordingly the exchangeable
cations and CEC should be determined at the soil pH and not at pH 7
Uchida (1973) determined that exchangeable bases did not differ
33
significantly between extraction at pH 7 or at soil pH for soils with
pH - dependent charge Soils with pH - dependent charges can be
recognized by either increase or decrease (~ pH) in pH that occurs
between measurement of the hydrogen ion activity in water vs its
activity in N unbuffered KCl Keng and Uehara (1973) illustrated
that a soil material possesses a net negative charge when the pH in
N KCl is more acid than the pH in water In this study CEC was deshy
termined with~ NH40Ac at pH 7 and with NH40Ac adjusted to the pH
of the soil The BS however was determined only on those
samples whose cations were also extracted at soil pH -- the latter
technique
a Cation exchange capacity
1 ~ NH40Ac adjusted to soil pH
Freshly air-dried 1000 g (oven-dried basis) soil
samples passing a 20-mesh sieve were shaken intermittantly with 200
ml of N NH40Ac which had been adjusted to the soil pH (plusmn 001 pH
unit) After 24 hours the solution was filtered through ff6 filter
paper in a 70 mm Buchner funnel with suction into a 500 ml Erlenmeyer
flask Four successive leachings with the above N NH40Ac in 50 ml
aliquots were collected in labeled flasks whose contents were later
analyzed for exchangeable bases
A clean suction flask was attached and 15-20 ml of the
NH40Ac were added to the leached soil The presence of Ca in the
leachate was checked by adding a few drops of 1 ~ NH4Cl 10 ammonium
oxalate and dilute NH40H to ca 10 ml of the leachate in a Pyrex test
34
--middot tube as described by Chapman (1965) Upon heating to near the boilshy
ing point the presence of Ca was indicated by turbidity or by a
white precipitate All soils from sites 3 and 8 showed positive
Ca tests but additional leaching with NH40k failed to result in
calcium depletion from the soil All samples from other sites showed
negative Ca tests
Three further leachings with 50 ml aliquots of N NHCl - 4
and once with 025 li_ NH4Cl were followed by 200 ml of 99 isopropyl
alcohol in successive 50 ml aliquots A test for chloride was made
by adding a few drops of 010 N silver nitrate (AgN0 ) in a test tube3
containing ca 10 ml of the leachate The presence of chloride
was indicated by a white precipitate None was detected
The washed soil was transferred to another flask and
shaken for 30 minutes with 200 ml of 4 KCl and filtered An additional
200 ml KCl was added in 50 ml aliquots then the leachate
was made up to 500 ml volume with KCl A 100 ml aliquot was transshy
ferred to a Kjeldahl flask to which was added 25 ml of 50 NaOH and
a few pieces of zinc A reagent blank was also prepared for
distillation on the Kjeldahl apparatus About 60 ml of distillate
was collected in 100 ml of 3 boric acid and 10 drops of bromocresol
green-methyl red mixed indicator The distillate containing NH4+ ions
was then titrated with 0038 li_ H2so4 CEC of the soil was determined
by the formula
CEC(meqlOO g) = ml of H2so4 x li_ of H2so4 x 10 x 5 (4)
35
2 CEC with i NH 40Ac at pH 7
The procedure used was similar to the one above however
no test for Ca or Cl was made The procedure was carried out primarishy
ly to establish a CEC based on saturating the soil with N NH40Ac at pH
7 -- the standard method used in soil classification work There were
wide discrepancies between the results using the two procedures
Since no cations were determined in the leachate of the pH 7 extracshy
tant calculation of the BS and pertinant discussions were preshy
cluded and such information was limited to Ntl40Ac extraction at soil
pH
b Exchangeable bases
The filtered NH40Ac extract that was made up to a volume
of 500 ml with NH40~ adjusted to soil pH was used for Ca Mg Kand
Na determinations Ca Mg and K were analyzed along with approshy
priate standard solutions and reagent blanks using a Perkin-Elmer
Model 303 atomic absorption spectrophotometer Sodium was determined
with a Beckman DU flame spectrophotometer
c Organic carbon
The Walkley-Black method (Walkley and Black 1934) was
used but further modified in this study when it was observed that the
prescribed volumes of potassium dichromate K2Crz07 were consumed beshy
fore a titration end point was reached Accordingly 20 ml of N
K2Cr207 was used instead of 10 ml as prescribed Ten ml of 85 phosshy
phoric acid were also used
3
36
Due to their proximity to sea water and salt spray when
in situ the surface soils of sites 1 4 and 8 were tested with AgN0
for the presence of chloride ion before beginning the experiment
All tests for chloride were negative A 1000 g sample of soil
passing a 100-mesh sieve was used in the determination Organic matter
content was also estimated by using OM = OC X 1724 as disshy
cussed by Jackson (1958)
d Carbonate
A semi-quantitative determination of the presence of
carbonates in the soil was made by saturating small amounts of soil
with 4 N HCl Carbonates when found in significant amounts are
mainly associated with calcium in marl limestone or coral deposits
with all forms being chemically the same -- calcium carbonate Caco 3
Only the soils of sites 3 and 8 showed consistantly
moderate to strong effervesence and were threfore the only samples
chosen for quantitative co 3-c determination Weak effervesence of
samples 1-lC and 2-1B22t was noted but this was attributed to lack
of precision in the method since the other horizons represented in
those sites showed negative tests
The method described by the US Soil Salinity Laborashy
tory (Allison and Moodie 1965) for determining co -c was attempted3
In that method 05 N HCl was titrated against 025 N NaOH with 1
phenolphthalein in 60 ethanol as an indicator Due to probable
precipitation of iron as the pH changed all samples became turbid
Also the end point could not be detected with phenolphthalein as an
indicator Better results were obtained with the Piper (1942) rapid
37
middot-middot-middot -middotmiddotmiddot -~--------------
titration technique which called for 1 M HCl and 1 M NaOH and
bromthymol blue as an indicator Despite a caution in the method
that water soluble carbonates must be accounted for in interpreting
the experimental results no water soluble carbonates could be
detected in selected samples Repeated titrations with blanks of
standardized reagents demonstrated however that the test was very
sensitive -- sharp equivalence points being repeatedly attained
withinplusmn 005 ml of titer
e Total nitrogen
Two grams of freshly air-dried soil passing through a
100-mesh sieve were analyzed for total nitrogen content by the
Kjeldahl method The collected distillate was titrated with 0038 N
H2so4 and the content of nitrogen was expressed in percent by the
formula
ml middot x N of d x O 014titer - aci N=---------------- X 100 (5)g of OD soil
Reagent blanks were also prepared and titrated Carbon-nitrogen
ratios were computed using the results of determinations of OC
and total N
f Extractable phosphorus
Two grams of 20-mesh soil were extracted with 200 ml of
002 N H2so4 which had 03 ammonium sulfate (NH4) 2so4 in a modified
Truog (Ayers and Hagihara 1952) method Aliquots of 25 ml of the
centrifuged extract were made up to 50 ml volume by adding 2 ml of
freshly prepared sulfomolybdate extracting solution and a few drops
38
of stannous chloride (SnClz) in a sequence which included the addition
of ca 5 ml of water after each reagent
The samples were analyzed colorimetrically using a Coleshy
man Jr colorimeter at wavelength of 600 mmicro In some cases 10 ml
aliquots were used in lieu of 25 ml aliquots if absorbance was beyond
the range of the standards used
g Water-soluble silicon
Although silicon is not an essential element for plant
nutrition the high content of SiOz in the ash and tuff of the
Krakatau eruption may have altered the SiOz content of the soil in
important ways Significant differences in the amount of watershy
soluble silicon particularly in the tuff layer among sites might be
taken as one index of physico-chemical change resulting from differshy
ences in relief rainfall or biotic factors
Three grams of lt20-mesh soil were shaken continuously for
4 hours in a stoppered flask with 30 ml of H2o according to the
method of Fox~ al (1967) After centrifuging at high speed 10
ml aliquots were made up to 50 ml volume with 1 ml of disodium sulshy
fite Na 2S03 sodium bisulfate + H2S04 reducing solution and water
Silicon content was analyzed colorimetrically at 600 mmicro with a Coleman
Jr colorimeter Results were expressed as ppm in solution
h Other chemical analyses
Exchangeable manganese Mn was detennined with the atomic
absorption spectrophotometer from the N ~H 40Ac extract used for
39
determining Ca K Mg and Na
The results were taken from a standard curve of values charted on
log-log graph paper
The effects of fumigation partial drying or prolonged storage
of samples on soil pH were checked by comparison of pH readings with
those obtained in Indonesia No major changes were noted
5 Mineralogical Analyses
a The soils were separated into sand silt and clay fractions
Sands were collected on a 325-mesh sieve Clay was separated from
silt after washing through the sieve either by pipetting the susshy
pended clay from a glass cylinder after overnight sedimentation or
by decanting off after being centrifuged at 750 rpm for more than 3
minutes Attempts were made to minimize the clay contamination of the
silt fraction by stirring and centrifuging silt samples and decanting
off the clay Due to insufficient clay content in the soils of sites
4 and 8 no attempt was made to separate silt from the clay in those
samples Also due to insufficient soil no silt+ clay separation of
sample 8-lCll was conducted
b A few grams of unseparated silt+ clay for total elemental
analysis were collected from the cylinders The samples were centrishy
fuged at high speed then dried at 70deg C before other total analysis
preparations were made as described below Whole soil samples of
1-lC 3-4C 5-lC and 6-lC were also prepared for total analysis by
crushing air-dried samples with mortar and pestle and passing the
samples through a 200-mesh sieve
In preparation for X-ray diffraction (XRD) studies the silt
40
and clay fractions were divided into two lots one was saturated with
_i KCl and the other with _i MgC1 2 After three centrifuge runs with
the saturating salts followed by three more runs with water the
supernatant was checked for chloride ion with _i AgN03 Further washshy
ing was conducted as needed Air-dried sand samples were powdered
with mortar and pestle and passed through a 200-mesh sieve
A Phillips X-ray diffractometer using copper K-a radiation with
wavelength A= 15418 A was used Xg-saturated wet paste samples of
both silt and clay on glass slides were prepared and analyzed from
2deg 28 to 64deg 28 goniometer reading Mg-saturated ethylene glycol
solvated samples were traced from 20 2S to 160 26 K-saturated silt
and clay samples were analyzed from 2deg 28 to 16deg 29 after heating
for over two hours at temperatures of 110deg C 300deg C and 525deg C
Untreated powder samples (sand) were prepared in slotted aluminum
slides and traced from 16deg 28 to 64deg 26
Total Oxide Analyses
Sufficient sample (about 5 g) of silt+ clay was oven-dried to
110deg C Exactly 0500 g of the OD soil was blended with 1500 g of
lithium tetraborate (Li2B4o7) and fused in a furnace at 1000deg C for
about one hour The fused pellets were then ground and pressed into
wafers for total oxides analyses by an Applied Research Laboratories
Model 72000 X-ray quantometer
Due to the large discrepancies in loss of weight on ignition
(LOI) determination among some samples the quantometer results were
recalculated on an ignited basis No Na 2o readings were obtained
41
because the tube with Na wavelength was not in operation Also all
results totaled more than 100 due to positive deviation from the
regression equations used in calibration of quantometer standard
samples
In addition to the regular samples whole soil samples from
1-lC 3-4C 5-lC and 6-lC were also analyzed by the quantometer
42
RESULTS
Vegetation
The data in Table 2 summarize the counts of trees and saplings
the mean diameter at breast height (dbh) of trees basal area (ba)
of trees ba range of saplings (from a minimum of 10 cm dbh to a
maximum of 25 cm dbh) and total ba range of both trees and saplings
Because precise dbh of saplings was not measured both lower and upper
ba range is given Table 2 is arranged in order of ascending ba upper
range Comparisons of tree ba between sites and range of total ba of
trees and saplings are shown in Figure 6
The great range in ba among forested sites reaching a maximum
of 452 m2ha in site 7 indicates a very heterogeneous forest in ung
Kulon Inasmuch as basal area utilizes stem diameter at 137 m above
the ground those sites which were composed of primarily grassy or
herbaceous vegetation (sites 4 and 1 respectively) yielded little
information It was necessary therefore to supplement the withinshy
site data with descriptions of the understory species and their feashy
tures also to include some general descriptions of physiognomic
features outside the sites Accordingly a more complete listing of
vegetation found on and around the sites is given in Table 3 To
facilitate identification their synonyms are also given
Description of Vegetation Sites
One criterion for selection of sites 1 3 4 and 5 which were
not on the N 45deg E transect was the apparent internal homogeneity of
vegetation exhibited therein Gerard (1965) noted that such homoshy
geneous entities are often dissected from their surroundings and may be
Table 2 Tree and sapling data of 25 x 50 m Ujung Kulon vegetation plots
Site Mean dbh Mean hgt ti Trees Tree ba ti Saplings Sapling ba range Total ti stems Total ba range cm m m2ha m2ha gt10 cm dbh m2ha
4 a a
1 670 10
Trees represented
2 602 19
Trees represented
5 406 22
Trees represented
8 538 18
Trees represented
3 409 28
Trees represented
0 a 0 a 0 a
1 282 1 006 - 039 2 288 - 321
Corypha utan (1)
4 1066 17 107 - 668 21 11 73 - 1734
Arenga obtusifolia (1) Artocarpus elastica (2) Dillenia excelsa (1)
9 1036 32 201 - 1258 41 1237 - 2294
Diospyros macrophylla (1) Drypetes macrophylla (5) Mangifera indica (1) Memecylon edule (1) Pterospernum diversifolium (1)
11 21 30 19 120 - 747 30 2250-2877
Corypha ~tan (8) Neonauclea calcinia (2) Vitex quinata (1)
14 1774 29 182 - 1140 43 1956 - 2914
Aglaia argentia (2) Aglaia elliptica (1) Cryptocarya sp (2) Cryptocarya ferrea (1) Dillenia sp (1) Lophopetalum javanicum (1) Polyalthea longipes (1) Strombosia ~vanica (1) Syzygfom lineatum (1) Wetria macrophylla (3)
a - no trees or saplings
Table 2 Tree and sapling data of 25 x 50 m Ujung Kulon vegetation plots (Contd)
Site Mean dbh Mean hgt Trees Tr2e ba II Saplings Sapliog ha range Total II stems Tota~ ba range cm m m ha m1 ha gt10 cm dbh m ha
6 449 24 17 2584 38 239 - 1493 55 2823 - 4077
Trees represented Astronia sp (1) Fagraea ~uriculata (1) Ficus pisocarpa (1) Neesia altissima (1) Sandoricum koetjape (1) Syzygium syzygoides (2) Unknown (10)
7 473 24 18 2907 41 258 - 1611 59 3165 - 4518
Trees represented Ficus vasculosa (2) Meliosma nitida (1) Neesia altissima (3) Neonauclea pallida (1) ~parosa javanica (1) Syzgium syzygoides (1) Unknown (9)
bullN E 20 I bull bull bull I bull I bull
I
I bull bull I
I bull bull bull 10 bullbull bull bull bull ~ I bull ~middot I -SITE 4 2 5 8 3 6 7 TREES 0 4 9 I I 14 17 18
i-SAPLINGS 0 17 32 19 29 38 4 I ln
FIGURE
TREE BASAL AREA BASAL AND SAPLINGS AND TREE
EACH SITE
40
~ UPPER RANGE
0 LOWER RANGE 30
[] TREES
0 amp
6
AREA RANGE OF TREES AND SAPLING COUNT IN
~ Ibull
I
bull bull I
46
----- ----------middotmiddotmiddotmiddotmiddot--------
Table 3 Botanical names and synonyms of important species 7ound on and around Ujung Kulon vegetation sampling sitesl
Botanical name Synonym Family
Aglaia argentea Bl
Alglaia elliptica Bl
Ardisia humilis Vahl
Arenga obtusifolia Bl
Artocarpus elastica Reinw ex Bl
Astronia sp
Chrysopogon aciculatus (Retz) Trin
Corypha ~ Lamk
Cryptocarya ferrea Bl
Cryptocarya sp
Gilg
Dillenia obovata (Bl) Hoogl
sp
Diospyros macrophylla Bl
Drypetes macrophylla (Bl) Pax amp K Hoffm
Meliaceae
Meliaceae
Myrsinaceae
A westerhoutii Griff Arecaceae
Moraceae
Melastomataceae
Andropogon aciculatus Poaceae Retz
C elata Roxb gebanga Arecaceae Bl Sphalm gebanga Bl) Bl _g_ sylvestris (Bl) Bl nom illeg
C tomentosa Bl Lauraceae
Lauraceae
D pauciflora (Zoll amp Mor) Dilleniaceae Gilg Wormia Jack
D aurea Auct non Dilleniaceae J E Smith
Dilleniaceae
Ebenaceae
Cyclostemon macrophyllus Euphorbiaceae Bl
Loganiaceae
F retusa Auct non L Moraceae
1- Source Backer C A and Bakhuizen Van Den Brink RC 1963-68 Flora of Java Vol I-III
47
-----middot------middotmiddot---
Table 3 Botanical names and synonyms of important species found on and around Ujung Kulon vegetation sampling sites (Contd)
Botanical name Synonym Family
Ficus pisocarpa Bl
Ficus vasculosa Wall ex Miq
Hyptis rhomboidea Mart amp Gall
Lagerstroemia flos-regishynae Retz
Lantana camara L
Lophopetalum javanicum (Zoll) Trucz
Mangifera indica L
Meliosma nitida Bl
Memecylon edule Roxb
Neesia altissima (Bl) Bl
Neonauclea calycina (Bartl ex DC) Merr
Neonauclea pallida (Reinw ex Havil) Bakh f
Polyalthia longipes (Miq) K amp V
Pterospermum diversifolium Bl
Ryparosa javanica (Bl) Kurz ex K amp V
Sandoricum koetjape (Burm f) Merr
Schizostachyum blumei Nees
F microstoma Wall ex King
middot capitata Auct non Jacq
_ speciosa Auct (L) Pers
L aculeata L
Solenospermum j avanicum Zoll
M laurina Bl
M sumatrana (Jack) Walp
Nauclea purpurascens Korth
Nauclea pallida Reinw ex Havil
S indicum Cav S nervosum Bl
S longispeculatum (Kurz) Kurz
Moraceae
Moraceae
Lamiaceae
Lythraceae
Verbenaceae
Celastraceae
Anacardiaceae
Sabiaceae
Melastromataceae
Bombacaceae
Rubiaceae
Rubiaceae
Annonaceae
Sterculiaceae
Flacourtiaceae
Meliaceae
Poaceae
48
Table 3 Botanical names and synonyms of important species found on and around Ujung Kulon vegetation sampling sites (Contd)
Botanical name Synonym Family
Streblus spinosus (Bl) Corner
Strombosia javanica Bl
Syzygium lineatum (DC) Merr amp Perry
Syzygium syzygoides (Miq) Amsh
Vitex quinata (Lour) FN Will
Wetria macrophylla (Bl) JJS
Taxotrophis javanica (Bl) Bl _I spinosa (Bl) Steen ex Back
Eugenia lineata (DC) Duthie~- teysmanni (Miq) K amp V
Eugenia cymosa (Auct non Lamk)
V heterophylla Roxbmiddot V sumatrana Miq V velutina K amp V
Moraceae
Olacaceae
Myrtaceae
Myrtaceae
Verbenaceae
Euphorbiaceae
49
variously described as stands samples communities or associations
Sites 1 3 4 and 5 then were selected as examples of salient
associations within the forest Sites 2 6 7 and 8 represent preshy
selected sites without regard to the vegetation association they may
have represented
Site 4 Cidaun
On the low end of the tree biomass scale site 4 was chosen as
representative of a grazing ground of the banteng Bos javanicus
javanicus Since the site center was chosen at random it was only
coincidental that the site contained no trees or saplings Scattered
trees do exist those of Dillenia obovata being favored in management
practices because the soft fruits are eaten by the animals Heavy
grazing by the banteng and other animals restricts the growth of
vegetation to mostly grasses Chrysopogon being the chief
one Also found are seasonal aquatic plants like Hyptis rhomboidea
which grows in shallow depressions with a high water table during the
rainy season The basal area of an alternate but typical grazing ground
site (not described) was 068 m2ha and restricted to only trees and
saplings able to withstand the grazing pressure
Site 1 Cibunar
The area along the coast east of Cibunar is also an abandoned
banteng grazing ground but it is not maintained in the same manner
as the grazing ground at Cidaun Consequently a primary successional
growth of chest-high
only an occasional Corypha or Arenga palm emerging through the under-
50
growth The Lantana effectively inhibits the establishment of shade
intolerant species Occasional grassy patches are connected by
narrow game trails Toward the inland periphery of the narrow sandshy
stone plateau on which site 1 is located the Lantana gives way to
nearly pure stands of obtusifolia the most common palm found
in lowland Ujung Kulon (Dransfield unpublished) The Arenga are
associated with deeper soils where they occur just north of the site
Site 2 Cikendeng
Located astride two minor drainages site 2 is unique among the
sites studied as the only one containing a bamboo stand Nearly the
entire understory is dominated by the bamboo Schizostachyum
which grows horizontally in some places excluding light and all other
forms of vegetation Although bamboo thickets are found elsewhere in
Ujung Kulon they are not commonplace and may be seen along ridges as
well as along stream beds
The low basal area in site 2 is the result of a bamboo stand in
contact with another forest association in which Artocarpus
and Arenga obtusifolia are well represented Although Artocarpus is
quite common in the lowland flats of Ujung Kulon the only two
representatives recorded were found on site 2 belying its actual
frequency of occurrence Another tree typical of the flats is
Lagerstroemia flos-reginae but it was not found on any of the sample
sites
51
Site 5 Cankeuteuk
The basal area range of site 5 is rather broad A fuller lower
canopy of saplings in site 5 makes a difference in stocking of this
site If upper ba range of saplings were added to the measured ba
of trees in site 5 and lower ba range of saplings in site 8 were comshy
pared the total ba would be about the same -- 229 m2ha in site 5
2and 225 m ha in site 8 The high frequency of the small diameter
Ardisia humilis in site 8 tends to skew the mean ba toward the lower
end of the range there The common Arenga palm in site 5 tends to skew
the range toward the higher end of the scale Of 32 saplings counted
in site 5 10 were Arenga Because the monocotyledonous palms have
considerable diameter when they achieve sufficient height to be counted
at dbh they measure closer to 25 cm dbh than to 10 cm dbh
The high frequency of Arenga in the lowlands of Ujung Kulon has
an effect which is not evident in the limited vegetation site data in
this study As Schenkel and Schenkel-Hulliger (1967) put it These
palms are responsible for such poor light conditions in the lower
stratum that no saplings can grow apart from young Arenga
Accordingly the inter-species relationships are a necessary part of
the site descriptions Tree andor sapling number and size alone
cannot adequately describe the overall physiognomy of the forest
Except for the Arenga palm no tree species found in site 5 was
also found in other sites The several Drypetes macrophylla contrishy
buted the greatest to ba with 5 of the 9 trees representing 60 of
the ba of all the trees Drypetes was also well represented in the
sapling and pre-sapling categories although the short stout and
52
barbed Streblus spinosus is so dense in places that passage through
the lowest canopy required cutting a tunnel
A single representative of Diospyros macrophylla was recorded
yet this species is found extensively in uplands and in lowlands that
are not subjected to flooding
Site 8 Cikarang
The canopy of the seasonal swamps in the northeastern section of
Ujung Kulon is singularly dominated by the palmate fronds of the
Corypha utan Few species are found here that grow tall enough to
even be considered as co-dominants of Corypha The tallest of the
competitors in the sample site Neonauclea calycina and Vitex quinata
approach the shortest Corypha in height but are spatially separated
so that the Corypha have no restrictive influence over their growth
Corypha trees along constitute 74-95 of the ba and number 8 of the
11 trees in the site
The vast majority of the middle canopy is composed of Ardisia
humilis trees and saplings Because Ardisia is so widespread in the
vast seasonal swamplands of the Northeast but does not often achieve
large diameter more saplings than trees were counted The ba distrishy
bution consequently is likely to be skewed toward the lower end of
the range
It is probable that the Corypha-Ardisia association is one of the
largest in Ujung Kulon although most of the evidence results from
empirical observations rather than sample plot data Inasmuch as the
northeast side was subjected to direct inundation by the 1883 tidal
waves (Hoogerwerf 1970) it is presumed that the entire association
53
is largely post-successional dating from that time High soil pH
(about 81) and thick tuffaceous layers in the area also contribute
to the formation of the essentially edaphic mosaic with few species
present
Site 3 G Telanca
The species complexity of trees in site 3 is more evident than
for any other site by virtue of the more complete identification of
its tree representatives Ten taxa were identified by genus andor
species and numerous unidentified saplings add to the complexity
index of the site Basal area of site 3 is nearly double that of
site 2 although both are inland forest sites only a few kilometers
apart and relatively undisturbed by animal grazing Heights of the
tallest trees Syzygium lineatum Lophopetalum javanicum and
Cryptocarya ~- at 39 37 and 32 m respectively are comparabe to
the 38-40 m heights and 20-30 m average overstory heights of the
trees studied on nearby P Peucang (SEAMEO BIOTROP 1972)
Site 6 G Pajung
Located in one of the remotest sections of Ujung Kulon the
G Pajung massif has been little influenced by man and not at all by
tidal waves The elevation of site 6 contributes to the increased
1complexity index CI = 10-3 (hbds) after Holdridge (1967) h = hgt of 3 tallest trees in m for 110 ha plot b = ba in sq m for trees over 10 cm dbh for 110 ha plot d = number of tree stems over 10 cm dbh for 110 ha plot s = number of species of trees over 10 cm dbh for 110 ha plot
54
rainfall there which is presumed to be the highest in Ujung Kulon
The apparent disagreement between Boerema (1925) and Hoogerwerf (1970)
in regard to the amount of rainfall east and west of the summit notwithshy
standing this author agrees with the latter that more rainfall
occurs on the western side Orographic uplift on the windward side
at least during the rainy season seems to result in greater rain-
fall on the western slopes
In site 6 the vegetation is considered as primary and an example
of the favorable composition noted by Hoogerwerf (1970) in the
Pajung Range Only two trees exceeded 80 cm in dbh however The
mean height of trees was only 242 m with the tallest dominants of
41 39 and 38 m comparable with the heights of trees on low-lying
P Peucang
The ba range of saplings is thought to be normally distributed
here since no Arenga palms were encountered Dransfield (unpublished)
noted that Arenga is not found at elevations over 150 m On the
basis of normal distribution of saplings the mean ba of site 6 would be
731 m2ha for saplings combined with measured tree ba giving a
mean total of 3315 m2h~ This is about the 145 sq ftA (3329
m2ha) of ba attained by a primary tropical high forest under favorshy
able conditions as cited by Dawkins (1959)
Site 7 Guhamasigit
On the western slope of the G Pajung massif the Guhamasigit
site has rainfall which approaches that found on top of G Pajung
From the ba data and the number of trees found in the site it appears
that the complexity of the site exceeds all others investigated
55
Nevertheless mean height and dbh did not vary appreciably from the
values found in site 6
Only one tree is outstandingly large an unknown with a dbh of
102 cm and a height of 30 m The penultimate diameter is only 70 cm
dbh Mean tree height in site 7 is only slightly less than that found
in site 6 Both sites are completely within a large upland high
forest community and both would probably be mapped as identical
units on any large scale vegetation map
Sites 6 and 7 resemble each other in volume of stems length of
boles and the type of understory vegetation which is lacking in
Arenga palm Some of the tree and sapling species which occur in
site 6 also occur in site 7 including Neesia
Syzygium syzygoides ~he data are too scanty to make close comparisons
but it is safe to say that whereas all the other sites investigated
are notable for the heterogeneity among them sites 6 and 7 exhibit
several homogeneous physiognomic features
Soils
Data on soil profiles of Ujung Kulon soils are presented in
Tables 4-11 Verification of textural designation by particle size
distribution is given in Table 12
Depth of solum varied from a minimum of 72 cm in 1-1 to well over
the maximum depth limit adopted for convenience of 150 cm in 2-1
5-1 6-1 and 6-2 In sites 4 and 8 the sampling depth was limited
by the water table Bedrock R in site 1 appeared to be sandstone
in site 3 a marl in site San unconsolidated conglomerate containing
dissimilar rocks and in site 7 a soft pink-gray saprolitic siltstone
Table 4 Ujung Kulon Field soil description Site 1
Location Cibunar PARENT MATERIAL Sandstone Volcanic Tuff Relief Simple PHYSIOGRAPHY Level coastal terrace
DRAINAGE Excessive ELEVATION 25 m SLOPE 0-2 EROSION Moderate
Horizon Depth Color Texture Structure Stickiness Boundary (cm) (moist) (apparent) plasticity
A 0-7 Dark brown 7SYR 44
Loamy sand Medium crumb strong Non non
sticky plastic
Very abrupt irregular and discontinuous
I
C 7-15 Olive grey SY 52
Sand Fine granular moderate
Non non
sticky plastic
Very abrupt irregular discontinuous
IIC 15-72 Dark yellowish brown lOYR 34
Loamy sand Very weak
fine granular Non non
sticky plastic
Very abrupt
R 72+
A 0-10 Dark yellowish Loamy sand Medium crumb strong Non sticky brown lOYR 44 non plastic
C 10-15 Pale olive Sand Fine granular Non sticky SY 63 moderate non plastic
llC 15-62 Dark yellowish Loamy sand Very fine granular Non sticky brown lOYR 3 4 weak non plastic
R 62+
Very abrupt irregular discontinuous
Very abrupt irregular discontinuous
Very abrupt
V1 ------------------------------------------middot-middot --- ------middot --------------- ----------------- ------- ------ ----------- ------------------
Table 5 Ujung Kulon field soil description Site 2
Location Cikendeng PARENT MATERIAL Sedimentary rock
Relief Complex PHYSIOGRAPHY Hilly lowland DRAINAGE Imperfect ELEVATION 25 m SLOPE 15 EROSION V severe
Horizon Depth Color Texture Structure Stickiness Boundary (cm) (moist) (apparent) plasticity
A 0-13 Gray 25YR 50 Silt loam Medium crumb Slightly sticky moderate slightly plastic
B22 13-71 Brown lOYR 53 Silty clay Very fine sub Slightly sticky angular blocky plastic
r-1 I moderate
N
B22t 71-150+ Pale brown iOYR Clay Medium platy Slightly sticky 63 with 15 slightly plastic yellowish red 5YR 58 mottles
Gradual irregular
Clear
All 0-3
Al2 3-9
C 9-12 -t I
N
IIC 12+
Very dark gray 5YR 31
Silt loam
Dark brown to brown lOYR 43
Silt loam
Brown lOYR 53 Loamy sand
Yellowish brown lOYR 58
Silt
Medium crumb moderate
Medium crumb moderate
Medium granushylar weak
Fine sub angushylar blocky
Non sticky non plastic
Non sticky non plastic
Non sticky non plastic
Slightly sticky slightly plastic
Abrupt
Clear irshyregular
Clear ir regular
IJI---------------------------middot--middot----------------middot---------
-----------------------------
Table 6 Ujung Kulon field soil description Site 3
Location Telanca PARENT MATERIAL Marl volcanic tuff Relief Complex PHYSIOGRAPHY Mountainous upland
DRAINAGE Excessive ELEVATION 25-30 m SLOPE 25 EROSION Slight
Horizon Depth Color Texture Structure Stickiness Boundary (cm) (moist) (apparent) plasticity
All 0-4 Very dark brown Silty loam Coarse crumb Slightly sticky Clear lOYR 22 moderate slightly plastic irregular
Al2 4-10 Dark brown Silty loam Coarse crumb Slightly sticky Abrupt irregular lOYR 33 moderate slightly plastic discontinuous
-i C 10-13 Olive SY 53 Loamy sand Medium granushy Non sticky Abrupt irregular (I) I lar weak non plastic discontinuous
IIC 13-95 Dark brown to Clay loam Medium crumb Sticky brown lOYR li3 moderate plastic
R 95+
All
Al2
-j
I (I)
C
IIC
R
0-5
5-15
15-20
20-80
80+
Black lOYR 21
Dark yellowish brown lOYR 44
Light olive gray SY 62
Dark brown lOYR 33
Silty loam
Silty loam
Fine sand
Clay loam
Coarse crumb moderate
Medium crumb moderate
Fine granular weak
Medium granular moderate
Slightly sticky non plastic
Slightly sticky slightly plastic
Non sticky non plastic
Slightly sticky slightly plastic
Abrupt
Clear irregular discontinuous
Abrupt irregular discontinuous
Ln Ol
1 l
Table 7 Ujung Kulon field soil description Site 4
Location Cidaun PARENT MATERIAL Alluvial sand volcanic tuff Relief Simple PHYSIOGRAPHY Lowland alluvial fan
DRAINAGE Poorly drained ELEVATION lt25 m SLOPE 0-2 EROSION None
Horizon Depth Color Texture Structure Stickiness Boundary (cm) (moist) (aEearent) plastic it
All 0-2 Dusky red Loamy sand Fine granular Non sticky Abrupt 25YR 32 weak non plastic
Al2 2-6 Very dark gray Loamy sand Fine granular Non sticky Abruptirregular 25YR 30 weak non plastic discontinuous
C 6-10 Reddish brown Coarse sand Coarse granular Non sticky Abruptirregular 25YR 44 single grain non sticky discontinuous
-1 IICl 10-55 Reddish brown Fine sand Fine granular Non sticky Gradual
r I 5YR 43 single grain non plastic
IIC2 55-82+ Yellowish brown Very fine Very fine granu- Non sticky lOYR 58 sand lar single non plastic
grain
All 0-2 Dusky red Loamy sand Fine granular Non sticky Abrupt 25YR 32 weak non plastic
Al2 2-10 Dark brown Loamy sand Fine granular Non sticky Abrupt 75 YR 30 weak non plastic
(I)
I r
IICl 10-70 Brown 44
75YR Fine sand Fine granular single grain
Non non
sticky plastic
Gradual
IIC2 70-110+ Yellowish red Very fine Very fine granu- Non sticky 75YR 56 sand lar single non plastic
grain
middot--------middotmiddot---middot
Table 8 Ujung Kulon field soil description Site 5
Location Relief
Cankeuteuk Complex hilly
PARENT MATERIAL Mixed sedimentary and volcanic rocks PHYSIOGRAPHY Low mountain slope DRAINAGE Moderate-well ELEVATION 25-50 m SLOPE 27 EROSION Uneroded to slight
Horizon Depth (cm)
Color (moist)
Texture (aE~arent)
Structure Stickiness Elasticity
Boundary
All 0-4 Black lOYR 21
Al2 4-10 Very dark gray lOYR 31
-t I C 10-14 Olive SY 53
Lf)
IIC 14-150+ Dark gray lOYR 41
Silty loam to sandy clay loam
Silty loam
Loamy sand
Sandy clay to clay
Coarse crumb moderate
Coarse crumb moderate
Medium granu-lar weak
Fine sub angu-lar blocky firm
Slightly sticky non plastic
Slightly sticky slightly plastic
Non sticky non plastic
Slightly sticky plastic
Abrupt
Abruptirregular discontinuous
Abruptirregular discontinuous
All 0-3 Very dark brown lOYR 22
Loam Coarse crumb moderate
Slightly sticky non plastic
Abrupt
Al2 3-7 Very dark gray brown lOYR 32
Loam Medium crumb weak
Slightly sticky non plastic
Abruptirregmicrolar discontinuous
()
I Lf)
C
IIC
7-13
13-130
Gray brown 25Y 52
Dark gray brown lOYR 42
Sand
Sandy clay
Medium granu-lar weak
Fine sub angu-lar blocky firm
Non sticky non plastic
Slightly sticky plastic
Abruptirregular discontinuous
R 130+
middot---middot-----middot------
(1
0
Table 9 Ujung Kulon field soil description Site 6
Location Gunung Pajung PARENT MATERIAL Sedimentary rock Relief Complex steep PHYSIOGRAPHY Mountainous slope
DRAINAGE Mod well SLOPE 32
Horizon Depth Color Texture Structure (cm) (moist) (apparent)
All 0-2 Dark brown to Sandy loam Medium crumb brown 75YR 42 weak
Al2 2-11 Dark yellowish Loamy sand Fine crumb weak r--l brown lOYR 44 I
C 11-20 Gray to light Sand Fine crumb weak gray SY 61
IIC 20-150+ Brownish yellow Clay loam Coarse sub-lOYR 68 angular blocky
moderate
AllA12 0-5 Dark brown Silt Medium crumb lOYR 33 weak
N
5-9 Olive 5YR 54 Silty sand Fine granular
I C weak
IIC 9-150+ Brownish yellow Clay Medium sub-lOYR 68 angular blocky
moderate
tuff
ELEVATION 460 m EROSION Moderate
Stickiness Boundary plasticity
Non sticky Abrupt non plastic
Non sticky Clear wavy non plastic
Non sticky Clear disconshynon plastic tinous
Non sticky slightly plastic
Slightly sticky Abrupt disconshynon plastic tinuous
Non sticky Abrupt disconshynon plastic tinuous
Slightly sticky plastic
Table 10 Ujung Kulon field soil description Site 7
Location Relief
Guhamasigit Complex v steep
Horizon Depth (cm)
Color (moist)
-4
rmiddot
AllAl2
llC
middot 0-11 Dark brown lOYR 33
11-120 Yellowish brown lOYR 58
R 120+
PARENT MATERIAL Sedimentary rock PHYSIOGRAPHY Mountainous slope DRAINAGE Excessive ELEVATION 300 m SLOPE 52 EROSION Moderate
Texture (apparent)
Structure Stickiness plasticity
Boundary
Silt loam Medium crumb moderate
Slightly sticky slightly plastic
Gradual
Silt Medium subshy Slightly sticky Gradual angular slightly plastic blocky moderate
CJ N
Table 11 Ujung Kulon field soil description Site 8
Location Cikarang PARENT MATERIAL Marine sediments tuff Relief Nearly level PHYSIOGRAPHY Lowland swamp
DRAINAGE Poor ELEVATION lt25 m SLOPE 2 EROSION Slight
Horizon Depth Color Texture Structure Stickiness (cm) (moist) (apparent) plasticity
A 0-13 Black 5YR 21 Loamy sand Medium crumb weak Non sticky non plastic
Cll 13-23 Very dark grey Fine gravel Medium granular Non sticky brown lOYR 32 weak non plastic
Cl2 23-34 Pale brown Medium sand Medium granular Non sticky lOYR 63 weak non plastic
IICl 34-47 Olive brown Fine sand Very fine platy Non sticky 25Y 44 weak non plastic
IIC2 47-57+ Pale yellow Coaise sand Very fine platy Non sticky
A 0-13 Black 25Y Gravel to Medium granular Non sticky 20 very coarse weak non plastic
sand
IICl 13-24 Very dark grey Gravel to Medium granular Non sticky brown lOYR 32 very coarse weak non plastic
sand
IIC2 24-56+ Dark brown Medium sand Very fine platy Non sticky lOYR 33 weak non plastic
Boundary
Clear
Abrupt irregular discontinuous
Gradual
Gradual
Clear
Abrupt irregular discontinuous
64
Few soil horizons were observed Those sites where slope permits
continuous removal of both excess rain water and surface soil (sites
1 2 3 5 6 and 7) had only 3 or 4 horizons and a relatively uni-shy
form deep subsoil Differentiation of subsoil horizonation in sites
4 and 8 may reflect past changes in sedimentation deposition patterns
The precisely dated age of the C horizon (1883) obviates the
rapid rate of soil development above it Also the usually abrupt
boundary between the surface soil horizon(s) points to rapid alterashy
tion The All surface horizon when distinguished averaged 31 en in
thickness (Tables 4-11) An Al2 when visible as a separate entity
averaged 66 cm in thickness (also refer to Appendix B) The absence
of the All Al2 sequence in site 2 is thought to be due to erosion
In sites 6 and 7 the AllAl2 horizon indicates that normal All Al2
horizonation is distinguishable but due to slope effects there is
considerable soil mixing Morphological properties of the various
horizons highlight the dissimilarities of the tuffaceous C horizon in
particular
Table 12 shows that most profiles are rather loamy or sandy
Clay texture for the most part is found only in the subsoil In
site 2 the whole profjle is more clayey due perhaps to repeated
erosion of the surface layers resulting in a truncated soil The C
horizons are more finely textured than the field soil descriptions in
Tables 4-11 would indicate
Bulk density and soil moisture information are given in Table 13
With soil pores completely filled (at O cm suction) site 3 has
slightly greater percentage water volume than site 7 which has the
next highest water percentage The site 3 profile however has the
l I I
Table 12 Mean particle density pp particle size distribution and textural class designation
Site horizon
1-lA 1-lC 1-lIIC
2-lA 2-1B22 2-lB22t
3-lAll 3-1Al2 3-lC 3-lIIC
4-lAll 4-1Al2 4-lC 4-lIICl 4-1IIC2
5-lAll 5-lAll(repeat) 5-1Al2 5-lC f 5-IIC 5-1 IIC (repeat)
p-p
267 244 278
250 262 2 72
249 260 244 266
243 255 263 268 268
243 243 251 252 263 263
CSbVCSa
142 1085 399 850 1 72 1393
346 461 165 560 005 011
190 222 1 93 426
1067 490 406 364
1036 2745 203 1214 458 13 97 288 13 25 244 1393
311 1233 -------------390 1251 481 7 96 266 706 -------------
MSc
1814 986
1969
307 351 015
259 248 279 228
2491 1902 1774 1854 2087
1080 55 73 1119
752 708
3552
dFS
eVFS
21 34 776 1222 1420 1878 646
425 804 304 376 052 218
463 814 443 488 590 1210 353 438
2541 944 26 77 1644 2499 1551 2914 1360 2809 13 70
1683 1005 -------------1503 852 1439 1315 1099 930 -------------
Silt
2965 4523 2075
4672 3110 3142
44 77 3448 4745 3053
243 1722 13 70 1240 11 70
3131 2220 3218 3935 3081 2129
Clay
1084 601
1867
2986 5134 6557
3404 4755 1619 4892
00 588 951
1018 926
1557 2207 1666 1282 3210 4320
Textural designation
Sandy loam Fine sandy loam Sandy loam
Clay loam Clay Clay
Clay loam Clay Loam Clay
Coarse sand Loamy sand Sandy loam Sandy loam Loamy sand
Fine sandy loam Sandy clay loam Loam Loam Clay loam Clay
a b C
vcs cs MS
= very coarse coarse sand medium sand
sand d e f
FS VFS
fine sand very fine sand 3 detcrrninations deg J1
Table 12 Mean particle density Pp particle size distribution and textural class designation (Contd)
Site horizon Pp VCSa csb MSc FSd VFSe ~ Silt Clay
Textural designation
6-lAll 235 205 753 501 8 70 1105 4681 1885 Loam 6-1Al2 237 304 719 603 950 1263 4213 1947 Loam 6-lC 244 441 735 634 1110 1757 4698 624 Fine sandy loam 6-lllC 267 250 397 308 523 621 39 71 3930 Clay loam 6-lIIC(repeat) 270 258 317 252 483 616 4032 4043 Silty clay 6-lIIC(repeat) 287 ------------- 2119 -------------- 3204 46 77 Clay
7-1AllAl2 253 675 731 702 1360 844 3050 2637 Loam 7-llIC 268 517 579 555 1068 717 3344 3230 Clay loam
8-lA 239 11 33 7 21 739 1567 2434 2550 857 Fine sandy loam 8-lCll 241 1010 458 428 2225 3397 2072 410 Loamy fine sand 8-1Cl2 260 315 497 890 2687 2538 2322 751 Sandy loam 8-lIICl 263 336 511 588 27 11 3100 21 32 622 Very fine sandy
loam 8-1IIC2 270 556 1564 21 71 3065 1241 958 446 Loamy sand
Table 13 Mean bulk density and mean percent water by volume (OD) and percent available water of Ujung Kulon soil profiles
Suction a
Depth (cm) 0cm 10 cm 100 cm 13 bar 15 bar Percent available 1 3 - 15
Percent
Site Ill 0-15 15-30 30-45
cm cm cm
103 107 1 06
6127 6147 6201
4947 4848 5028
3622 3625 3138
3061 3066 2779
1472 1643 1892
1589 1423 887
Site IJ2 0-15 15-30 30-45
cm cm cm
090 086 086
6408 6702 6718
6251 6230 61 25
5375 5442 5629
4780 4933 5215
3506 3757 4299
1274 11 76
916
Site 113 0-15 15-30 30-45
cm cm cm
o 71 0 73 084
72 37 7256 6842
4068 4091 5060
3608 3676 l4 36
3266 3399 41 22
2450 2793 3226
816 606 8 96
Site 14 0-15 cm 15-30 cm --- b
1 20 1 39
5181 4813
41 28 4338
3319 3303
2762 2501
1746 1728
1016 7 73
Site 115 0-15 15-30 30-45
cm cm cm
o 96 097 093
61 75 6312 6464
5325 5473 5322
4402 4693 4516
3681 4025 3915
2437 2864 2821
1144 11 61 1094
Site IJ6
a
0-15 15-30 30-45
cm cm cm
0 75 097 103
6822 6387 6164
5795 6044 5982
4326 5479 5Lt 78
2879 4523 16 12
2024 3392 3289
855 1131 n23
Cb - No J0-45 cm samples due to high water tuble _
~ble 13 Mean bulk density and mean percent water by volume (OD) and percent available water of Ujung Kulon soil profil~s (Contd)
Depth (cm) 0cm 10 cm 100 cm 13 bar 15 bar Percent available _________________________________ - 15 bar________________ ________ middot----middotmiddot--
Site 117 0-15 cm 0 71 7194 5661 4925 3803 2644 1159 15-30 cm 078 7089 5929 5165 4033 2941 1092 30-45 cm o 77 7127 6006 5312 4087 31 23 964
Site 118 0-15 cm 062 7414 5114 4121 2867 1108 1759 15-30 cm 091 6579 5533 4721 2556 1128 14 28 30-45 cm 115 5685 5097 4598 21 7 4 1275 1199
p
69
least propensity to retain water despite having considerably more clay
in the profile
Results of chemical analyses are given in Tables 14-17 Soil pH
is moderately acid (in the pH 50-60 range) in most cases with a minishy
mum of 506 in 6-lIIC The entire profile of site 8 is above H 70 due
to decomposing shells while only horizon IIC in site 3 is above pH 70
due to the presence of marl
The CEC determined at soil pH is greatest in the surface soil
3-lAll which also has appreciable clay (Table 12) and organic material
as evidenced by a high organic C content (Table 16) Conversely the
lowest CEC is found in the loamy sand of 8-1IIC2 which has a comparashy
tively low content of both clay and OC
Calcium dominates among the exchangeable bases (Table 15) in ~ost
cases particularly in sites 3 and 8 where water-soluble Ca precluded a
calculation of percent base saturation( BS) In sites 6 and 7 ~g
exceeded Ca in the surface soil deeper in these profiles potassium and
sodium also exceeded the Ca levels in most instances
The OC declined sharply with depth (Table 16) but C03-C where
it occurred was many times higher in the subsoil with depth thus conshy
tributing to a trend toward uniformity in CN ratios except in sites
1 4 and 5
Extractable P levels were variable between surface soils and subshy
soils in different profiles (Table 17) Site 8 had the highest amount of
Pin the surface (275 ppm) but relatively less in the two tuff layers
below (92 and 60 ppm respectively) Horizons in site 3 had the penulshy
timate amount of Pin any single profile but there was considerably
70
Table 14 Soil pH and cation exchange capacity of soil profiles of Ujung Kulon determined by two methods
Sitehorizon Soil pH At CEC melOOg Soil
soil pH At pH 7
1-lA 1-lC 1-lIIC
578 598 633
1786 1135 1990
1501 959
1492
2-lA 2-1B22 2-1B22t
512 517 526
3410 3886 4636
2822 4372 4675
3-lAll 3-1Al2 3-lC 3-lIIC
649 684 682 7 73
5406 4066 1530 3349
4812 4182 1100 32 77
4-lAll 4-1Al2 4-lC 4-lIICl 4-1IIC2
5 41 532 528 533 552
1658 1354 1311 1240 1292
1800 1433 1115 817 895
5-lAll 5-1Al2 5-lC 5-lIIC
573 528 524 564
3116 2959 1454 36 24
2964 2049 1208 3101
6-lAll 6-1Al2 6-lc 6-lIIC
563 556 539 506
2617 20 71 1230 2080
18 24 1545
616 1528
7-lAllAl2 7-lIIC
572 519
2612 2422
2240 2074
8-lA 8-lCll 8-1Cl2 8-lIICl 8-1IIC2
713 799 793 794 799
4056 11 59 1358 1439
988
4441 1232 1262 1139
797
-middotmiddot-middotmiddotmiddot ------middotmiddotmiddotmiddot
71
Table 15 Exchangeable bases and percent base saturation in Ujung Kulon soil profiles
meq100~ Sitehorizon Ca Mg K Na lBases CEC a1
lo BS at soil pH
1-lA 454 250 041 o 71 816 1786 4569 1-lC 276 091 056 096 519 1135 4573 1-lIIC 1115 1 93 091 048 1447 1990 7656
2-lA 648 674 200 065 1587 3410 4654 2-1B22 11 94 787 234 041 2256 3886 5805 2-1B22t 2120 811 108 029 3086 4636 6618
3-lAll 4638 354 219 054 5265 5406 9739 3-1Al2 3306 319 094 059 3778 40 66 9292 3-lC 1319 097 045 050 1511 1530 9876 3-lIIC 6840 051 115 046 7052 3349 gt100 a
4-lAll 331 118 040 068 557 1658 3359 4-1Al2 344 098 019 063 529 1354 3870 4-lC 352 116 014 060 542 1311 41 34 4-lIICl 622 242 012 o 77 953 1240 7685 4-1IIC2 684 206 023 052 965 12 92 7469
5-lAll 2246 676 247 061 3230 3116 10366 5-1Al2 1492 486 221 o 70 2269 2959 7668 5-lC 690 301 1 23 054 1168 1454 8033 5-lIIC 1570 957 1 78 130 2835 3624 7823
6-lAll 135 1 66 133 065 499 2617 1907 6-1Al2 034 055 091 052 232 2071 11 20 6-lC 028 018 066 067 1 79 1230 1455 6-lIIC 004 085 016 047 1 52 2080 731
7-1AllAl2 7-lIIC
3 96 056
432 186
058 032
052 067
938 341
2612 2422
3591 1408
8-lA 10700 278 052 047 110 77 4056 gt100 a 8-lCll 4568 128 040 030 4766 11 59 gt100 a 8-1Cl2 5362 293 032 050 5737 1358 gt100 a
8-lIICl 4359 247 015 046 4667 1439 gt100 a 8-1IIC2 5062 354 018 040 5474 988 gt100 a
a - Due to water soluble Ca
72
Table 16 Percent organic carbon carbonate-carbon and total nitrogen and carbon-nitrogen ratios in Ujung Kulon soil profiles
CaSitehorizon oc Co N CN ratio3 -
1-lA 1-lC 1-lIIC
2-lA 2-1B22 2-1B22t
3-lAll 3-1Al2 3-lC 3-lIIC
4-lAll 4-1Al2 4-lC 4-lIICl 4-1IIC2
5-lAll 5-1Al2 5-lC 5-lIIC
6-lAll 6-1Al2 6-lC 6-lIIC
7-1AllAl2 7-lIIC
8-lA 8-lCll 8-1Cl2 8-lIICl 8-1IIC2
124 091 102
189 1 20 047
561 270 096 1 88
581 329 1 46 091 051
5 73 330 094 072
481 341 1 20 094
414 111
528 1 31 139 088 080
388 269 275
275
975 235 2625 345
480
016 012 068
027 016 007
052 030 009 023
050 033 018 014 007
044 037 011 007
036 029 009 008
039 012
052 012 012 009 008
78 76 1 5
70 75 67
11 0 90
107 82
116 100
81 65 73
130 89 85
103
13 4 118 13 3 11 8
108 92
102 109 116
98 100
a - Mean of replicate determinations
----------------middot--- middot-----middot--middot--middot -----middot--middotmiddot ---middot
73
Table 17 Phosphorous silicon and manganese levels of Ujung Kulon soils
eem Sitehorizon p Si Mn
1-lA 85 281 029 1-lC 160 381 0 a 1-lIIC 26 261 0 a
2-lA 34 373 1 75 2-1B22 8 414 075 2-1B22t 3 421 tr b
3-lAll 122 1034 tr b 3-1Al2 122 731 tr b 3-lC 170 756 0 a 3-lIIC 34 655 0 a
4-lAll 10 181 036 4-1Al2 6 166 030 4-lC 4 190 031 4-lIICl 4 236 007 4-1IIC2 4 291 tr b
5-lAll so 362 061 5-lA--12 42 281 049 5-lC 68 346 046 5-lIIC 4 655 028
6-lAll 16 241 224 6-1Al2 8 342 044 6-lC 23 331 tr b 6-lIIC 19 251 078
7-lAllAl2 8 221 033 7-lIIC 4 196 162
8-lA 275 666 007 8-lCll 92 640 021 8-1Cl2 60 576 066 8-lIICl 26 651 028 8-1IIC2 26 41 6 048
a - Non detectable in 8 readout counts b - tr= trace detectable but below 005 ppm mean
74
high Pin the C horizon (170 ppm) Sites 1 5 and 6 had the greatest
amount of Pin the C horizon
Water-soluble Si was extremely high in 3-lAll and substantially
higher in the entire profile than in other sites except the site 8
profile and in 5-lIIC By contrast Mn levels were low In oany
cases Yin was not detectable or detectable at a mean level of less
than 005 ppm Only 3 horizons showed Mn in excess of 10 ppm
Mineralogical information is given in Tables 18 and 19 Quartz
predominates in the sand and silt fractions of most horizons of each
profile (Table 18) and in most profiles In site 5 plagioclase reshy
places quartz in the sand fraction of all horizons except in 5-lIIC
where plagioclase has not been identified in the silt and clay fracshy
tions cristobalite and smectite predominate The subsoil sand and
silt of 3-4IIC contain calcite At the deepest levels of site 8
the presence of calcium phosphate is indicated Moderate amounts of
smectite halloysite and kaolin occur commonly in the silt and clay
fractions of most profiles
Total oxides are given in Table 19 Reported percentage totals
are several percent high due to positive deviation from regression
equations used in internal standards employed in calibration of the
X-ray quantometer Also some error exists due to the absence of
Na 2o values
75
Table 18 Primary and secondard minerals identified from X-ray diffraction patterns and unidentified peaks in soils of Ujung Kulon
Sitehorizon Mineral Unidentified peaks (Mg-saturated paste only)
d-soacing (Angstroms) 1-lA
Sand Silt Clay
1-lC Sand Silt Clay
1-lIIC Sand
Silt Clay
2-lA Sand Silt Clay
2-1B22 Sand Silt Clay
2-1B22t Sand Silt Clay
3-4All Sand Silt Clay
3-4Al2 Sand
Silt Clay
Quartz Quartz Quartz
Quartz Quartz halloysitea b
Quartz
Quartz halloysite Quartz halloysite
Quartz Quartz Smectite kaolin
Quartz Quartz Smectite kaolin halloysite
Quartz Quartz halloysite Smectite kaolin halloysite
Quartz Quartz Kaolin halloysite
Quartz
Quartz halloysite Kaolin smectite halloysite
319 413243321377 415
404322291 321
314321255323 380
417319269714
429323198 319446404
429450 319446200352
448318 319446377300
3 20 4 06 i 7 2
296321406151 1501 78
1004
a - Silt + clay b - No sample
76
Table 18 Primary and secondary minerals identified from X-ray diffraction patterns and unidentified peaks in soils of Ujung Kulon (Contd)
Sitehorizon Mineral Unidentified peaks (Mg-saturated paste only)
cl-spacing (Angstroms)
3-4C Sand Silt Clay
3-4IIC Sand Silt Clay
4-lAll Sand
Silt Clay
4-1Al2 Sand
Silt Clay
4-lC Sand
Silt Clay
4-1IIC1 Sand Silt
4-lIICa Sand
Silt
Clay
Quartz Quartz halloysite Kaolin halloysite
Calcite
Smectite kaolin halloysite
Quartz
Quartz C
Quartz
Quartz smectitea b
Quartz
Quartz smectitea b
Quartz Quartz smectitea
Quartz
Quartz smectitea
b
324377336182 182 714472335287
324
335 320334243240 724482
320322408378 366349
319377
319365377406 1 98
321343404
319323408374 3 66 l 98
319323377405 448349
406322253198 3221000
320321377406 390366229198
322319408377 444100
a - Silt + clay b - No sample c - No clay in horizon
77
Table 18 Primary and secondary minerals identified from X-ray diffraction patterns and unidentified peaks in soils of Ujung Kulon (Contd)
Sitehorizon Mineral Unidentified peaks
5-lAll Sand Feldspar Silt a Cristobalite smectite Clay Smectite
5-1Al2 Sand Plagioclase Silt a Cristobalite smectite Clay a Cristobalite smectite
5-lC Sand Plagioclase Silt a Cristobalite Clay Smectite
5-lIIC Sand a Cristobalite
Silt a Cristobalite smectite
Clay Smectite
6-lAll Sand Quartz Silt Quartz Clay Kaolin halloysite
6-1Al2 Sand Quartz calcium - aluninum
silicated Silt Quartz Clay Kaolin halloysite
6-lC Sand Quartz
Silt Quartz Clay Kaolin halloysite
6-lIIC Sand Quartz Silt Quartz Clay Kaolin halloysite
(Mg-saturated paste only) cl-spacing (Angstroms)
321446378
214192284161
230180178 335321440
322365377170 302294216
321383440331 298256
4 06 3 77 1 85 281446 415442719
348 213 415386444725
322365406425 3 77 252
444319 4397141425
323380217 352324377216 417725
d - Ca Al2 Si2 Og
78
Table 18 Primary and secondary minerals identified from X-ray diffraction patterns and unidentified peaks in soils of Ujung Kulon (Cond)
Sitehorizon Mineral Unidentified peaks (Mg-saturated paste only)
cl-spacing (Angstroms)
7-1AllAl2 Sand Silt Clay
7-lIIC Sand Silt
Clay
8-lA Sand Silt Clay
8-1Cl2 Sand
Silt Clay
8-lIICl Sand
Silt
Clay
8-lIICZ Sand
Silt
Clay
-
Quartz Quartz Kaolin halloysite
Quartz Quartz
Kaolin halloysite
Quartz Quartz kaolina b
Quartz
Quartz kaolin halloysitea b
Quartz
Quartz calcium phosphatee kaolina
b
Quartz
Quartz calcium phosphatee halloysitea
b
380325300 353324 719598
324380303 352323377216
212 731417
349322305 1004
300304188249 270210
300304340271 188249
3031004
300341189271 329226186 377238
8421004
a - Silt+ clay b - No sample e - Ca2P207
Table 19 Percent total oxides in Ujung Kulon soils (on ignited basis)
Sitehorizon Si02 Al203 Fe 2o3 MgO K20 Cao P205 Others-ab Total
1-lA 5635 21 7 2 1696 l 75 213 094 143 333 10461 1-lC 6597 2069 798 180 254 183 084 234 10399 1-llIC 49 13 2302 2308 154 202 066 143 396 10484 1-lC 6673 1972 830 189 235 241 068 243 10451 (whole soil)
2-lA 6986 2201 722 200 184 060 041 229 10623 2-1B22 6458 2622 879 219 182 039 031 235 10665 2-1B22t 6228 2767 896 266 201 061 025 224 10668
3-4All 5503 2716 1061 1 80 157 1 59 1 27 269 104 72 3-4Al2 5518 2902 1146 1 73 1 54 267 120 270 10550 3-4C 6898 2066 581 1 60 278 213 045 218 10459 3-4IIC 4805 3104 12 82 1 86 098 774 140 271 10660 3-4C 6867 2002 569 1 41 267 242 043 214 10348 (whole soil)
4-lAll 7245 1945 728 1 81 216 089 042 216 10662 4-1Al2 6864 2266 767 182 1 98 068 035 220 10600 1-lC 6461 2344 978 209 212 0 70 035 230 10539 4-lIICl 6259 2457 10 77 217 208 085 036 239 10578 4-1IIC2 6056 2569 11 74 2 73 207 098 035 233 10645
----------~~---- ~---middot----middot-----middot
a - Ti0 2 MnO b - no Na 2o calculated
r
Table 19 Percent total oxides in Ujung Kulon soils (on ignited basis) (Contd)
Sitehorizon Si02 Al203 Fe2o3 MgO K20 Cao P2D5 Others-ab Total
5-lAll 5-1Al2 5-lC 5-llIC 5-lC (whole soil)
6-lAll 6-1Al2 6-lC 6-lIIC 6-lC (whole soil)
7-1AllAl2 7-lIIC
8-lA 8-1Cl2 8-lIICl 8-1IIC2
6994 6909 6992 6726 6614
6617 6393 66 96 5787 6795
5995 5818
6265 5788 5885 6028
2254 2372 2156 2664 2247
2437 2627 2243 3160 2080
3012 3087
2024 1997 2139 2307
592 628 568 630 584
795 827 658
10 77 610
920 1007
802 809 832 869
1 91 1 97 169 218 1 70
139 136 1 70 1 22 165
152 165
237 238 266 256
273 266 278 203 214
200 200 244 214 255
287 303
1 64 1 60 1 55 1 61
167 141 1 70 069 348
075 074 1 55 000 210
014 000
798 1204 10 90
745
039 040 032 020 032
037 039 033 028 033
037 030
101 057 047 043
200 207 208 189 223
235 235 224 239 223
247 247
231 223 218 219
10710 10760 105 73 107 19 10432
10535 10531 10423 10627 103 71
10664 10657
10622 10476 10632 10628
---J
0 0
81
DISCUSSION
Density Stocking and Site Utilization
Numerical abundance and spatial distribution of species must be
taken into account before an understanding of plant community organizshy
ation can be obtained in the viewpoint of Hairston (1958) In the
opinion of Gause (1936) the most important structural feature of a
community is a definite quantitative relationship between abundant
and rare species The plant community can best be described as a
spatial and temporal organization of organisms (Dansereau 1963)
with differing degrees of integration Despite close interrelationshy
ships the ultimate unit of vegetation is not the plant community
but the individual plant type whose representatives show similar
ecological behavior (Mueller-Dombois and Ellenberg 1974)
Abundancy contributes to homogeneity whereas rarity is a sign of
heterogeneity within a particular community Spatial homogeneity
however requires that a species be distributed equally in all parts
of an area ie the probability of encountering the species in
all parts is the same Tests of homogeneity in a statistical sense
are rarely applied in multi-species communities (McIntosh 1967)
and usually homogeneity is determined subjectively
The paucity of information within each site and the inadequate
number of sample sites in this study compound the problem of drawing
meaningful inferences from the Ujung Kulon vegetation data Attempts
to delimit the various community boundaries by investigating only
selected associations was done at the sacrifice of randomness Comparishy
sons of site utilization among associations was not possible because
82
no true replication of conditions existed
Density of trees and saplings ie the number of stems per unit
area is generally greater in the well drained uplands than in lower
elevation sites (see Figure 6) having less relief Sites 6 and 7 as
typical of the upland situation exhibit good drainage They contain
43 and 41 stems respectively Site 8 on poorly drained flat ground
contains 30 stems Sites 1 and 2 have low stem counts
There is apparently greater site utilization in the uplands on ~
the basis of stocking as well Stocking is a relative rather than
an absolute measure of site utilization and often employs the detershy
mination of dbh and ba The use of dbh alone has serious drawbacks
because mean dbh depends upon the number of trees in each site as
well as tree size Exceptionally large or small trees tend to greatly
affect mean dbh since sample size is small Site 5 with 9 trees and
mean dbh of 406 cm appears to be comparable to Site 7 with 18 trees
and 473 cm mean dbh a dbh change of 165 between the two sites
Median dbh in Sites 5 and 7 were 35 cm and 39 cm respectively Fron
the standpoint of total ba per site however from 1237 - 2294 m2ha
in site 5 to 3165 - 4518 m2ha in Site 7 the percent change of the
ba range is 854 - 427
This grouping of total baby sites also suggests greater site
utilization in the uplands Basal area alone does not constitute an
index of site productivity Productivity is measured against some age
standards but lacking true growth rings in most species actual age
of trees in undisturbed forests of the tropics is mostly a matter of
conjecture In mixed forest of multi-aged species there is as yet
no precedent for the concept of site index The use of basal area
83
assumes some maximum tree crown capacity as a function of stem dia-
meter Penetration of light is thus limited and some equilibrium be-
tween canopy trees and understory species comes about perhaps one
reason why Dawkins (1959) assigned a maximum value for primary tropishy
cal high forest of about 3327 m2ha Even higher ba in sites 6 and
7 may be due to more compact crowns of species found there At any
rate the differences in elevation alone would suggest the possibilishy
ty that lower basal areas in the lowlands may be due in part to the
destruction of part of the overstory by the tidal waves of 1883
Traditional parameters of dbh and tree height have limited useshy
fulness as indices of site utilization Although Hoogerwerf (1970)
attested to the primary nature of the forest in the G Pajung Range
he seemed skeptical that much primary forest existed elsewhere in
Ujung Kulon because few trees of large diameter are encountered Only
two specimens in the 80-100 cm dbh range were neasured in site 6 and
one in site 7 both in the G Pajung Range In the lowlands Artoshy
carpus elastica of 83 and 86 cm dbh were recorded in site 2 and a 93
cm dbh Syzygium lineatum was measured in site 3 Other equally large
trees were found near and around sites 2 3 and 5 but with the same
low frequency as those encountered within the sites Cain et al
(1956) also noted that although very large trees do occur in tropical
rain forest their studies in Brazil gave them the impression of a
forest composed of moderate to small trunks with long unbranched boles
and relatively small crowns Holdridge (1970) also reported a maxishy
mum dbh of 957 cm and a penultimate dbh of 800 cm in a primary
forest in Puerto Rico The long boles and small crowns of trees in
-
---
---
84
sites 6 and 7 contributed to the present authors inability to get
leaf samples for identification
Taxonomic differences among the sampling sites were striking
since few of the same tree species were found in other sites Method
of seed dispersal is suspected to be one of the important factors in
species homogeneity within sites and similarly a factor in causing
heterogeneity between sites Many primary tree species of the
tropics have large seeds which restrict rapid widespread establishshy
ment (Gomez-Pompa~ al 1972) The Neesia altissima found only in
sites 6 and 7 for example is quite widespread in the G Pajung Range
and would presumably grow in the vicinity of sites 3 and 5 Its heavy
seed pods however are cast quite close to the parent trees and it is
probable that the spread of the species is restricted to slow expanshy
sion On the other hand floatable seeds especially those of Arenga
obtusifolia may predominate in the drained soils of the lowlands in
voids created there by the tidal wave destruction of 1883 Otherwise
Arenga is limited to vegetative propagation of suckering of underground
parts of parent trees Although Arenga may have been established by
seed floatation apparently the trees dont tolerate prolonged exshy
posure to salt water No Arenga were found in site 8
Other edaphic conditions are thought largely responsible for reshy
striction of plant species to various associations The draughtiness
of the soil in site 1 is thought to be largely a feature of the undershy
lying sandstone parent material After 10 days of continuous rain
during March 1973 there was no sign of puddling in site l and soil
moisture content was only about 25 Also the apparent excessive
drainage may be due to fissured rocks in the fairly shallow soil
85
An analogous situation seems to exist in the northern periphery
of the Telanca area at least in the upper part of the solum The
rapid infilitration of rain water into the soil in wuch of the watershy
shed results in movement of water in underground streams Where a
high water table exists near sea level the trees establish shallow
root systems and are readily blown down by waterspouts and high winds
which occur in the coastal areas The secondary appearance of the
forest in the northeastern sections of Ujung Kulon may be a conseshy
quence of both high water table and wind blowdown of species not
adapted to a wet soil regime Mangroves and other species found in
the littoral zone are better able to withstand those influences
because of their adaptation of mechanical support
On the basis of ground reconnaissance the northeastern lowlands
seem to have more clear-cut vegetation mosaic patterniag than other
areas The tidal waves in 1883 may have been most destructive there
thus altering species succession However the thick ash fall itself
in terrain above the high water line was also an important factor in
post-Krakatau succession
Preliminary Biomass Estimation
Total biomass production is a useful indicator in describing
site utilization A reasonable post facto approximation can be made
by applying the concepts of other investigators Ovington and Olson
(1970) calculated regression equations of oven dry weight of various
plant parts (roots boles stems and leaves) in standing trees by
direct weighing of typical representatives when they were removed
-
86
and weighed by sections The regression equations they employed for
major trees which are also used here were
g (OD wgt) leaf ln y 1 =a+ b x + b2ln x2 (6)1 1
where a= 29254 = 00012 b = 13277b1 2
and x was hgt in m and x was dbh in cm Coefficients a b and b1 2 1 2
were different for various parts thus
bole ln y1 = 43821 0001 x1 + 19379 ln x 2 (7)
branches ln y1 = 27453 + 00004 x1 + 22401 ln (8)x2
rootslt 05 cm ln Yl = 13583 - 00003 x + 08582 (9)1
ln x 2
and rootsgt 05 cm ln y = 3002 + 25538 ln x (10)1 2
Minor trees were best represented by regression of biomass on dbh
alone and put into their Group C Ovington and Olson (1970 also
developed regressions for minor trees as follows
g (OD wgt) leaf ln y = 40243 + 15726 ln (11)1
x 2
bole ln Yi= 53717 + 18010 ln (12)x2
branch ln y1 = 411894 + 19357 ln (13)x 2
rootslt 05 cm ln y1 = 15415 + 09779 ln x (14)2
and rootsgt 05 cm ln y 1 = 42850 + 19367 ln (15)x 2
Since saplings in this study were counted only the mean dbh of 175 cm
was used in all cases and the results rounded to the nearest kg A
different plant geometry exists for palms therefore the regression
equation of Bannister (1970) for Euterpe globosa Gaertn was
Total biomass (OD wgt) ln y1 = 384629 + 2912322 ln (16)x 2
1II r Pi rrmrr 71 F7i1 5 I rttta fttHt zttrrwnmt
87
and is used to compute the biomass of Arenga obtusifolia Both palms
belong to the same sub-family Arecoideae and have quite similar morshy
phological features
The Corypha _utan on the other hand belongs to the sub-family
Coryphoideae so the use of Bannisters (1970) regression may not be
appropriate Tomlinson and Soderholm (1975) measured a single Corypha
elata Roxb in Florida and gave several oven-dry weights of the plant
parts By using proportional weights of various parts the total bioshy
mass of the smaller Corypha utan in Ujung Kulon was estimated Bioshy
mass of boles however was computed by considering the bole as an unshy
tapered cylinder with an estimated specific gravity of 095 and a dry
matter content of 25 Oven dry weight may be computed by first de-
termining the volume of a cylinder V = TI r 2 h (17)
and then substituting in the specific gravity of the wood g8 the
weight of dry wood wd and 100212 kgm3 the weight of a cubic
meter of water Oven dry weight in kg is thus
W = Tir 2hgswd X 100212 kgm3 (18)
All biomass estimates for this study have been summarized in
Table 20 Lacking any other estimate and although completely conshy
trived the biomass estimates made for Ujung Kulon are probably not in
serious error except for site 4 In theory the overall morphologshy
ical characteristics of forest trees and shrubs found in the same life
zones are similar according to Holdridge (1967) Inasmuch as rainshy
fall and elevation are key parameters in the Holdridge system the El
Verde Puerto Rico sites of the Ovington and Olson (1970) and
Bannister (1970) studies should be comparable The El Verde sites are
Table 20 Estimates of tree and sapling biomass of vegetation sites in Ujung Kulon
Site II Major trees IJ Saplings II Arenga II Corypha kgsitea kghaa
1 0 - 0 - 1 20 1 2936 2956 23648
2 3 - 5414 2 - 153 15 - 1024 0 - 0 6591 52728
3 14 - 8415 21 - 1609 8 - 546 0 - 0 10570 84560
4 b - b - b - b - b
5 9 - 4646 22 - 1686 10 - 683 0 - 0 7015 561120 I6 17 - 12584 38 - 2912 0 - 0 0 - 0 15496 123968 I
l7 18 - 14023 41 - 3142 0 - 0 0 - 0 17165 137320
I
8 3 - 818 19 - 1456 0 - 0 8 - 18284 20558 164464
a - oven dry weight I b - no trees or saplings in Site 4 I
I
00 00
89
at 424 m elevation with 3120-4650 mm annual rainfall (Odum 1970)
Although no true mean rainfall has been established the lower value
seems more likely and is close to that of Ujung Kulon The average
biomass estimate (excluding site 4) of 91830 kgha for Cjung Kulon
is less than the average given by Ovington (1965) or Sanchez (1973)
for tropical forests However it is above the minimum of 71900
kgha of live vegetation biomass given by Ovington (1965) even withshy
out changing the regression coefficients or any of the other assumpshy
tions
Some of the low biomass estimates may be attributed to the
effects of the coarse tuff Warnaars and Eaves (1972) presented exshy
perimental evidence that excessive aeration and erratic water stress
in coarse aggregates led to restricted root growth of emerging seedshy
lings Taylor (1974) demonstrated that rate of seedling emergence
plant height and weight of aerial and subterranean vegetative comshy
ponents of maize and sorghum were generally correlated with soil
aggregate size -- root development was significantly more pronounced
in soils with finer aggregates
Interruption in Plant Succession
Except where erosion bared the soil to a mineral surface the
tuff layer may have been responsible for a prolonged interruption in
plant succession The interruption lasted perhaps a decade or longer
until biocycled organic residue of sufficient depth and water-holding
capacity resumed its full role as a medium of seed germination and
development Normal development in a downward direction had to take
place through a nutrient-poor and structurally inhospitable tuff layer
--
--
90
Seeds which were cast prior to tuff deposition may have experienced
little difficulty in emerging upward through the tupoundpound In spite of
Verbeeks (1885) sole measurement of 10 mm tuff thickness at Javas
First Point this study indicates a tuff layer that is on the
average 667 rrun in thickness for 24 observations (Table 21 also see
Appendix B)
Differences in tuff thickness resulted in some part by
re-distribution by wind gravity and stream flow Also the greater
tuff thickness may have resulted from directional eruption as disshy
cussed by Colmet-Daage and Gautheyrou (1974) or due to localized
wind currents andor eddy effects The work of Schuylenborgh (1954)
inexplicably made no mention of the Krakatau tuff in soils that are
61 - 139 km SE of Krakatau in Bantam Province Curiously he was
studying classification and genesis of soils derived from tupoundpound (the
G Danau tupoundpound) -- which he did identify deep in the profiles
Many seeds particularly those dispersed by the wind or light
seeds with limited carbohydrate reserves may have succumbed in greater
numbers and were subject to greater establishment problems than seeds
in soil with little or no tuff layer Consequently spatial patterns
of some species may have been permanently altered and successional
changes may have resulted
Existing trees and shrubs probably did not suffer species
extinction as a result of a decade or more of unfavorable gennination
medium but they probably declined in growth rate and overall vigor
due to water stress In places where the tuff layer was thick enough
to prevent normal seed germination it probably also caused seasonal
91
water stress by simulation of a long capillary fringe on the
surface of the soil
Physical Effects of the Tuff Layer
The granular sandy apparent texture of the tuff was one of many
physical properties which affected plant succession At the outset it
is felt the sandy nature of the tuff layer was more permeable to
water but like sands in general had low water holding capacity I~
periods of low rainfall it tended to dry out to a greater extent than
the underlying litter layer andor surface soil having more organic matshy
ter In time organic residues from the forest canopy gradually buried
the tuff The water balance problem then became one cf inability of
water to percolate to lower depths until the entire tuff layer was
nearly saturated
Unsaturated flow of water through soil under suction is linited by
the size number and arrangement of the pores Large pores fill last
and empty first In site 3 horizon 3-1Al2 with 47 clay would be ex-
pected to exert a greater pressure gradient than in 3-lAll with 34 clay
The theoretically greater pressure potential in the subsoil 3-lIIC with
49 cannot be realized because there is a relatively low pressure
potential under unsaturated flow conditions in the tuff above it which
has only 16 clay From that standpoint the data in Table 13 are misshy
leading since they do not represent continuous column simulation Un-
fortunately the realization came no soil moisture ten-
sion data were collected for the C horizons alone
The available water supply as presented in Table 13 is an overshy
simplification Available water capacity (AWC) of Salter (1967) as
given by Williams and Joseph (1970) takes into account the depth of
92
soil (d) and its apparent specific gravity (ASG) -- also known as bulk
density -- expressed as wgtvol in addition to the conventional upper
limits (UL) for water availability at 13 bar tension and the lower
limits (LL) at 15 bar--the permanent wilting point AWC is then ~alshy
culated as
AWC = (UL-LL) x d x ASG (19) 100
and expressed as either inches per foot or cm perm Although availshy
able water percentage in Table 13 seems to vary little with depth the
AWC by equation 19 varies nearly 20-fold between surface soils and
subsoils Moreover the field capacity in sandy soils is closer to
110 bar than to 13 bar (Williams and Joseph 1970) hence the
coarser textured tuff and overlying horizons are not accurately repre-
sented by substitution into UL of 13 bar tension data Salter (1967)
found that 110 bar tension for UL was also ~ore accurate for soils
with good infiltration characteristics
By equation (19) for example the AWC of 0-15 cm depth in 6-1
(from Table 13) would yield only 096 cmm because dis 15 cm and ASG
is 075 On the other hand the AWC of 6-lIIC is at least 1771 beshy
cause the measured dis at least 130 cm (Table 9) and ASG of 103
points to a greater storage capacity The tuff layer of 6-1 with
mean ASG of between 0505 for pumice and about 080 for finer
separates could be expected to hold very little water
During the first decades after tuff deposition the combination
of the long capillary fringe followed by a disjunction of pressure
gradient in the tuff may have meant that little or no water percoshy
lated to the root zone during the driest months Schenkel and
Schenkel (1973) reported one instance in which almost no rain fell
93
for more than a month in Ujung Kulon Table 1 attests to a decidedly
dry season in terms of the frequency of rainfall occurrence
Another physical effect of the tuff layer is the poor structural
stability it possesses as a medium for mechanical support of roots
The apparent sandiness of the tuff in the upland sites borders on a
gravelly texture in the lowland swales Colmet-Daage and Gautheyrou
(1974) also remarked on the single grain deceptiveness of fresh
volcanic ash in Martineque which nevertheless was texturally a clay
by mechanical analysis
The problems of root establishment and water percolation are
probably no longer noticeable in Ujung Kulon because the soil horizons
are now sufficiently thick to contain enough roots for adequace water
uptake
Chamical Properties of Soil
a Effective CEC
Uchida (1973) had previously determined that there were no
statistical differences in exchangeable bases when extracted at both
soil pH and pH 7 but that CEC determination was much more dependent
upon extractant pH Gross differences in CEC by the two methods used
in this study were too large to ignore Consequently percentage base
saturation calculations were affected The BS exceeded 100
only in sample 5-lAll when the NH40Ac was adjusted to soil pH--
except for the calcareous soils of sites 3 and 8 as noted at the
bottom of Table 15 The BS of 10366 in 5-lAll probably reshy
flects experimental error due to the sizeable quantity of Ca present
94
middot-middotlioiftr----------------middot------middot-----------middotmiddotmiddot----middotmiddot -middotmiddotmiddot- -------middot-
It could be due to error in CEC determination as well but the CEC as
determined with neutral NH40Ac is even lower and would result in a
larger BS of 10897 Using neutral NH40Ac the percent BS
exceeds unity in samples 4-1 IICl 4-1 IIC2 5-lAll and 5-1Al2 if all
other factors remain the same
Effective CEC is reputed to increase with increase in pH in soils
having a pH dependent charge (Tamimi et al 1972 Keng and Uehara
1973) Yet CEC decreased in all samples from sites 1 5 6 and 7 when
it was determined with neutral N NH40Ac Lowering of the pH of the
extractant for samples 3-1 IIC and all samples of site 8 had varied
effects on CEC It lowered the value of CEC of samples 3-1 IIC but
raised it for 8-1 A and 8-1 Cll whereas the rest of site 8 soils
showed lower CEC values
b Organic carbon
carbon expressed as percent decline
rapidly from the surface soil to subsoil horizons (Table 16) A
conventional conversion of OC x 1724 =organic matter was
used in this study Soil organic matter contributes significantly
to the CEC as evidenced from sample 4-lAll This horizon has an exshy
change capacity of 1658 meq100 g despite having 243 silt and no
clay at all Most chemical activity takes place in the 20 micro or
smaller size fraction as suggested by Witt and Baver (1937) They
indicated that 20 - 5 micro diameter silt had 110 the surface reactivity
of coarse clay and less than 120 of the adsorptive capacity of
colloidal clay (lt 100 m micro diameter)
The levels of
95
In the pipette method of mechanical analysis virtually all un-
explained error goes into the silt fraction and only a loss of sand
in the various sieving and weighing operations could increase the value
for silt A part of the 243 silt presumably included some experishy
mental error also some of the silt was of the relat~vely inactive
size fraction above 20 micro Therefore the CEC in sample 4-lAll nay
be predominantly attributed to its organic matter content
Dead roots leaves branch material animal wastes and all other
sources of organic C which contribute to the high organic matter level
of 4-lAll may also contribute to the CEC By Rodes (1962) estimate
the CEC of soil humus is 180-200 meq100 g and fresher organic
residues show an exchange capacity of about 100 meq100 g With 1002
OM in sample 4-lAll it could have a CEC between 1804 and 2004
meq100 g which could be ascribed to OM matter alone The detershy
mined CEC of 1658 meq100 gin a soil which is 9757 sand shows
that virtually all of the exchange capacity arises from the organic
matter In site 8 also where most horizons have coarse textured
soils the organic matter plays an important role in the establishment
and survival of vegetation There as elsewhere organic matter
contributes to water holding capacity and is a source of nutrients
Most of the soils of Ujung Kulon are not very high in clay
Of 33 samples tested only 4 were clearly clay in texture and two other
samples were borderline (see Figure 7) To account for the
surprisingly high CEC of the coarse soils it seems evident that both
OC and clay content must be considered Using data obtained in
this study a regression equation incorporating both OC and clay
-----
FIGURE 7 SOIL TEXTURAL TRIANGLE
percent sand
SOUHCE USDA SOIL SURVEY MANUAL1951
97
was worked out to predict CEC for the diverse soil conditions found
within Ujung Kulon The equation
Y = 0582X + 10542 (20)
where X = OC +clay
Y = predicted CEC in meq100 g soil
and gave a better prediction of CEC than if either OC or clay
alone were substituted for the X values Regression coefficients of
r = 080 039 and 076 respectively were obtained when X = OC +
clay X = OC and X =clay respectively Figure 8 shows a comshy
parison of actual CEC values and the computed regression line for the
relationship between CEC and OC +clay
Mineralization and Soil Genesis Theories
A soil genesis theory (Tan and Schuylenborgh 1961) developed
largely by Schuylenborgh (Schuylenborgh and Rummelen 1955
Schuylenborgh 1957 1958 1959) which was propounded by Mohr (1922)
and Joffe (1931 1936) holds that
Under suitable conditions of high base status adequate air
water and temperature regimes the organic matter decomposes comshy
pletely so that the soil forming agent (which is the most important)
is carbonic acid Products of decomposition are CO2 and water
The differential rate of mineralization of soil organic matter
was held to be of extreme importance for the process of soil formashy
tion (Hong and Schuylenborgh 1959) A rapid mineralization of
Ujung Kulon soils is supported by the findings of Schuylenborgh
(1957) who reported litter layers of only one leaf thickness and
whole descriptions of profiles elsewhere generally lacked humus
50
Figure 8
Regression of C EC on dego OC +0o CLAY
40 bull2e
bull19
bull4 bull10
D
g 30 bulls
bull11 O ltIgt
E bull25 0 w 0 20 bull21 bull23
bull9 12 bullre29 bullbull 13
27bull i bull14 A
Y= I0542t0582X10
r= 0801 bull 2 30
10 20 30 40 50 600L----------------------------0o OC + 0o CLAY
99
layers In Ujung Kulon the absence of a buried A horizon under the
Krakatau tuff suggests that mineralization has gone to completion in
all sites investigated
Despite the lack of humus in surface soils of the lowland
tropics OC is considerable Jenny~ al (1949) found total
nitrogen organic matter and CN ratios to be higher in Colombian
forests than in similar well-drained upland soils of temperate areas
They estirr~ted an average mineralization rate of 3 of the organic
matter They calculated that less than a decade was required to reach
a near-equilibrium accumulation of forest litter in tropical crests
compared to 100-200 years under Ponderosa Pine in North America
Elevation and temperature however play strong roles in litter
accumulation within a narrow geographical region Schuylenborgh
(1958) showed that higher elevation soils have somewhat thicker
humus layers and consequently higher OM values than lowland soils
in Indonesia He proposed 5 belts of soil development based somewhat
on elevation
1 - 1600m - 1300m elevation
2 - 1300m - 1000m
3 - 1000m - 600m
4 - 600m - 300m
5 - lt300m
with considerations for pH morphology CN ratios and R203SiOz
ratios All of Ujung Kulon would be included in belts 4 and 5 and
the soils therein he described as podzolized brown latosols and latoshy
solic soils respectively In an earlier work however Schuylenborgh
-----------------middot--middot----------middot-----middotmiddot-----middot-middot-- ---~ ___ - middot-
100
and Rummelen (1955) considered soils formed from andesitic tuff at
an elevation of 1000-1500m as grey-brown podzolics ie true
Spodosols due to clay accumulation in the B horizon while Tan and
Schuylenborgh (1961) classified as brown podzolics the Sumatran soils
found at 500-llOOm with red-yellow podzols at less than 500 m eleva-
tion
The Schuylenborgh classification postulates were explained
(Schuylenborgh 1957) more fully for West Javan profiles derived from
dacitic tuff of the Danau volcano which disappeared in the Pleistocene
era Four profiles at an elevation of ca 70 m were examined hy
Schuylenborgh and classified into either
(1) Podzolized Reddish-Brown Latosolic soil--on the basis of
marked increase in clay content (indicating podzolization processes)
and increase in Si0 2R2o3 ratio with depth or
(2) Red-Yellow Podzolic--increase in clay and a decrease in
Si02R203
Schuylenborgh concluded (1957) that in the humid tropical region
the CN quotient of the podzolic soils is practically constant while
the molar Al 2o3 Fe2o3 ratio of the clay fraction increases with depth
In latosolic soils the CN quotient and the Al 2o3 Fe 2o3 ratio in the
clay decrease with depth
The decreasing Si0 2 R2o3 ratios with depth and the increasing
clay content (Table 21) in Ujung Kulon support the Schuylenborgh
(1957) characterization of Red-Yellow Podzolic soils The C horizon
is seen as an anomaly The CN ratios in Ujung Kulon however do
not seem to decrease with depth in all profiles -- one of the
Schuylenborgh criteria for latosolic soils
----middot-middotmiddot-middotmiddotmiddotmiddotmiddot---middotmiddot-middotmiddotmiddotmiddot _- middot-middot----
101
Soerianegara (1972) considered the buried clayey soils of marl
origin of nearby P Peucang as podzolized grumusol in accordance with
earlier criteria of Dudal and Soepraptohardjo (1961) and
Soepraptohardjo sect al (1966) for grumusols He recognized that
many of the properties did not agree because the upperuiost horizons
lack dark coloration of grumusols (Vertisols) and the Peucang soils
did show eluvial and illuvial differentiation
c The CN ratio
The near uniformity of CN ratio found by Schuylenborgh and
Rurnmelen (1955) Jenny~ al (1949) and in this study (see Table 16)
indicate near equilibrium in soil development as discussed by the
various authors In the Schuylenborgh and Rummelen study the unishy
formity of CN ratio throughout the profile was true despite a 10-fold
decrease in both 0 C and ~ N with depth The study by Jenny ~ al
(1949) suggests that uniform CN ratios may be an indicator of virgin
forest conditions They found a CN ratio of 96-110 in one virgin
forest site in Costa Rica and 100-143 in another site Results of
the present study show a greater CN range but there was a trend
towards uniformity
The overall virgin forest status of Ujung Kulon has already been
established at least for the less accessible areas--sites 3 5 6 and
7 Alluvial accretions in sites 4 and 8 preclude them from considershy
ation in the same manner and due to probable extensive destruction
of the vegetation in those sites in 1883 designation of virgin forest
102
Table 21 Percentage clay Si02R203 and Al 2o3Fe2o3 ratios of Ujung Kulon soils
Sitehorizon Clay
1-lA 1-lC 1-lIIC
2-lA 2-1B22 2-1B22t
3-4All 3-4Al2 3-4C 3-4 IIC
4-lAll 4-1Al2 4-lC 4-lIICl 4-1IIC2
5-lAll 5-1Al2 5-lC 5-lIIC
6-lAll 6-1Al2 6-lC 6-lIIC
7-1AllA12 7-lIIC
8-lA 8-lCll 8-1Cl2 8-lIICl 8-1IIC2
1084 601
1867
2986 5134 6557
34 Otiaa
4755 1619a
a
4892
oo 588 951
1018 926
15 57 1666 1282 3210
1885 1947
624 3930
2637 3220
857 410 751 622 446
146 230 107
239 184 1 70
146 1 36 261 110
271 226 1 95 1 77 1 62
246 230 257 204
205 185 231 137
1 52 142
222
206 198 190
l 28 259 1 00
305 298 309
256 253 356 242
267 295 240 228 219
381 378 380 423
307 318 341 293
327 293
252
247 257 265
a-Clay samples from 3-4 series
103
in those sites is inappropriate As discussed earlier the mosaic of
which sites 4 and 8 are representatives may be due in part to a
residual pattern of succession first initiated by tidal wave action
andor piecemeal destruction of overstory vegetation by water spouts
Richards (1952) thought that tropical savannas of which site 4 oight
be considered an example are due to edaphic factors or are stages i~
a hydrosere It seems that the latter reason is more valid in the
case of site 4 inasmuch as a high water table exists for much of the
year
Although site 1 may be considered to be in near-equilibrium froo
a soil development standpoint the predominance of herbaceous vegeshy
tation is not comparable to other sites studied The site however
is representative of the open shrub found along Ujung Kulons south
coast In any case additions of organic residue are not expected to
be as great as in fully stocked forest sites Site 2 which may be
close to other forested sites in organic matter production may
however be more representative of organic matter depletion rather
than accretion due to evidence of moderate to severe erosion
Forms of Silicon in the Soil
Water soluble silicon levels in soil profiles varied appreciably
between sites but showed only small increases with depth (Table 17)
The C horizon showed a sharp increase in Si but the level normally
decreased in the horizon below it A typical laterization process
whereby SiOz is leached downward leaving only sesquioxides at the
surface cannot be discerned from the results obtained Slightly
104
higher content of Si in the C horizon may be due to a greater SiOz
content of the tuff at the time of its deposition as well as some
desilication of the over horizons -1ohr (1944) reported about
66 Si0 2 in the Krakatau ash The extremely high 1034 ppm value for
Si in 3-lAll is beyond what can be found for soil Si in the literature
(Dr R L Fox personal communication) but not beyond theoretical
limits of Si solubility Chan (1972) presented a graph of Si02
solubility at various pH levels crystalline quartz at pH 2-4 was
soluble to about 2 m mole1 or about 56 ppm of Si in solution at up
to pH 8 the solubility increased to nearly 3 m mole1 or 84 ppm
of Si Other forms of Si are even more soluble Cristobalite the
least crystalline form of Si0 found in nature (Iler 1955) also has2
the greatest solubility Tridymite a form of Sio2 between quartz
and cristobalite in solubility was known to be in the Krakatau ecta
(Stehn 1929) but was not found in the X-ray diffraction patterns
(XRD) Cristobalite on the other hand exists in site 5 Amorphous
silica in the form of gel has a solubility of 001 - 0015 (100-150
ppm) at ordinary temperatures and the gel is thought to be abundant in
organic matter German researchers cited by Iler (1955) produced a
solution of colloidal silica containing 200 mg of Si02 per liter (220
ppm) which later stabilized at about 165 ppm comparing favorably with
the findings of Iler (1955)
In all probability the soil silicon in the sites is a combinashy
tion of several forms found in nature An accurate assessment is
difficult because of the impurity of minerals found in nature when
compared to the values of published standard end-members (Garrels
and Christ 1965) A compounding error may result from failure to
---------------------------middot------middot-middot--middot-----middotmiddot--middot--middotmiddotmiddot middotmiddotmiddot------middotmiddot-middot--middotmiddot---
105
recognize the silica that may result from ing of decomposing
plant parts
Several tree species found in Ujung Kulon are know-u to contain
amorphous silica Sharma and Rao (1970) found silica in vessels
fibers ray cells or vertical parenchyrma in about half of 134 species
of Indian timbers Many of the silica bear genera inclucied in
their findings are also found in Ujung Kulon among them Vitex
Cryptocarya Dillenia
tent of these genera was 006 - 082 for Syzygium to Artocarpus
respectively In the Philippines the Forest Products Research
Institute (1961) found 83 of 161 listed species contained silica
inclusions Streblus ____ and Artocarpus elastica were highest among
the 10 species found also in ejung Kulon with 482 and 396 silica
respectively No attempt was CTade however to determine the silica
content in Ujung Kulon tion Nevertheless it may be nore than
coincidence that the subsoil profiles of 5-1 where Streblus is
elastica is growing have corresponding-
ly high water-soluble silicon levels
It would seem that the most important factor for the high Si conshy
tent of sites 3 and 8 is the presence of carbonates in the soil The
work of Dienert and Wandenbulche reported by Iler (1955) demonstrated
that alkaline salts accelerate the formation of soluble silica Inasshy
much as the solubility of silica rises sharply with a rise in pH
(Iler 1955) there is concurrent cause-effect condition within these
sites Although the pH of the soils in site 3 varied from 649 -
773 the pH of the marl rock itself was 81
106
Silica may be the chief cementing agent in the marl of site 3
and de-silication may lead to formation of the lime sinter as
reported by Schenkel and Schenkel-Hulliger (1967) in streams of the
Telanca area The 11 sinter 11 is probably a combination of calcium
carbonate and highly hydrated silica Smooth surface crusts on rocks
found in the downstream reaches of the Telanca watershed are probably
a result of gradual evaporation of water rich in silica and calcium
Presumably as long as the water head has sufficient pressure the
silica and calcium are discharged into the sea When rainfall
diminishes however the width of streams decreases and the flow of
water declines Evaporation then takes place in isolated pools ard
along the peripheries of the water line Once dehydration has taken
place to a sufficient extent the crust hardersand becomes relatively
insoluble
Although the carbonates responsible for catalysis of soluble
silica are also found in site 8 and where high soil silica is
evident the lime sintering does not appear to take place On the
contrary the seasonal flooding tends to cause broad lateral disshy
persion of the solutes When drying occurs the solutes are
re-deposited in place resulting in high values for Si in surface
soils The dissolved solutes within site 3 may likewise lead to
high Si levels in the surface but owing to internal drainage
in the upper part of the Telanca escarpment the crusting effect on
rocks in the upper reaches of the streambeds is not evident
Another feature shared by the soils in sites 3 and 8 is an
apparent silicon-phosphate interaction Limestone may be phosphashy
tized (Clarke 1924) and the highest levels of extractable Pare
107
found in the calcareous soils of sites 3 and 8 In site 8 the sharp
reduction of Pin the subsoil (Table 17) may be due to seasonal
effects Reduction of Fe++-+ to Fe-++ apparently releases mobile phosshy
phate (Russell 1950)which riay be largely absorbed and stored in plant
tissue as discussed by Johnson (1976) When sampling is done in the
dry season the P levels might seem erroneously low Leaf P was
highest in sites 4 1 and 8 respectively (see Appendix A) Although
it is not known what species if any have norrrally high leaf P
levels the higher than average leaf P levels in site 4 may also be
a result of seasonal reducing conditions in the soil
Another apparent interrelationship exists between silicates
carbonates and phosphates It is thought that the carbonate andor
bicarbonate ion is the cause of greater Si solubility and P solubility
as well In sites 3 and 8 high Si and P levels (Table 17) go hand
in hand for the whole profile however Si decreases only gradaully
between hozizons except for the C and P decreases quite sharply in
the subsoils Since most plant roots go deeper than the shallow All
Al2 and C or corresponding overlying horizons efficient plant exshy
traction of P from subsoil is not unexpected Normally high amounts
of organically-bonded Pis typical in surface residues but may be
significantly more so in these sites due to the presence of carbonate
bicarbonate ions On the other hand Si could reduce P uptake below
its normal level Schollenberger (1922) found an inverse relationship
of P level and yield of wheat He speculated that silicon as CaSi03
lime could have had a P uptake ameliorating effect when substituted
for Caco 3 which produced the lowest yields but had the highest P
108
levels More recent data do not support this idea (Dr J A Silva
personal communication) Since both Si and P were high in the soils
of sites 3 and 8 no definite conclusion can be reached about the
nature of the relationship
Soil Genesis in Ujung Kulon
The study of the processes of soil development in Ujung Kulon is
facilitated by the presence of the precisely dated Krakatau tuff horishy
zon in the soil As a parent material the tuff has been designated
where it was found as the C horizon Soil formation atop the C subshy
sequent to tuff deposition must therefore represent either the
weathering products and alteration of the C horizon alluvial andor
colluvial accretions soil genesis due to mineralization of organic
matter or accretions due to inverted or partially-inverted horizons
resulting from upturned tree roots during wind blow-down Lack of a
C horizon would on the other hand indicate that erosion obliterated
the tuff Consequently nothing could be said about the rate of soil
formation in absolute terms Approximations could be made however
if the properties of the subsoils and other existing horizons were
sufficiently identified by comparing them with adjacent pedons conshy
taining the C horizon
weathering is a well known feature of tropical soils It
stands to reason that if weathering were the rule there must be
a correspondingly high rate of new soil formation In an attempt to
determine the factors which affect that rate Jenny (1941) focused on
weathering rate of a variety of materials of known age ranging from
tombstones to natural soil profiles The greatest weathering he
109
recorded was to a depth of 80 mm over 568 years in natural soil an
average development rate of 0141 mm per year Tamm as cited by
Jenny (1941) estimated that a podzol with 4 inches (102 cm) of raw
humus 4 inches of A and 10-20 inches (254-508 cm) of B horizon
requires 1000-5000 years to develop in Sweden an average rate of
0305-0711 mm per year Baren as reported by Jenny (1941) measured
350 mm of new soil developed on Lang Island in the Krakatau Group only
45 years after the 1883 eruption an astounding average of 778 mm
per year
Weathering of parent materials does not proceed uniformly over
the years however It takes place slowly at first in coarse textured
materials which have srr~ll surface area proceeds more rapidly as surshy
face area increases and again declines after most chemical dissolutiorshy
has been completed Temperature rainfall biota and the nature of
the parent materials all play important roles in the rate according
to the celebrated integral soil development concept first expounded
by Dokachiev Since all factors operate along a continuum each
factor representing a differential component true integration in the
mathematical sense is not possible It is more appropriate to say
therefore that in this study an average of about 98 mm of soil was
formed in the interim 90 years since the Krakatau eruptions Average
thickness of combined All and Al2 or corresponding horizons when they
occurred above an intact C horizon was 98 rrnn over 33 observations
Table 22 shows depth of overlying horizons and the relationship of
depth to site
The wide range in the thickness of horizons above the C horizon
within each site are manifestations of microsite differences Slope
110
Table 22 Thickness and occurrence of horizons overlying Krakatau tuff (C horizon) in Ujung Kulon soils
Site and pit Depth of overlying horizons C horizon thickness (cm) (cm)
1 1 8 4 2 6 7 3 5 6 4 8 9 5 18 7
2 1 absent 2 absent 3 absent 4a 19 9 4b 9 3 5 absent
3 la 10 3 lb 12 uneven 15 5
4 1 6 4 3 10 absent
5 la 9 absent lb 10 4 2 10 absent 3a 10 absent 3b 7 6 4 5 absent 5 10 absent
6 1 11 9 2 7 4 3 12 6 4 20 10 5 2 3
7 1 10 15 2 18 6 3 8 10 4 8 absent 5 5 3
8 1 13 10 lA 4 6 2 5 absent 3 13 11
111
perhaps is the most important factor playing a role in horizon thickshy
ness in Ujung Kulon inasmuch as slope influences or facilitates
erosion Localized difference in slope would be manifested in the
horizons which overlie the C as well as the C horizon itself Colmetshy
Daage and Gautheyrou (1974) noted the effects of steep slope on
differences in the thickness of ash deposits in Hartinque and
Guadeloupe Absence of the C horizon in 4 of 6 borings in site 2 and
in 5 of 7 borings in site 5 attest to conditions of localized erosion
Measurement of the thickness of overlying horizons however was done
when both the overlying horizons and subsoils were identified It is
noted that in site 2 even the overlying horizons were eroded off due
perhaps to periodic minor flooding of this site which lies astride a
small streambed
Any attempt to estimate the rate of soil formation would best be
made on flat rather than sloping ground Only sites 1 4 and 8 are
sufficiently level to qualify but it is thought that alluvial accreshy
tion predominates in site 4 while lateral transport of materials inshy
fluences soil building in site 8 (where organic residues seem to conshy
centrate in small hummocks) Only in site 1 does normal weathering
with depth appear to be least influenced by outside conditions
Colluvial accretion effects can be seen however in pit 1-5 which is
located near the base of a minor hump in an otherwise nearly level
site
The Tuff Layer
Identity of the Krakatau tuff layer is well established from the
disparaties of chemical and physical properties it possesses in
112
comparison with adjacent horizons Some results must be viewed with
reservations however In particular many ionic species which are
mobile in the soil may seem to cause abnormally high or low base stashy
tus in the C horizon Large differences may reflect ionic migration
upward or downward in the solum at a given point in time and be more
related to capillary or gravitational forces at different seasons
rather than relate to properties of the tuff itself The CEC it is
felt is a more nearly static and intrinsic chemical characteristic
of the tuff than is the status of exchangeable bases or other imporshy
tant nutrients The CEC of the C horizon has a standard deviation of
only 167 meqlOOg in the 6 sites where it was found and determined
compared to 1148 meqlOOg in the immediately adjacent overlying
horizons and 989 meqlOOg in horizons irrnnediately below Illustrashy
tion of CEC differences by horizon is shown in Figure 9 Furthermore
differences in CEC are not significant among site profiles considered
in their entirety but are significant at about a 2 level for various
horizons within each site (Table 23)
By a Duncan multiple range test (Duncan 1955 Harter 1960) a
significant difference of intra-profile CEC occurs between the C
horizon and the contact horizons but not between the contact horishy
zons Due to absence of Al2 horizons in sites 1 and 8 the immediate
contact horizons in Table 23 have been designated as upper and
lower
Differences in Munsell color values of the C horizon among the
sites suggest that the original color of the tuff is being altered to
more nearly that of the contact horizons It is thought that color
changes from dark to light reflect mostly organic matter and clay
Figure 9
CEC by Horizon of Selected Ujung Kulon Soi I Profiles
All
Al2
0 40 50
~A
~-Cr
C
0 N
0 I
C
DC
1-1 --3-1 ------4-1 -middot-middot-5-1 -middotmiddotmiddot-~middot-6-1 ---middot 8-1 -o-o-
nc1
nc2
CECmeqlOOg
10 20 30----1----+--_-vr ---- __ _
114
X
Table 23 Analysis of variance of intra-site and inter-site CEC of C horizons and contact horizons of selected profiles
Horizon Site 1 3 4 6 8 Total CEC me
Upper 18 40 14 30 21 41 164 273a
C 11 15 13 15 12 12 78 130b
Lower 19 33 36 21 14 135 22Sa
48 88 39 81 54 67 377
Source df MS
Sites 5 12312
Horizons within site 2 31906
Error 10 5472
Total 17
1 Means designated with the same letter are not significantly different at p lt05
115
eluviation Indeed most of the clay found in the C horizon appears
to be coatings on the tuff particle surfaces
If the organic matter and clay illuviates are mainly responsible
for fluctuations in the CEC then a closer approximation of the CEC
of pure tuff could be determined by subtracting the relative proporshy
tions of OM and clay Table 24 attempts to show this proposishy
tion It was assumed however that for all samples 1724 x OC =
OM all OM had 190 meqlOOg of exchange capacity and all clay
had 25 meqlOOg of exchange capacity The higher values obtained for
sites 3 and 5 would be further reduced if some proportion of the CEC
were ascribed to smectite which was found in both sites Xontshy
morillonite according to Rode (1962) has a CEC of 60-100 meqlOOg
Some color changes are also attributed to indirect effects of the
lower contact horizon Most noticeable in this respect was in site 1
where ant and termite movement through the soil resulted in intershy
mittant discoloration of the C horizon around well-travelled passageshy
ways Both upper and lower contact horizons soil colors could be
seen in the vicinity of the passageways Again however the color
as well as the chemical properties are thought to be transported
rather than situ features Nye (1961) suggested that considerable
fertility may be ascribed to the activity of termites inasmuch as inshy
creased crop yields have been reported in the vicinity of termite
mounds
Because the relatively fresh Krakatau tuff may be considered as
point zero in soil genesis any changes within a particular profile
since deposition may be more manifested in the C horizon than elseshy
where Relative change among profiles might also be reflected in
Table 24 Net CEC of tuff derived by subtraction of CEC components found in clay and organic matter
Sample Calculated CEC Less clay content Less OM content Net CEC meq100 g 25 rneq100 g 190 meq100 g meq100 g
0 M
1-lC 11 35 601 150 157 298 687
3-lC 1530 1619 405 167 317 808
4-lC 1311 951 238 252 479 594
5-lC 1454 1282 320 162 308 826
6-lC 1230 624 1 56 207 393 681
8-lCll 1159 410 102 226 429 628
8-1Cl2 1358 751 188 2 40 456 714
117
correspondingly greater change in the C horizon Where erosion is
severe however no comparisons are possible
The light hues of the deep subsoils in sites 2 5 6 and 7 suggest
that as weathering progresses soil color becomes increasingly lighter
over much of Ujung Kulon Decrease in particle size from sand to silt
to clay fractions should be from darker to lighter hues ifmiddot particle
size reduction and lighter coloration proceed simultaneously The data
in Table 25 demonstrate a semi-quantitative technique for expressing
the relationship of particle size separates and their corresponding
color changes In application the surface soil is the reference
color inasmuch as it has the darkest hue and lowest values and chroma
Departures of one unit in hue have arbitrarily been assigned a 3-count
departure in value of one unit a 2-count and departure of one chroma
unit a 1-count Scoring is based on positional change rather than
numerical unit change since chroma units assigned to different hues
are currently inconsistent
Intra-site and inter-site changes should reflect to some degree
the extent and rate of weathering Sharp color changes between soil
horizons do occur especia between the fresh C and the residual sub-
soils but it is because the tuff layer is an anomalous intrusion that
inter-site color changes may reflect soil neo-genesis processes most
clearly
It is recognized that a dark surface layer of organic residue is
the norm It is further recognized that not all soils would lend
themselves to analysis in this manner Spodosols for instance have
abrupt color changes from light to dark between the elluviated A2 horishy
zon and the diagnostic spodic horizon The proposed technique herein
118
used for Ujung Kulon soils must therefore be tested and refined to
account for differences among other dissimilar soils
Nevertheless the arrangement of color chips in Munsell color
coding is based on a logically progressive sequence which is supported
by the consistance of within-profile changes as seen in Table 25 On
the other hand the reasons for inconsistancy of change between soil
separates is not understood at this time Any change at all demonshy
strates that soil color is not uniformly shared among sand silt and
clay fractions The change in color is indicative of a weathering proshy
cess albeit here expressed in a form which depends upon quantum change
by discrete units rather than movement in a continuum The very coarse
sand fraction of 2-1B22t was found to contain only red mottles whereas
cylinders of the clay suspensions of that horizon resembled 6-lIIC and
7-lIIC For the most part progressive lightening of intra-profile
color change is clearly demonstrated in Table 25 because the bold conshy
trasts of the mottle colors are not easily detected in the whole soil
matrix also the very coarse sand fraction of 2-1B22t represented less
than 1 of the matrix Neither do drastic color changes occur in the
tuff horizon even though it is an anomoly because of the migration of
silt and clay through the profile
The effects of slope and consequent erosion are perhaps more
important in obliterating regular horizonation than any other factors
because of the speed with which the obliteration may be achieved A
notable example is the absence of All and Al2 horizons in much of site
2 although supplementary horizon descriptions (2-3 and 2-4 in Appendix
B) indicate they did exist Steep slope in 7-1 obscured differentiashy
tion of the All from Al2 in the main soil pit but ample evidence of
Table 25 Units of change in Munsell color codes by horizons and between soil separates of Ujung Kulon soils
Sample Sand
Units change
Silt Color Code
Units change
Clay
Units change
Units change between seearates
Sand to Silt to silt clay
1-lAll 1-lC 1-llIC
lOYR lOYR lOYR
32 32 32
0 0
lOYR 32 lOYR 44 75YR 32
+4 -3
75YR a
lOYR
44
43 +2
0 +4 -3
+ 1 a
+ 6
2-lA 2-1B22 2-1B22t
lOYR lOYR lOYR
32 44 44
+4 +4
lOYR lOYR lOYR
44 54 54 b
+2 +2
lOYR lOYR 25Y
54 54 64
0 +8
+4 +2 +2
+ 2 0
+ 5
3-4All 3-4Al2 3-4C 3-4IIC
lOYR 22 lOYR 22 25YR 52 lOYR 42
0 +9 +4
lOYR 22 75YR 32 lOYR 44 lOYR 44
c -1 +6 +6
lOYR lOYR lOYR lOYR
44 44 54 44
0 +2
0
0 -1 -3 +2
+ 4 + 7 + 2
0
4-lAll 4-1Al2 lt-lC 4-lllCl 4-1IIC2
lOYR lOYR lOYR lOYR lOYR
22 32 43 43 54
+2 +6 +5 +8
lOYR lOYR lOYR lOYR lOYR
2 2 d 22 d 32 d 32 d 44 d
0 +2 +2 +6
0 -2 -4 -3 -2
e e e e e
a d
- no sample - silt + clay
b e
- or 25Y - between
54 sand and
C -
silt + clay 3--11 Al2 rep was lOYR 3 2
Table 25 Units of change in Munsell color codes by horizons and between soil separates of Ujung Kulon so d
Sample Sand Silt Clay Units change Color Code between seEarates
Units Units Units Sand to Silt to
5-lAll 5-1Al2 5-lC 5-lIIC
lOYR 22 2SYR 32 2SY 52 SY 53
+s +9 +13
lOYR lOYR lOYR lOYR
31 32 42 52
+l +3 +s
2SY 2 SY lOYR lOYR
52 54 42 52
+2 -5 -3
+l -3 -5 -7
+10 + 9
0 0
6-lAll 6-1Al2 6-lC 6-lIIC
lOYR lOYR 25Y lOYR
32 42 42
58
+2 +5 +8
lOYR lOYR lOYR lOYR
44 44 44 58
0 0
+4
lOYR lOYR 2SY lOYR
54 54 54 68
0 +3 +4
+4 +2 -5
0
+ 2 + 2 + 5 + 2
7-1AllAl2 7-llIC
lOYR 32 75YR 44 0
lOYR lOYR
44 56 +3
lOYR lOYR
54 56 +l
+4 +6
+ 2 0
8-lAll 8-lC 8-lIICll 8-1IIC12 8-1IIC2
lOYR lOYR lOYR lOYR lOYR
22 42 42 5 2 53
+4 +4 +6 +7
lOYR
2SY 2SY lOYR
21 d a 32 d 32 d 42 d
+s +s +s
-1
-1 -1 -3
I- N 0
121
the horizons was seen in other borings Unfortunat the overall
steep slope within the sample plot precluded selection of a more
representative main pit On the other hand truncation of the proshy
file emphasizes the effects of slope At the opposite extreme of
slope no Al2 was distinguishable in 1-1 even though the ground was
level An irregular discontinuous Al2 was recorded however in
alternate faces of 1-1 and was seen in other borings throughout Ujung
Kulon The amount of soil available for multipurpose sampling was
insufficient however to maintain sampling integrity
Absence of a C horizon in some areas of Ujung Kulon possibly may
be attributed to removal of the tuff downfall by the action of the
tidal waves which followed the eruptions of August 1883 Since the
expulsion of the tuff from Krakatau preceded the last tidal wave the
washing action of the waves may have scoured the ground surface and
re-arranged the tuff deposits in sites which were less than 20 min
elevation Much water-borne tuff was also deposited in the lowlands
below the tidal wave crests Also since much pumaceous material was
expelled from beneath sea level large floatable pumice stones were
part of the cresting waters Average density of 4 samples of pumice
taken from the vicinity of Cidaun was 0505 gcm3 ranging in weight
from 552 g to 3052 g
Despite the fact that volcanic dust remained in the air currents
for 25 years (Furneaux 1964) local rain showers undoubtedly preshy
cipitated most of the ash in a short period of time so that the
ejecta as a source of soil parent material may be considered as
laid down at one time
Particles of tuff which were not water borne ostensibly those
122
heavier than air that descended in spots above the high water line
were composed of both wind blown fine and coarse materials Assuming
the 20 m was the actual high water mark sites 2 4 and 8 were defishy
nitely affected by wave action Sites 1 3 and 5 were borderline in
elevation (refer to Tables 4 6 and 8) and sites 6 and 7 were unshy
affected by the tidal waves It is felt that site 1 was also unshy
affected by tidal waves inasmuch as it is on the south coast of
Ujung Kulon and protected somewhat by G Kendeng which rises to about
100 m elevation in a blocking position north of site 1
Mineralogical Properties
Evaluation of the minerals present in Ujung Kulon soils is given
in Table 18 In most cases the primary mineral found is low-temperashy
ture quartz aSi0 2 occurring in the sand and silt fractions (see
X-ray powder diffraction file Sets 1-5 catalogue No 5-0490) A
few exceptions do exist The calcite parent material of the Telenca
formation (site 3) is clearly evident in the sand fraction of 3-4IIC
(see Appendix D) but inexplicably the major peak for calcite is
missing in the silt fraction of 3-4IIC (Appendix E)
In site 5 the crystalline a quartz cannot be positively identishy
fied in any size fraction or in any horizon Plagioclase appears to
be present in the X-ray traces of sand and silt and small amounts
of tridymite or cristobalite in the silt and clay fractions (Appendix
H) Since tridymite cristobalite and a quartz are all species of
Si0 2 identification in the traces is hampered probably by mixture
with primary plagioclase and with smectite which is also found in the
clay fraction As Garrels and Christ (1965) cautioned The most
123
serious error likely to be made is in forgetting how far minerals
do deviate from pure end-member composition bullbullbull
In addition to a quartz in site 8 calcium phosphate was found in
8-lIICl and i-1IIC2 silt+ clay Perhaps the calcium phosphate did
not appear in other X-ray traces owing to differences in oxidation
states The normally wet subsoils of site 8 also contain visably
greater percentages of marine shell fragments in the soil fabric In
8-1IIC2 shells composed about half of the whole soil Phosphorus reshy
moved from skeletal structures of marine organisms may replace carshy
bonates in calcareous sediments (Rankama and Sahama 1950) but the
transition is so rapid that unlike the formation of calcite as in
site 3 as discussed by Clarke (1924) no transition to aragonite is
evident
Various Ca Kand Na silicates in the soils of Ujung Kulon can
be seen in some X-ray traces but apparently they are so poorly
crystalline that positive identification has not been established
Secondary minerals which are found in the clay fraction -- and
in the silt+ clay where separation was not attempted -- seem to be
limited to kaolin smectite and halloysite for the most part
Selected examples of some primary and secondary minerals are given in
Appendix C-J Surface soils tend to have less secondary mineral
content in the clay although no attempt was made to quantify the
amount in each horizon A general lack of clay in the C horizon is
an indication that no substantial amount of clay has been eluviated
to the C horizon over the past 93 years The X-ray diffraction
pattern of the clay fraction of samples from 3-4C and 6-lC show
traces of only kaolin whereas 5-lC and 4-lC have smectite If the
124
soils of the Telanca area were grumusols (Vertisols) as mapped by the
Indonesian Soils Research Institute (Lembaga Penelitian Tanah 1966)
then the smectite rather than kaolin should be found in 3-4C
Soerianegara (1972) perhaps recognized the anomaly and classified
sandy soils over similar marl derived profiles on Pulau Peucang as
latosolized tuffaceous regosols over podzolized grumusols On the
other hand quartz and srnectite are seen in 4-lC (Appendix F) and
other horizons of site 4 Displacenent of 21 clays from upper
elevations in the terrain is the norm in soil transport and rapid
eluviation through the alluvial profile of site 4 apparently supershy
cedes any genesis of kaolin clays
Relative weathering by horizons can be deduced by the data given
on Table 19 The total Si02 decreases with th in all horizons
except the C In samples 1-lC 3-4C 5-lC and 6-lC the Si02 was
higher than in the upper horizons in sample 4-lC it was lower
Elevated Si02 levels in the tuff layer are attributed to the residual
of the original tuff composition which Mohr (1944) reported averaged
about 65 Sio2 Where found in the Ujung Kulon sites the tuff
ranged from 6406 - 6962 in total Si02 Si02 levels in the
surface horizons are due perhaps primarily to biocycling of silica
bodies in the litter Nevertheless plant roots in the lower horizons
are thought to re-absorb soluble silica as it becomes available so
that sequence de-silication except in the anomalous C horizon is a
true indication of soil
In site 8 however there is no apparent de-silication with
depth--in fact the reverse appears to be the case It can only be
suspected that excess SiOz accumulates at lower depths in response to
125
a normally high water table Even though site 4 also has a high
water table during the rainy season increase in its level is due to
downward percolation of water vertically through the profile Inshy
creases in water-soluble Si tend to bear out that leaching is the
mode of action On the other hand in site 8 the water table may
actually rise predominantly by vertical upward movement of ground
water rather than by direct filling by rain water once widespread
lateral movement of overflowed streams has infiltrated the lowest
spots in the terrain No trend can be seen in the data however
Lateral transport presumably enriches the ground water and the flucshy
tuating water table then becomes an important agent of transportashy
tion (Buol~ al 1973) within the profile
126
SUMMARY AND CONCLUSIONS
Ujung Kulon is an example of a tropical lowland moist forest
The evidence from eight sites investigated in this study points to
wide range in species composition tree frequency and basal area
among sites The heterogeneous forest thus described is composed of
many distinct vegetation associations composing a large mosaic Some
associations appear to be perpetuated as a result of edaphic factors
It is thought that excessive drainage in site 1 on level ground
along the south coast combined with a porous shallow soil leads to
draughtiness which precludes the establishment of many species which
are found elsewhere in Ujung Kulon Also the high density of
Lantana camara found there inhibits shade intolerant species from
becoming established
Site 8 in the northeast lowlands and to some extent site 4
between two promontories are influenced by a seasonal water table
which restricts species composition to plants able to withstand proshy
longed waterlogging Species composition differences between sites
4 and 8 may also be affected by soil pH In site 4 management
activities favor a cleared grazing area and the grazing itself keeps
the volume of vegetation at a low level
Site 2 along a minor drainage in central Ujung Kulon is low in
volume of stems and in species diversity probably as a result of
repeated erosion of the surface soil The presence of dense patches
of bamboo in a broad-leaved species-bamboo association probably reshy
sulted from pioneer establishment of the bamboo Schizostachyum
127
blumei in the eroded soil Subsequent establishment of other
species except near the association peripheries was inhibited
Sites 3 5 6 and 7 are examples of inland sloping and wellshy
drained forested areas that do not show evidence of either excessive
draughtiness of soils or of waterlogging The frequency of tree
stems the number of saplings present and the range of total basal
area of trees plus saplings suggest that the absence of limiting
soil physical factors results in markedly greater site utilization
in those areas Species heterogeneity among sites persists however
Greater homogeneity of intra-site speciation in sites 1 and 8
may be due to the effect of wind blowdown in addition to edaphic
factors Much of the northeast sector of Ujung Kulon including the
periphery of the Telanca area has a high water table where trees are
typically shallow-rooted and subject to blowdown by wind and watershy
spouts~
Soils and Their Properties
Numerous chemical nutrient determinations of the soils suppleshy
mented by leaf tissue analysis failed to establish definite relashy
tionships between nutrient status and apparent site productivity
Due to high content of organic matter and the presence of smectite
clay the cation exchange capacity of most soil profiles is moderateshy
ly high
Calcium predominates among the exchangeable bases of surface
soils especially in sites 3 and 8 which have high soil pH readings
and free Caco3 In subsoils of sites 6 and 7 the amount of exshy
changeable Kand Na exceeds Ca The volume of vegetation on the
128
bullgtbullbull-bullbullrnbullmiddotbullmbullillMillitrllilitlllSUMIMISill_ ________ ___ _____ middot- ____________ bull 4 -
sites could not be correlated with the amounts of exchangeable bases
or with the percentage base saturation The greatest numbers and
basal areas of trees and saplings occur in sites 6 and 7 which have
among the lowest total of exchangeable bases and the lowest BS
Organic carbon levels exceed 5 in about half of the surface
soils investigated but decrease sharply with depth Those soils
which have high organic C also have the greatest amount of total
nitrogen which is a maximum of about 05 Lower percentages of
organic C and Nin other surface soils and in deeper horizons of all
profiles except 1-lIIC generally correspond with one another so that
the CN ratio is relatively uniform
Amounts of extractable soil phosphorous detected vary widely
from a low of 3 ppm to a high of 275 ppm Although the highest P
levels are found in surface soils in some profiles high levels (up
to 170 ppm) are also found in the C horizon
The amount of water-soluble silicon detected is appreciable
thus reflecting the presence of a-quartz an important primary
mineral found in Ujung Kulon and other forms of silicon which
include silica bodies found in decomposing organic residues
cristobalite found in the silt and clay fractions and residual
Si0 2 in the Krakatau tupoundpound A probable P Si and carbonate-bicarshy
bonate ion interaction may explain the high values of those ions
in the calcareous soils of sites 3 and 8
In addition to a-quartz and cristobalite the Ujung Kulon
mineralogy also includes plagioclase calcite and calcium phosphate
among primary minerals and smectite and kaolin among secondary
minerals
--------------------------------------middot-- middotmiddot---middot-middot-----------middotmiddot-
129
This investigation showed evidence of a rapid rate of soil
development in the area of study Indications of clay increase with
depth and a decrease of Si02 R2o3 ratios with depth point to a podshy
zolization process of soil formation
It is speculated that the anomalous C horizon may have been reshy
sponsible for decreased tree growth and vigor for some time followshy
ing deposition in 1883 Species distribution patterns of some plants
may have also been affected The low biomass estimates obtained may
be partly due to the resultant stresses to the edaphic considerashy
tions described and to the natural limitations of productivity of
a moist tropical forest
Appendix A Plant tissue analysis data of selected species of Ujung Kulon vegetation
Site Species p
K
Ca
Mg
Na
Cu ppm
Fe ppm
Zn ppm
B ppm
Mn ppm
Al ppm
Ba ppm
1 Arenga obtusifolia Corypha utan Lantana camara
013 017 047
063 119 227
053 059 183
029 024 101
001 004 013
83 72
258
80 66
168
7 11 62
27 23 84
63 181 174
50 50
150
03 00 94
2 Arenga obtusifolia Artocarpus elastica Dillenia excelsa Schizostachyum blumei
013 014 016 012
074 086 095 069
078 125 143 015
025 013 022 018
001 004 006 001
84 72 76 73
168 204
71 63
10 10 20
220
25 33 49
4
32 54 21
282
210 300 120
90
92 441 465 108
3 Aglaia elliptica Arenga obtusifolia Strombosi~ javanica Wetria macrophylla
014 011 033 017
051 063 073 066
1 26 094 212 236
o 34 024 046 026
015 002 006 002
152 95
127 85
ll5 61 68 84
15 10 13 13
145 27 50 61
44 26 30 49
170 80 90
100
36 1 7 24 39
4 Chrysopogon aciculatus 021 Dillenia obovata 022 Ilyptis o 43
1 63 110 522
027 141 1 73
025 048 068
003 006 009
82 91
147
316 146
1183
28 21 97
39 60
108
218 589 664
290 140 950
47 53
341
5 Arenga obtusifolia Drypetes macrophylla Mangifera indica Memecylon edule
012 009 010 009
040 091 045 0 45
087 203 238 o 73
030 051 040 031
001 005 002 022
83 86
126 111
59 54 63
107
8 11 10 8
27 53 26 39
28 43
239 21
110 100 llO 170
169 876
1053 446
6 Fagraea auriculata Fkus pisocarpa Neesia altissima ~~ium syzygoides
009 007 012 009
1 58 1 39 098 090
136 083 103 1 54
055 033 042 0 41
004 002 006 006
114 110
91 108
149 57
116 85
24 10 15 21
29 67 56 70
165 34
474 593
250 100 230 160
861 178 298 290
t- w 0
Appendix A Plant tissue analysis data of selected species of Ujung Kulon vegetation (Contd)
I Site Species p K Ca Mg Na Cu Fe Zn B Mn Al Ba
m ppm ppm ppm ppm ppm ppm
7 Ficus vasculosa Meliosma nitida Neesia altissima Ryparosa javanica
015 014 014 031
015 202 049 138
080 054 1 38 073
1 23 060 067 085
038 005 012 006
94 128 113 123
442 224 153
82
16 10
9 14
149 91 67 67
432 202 467 140
810 800 470 193 270 594 150 373
I I I
8 Ardisia humilis Corypha ut-an Neonauclea calycina Vitex quinata
018 020 015 042
239 190 106 054
220 050 1 52 097
086 023 029 037
057 006 009 009
116 85
114 75
81 38 46
177
22 11 16 20
113 21
155 132
37 73 30 57
140 60 80
190
22 00 31 37
I I
I i I
I I
I
w
Appendix B Depth in cm of horizons of main and supplementary erofiles __of Ujung Kulon soil sampling sites
Site
1 All Al2 C IIC R
o-2a 2-Ba 8-12a
12-98a 98+
All Al2 C IIC
0-1 1-6 6-13
13+
All Al2 C IIC
0-2 2-5 5-11
11+
All Al2 C IIC
0-1 1-8 8-17 17+
All Al2 C IIC
0-11 11-18 18-23 23+
2
3
A B22 B22t
All Al2 C IIC
0-13 13-71 71-150
0-4 4-10
10-13 13-95
All Al2 C IIC
0-4 4-15
15-20 20-80
All A12 C IIC
0-3 3-9 9-12
12+
All Al2 C IIC
0-10 10-19 19-28
28+
Bl B-IIC IIC
A IIC
0-10 10-43 43+
0-5 5+
4 All Al2 C IICl I1C2
0-2 2-6 6-10
10-55 55-82
All Al2 IICl IIC2
0-2 2-10
10-70 70-110
aAlternate face of main pit
bseparate pit
cNo pit underwater
dAlternate site
Appendix B Depth in cm of horizons of main and supplementary profiles of Ujung Kulon soil sampling sites
No
5 All Al2 IICl IIC2
0-5a 5-9a 9-75a
75+ a
All Al2 IIC
0-4 4-10
10-75
All Al2 C nc
0-2 2-10
10-30 30+
All Al2 B
0-5 5-70
7o+
All Al2 B
0-3 3-10
10+
6 All Al2 C nc
0-2 2-11
11-20 20-150
All Al2 C IIC
0-1 1-7 7-11
11+
All Al2 C nc
0-4 4-12
12-18 18+
AllAl2 C IIC R
0-20 20-30 20-45 45+
A C UC
0-2 2-5 5+
7 All Al2 C IIC
0-2 2-10
10-25 25+
All Al2 B C IIC
0-3 3-18
18-30 30-36 36+
All Al2 C IIC
0-2 2-8 8-18
18+
All Al2 IIC
0-2 2-8 8+
All Al2 C IIC
0-3 3-5 5-8 8+
8 A C IICl IIC2
0-4b 4-lOb
10-36b 36+
A C IIC
0-5 5-36
36+
A C IIC
0-13c 13-24d 24+
A Cll Cl2 IIC
0-12 12-90 90-105
105+
C
Appendix C X-ray diffraction pattern of silt+ clay fractions of lC horizon in site l (Mg-saturated wet paste)
l()IJ IOO IJO
110 90
00 eu OU
10 70 70
Q = Quartz60 bO 60
l
d = 3338 A
IU l1gt
Q Q d = 427 A
10 c
0 0 00 CI
0 N C)
0 0 C)
0 00 N
0
deg N
0 -t N
0 N N
0 O N
0 00 -I
0
deg-I 0
-t rl
0 N rl
0 0 rl
0 00
0
deg 0
-r
Degrees 20
Appendix D X-ray diffraction pattern of sand fraction of 4IIC horizon in site 3 (powder sample)
1)0 I())=3038A100 10
I oto o WQ
110 60 II
70 10
~o 60
$0 ~o ~
40
d = 2094 A d = 2 495 A 1 )(1 pd 1877 A
C C C C C w d = 2287 A
10 d = L 914 i
10 Ilt) 0
0 0 00 N co 0 ONO 0 0 0 0 0 odt 0 00 -t N
If) t -t deg -t -t t M degr) r) r) r)
Degrees 20
llltJ
C = Calcite
70
60
o
40
C
d
C
386 A ~
h)
0 OC N
0
deg N
0 t (~
0 N N
0 0 N
oc8 i-1
t-J w VI
Appendix E X-ray diffraction pattern of silt fraction of 4IIC horizon in site 3 (Mg-saturated wet paste)
100 100 100
iO IJO 90
JO eo
lO 70
60 60
d == 3197 A
50 Q == Quartz ~o
40 40 o
QF
0 0 0 0 0 0 0 0 0 0 0 0 0 0 0 0 a 0 0 8 0 0 CX) -er N 0 CX) -t N 0 CX) -t N 0 CX) 4
t--t ltI Ci Ci Ci ltI N CI N N N rl rl rl deg deg rl rl deg deg w 0
Degrees 20
Appendix F X-ray diffraction patte~n of silt+ clay fractions of lC horizon in site 4 (Mg-saturated wet paste)
100 100
to 90
10 oeo
10 10 10
d = 335 A 60 60 tiil Q = Quartz
S = Smectite 50 50 so bullo
d = 2455 A
bullo 40 d 427 A
40 d = 192 A Q
lO
10
Q
lO
0 0 0
0 0 -t
0 a) ()
0
deg(Y)
0 -t ()
0 N ()
0 0 C1
0 co N
0
deg N
0 -t N
0
N
0 0 N
0 IX)
rl
0
deg rl
0 I rl
0 N r-l
0 0 rl
0 00
0 -t
Degrees 20
Appendix G X-ray diffraction pattern of sand fraction of 1Al2 horizon in site 5 (powder sample)
100100100
110110~o
1080uo
707010
F = Feldspar
606060
10toso
I
d = 3209 A 104040
d = 2522 A d 3028 A
lo = JO10
F F F F 1 F
20 d = 404 A
=o
~ 0 0 0 00 0 0 0 0 0 0
0 0 0 0 0
0 0 0 0 0
-ct N 0 co ct N 0 co -t N 0 00 ct N 0 co l) LJ) LJ) ct deg-t -t ct -ct M degM M M M N N N N -j
DegnLS 20
Appendix H X-ray diffraction pattern of silt fraction of lIIC horizon in site 5 (Mg-saturated wet paste)
100 100 100
90 to 90
IQ 1080
10 707Q
CR = Cristohalite 60 eo6Q
s = Smectite
so 50 $0
40 40 d = 404 A d = 201 A40
CR s CR
JO
d = 2481 A 10
d == 421 A JO
lO lO
0 0 0
0 0 0 0 0 0 0 0 0 0 0 0 0 0 0 0 0 0 co () deg ()
t ()
N (yen)
0 ()
co N deg N
-1 N
N N
0 N
co -j deg -
middot1 rl
N rl
0 r-l
co 0 -1
Degrees 20
Appendix I X-ray diffraction pattern of clay fraction oflIIC horizon in site 6 (Mg-saturated Yet paste)
100 100
100
10 o 00
80 bullo
70 10
H H = Halloystte110
60
d = 3547 A
511
40 bullo
d = 419 A
10 10
0 0 0
0 0 -t
0 00 ()
0
deg ()
0 t ()
0 N ()
0 0 M
0 co N
0
deg N
0 -r N
0 N N
0 0 01
0 0) r-l
0
deg bull-i
0 --t rl
0 N -j
0 0 rl
0 00
0
deg 0
-t t- +0
Degrees 20
Appendix J X-ray diffraction pattern of silt + clay fractions of IICl horizon in site 8 (Mg-saturated wet paste)
bulloo 100 IOO
o 90 ~lt)
00 d = 330 A ro Olt)
70
CP 60
so d = 2455 A
CP d = 303 AAO
Q CP CP
lO
0
0 0 0 0 0 0 co 0 -t N 0 co 01 01 01 tlti 0) N
7() 70
middotcp = Calcium phosphate Q
60 Q = QuartzfO
d = 335 A K - KaoUn
50 30
s = Smectite d = 192 ACP d = 425 A
40 40 sQ K
JO
d = 714 A l(I
10
0 0
0 0 0 0 0 0 0 0 0 0 0 0 -r N co -t N 0 00 -t J-(1 N 01 rl rldeg rl rl rl deg
Degrees 20
142
APPENDIX K
Range of Ejecta Dispersion
By theoretical considerations some of which were given by Verbeek
(1885) the ejecta of Krakatau--even free falling particles--could
have reached all parts of Ujung Kulon Assuming negligible air fricshy
tion as did Verbeek and also ignoring elevation since much of the
ejecta was spewed forth from below the level of the sea the maximum
range of free falling bodies can be estimated by
2R = V g (21)
0
at an angle of 45deg which gives the greatest range Knowing the
initial velocity V is the problem and must be determined indirectly0
from other information given by Verbeek Treating vertical and hori-
zontal components of ejecta trajectory as vectors where V is the X
horizontal component and V is the vertical component the resultant y
vector V -- or the initial velocity--is the hypotenuse of a right0
triangle with the angle e = 45deg
i
With angle e known
(22)
143
and V X
= V 0
Cos 0 (23)
Likewise Vy= V0
Sin G (24)
Actual height y depends upon time of flight The time to reach height
y is designated as Ty and height y at any time Ty is determined froru
the gravatation expression
2 y = VyTy - l2gt y ( )
2where g is the force of gravity 981 msec Height y is a maximum
at a point where the first derivative of (25) is equal to zero so
that with respect to time
2Y = Vy - gTy (26)dt
at dydt = 0 equation (26) becomes
0 = Vy - gTy (27)
re-arranging to g Ty= Vy (28)
and Ty= (29) g
We can now solve for Vy by information given by Verbeek (1885) who
assigned Ty as 15 minutes (90 sec) Substituting in values in
equation (28)
2981 msec x 90sec = Vy
Vy= 8829 msec
It is also seen that Vx = 8829 msec Rewriting equation (24) to
(30)
and substituting
V = 8829 msec o 0707
V = 12486 msec0
144
The total lateral distance V within the right triangle wouldX
however put ejected particles at the top of their trajectory Total
range R must be twice the time to rise Ty The formula then becomes
R = V 2Ty (31)X
Substituting into (31)
R = 8829 msec x 2 X 90 sec
R = 158922 m
which rounds off to 159 km Equation (21) gives the same result once
the V has been established 0
As was stated earlier all of Ujung Kulon is between 56-84 km
distance from Krakatau Given sufficient force many various sized
particles could reach the remotest parts of Ujung Kulon Actual trashy
jectory is much less in air due to air resistance as well as gravity
Large dense projectiles travel proportionally further in air than do
smaller particles Air resistance varies with form of projectiles
cross sectional area and the velocity of the projectile An adaptashy
tion of the air resistance formula of Lissack (1907)
D=r_g_ (32) w
where Dis drag or retardation r is air resistance g is force of
gravity and w is weight of projectile in kilograms can be used to
show that small particles of tuff had very limited range in air
First an approximation must be made of a particle of known size
and sufficient weight to be relatively unaffected by wind A fistshy
sized particle of pumice reported at Ketembang some 40 km from
Krakatau (Verbeek 1885) would have a diameter of perhaps 10 cm
145
Considered as a sphere its volume
3Vol= 43 n r (33)
3is 5236 cm An average density of pumice as previously computed
3 was 0505 gcm Weight of the pumice stone (technically its mass)
is
Mass= Density x Volume
= 0505 g 3 x 5236 cm3 cm
= 2644 g
Air resistance acting upon the pumice can now be compared with lighter
and heavier particles Ignoring the shape of projectile air resisshy
tance varies with the square of projectile velocity at velocities over
1350 ftsec (411 msec) and up to the 6th power of velocity at veloshy
cities under 900 ftsec (274 msec) according to experimental evishy
2dence (Lissack 1907) Using only v as a substitute for r in equashy
tion (32) a new equation
D = (34) w
may be written Using the initial velocity of eruption from equation
(30) above and ignoring units in the answer the air resistance facshy
tor for the Ketembang pumice is then
D = 12486 (msec) 2 981 msec 2644 kg
= 58 X 107
compared to 11 x 105 for a 300 pound (13636 ) artillery shell and
58 x 109 for a 264 g tuff particle How then according to Verbeek
(1884) was pumice the size of a fist bull still thrown at a disshy
tance of 40 kilometers and did pumice stones fall on Serang (Anon
146
1883) some 78 km E of Krakatau as well as 70-80 km in the opposite
direction (Leeuwen 1936) How did tuff particles of 0146 g appear
in the C layer of 6-1 in still another quadrant According to equashy
tion (34) the retardation factor D of these small particles is about
1110 x 10 but the distance at which they were found is about 78 km
SSW of Krakatau
The solution to the seeming paradox in which light vescicular
tuff particles are carried to comparable distance as heavy particles
may be related to movement of all particles in the ascending phase of
flight Perret a volcanologist quoted by Holmes (1965) described a
nuee ardente (glowing cloud) as an avalance of an exceedingly dense
mass of hot highly gas-charged and constantly gas-emitting fragmental
lava much of it finely divided extra-ordinarily mobile and pracshy
tically frictionless because each particle is separated from its
neighbors by a cushion of compressed gas Although movement of true
nuees ardentes is primarily downward in response to gravity the lack
of friction and rapidly expanding gas characteristics could well apply
to particles in the ascending phase
If the ascent is also assisted by thermal currents and by virtue
of the gas overcoming air resistance within the mass of ascending
gases the free fall 11 of cinders and ash may not actually commence
until the individual particles are beyond the effects of the gases in
their particular trajectories Holmes (1965) wrote of incadescent
pumice of Krakatau which rose to 50 miles (80 km) in the air but
Wexler (1951) gave a 32 km maximum which seems more accurate
Thus it is that neither normal ballistics formulae nor trajectory
in formulae adequately describe the kinetics of volcanic ejecta
14 7
Heavy particles may behave more nearly like ordnance in flight because
they are less affected by the gas propulsion thus ballistics formulae
for trajectory in air would seem more appropriate Vescicular tuffs
however of considerable cross-sectional area but low density would
appear to conform more closely with the trajectory in vacuo concept
Accordingly the trajectory estimations using both methods have been
presented here The difference in range between ballistics trajectory
and in vacuo trajectory does not vary by more than a factor of 2
Wind-assisted pumice would have a greater lateral range than in
the examples used contra-wind pumice would have lesser range August
jet-stream direction over the Sunda Strait is ENE its velocity about
10 msec its height about 12 km and its vertical depth about 3000 n
(Dr C S Ramage personal communication) Thus falling pumice
cinders and ash of various sizes and descent angles would be displaced
to the WSW on encountering the jet-stream
Since most of the Krakatau ejecta was over water in the SW quadshy
rant the sole Verbeek (1885) measurement of 10 mm thickness in Ujung
Kulon does not seem to be at all representative The ENE jet-stream
notwithstanding cinders of 06 mm average diameter descended in
Bogar some 150 km ESE of Krakatau between 11 AM and 3 PM of
August 27 reported by Verbeek (1885) Mohr (1944) seemed to confirm
the role of wind dispersion near ground-level as well as within the
jet-stream however his exact wording was somewhat confusing
toward Bantam the ash was blown back eastwards (sic) by the high
counter-trade winds so that all the coarser ash had already fallen
to the west before such material as reached greater heights began its
148
journey eastwards By convention wind directional notations refer
to point of origin and not to path of destination as Mohr seemed to
have implied
149
LITERATURE CITED
Allison L E and Moodie C D 1965 Carbonate pp 1379-1396 Black et al (Eds) Methods~ soil analysis Part II
ASA No 9 Amer Soc Agron Madison Wisconsin
American Society for Tes and Materials 1967 X-ray powder data file sets 1-5 (inorganic) Vol PDIS SIRB
Anonymous 1961 Occurrence of silica inclusions in Philippines woods Forest Products Research Institute Tech Note No 24 College Laguna Philippines unpaged
Anonymous 1883 Notes Nature 28425
Ayres A S and Hagihara H H 1952 Available phosphorous in Hawaiian soil profiles Hawaiian Planters Record 52(2) 81-99
Backer C A and Bakhuizen van den Brink R C 1963-68 Flora Java Vol I-III Walters-Noordhoff N V Groningen
Netherlands
Bannister B A 1970 Ecological life cycle of Euterpe globosa Gaertn pp B299-314 In Odum H T and Pigeon R F (Eds)_ tropical forest Div of Tech Info US Atomic Energy Comm
Batavia Magnetisch en Meteorologisch Observatorium 1896-1909 Regen waarne mingen in Nederlandsch-Indie
Beard J S 1949 The natural vegetation of the Windward and Leeward Islands Oxford Forestry Memoirs No 21 Clarendon Press Oxford
1942 Montane vegetation in the Antilles Carib For 361-74
Black C A Evans D D White J L Ensminger L E and Clark F E (Eds) 1965 Methods of analvsis Part II ASA No 9 Amer Soc Agron Madison Wisconsin
Boerma J 1925 Regenval in Nederlandsch-Indie Koninklijk Magnetisch en Meteorologisch Observatorium te Batavia Landsdrukkerij-Weltevreden (Netherlands)
Buol S W Hole F D and McCracken R J 1973 Soil and classification Iowa State Univ Press Ames Iowa 360 p
150
Cain S A Castro de Olivera G M Pires JM and da Silva N T 1956 Application of some phytosociological techniques to Brazilian rain forest Amer Jour Botany 43911-941
Chan J K 1972 Chemical and morphological characterization of the noncrystalline fraction in the Hilo soil (Typic Hydrandepts) MS Thesis Univ of Hawaii Honolulu Hawaii
Chapman H D 1965 Cation-exchange capacity pp 891-901 In Black et al (Eds) Methods of soil analysis Part II A S A No 9 Amer Soc Agron Madison Wisconsin
Clarke F W 1924 The data of geochemistry US Govt Print Office Washington DC 841 p
Chenery E M and Hardy F 1945 The moisture profile of some Trinidad forest and cacao soils Trop Agric 22100-115
Colmet-Daage F and Gautheyrou J 1974 Soil associations on volcanic material in tropical America with special reference to Martinique and Guadeloupe Trop Agric 51121-128
Dansereau P 1963 The barefoot scientist Colorado Quarterly 12113
Dawkins H C 1959 The volume increment of natural tropical high forest and limitations on its improvement Empire For Review 38175-180
Decker R W and Hadikusmo D 1961 Results of the 1960 expedishytion to Krakatau J Geophys Research 663497-3511
Dudal R and Soepraptohardjo M 1961 Soil classification and soil survey Bogor Institute of Agricultural Sciences Bogor Indonesia 94 p
Duncan D B 1955 Multiple range and multiple F tests Bioshymetrics 111-42
Fox R L Silva J A Younge O R Plucknett D L and Sherman GD 1967 Soil and plant silicon and silicate response by sugar cane Soil Sci Soc Amer Proc 31775-779
Furlong W and Furlong J 1974 Volcanoes mavericks of the mountains Holiday Magazine AprilMay 1974 p 29 64 66
Furneaux R 1964 Krakatoa Prentice-Hall Englewood Cliffs New Jersey
Garrels R M and Christ C L 1965 Solutions minerals and equilibria Harper and Row New York 450 p
151
Gause R W 1934 Principles of biocoenology Quart Rev Biol 11320-336
Gerard R W 1965 Intelligence information and education Science 148762-765
Grieg-Smith P 1965 Notes on the quantitative description of humid tropical forest In Symposium on Ecological Research in Humid Tropics Vegeta Govt of Sarawak and UNESCO
Hairston N G 1959 Species abundance and community organizashytion Ecology 40404-416
Harter H L 1960 Critical values for Duncans new multiple range test Biometrics 16671-685
Hilgard E 1912 Soils their formation properties comuosition and relations~ climate and plant growth in the humid and arid regions MacMillian Co New York 563 p
Hodder B W 1968 Economic development tropics Methuen and Co Ltd London 246 p
Hock M and Kostermans A 1950 Verslag over sen bozoek aan het Wildreservaat Udjung Kulon in juni 1950 Dienstrapport ( )
Holdridge L R 1970 A system for representing structure in tropical forest associations pp Bl47-150 In Odum H T and Pigeon R F (Eds) A tropical rain for Div of Tech Info US Atomic Energy Comm
1967 Life~ ecology Tropical Science Center San Jose Costa Rica 198 p
Holmes A 1965 Principles of physical geology Ronald Press New York 1250 p
Hong T K and v Schuylenborgh J 1959 On the classification and genesis of soils derived from andesitic volcanic material under a monsoon climate Neth Jour Agric Sci 71-21
Hoogerwerf A 1970 Ujung Kulon - the land of the last Javan rhinoceros E J Brill Leiden Netherlands 512 p
and silicates Cornell Univ Press Ithaca New York
Iler R K 1955 The colloid chemistry of
Indonesian Forest Service 1957 Nature park Ujung-Kulon Bogar Indonesia unpaged
Jackson M L 1958 chemical analysis Prentice-Hall Englewood Cliffs New Jersey 498 p
152
Jenny H Gessel S P and Bingham F T 1949 Comparative study of decomposition rates of organic matter in temperate and tropishycal regions Soil Sci 68419-432
Jenny H 1941 Factors of soil formation McGraw-Hill New York 281 p
Joffe J S 1936 Pedology Rutgers Univ Press New Brunswick New Jersey 545 p
1931 Soil profile studies III The process of podolization Soil Sci 32303-323
Johnson N E 1976 Biological opportunities and risks associated with fast-growing plantations in the tropics J For 74206-211
Kartawinata E K 1965 Notes on the vegetation of the Peutjang Island (SW Java) In Symposium on Ecological Research in Humid Tropics Vegetation Govt of Sarawak and UNESCO
Keng J C W and Uehara G 1973 Chemistry mineralogy and taxonomy of Oxisols and Ultisols Soil and Crop Sci Soc of Florida Proc 33119-126
Kilmer V J and Alexander L T 1949 Methods of making mechanishycal analyses of soils Soil Sci 6815-24
Kira T 1969 Primary productivity of tropical rain forest Malayan Forester 32375-384
Krliger C (Ed) 1971 Volcanoes G P Putnams Sons New York 163 p
Lang G E Knight D H and Anderson D A 1971 Sampling the density of tree species with quadrats in a species-rich tropishycal forest Forest Sci 17395-400
Lembaga Penelitian Tanah 1966 Peta tanah tindjau Kabupaten Pendeglang Bogor Indonesia
Lissack O M 1907 Ordnance and gunnery John Wiley amp Sons New York 594 p
Leeuwen dv W M 1936 Krakatau E J Brill Leiden Netherlands 506 p
Macdonald G A 1972 Volcanoes Prentiss-Hall Englewood Cliffs New Jersey 510 p
McIntosh R P 1967 An index of diversity and the relation of certain concepts of diversity Ecology 48392-404
~--------bullbullbullrrbullttMrllillmiddotiii___erbullmiddot1110--- -----------middot__ __________ ~---t middot--middotmiddot-- ___ ___ ~
153
McPherson WW and Johnston B F 1967 Distinctive features of agricultural development in the tropics pp 184-230 In Southworth H M and Johnston B F (Eds) Agricultural~ development and economic growth Cornell Univ Pres Ithaca New York 583 p
Mohr E C J 1944 The soils of equatorial regions Translated from Dutch by R L Pendleton J W Edwards (Publ) Washington DC 694 p
1930 De grond van _Iava en Suplatra J H DeBussy Amsterdam 258 p
1922 De bodem van Java en Sumatra
Mueller-Dombois D and Ellenberg H 1974 Aims and methods poundi vegetation ecology John Wiley and Sons New York 547 p
Nye P H 1961 Organic matter and nutrient cycles under moist tropical forest Plant and Soil 13333-346
Odum H T 1970 The El Verde study area and the rain forest systems of Puerto Rico pp B3-32 In Odum H T and Pigeon R F (Eds) _ tropical rain forest Div of Tech Info US Atomic Energy Comm
Ovington J D and Olson J S 1970 Biomass and chemical conshytent of El Verde lower montane rain forest plants pp H53-78 In Odum H T and Pigeon R F (Eds) _ tropical rain forest Div of Tech Info US Atomic Energy Comm
Parsons R B and Herriman R C 1975 A lithosequence in the mountains of Southwestern Oregon Soil Sci Soc Amer Proc 39943-948
Pellek R 1971 A study of site factors associated with the growth and management of teak plantations in Trinidad M S Thesis Univ of Florida Gainesville Fla
Rankama K and Sahama T G 1950 Geochemistry Univ of Chicago Press Chicago 912 p
Richards P W 1952 The tropical rain forest Cambridge Univ Press Cambridge 450 p
Rode A A 1962 Soil science Translated from Russian Natl Science Foundation 517 p
Russell E J 1912 Soil conditions and plant growth 8th ed (1950) Longmans Green amp Co London 606 p
Salter P J 1967 Methods of determining the moisture charactershyistics of soils Expl Agric 33163-173
154
Sanchez PA 1973 Review of soils research in tropical Latin America N C Agric Exp Sta Tech Bul 219
Satmoko K P 1961 Udjung Kulon Nature Park Java Nature Cons in W Malaysia 1-25
Schenkel R and Schenkel L 1973 Protection and management of the Udjung Kulon National Park for the Javan rhinoceros and other species World Wildlife Yearbook 1972-73 p 128-132
~~~~~- and Schenkel-Hulliger L 1969 The Javan rhinoceros (Rh sondaicus Desm) in Udjung Kulon Nature Reserve Its ecology and behavior Acta Tropica 2698-133
Schollenberger C J 1922 Silica and silicates in relation to plant growth and composition Soil Sci 14347-362
Schofield R K 1949 Effect of pH on electric charges carried by clay particles J Soil Sci 11-8
Schuylenborgh J v 1958 On the genesis and classification of soils derived from andesitic tuffs under humid tropical conshyditions Neth J Agric Sci 699-111
1957 Investigations on the classification and genesis of soils derived from acid tuffs under humid tropical condishytions Neth J Agric Sci 5195-206
and Rummelen F F F E v 1955 The genesis and classification of mountain soils developed on tuffs in Indonesia Neth J Agric Sci 3192-215
SEAMEO BIOTROP 1972 Quantitative vegetational study of a tropical rain forest in the Peucang Island S W Java Tech Report of Train Course in For Ecol May 26 - July 6 1972 Bogor Indonesia 32 p
Sharma M and Rao K R 1970 Investigations on the occurrence of silica in Indian timbers Ind For 96740-754
Soerianegara I 1972 Soils of Peutjang Island Southwest Java SEAMEO BIOTROP Bogor Indonesia 15 p
1970 Soil investigation in Mount Hondje Forest Reserve West Java Rimba Indonesia 251-16
Soepraptohardjo M Soewardjo and Dudal R 1966 Exploratory soil map of Java and Madura scale 1250000 Soil Research Insti-tute Bogar Indonesia
155
Stehn C E 1929 Krakatau Part I the geology and volcanism of the Krakatau Group Fourth Pacific Science Congress 118 p
Tamimi Y N Matsuyama D T and El-Swaify S A 1972 Effect of CaC03 CaSi03 on Pon pH-dependent charges and cation reshytention in an Hydric Dystrandept in Hawaii Agron Abst 197289
Tan K H and Schuylenborgh J v 1961 On the classification and genesis of soils developed over volcanic material under humid tropical conditions II Neth J Agric Sci 941-54
Taylor M S 1974 The effect of soil aggregate size on seedling emergence and early growth East Afric Agric For J 40204-213
Thornbury W D 1954 Principles of geomorphology John Wiley amp Sons (New York) 576 p
Tomlinson P B and Soderholm P K 1975 The flowering and fruiting of Corypha elata in South Florida Principes 1983-99
Tschirley F H Dowler C C and Duke J A 1970 Species diversity in two plant communities of Puerto Rico In Odum H T and Pigeon R F (Eds) A tropical rain forest Div of Tech Info US Atomic Energy Comm
Uchida R S 1973 The effect of calcium silicate on cation exshychange cpacity and on exchangeable potassium calcium and magnesium in a field trial on a Hydric Dystrandept MS Thesis Univ of Hawaii Honolulu Hawaii
US Department of Agriculture 1951 Soil survey manual US Govt Print Office Washington DC 503 p
Verbeek R D M 1885 Krakatau Batavia
1884 Notes Nature 3010-15
Wadsworth F H and Bonnet J A 1951 Soil as a factor in the occurrence of two types ofmiddot montane forest in Puerto Rico Carib For 1267-70
Walker A 1947 A critical examination of a rapid method for deshytermining organic carbon in soils - effect of variations in digestion conditions and of inorganic soil constituents Soil Sci 63251-264
Walker H Harnickell E and Mueller-Dombois D 1975 Climateshydiagram maps of the individual continents and the ecological climatic regions of the earth Translated from German Springer-Verlag Stuttgart 36 p
156
Warnaars B C and Eavis B W1972 Soil physical conditions affecting seedling root growth II Mechanical impedence aeration and moisture availability as influenced by grainshysize distribution and moisture content in silica ponds Plant and soil 36623-634
Wedepohl K H (Ed) 1969 Handbook of geochemistry SpringershyVerlag (New York) 411 p
Wentworth C K and Williams H 1932 The classification and terminology of the pyroclastic rocks Nat Res Council Bul 8919-53
Wexler H 1951 Spread of the Krakatau volcanic dust cloud as related to the high-level circulation Bul Amer Xeteor Soc 3248-51
Whitt P M and Baver L D 1937 Particle size in relation to base exchange and hydration properties in Putnam clay J Amer Soc Agron 29905-916
Williams C N and Joseph K T 1970 Climate soil and crop production in the humid tropics Oxford Univ Press Kuala Lumpur 177 p
- Pelleck_2017-08-10_163515_0001
- Pelleck_2017-08-10_163515_0002
- Pelleck_2017-08-10_163515_0003
- Pelleck_2017-08-10_163515_0004
- Pelleck_2017-08-10_163515_0005
- Pelleck_2017-08-10_163515_0006
- Pelleck_2017-08-10_163515_0007
- Pelleck_2017-08-10_163515_0008
- Pelleck_2017-08-10_163515_0009
- Pelleck_2017-08-10_163515_0010
- Pelleck_2017-08-10_163515_0011
- Pelleck_2017-08-10_163515_0012
- Pelleck_2017-08-10_163515_0013
- Pelleck_2017-08-10_163515_0014
- Pelleck_2017-08-10_163515_0015
- Pelleck_2017-08-10_163515_0016
- Pelleck_2017-08-10_163515_0017
- Pelleck_2017-08-10_163515_0018
- Pelleck_2017-08-10_163515_0019
- Pelleck_2017-08-10_163635_0001
- Pelleck_2017-08-10_163635_0002
- Pelleck_2017-08-10_163635_0003
- Pelleck_2017-08-10_163635_0004
- Pelleck_2017-08-10_163635_0005
- Pelleck_2017-08-10_163635_0006
- Pelleck_2017-08-10_163635_0007
- Pelleck_2017-08-10_163635_0008
- Pelleck_2017-08-10_163635_0009
- Pelleck_2017-08-10_163635_0010
- Pelleck_2017-08-10_163635_0011
- Pelleck_2017-08-10_163635_0012
- Pelleck_2017-08-10_163635_0013
- Pelleck_2017-08-10_163635_0014
- Pelleck_2017-08-10_163635_0015
- Pelleck_2017-08-10_163635_0016
- Pelleck_2017-08-10_163635_0017
- Pelleck_2017-08-10_163635_0018
- Pelleck_2017-08-10_163635_0019
- Pelleck_2017-08-10_163635_0020
- Pelleck_2017-08-10_163635_0021
- Pelleck_2017-08-10_163635_0022
- Pelleck_2017-08-10_163759_0001
- Pelleck_2017-08-10_163759_0002
- Pelleck_2017-08-10_163759_0003
- Pelleck_2017-08-10_163759_0004
- Pelleck_2017-08-10_163759_0005
- Pelleck_2017-08-10_163759_0006
- Pelleck_2017-08-10_163759_0007
- Pelleck_2017-08-10_163759_0008
- Pelleck_2017-08-10_163759_0009
- Pelleck_2017-08-10_163759_0010
- Pelleck_2017-08-10_163759_0011
- Pelleck_2017-08-10_163759_0012
- Pelleck_2017-08-10_163759_0013
- Pelleck_2017-08-10_163759_0014
- Pelleck_2017-08-10_163759_0015
- Pelleck_2017-08-10_163759_0016
- Pelleck_2017-08-10_163759_0017
- Pelleck_2017-08-10_163759_0018
- Pelleck_2017-08-10_163759_0019
- Pelleck_2017-08-10_163759_0020
- Pelleck_2017-08-10_163759_0021
- Pelleck_2017-08-10_163759_0022
- Pelleck_2017-08-10_163759_0023
- Pelleck_2017-08-10_163759_0024
- Pelleck_2017-08-10_163759_0025
- Pelleck_2017-08-10_163924_0001
- Pelleck_2017-08-10_163924_0002
- Pelleck_2017-08-10_163924_0003
- Pelleck_2017-08-10_163924_0004
- Pelleck_2017-08-10_163924_0005
- Pelleck_2017-08-10_163924_0006
- Pelleck_2017-08-10_163924_0007
- Pelleck_2017-08-10_163924_0008
- Pelleck_2017-08-10_163924_0009
- Pelleck_2017-08-10_163924_0010
- Pelleck_2017-08-10_163924_0011
- Pelleck_2017-08-10_163924_0012
- Pelleck_2017-08-10_163924_0013
- Pelleck_2017-08-10_163924_0014
- Pelleck_2017-08-10_163924_0015
- Pelleck_2017-08-10_163924_0016
- Pelleck_2017-08-10_163924_0017
- Pelleck_2017-08-10_163924_0018
- Pelleck_2017-08-10_163924_0019
- Pelleck_2017-08-10_163924_0020
- Pelleck_2017-08-10_163924_0021
- Pelleck_2017-08-10_163924_0022
- Pelleck_2017-08-10_163924_0023
- Pelleck_2017-08-10_163924_0024
- Pelleck_2017-08-10_163924_0025
- Pelleck_2017-08-10_164045_0001
- Pelleck_2017-08-10_164045_0002
- Pelleck_2017-08-10_164045_0003
- Pelleck_2017-08-10_164045_0004
- Pelleck_2017-08-10_164045_0005
- Pelleck_2017-08-10_164045_0006
- Pelleck_2017-08-10_164045_0007
- Pelleck_2017-08-10_164045_0008
- Pelleck_2017-08-10_164045_0009
- Pelleck_2017-08-10_164045_0010
- Pelleck_2017-08-10_164045_0011
- Pelleck_2017-08-10_164045_0012
- Pelleck_2017-08-10_164045_0013
- Pelleck_2017-08-10_164045_0014
- Pelleck_2017-08-10_164045_0015
- Pelleck_2017-08-10_164045_0016
- Pelleck_2017-08-10_164045_0017
- Pelleck_2017-08-10_164045_0018
- Pelleck_2017-08-10_164045_0019
- Pelleck_2017-08-10_164045_0020
- Pelleck_2017-08-10_164045_0021
- Pelleck_2017-08-10_164045_0022
- Pelleck_2017-08-10_164045_0023
- Pelleck_2017-08-10_164206_0001
- Pelleck_2017-08-10_164206_0002
- Pelleck_2017-08-10_164206_0003
- Pelleck_2017-08-10_164206_0004
- Pelleck_2017-08-10_164206_0005
- Pelleck_2017-08-10_164206_0006
- Pelleck_2017-08-10_164206_0007
- Pelleck_2017-08-10_164206_0008
- Pelleck_2017-08-10_164206_0009
- Pelleck_2017-08-10_164206_0010
- Pelleck_2017-08-10_164206_0011
- Pelleck_2017-08-10_164206_0012
- Pelleck_2017-08-10_164206_0013
- Pelleck_2017-08-10_164206_0014
- Pelleck_2017-08-10_164206_0015
- Pelleck_2017-08-10_164206_0016
- Pelleck_2017-08-10_164206_0017
- Pelleck_2017-08-10_164206_0018
- Pelleck_2017-08-10_164206_0019
- Pelleck_2017-08-10_164206_0020
- Pelleck_2017-08-10_164206_0021
- Pelleck_2017-08-10_164206_0022
- Pelleck_2017-08-10_164206_0023
- Pelleck_2017-08-10_164206_0024
- Pelleck_2017-08-10_164206_0025
- Pelleck_2017-08-10_164339_0001
- Pelleck_2017-08-10_164339_0002
- Pelleck_2017-08-10_164339_0003
- Pelleck_2017-08-10_164339_0004
- Pelleck_2017-08-10_164339_0005
- Pelleck_2017-08-10_164339_0006
- Pelleck_2017-08-10_164339_0007
- Pelleck_2017-08-10_164339_0008
- Pelleck_2017-08-10_164339_0009
- Pelleck_2017-08-10_164339_0010
- Pelleck_2017-08-10_164339_0011
- Pelleck_2017-08-10_164339_0012
- Pelleck_2017-08-10_164339_0013
- Pelleck_2017-08-10_164339_0014
- Pelleck_2017-08-10_164339_0015
- Pelleck_2017-08-10_164339_0016
- Pelleck_2017-08-10_164339_0017
- Pelleck_2017-08-10_164339_0018
- Pelleck_2017-08-10_164339_0019
- Pelleck_2017-08-10_164339_0020
- Pelleck_2017-08-10_164339_0021
- Pelleck_2017-08-10_164339_0022
- Pelleck_2017-08-10_164339_0023
- Pelleck_2017-08-10_164339_0024
- Pelleck_2017-08-10_164339_0025
- Pelleck_2017-08-10_164339_0026
- Pelleck_2017-08-10_164339_0027
- Pelleck_2017-08-10_164339_0028
- Pelleck_2017-08-10_164339_0029
-