A STUDY OF 'OWNERSHIP OF CORPORATIONS IN … STUDY OF 'OWNERSHIP OF CORPORATIONS IN HAWAII ......
36
A STUDY OF ' OWNERSHIP OF CORPORATIONS IN HAWAII HAWAIIAN ECONOMIC FOUNDATION 1015 Bishop Street, Honolulu, Hawaii
Transcript of A STUDY OF 'OWNERSHIP OF CORPORATIONS IN … STUDY OF 'OWNERSHIP OF CORPORATIONS IN HAWAII ......

A STUDY OF
'OWNERSHIP OF CORPORATIONS
IN HAWAII
HAWAIIAN ECONOMIC FOUNDATION 1015 Bishop Street, Honolulu, Hawaii

PREFACE
This is the first of a series of studies of various basic aspects of the economy of the Hawaiian Islands.
These studies by the HAWAIIAN ECONOMIC FOUNDATION are designed to achieve the maximum degree of objective understanding of the Islands' problems and prospects-understanding on a community-wide basis in Hawaii, in mainland United States of which Hawaii is an integral part, · and in other lands in the Pacific area.
The FOUNDATION is a non-profit membership association. The scope of the concept of its activities is indicated by the fact that among objectives set forth in its By-Laws are to aid in "making the Islands a progressively better place in which to live and work," and in "strengthening the position of Hawaii in the further development of the Pacific area."
It is the hope of the FOUNDATION that this and succeeding studies will make a contribution to Hawaiian progress.
September 15, 1948
HAWAIIAN ECONOMIC FOUNDATION,
Claude A. Jagger, President
I
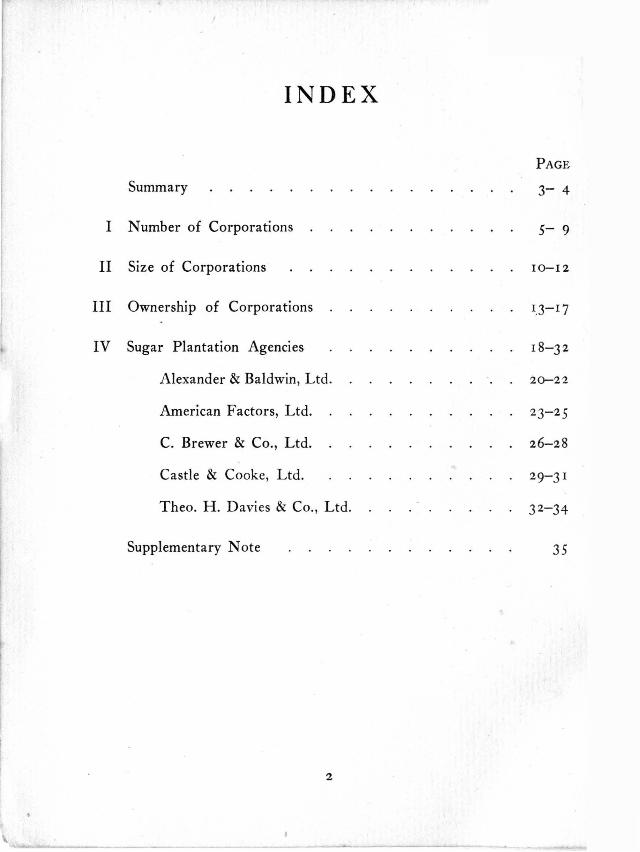
INDEX
PAGE
Summary 3- 4
I Number of Corporations 5- 9
II Size of Corporations 10-12
III Ownership of Corporations 1.3-17
IV Sugar Plantation Agencies 18-3 2
Alexander & Baldwin, Ltd. 20-22
American Factors, Ltd. 23-25
C. Brewer & Co., Ltd. 26-28
Castle & Cooke, Ltd. 29-3 1
Theo. H . Davies & Co., Ltd. 32-34
Supplementary Note 35
2

SUMMARY
This study-Ownership of Corporations in Hawaii in I946-is limited in scope. It marks only a beginning. It has indicated the need of extending this analysis to include other aspects of corporate organization in Hawaii. Briefly, this study seeks to answer these questions:
How many corporations are there in Hawaii and what is the nature of the goods produced and the services performed by them?
How large are Hawaiian corporations, as measured by total assets, and net worth (capital stock plus surplus and free reserves) ?
How are these corporations owned, as between individuals, and other corporations, and what is the relative size of each of the respective groups of holdings?
What. are the sizes of the principal sugar plantation agencies and what are their relative sizes compared to total corporate enterprise in Hawaii, as measured by (I) total assets and (2) net worth?
Insofar as could be learned, no exactly comparable study has been made for any single state or territory. For this reason, points of reference are lacking. For the most part, the study carves out new paths.
Consideration of these findings, therefore, must be laid against long established basic principles governing industrial organization, due allowance being made for Hawaii's isolation, and the limitation of its resources.
Certain over-all conclusions or inferences, however, may be tentatively drawn from the facts gathered in the present study:
( I) Participation in ownership of corporations in Hawaii is widely dispersed among many small stockholders and a substantial number of larger stockholders. There are nearly 34,000 individual stockholders in 83 I corporations studied.
3

(The vast majority of these stockholders live and work in Hawaii.) A total of nearly 34,000 stockholders is significant, when laid against the fact that there are approximately 105,000 households or families in the Islands.
(2) Viewed in relation to these 83 I corporations;
the largest of the sugar plantations agencies represents 5.4 per cent of the 831 studied, when the comparison is made on the basis of total assets, which includues assets owned directly, or indirectly by virtue of holdings of stocks in other corporations.
When the comparison is made on the basis of net worth (including the share of net worth held in other corporations), the largest agency represents 6.6 per cent of the total of
831.
(3) Ownership in corporations in Hawaii appears to be in the direction of dispersal into more and more hands. While there are no points of reference from which a comparison can be made of changes that have taken place on a regional or national scale, the increase in the number of individual stockholders has been significant. The study shows that on the average the number of stockholders in several larger corporations has increased more than one hundred and fifty per cent in two decades.
4
.-

I NUMBER OF CORPORATIONS IN HAWAII According to the records of the Territorial Treasurer, the number of corporations organized under the laws of the Territory of Hawaii as of June
30 , 1946, was 959.
These included: Corporations which were inactive or in process
of liquidation 90 Corporations for which financial statements
were inadequate, including three East India rubber and coconut plantations and two Philippine sugar centrals 30
Building and Loan Associations for which stockholders lists were not available 6
Cooperative Associations which issued no stock 2
The above totaled 128 and were not included in the study, which therefore covers 831
It is based upon financial statements as of December 31, 1946, or such other date in 1946 as marked the financial accounting date.
In addition to the above, there were 91 corporations organized under laws of other jurisdictions and one national bank. These corporations conducted business in the Territory but were excluded from the study. The exclusion of these and the 128 Hawaiian corporations indicated above does not affect the validity of the study or substantially affect the conclusions reached.
GROWTH IN NUMBER OF .cORPORATIONS The Territorial Treasurer's records show that the number of Hawaiian corporations has steadily increased. The following Table shows the number registered on June 30 in the years indicated:
19 16 1920
1926 1930
5

E _
CHANGES IN NUMBERS OF CORPORATIONS BY TYPES OF ENTERPRISE
During the past twenty years the tendency has been toward greater diversification of enterprise. Detailed records are not available for a complete breakdown, but the following Table gives a general idea of development since 1898. It has particular limitations in that the blanks shown in several classifications for earlier years chiefly reflect the lack of a detailed breakdown in those records.
Corporations engaged in pursuits other than agriculture numbered 440 in 1916; by 1926 this figure had increased to 688, and by 1946 to 869. A later Table gives fuller details for recent years.
Hawaiian Corporations by Type-I 898 - 19461
18982 1916 1920 1926 1930 1936 1940 1946
Agriculture 64 147 154 90 52 93 88 90 Railroad 5 9 9 9 8 5 3 4 Streetcar and Bus 2 2 I 8 9 10 10 Steamship I I 3 3 I I 2 2 Airlines 2 I I 6 Banking I 6 9 I I II 10 8 4 Building and Loan I 10 19 22 5 II 7 7 Trust I 6 7 14 12 I I 7 7 Insurance and Insurance
Agents 2 2 2 3 13 18 20 Mortgage and
Investment 74 13 2 13 I 123 Other Financial 72 46 43 Public Utility 22 22 22 Retail and Wholesale 325 305 319 Manufacturing 74 85 80 All Others 92 404 514 626 694 182 196 222
TOTALS 165 587 719 778 870 961 929 959
lSource: Annual Reports of the Treasurer of the Territory of Hawaii.
2Includes only those which were incorporated under the laws of the Republic and which were still doing business in 1910.
6

DIVERSITY OF CORPORATE ENTERPRISE
As the following Table indicates, one out of every three corporations IS
engaged in wholesale and retail trading.
N ext come financial corporations: banks, insurance agencies, trust companies, real estate, mortgage and investment enterprises. These represent 21.3 per cent of all Hawaiian corporations.
The third most nume~ous group is that engaged in agriculture. These add to 9.4 per cent of all corporations. About one in every three among this group IS a sugar company.
The Table is not without its shortcomings. For instance, only one corporation is shown as being engaged in the production of macadamia nuts. In point of fact, the largest producer of this commodity is 12rimarily engaged in growing sugar, and is accordingly listed under the latter headmg.
Again some corporations have many types of activity, but are listed under only one heading.
It should also be remembered that the full gross total of 959 corporations are represented in the Table:
7

HAWAIIAN CORPORATIONS-BY TYPE 1
0/0 of Total 1936 1940 19462 . for 1946
A. Agriculture
Total 93 88 90 9·4 Sugar 44 35 33 Sugar cane products I I I
Sugar factors 7 7 7 Pineapple I I 10 I I
Pineapple products I
Macadamia nuts · I I I
Poi I 2 2 Coffee 3 4 3 Avocado I I
Rubber and coconut I 3 3 Ranches and farms 2 18 18 Unclassified 20 6 10
B. Financial
Total 249 217 204 21.3 Estates 23 13 II
Trusts I I 7 7 Banks 10 8 4 Insurance and agencies 13 18 20 Building and Loan I I 7 7 Real estate, mortgage, finance
investment 13 2 13 I 123 Rental and leasing of buildings 29 19 20 Holding companies 8 6 7 Adjustors, appraisers, etc. 12 8 5
c. Manufacturing
Total 74 85 80 8·3 Foodstuffs 18 26 18 Beverages, sodawater, ice 34 29 25 Tailoring 4 3 6 Cotton I I
Welding and metal works 4 13 9 Miscellaneous 13 13 22
8
-- 14 ----- ------~~--~~

.>'
'~
% of Tolal 1936 1940 19462 f or 1946
D. Public Utilities
Total 38 38 44 4.6 Gas and electricity I I 12 12 Telephone I I I
Railroads 5 3 4 Steamship I 2 2 Streetcar and bus 9 10 10 Airway I I 6 Water rights 10 9 9
E. Retail and Wholesale
Total 325 305 319 33·3 General merchandise 19 1 182 208 Foodstuffs 51 I7 I7 Liquor. 12 14 13 Drugs 14 13 12 Service stations 26 20 21 Building materials 13 23 I7 Auto dealers 18 36 31
F. Miscellaneous
Total 182 196 222 23. 1 Contracting 27 31 42 Publishing and printing 31 33 29 Cleaners and dyers 5 6 6 Amusements, sports, clubs, etc. 35 30 26 Hauling and draying 3 13 16 Hotels and inns 8 13 18 Professional 3 15 7 Unclassified 70 55 78
lSource: Annual Reports of the Treasurer. 2As of June 30, 1946.
9

II SIZE OF CORPOR~f\TIONS IN HAWAII
By mainland standards no Hawaiian corporation would rank large. The total assets of all the 831 corporations together amount to $902,974,170. This total is less than the total assets for Socony-Vacuum Oil Co., one of the larger mainland corporations. It is less than one quarter the size of American Telephone and Telegraph Co., alone.
Figures showing the total assets of the 12 largest non-financial Hawaiian corporations are compared below with the total assets of the 12 largest non-financial mainland corporations. l
HAWAII MAINLAND2
Millions Millions of of
Dollars Dollars American Factors, Ltd. $3 2 American T. & T. Co. $3,83 I Hawaiian Pineapple Co., Ltd. 3 1 Standard Oil CO. (N.J.) 2,660 Hawaiian Electric Co., Ltd. 29 Pennsylvania RR System 2,180 Alexander & Baldwin, Ltd. 24 U. S. Steel Corp. 2,004 Waialua Agricultural Co., Ltd. 2 I General Motors Corp. 1,983 Castle & Cooke, Ltd. 20 N. Y. Central RR System 1,698 C. Brewer & Co., Ltd. 17 Southern Pacific RR 1,624 Hawaiian ' Commercial & Sugar Atchison, Topeka & S. F.
Co., Ltd. 17 RR Co. 1,21 9 Mutual Telephone Co., Ltd. 14 Union Pacific RR Co. 1, 207
Consolidated Edison Lihue Plantation Co., Ltd. 14 (N.Y.) 1,174 Oahu Sugar Co., Ltd. 13 Baltimore & Ohio RR. Co. 1, 164 Maui Agricultural Co., Ltd. 13 Socony-Vacuum Oil Co. 1,110
lAssets have in all cases been reduced by reserves for depreciation . The figure for Hawaiian Pineapple Co., Ltd., is as of May 31, 1946; all others are as of December 31, 1946.
2Per Moody's Investment Service.
10

Net Worth In terms of net worth, Hawaiian corporations may be grouped as follows:
Number of Corporations Net Worth
34 $ 1,000 or less 3 8 1,001 to 5,000
41 5,001 to 10,000
109 10,001 to 25,000
134 25,001 to 5 0 ,000
13 2 5 0 ,001 to 100,000
85 100,001 to 150 ,000
148 15 0 ,001 to 1,000,000
33 5 00,001 to 10,000,000
65 1,000,001 to 10,000,000
II 10,000,001 to 25,000,000
I Over 25,000,000
83 I
The median falls within the group having a net worth of between $50,000
and $100,000.
Total Assets In terms of assets held, Hawaiian corporations may be grouped as follows:
Number of Corporations Value of A ssets
8 $ 1,000 or less 29 1,001 to 5,000
29 5,001 to 10,000
99 10,001 to 25,000
102 25,001 to 5 0 ,000
145 5 0 ,001 to 100,000
72 100,001 to 15 0 ,000
194 15 0 ,001 to 5 00,000 .
50 5 00,001 to 1,000,000
83 1,000,001 to 10,000,000
15 10,000,001 to 25,000,000
5 Over 25,000,000
83 I
The above Table shows that the average corporation (median) has assets between $ I 00,000 and $ 150,000.
II

Total Corporate Worth
Assets of all 831 corporations total
Inter-corporate investments are included In the above figure in the sum of
The combined assets of all 831 fore
corporations are there-
Divisible thus: Banks Other corporations
Liabilities of all 831 corporations total
Divisible thus: Banks Other corporations
The difference represents the combined
$242,45 1,695 2
577,55 8,064
$234,55 1,0282
183,774,073
Net worth of the 831 corporations
IThis figure represents the book values of investments in Hawaiian corporations. These book values are included in the figure of $902,974)70, and must be deducted in order to arrive at the net worth of the 831 corporations as a group.
2Separate totals for assets and liabilities are shown for banks, because their ratio of assets to liabilities would not be representative. A Iso, it should be noted that the banking figures used here are slightly less than half the totals for the Territory. The Bishop National Bank, w ith deposits of $243,279,640, was not included, because it is a national bank and operates under a national rather than territorial charter.
12

III OWNERSHIP OF CORPOR .. J\TIONS
The present study, it should be noted, is a study of corporation ownership as represented by stock holdings. It is not a study of control, a far more complex problem which is a subject worthy of future study.
Ownership of the 83 I corporations studied by the FOUNDATION is spread among a total of 34,225 stockholders. Three hundred and twentyeight of these stockholders are other business organizations. The rest-33,897-are virtually all individual holders.l
The grouping of these 33,897 stockholders is given in the two following Tables. The first shows the breakdown by reference to the number of shares held; the second groups them according to the net worth value of their stockholdings.
It will be observed from the first Table that 20,913 stockholders-over 60 per cent of the Total-own fewer than 100 shares each:
Table I
Holdings Grouped by Number of Shares 5,9 10 stockholders each own from I to 9 shares
10,079 " " " " 10 to 49 " 4,9 24 " " " " 50 to 99 " 9,118 " " " " 100 to 499 " 1,73 I " " " " 500 to 999 " 2,135 " " " " 1,000 and over
33,897
lSome small part ~f the stocks are held by non-commercial organizations such as schools, lodges, charitable organizations, etc.
13
~ -~~- ------ -------
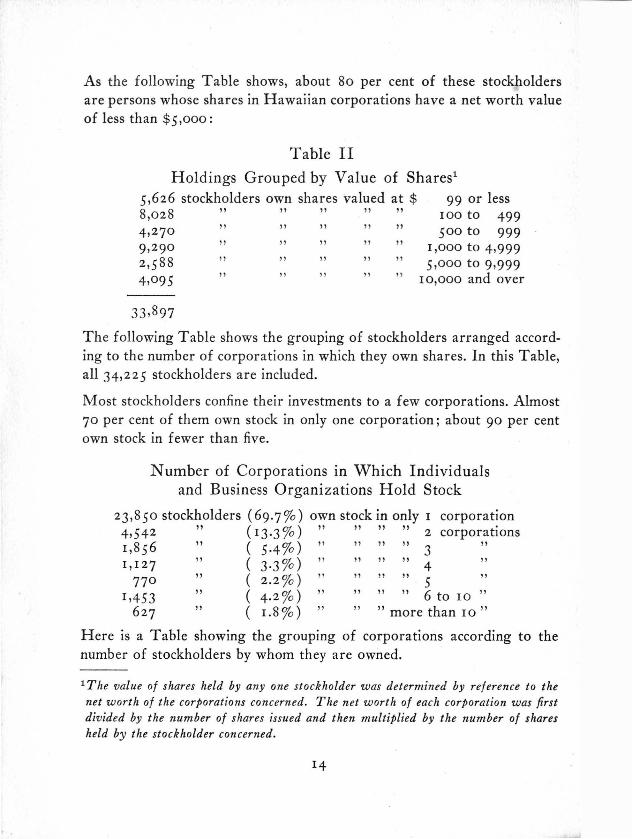
As the following Table shows, about 80 per cent of these stockholders are persons whose shares in H awaiian corporations have a net worth value of less than $ 5,000:
Table II
Holdings Grouped by Value of Shares l
5,626 stockholders own shares valued at $ 99 or less 100 to 499 500 to 999
1,000 to 4,999 5,000 to 9,999
I 0,000 and over
8,028 " "" " " 4,270 " " " " " 9,290 " " " " " 2,5 88 " " " " " 4,095 " " " " "
33,897
The following Table shows the grouping of stockholders arranged according to the number of corporations in which they own shares. In this Table, all 34,225 stockholders are included.
Most stockholders confine their investments to a few corporations. Almost 70 per cent of them own stock in only one corporation; about 90 per cent own stock in fewer than five.
N umber of Corporations in Which Individuals and Business Organizations Hold Stock
23,850 stockholders (69.7 % ) own stock in only I corporation 4,542 " (13.3 %)" """ 2 corporations 1,85 6 " (5·4% ) " "" " 3 " 1, 127
770
" " " "
(3·3 % ) " " " " 4 " (2.2 % ) " "" " 5 " (4.2 % ) " """ 6 to 10 " ( 1.8 % ) " " " more than 10"
Here is a Table showing the grouping of corporations according to the number of stockholders by whom they are owned.
1 The value of shares held by anyone stockholder was determined by reference to the net worth of the corporations concerned. The net worth of each corporation was first div ided by the number of shares issued and then multiplied by the number of shares held by the stockholder concerned.
14

It will be seen that most corporations have only a small number of stockholders.
26I corporations are owned by I to 5 stockholders 34 I " " " " 6 to 25 "
80 " " " " 26 to 50 " 55 " " " " 5 I to IOO " 67 " " " " IOI to 500 " IO " " " " 50I to I,OOO " 9 " " " " I,OOI to 2,000 " 8 " " " " more than 2,000 "
Generally speaking, the larger the corporation, the greater its number of stockholders. On the other hand, a vast number of very small corporations have only five or six stockholders.
The average number of stockholders for the ten corporations which, measured by assets, are the largest in the Territory is I966. This figure is arrived at as follows:
Number of Number of CORPORATIONS Stockholders Stockholders
1927 1946
American Factors, Ltd. 774 2, I69 Hawaiian Pineapple Co., Ltd. I,844 5,830 Hawaiian Electric Co., Ltd. 27 6 I,868 Alexander & Baldwin, Ltd. 2I8 8I3 Waialua Agricultural Co., Ltd. I,59 8 2,9 29 Castle & Cooke, Ltd. 24 926 C. Brewer & Co., Ltd. I90 509 Hawaiian Commercial & Sugar Co., Ltd. I,55 6 2,09 8 Mutual Telephone Co., Ltd. 870 2,33 6 Lihue Plantation Co., Ltd. 30 179
Total Number of Stockholders 7,3 80 I9,657
Average-ten coporations 73 8 I,966
It is important to remember that among the stockholders included above . are corporations which in turn are owned by numerous individual members of the community.
I5

The trend toward wider ownership of Hawaiian corporations is illustrated by a comparison of the number of stockholders in 1946 with the number of stockholders in 1927. In 1927, the ten companies were owned by a total of 7,380 stockholders. In 1946, there were 19,657 stockholders-an increase of over one hundred and fifty per cent.
Following is a Table showing the average number of stockholders by size of the corporations:
Size of Corporation Average Number of Measured by Value of Stockholders per
Total Assets Owned Corporation
$ 5,000 or less 11.4
5,001 to 10,000 4 0 . 2
10,001 to 25,000 15·4
25,001 to 5 0 ,000 19.0
5 0 ,001 to 100,000 26 . 1
100,001 to 150 ,000 27·9
150 ,001 to 5 00,000 39·9
5 00,001 to 1,000,000 64. 8
1,000,001 to 10,000,000 216.1
10,000,001 to 25,000,000 1, 264 .7
Over 25,000,000 2,65 8 . 5
Broad Analysis of Corporate Ownership
181 corporations are holders of Hawaiian corporation stock. Their total holdings represent 29 per cent of the combined net worth of 831 corporations.
The breakdown of the latter is as follows:
Hawaiian corporations own 29%
Other businesses 1 % Individuals (and a small number of non-profit organi-
zations such as schools, lodges eleemosynary insti-tutions) 70%
10070

In final analysis, of course, the proportion owned by Hawaiian corporations is in turn held by individual stockholders of those corporations. The above analysis may accordingly be said to represent an intermediate stage of study of corporate ownership.

IV THE SUGAR PLANTATION AGENCIES
Among significant facts disclosed in the present study are those relating to the ownership and stockholdings of the agencies for the sugar plantations.
There are five principal agencies. They supply certain management and financial services to the plantations in Hawaii, and engage in certain other businesses. They have a long history in the development of th.e business of the Territory and are often referred to as the "Big Five". They sometimes are erroneously regarded as "five families", or even "five persons".
The present study shows:
( I) These sugar plantation agencies are owned by about 4,500 persons.
(2) One of these five sugar plantation agencies owns a minority interest in one of the others.l Apart from this, the agencies are completely separate units. They operate in competition with one another in many areas.
(3) There were no interlocking directorates among these five sugar plantation agencies1
; that is, no director of any one of the five agencies is a director of any other of the agencies; an officer of one agency is a director in another, however.2
lSince the date of this study, the president of a trust company, and a director of Castle and Cooke, Ltd., has also become a director of Alexander and Baldwin, Ltd.
20f the 500,000 shares of American Factors, Ltd., outstanding, Alexander & Baldwin, Ltd., hold 37,266. This represents an interest of just under 70 per cent. Ana /ficer of the latter is a director of the former.
18

~ ." r ~:
(4) The corporate ownership picture in Hawaii cannot be drawn within the shadow of the five sugar agencies. The -assets owned by the largest of the sugar plantation agencies, either directly or indirectly through its ownership of stock in other Hawaiian corporations, represent 5.4 per cent of the total assets of all 831 corporations. Its net worth represents 6.6 per cent of the combined net worth of all 83 I cor-
_ porations.
( 5) The smallest of the agencies owns, directly or indirectly, assets representing 1.8 per cent of the total for all 831 corporations. In terms of net worth, a similar comparison shows the percentage to be 1.9.
(6) Some of the officers and directors of the agencies own stock in corporations in which the agencies themselves are stockholders. Such stockholdings represent 0.7 per cent of the combined net worth of the 831 corporations.
19

ALEXANDER & BALDWIN, LTD.
Assets
Assets owned by Alexander & Baldwin, Ltd., excluding their holdings of stock in other Hawaiian corporations, amount to $11,828,467. This represents 1.4 per cent of the assets of all 831 corporations studied.
Through their holding of stock in other Hawaiian corporations, Alexander & Baldwin, Ltd., may be said to own a share of the assets of such corporations. This additional ownership of assets amounts to $27,223,856. Altogether, Alexander & Baldwin, Ltd., own directly or indirectly $39,-052,3231 of the assets of the 831 corporations-namely 4.8 per cent. ,
Net Worth
Excluding stock owned in other Hawaiian corporations, Alexander & Baldwin, Ltd., have a net worth of $7,842,660. This represents 1.9 per cent of the combined net worth of all 831 corporations.
Through their holding of stock in other Hawaiian corporations, Alexander & Baldwin, Ltd., may be said to own a share of the net worth of such corporations. This additional net worth ownership amounts to $21,687,127. The total theoretical net worth of Alexander & Baldwin, Ltd., may be expressed at $29,531,787 which represents 7.3 per cent of the combined net worth of the 831 corporations.
1A n effort has bun made here to arrive at a maximum theoretical totat which is, of course, larger than the conservative balance sheet totals sho.wn in the table comparing sizes of the largest Hawaiian and mainland corporations on page 9. This applies also. in the cases of other plantation agencies appearing in the table on page 9.
20

Investments in Other Hawaiian Corporations
The following Table illustrates the extent of this agency's interest in other Hawaiian corporations.
HELD BY ALEXANDER & BALDWIN, LTD. CORPORA TIONS Shares Percentage
Outstanding Number of Total
Hawaiian Electric Co., Ltd. 600,000 985 0.2 Inter-Island Steam Navigation Co., Ltd. 270,695 1,545 0.6 Bank of Hawaii 165,000 1,350 0.8 Hawaiian Airlines, Ltd. 42,03 8 750 1.8 Honolulu Gas Co., Ltd. 125,000 5,000 4.0 Pacific Chemical & Fertilizer Co. 53,750 2,62 5 4·9 Honolulu Iron Works Co. 26, 269 1,650 6·3 Maui Electric Co., Ltd. 25,000 1,500 6.0 Hawaiian Trust Co., Ltd. 83,080 5,650 6.8 Mutual Telephone Co. 600,000 41,27 1 6·9 American Factors, Ltd. 500,000 37,266 7·5 Hawaiian Cane Products, Ltd. 1 25,454 2,250 8.8 Baldwin Packers, Ltd. 75,000 16,063 21.0 Haleakala Pineapple Co., Ltd. 2,200 549 25.0 Sugar Factors Co., Ltd. 2 50,000 13,304 26.6 Hawaiian Commercial & Sugar Co. , Ltd.3 400,000 139,598 35.0 Maui Agricultural Co., Ltd.3 250,000 81,570 32.6 Kauai Terminal Co., Ltd. 5,000 2,499 50.0 McBryde Sugar Co., Ltd. 470,000 320,744 68.2 Kahuku Plantation Co. 100,000 71,5 25 71.5 Kauai Pineapple Co., Ltd. 6,000 5,750 95. 8
l/nterest in this company was sold to Flintkote Co. , of New York, after December 31, 1946.
2Liquidated after December 31, 1946.
3These two companies were subsequently consolidated as Hawaiian Commercial & Sugar Co., Ltd.
21

The Owners of Alexander & Baldwin, Ltd.
The largest single stockholding was 105,200 of the total of 500,000 shares. Below is a Table showing the grouping of stockholdings:
Number of Stockholders Number of Shares Held in Each Group
I to 10 64 I I to 25 128
26 to 50 167 51 to 100 150
101 to 25 0 123 25 1 to 5 00 90
501 to 1,000 33 Over 1,000 58
81 3
22

AMERICAN FACTORS, LTD.
Assets
Assets owned by American Factors, Ltd., excluding their holdings of stock in other Hawaiian corporations, amount to $22,438,8I9. This represents 2.7 per cent of the assets of all 83 I corporations studied.
Through their holding of stock in other Hawaiian corporations, American Factors, Ltd., may be said to own a share of the assets of such corporations. This additional ownership of asse'ts amounts to $22,°57,966.
Altogether, American Factors, Ltd., own directly or indirectly $44,496,-785 of the assets of the 83 I corporations-namely 5.4 per cent.
Net Worth
Excluding stock owned in other Hawaiian corporations, American Factors, Ltd., have a net worth of $9,317,049. This represents 2.3 per cent of the combined net worth of all 83 I corporations.
Through their holding of stock in other Hawaiian corporations, American Factors, Ltd., may be said to own a share of the net worth of such corporations. This additional net worth ownership amounts to $17,348,638 .
. The total theoretical net worth of American Factors, Ltd., may be expressed as $26,665,687 which represents 6.6 per cent of the combined net worth of the 83 I corporations.
2]

Investments in Other Hawaiian Corporations
The following Table illustrates the extent of this agency's interest in other Hawaiian corporations.
HELD BY AMERICAN FACTORS, LTD. CORPORATIONS Shares Percentage
Outstanding Number of Total
Hawaiian Airlines, Ltd. 42,03 8 375 0·9 McCabe, Hamilton & Renny Co., Ltd. 6,000 180 3.0 Honolulu Iron Works Co. 26, 269 883 3·4 Kona Light & Power Co., Ltd. 11,03 I 597 5·4 Maui Finance & Mortgage Co., Ltd. 25,445 2,25 I 8.8 Hawaiian Cane Products, Ltd. l 25,454 2,82 I I I. I
Oahu Sugar Co., Ltd. 300,000 46,048 15·3 Pacific Chemical & Fertilizer Co., Ltd. 53,750 10,133 18·9 Olaa Sugar Co., Ltd. 242,75 2 46,300 19. I Sugar Factors Co., Ltd. 2 50,000 14,75 8 29·5 Pioneer Mill Co., Ltd. 250,000 64,700 25·9 Kekaha Sugar Co., Ltd. 25 0,000 80, I 66 32.1 Hawaiian Canneries Co., Ltd. 67,25° 24,370 36.2 Lihue Plantation Co., Ltd. 25 0,000 13 1,21 3 52.5 Waianae CO. 2 30,000 17,670 58.9 Koloa Sugar CO.3 50,000 34,750 69·5 C. B. Hofgaard & Co., Ltd. 35,000 34,000 100.0 Henry May & Co., Ltd. 1,500 1,500 100.0 W. A. Ramsay, Ltd. 2,5 00 2,500 100.0
l Interest in this company sold to Flintkote Co., of New York after December 31, 1946. 2 Liquidated after December 31, 1946. 3Merged into Grove Farm Co. , Ltd., after December 31, 1946.
24

The Owners of American Factors, Ltd.
The largest single stockholding was 37,266 of the total of 500,000 shares.
Below is a Table showing the grouping of stockholdings:
Number of Stockholders Number of Shares Held in Each Group
I to 10 274 II to 25 327 26 to 50 45 2 51 to 100 505
101 to 250 354 25 1 to 500 135 501 to 1,000 56
Over 1,000 66
2, 169

c. BREWER & CO., LTD.
Assets
Assets owned by C. Brewer & Co., Ltd., excluding their holdings of stock in other Hawaiian corporations, amount to $8,277,973. This represents 1.0 per cent of the assets of all 831 corporations studied.
Through their holding of stock in other Hawaiian corporations, C. Brewer & Co., Ltd., may be said to own a share of the assets of such corporations. This additional ownership of assets amounts to $25 ,795 ,891.
Altogether, C. Brewer & Co., Ltd., own directly or indirectly $34,023,864 of the assets of the 83 I corporations-namely 4. I per cent.
Net Worth
Excluding stock owned in other Hawaiian corporations, C. Brewer & Co., Ltd., have a net worth of $6,916,648. This represents 1.7 per cent of the combined net worth of all 83 I corporations.
Through their holding of stock in other Hawaiian corporations, C. Brewer & Co., Ltd., may be said to own a share of the net worth of such corporations. This additional net worth ownership amounts to $ I 0,449,139.
The total theoretical net worth of C. Brewer & Co., Ltd. , may be expressed as $17,365 ,787 which represents 4.3 per cent of the combined net worth of the 83 I corporations.

Investments in Other Hawaiian Corporations
The following Table illustrates the extent of this agency's investment III
other Hawaiian corporations. l
HELD BY C. BREWER & CO., LTD. CORPORA TIONS Shares Percentage
Outstanding Number of Total
Mutual Telephone Co. 600,000 15,000 2·5 Hawaiian Cane Products, Ltd.2 25,454 1,000 3·9 Bank of Hawaii 165,000 10,000 6.1 Pacific Chemical & Fertilizer Company 53,75 0 3,042 5·7 Honolulu Iron Works Co. 26, 269 2,000 7.6 Sugar Factors Co., Ltd.3 50,000 6,997 14.0 Hila Sugar Co., Ltd. 20,000 6,748 33·7 Hawaiian Agricultural Co., Ltd. 125,000 52,59 6 42.1 Waimanalo Sugar CO.3 37,500 17,050 45·5 Onomea Sugar Co. 12 5,000 63,010 50.4 Wailuku Sugar Co. 150,000 76,220 50.8 Pepeekeo Sugar Co. 106,250 56,200 52.9 Olokele Sugar Co., Ltd. 126,000 75,600 60.0'
lC. Brewer & Company, Ltd., have substantial holdings in the following sugar companies, which are incorporated under the laws of the state of California, but which operate wholly within Hawaii: Hakalau Plantation Company, Hutchinson Sugar Company, Kilauea Sugar Plantation Company, Paauhau Sugar Plantation Company.
2Interest in this company sold to Flintkote Co., of New York after December 31,1946.
3These two companies were liquidated after December 31, 1946.
27

The Owners of C. Brewer & Co., Ltd.
The largest single stockholding was 3,720 of the total of 80,000 shares. Below is a Table showing the grouping of stockholdings:
Number of Stockholders Number of Shares Held in Each Group
I to 10 169 I I to 25 84 26 to 50 67 51 to 100 62
101 to 25 0 57 25 1 to 500 3 0
5 01 to 1,000 23 Over 1,000 I7
5 0 9
28

CASTLE ($ COOKE, LTD.
Assets
Assets owned by Castle & Cooke, Ltd., excluding their holdings of stock in other Hawaiian corporations, amount to $9,365,485. This represents 1.1 per cent of the assets of all 831 corporations studied.
Through their holding of stock in other Hawaiian corporations, Castle & Cooke, Ltd., may be said to own a share of the assets of such corporations. This additional ownership of assets amounts to $20,973,320.
Altogether, Castle & Cooke, Ltd., own directly or indirectly, $30,338 ,805 of the assets of the 831 corporations-namely 3.7 per cent.
Net Worth
Excluding stock owned in other Hawaiian corporations, Castle & Cooke, Ltd., have a net worth of $5,596,403. This represents 1.4 per cent of the combined net worth of all 831 corporations.
Through their holding of stock in other Hawaiian corporations, Castle & Cooke, Ltd., may be said to own a share of the net worth of such corporations. This additional net worth ownership amounts to $17,887,155.
The total theoretical net worth of Castle & Cooke, Ltd., may be expressed as $23,483,558 which represents 5.8 per cent of the combined net worth of the 831 corporations.
29

Investments in Other Hawaiian Corporations
The following Table illustrates the extent of this agency's investment in
other Hawaiian corporations.
HELD BY CASTLE & COOKE, LTD. CORPORATIONS Shares Percentage
Outstanding Number of Total
Sugar Factors Co., Ltd.1 50,000 8,602 17.2 Hawaiian Pineapple Co., Ltd. 1,335,456 23 6,485 17·7 Ewa Plantation Co. 25 0,000 50,25 2 20.1 Waialua Agricultural Co., Ltd. 2 609,375 145,300 23.8 Home Insurance Co., Ltd. 50,000 19,208 38.4 Kohala Sugar Co., Ltd. 166,500 144,779 86·9 Castle & Cooke Terminals, Ltd. 37,500 37,493 100.0 Hawaiian Equipment Co., Ltd. 15,000 14,995 100.0
lLiquidated after December 31, 1946.
2It is worthy of note that Waialua also owns 493;!68 shares in Hawaiian Pineapple Co., Ltd., which is 36.9 per cent of total Hawaiian Pineapple Co., Ltd., stock.
30

The Owners of Castle & Cooke, Ltd.
The largest single stockholding was 37,500 of the total of 487,770* shares.
Below is a Table showing the grouping of stockholdings:
Number of Stockholders Number of Shares Held in Each Group
I to 10 55 I I to 25 15 8 26 to 50 25 2 51 to 100 203
101 to 250 97 25 1 to 500 63 501 to 1,000 26
Over 1,000 72
926
*Excluding 2S80 shares held in Treasury .
•
31

THEO. H. DAVIES & CO,) LTD.
Assets
Assets owned by Theo. H. Davies & Co., Ltd., excluding their holdings of stock in other Hawaiian corporations, amount to $9,875,323. This represents 1.2 per cent of the assets of all 831 corporations studied.
Through their holding of stock in other Hawaiian corporations, Theo. H. Davies & Co., Ltd., may be said to own a share of the assets of such corporations. This additional ownership of assets amounts to $5,251,491.
Altogether, Theo. H. Davies & Co., Ltd., own directly or indirectly, $15,-126,814 of the assets of the 831 corporations-namely 1.8 per c~nt.
Net Worth
Excluding stock owned in other Hawaiian corporations, Theo. H. Davies & Co., Ltd., have a net worth of $4,I42,578. This represents 1.0 per cent of the combined net worth of all 831 corporations.
Through their holding of stock in other Hawaiian corporations, Theo. H. Davies & Co., Ltd., may be said to own a share of the net worth of such corporations. This additional net worth ownership amounts to $3,754,-970 •
The total theoretical net worth of Theo. H. Davies & Co., Ltd., may be expressed as $7; 8 97,548 which represents 1.9 per cent ~of the combined net worth of the 831 corporations.
32

Investments in Other Hawaiian Corporations
The following Table illustrates the extent of this agency's investment in other Hawaiian corporations.
HELD BY THEO. H. DAVIES & CO., LTD. CORPORA TIONS Shares
Outstanding
Hawaiian Airlines, Ltd. 42,03 8 Hawaii Consolidated Railway Co., Ltd. l 182,748 Hawaii Planing Mill 1,266 Sugar Factors Co., Ltd.2 50,000 Hawaiian Cane Products, Ltd.3 25,454 Honolulu Iron Works Co. 26, 269 Hamakua Mill Co. 14, I 80 Kukaiau Ranch 1,500 Kaiwiki Sugar Co. 50,000
l Interest in this company sold after December 31, 1946.
2Liquidated after December 31, 1946.
Percentage Number of Total
375 0·9 3,034 1.7
104 8.2 4,335 8·7 2,32 I 9. 1 4,824 18·4 5,626 39·7 1,040 69·3
49,749 99·5
31 nterest in this company sold to Flintkote Company of New York after December 31,1946.
33

The Owners of Theo. H . Davies & Co., Ltd.
The largest single stockholding was 3,000 of the total of 26,886 shares. Below is a Table showing the grouping of stockholdings :
Number of Stockholders Number of Shares Held in Each Group
I to 10 9 I I to 25 14 2 6 to 50 15
51 to 100 15 101 to 25 0 25 25 1 to 500 15 501 to 1,000 10
Over 1,000 4
107
34
Supplementary Note
This is a study of Hawaiian corporations. Enterprises incorporated elsewhere are, therefore, excluded.
Among the latter are two large corporations which, although incorporated in California, are so closely related to the corporate situation in Hawaii that brief note may be appropriately made of them.
First, there is the California and Hawaiian Sugar Refining Corporation, a cooperative enterprise through which most Hawaiian Sugar Companies market their product. All of the capital stock is owned by 21 Hawaiian Sugar plantation companies, which ship all of their raw sugar to the company's refinery at Crockett, California, except sugar for consumption in the Hawaiian Islands which is refined at the Aiea, Oahu, plant.
The net worth of this corporation as of November 30, 1946, was $20,4°2,-458. Assets totaled $26,058,458.
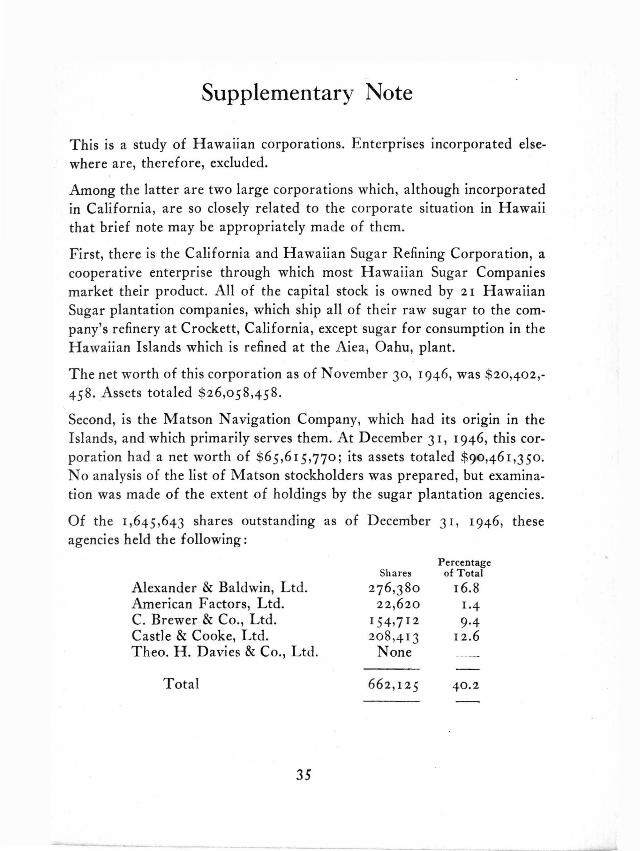
Second, is the Matson Navigation Company, which had its origin in the Islands, and which primarily serves them. At December 31, 1946, this corporation had a net worth of $65,615,77°; its assets totaled $9°,461,35°. No analysis of the list of Matson stockholders was prepared, but examination was made of the extent of holdings by the sugar plantation agencies.
Of the 1,645,643 shares outstanding as of December 3 I, 1946, these agencies held the following:
Alexander & Baldwin, Ltd. American Factors, Ltd. C. Brewer & Co., Ltd. Castle & Cooke, Ltd. Theo. H. Davies & Co., Ltd.
Total
35
Shares
27 6,]80 22,620
154,7 12 208,4 13
None
662, 12 5
Percentage of Total
16.8 1.4 9·4
12.6
40 . 2