A study of overvoltage - IDEALS
112
91?
Transcript of A study of overvoltage - IDEALS

91?


A STUDY OF OVERVOLTAGE
BY
LEON ADLER
THESIS
FOR THE
DEGREE OF BACHELOR OF SCIENCE
IN
CHEMICAL ENGINEERING
COLLEGE OF LIBERAL ARTS AND SCIENCES
UNIVERSITY OF ILLINOIS
1917

UNIVERSITY OF ILLINOIS
k&ay....23y.>.«L9.&£., 191
THIS IS TO CERTIFY THAT THE THESIS PREPARED UNDER MY SUPERVISION BY
jWrft...^.eo.n...AdX.ftr.
ENTITLED A...§.Ji.uiy....o.f....Q.v.«r.».ol.l.AgjQ
IS APPROVED BY ME AS FULFILLING THIS PART OF THE REQUIREMENTS FOR THE
DEGREE OF 5.Mhelo r..o.f 3c.le^.c.e..i.a.,.Ch.eiiLic.ai....^a^.iii.eer.i.n^...:,..
sOk^£r?r?..a
Instructor in Charge
Approved
HEAD OF DEPARTMENT OF ?.!i.5i?i..?.J.r.X.
376541

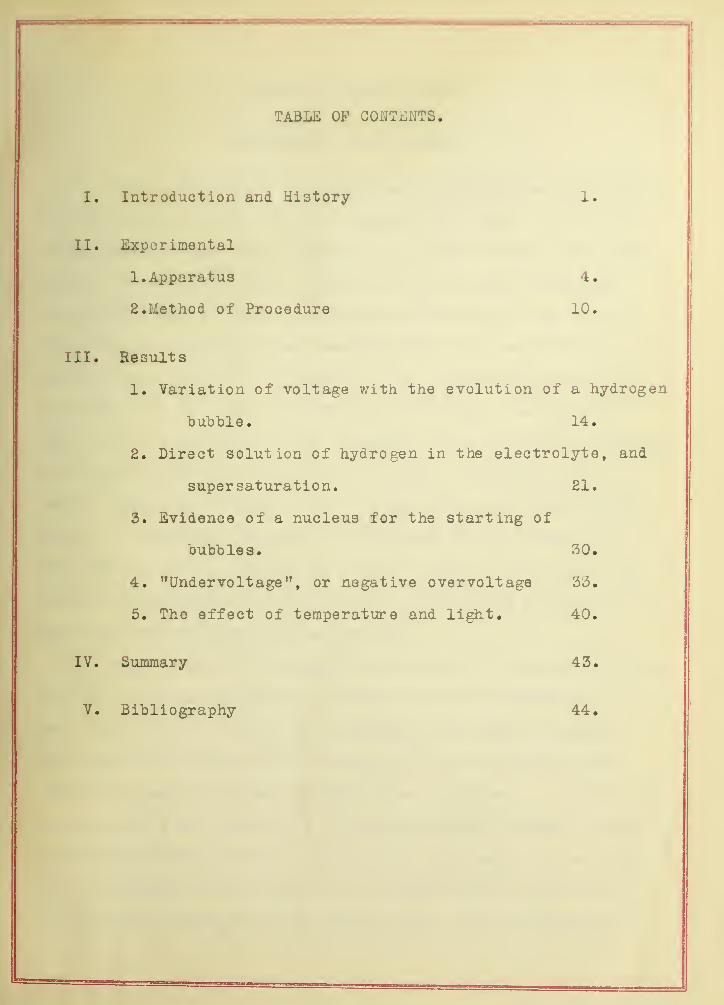
TABLE OF COffTBJJTS
I. Introduction and History 1.
II. Experimental
1. Apparatus 4.
2. Method of Procedure 10.
III. Results
1. Variation of voltage with the evolution of a hydrogen
bubble. 14.
2. Direct solution of hydrogen in the electrolyte, and
super saturation. 21.
3. Evidence of a nucleus for the starting of
bubbles. 30.
4. "Undervoltage" , or negative overvoltage 33.
5. The effect of temperature and light. 40.
IV. Summary 43.
V. Bibliography 44.

Digitized by the Internet Archive
in 2013
http://archive.org/details/studyofovervoltaOOadle

1
A Stuoy of Overvoltage.
Introduction ana History.
This investigation of hydrogen overvoltare was undertaken
for tne purpose of stuoying trie factors that seem to control it,
ratner than attempt to get values of the overvoltage on tne many
metals, and to gatuer more evidence of overvoltage phenomena
which might help to give a better under standing of what it is.
For a number of years it has been realized that overvoltage,
Wiiicn at tnis point can be thought of as the back electromotive
force built up at electrodes during electrolysis, exists, and
that it is a force tnat is met in nearly all electrolytic process-
es. Much work has been done on tne subject, but most of the
results vary considerably, and the explanations and hypotheses to
explain it are many. Bennett and Thompson? give an excellent
bibliography on the subject and present some of the views of the
various investigators. Their article also contains a table of the
most representative overvoltage values.
That different voltages are necessary to decompose dilute
sulphuric acid using different metals as the electrodes was
early noticed and referred to by LeBlanc and IJernst. LeBlanc^-
determined the decomposition voltage of dilute sulphuric acid
using platinum electrodes. Nernst^, also a pioneer in overvoltage
study, gives some interesting information in his article. In the
beginning of the nineteenth century were discoverev the electro-
lytic processes, which include the decomposition of water into
hydrogen and oxygen; but while current was used considerably to


2
deposit metals, such as nickel in nickel-plating, little attention
was paid to the question of gas evolution, Nernst says that in
order to deposit a substance, a higher electromotive force must
be put on it than is its solution tension. In a later article' ,
in which he discusses the work done by Caspari , who made some of
the first most reliable determinations of overvoltage, Nernst
sets forth the hypothesis that the presence of monatomic hydrogen
4on the electrode is the cause of the back potential, Caspar!
claims that hydrogen on a platinized platinum electrode is revers-
ible, but not so with oxygen, and that the metal with the highest
absorbtion power has the lowest overvoltage. In his determinations,
Caspari used the bubble method, which consists in measuring the
electrode potential at the limit between the visible formation of
gas bubbles and the point at which they stop. The other method
which was used by Mtlller^ and Cohen and Dannenberg , consists in
noting the abrupt bend in the current-voltage curve, which point
is supposed to represent that place at which the reaction to
evolve hydrogen is starting, thus causing the sudden increase in
current. Thiel and Bruening''', who refer to this method as the
"Knickmethode" , think that the bubble method is the more accurate,
for the bend in the curve is not always well defined. Some of
Mtlller's curves have poorly defined bends, and like some of
Kerns
t
1 8 curves, have several bends.
Cohen and Dannenuerg" compare hydrogen deposition to
metal deposition and conclude that in the case of palladium that
the hydrogen alloys with the metal thus accounting for the value
of -0.26 that they obtained. This negative value stands out in
strong contrast to the opposite voltage obtained by Caspari


3
for palladium which was 0.46, and to that gotten by Mttller ,
which was 0.24 .
The monatomic hydrogen theory , wnich was referred to by
Uernst 3, has been expanded upon by Lewis and Jackson8 , and recent-
ly by Bennett and Thompson9 , and discussed quite fully by
Bancroft 10 . The hypothesis says that the equation 2H"*" + 29 = H2
goes in two steps: Hf + d s Hi and Hi +» Hi H£, in wnich
Hi is tne monatomic form of hydrogen. To defend the existence of
such a form of hydrogen, Bennett and Thompson9 refer to the work
of Langmuir 11 , who by heating hydrogen gas in a tungsten lamp to
a very high temperature, condensed an active form of hydrogen on
the walls of tne lamp by means of liquid air.
The nistory of the study of overvoltage is almost insep-
arable from the theoretical development of the subject, and a
further presentation of the various works will be brought out
while discussing the data and results of this investigation.
Definitions of hydrogen overvoltage are many and of varying
significance, but the term "nydrogen overvoltage", as will be
used in this thesis, will refer to the difference of potential
existing between a reversiole hydrogen electrode and an electrode
at whicn hydrogen is being actively formed from hydrogen ions,
both electrodes being in the same solution. The hydrogen formed
need not, in our meaning of the term "overvoltage", oe evolved
in the form of oubbles.

4
|Xperimental.
Apparatus.
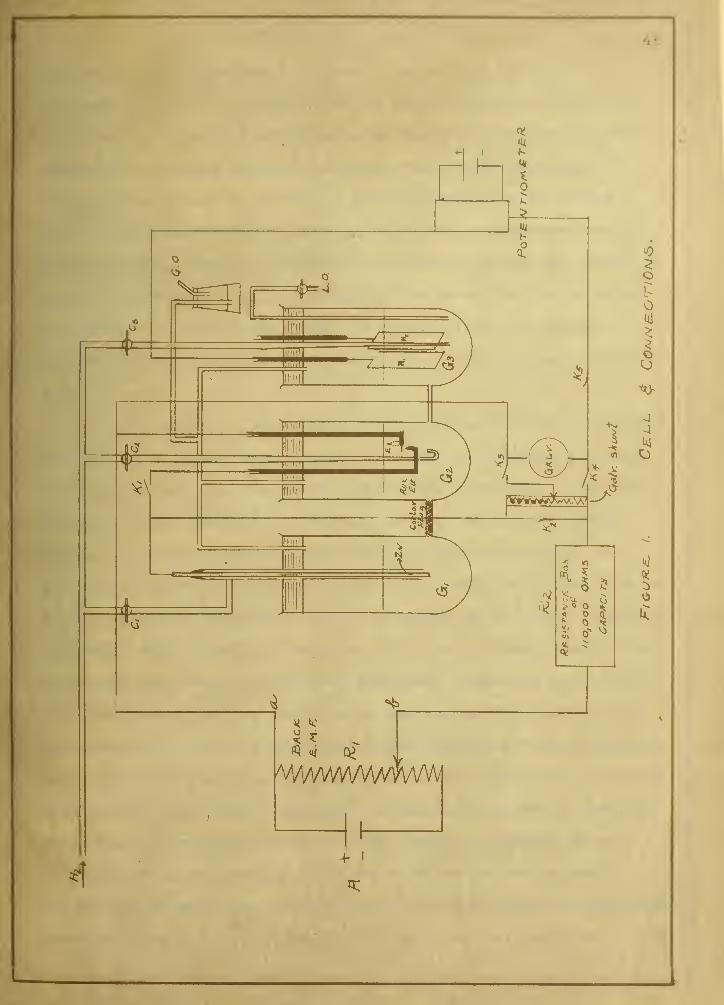
Cell. The cell and tne auxiliary parts of the apparatus
used in thifl investigation were set up after many invaluable
suggestions obtained from the work of Thiel and Breuning7. As
shown in Figure 1, the cell proper consists of three cylindrical
compartments, each 4 cm. in diameter and 10 cm. long, designated
by G]_, G2, and G3 in the diagram, connected near the bottom with
glass tuoes, the first two being connected by one of 8 mm. inside
diameter, and the second and third chamoers "by a finer one, 3 mm.
inside diameter. Into the larger tube between G]_ and G2 is insert-
ed a wad of cotton to prevent the mixing of the solutions in these
chambers, iiach compartment is tightly fitted with a rubber stopp-
er, through which pass the various tubes that go into the cell.
Delivery tuoes for hydrogen gas go into all three chambers, the
one in G^ being large enough to permit a rod of zinc, 0.6 cm. in
diameter, to pass through it and dip into the solution; the zinc
rod is fastened to the glass tube by a piece of rubber tubing,
a wire soldered to the zinc to make electrical connecti n for tne
circuit. To prevent unnecessary solution, the zinc is amalgamated.
The delivery tubes into the second and third comp rtments are
drawn out to fine capillaries which extend down to the bottom of
the cell, allowing better control of the buboling into the
liquid in the cell in very fine bubbles. In the middle chamber
the electrodes that are to be investigated are fixed, while in
the third compartment are the hydrogen electrodes. Also to the


bottom of this compartment extends a glass tuoe through which
tne excess liquid in the cell can be displaced when filling the
upper part oi* the cell with nydrogen. The gas irom eacn oi the
ohamDers is allowed to escape through exit tubes running to a
comman flask in wnich is seme of the cell solution to act as a
seal for tne cell from the outsiae air. This arrangement and the
metnod of obtaining an atmosonere of hydrogen above the liquid is
a modification of Tniel and 3reuning's apparatus to replace the
individual seals that they used. The electrolyte, 2 normal
sulpnuric acid, occupies about two fifths of the volume of the
cell.
Electrodes. The electrodes that were studied were seal-
ed into glass tubes, bent upwards to allow an unhindered ascent
of hydrogen that was liberated; electrical connection with the
electrodes was effected by means of mercury within the glass
tubes. In several experiments, the electrode was held in a
horizontal position so that bubbles from another electrode, call-
ed the auxiliary electrode, could be caugnt on it. This auxiliary
electrode was a platinum electrode with its tip bent upward. The
materials that were studied were platinum, palladium and silver,
the platinum and silver being wire, and the palladium being in
sheet torm cut to a suitable width. The lengths of the electrodes
were from 0.6 to 0.8 mm. The diameters of the platinum electrodes
were 0.046, 0.345, and 0.092 mm., the last being from a platinum
resistance thermometer since in this case an electrode of un-
doubted purity was desired. The other two were from ordinary
stock. The silver wire was 0.46 mm. in diameter, and the palladium
electrode was cut to a width of 0.46 mm., and was 0.092 mm. thick.


The hydro gen electrodes were made of sheets of platinum, 2 x
3.5 cm,, to whicn was welded SB a piece of platinum wire, which
in turn was sealed into a glass tube so that connection could be
made by means of mercury. Two electrodes were used so that one
could be used as a check for the otner. They were of the same
size, but incidently taken from different platinum stock; both
were platinized in a platinic chloride solution containing one
percent of platinum, carefully following the directions ana pre-
cautions given by Ellis^ 6. The small platinum electro aes, of
whicn tne overvoltages were to be determined, were treated in a
similar manner. In the early part of the investigation, tne
hydrogen electrodes were allowed to dip about tnree-quarters into
the solution, but later on they were almost completely immersed.
Connections. In order to control tne liberation of
hydrogen on an electrode, a suitable means was necessary for
controlling the current between the electrode and tne zinc rod.
The zinc and platinum electrodes in sulphuric acid constitutes
a Smee primary cell witn a voltage of 0.7 of a volt. Even if a
very nigh resistance is placed between the two electrodes, hydro-
gen will come off with great rapidity from the platinum electrode.
As it was necessary to control tne nydrogen evolution and hence
tne current produced by this cell, several means of obtaining
sufficiently high resistances were attempted, but without
success. As no resistance was found that was large enough and at
the same time adjustable, this method had to be abandoned in
favor of the scheme shown in Figure 1. In this arrangement the
voltage between the zinc and the studied electrodes was opposed
by a slightly smaller electromotive force. This back voltage was


4 Iir-T^-TITir—., ,
~
7
obtained by passing tne current from a dry cell, A, tnrough a
hign resistance and taking a portion of the resulting potential
drop from the contacts a and b. The final adjustments of the
current could then be made by means of the resistance box, Hg»
of 110,000 ohms ceqoacity.
Inserted in the circuit between the zinc and the electrode
wasASiiunted galvanometer, used for measuring the current, the
galvanometer being the same one that was used in connection with
the potentiometer.
Instruments and calibration. The potentiometer used
was miide by the Leeas and Uort'hrup Co., #15383, and had a range
of 1.5 volxs in increments of 0.000001 volt. Two lead accumulators
in parallel gave the balancing potential. A D'Arsonval galvanometer
that was m&de by tne Leeds and Northrup Co., was the galvanometer
used both as tne null point and for measuring the current. It was
of the high sensitivity type, #27923. The scale was located about
one meter irom the mirror of the galvanometer. The calibration of
this galvanometer for measuring current consisted in noting the
deflection on the scale when a known electromotive force from the
potentiometer was sent through the galvanometer, and then drawing
a curve between the calculated current sent through the galvano-
meter and the deflection. Knowing the resistance of the galvano-
meter and the impressed voltage, the impressed current was
calculated from the relation that I = S/S* Since the currents to
oe measured were always too large to apply directly to the
galvanometer, a known resistance was shunted across the galvano-
meter. The total resistance of the galvanometer and shunt equaled
Rgr/(r + Rg)» Rg was the resistance of the galvanometer and r the

resistance of the shunt. I (the unknown current) then was
obtained from the equation £(Rg + r)/Rgr, but since J£/Rg was "the
current through the galvanometer, Ig, which could be obtained
from the current-voltage curve, I s Ig (1 + Rg/r).
A Weston Standard cell, #2939, having a potential of
1.018t2 volts, was used to furnish the standard potential. In
order to view tne small bubbles that were liberated, a lowpower
microscope was placed outside of the thermostat and focused on
the electrode through the glass of the tnerrnostat, the necessary
illumination being obtained by means of a small electric light
situated at tae end of the microscope and directed on the elect-
rode.
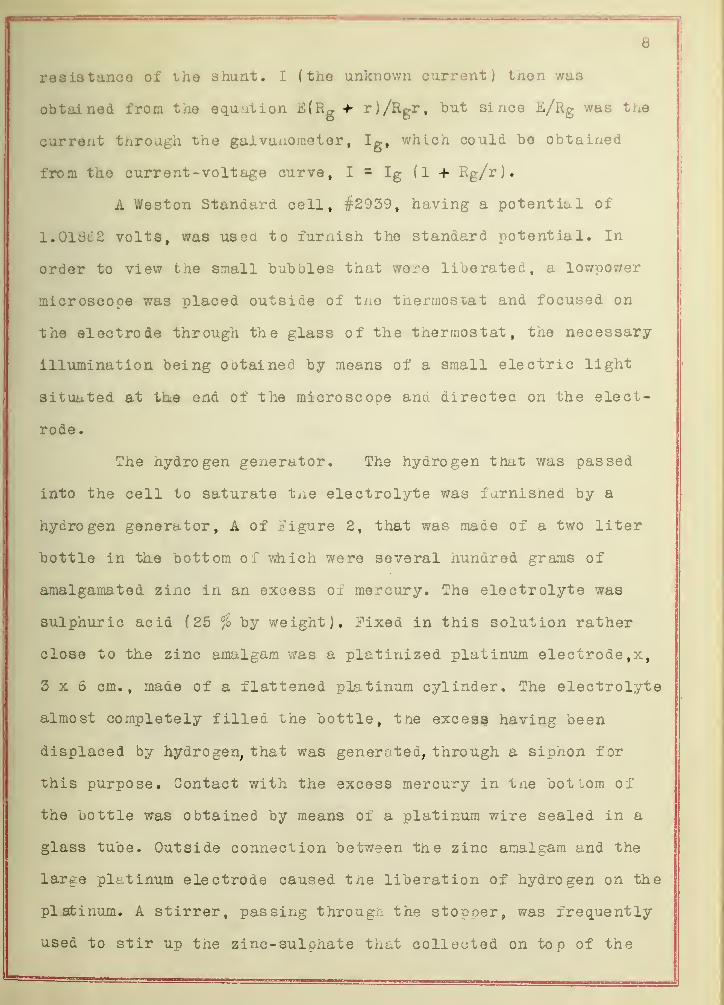
The hydrogen generator. The hydrogen that was passed
into the cell to saturate the electrolyte was furnished by a
hydrogen generator, A of Figure 2, that was made of a two liter
bottle in th.e bottom of which were several hundred grams of
amalgamated zinc in an excess of mercury. The electrolyte was
sulphuric acid (25 fo by weight). Fixed in this solution rather
close to tiie zinc amalgam was a platinized platinum electrode, x,
3x6 cm., made of a flattened platinum cylinder. The electrolyte
almost completely filled the bottle, tne excess having been
displaced by hydrogen, that was generated, through a siphon f or
this purpose. Contact with the excess mercury in tne hot lorn of
the bottle was obtained by means of a platinum wire sealed in a
glass tube. Outside connection between the zinc amalgam and the
large platinum electrode caused the liberation of hydrogen on the
platinum. A stirrer, passing through the stopper, was frequently
used to stir up the zinc-3ulphate that collected on top of the


ca
To HCiOIn 1 fierce sfai
the* to cell.
_/>i*b,„.c Wafer
Hydrogen Geln&zator 6 Gas System.
Figure-


9
ainc amalgam. Resistance in the outside circuit coulu be used to
regulate the amount of hydrogen that was generated.
The generator also amounted to a Smee primary cell, which
was used not for its electrical energy, but for the hydrogen
that it could lioerate. Its capacity as a hydrogen generator is
tnen proportional to its capacity as a source of electrical
energy, and If the latter is given, an idea of the former can be
concluded. On open circuit the potential of tiie freshly charged
cell was 0.7 volt, and it gave an amperage reading as high as
4.8 amperes. Various strengths of acids were tried, as was also
a twenty percent sodium hydroxide solution, but the twenty-five
percent sulphuric acid was found to be the most satisfactory. If
a weaker acid was used, the life of the cell was too small, and
if a stronger acid was used, polarization was encountered by the
decrease of solubility of the zinc-sulphate in this stronger acid
which collected on top of the zinc amalgam.
The hydrogen gas thus formed was collected in a large
bottle, B. The displaced water was forced into a similar bottle,
C, located several feet above, tfrom this gas reservoir, the
hydrogen first passed through an alkaline pyrogallol solution,
then water, and then through some of the 2 formal sulphuric acid
before passing into the cell.
Thermostat. The cell was immersed in a tnermostat, the
temperature of which could be automatically controlled. It
consisted of a volume of water in a large storage battery jar,
heated by an electric coil, and controlled by a mercury regulator.
A coil of nichrome wire was also suspended in the water which
was used to heat up the water rapidly when it was so desired.

10
General Method, of Procedure.
To outline a general method of getting the overvoitage of
a metal during this investi^.ti on, the steps for obtaining the
overvoitage of platinum will be given. The thermostat was care-
fully regulated to a temperature of twenty-five degrees; all the
experiments, except the one where the effect of temperature was
studied, were conducted at this temperature. Before all runs,
the cell was well cleaned and clean cotton inserted in the tube
connecting G^and Gg. The cell was then filled with 2 Normal
sulphuric acid, Gg and G3 completely filled, while G]_ was but
two-fifths filled. The various electrodes were put into their
respective positions, and the stoppers tightly put into place.
The excess acid in chambers two and three was then replaced by
hydrogen gas from the reservoir by opening outlet L.O. , the tube
of which extends to the bottom of Gg, closing the gas escape
opening G.O., and allowing nydrogen to pass into Gg through its
gas delivery tube. This entering gas forced out the excess liquid
through the tube L.O. «7hen the liquid level in these two compart-
ments became the same as that in G]_, the incoming gas was shut
off, the exit L.O. closed, and the gas escape G.O. now opened.
Gas was then slowly bubbled through all three chambers, but was
turned off in Gj_ and Gg after saturation was thought to have been
reached (usually after twelve or more hours); the hydrogen was
allowed to go into the hydrogen electrode chamber co nt iniously,
and turned on again in Gg for particular parts of the experiment.
Before and during an experiment .voltage readings were taken
between the two hydrogen electrodes to see if any potential


11
difference existed between them. The zinc platinum circuit was
then closed tnrough a small resistance and hydrogen gas allowed
to be liberated rather vigorously for about one-quarter of an
hour betore any more resistance was added. The counter electro-
motive force was then imposed and the resistance adjusted
until the bubbling was slow enough to admit of the bubbles being
counted. The first measurements were usually taken when the
bubbling had been reduced to about 150 bubbles per minute, and as
resistance was slowly put into the circuit, current and overvoltage
readings were recorded, waiting about ten minutes after each
change in resistance, and a longer time when it was convenient.
At the same time the speed of the bubbling was noted, and from
time to time various factors that tend to govern the voltage, such
as temperature, stirring, presence of oubbles on the electrode,
light, etc., were investigated. The most careful measurements
and various factors were ooserved mainly after the bubbling had
been reduced to about three or less per minute. It was not un-
comman to work when the formation of bubbles had been reduced to
one per minute, and in several cases the bubbles had been made to
evolve periodically once every ten minutes. Also in a few cases,
it took several nours lor bubbles that were present on the surface
of the electrode to reach their full growth. When the overvoltage
measurements were to be made on approaching the formation of the
first bubble from the state of no bubbling of hydrogen, the
circuit was closed through a high resistance, and observations
made as the resistance was slowly taken out. In all the experiments
with platinum, 1100U0 ohms were enough so that no bubbling would
start at the beginning of the run. In one experiment in which the


12
solution was stirred by the incoming gas which was passed into
the solution, Jhe resistance wai reduced to 1<J0 ohms before any
bubbling took place. It is thus seen that the bubble metnod for
getting the overvoltage was tried by approaching the limit of the
formation of buobles both from the rapid state of evolution and
from tne state of no evolution of bubbles.

13
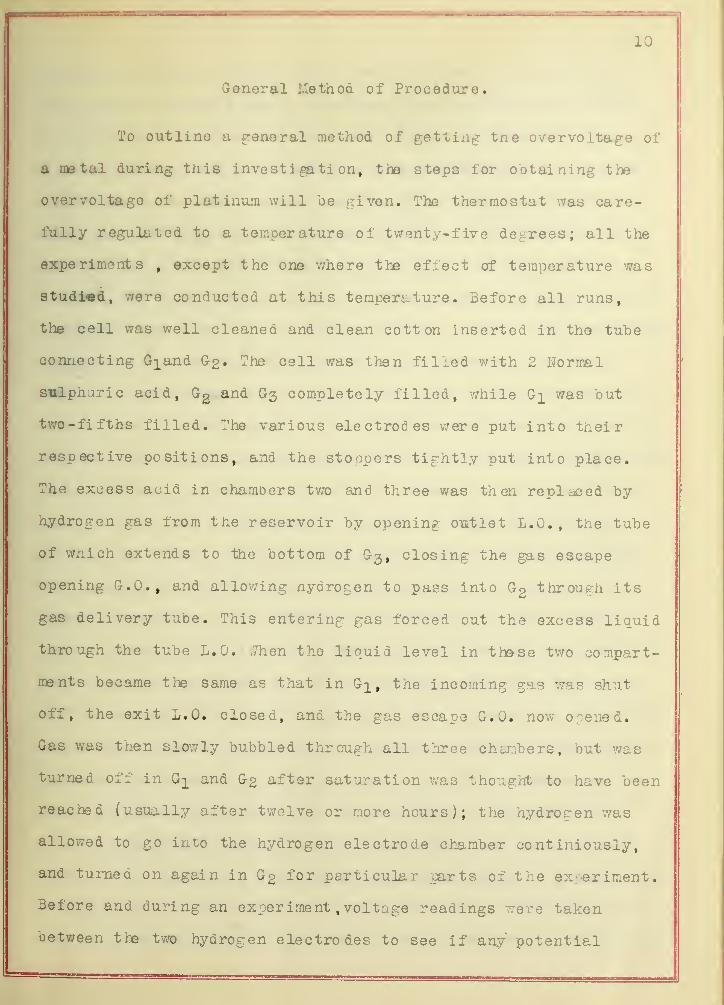
Results.
For a discussicn of tne conclusions drawn during the
course of this investigation, the results and their discussion can
be divided into the following five parts;
1. Variation of voltage with the evolution of a hydrogen
hub Die.
2. Direct solution of hydrogen in the electrolyte, and
super saturation,
3. Evidence of a nucleus for the starting of bubbles.
4. "Undervoltage", or negative overvoltage.
5. The effect of temperature and light.
Only the data obtained with platinized platinum will be
used in this thesis for discussing the investigation.


14
1. Variation of voltage witn the evolution of
hydrogen bubble.
After naving followed the voltage until the rate of bubbli
was reduced to about one per minute, a variation of the voltage
witn tiB evolution of the bubble became evident. This fluctuation
with the forming of the bubble was then observed in several exper-
iments.
Table I.
Trial 1.
Current 9.01 x 10~ v amperes.*
Time Seconds Voltage when bubble came off. Maximumvoltage.
2:40:00 .001256 »
2:40:35 35 .001400
2:41:00 60 .001241
2:41:40 100 .001416
2:42:05 125 .001235
2:42:40 160 .001407
2:43:07 187 .001240
2:43:35 215 .001404
2:44:10 250 .001243
2:44:40 280 .001415
2:45:10 310 • 001244
2:45:43 343 .001410
2:46:12 372 .001241
* Uo fluctuation of current.
15
Time
3:48:15
:4b:45
:49:15
:49:45
:50:15
: 50:40
:51:15
: 51 : 38
:52:15
:52:47
:53:17
:53:40
:54:18
:54:45
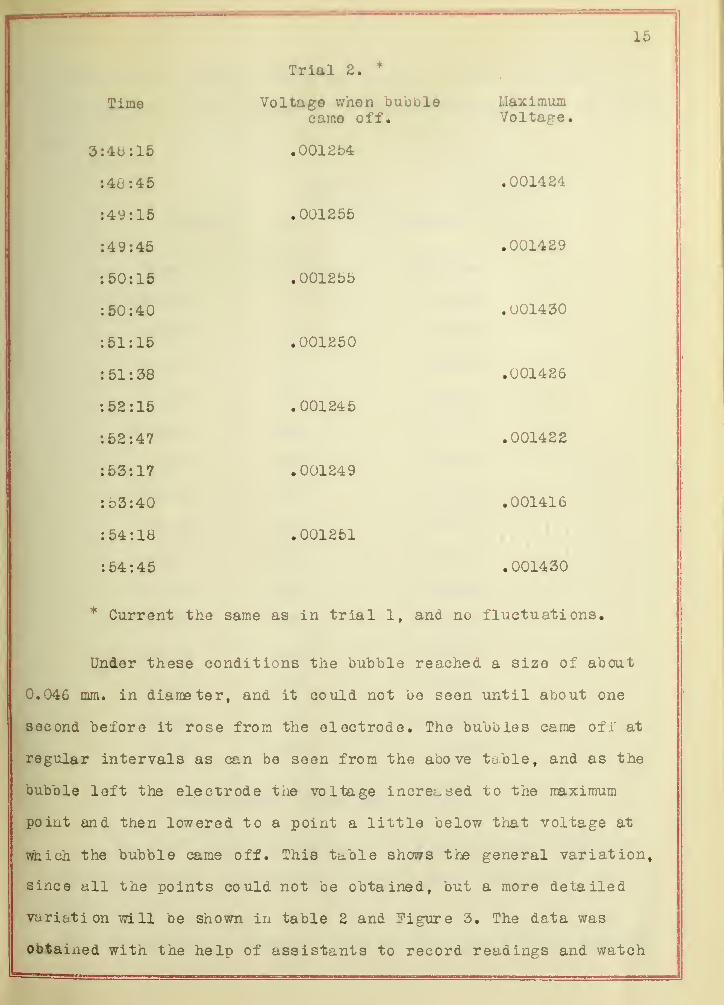
Trial 2. *
Voltage when bubblecame off.
.001254
.001255
.001255
.001250
.001245
.001249
.001251
MaximumVoltage,
.001424
.001429
.001430
.001426
.001422
.001416
.001430
* Current the same as in trial X, and no fluctuations.
Under these conditions the bubble reached a size of about
0.046 mm. in diameter, and it could not be seen until about one
second before it rose from the electrode. The bubbles came off at
regular intervals as can be seen from the above table, and as the
bubble left the electrode tue voltage increased to the maximum
point and then lowered to a point a little below that voltage at
which the bubble came off. This table shows the general variation,
since all the points could not be obtained, but a more detailed
variation will be shown in table 2 and Figure 3. The data was
obtained with the help of assistants to record readings and watch


16
the evolution of buobles. Data was taken for auo ut an hour, but
only a portion of it, to snow a typical fluctuation, will be given
here.
Table 2.
Current 8.00 x 10" 7 amperes.
Time Seconds Voltage.
3 :30
• 00 o .001655
• 30' 53 53 .001637 x
* 31 • 10 70 .001940
• 31 • 28 88 .0014 50
•31*40 100 .001609
• 32 • 00 120 .001675
•32*45 165JL \J %s .001639 x
• 33 • 02 182 -001925
:33:18 198 .001520
: 33 : 30 210 .001596
: 34 : 35 275 .001646 X
:34:55 295 .001913
:35:08 308 . 001524
: 35 : 22 322 •001587
:36:30 390 •001655 X
x is voltage where bubble was evolved.
The time for the evolution of the above bubble averaged
aDout 113 seconds, and reached a size of about ,035 mm. in dia-
meter.
It is hard to explain tnese fluctuations without assuming

16a

17
that tne formation of the surface of a buoole iias an effect on the
overvoltage. The formation of numerous small buubles will ooviously
be accompanied by the formation of a large extent of surface. The
smaller the bubble, tne greater tije extent of surface. Calculations
given below show that this surface energy is sufficient to account
for overvoltages of the magnitude commanly observed.
The exact place on the curve at which the bubble came off
aces not seem to be important, as it was found at otx^r times that
the bubble came off higher up on the curve, at the top in some
cases. It seems possible that tne main variation that took place
was not Que to the bubble that was seen in its fullest form, out
to another one that was basing formed in a cavity in the electrode,
for tne variation took place over a considerable time while the
time that the bubble was actually seen was very short, usually
only a second. It doesn't appear unreasonable that the bubble that
was seen was pusned out oi its cavity or off of the electrode by
tne newly forming bubble, and also that the bubble in other
cavities, daring different experiments, could have clung on to the
electrode longer and hence could have appeared at a different
point on the curve. That the bubble grew also by absorbing hydro-
gen from the surrounding solution seems to have been the case, for
aiter it becsme visible, it reacned its fullest size in a short
time. The bend in Figure 3 just before the bubble rose makes this
a possible explanation. During the time that the bubble has an
effect on the electromotive force, the highest potential will be
present wnen the gas has become a bubble of the smallest dimen-
sions wnich, when growing, will be accompanied by a decrease in
the overvoltage until the bub Die has reacned its fullest size.


lb
Lewis and Jackson**, wnile working wi tn mercury, found
that the presence of bubbles on the surface of tne electrode had
no apparent effect, which on the basis of Ine auove iaea could be
explained by tne absence of very small "nuclei" bubbles In any
cavities in tne electrode, for in tne case of mercury, the surface
is constantly free to change and no pores can exist. That the
buboles in tneir experiments came off nainly on the mercury and
glass b^undry snows that the bubbles tended to form in a crevice
where a nucleus would be most apt to exist. Tne full grown bUDoles
on the surface of the metal apparently had no direct connection
with the minute ouobles in tne pores and nence had no expect on
the overvoltage of the electrode.
Below will be given a diagram to snow the variations that
took place with the development of the bubble as it seemed to
exist
.
/
CO CU
a. Nucleus begins to grow.
a to b. 3ubble growing, partly from electrolysis and
partly from absoroing nydrogen from the supersaturated solution.
b. Bubble full grown; it may or may not become detached,
b to a'. Solution getting supersaturated until voltage is
high enough for nucleus to grow. Hydrogen must increase in solut
ion to make up for hydrogen absorbed by odubie and diifusion.


19
Calculation of o vervo Itagfl due to tiie formation
of small bubbles.
Surface of sphere = 4"rrr 2 Volume of sphere = (4iw3 )/3
Let V equal tue volume of one mol.
dumber of oubbles per mol. v.
3
Surface per mol. formed. —4^3 x ^-nr 2, * 3V/r
3
Work per mol. formed (3V/r)X , wnere I is the surface
tension in dynes per sq.cm. of surface.
3BTBut V-RT/p Then wcrk per mol. formed =
pr
Letting I equal 75.6 dynes/sq.cm. for 10°/o sulphuric acid,
tjt -i . n _ 3 x 8.31 x 107 x 298 x 75.6fiork m ergs per mol. = —
76 x 1.5.7 x 980 x r
" " " " " also = F x 2 x 96500 x 107, where
F is the over voltage.
Combining the las'u two equations and solving for F,
F = (2.85 x 10~ 6 )/r volts.
i'rom this relation table 3 and Figure 4 were made, showing
the relation between the voltage and the radius of the bubble. The
number of molecules in a bubble were also calculated from
aumber of molecules in one mol. of gas equals 60.6 x 10⁻²^ anQ-
PVaMT. Then the number of molecules per cubic millimeter of gas
equals 2.5 x 10¹⁷ .


20
Table 3. Calculated Overvoltages in Comparison
I/O OlZ9 OI DUO 010
.
Radius ofouoDie < r. nun.
OvervoltageJ! • VO lib.
Volume of bubble,uiii mm
.
Wo. of mol
• 1UUU a. i Qvi n~3 i n Aft-ri nl^
• uouu • UUUO I u T 0t "1 YT()1.*>
on on XW . t:OAX W
.0050 .005700 5. 24x10"' 13.1 xl0lu
.0010 .02o500 4. 19x10" 9 10.48X10⁸
.0005 .057000 5.24xl0" 10 13.1 xlO7
.0001 .2ti5000 4.19X10" 12 10.48xl05
Tne size of the bubbles that were oommanly observed were
of tiie right oruer to have an overvoltage as above indicated.
Surface tension relations must become more complicated
with still smaller bubbles, and perhaps for these smaller bubbles,
tne simple calculation is invalid. The theory as given can hold
true only if nuclei remain on the surface of tne metal. If new
bubbles must start, tne voltage relations must obviously become
more complicated, and not only tne surface tension at the gas-
liquid boundry, but also the surface tension at the gas-liquid and
gas-metal boundries must come into play.


21
2. Direct Solution ox Hydrogen in the
Electrolyte, and Supersaturation.
A marked diiference of results were observed when the
voltages were obtained by decreasing the bubbling, after having been
vigorously liberated on the electrode, by steadily lowering the
current, in contrast to the results found by starting the current
from zero. With stirring, a much higher voltage could be impressed
on the platinum electrode before any hydrogen began to evolve as
gas. By increasing the current moderately, the voltage on the
electrode could be raised to a high value before bubbling began
because, in the absence of nuclei to form bubbles, the hydrogen
apparently can go directly into solution and slowly diffuse into
the rest of the electrolyte. Tables 4 and 5 with Figure 5 show that
voltages were lower after buboling had started than those obtained
before any bubbles were evolved.
Table 4. Overvoltages while decreasing current.
Time Voltage Current Remarks,(high points) 10"' amperes.
Dec. 23, 19163:20 P.M. .001520 9.45 Bubbles evolved.
3:30 .001490 9.19 " "
3:40 .001450 8.00 "
3:50 .001426 7.21 " "
4:00 .001276 6.73 " "
4:12 .001144 6.09 " "
4:40 .001015 5.84 1 bubble in 9 min.
5:15 ..000924 5.01 Hone in 10 min.
5:33 .000775 4.24 " ,T "

22
Table 4. (Continued)
Dec. 25, 1.161:05 P.M. .000530 4.00 Hone in 10 i
l:ld .000430 3.68 N IT II
1:37 .000360 3.04 tt II It
1:53 . 000341 2.80 it IT It
2:06 .000291 2.62 it IT It
2:20 .000269 2.43 it TT II
2:29 .000242 2.28 tt IT It
3:07 .000192 1.82 it TT It
3:22 .000188 1.71 TT II It
3:36 .000182 1.64 IT It II
3:52 .000168 1.59 tl II II
4:06 .000166 1.50 TT II It
4:39 .000154 1.41 IT It It
5:09 .000148 1.30 IT II It
After this reading was taken, hydrogen gas was passed into
the electrode chamber causing the voltage to lower to the following:
5:11 .000000 1.30
5:12 .000000 1.30
5:13 -.000009 1.30
5:14 .000000 1.30
5:19 .000005 1.30
At this very low current, the amount of hydrogen that could
be deposited was very small, and with stirring, since the solution
was saturated with hydrogen, the platinum electrode became the
same as a hydrogen electrode.


23
Table 5. Overvoltages wnile increasing current,
(Ho bubbling into G 2 ).
From time to time the electrode was watched from ten to
thirty minutes to see if any buobles were liberated, but none came
off until at that place as indicated.
Time Voltage Current10"? amperes.
Dec. 26, 191611:16 A.M. .000377 1.23
11:45 .000405 1.38
11:54 .000441 1.53
12:00 .000468 1.73
12:06 .000475 1.98
12:17 .000596 2.31
1:19 P.M. .000659 2.56
1:38 .000707 2.93
3:20 .000827 3.60
3:45 .000907 4.32
4:20 .001025 4.96
4:26 .001085 6.16
4:37 .001306 7.70
4:47 .001701 10.2
4:56 .001977 11.8
5:05 .002291 14.8
5:22 .002742 17.6
5:30 .003508 27.1
5:37 .004624 34.3
5:47 .005664 42.2
5:54 .007750 62.7


24
Table 5. (Continued).
6:05 .006570 72.9
6:22 .013102 129.0
6:31 .018035 225.0
On further increasing the current, buboles began to form
on the electrode. After the first few were formed, the electrode
bubbled vigorously, sending off about 250 per minute.
6:41 .021492 364.0
After the circuit was opened, bubbles continued to come off
of the electrode for aoout 60 seconds.
Dec. 27.9:14 The circuit was closed with the same resistance
in as was in at 6:31 above so that the current would be the same.
9:37 .017894 222.0
As above, no bubbles came off at this current.
9:58 Greatly increasing the current momentarily, with
a sudden short circuit between the zinc and platinum electrodes,
hydrogen buobles were made to oe evolved at about 300 per minute.
Bubbles continued to come off at this rate.
10:04 .016020 228.
Passing in hydrogen gas into the electrode chamber caused
to potential to lower still more:
10:08 .013770 235.
It was also noticed that buobling into S£ hinders the
liberation of bubbles on the electrode being studied. Starting
with a rather high current with a new electrode on which no bubble
had been larned for several hours, the rise of voltage was
observed with increasing current while hydrogen was passed into


25
the electrode cnamDer. The experiment was conducted with an
electrode of platinized platinum, the platinum having been taken
Irom a platinum resistance tnermometer, diameter of wire .0 CJ£ mm. g
and the following table can be considered as a continuation of
the preceding table.
Table 6. High over voltages with increasing
current and stirring.
As in table 5, the electrode was carefully watched to note
when the liberation of hydrogen bubbles started.
Time Voltage CurrentAmperes
(Using a milliameter)
7:50 .02880 .00009
7:55 .03236 .00012
8:00 .03600 .00019
6:05 .04844 .00038
8:06 .06062 .00070
8:08 .07136 .00111
8:10 .06850 .00194
On attempting to further increase the current a slight
amount, bubbles began to pour off of the electrode violently.
Curves of tables 4 and 5 are shown in Figure 5, while a
graph of table 6 is shown in Figure 6. The arrows indicate the
direction in which the readings were taken.


26
In addition to the above effect due to stirring, atirring
of the electrolyte in the eleotrode chamber has a lowering effect
on the overvoltage. An experiment on one of the platinized plat-
inum electrodes, with the results shown in tho following- table, was
conducted to show this effect. As in the other experiments, the
stirring was obtained by passing in hydrogen gas from the gas reser-
voir.
Table 7. Change of overvoltage with stirring.
Remarks.Time
2:23
2:29
2:31
2:33
2:36
2:41
2:44
2:45
2:48
2:52
Voltage.
.001450
.000928
.000937
.000947
.000938
.000948
.000920
.000890
.000935
.001450
Current10" 7 amperes
10.49
11.25
No stirring. One buoblein l| min. liberated onthe electrode.
Stirring at rate 1.
IT »T tt 2
tT If »» ^
ft it n2_
ft 11 TT ^
Increased stirring torate 2.
Increased stirring torate 3.
Decreased stirring torate 1.
Stopped stirring.10.49
During the stirring, no bubbles were observed to form on the
electrode, which was for about thirty minutes. During tests of this
sort, bubbles sometimes remained on the electroce when the stirring
was not too violent, and since there was not any marked variation
of the potential during stirring, it seems possible that the liber-
ated hydrogen gas went directly into solution, and the resulting


27
supersaturat ad electrolyte was removed by the stirring. However,
the small bubble may have been knocked off of the elect roue as soon
as it was formed, whicn, if tne case, could prevent the voltage
variation due to the growing of the buoble.
In contrast to the test lust explained in which the super-
saturated volume was removed by stirring will be cited the follow-
ing experiment in which the amount of supersaturat ion was increased.
After taking the initial voltage reading, a large voltage was
applied to tne platinum electrode by momentarily short-circuiting
the zinc-platinum circuit so as to vigorously liberate hydrogen
buobles. The voltage was then again noted, and the length of time
watched for the voltage to return to its initial value. The length
of time thus observed was tne time in which it took the increased
volume of supersaturated electrolyte^diffuse away without stirring.
Time Voltage
7 : 00 . 000433
A large voltage applied for an instant to vigorously liber-
ate hydrogen bubbles.
7:01 .002666
The voltage slowlj/ dropped to
7; 45 .000435
It took 44 .minutes for the increased supersaturat ion to
be removed without stirring.

28
Table 4, as headed, gives the overvolt f.ge values as tne
current was decreased. Since bubbles are able to prow, tnev will
stop being liberated at tiiat voltage, so that they cannot be com-
fortably counted, at which trie current is so small that the hydrogen
evolved is in equilibrium with the saturated solution around tne
electrode, and because of the slowness of the evolution the satur-
ated volume can diffuse away in time so that no supersaturation
can exist. Bubbles were not watched for longer than ten minutes,
nine minutes being the longest time in which one bubble was liber-
ated, but in some experiments bubbles were observed that required
an hour or more for their liberation. That it might take an entire
day for a bubble to be liberated does not seem impossible.
While increasing the current, the hydrogen, because it
could not escape as gas bubbles since none were forming, must have
gone into solution in the metal electrode and in the electrolyte.
The gradual dispersing of hydrogen into the liquid could possibly
set up a metast^ble system, analogous to th3 supercooling of water
in the absence of any ice crystals or to a supersaturated salt
solution. In the experiment of table 5, a voltage of .0215 was
reached before the electrolyte was so supersaturated with hydrogen
that the liberation of hycro gen bubbles finally took place, and
in the test of table 6, with stirring it was possible to have a
potential of .0685 volts on the platinum electrode before any
hydrogen bubbles were formed. Tables 1 and 2 show that bubbles can
form at much lower voltages than those given, provided that the
electrodes nave previously been used to form bubbles.


29
BsIqw will be given a calculation to shgw the voltage
that would be due to the hydrogen evolved if liberated entirely as
a bubble, in comparison to tuat wnich actually existed.
Q - FN - It Therefore N« It/F
PV = NET Then V = NRT/P
Then volume of gas liberated equals ItRT/?F
From table 1, I 9,01 x 10~ 7 amperes, and since one bubble
came off every 60 seconds, t = 60 seconds.
9.01 x 10" 7 x 60 x 82 x 296Volume of gas evolved = —
1 x 96500
equals 13.69 x 10"° cc.1
Kadius of sphere equals (lV/V)3
Hence radius of bubble = 10* 2 x (fxl3.69/-"-)i = .1485 mm.
From Figure 4, the voltage corresponding to a bubble of
radius .1485 mm., equals .000210 volts.
3ut the average potential as existed in table 1 was
.001320 volts, which voltage, on Figure 4, corresponds to a bubble
of radius .025 mm. The bubble that was observed to come off during
this experiment was carefully approximated at radius .023 mm.
It is therefore concluded that the higher voltage that
existed was due mainly to the formation of the bubble, and slightly
increased due to the effect of saturating the metal and electrolyte
even if the amount that went into solution was large in comparison
to that which made up tne bubble.

30
3. Evidence of a nucleus for the starting of bubbles.
In the preceding discussion of superset urati on, trie Question
of a gas nucleus was constantly referred to. The two topics are
very closely allied, since, as in the case of a supercooled body of
water or supersatur ated salt solution the presence of a minute
water orystal or salt crystal respectively will cause the immediate
breaking down of the metastable system, the presence of a minute
bubble attached to an electrode in the case of a supersaturated
gas solution undergoing electrolysis will cause the continued
evolution of bubbles. One large bubble on the surface will not
suffice, for on breaking free after absorbing as much hydrogen as
the buoyancy of the bubble will permit, it will leave no nucleus on
the electrode. A nucleus must remain remain in a small cavity or
pore, on which more bubbles will grow and continue to be liberated
as such. Thiel', in his discussion, refers to "Gaskeime", or gas
seedlings and to the"continui:ig" formation of bubbles, to which
the idea of tne nucleus and the removing of the excess saturation
seem to compare. As shown in table 5, after bubbles were started,
they continued to evolve, while in the data of the preceding day
under tne same conditions, no bubbling took place. Stirring seems
to remove the supersaturated solution so that the bubbles have no
cnance to grow. This may suggest the idea that tne hydrogen must
first go into solution, at least partly, before it can grow into a
bubble on the nucleus, which idea also seems to help explain the
peculiar variations in tne voltage just before the bubble is evolv-
ed, as shown in Figure 3.

31
An attempt was therefore made to supply small babbles to the
electrode from a neighboring electrode, called the auxiliary elect-
rode. As shown in Figure 1, the auxiliary electrode is situated
below the electrode being studied. Hydrogen can be liberated on it
by connecting it, by means of the switch K^, to the zinc. It con-
sists of a piece of platinum wire sealed in a glass tube bent up-
wards. Turing this experiment, the platinum electrode on which the
auxiliary bubbles were to be caught, was held in a horizontal
position as shown by the heavy electrode in Gg of Figure 1. 3ubbles
were caught on the underneath siae of the electrode, and some inter-
esting results, wnich help to show that a bubble of hydrogen can
act as a gathering point for the surrounding hydrogen, will be out-
lined.
Starting with a low current so that no bubbles would be on
the electrode, the current was slowly increased until the voltage
became
3:00 P.M. .00567
A small bubble was then caught on the electrode. The bubble
grew on this electrode, the potential of the electrode dropping as
follows:
3:10 .00500
3:20 .00468
3:30 .00450
3:45 .00390
The bubble then broke free and the electromotive force
rose at once to .00566


32
In another experiment the presence of a bubble oausnt from
the auxiliary electrode caused the potential to drop from .00735
volts to .00490 volts. During this experiment a strange incident
took place which supports the nucleus theory. As soon as the bubble
from the auxiliary electrode came in contact with the observed
electrode, bubbles started to grow in immediate contact with the
original bubble in four places, and evolution continued from those
points on the electrode.
After the liberation of buboles had started and the current
increased, the presence of a bubble caught from the auxiliary
electrode still had a lowering effect on the voltage of the electrode,
from .01065 volts to .00744 volts.
Another point of interest with this connection deserves
mention at this place. During one of the experiments in which the
electrode was held in a vertical position, small bubbles slowly
formed near the bottom of the electrode and rose along side of the
electrode when freed, at times coming in contact with the electrode.
These bubbles occasionally stopped at a place on the electrode
where they grew to a larger size. After a while the point at which
these bubbles stopped became the source of the newly forming small
bubbles, and bubbles were thereafter evolved from that place.


33
4. "Undervoltage" , or negative overvoltage.
"Undervoltage", as the name implies, is negative overvolt-
age, and oan be considered as that difference of potential between
a hydrogen electrode and an electrode on which hydrogen is being
evolved in the same solution, the sign of the potential bein*? neg-
ative to overvoltage. In the case of the experiments with platinum
when undervol tages were obtained, the proof that hydrogen was still
being evolved was the fact that the current was still flowing in the
same direction as it did when the overvoltage existed. Data, shown
in tables 9 and 10, and in the curves in Figures 7 and 8, brings
out the existence of undervoltage.
In some of the early experiments in which negative over-
voltages were obtained, some doubt arose as to the reversibility
of the hydrogen electrode used, but an investigation to be describ-
ed below relieved that uncertainty.
After the electrolyte in the chamber (Gg) containing the
two hydrogen electrodes was thought to be saturated with hydroeren
gas, as hydrogen had been bubbled into the liquid for a number of
hours, the voltage between the two large electrodes was found to
be .000000 volts. Hydrogen gas was then liberated on one of the
electrodes (Hi) by using a platinum anode in Gi and applying four
volts. The hydrogen gas was allowed to be generated on this hydro-
gen electrode for one-half hour, thus highly supersaturating the
one electrode while the other was left as it was, against which the
supersaturated electrode was compared.

34
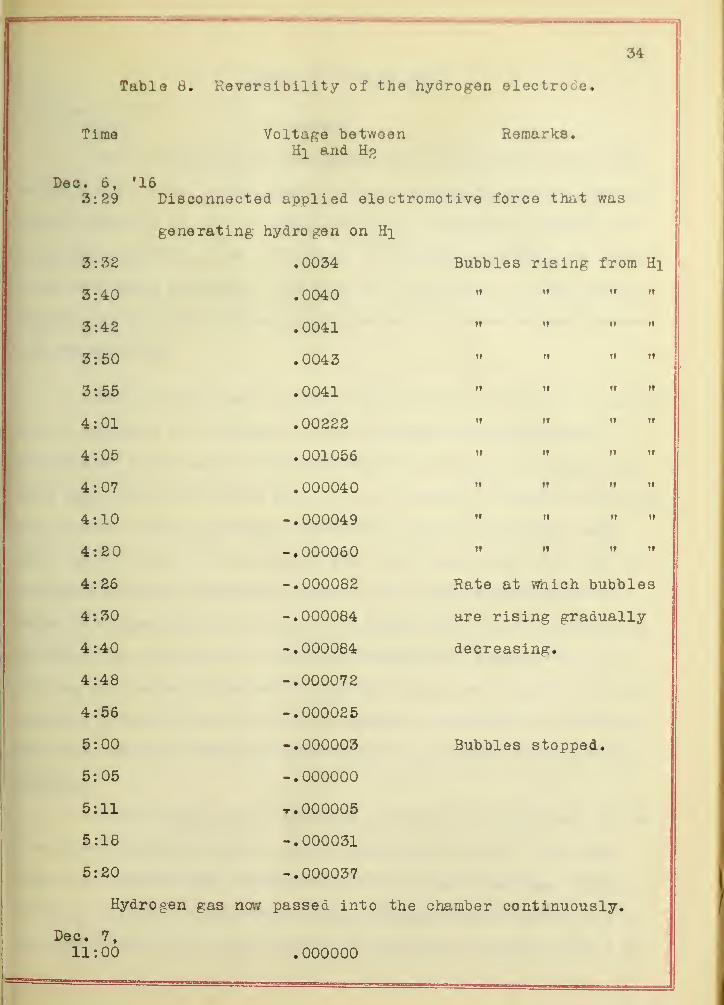
Table 8. Reversibility of the hydrogen electrode.
Time Voltage between Remarks.Hi and K%
Dec. 6, '16
3:29 Disconnected applied electromotive force that was
generating hydrogen on Hi
3:32 .0034 Bubbles rising from Hi
3:40 .0040 " " " "
3:42 .0041
3:50 .0043 " " " "
3:55 .0041 " "
4:01 .00222
4:05 .001056 " " " "
4:07 .000040 " " " "
4:10 -.000049 " " " "
4:20 -.000060 " " ,f ?T
4:26 -.000082 Bate at which bubbles
4:30 -.000084 are rising gradually
4:40 -.000084 decreasing.
4:48 -.000072
4:56 -.000025
5:00 -.000003 Bubbles stopped.
5:05 -.000000
5:11 -r. 000005
5:18 -.000031
5:20 -.000037
Hydrogen gas now passed into the chamber continuously.
Dec. 7,11 : 00 . 000000

35
Table 8. (Continued)
Dec. 8, '16
10:00 .000000
It is noticed that the difference of potential, which was
above 3 millivolts at the start, dropped gradually through zero and
became negative to the original direction, but upon stirring, the
original condition of no difference of potential between the elect-
rodes was again attained. This must be a condition of true eauil-
ibrium, as the equilibrium was approached from supersaturat ion and
under saturation.
A plausible theory of this undervoltage is that it is caused
by the presence of a hydride in the electrode. V/hen Cohen and
Dannenberg^ got a negative overvoltage of .26 volts on palladium,
they explained it as being due to the alloying of hydrogen with the
palladium to form a hydride. LeBlanc-^, in his discussion, says
that overvoltage is the greatest with the metals that have the
smallest occlusion capacity, while in the case of palladium, it
helps the separation of hydrogen, probably due to the formation of
an alloy, as explained by Cohen and Dannenberg. Newbery-^, in
quoting some work of Fowler^, says that hydrogen liberated from an
antimony cathode in acid solution contains a good deal of stibine,
and that hydrogen liberated from carbon electrodes contains hydro-
carbons.
In this investigation, while working with palladium, no two
runs gave checking results. Out of four experiments, three gave
negative overvoltages, while the points at which hydrogen stopped
bubbling from the electrodes differed widely in all cases. In all
the experiments, the glass around the palladium cracked after 5 or


36
6 days, which could have been due to the expansion of the palladium
caused by the absorption of hydrogen.
While platinizing some very fine platinum wire, ,046 mm.,
n 11
in diameter, it was chewed off even with the glass and the platin-
izing built up on top of the glass. This suggested the possibility
of a reaction between the platinum and the hydrogen evolved.
Newberyl^ found that the surface of metalic cathodes became dull
after liberating hydrogen, and mi cropho tographs revealed minute
pittings which had craterlike forms.
The reactions that could possibly take place at the cathode
to fit in with the hydride theory seem to be some of the following.
2H+ + 29 2 H2 for the general evolution of hydrogen,
and H* + Ptx + 9 = HPtx at higher voltages for the
formation of the hydride.
The test of the theory, if the hydride could react with
another hydrogen ion and an electron to form platinum and hydrogen
gas, would be to continue the experiment after the undervoltage
would be present, and see if the potential returned to the over-
voltage side again. The equation to express that reaction might
be HPtx + H+ + 9 = H2 + Ptx
Accordingly, an experiment was set up to see if , with
prolonged flowing of the low current after the undervoltage existed,
the potential would go back to the overvoltage side again. For th.is
experiment, a piece of platinum wire of undoubted purity, carefully
platinized, was made the electrode. After bubbles were liberated on
the electrode for more than twelve hours, the experiment was started
Because the light stopped the bubbling easier on this very pure
platinum electrode when they were coming off slowly, the point at
which the bubbles stopped, or the rate at which they were coming


37
off when they were reduced to 3 or 4 per minute oould not be observ-
ed. No hydrogen was passed into the electrode chamber Gg. Tables
9 and 10 show the measurements obtained.
Time
Apr. 22, '17
3:05
3:45
4:00
4:10
4:20
4:30
Apr. 23.8:00
8:45
9:30
9:35
9:40
9:50
11 : 00
11:30
1:00
2:00
7:00
Apr. 24.8:00
9:30
10:30
4:00
Table 9.
Voltage
.003724
.003040
.001722
.001544
.001031
.000792
.000271
.000260
.000021
.000000
-.000025
-.000084
-.000243
-.000382
-.000522
-.000633
-.000796
.000528
.000552
.000631
.000506
Current 10" 7 amperes.
11.2
8.16
4.32
2.80
2.72
2.08
1.90
1.76
1.51
1.51
1.51
1.28
1.15
1.04
0.91
0.80
0.80
1.15
1.15
1.15
1.15
From here onno change inresistance Rg


38
It is seen that on continued running at the very low
current, the voltage passed through zero again to the overvoltage
side.
After the current was rather low, around l.b x 10 amperes
a change in the resistance Rg only changed the current a small
amount, since the back electromotive force from R-j_ was rather
high. A table showing the change of potential with respect to time
while the undervoltage existed and returned to the positive side
will be shown in table 10.
Time
Apr. 23, '17
9:00 A.M.
9:30
9:50
11:00
11:30
1:00 P.M.
2:00
3:00
5:00
7:00
Apr. 24
8:00 A.M.
9:30
10:30
1:00 P.M.
Table 10.
Hours
0.5
0.8
2
2.5
4
5
6
8
10
23
24.5
25.5
28
Voltage
.000021
•.000084
.000243
.000382
••000522
•.000633
.000669
.000758
.000796
.000528
.000552
.000631
.000625
Current.
The current can be
considered as about
_ 71.0 x 10 amperes.

39
A curve of table 9 ia shown in Figure 7, and one of
table 10 is shown in Figure 8. The negative voltage disappeared
and the potential became positive again as was predicted. The
return to the overvoltage side again seems to have been regular
with respect to time for tne assumed voltages during the nipht,
as outlined in the dotted portion of Figure 8, fall in line with
the observed potentials taken the next morning.


3Ja


40
5. The effect of temperature and light.
Increasing the temperature had tne effect of lowering the
overvo It :.ge , but not as much as tne speed of reaction demands if
the monatomic hydrogen theory far overvoltage is correct. In
table 11 will be given the over voltages on platinized platinum
with change of temperature and the corresponding constant obtained
by dividing the voltage by the surface tension of water at that
temperature. The Barface tension of water was used as no data of
tne change of the surface tension of 10 percent sulphuric acid
witn cnsnge of temperature could be obtained.
Table 11. Effect of increasing temperature.
Temperature Voltage Current Rate of k = V/l10"' amperes bubbling.
25 .00205 3.64 1 in 2 '30" 286
30 .00197 3.64 1 »i 2'40" 279
35 .00173 3.64 1 n8 '40" 246
40 .00167 3.64 1 t» 2'40" 240
45 .00161 3.64 1 rr 2'30" 235
50 .00150 3.80 1 t» 2 '20" 221
Since the speed of reaction doubles for every ten degrees
rise of temperature, the overvoltage does not uecres.se as fast as
tn j speed of reaction demands; however, tne overvoltage does decreas^
a little faster than surface tension of water decreases with rise
of temperature.

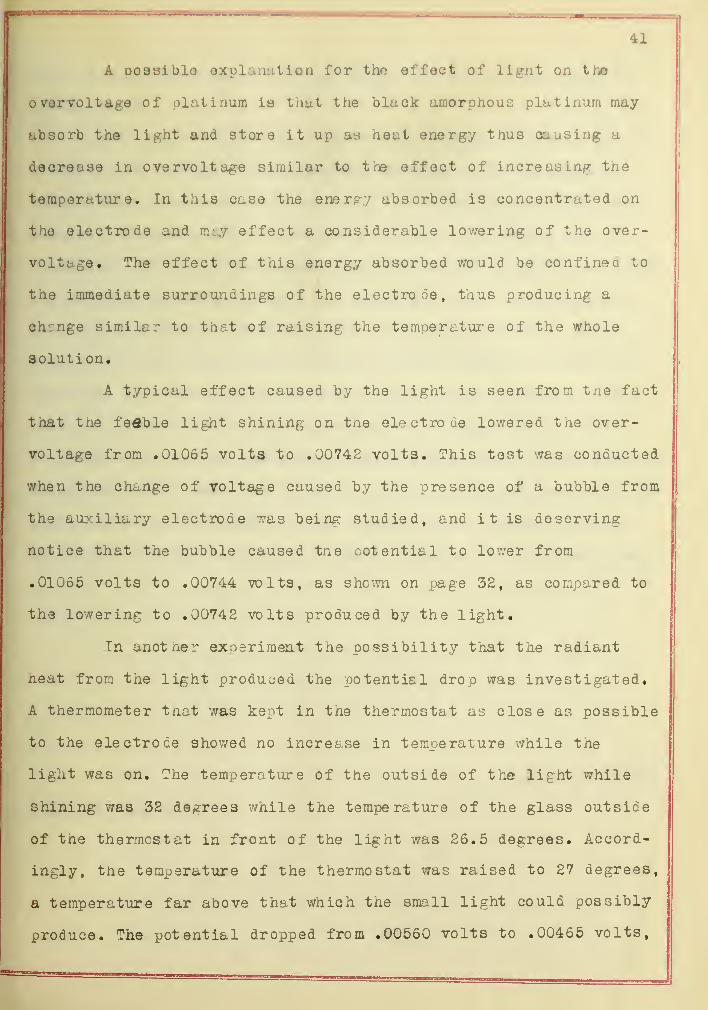
41
A possible explanation for the effect of light on the
overvoltuge of platinum is that the black amorphous platinum may
absorb the light and store it up as heat energy thus causing a
decrease in overvoltage similar to tne effect of increasing the
temperature. In this case the fnergy absorbed is concentrated on
the electrode and m-y effect a considerable lowering of the over-
voltage. The effect of this energy absorbed would be confined to
tne immediate surroundings of the electrode, thus producing a
chcnge similar to that of raising the temperature of the whole
soluti on.
A typical effect caused by the light is seen from tne fact
tnat tne feeble light shining on tne electrode lowered the over-
voltage from .01065 volts to .00742 volts. This test was conducted
when the change of voltage caused by the presence of a bubble from
the auxiliary electrode was being studied, and i t is deserving
notice tnat the bubble caused tne ootential to lower from
.01065 volts to .00744 volts, as shewn on page 32, as compared to
the lowering to .00742 volts produced by the light.
In anotner experiment the possibility tnat the radiant
neat from tne light produced the potential drop was investigated.
A thermometer tnat was kept in the thermostat as close as possible
to the electrode showed no increase in temperature while the
light was on. The temperature of the outside of tne light while
shining was 32 degrees while the temperature of the glass outside
of tne thermostat in front of the light was 26.5 degrees. Accord-
ingly, tne temperature of the thermostat was raised to 27 degrees,
a temperature far above that which the small light could possibly
produce. The potential dropped from .00560 volts to .00465 volts,

42
while the decrease caused by the light was from .00560 volts to
.00261 volts.
Not only did the light cause the voltago to lower, but it
also nad the effect of stopping the bubbling on the electrode
wnen bubbles were being evolved at a slow rate, six or less nor
minute. A representative experiment to show this effect will be
explained. The light was turned on at 11:06 and at 11:09 tne babbl-
ing on the electrode stopped; tne light was then turned off and
at 11:13 the bubbling started again. It took, therefore, tnree
minutes for the light wnile snining on the electrode to stop the
bubbling, and four minutes with no light on the electrode before
bubbling started again. This starting and stopping of bubbling
was gradual. When the light was turned on the speed of the bubbling
slowly decreased until the bubbling entirely stopped, and with the
light off after the bubbling had started again, fully five min-
utes were required before the bubbling reached its original speed.


43
Summary.
1. The smaller values of nydrogen overvoltage are due to
the energy necessary to form the gas into small bubbles. It is
tnus related to the suri^ce tension at the gas-electrolyte bound-
ary.
2. Besides forming buDules hydrogen liberated can go
directly into solution.
3. For the evolution of hydrogen bubbles at low overvolt-
ages on an electrode, a hydrogen gas nucleus must be present.
4. "Undervoltages" can exist, and are probably due to the
formation of hydrides with the metal of the electrodes.
5. A rise of temperature decreases overvolt ages. This
pnenomena seems to be connected witn the decrease of the surface
tension of the electrolyte.
If the monatomic tneory for overvoltage is true, an
increase of temperature ought to cause a greater decrease of
overvoltage than was obtained.
6. Light loweres the overvoltage of platinized platinum.
7. The claim of Thiel and Breuning7 that platinized
platinum has a zero (0.000000 volts) hydrogen overvoltage has not
been confirmed.


44
Bibliography.
1. Leblano Zeit. Phys. Chem., 8, 299, (1891)
2. Nernst Berichte deut. diem. Ges. , 30, 1547, (1897)
3. Nernst Zeit. Elect. Chem., 6, 37, (1899)
4. Caspari Zeit. Phys. Chem., 30, 89, (1899)
5. Mtlller Zeit. anorg. Chem., 26, 1, (1901)
6. Coehen and Dannenberg Zeit. Phys. Chem., 38, 609, (1901)
7. Thiel and Breuning Zeit. anorg. Chem., 83, 329, (1913)
8. Lewis and Jackson Zeit, Phys. Chem., 56, 193, (1906)
9. Bennett and Thompson J. Phys. Chem., 20, 296, (1916)
Trans. Am. Elect. Chem. Soc, 29, 24, (1916)
10. Bancroft Trans. Am. Elect. Chem. Soc, 29, 5, (1916)
11. Langmuir J. Am. Chem. Soc, 34 1 860, 1310, (1912)
37, 417, 457, (1915)
12. LeBlanc Text on Electrochem.
13. Hewbery J. Chem. Soc, 109, 1359, (1916)
14. Fowler Trans. Roy. Soc, 209, 447, (1909)
15. Newbery J. Chem. Soc, 105, 2419, (1914)
16. Ellis, J.H. J. Am. Chem. Soc, 38, 737, (1916)
t f

I wish to take this opportunity of
expressing to Dr. D. A. Maclnnes my deep-
est appreciation for the kind aid and
many helpful suggestions offered during
this investigation, and for his interest
shown during this work.


![Critical ideals of graphs - CINVESTAV · G], the determinantal ideals of L(G;X G) are ideals on Z[X G] which we call critical ideals of G. Next we study how the critical ideals encode](https://static.fdocuments.us/doc/165x107/5fa3f5e4efc6f36b113a3fab/critical-ideals-of-graphs-cinvestav-g-the-determinantal-ideals-of-lgx-g-are.jpg)