A STUDY OF LIPID PROFILE IN CHRONIC KIDNEY DISEASE...
97
28 A STUDY OF LIPID PROFILE IN CHRONIC KIDNEY DISEASE PATIENTS DISSERTATION submitted in partial fulfilment of requirements for M.D. DEGREE EXAMINATION BRANCH- I (GENERAL MEDICINE) MADRAS MEDICAL COLLEGE CHENNAI – 600 003 THE TAMIL NADU DR. M.G.R. MEDICAL UNIVERSITY CHENNAI. MARCH 2009
Transcript of A STUDY OF LIPID PROFILE IN CHRONIC KIDNEY DISEASE...

28
A STUDY OF LIPID PROFILE IN CHRONIC
KIDNEY DISEASE PATIENTS
DISSERTATION
submitted in partial fulfilment of requirements for
M.D. DEGREE EXAMINATION BRANCH- I (GENERAL MEDICINE)
MADRAS MEDICAL COLLEGE CHENNAI – 600 003
THE TAMIL NADU DR. M.G.R. MEDICAL UNIVERSITY CHENNAI.
MARCH 2009

29
BONAFIDE CERTIFICATE
Certified that this dissertation is the bonafide work of
Dr.A.VINOTH on “A STUDY OF LIPID PROFILE IN
CHRONIC KIDNEY DISEASE PATIENTS ” during his M.D.
(General Medicine) course from May 2006 to March 2009 at the
Madras Medical College and Government General Hospital,
Chennai.
Director & Professor, Institute of Internal Medicine, Madras Medical College & GGH, Chennai- 600 003
Additional Professor, Institute of Internal Medicine,
Madras Medical College & GGH, Chennai- 600 003
DEAN Madras Medical College,
Government General Hospital, Chennai-600 003.

30
DECLARATION
I solemnly declare that the dissertation titled “A STUDY OF
LIPID PROFILE IN CHRONIC KIDNEY DISEASE PATIENTS”
is done by me at Madras Medical College & Govt. General Hospital,
Chennai during 2007-2008 under the guidance and supervision of
Prof. R.SUKUMAR, M.D.,
This dissertation is submitted to The Tamil Nadu Dr.M.G.R.
Medical University towards the partial fulfillment of requirements
for the award of M.D. Degree (Branch I) in General Medicine.
Dr.A.VINOTH Place: M.D. General Medicine, Date: Postgraduate Student, Institute of Internal Medicine,
31
ACKNOWLEDGEMENT
I am grateful to our beloved Dean, Prof. Dr.T.P.KALANITI
M.D ., Madras Medical College for allowing me to do the study in
this noble institution.
I express my sincere thanks to our beloved Professor & Director
of the Institute of Internal Medicine, PROF.Dr.C.RAJENDIRAN M.D.,
Madras Medical College, Chennai for his constant support, advice and
guidance to complete this study.
I express my sincere thanks to my beloved Chief
PROF. Dr.R.SUKUMAR M.D., Additional Professor of Medicine,
Institute of Internal Medicine, Madras Medical College, Chennai for
his continuous encouragement, kindness and guidance.
I express my heartful thanks to our unit Asst. Professors,
Dr.R.S.A.Alexander M.D., Dr.S.Deepa M.D., Dr.Kani Sheik
Mohammed M.D., Dr.S.Sivakumar M.D., for their assistance &
guidance.
I express my sincere thanks to Former Professor & Director,
Institute of Biochemistry Dr. Renuka M.D., M.N.A.M.S., Ph.D and
Prof. and Director Dr. Pragna B Dolia M.D., for allowing me to
utilize their laboratory services.
I am indebted to my patients and persons who volunteered as
controls without whom I could not have completed this work.

22
CONTENTS
S.No Title Page No
1. Acronyms
2. Introduction 1
3. Aims of the study 3
4. Review of literature 4
5. Materials and methods 29
6. Results and observations 37
7. Discussion 47
8. Conclusion 54
9. Limitations of the study 55
10. Appendix
Bibliography
Ethical committee certificate
Proforma
Lipid Profile Charts
Master Chart

1
INTRODUCTION
Hyperlipidemia, one of the important risk factor of
atherosclerosis, is an abnormality commonly encountered in
patients with chronic kidney disease. The increased risk of
atherosclerotic cardiovascular disease may be due to hyperlipidemia.
Other risk factors predisposing to cardiovascular disease in chronic
kidney disease patients include diabetes, hypertension, obesity and
smoking.
Dyslipoproteinemia is an additional risk factor for the
progression of renal insufficiency. It has been shown in a large
population of patients with chronic kidney disease that the rate of
progression was significantly higher in hyperlipidemic patients
compared with normolipidemic patients1.
The pathogenesis of chronic allograft dysfunction is complex
and results from various factors. Among them hyperlipidemia is an
important factor implicated in the development and progression of
chronic allograft dysfunctions. In an observational study, it was
found that hypertriglyceridemia and the Lp (a) >30mg/dl before and

2
after transplantation were independent risk factors for chronic
allograft dysfunction2.
Factors such as race, gender, age and diabetic status
potentially confound the interpretation of the lipoprotein profile3.
Indian studies on lipid abnormalities in chronic kidney
disease have not been consistent. Sharma et al.,4 Kunde et al.,5
found no hyperlipidemia whereas Gupta et al.,6 Das et al.,7
observed hypertriglyceridemia and reduced HDL levels in CKD
patients as in western studies. In view of inconsistency and limited
evidence in southern part of this country it was decided to study the
lipid profile in our patients with chronic kidney disease.

3
AIMS OF THE STUDY
1. To estimate various lipid profile abnormalities in Chronic
Kidney Disease patients.
2. To identify the predominant lipid pattern in chronic kidney
disease patients.
3. To study the correlation between the serum creatinine
levels and lipid abnormalities in Chronic Kidney Disease.
4. To estimate the prevalence of Left Vetricular Hypertrophy
and Ischemic Changes in patients with chronic kidney
disease.

4
REVIEW OF LITERATURE
CHRONIC KIDNEY DISEASE DEFINITION:8,9
K/DOQI - Kidney Disease Outcome Quality Initiative
definition of CKD is
1. Kidney damage for >3 months is defined by structural
or functional abnormalities of the kidney with or
without reduction in GFR manifest either by
a. pathological abnormalities or
b. Markers of kidney damage including abnormalities
of composition of blood or urine or abnormalities in
imaging tests.
2. GFR <60ml/min/1.73m2 for >3 months with or without
kidney damage.
HISTORY:
The word “Uremia” is coined by Piorry & L.Heritier in 1840.
Association between lipid abnormalities and pathogenesis of renal
disease was first suggested by virchow in 1860. He described
extensive fatty degeneration in autopsy tissue from patients with
Bright’s disease.

5
EPIDEMIOLOGY:
In India, with a population of one billion and an estimated
incidence of ESRD of 100 per Million Population, approximately
100,000 patients develop ESRD each year. Of these 90% never see
a nephrologist. Of the 10,000 patients who do consult a
nephrologist renal replacement therapy started in 90%; the other
10% are unable to afford any form of renal replacement therapy10.
The majority of the 9000 patients who receive renal
replacement therapy are begun on hemodialysis. Of the 8500
patients, who are on hemodialysis, about 60% lost their follow-up
within 3 months. Approximately 9-13% of patients die within one
year while on treatment11,12.
About 17-23% of patients undergoing renal transplantation
should be on dialysis for 2-3 months for pre-transplant stabilisation.
Although 4% of patients remain on maintenance HD, very few stay
on maintenance HD longer than 24 months11,12.

6
Patients mobilise the resources for the expenditure from the
following13:
1. 4% - Pooled family resources
2. 60% - Employer
3. 20% - Selling property and jewels
4. 20% - Loans
ETIOLOG Y
Common causes of ESRD in India are
Disease % Center A12
Center B14
Center C15
CGN (Chronic glomerulo nephritis) 28.6 36.64 18.20
Diabetic nephropathy 23.2 23.84 26.76
Chronic interstitial nephritis 16.5 14.35 21.05
Hypertensive nephrosclerosis 4.1 13.4 10.06
Obstructive nephropathy 6.4 – 1.22
Adult polycystic kidney disease 2.0 3.53 2.07
Unknown 16.2 3.76 –
In developing countries like India, majority of patients die
without receiving any form of dialysis. The number of patients
accepted by dialysis programs is about
80 pmp - Egypt16
20 pmp - Malaysia17
3-5 pmp - India & China18

7
PATHOPHYSIOLOGY OF CHRONIC KIDNEY DISEASE19
The pathophysiology of CKD involves two broad sets of
mechanisms of damage (1) Initiating mechanisms specific to
underlying etiology (Immune complexes and mediators of
inflammation in certain type of glouerulonephritis, or toxin
exposure in certain diseases of the renal tubules and interstitium)
and 2) a set of progressive mechanisms involving hyperfiltration
and hypertrophy of the remaining viable nephrons, that are a
common consequence following long term reduction of renal mass,
irrespective of underlying etiology. The responses to reduction in
nephron number are mediated by vasoactive hormones, cytokines,
and growth factors. Eventually, these short term adaptations of
hypertrophy and hyperfiltration become maladaptive as the
increased pressure and flow predisposes to sclerosis and dropout of
remaining nephrons. Increased intrarenal activity of the renin-
angiotensin axis appears to contribute both to initial adaptive
hyperfiltration and to the subsequent maladaptive hypertrophy and
sclerosis, the latter, in part, owing to the stimulation of
transforming growth factor β;(TGF β). This process explains why a
reduction in renal mass from an isolated insult may lead to a

8
progressive decline in renal function over many years.
Stages of CKD19
National Kidney Foundation (KDOQI) laid guidelines for the
definition of stage of CKD.
Stages GFR, ml/min per 1.73m2
0 >90a
1 >90b
2 60-89
3 30-59
4 16-29
5 <15
a) With risk factors for CKD (HTN, DM, autoimmune
disease, old age, African ancestry, family history, H/o
ARF, Proteinuria, abnormal urinary sediment, abnormal
urinary test)
b) With demonstrated kidney damage e.g. persistent
proteinuria, abnormal urinary sediment, abnormal blood
and urine chemistry, abnormal imaging studies.

9
CLINICAL FEATURES:
Fluid and electrolyte disturbances
• Volume expansion
• Hyponatremia
• Hyperkalemia
• Hyperphosphatemia
Endocrine - Metabolic disturbances
• Secondary hyperparathyroidism
• Adynamic bone disease
• Vit. D deficient osteomalacia
• Carbohydrate resistance
• Hyperuricemia
• Hypertriglyceridemia
• Increased Lp (a) levels
• Decreased high density lipoprotein level
• Malnutrition
• Amenorrhea ,infertility and sexual dysfunction
• β2 microglobulin associated amyloidosis

10
Neuromuscular Disturbances
• Fatigue
• Sleep disorders
• Headache
• Impaired mentation
• Lethargy
• Asterixis
• Muscular rigidity
• Peripheral neuropathy
• Restless leg syndrome
• Myoclonus
• Seizures
• Coma
• Muscle cramps
• Dialysis disequilibrium syndrome
• Myopathy
Cardiovascular and pulmonary complication

11
• Arterial hypertension
• Congestive heart failure or pulmonary edema
• Pericarditis
• Hypertropic or dilated cardiomyopathy
• Uremic lung
• Accelerated atherosclerosis
• Hypotension and arrythmias
• Vascular calcification
Dermatologic Disturbances
• Pallor
• Hyperpigmentation
• Pruritus
• Ecchymoses
• Fibrosing dermopathy
• Uremic frost
Gastro Intestinal disturbances

12
• Anorexia
• Nausea and vomiting
• Gastroenteritis
• Peptic ulcer
• Gastrointestinal bleeding
• Idiopathic ascites
• Peritonitis
Hematologic and Immunologic disturbances
• Anemia
• Lymphocytopenia
• Bleeding diathesis
• Increased susceptibility to infection
• Leukopenia
• Thrombocytopenia
Treatment
The optimal timing of therapy is usually well before a
measurable decline in GFR and certainly before CKD is

13
established.
Clinical Action Plan19
GFR ml/min/ 1.73m2
Action a
Kidney damage
with normal or
increased GFR
>90 Diagnosis and treatment, treatment
of comorbid conditions, slowing
progression, CVD risk reduction
Kidney damage
with mild
decrease in GFR
60-89 Estimating progression
Moderate ↓ GFR 30-59 Evaluating and treating
complications
Severe ↓ GFR 15-29 Preparation for kidney replacement
therapy
Kidney Failure <15 (or dialysis)
Kidney replacement
(if uremia present)
a-includes actions from preceding stages.
Renal replacement therapy includes both dialysis and
transplantation.
Slowing the progression of renal disease in CKD can be
accomplished by the following.

14
1. Diet - Protein restriction 0.6-0.75g/kg/day
- Low salt 60-80mmol/day
2. Blood pressure control - Bp <130-135/80-85mmHg
if proteinuria <1g/24 hr
Bp <125/75 mmHg if proteinuria >1g/24 hr
3. Proteinuria –to reduce to <1g/24hr
use an ACE inhibitor or angiotensin receptor antagonist
4. Glycemic control in DM - Hb AIC < 7%
5. Dyslipidemia -Control individual lipid fractions
6. Smoking - cessation
7. Alcohol - Restriction to less than 2 drinks per day.
DYSLIPIDEMIA:
Dyslipidemia is empirically defined as plasma lipids that are
associated with adverse outcomes such as cardiovascular disease20.
Normal structure and fuction of lipoprotein:
Lipoproteins & Apolipoproteins:
• Lipoproteins consist of lipids and proteins known as
apolipoproteins (apo) with the main function of

15
transporting water insoluble lipids such as cholesterol
or triglycerides in plasma, from sites of absorption (gut)
and/or synthesis (liver) to the sites of utilization
(peripheral tissues) or processing.
• In addition to their role in the formation of lipoproteins
apolipoproteins perform a variety of functions in the
metabolic conversions of lipoproteins including
secretion, retardation of premature removal, recognition
of binding & removal sites and activation of lipolytic
enzymes.
Traditionally, lipoproteins are classified on the basis of their
density properties21
1. Chylomicrons (<0.94g/ml density)
2. Very low density (0.94 - 1.006g/ml density)
3. Intermediate density (1.006 - 1.019 g/ml density)
4. Low density (1.019 - 1.063 g/ml density)
5. High Density (1.063 - 1.21 g/ml density)
LIPOPROTEIN PATHWAYS:
Lipoprotein pathways are divided into exogenous pathway
and endogeneous pathway.

16
EXOGENOUS PATHWAY:
In this pathway chylomicrons transport dietary lipids that are
absorbed from the intestine via the systemic circulation.
Chylomicrons are triglyceride rich and normally catabolized within
minutes by the endothelium - associated lipoprotein lipase (LPL),
thereby generating free fatty acids (FFA), which are taken up by the
liver, muscle and adipose tissues. During this catabolic process,
chylomicrons diminish in size and become chylomicron remnants,
which are taken up by the liver via the low-density lipoprotein
(LDL) receptor and the LDL receptor - related protein (LRP).
ENDOGENOUS PATHWAY 22
In this pathway, the liver assembles and secretes triglyceride
- rich VLDL particles, which transport triglycerides from the liver
to peripheral tissues. After hydrolysis of the triglycerides by LPL
(Lipoprotein lipase) the VLDL particles are reduced to intermediate
density lipoproteins which can be taken up by the liver or can be
further hydrolysed to LDL particles. During this conversion, the
particles become depleted of triglycerides but retain considerable
amounts of cholesterol .
LDL transports cholesterol primarily to hepatocytes but also

17
to peripheral tissues. APO B-100 is responsible for the recognition
and uptake of LDL by the LDL receptor, which clears
approximately 60-80% of LDL in normal individuals. The
remaining LDL is removed by other specific receptors such as LRP
or by scavenger receptors23.
Oxidized LDL (OX-LDL) in particular can be taken up by
scavenger receptors on macrophages and vascular smooth muscle
cells. When these macrophages become overloaded with cholesterol
esters, they transform into foam cells, which is a major step in the
development of atherosclerosis. When LDL becomes lipid depleted
small dense LDL (sd LDL) is generated which has lower affinity
for the LDL receptor but is more susceptible to oxidative
modification. Thus sd LDL is more atherogenic than larger LDL
particles24.
High-density lipoprotein plays an important role in reverse
cholesterol transport, which shuttles cholesterol from peripheral
cells to the liver an important step that relieves the peripheral cells
from cholesterol burden25. HDL precursor particles are secreted by
the liver and intestine and can absorb free cholesterol from cell
membranes; a process that is mediated by ATP binding

18
cassette transporter-1, apoA-I, apoA-IV. ApoA-I is the major
apolipoprotein of HDL and activates lecithin: Cholesterol
acyltransferase which esterifies the accepted free cholesterol for
transport.
By acquisition of additional apolipoproteins, cholesterol
esters and triglycerides, HDL3 particles are transformed into larger
HDL2 particles26. Reverse cholesterol transport can take three
different routes. First large HDL particles with multiple copies of
Apo E can be taken up by the liver via the LDL receptor. Second,
the accumulated cholesterol ester from HDL can be selectively
taken up by the liver mediated by scavenger receptor B127. This
receptor is expressed primarily in liver and nonplacental
steroidogenic tissues. Third, cholesterol esters are transferred by
the cholesteryl ester transfer protein from HDL to triglyceride rich
lipoproteins. Plasma HDL cholesterol levels are influenced by the
complexity of these reverse cholesterol transport process.
Disturbances in the concentration of apoproteins, function of
enzymes, transport proteins, receptors, other lipoproteins and the
clearance from plasma can have a major impact on the anti
atherogenic properties of HDL.

19
Pathophysiology of dyslipidemia in CKD28-31
Plasma triglycerides are predominantly found in two types of
lipoproteins in normal individuals. These are chylomicrons which
are assembled in the intestine for the transport of dietary fatty
acids, and VLDL, which are produced in the liver for the transport
of endogenous fatty acids32-34.
Elevated triglycerides are the consequence of both high
production rate and a low fractional catabolic rate35.
Increased production of triglyceride rich lipoproteins is
possibly due to
1. Impaired carbohydrate tolerance.
2. Enhanced hepatic VLDL synthesis.
Reduced fractional catabolic rate is due to decreased activity
of two endothelium associated lipases namely lipoprotein lipase and
hepatic triglyceride lipase which have the primary physiologic
function of clearing triglycerides into FFA.
The cause of decreased lipase activities in uremia is thought
to be depletion of the enzyme pool induced by

20
a) Heparinisation in hemodialysis36.
b) Increase in the plasma apoc-III/apo-c II ratio37.
c) Presence of other lipase inhibitors in the plasma.
Impaired lipase activities in uremic plasma may also be
caused by a decrease in LPL synthesis as a result of secondary
hyperparathyroidism or suppressed insulin level38.
HIGH DENSITY LIPOPROTEINS:
Patients with CKD generally have reduced plasma HDL
cholesterol concentration compared with nonuremic individuals.
Because of the low apo-AI level and decreased LCAT activity, the
esterification of free cholesterol and hence the conversion of HDL3
to HDL2 are diminished in uremia. This decreased ability of the
HDL particles to carry cholesterol leads to impairment in the
reverse cholesterol transport from peripheral cells to the liver,
thereby burdening the vasculature with cholesterol and promoting
atherosclerosis39-41.
Paraoxanase, a component of HDL, inhibits the oxidation of
LDL. Plasma paraoxanase activity is reduced in patients with
CKD42, thereby predisposing the LDL and possibly also

21
HDL particles to oxidation. Further uremia associated inflammation
might convert HDL from an antioxidant into a prooxidant
particle43,44. All of these may contribute to atherogenesis in CKD.
LOW-DENSITY LIPOPROTEIN:
Elevated plasma LDL cholesterol concentration is common in
nephrotic syndromes. But it is not a typical feature of patients with
advanced chronic kidney disease, especially who are on
hemodialysis. But qualitative changes may occur in LDL in patients
with CKD and dialysis patients.
The proportion of small dense LDL and IDL which are
considered to be highly atherogenic, are increased. Sd LDL is a
subtype of LDL that has high propensity to penetrate the vessel
wall, becomes oxidized and triggers atherosclerotic process.
Since the hepatic lipase enzyme is decreased in HD patients,
which degrades VLDL to IDL, IDL accumulates in plasma45. IDL
and sd LDL have high affinity for macrophages, which theoretically
promote their entry into the vascular wall to participate in the
formation of foam cells and atherosclerotic plaques46-49.
A vicious cycle has been suggested in uremia in which the

22
decreased catabolism of IDL and LDL leads to their increased
plasma residence time and further modification of apo B contained
in these lipoproteins by oxidation, carbamylation and glycation.
These modifications lead to reduced recognition and binding of
those lipoproteins to LDL receptors50.
TOTAL CHOLESTEROL
In a prospective study51 in 73 non diabetic patients with
primary CKD,total cholesterol,LDL cholesterol and apolipoprotein
B were signifigantly associated with a rapid decline in renal
function.In another study52,among 104 patients with CKD who were
followed up for a mean of 4.1 years,total cholesterol and urinary
protein scores were positively related to the progression of renal
disease. In the Choices for Healthy Outcomes in Caring for ESRD
(CHOICE) study, which showed a nonsignificant negative association of
cardiovascular mortality with plasma total as well as non–HDL
cholesterol levels in the presence of inflammation and/or malnutrition ; in
contrast, there was a positive association between total and non–HDL
cholesterol and mortality in the absence of inflammation or malnutrition.
These observations are compatible with the hypothesis that the inverse
association of total cholesterol levels with mortality in dialysis patients is

23
mediated by the cholesterol-lowering effect of malnutrition and/or
systemic inflammation and not due to a protective effect of high
cholesterol concentrations53,54.But most studies state that
hypercholesterolemia is not a common feature of CKD.It is commonly
found in nephrotic syndrome.
LIPOPROTEIN (a)
Lipoprotein (a) is an LDL-like lipoprotein that consists of
apo(a) that is covalently bound to an LDL particle. There are two
isoforms of Lp(a) (i) large apo (a) isoform and (ii) small apo (a)
isoform55.
Most but not all studies showed that isoform specific
increase in plasma Lp(a) levels seen in non-nephrotic patients with
CKD56-61.
Lp(a) contains 2 apolipoproteins. The production rates of
apo(a) and apo(b) were normal in CKD patients whereas fractional
catabolic rate of these apolipoproteins was significantly reduced in
these patients. This resulted in longer residence time in plasma of
almost 9 days for apo(a), compared with 4.4 days in control
subjects. This decreased clearance is likely the result of loss of

24
kidney function in HD patients62.
DYSLIPIDEMIA IN HEALTHY & SPECIAL POPULATION:
Dyslipidemia in Young healthy adult Indian population:
A study done by A.M. Sawant et al63 in 2006 at P.D. Hinduja
Hospital, Mumbai, India showed that the total cholesterol
concentration >200mg/dl was found in 38.7% of males and 23.3%
of females. HDL-C was abnormally low in 64.2% males and 33.8%
females. The increase in prevalence of hypercholesterolemia and
hypertriglyceridemia was more prominent in 31-40 age group than
in <30 age group.
Dyslipidemia of Diabetes64
In a hospital based study in Nagpur, India, the characteristic
pattern of lipoproteins in type 2 diabetes includes an increase in
triglycerides and decrease in HDL cholesterol. Concentrations of
LDL cholesterol in diabetic individuals do not differ significantly
from concentrations found in non-diabetic individuals but are
predominated by the small dense form of LDL. The small dense
LDL particles are more intrinsically atherogenic than the normal
larger and more buoyant LDL particles. Furthermore because of

25
their smaller mass, a greater number of LDL particles are contained
within the plasma of patients with small dense LDL, further
increase the atherogenic risk. This triad of lipid abnormalities
namely increased triglycerides and sd LDL and decreased HDL, has
been termed “Diabetic Dyslipidemia”.
Lipids in Haemodialysis and Peritoneal Dialysis65-68
HD patients usually display increased concentrations of intact
or partially metabolized triglyceride rich lipoproteins, reduced
serum levels of HDL cholesterol and elevated concentrations of
Lp(a). Total and LDL-cholesterol values are within normal limits or
reduced in this patient population whereas the sub fractionation of
apoliporotein B containing lipoproteins usually reveals of
predominance of small, dense LDL particles. Use of high flux
polysulfone membrane is accompanied by a significant reduction in
serum triglyceride levels as well as by an increase in apolipoprotein
AI, and HDL cholesterol levels . This improvement could be
attributed to an increase in the apolipoprotein C-II/CIII ratio which
increases the activity of lipoprotein lipase and facilitates the
intravascular lipolysis of triglyceride rich lipoproteins . Heparin,
used in HD, releases lipoprotein lipase from the endothelial surface

26
and thus its chronic use may result in lipoprotein lipase depletion
and defective catabolism of triglyceride rich lipoproteins.
It is well known that CAPD patients lose substantial amount
of proteins into peritoneal dialysate. This protein loss may, in turn,
stimulate hepatic production of albumin and cholesterol enriched
lipoproteins thus leading to elevated concentrations of LDL
cholesterol and Lp(a) . In addition, the absorption of glucose from
the dialysis fluid and the resultant increase in insulin levels may
enhance the hepatic synthesis and secretion of VLDL and possibly
that of other lipoproteins such as Lp(a) .
Lipids in renal transplant patients69
These patients have elevated values of total cholesterol ,
VLDL, LDL cholesterol as well as increased concentration of
triglycerides and apolipoprotein B . HDL cholesterol tends to
increase in post transplant period and this change is attributed to
the effects of corticosteroids. They also exhibit significant decrease
in the concentrations of Lp(a) after renal transplantation. It has
been shown that cyclosporine administration significantly increases
the concentrations of LDL-C and TGL while it reduces the serum

27
values of HDL cholesterol .
Treatment of dyslipidemia in CKD patients69
Data from studies conducted in individuals with CKD suggest
that the effect of these drugs on cardiovascular morbidity and
mortality in these patients is significantly influenced by the severity
of renal dysfunction. Thus in several large, prospective, placebo
controlled trials of statins, post hoc analyses of subgroups with
mild to moderate renal failure revealed a significant reduction in
cardiovascular morbidity and mortality . The use of statins as a first
line therapy for the prevention of ischemic events in dyslipidemic
individuals with CKD (stage 1-3) seems to be safe, reasonable and
evidence based.
It has been proposed that the failure of statins in ESRD
patients is due to the presence of micro inflammation and
malnutrition in these individuals .
Though fibrates induce shift in the LDL subfraction towards
larger and more buoyant particles , in patients with renal failure
they are associated with high risk of muscular toxicity . Fibrates
should be used only in the patients with CKD who exhibit

28
extremely elevated triglyceride values (>500mg/dl). In these cases
the risk of acute pancreatitis justifies the use of gemfibrozil as the
fibrate of choice in individuals with impaired renal function .
Efficiency of other drugs in patients with CKD and their
impact on the cardiovascular risk in these patients were not studied
well.

29
MATERIALS & METHODS
This study was conducted in 50 patients with chronic kidney
disease and 50 normal healthy persons.
All the patients in this study group were selected from the
outpatient department and those who were admitted to Institute of
Internal Medicine, Madras Medical College Hospital during
June2007 - June 2008. The controls were selected from the
outpatient department who were accompanying the patients.
STUDY DESIGN: Cross sectional observational study
INCLUSION CRITERIA FOR PATIENTS
1. Patients between age group of 15 to 80 years with chronic
kidney disease.
2. Patients with established chronic kidney disease were
selected irrespective of the etiology.
3. Patients who were on conservative or dialytic treatment for
chronic kidney disease.
4. Established renal failure was ensured by radiological
evidence or biochemical evidence for more than 3 months.

30
EXCLUSION CRITERIA
1. Patients with Acute renal failure and Nephrotic Syndrome
2. Who are on drugs affecting lipid metabolism like β
blockers, statins and oral contraceptive pills.
3. Female patients who were pregnant
Written consent was obtained from both patients and controls.
Detailed history regarding symptoms and duration of the
kidney disease, hypertension, diabetes, smoking, alcoholism, drug
intake and treatment were elicited. A detailed clinical examination
was performed in all patients. Blood pressure, renal function tests,
abdominal ultra sonogram and Electrocardiogram were done for all
patients.
After 12 hours of overnight fasting blood sample was taken
for lipid profile from patients and controls.
Patients with chronic kidney disease and controls included in
the study were matched according to age and the results were
analyzed.
LABORATORY METHODS FOR ESTIMATING LIPIDS

31
HDL-C Estimation: (Erba Mannheim - XL System packs)
HDL cholesterol was measured by using immunoinhibition
method. The reagent contains 2 parts. First reagent (R1) inhibits
lipoprotein fractions other than HDL-C. After adding reagent
2(R2), a blue colour complex develops. The intensity of blue color
complex formed at 593nm is proportional to the HDL-C in the
sample.
Principle
LDL, VLDL & Chylomicrons in the sample were complexed
with antibody present in the reagent 1 thereby HDL-C remains free
to react with reagent 2.
HDL cholesterol +H2O+O2 CHE & CO 4-Cholestenone+ Fatty Acid in reagent 2 + H2O2
H2O2 + DAOS + 4 AAP Peroxidase - Blue colored complex +2H2O
Cholesterol estimation (Autopack - Bayer)
Cholesterol was estimated by enzymatic method. The reagent
contains 2 parts. (R1 & R2). When R1 is added it forms hydrogen
peroxide. This in turn reacts with phenol in R2 and forms red
quinone. The intensity of red coloured complex is directly

32
proportional to the concentration of cholesterol in the sample. It is
measured at 500nm.
Principle:
Cholesterol ester +H2O Cholesterol Cholesterol + Fatty Acid Esterase in R1
Cholesterol+ O2 Cholesterol Cholesterol + H2O2 Oxidase in R1
H2O2+Phenol (R2) + 4 Aminoantipyrine (R1) � Red quinone + 4H2O
TGL Estimation (Bayer Diagnostics)
It was measured by enzymatic calorimetric method. The
reagent contains 2 parts. When R1 is added to the sample, H2O2 is
formed. This in turn reacts with R2 and forms red quinone. The
intensity of purple colour is directly proportional to the triglyceride
concentration in the sample and is measured at 546nm.
Principle:
Lipoprotein Triglycerides +H2O Glycerol + Fatty acid Lipase in R1
Glycerol Glycerol+ ATP Glycerol 3 Phosphate +ADP Kinase R1

33
GPO Glycerol 3 phosphate +O2 Dehydroxyacetone Phosphate in R1 + H2O2
Peroxidase 2H2O2+ 4 aminoantipyrine(R1) +ADPS(R2) Red quinone+4H2O
ADPS = N ethyl N sulfopropyl n-anisidine.
LDL was estimated by using Friedwald formula
LDL = Total cholesterol - (HDL-C + TGL/5)
Ultra sonogram showing reduced kidney size (<9cm) was
taken as radiological evidence of chronic kidney disease.
Electrocardiogram of all patients was studied in detail.
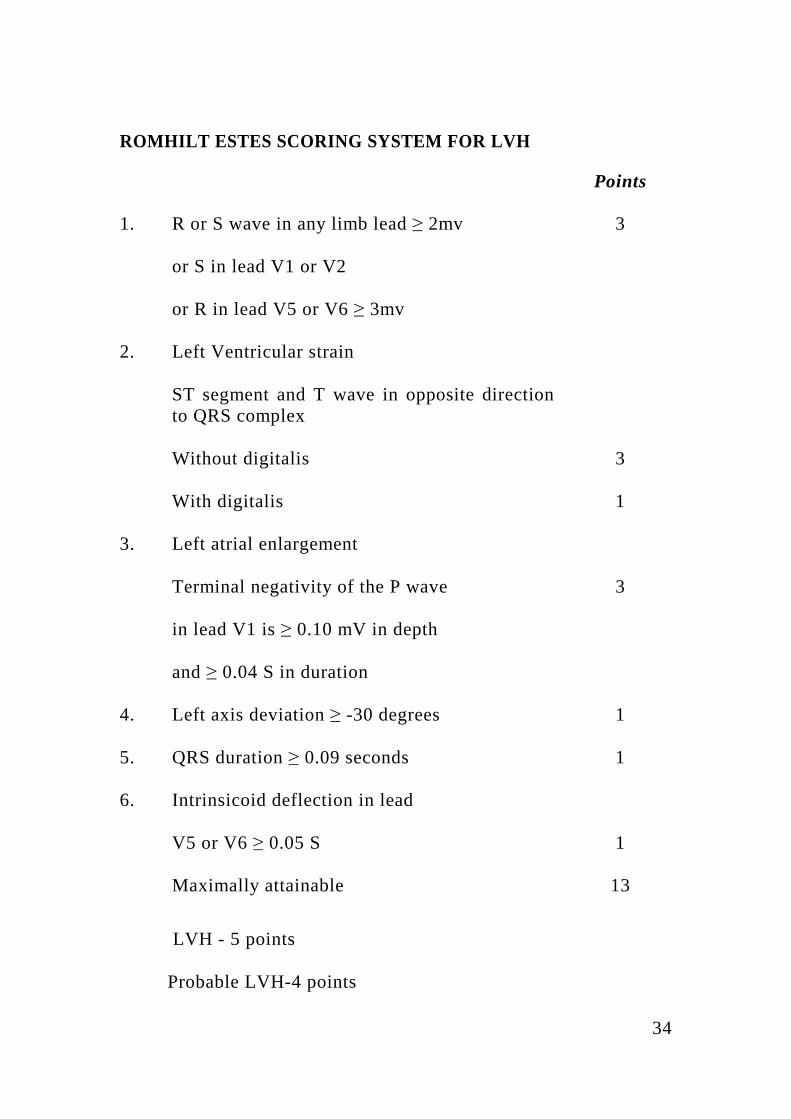
Romhilt- Estes criteria was applied for finding out left
ventricular hypertrophy.
34
ROMHILT ESTES SCORING SYSTEM FOR LVH
Points
1. R or S wave in any limb lead ≥ 2mv 3
or S in lead V1 or V2
or R in lead V5 or V6 ≥ 3mv
2. Left Ventricular strain
ST segment and T wave in opposite direction to QRS complex
Without digitalis 3
With digitalis 1
3. Left atrial enlargement
Terminal negativity of the P wave 3
in lead V1 is ≥ 0.10 mV in depth
and ≥ 0.04 S in duration
4. Left axis deviation ≥ -30 degrees 1
5. QRS duration ≥ 0.09 seconds 1
6. Intrinsicoid deflection in lead
V5 or V6 ≥ 0.05 S 1
Maximally attainable 13
LVH - 5 points Probable LVH-4 points

35
ATP - III NCEP guidelines were applied to the lipid profile.
ATP III CLASSIFICATION OF LDL, TOTAL AND HDL CHOLESTEROL AND TRIGLYCERIDES
TOTAL CHOLESTEROL
<200 Desirable
200-239 Borderline high
>240 High
LDL CHOLESTEROL
<100 OPTIONAL
100-129 Near or above normal
130-159 Border line High
>160 High
HDL CHOLESTEROL
<40 Low
>60 High
TRIGLYCERIDES
<150 Normal
150-199 Borderline high
200-499 High
≥500 Very high

36
In this study
LDL > 130 mg/dl
HDL < 40 mg/dl
TGL > 200 mg/dl
TC > 240 mg/dl were considered abnormal
STATISTICAL METHODS
Mean values were obtained for LDL, HDL, TGL & Total
cholesterol separately. Then standard deviations were calculated for
each category of observations for both study and control group.
Mean deviation, standard error of difference between two means
was calculated. If the standard error of difference between two
means is more than two times that of actual difference between two
means it will be taken as significant value. Students T test was
performed & T value was obtained. P value from t value was
calculated. P value of <0.05 was considered significant

37
RESULTS AND OBSERVATIONS
AGE DISTRIBUTION
Age of the patients varied from 14 yrs to 80 yrs. Majority of
patients fall in the age group between 26-55 years. Seventy two
percentage of people contribute this group.
AGE DISTRIBUTION IN PATIENTS
Age in years No. of Patients Percentage
15-25 2 4%
26-35 13 26%
36-45 11 22%
46-55 12 24%
56-65 10 20%
66-75 1 2%
>75 1 2%
SEX DISTRIBUTION
Males constitute 34(68%) and females constitute 16(32%) in
this study.
EDUCATIONAL STATUS
Majority of patients were illiterate (23 persons) (46%).
Patients studied higher than HSc were 6 persons (12%). Others
studied between 5th std to 10th std.

38
OCCUPATION
Patients in this study belonged to low socioeconomical status
which is being reflected by their occupations. A quarter of the
patients were doing agriculture or agriculture related profession.
Most women were home makers.
PERSONAL HABITS
In this study 40% (20 patients) of the patients were smokers
and 42 % (21 patients) were alcoholics.
RENAL PARAMETERS
Lowest urea value found in these patients was 17mg/dl and
the highest was 230 mg/dl. Creatinine values ranged between 0.5
mg/dl to 22.6 mg/dl. Mean values of creatinine was 6.74 ± 4.77
mg/dl.
BLOOD PRESSURE READINGS
Patients with blood pressure of more than 140/90 were
considered hypertensives. Most patients (39 patients) were
hypertensives at the time of presentation. Only 11 patients had
blood pressure less than 140/90mmHg.
DIABETIC STATUS

39
It was found that 22 patients (44%) were diabetic and their
random blood sugar levels ranged from 51mg/dl to 388 mg/dl.
TREATMENT SCENARIO
Among the 50 patients, 33 patients (66%) were on
conservative treatment only, 10 patients (20%) received peritoneal
dialysis, 7 patients (14%) received hemodialysis. Out of the 10
patients who underwent PD, 7 patients underwent PD earlier than 1
month ago and only 3 patients were treated with PD during the
time of admission. In the HD group, 4 patients underwent dialytic
treatment a week before admission whereas other 3 received more
than a month ago. 66% patients were treated with drugs only.
During our study no patients were admitted with history of previous
transplantation.
RADIOLOGICAL EXAMINATION
Radiological examination was done by abdominal ultra
sonogram. In 38 patients the kidney size was less than 9cm in one
or both kidneys. Rest of them (12 patients) showed normal kidney
size in USG.
ECG RESULTS

40
Patient’s electrocardiograms were analysed. It was found that
15 patients (30%) showed left ventricular hypertrophy. 10 patients
(30%) showed ischemic changes. 3 patients showed tall peaked T
waves.
ECG CHANGES IN CKD PATIENTS (STUDY GROUP)
Type of ECG changes Males Females Combined
LVH 10(20%) 5(10%) 15(30%)
Ischemia 6(12%) 4(8%) 10(20%)
CKD PATIENTS WITH LVH SHOWING LIPID ABNORMALITIES (STUDY GROUP)
Type of lipid Disorders Number of Patients
(out of 15) Percentage
Elevated Cholesterol 3 20%
Elevated Triglycerides 4 27%
Decreased HDL 10 67%
Increased LDL Cholesterol 10 67%
41
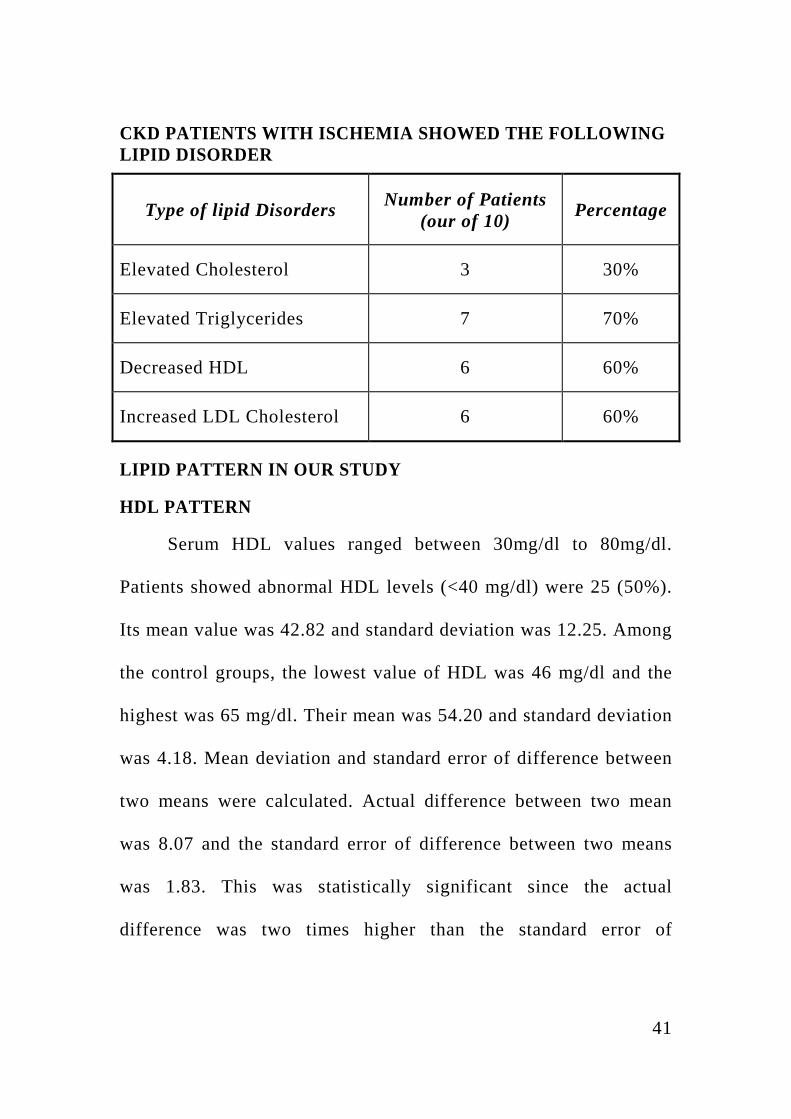
CKD PATIENTS WITH ISCHEMIA SHOWED THE FOLLOWING LIPID DISORDER
Type of lipid Disorders Number of Patients (our of 10)
Percentage
Elevated Cholesterol 3 30%
Elevated Triglycerides 7 70%
Decreased HDL 6 60%
Increased LDL Cholesterol 6 60%
LIPID PATTERN IN OUR STUDY
HDL PATTERN
Serum HDL values ranged between 30mg/dl to 80mg/dl.
Patients showed abnormal HDL levels (<40 mg/dl) were 25 (50%).
Its mean value was 42.82 and standard deviation was 12.25. Among
the control groups, the lowest value of HDL was 46 mg/dl and the
highest was 65 mg/dl. Their mean was 54.20 and standard deviation
was 4.18. Mean deviation and standard error of difference between
two means were calculated. Actual difference between two mean
was 8.07 and the standard error of difference between two means
was 1.83. This was statistically significant since the actual
difference was two times higher than the standard error of

42
difference between two means. T value was calculated using
student’s t test. It was 6.2169. P value (<0.05) was statistically
significant. It showed that there was a significant reduction in
HDL-C levels in patients with CKD than that of controls.
MEAN AND STANDARD DEVIATION OF LIPID FRACTIONS IN
50 CKD PATIENTS IN THE STUDY
Total
Cholesterol mg/dl
Triglycerides mg/dl
Low Density
Lipoprotein mg/dl
High Density
Lipoprotein mg/dl
Mean 209.3 171.2 131.7 42.82
Standard Deviation
42.9 86.45 25.71 12.25
MEAN AND STANDARD DEVIATION OF LIPID FRACTIONS IN 50 CONTROLS
Total
Cholesterol mg/dl
Triglycerides mg/dl
Low Density
Lipoprotein mg/dl
High Density
Lipoprotein mg/dl
Mean 185.2 102.2 112.5 54.20
Standard Deviation
15.2 7.75 13.42 4.18

43
STANDARD ERROR OF DIFFERENCE BETWEEN TWO MEANS AND P VALUES
Total
Cholesterol mg/dl
Triglycerides mg/dl
Low Density
Lipoprotein mg/dl
High Density
Lipoprotein mg/dl
Standard error of Difference between two means
6.44 12.28 3.61 1.83
P values <0.05 <0.05 <0.05 <0.05
LDL PATTERN
Lowest value of LDL 65 mg/dl and the highest value was
173mg/dl. Abnormally high LDL levels (>130mg/dl) were found in
22 patients and they constitute 44%. Their mean value was 131.7
mg/dl and standard deviation was 25.71.In controls, the mean and
SD were 112.5 and 13.42 (Range 85 - 150mg) respectively.
Standard error of difference between two means was 3.61.
Actual difference between two means was 19.2 which were (20%)
two times greater than the standard error of difference between two
means. Student t value was calculated (t=4.6813) and P value was
(< 0.05) significant.

44
TGL PATTERN
TGL value in our study group ranged between 95 mg/dl to
350 mg/dl. Range of TGL value in control group was 90mg/dl to
122mg/dl. TGL levels were abnormal in 24 patients (>200mg/dl).
Mean and standard deviation of study group were 171.2 and 86.45
respectively. In controls, the mean and standard deviation were
102.2 and 7.75. Student‘t’ test was performed and t value was
calculated (t=5.6212). P value was significant (P < 0.05)
TOTAL CHOLESTEROL
Range of TC levels in study group was 120mg/dl to 258
mg/dl. Lowest value in control group was 119 and the highest value
was 222mg/dl. Total cholesterol was more than 240mg/dl in 10
patients (20%). The mean values of study group and control group
were 209.3 and 185.2mg/dl respectively. Their standard deviations
were 42.9 and 15.2 respectively. Standard error of difference
between two means was obtained. It was 6.44 but the actual
difference was 124.1 which was more than two times higher than
that of standard error of difference between the two means. T value
was calculated (t =3.7442). P value was (P<0.05) significant.

45
CORRELATION STUDIES
CORRELATION BETWEEN LIPID FRACTIONS AND
SERUM CREATININE IN PATIENTS
Lipid Fraction Correlation coefficient with Creatinine P Value
TC +0.12469 N.S
TGL +0.23731 <0.05
HDL -0.28328 N.S
LDL +0.21606 N.S
N.S - Not Significant
Correlation coefficient between serum creatinine and various
lipid fractions were calculated.
Correlation coefficient between serum creatinine and LDL
was +0.216 which was a positive correlation.
Correlation coefficient between HDL and creatinine was –
0.286, which was a negative correlation.
Correlation coefficient between creatinine and TG was
+0.124 which was a positive correlation.

46
Correlation coefficient between creatinine and total
cholesterol was +0.12469, which was a positive correlation.
P values from the correlation coefficient were calculated.
P value of correlation coefficient between serum creatinine
and HDL levels was statistically significant in the study group. It
indicates that there is a negative linear relationship exists between
HDL values and serum creatinine (i.e. when creatinine value raises
HDL value falls).

47
DISCUSSION
In our study, most common lipid abnormalities found were
low HDL levels (50%) and hypertriglyceridemia (48%).
COMPARISON OF LIPID PROFILE BETWEEN OTHER STUDIES AND OUR STUDY
Studies TGL LDL HDL TC
Shah et al
S 222.78±90.08 109.63±36.51 52.69±16.36 211.33±40.33
C 121.78±64.89 140.33±23.34 44.22±10.33 184.11±18.79
Diana M lee et al
S 194.05±106.28 170.148±50.27 38.6±11.6 239.75±61.8
C 106.28±26.5 131.47±30.93 42.53±7.73 189.14±30.93
Our study
S 171.2±86.45 131.7±25.71 42.82±12.25 209.3±42.9
C 102±7.5 112.5±13.42 54.20±4.18 185.2±15.2
S- Study Group C-Control Group
DECREASED HIGH DENSITY LIPOPROTEIN LEVELS
The low HDL levels in patients with chronic kidney disease
in our study were consistent with Diana M Lee LG et al70 who
studied the lipid profile in CRF patients.

48
This low HDL cholesterol levels were also an independent
risk factor for the development of CKD in the Framingham off
spring study.
Several mechanisms may underlie these reductions in HDL
cholesterol levels, which is usually an indication of impaired
reverse cholesterol transport. Thus, uremic patients usually exhibit
decreased levels of apolipoprotein AI & AII (the main protein
constituent of HDL). Diminished activity of LCAT (the enzyme
responsible for the esterification of free cholesterol in HDL
particles) as well as increased activity of cholesterol ester transfer
protein that facilitates the transfer of cholesterol esters from HDL
to TGL rich lipoproteins that reduce serum concentrations of HDL
cholesterol69.
In MDRD study71, low HDL levels in CKD patients were one
of the independent risk factor for progression of kidney disease.
Though in our study the mean value was 42.82, it is significantly
less than the age matched healthy controls.

49
VARIOUS STUDIES ON PROGRESSION OF KIDNEY DISEASE AND ASSOCIATED PLASMA LIPID ABNORMALITIES:
Study Patients Number of patients
Follow up
Lipid
MDRD CKD 840 2.2
YRS
↓HDL
Samuelsson O
et al
CKD 73 3.2
YRS
↑TCh, ↑LDL,
↑ApoB
Locatelli et al CKD 456 2 YRS No relationship
Massy ZA et
al
CKD 138 12 YRS ↑TG, ↓HDL
ELEVATED TRIGLYCERIDES
Hypertriglyceridemia was observed in 48% of patients.
Triglyceride levels were significantly elevated in our study than
control group. Abnormal triglyceride values were found in 48% of
patients in our study. Shah et al72 & most western studies
demonstrated that hypertriglyceridemia was the abnormality found
in CKD patients. Gupta DK et al6, Das BS et al7, Bagdade J73,

50
Chan MK et al74 also found hypertriglyceridemia was the major
abnormality in their studies.
Hypertriglyceridemia represents an early feature of renal
failure. Indeed previous studies have shown that patients with
impaired renal function exhibit increased concentrations of
triglycerides even though serum creatinine levels were within
normal limits.
In addition, individuals with renal insufficiency, usually
display abnormal increase in serum triglycerides levels after a fat
meal (post prandial lipemia). Experimental studies revealed that
accumulation of triglyceride rich lipoprotein (VLDL, chylomicrons
and their remnants) in individuals with predialysis CKD is mainly
due to their decreased catabolism. The down regulation of the
expression of several genes along with the changes in the
composition of lipoprotein particles and the direct inhibitory effect
of various uremic toxins on the enzymes involved in lipid
metabolism represent the most important pathophysiological
mechanism underlying the development of hypertriglyceridemia in
renal failure. Interestingly, it has been proposed that secondary
hyperparathyroidism may also contribute to the impaired

51
catabolism of triglyceride rich lipoproteins and that
parathyroidectomy or the administration of calcium channel blocker
verapamil may partially ameliorate the hypertriglyceridemia of
CKD. It is well known that impaired insulin sensitivity represents
an early feature of CKD. Thus it could be due to insulin resistance
driven over production of VLDL may significantly contribute to the
development of hypertriglyceridemia in CKD patients70.
ELEVATED LOW DENSITY LIPOPROTEIN
LDL was significantly elevated than that of controls in our
study. We found that 44% of patients showed elevated LDL levels.
This observation is similar to the studies of Diana M Lee et al. In
an article published in archives of internal medicine75 32 patients
were studied and compared the lipid profile on CKD and non CKD
patients. It was found that 60.5% of patients have elevated LDL-C
than non CKD patients (P=0.06). But most studies find that Uremic
Patients usually have normal or slightly reduced concentrations of
LDL-C levels and they exhibit important disturbance in the density
distribution of LDL sub fraction that is characterized by a
predominance of small dense LDL particles76-80.
52
In our study, this elevated LDL-C may be due to the
inaccuracy of Friedwald formula in estimating LDL cholesterol.
Another contributing factor is that peritoneal dialysis may increase
LDL-C due to the compensatory production of lipoprotein in
response to protein loss during the procedure.
Total Cholesterol:
Total cholesterol levels were significantly elevated in our
study group. We observed the same findings in the study by Diana
Lee M et al. But most of the studies did not observe
hypercholesterolemia. The possible reason for the hypercholesterolemia
in our study is significant elevation of cholesterol containing lipid
fractions (IDL, LDL).
Correlation Studies:
It was found that serum triglycerides, TC, LDL, were not
correlated significantly whereas serum HDL levels had significant
negative correlation with serum creatinine. It means that when
serum creatinine level rises, serum HDL level falls. This was the
observation found in MDRD study.

53
ECG changes:
Out of 50 patients, 30% of patients showed changes
suggestive of LVH and 20% of patients showed ischemic changes.
This observation was similar to study done by Levin et al. The risk
of dying of cardiac complications is 65 times higher in dialysis
patients between 45-54 years and 500 times higher than the general
population. The risk factors which are responsible for increased
morbidity and mortality were hypertension, DM, high LDL, low
HDL, smoking, LVH, male gender, old age, anemia, hypervolemia,
insulin resistance and proteinuria.

54
CONCLUSION
1. HDL-C levels were lower and triglycerides, total
cholesterol and LDL-C levels were higher in the study
group compared to controls. All were statistically
significant.
2. Predominant lipid abnormality was reduced HDL-C
levels.
3. There was a negative correlation exists between serum
HDL-C level and serum creatinine levels which was
statistically significant.
4. Percentage of patients showing ECG changes of left
ventricular hypertrophy and ischemia were 30% and
20% respectively.

55
LIMITATIONS OF THE STUDY
1. Most studies showed low or normal LDL-C levels
whereas this study observed significantly elevated
LDL-C levels for reasons little known.
2. Smoking, alcoholism and diabetics may alter the lipid
pattern in the body. Their influences in the study group
also have to be considered.
3. Since we had not analysed the echocardiogram of the
patients, the real scenario of ischemia in CKD patients
who had not shown any abnormality in ECG was not
known.
4. We had not estimated the lipid abnormalities in patients
who underwent dialytic treatment since most of them
were irregular in their treatment.

1
BIBLIOGRAPHY
1. ALEIX CASES AND ELISABET COLL et
al:Dyslipidemia and progression of renal disease in
chronic renal failure patients. Kidney international,
volume 68,supplement 99,2005.
2. ISABEL BENEYTO CASTELLO et al:Hyperlipidimea-
a risk factor for chronic allograft dysfunction, Kidney
International,vol61,supplement 80,2002.
3. AVRAM et al:The uremic dyslipidemia-A cross-
sectional and longitudinal study, American journal of
kidney disease, volume XX,No 4,October 1992.
4. SHARMA BK, JINDAL SK, RANA DS. Absence of
hypedipidemia in patients of chronic renal failure in
Chandigarh. Indian J Med Res 1980; 72:461 464.
5. KUNDE AA, MANI MK, KURUVILLA KC. Lipid
abnormality in chronic renal failure and haemodialysis.
J Assoc Physicians India [abstract] 1977; 25:1013.
6. GUPTA DK. Hypedipidemia in patents of chronic renal
failure. Bombay Hospital J 1991; 33:45 50.

2
7. DAS BS, MISHRA SK, RAO DVP. Serum lipids in
chronic renal failure. J Assoc Physicians India 1984;
32:1019 1021.
8. KOPPLE JD et al,National Kidney Foundation,K/DOQI
clinical practice guildlines for CKD, American journal
of kidney disease, jan 2001,S66-70.
9. KDOQI Clinical practical guildlines for CKD,
American Journal of Kidney Disease,Feb 2002.
10. KESHAVIAH P et al:Resource limitations and
strategies for the treatment of uremia, Blood
purification19:44-52,2001.
11. RAO M et al: Hemodialysis for ESRD in southern
India, Nephrology Dialysis and Transplantation,1998.
12. MITTAL et al:CRF in India, Renal failure,1997.
13. MANI MK:The management of ESRD in India
Artificial Organs 1998.
14. SAKHUJA et al,CRF in India, Nephrology Dialysis
Transplantation,684-689, 1993.

3
15. MANI MK et al:Chronic Renal Failure in India,
Nephrology Dialysis Transplantion 1993.
16. BARSOUM RS et al: The Egyptian Transplant
Experience, Transplant Process,2417-2420, 1992
17. LIM TO et al, Malaysian dialysis and transplant registry
report, Nephrology 1998.
18. JHAV et al, The approach to dialysis in developing
countries, Complications of dialysis 2000.
19. HARRISON’S TEXT BOOK OF INTERNAL
MEDICINE,17th edition,chronic kidney disease.
20. BONNIE C.H. KWAN et al:Lipoprotein metabolism
and lipid management in chronic kidney disease,
Journal of American Society of Nephrology18:1246-
1261,2007
21. ORR JR, ADAMSON GL et al: Preparative
ultracentrifugation and analytical ultracentrifugation of
plasma lipoproteins, American Oil Chemist’s
Society,Champaign,IL,1991,pp 524-554.

4
22. EISENBERG S, BILHEIMER DW, LEVY RI, LINDGREN
FT: On the metabolic conversion of human plasma very low
density lipoprotein to low density lipoprotein. Biochim
Biophys Acta 326: 361–377, 1973.
23. BROWN MS, GOLDSTEIN JL: Lipoprotein metabolism in
the macrophage: Implications for cholesterol deposition in
atherosclerosis. Annu Rev Biochem 52: 223–261, 1983
24. AUSTIN MA, KING MC, VRANIZAN KM, KRAUSS RM:
Atherogenic lipoprotein phenotype. A proposed genetic
marker for coronary heart disease risk. Circulation 82: 495–
506, 1990
25. BRUCE C, CHOUINARD RA JR, TALL AR: Plasma lipid
transfer proteins, high-density lipoproteins, and reverse
cholesterol transport. Annu Rev Nutr 18: 297–330, 1998
26. DIEPLINGER H, ZECHNER R, KOSTNER GM: The in
vitro formation of HDL2 during the action of LCAT: The
role of triglyceride-rich lipoproteins. J Lipid Res 26:
273–282

5
27. ACTON S, RIGOTTI A, LANDSCHULZ KT, XU S,
HOBBS HH, KRIEGER M: Identification of scavenger
receptor SR-BI as a high density lipoprotein receptor.
Science 271: 518–520, 1996
28. KRONENBERG F, KUEN E, RITZ E, JUNKER R, KONIG
P, KRAATZ G, LHOTTA K, MANN JF, MULLER GA,
NEYER U, RIEGEL W, REIGLER P, SCHWENGER V,
VON ECKARDSTEIN A: Lipoprotein(a) serum
concentrations and apolipoprotein(a) phenotypes in mild and
moderate renal failure. J Am Soc Nephrol 11: 105–115, 2000
29. KRONENBERG F, KUEN E, RITZ E, KONIG P, KRAATZ
G, LHOTTA K, MANN JF, MULLER GA, NEYER U,
RIEGEL W, RIEGLER P, SCHWENGER V, VON
ECKARDSTEIN A: Apolipoprotein A-IV serum
concentrations are elevated in patients with mild and
moderate renal failure. J Am Soc Nephrol 13: 461–469, 2002
30. KRENTZ AJ: Lipoprotein abnormalities and their
consequences for patients with type 2 diabetes. Diabetes
Obes Metab 5[Suppl 1]: S19–S27, 2003

6
31. KRONENBERG F: Dyslipidemia and nephrotic syndrome:
Recent advances. J Ren Nutr 15: 195–203, 2005
32. SAVDIE E, GIBSON JC, CRAWFORD GA, SIMONS LA,
MAHONY JF: Impaired plasma triglyceride clearance as a
feature of both uremic and posttransplant triglyceridemia.
Kidney Int 18: 774–782, 1980
33. BATISTA MC, WELTY FK, DIFFENDERFER MR,
SARNAK MJ, SCHAEFER EJ, LAMON-FAVA S,
ASZTALOS BF, DOLNIKOWSKI GG, BROUSSEAU ME,
MARSH JB: Apolipoprotein A-I, B-100, and B-48
metabolism in subjects with chronic kidney disease, obesity,
and the metabolic syndrome. Metabolism 53: 1255– 1261,
2004
34. CATTRAN DC, FENTON SS, WILSON DR, STEINER G:
Defective triglyceride removal in lipemia associated with
peritoneal dialysis and haemodialysis. Ann Intern Med 85:
29–33, 1976
35. APPEL G: Lipid abnormalities in renal disease. Kidney Int
39: 169–183, 1991

7
36. ARNADOTTIR M: Pathogenesis of dyslipoproteinemia in
renal insufficiency: The role of lipoprotein lipase and hepatic
lipase. Scand J Clin Lab Invest 57: 1–11, 1997
37. SENTI M, ROMERO R, PEDRO-BOTET J, PELEGRI A,
NOGUES X, RUBIES-PRAT J: Lipoprotein abnormalities
in hyperlipidemic and normolipidemic men on hemodialysis
with chronic renal failure. Kidney Int 41: 1394–1399, 1992
38. CRYER A: Tissue lipoprotein lipase activity and its action in
lipoprotein metabolism. Int J Biochem 13: 525–541, 1981
39. CHEUNG AK, WU LL, KABLITZ C, LEYPOLDT JK:
Atherogenic lipids and lipoproteins in hemodialysis patients.
Am J Kidney Dis 22: 271–276, 1993
40. CRESSMAN MD, HEYKA RJ, PAGANINI EP, O’NEIL J,
SKIBINSKI CI, HOFF HF: Lipoprotein(a) is an independent
risk factor for cardiovascular disease in hemodialysis
patients. Circulation 86: 475–482, 1992
41. KOCH M, KUTKUHN B, TRENKWALDER E, BACH D,
GRABENSEE B, DIEPLINGER H, KRONENBERG F:
Apolipoprotein B, fibrinogen, HDL cholesterol, and

8
apolipoprotein(a) phenotypes predict coronary artery disease
in hemodialysis patients. J Am Soc Nephrol 8: 1889–1898,
1997
42. DANTOINE TF, DEBORD J, CHARMES JP, MERLE L,
MARQUET P, LACHATRE G, LEROUX-ROBERT C:
Decrease of serum paraoxonase activity in chronic renal
failure. J Am Soc Nephrol 9: 2082–2088, 1998
43. NAVAB M, HAMA SY, REDDY ST, NG CJ, VAN
LENTEN BJ, LAKS H, FOGELMAN AM: Oxidized lipids
as mediators of coronary heart disease. Curr Opin Lipidol
13: 363–372, 2002
44. SOLAKIVI T, JAAKKOLA O, SALOMAKI A,
PELTONEN N, METSO S, LEHTIMAKI T, JOKELA H,
NIKKARI ST: HDL enhances oxidation of LDL in vitro in
both men and women. Lipids Health Dis 4: 25, 2005
45. OI K, HIRANO T, SAKAI S, KAWAGUCHI Y, HOSOYA
T: Role of hepatic lipase in intermediate-density lipoprotein
and small, dense low-density lipoprotein formation in

9
hemodialysis patients. Kidney Int Suppl 71: S227–S228,
1999
46. LITTLEWOOD TD, BENNETT MR: Apoptotic cell death
in atherosclerosis. Curr Opin Lipidol 14: 469–475, 2003
47. STONEMAN VE, BENNETT MR: Role of apoptosis in
atherosclerosis and its therapeutic implications. Clin Sci
(Lond) 107: 343–354, 2004
48. KOLODGIE FD, NARULA J, HAIDER N, VIRMANI R:
Apoptosis in atherosclerosis. Does it contribute to plaque
instability? Cardiol Clin 19: 127–139, ix, 2001
49. BEST PJ, HASDAI D, SANGIORGI G, SCHWARTZ RS,
HOLMES DR JR, SIMARI RD, LERMAN A: Apoptosis.
Basic concepts and implications in coronary artery disease.
Arterioscler Thromb Vasc Biol 19: 14–22, 1999
50. HAIMAN M, SALVENMOSER W, SCHEIBER K,
LINGENHEL A, RUDOLPH C, SCHMITZ G,
KRONENBERG F, DIEPLINGER H: Immunohistochemical
localization of apolipoprotein A-IV in human kidney tissue.
Kidney Int 68: 1130–1136, 2005

10
51. SAMUELSSON O et al:Lipoprotein abnormalities are
associated with increased rate of progression human chronic
renal insufficiency. Nephrology dialysis transplant 14:2392-
2397,1994.
52. WASHIO M et al :Hypercholesterolemia and the progression
of the renal dysfunction in chronic renal failure patients.
Journal of epidemiology 6:172-177,1996.
53. LIU Y, CORESH J, EUSTACE JA, LONGENECKER JC,
JAAR B, FINK NE, TRACY RP, POWE NR, KLAG MJ:
Association between cholesterol level and mortality in
dialysis patients: Role of inflammation and malnutrition.
JAMA 291: 451–459, 2004
54. LONGENECKER JC, CORESH J, POWE NR, LEVEY AS,
FINK NE, MARTIN A, KLAG MJ: Traditional
cardiovascular disease risk factors in dialysis patients
compared with the general population: The CHOICE Study.
J Am Soc Nephrol 13: 1918–1927, 2002
55. DIEPLINGER H, KRONENBERG F: Genetics and
metabolism of lipoprotein(a) and their clinical implications
(Part 1). Wien Klin Wochenschr 111: 5–20, 1999

11
56. KRONENBERG F, KUEN E, RITZ E, JUNKER R, KONIG
P, KRAATZ G, LHOTTA K, MANN JF, MULLER GA,
NEYER U, RIEGEL W, REIGLER P, SCHWENGER V,
VON ECKARDSTEIN A: Lipoprotein(a) serum
concentrations and apolipoprotein(a) phenotypes in mild and
moderate renal failure. J Am Soc Nephrol 11: 105–115, 2000
57. KRONENBERG F, KONIG P, NEYER U, AUINGER M,
PRIBASNIG A, LANG U, REITINGER J, PINTER G,
UTERMANN G, DIEPLINGER H: Multicenter study of
lipoprotein(a) and apolipoprotein(a) phenotypes in patients
with end-stage renal disease treated by hemodialysis or
continuous ambulatory peritoneal dialysis. J Am Soc Nephrol
6: 110–120, 1995
58. DIEPLINGER H, LACKNER C, KRONENBERG F,
SANDHOLZER C, LHOTTA K, HOPPICHLER F, GRAF
H, KONIG P: Elevated plasma concentrations of
lipoprotein(a) in patients with end-stage renal disease are not
related to the size polymorphism of apolipoprotein(a). J Clin
Invest 91: 397–401, 1993

12
59. MILIONIS HJ, ELISAF MS, TSELEPIS A, BAIRAKTARI
E, KARABINA SA, SIAMOPOULOS KC:
Apolipoprotein(a) phenotypes and lipoprotein(a)
concentrations in patients with renal failure. Am J Kidney
Dis 33: 1100–1106, 1999
60. STENVINKEL P, HEIMBURGER O, TUCK CH,
BERGLUND L: Apo(a)- isoform size, nutritional status and
inflammatory markers in chronic renal failure. Kidney Int 53:
1336–1342, 1998
61. ZIMMERMANN J, HERRLINGER S, PRUY A,
METZGER T, WANNER C: Inflammation enhances
cardiovascular risk and mortality in hemodialysis patients.
Kidney Int 55: 648–658, 1999
62. FRISCHMANN KE, KRONENBERG F, TRENKWALDER
E, SCHAFER J, SCHWEER H, DIEPLINGER B, KONIG
P, IKEWAKI K, DIEPLINGER H: In vivo turnover study
demonstrates diminished clearance of lipoprotein(a) in
hemodialysis patients. Kidney Int 2007.

13
63. A.M.SAWANT et al:Prevalence of young adult Indian
population, Journal of association of physicians of India.
2008.
64. SUNIL GUPTA et al:Lipid profile pattern in diabetics from
central india, International journal of diabetes in developing
countries, 2001.
65. BLANKESTIJN PJ, VOS PF, RABELINK TJ, VAN RIJN
HJ, JANSEN H, KOOMANS HA: High-flux dialysis
membranes improve lipid profile in chronic hemodialysis
patients. J Am Soc Nephrol 1995;5:1703-1708.
66. DOCCI D, CAPPONCINI C, MENGOZZI S, BALDRATI
L, NERI L, FELETTI C: Effects of different dialysis
membranes on lipid and lipoprotein serum profiles in
hemodialysis patients. Nephron 1995;69:323-326.
67. WANNER C, BAHNER U, MATTERN R, LANG D,
PASSLICK-DEETJEN J: Effect of dialysis flux and
membrane material on dyslipidaemia and inflammation in
haemodialysis patients. Nephrol Dial Transplant
2004;19:2570-2575

14
68. KRONENBERG F, LINGENHEL A, NEYER U, LHOTTA
K, KONIG P, AUINGER M, WIESHOLZER M,
ANDERSSON H, DIEPLINGER H: Prevalence of
dyslipidemic risk factors in hemodialysis and CAPD
patients. Kidney Int Suppl 2003;84:S113-S116.
69. VASILIS TSIMIHODIMOS et al:Dyslipidemia in Chronic
Kidney Diseas:An approach to pathogenesis and
treatment,American Journal of Nephrology,vol 28,no
6,2008.
70. DIANA M.LEE et al:Lipoprotein particle abnormalities and
the impaired lipolysis in renal insufficiency ,kidney
international, vol.61,2002,pp209-218
71. LAWRENCE G.HUNSICKER et al:Predictors of the
progression of renal disease in the modification of diet in
renal disease study, Kidney international,vol 51,1997,pp
1908-1919.
72. B SHAH et al: Dyslipidemia in patients with chronic renal
failure and in transplant patients,vol 40,Journal of
Postgraduate Medicine 1994.

15
73. BAGDADE J, CASARETTO A. Effect of chronic
uremia, haemodialysis and renal transplantation on
plasma lipids and lipoproteins. J Clin Invest 1976;
87:37 41.
74. CHAN MK, VARGHESE Z, MOORHEAD JF. Lipid
abnormalities in'uremia. Kidney Int 1981; 19:625- 637
75. NISHA I.PARIKH et al: cardiovascular risk factors in
chronic kidney Arch Intern Med. 2006;166:1884-1891
76. WHEELER DC: Abnormalities of lipoprotein metabolism in
CAPD Disease patients. Kidney Int Suppl 1996; 56:S41-
S46.
77. HEIMBURGER O, STENVINKEL P, BERGLUND L,
TRANOEUS A, LINDHOLM B: Increased plasma
lipoprotein(a) in continuous ambulatory peritoneal dialysis is
related to peritoneal transport of proteins and glucose.
Nephron 1996;72:135-144.
78. WANNER C, BARTENS W, WALZ G, NAUCK M,
SCHOLLMEYER P: Protein loss and genetic polymorphism

16
of apolipoprotein(a) modulate serum lipoprotein(a) in CAPD
patients. Nephrol Dial Transplant 1995;10:75-81.
79. KAGAN A, BAR-KHAYIM Y, SCHAFER Z, FAINARU
M: Heterogeneity in peritoneal transport during continuous
ambulatory peritoneal dialysis and its impact on
ultrafiltration, loss of macromolecules and plasma level of
proteins, lipids and lipoproteins. Nephron 1993;63:32-42.
80. SIAMOPOULOS KC, ELISAF M: Is CAPD atherogenic?
Perit Dial Int 1997;17:227-231.

17
LIPID PROFILE IN PATIENTS WITH
CHRONIC KIDNEY DISEASE
Sl. No
Name Age Sex HDL LDL TGL TC
1. Narayanan 44 M 80 126 180 242
2. Guthigan 44 M 42 150 230 238
3. Sundaramoorthy 30 M 55 120 146 206
4. Kumar 27 M 32 162 220 238
5. Subrammani 65 M 50 128 214 220
6. Babu Sethu 32 M 32 126 96 177.2
7. Shankar 30 M 68 146 220 258
8. Chokkammal 45 F 35 119 110 176
9. Amaravathy 65 F 35 65 104 120.8
10. Suseela 30 F 30 140 350 240
11. Narayana Samy 55 M 45 168 160 245
12. Mariyan Beevi 60 F 76 130 185 243
13. Kumar 29 M 32 156.8 106 210
14. Banu 27 F 48 128 150 206
15. Chinna Ponnu 45 F 45 151 220 240
16. Chinna Samy 55 M 40 148 235 235
17. Saratha 37 F 48 130 200 218
18. Ponmudi 52 M 35 65 104 120
19. Sithiraj 55 M 32 85 95 136
20. Ibrahim 38 M 42 86 110 152
21. Vasantha Kumar 24 M 36 150 240 234
22. Marimuthu 50 M 42 147 200 229
23. Kondai raj 32 M 76 125 190 239
24. Panja charam 64 M 40 126 130 202
25. Selvi 40 F 40 123 210 205

18
Sl. No
Name Age Sex HDL LDL TGL TC
26. Ramu 60 M 36 131 235 214
27. Saratha 35 F 38 158 260 248
28. Ramachandran 80 M 40 167 158 238
29. Kalyanam 40 M 36 112 100 168
30. Lurthu samy 50 M 36 110 110 168
31. Orammal 55 F 40 149 206 230
32. Siva Kumar 38 M 36 158 220 238
33. Geetha 45 F 36 160 228 241.6
34. Jeveula 70 M 36 112 100 168
35. Mani 52 M 40 122 209 222
36. Senthil 29 M 36 135 95 190
37. Govindaraj 55 M 40 167.8 136 235
38. Arumugam 60 M 73 125 218 242
39. Vasantha 35 F 40 126 200 202
40. Ellappan 57 M 35 119 110 176
41. Perumal 70 M 39 148 200 227
42. Vijayalakshmi 47 F 38 173 95 230
43. Kannagi 40 F 36 112 100 168
44. Ramesh 32 M 38 149 205 228
45. Rajathi 38 F 36 110 110 168
46. Mathivanan 50 M 38 170 136 235.5
47. Kalaiyarasan 35 M 66 148 205 255
48. Ayyaru 65 M 40 128 208 209.6
49. Pichai Kannu 60 M 36 66 104 122.8
50. Anjammal 56 F 40 128 206 210

19
LIPID PROFILE IN CONTROLS
S.No Name Age/Sex TGL mg% LDL mg% HDL mg% TL mg%
1. Anbuselvam 35/M 106 108 58 186.8
2. Ponnammal 47/F 95 120 55 194
3. Kumar 37/M 90 128 50 196
4. Parimala 40/F 105 114 60 195
5. Karitha 22/F 110 150 50 222
6. Raju 60/M 95 125 55 119
7. Chinnakannu 72/M 90 128 58 204
8. Gangadharan 48/M 115 106 65 194
9. Deva Anbu 37/M 106 107 50 178.2
10. Sironmani 42/M 102 103 53 176.4
11. Kannaiya 54/M 115 110 54 176.4
12. Subramaniyan 38/M 90 120 50 187
13. Rajeshkumar 25/M 105 110 60 191
14. Maniyammal 39/F 102 124 56 200.4
15. Bharathi Devi 28/M 100 115 54 189
16. Neela 47/F 100 85 55 160
17. Panneerselvam 50/M 102 103 55 178
18. Velmurugan 33/M 96 128 50 192
19. Poongothai 37/F 100 125 55 200
20. Savithiri 35/F 116 102 55 180
21. Sadasivam 37/M 90 120 50 180
22. Perumal 47/M 112 100 50 188
23. Selvi 30/F 96 128 51 (50) 192

20
24. Nalini 31/F 95 116 58 193
25. Murugesan 62/M 100 125 55 201
26. Pavithra 19/F 116 102 55 180
27. Narmatha 33/F 102 104 56 180.4
28. Kaliyaperumal 75/M 90 120 50 188
29. Pitchaikannu 47/M 94 120 55 193.8
30. David 39/M 96 104 55 178.2
31. Gunasekaran 34/M 98 103 55 177.6
32. Harini 27/F 100 128 46 194
33. Veerasekar 67/M 104 98 60 178.8
34. Vikram 38/M 103 98 60 178.8
35. Elangovan 35/M 98 98 56 173.6
36. Pathiyammal 78/F 109 100 58 179.8
37. Porselvi 40/F 110 114 60 196
38. Kanagavalli 26/F 98 100 54 1736
39. Muthukumar 24/M 100 106 49 175
40. Stalin 30/M 104 90 48 158.8
41. Sampathkumar 37/M 102 108 58 186.4
42. Nagarani 55/F 105 90 56 167.0
43. Anjammal 58/F 110 92 58 172
44. Valli 43/F 100 106 55 180
45. Vadivammal 58/F 106 105 55 182
46. Ravi 38/M 122 124 50 198
47. Mathialagan 50/M 118 107 50 180
48. Govindaraju 56/M 100 128 48 196
49. Kalaivanan 29/M 95 143 48 210
50. Vani 32/M 96 125 50 194.2

21
PROFORMA
No.:
Name: Age/Sex I.P. No. DOA Date
Unit: Education: Occupation:
RFT
Sugar Na+ TC PCV
Urea K+ DC P L E Hb
Creatinine ESR Platelets
USG Abdomen: RK PCS
LK PCS Pancreas
Other Findings
BP Status Glycemic Status
Drugs
Duration of DM - Drugs/Insulin/Nil
Duration of HTN - Drugs/No Drugs/Irregular
Other causes of CKD
H/o Smoking Symptoms Signs
H/o Alcoholism
Family H/o Kidney Disease: DM / HTN
Daily urine volume now:
On drugs only / PD / HD / Transplant - If dialysis no. of
times last dialysis
Date of Transplant
ECG ECHO if done
Lipids: TGL TC HDL LDL

23
MASTER CHART S
l. N
o
Nam
e
Age
Sex
IP.
No
Edu
catio
n
Occ
upat
ion
Sm
okin
g
Alc
ohol
Na+
meq
/L
K+
meq
/L
Ure
a m
g%
Cre
atin
ine
mg%
Sug
ar m
g%
BP
mm
hg
DM
HT
N
Tre
atm
ent
/last
di
alys
is
HD
Lmg/
dl
LDL
mg/
dl
TG
L m
g/dl
TC
mg/
dl
RK
siz
e (c
m)
LK s
ize
(cm
)
PC
S
EC
G C
hang
es
1. Narayanan 44 M 65815 8th Std Leather Works
+ - 11.5 3.6 48 1.8 60 150/100 – + 80 126 180 242 10 11 N N
2. Guthigan 52 M 65178 – Agri + + 120 5 44 1.8 66 150/100 – – Drugs 42 150 230 238 10 9.5 N N
3. Sundaramoorthy 30 M 70240 – Wood cutter – – 138 3.8 55 3.6 55 120/70 – – HD/ 5 days ago
55 120 146 206 8.1 8.1 Dilated/ B/L
N
4. Kumar 27 M 70208 – Painter – + 118 4.2 230 14.5 110 160/100 – + PD / 2 months
32 162 220 238 8.5 7.2 N T ↓ V1-V4
5. Subrammani 65 M 67166 2nd std
Agri + + 130 4 70 2.8 136 130/100 + + PD / 1 month
50 128 214 220 7.5 8.8 N LVH with I, avl; ST↓
V5-V6
6. Babu Sethu 32 M 65742 SSLC Flower Business
– + 126 5 192 22.6 80 160/100 – + Drugs 32 126 96 177.2 7.5 7.3 N LVH with strain
7. Shankar 30 M 67047 SSLC Driver – – 134 4 135 12.3 95 180/110 + + HD/ 4 days
68 146 220 258 8.5 8.8 N LVH
8. Chokkammal 45 F 66802 – Home maker
– – 118 6 47 1.5 51 90/60 + – Drugs 35 119 110 176 10.2 8.9 N Sinus tachy cardia

24
9. Amaravathy 65 F 66803 – Home maker
– – 127 4.8 64 2.3 192 160/100 + + Drugs 35 65 104 120.8 8.5 9.8 N N
10. Suseela 30 F 66312 – Home maker
– – Low 4.5 151 13.9 57 160/100 – – PD/ 1 month
30 140 350 240 7.3 7.1 N N
11. Narayana Samy 55 M 68068 – Agri – – 118 5.6 192 12 94 180/100 + – PD/ 2 months
45 168 160 245 6.2 6.3 N LVH with ST↓ II, III,
AVF
12. Mariyan Beevi 60 F 67653 – Home maker
– – 126 4.9 68 2.5 104 190/100 + + Drugs 76 130 185 243 10.3 11.7 N LAD/ LVH
13. Kumar 29 M 67957 8th std Business + + 132 4.2 221 14.3 100 240/140 – – Drugs 32 156.8 1.6 210 7.6 8 N LVH
14. Banu 27 F 68271 7th std Agri – – Low 5.9 174 11.3 135 150/80 – + Drugs 48 128 150 206 8.2 8.3 N LVH / T↓ V4-V6
15. Chinna Ponnu 45 F 68307 – Agri – – 133 5.8 76 3.6 118 140/90 + – Drugs 45 151 220 240 7.1 7.6 N N
16. Chinna Samy 55 M 71885 SSLC Agri – – Low 5 148 2.9 102 140/100 – + PD/ 3 months
40 148 235 235 7.2 7.5 N T ↓ I, AVL; QS V1-V6
17. Saratha 37 F 69638 5th std Home Maker
– – 130 4.8 116 5 96 160/90 – – PD/ 2 months
48 130 200 218 7.8 7.2 N N
18. Ponmudi 52 M 72136 – Construction worker
+ + 110 3.2 120 4.8 82 150/100 – + HD 1 day
35 65 104 120 8.4 83.6 N N
19. Sithiraj 55 M 68411 – Agri + + 128 4 79 2.8 92 130/90 – + Drugs 32 85 95 136 9.4 9 N Low voltage complex
20. Ibrahim 38 M 66059 8th std Leathar worker
– – 115 3.5 140 8 154 130/60 – – Drugs 42 86 110 152 12 12 N N

25
21. Vasantha Kumar
24 M 66105 B com
BPO – – 128 6.4 185 21.2 200 200/110 – – Drugs 36 150 240 234 6.9 7.2 N N
22. Marimuthu 50 M 70221 12th std
Agri + + 118 5.3 123 7.4 129 140/100 + – HD/1 month
42 147 200 229 11.4 11.3 N Tall T Waves
23. Kondai raj 32 M 65293 4th std Load man + + 124 3.8 17 0.5 100 190/120 – – HD/ regular
76 125 190 239 8.3 7.8 N LVH
24. Panja charam 64 M 65007 8th std Lorry driver
+ + 131 5.7 102 5.6 104 130/80 – + Drugs 40 126 130 202 7 8.1 N Sinus Brady cardia
25. Selvi 40 F 66057 – Home maker
– – 124 5.1 68 5.6 388 130/100 + + Drugs 40 123 210 205 8.4 7.2 N ST↓ I; AVL, V5-
V6
26. Ramu 60 M 66032 5th std Washer man – – 118 6.2 177 14.6 122 200/120 – – Drugs 36 131 235 214 7.8 7.4 N Tall T waves
27. Saratha 35 F 64541 – Home maker
– – 131 4 176 10.2 97 200/120 + – PD/ 5 days
38 158 260 248 8.1 9.6 N Poor progression
R wave, V1-V3
28. Ramachandran 80 M 70055 3rd std Agri + + 124 3 112 5.6 80 140/90 + + Drugs 40 167 158 238 6.8 7.2 N LVH
29. Kalyanam 40 M 70118 7th std Agri + – 128 5 76 3.4 132 221/50 + – Drugs 36 112 100 168 9.4 9.8 N N
30. Lurthu samy 50 M 69928 6th std Mason – – 128 3.2 143 7.6 72 150/90 + + Drugs 36 110 110 168 6.1 6.3 N N
31. Orammal 55 F 65139 9th std Home maker
– – 116 5.5 120 6 120 140/90 + + Drugs 40 149 206 230 10.1 10.8 N LVH
32. Siva Kumar 38 M 68315 12th std
Agri + + 130 5 148 7 110 150/100 – + Drugs 36 158 220 238 7.1 7.8 N N

26
std
33. Geetha 45 F 67412 PUC Home maker
– – 116 3.8 110 5.8 100 130/100 – – Drugs 36 160 228 241.6 8.2 7.8 N N
34. Jeveula 17 M 72163 10th std
Carpenter – – 118 5 100 5.5 106 130/80 – + Drugs 36 112 100 168 6.8 7.1 N LVH
35. Mani 52 M 66034 – Business + + 126 5 140 7 150 200/100 + + HD/ 2 months
40 122 209 222 9.8 10.4 N N
36. Senthil 29 M 70106 BSc Clerk – + Low 6 124 7 128 140/100 + + Drugs 36 135 95 190 7.8 11.2 N LVH
37. Govindaraj 55 M 67875 7th std Steel work + – 130 5.6 112 5.5 80 200/120 + – Drugs 40 167.8 136 235 6.4 7.2 N T ↓ V4-V6
38. Arumugam 60 M 68130 5th std Painter + + 127 4.8 120 6 110 140/90 + + PD/3 days
73 120 218 242 9 10.2 N ST ↓ V1-V4
39. Vasantha 35 F 65235 SSLC Home Maker
– – 130 7 140 6.7 78 190/120 – + Drugs 40 126 200 202 8.4 8.6 N Tall T waves
40. Ellappan 57 M 67315 – Agri + + 116 4.5 148 7 112 150/100 – + PD/1 month
35 119 110 176 6.9 7.4 N N
41. Perumal 70 M 68112 – Mason + + 130 5 112 6 100 130/90 – + Drugs 39 148 200 227 7.1 7.8 N N
42. Vijayalakshmi 47 F 68306 – Construction worker
– – 134 4 70 3 90 150/90 – + Drugs 38 173 95 230 7.4 9 N PRWP V1-V4
43. Kannagi 40 F 66720 7th std Agri – – 116 3.9 123 5.4 116 130/90 – – Drugs 36 112 100 168 8 8.2 N N
44. Ramesh 32 M 64535 BA Business – – 124 5 110 2.8 138 146/90 + – HD/3 months
38 149 205 228 10.2 10.8 N N
45. Rajathi 38 F 65175 – Home maker
– – 138 5 88 3.5 105 140/100 – + Drugs 36 110 110 168 7.4 7.2 N LVH

27
46. Mathivanan 50 M 62252 9th std Agri + + 135 4 140 2.6 106 200/110 + + Drugs 38 170 136 235.5 6.5 7.8 N LVH
47. Kalaiyarasan 35 M 38420 SSLC Mechanic – + 110 4.8 112 4 130 170/90 + + PD/ 2 days
66 148 205 255 11.5 10.8 N N
48. Ayyaru 65 M 72015 – Agri + + 128 5 170 5.8 70 190/100 – + Drugs 40 128 20 209.6 7.8 8 N N
49. Pichai Kannu 60 M 67210 6th std Agir + + 130 4.5 120 3.8 108 138/80 – + Drugs 36 66 104 122.8 8.8 9.2 N N
50. Anjammal 56 F 71112 – Home Maker
– – 110 6 205 12.4 136 170/90 + + Drugs 40 128 206 210 8.7 7.8 N LVH

32
ACRONYMS
Apo - Apolipoprotein
BP - Blood Pressure
CC - Correlation Coefficient
CKD - Chronic Kidney Disease
CVD - Cardio Vascular Disease
DM - Diabetes Mellitus
ECG - Electro Cardiogram
ESRD - End Stage Renal Disease
FFA - Free Fatty Acid
GFR - Glomerular Filteration Rate
HD - Hemodialysis
HDL-C - High Density Lipoprotein Cholesterol
HTN - Hypertension
IDL-C - Intermediate Density Lipoprotein Cholesterol
IP No - In Patient Number
K+ - Potassium
K/DOQI - Kidney Disease Outcome Quality Initiative

33
LCAT - Lecithin Cholesterol Acyl Transferase
LDL-C - Low Density Lipoprotein Cholesterol
LK - Left Kidney
LPL - Lipoprotein Lipase
LRP - Low Density Lipoprotein Related Protein
LVH - Left Ventricular Hypertrophy
MDRD study - Modification of Diet in Renal Disease study
Na+ - Sodium
OXL-DL - Oxidised LDL
PCS - Pelvic Calyceal System
PD - Peritoneal Dialysis
PMP - Per Million Population
RK - Right Kidney
Sd LDL - Small Dense Low Density Lipoprotein
TC - Total Cholesterol
TGL/TG - Triglycerides
USG - Ultra Sonogram
VLDL-C - Very Low Density Lipoprotein Cholesterol


COMPARISON OF TGL LEVELS (Mean) BETWEEN OTHER STUDIES AND OUR STUDY
222
194
171
121106 102
0
50
100
150
200
250
Shah et al Diana M Lee et al Our study
Study GroupControl Group

COMPARISON OF LDL LEVELS (Mean) BETWEEN OTHER STUDIES AND OUR STUDY
109
170
131140
131
112
0
20
40
60
80
100
120
140
160
180
Shah et al Diana M Lee et al Our study
Study GroupControl Group

COMPARISON OF HDL LEVELS (Mean) BETWEEN OTHER STUDIES AND OUR STUDY
52
384244 42
54
0
10
20
30
40
50
60
Shah et al Diana M Lee et al Our study
Study GroupControl Group

COMPARISON OF TOTAL CHOLESTEROL LEVELS (Mean) BETWEEN OTHER STUDIES
AND OUR STUDY
211
239
209184 189 185
0
50
100
150
200
250
300
Shah et al Diana M Lee et al Our study
Study GroupControl Group

15-25 Yrs 4%26-35 Yrs 26%36-45 Yrs 22%46-55 Yrs 24%56-65 Yrs 20%66-75 Yrs 2%>75 Yrs 2%
Age Distribution in Patients4%
24%
20%
2%2%
15-25 Yrs 26-35 Yrs 36-45 Yrs 46-55 Yrs

Age Distribution in Patients
26%
22%
46-55 Yrs 56-65 Yrs 66-75 Yrs >75 Yrs

Sex Distribution in Patients
68%
32%
Males
Females

OUR STUDY / COMPARISON OF LIPID FRACTIONS BETWEEN PATIENTS AND
CONTROLS
171
131
42
209
102 112
54
185
0
50
100
150
200
250
TGL LDL HDL TC
Study GroupControl Group