A STUDY OF LEARNING-CENTERED LEADERSHIP SKILLS OF ...
230
The Pennsylvania State University The Graduate School College of Education A STUDY OF LEARNING-CENTERED LEADERSHIP SKILLS OF PRINCIPALS IN CAREER AND TECHNICAL EDUCATION SCHOOLS A Dissertation in Workforce Education and Development by Mary E. Rodman © 2012 Mary E. Rodman Submitted in Partial Fulfillment of the Requirements for the Degree of Doctor of Philosophy May 2012
Transcript of A STUDY OF LEARNING-CENTERED LEADERSHIP SKILLS OF ...

The Pennsylvania State University
The Graduate School
College of Education
A STUDY OF LEARNING-CENTERED LEADERSHIP SKILLS OF
PRINCIPALS IN CAREER AND TECHNICAL EDUCATION SCHOOLS
A Dissertation in
Workforce Education and Development
by
Mary E. Rodman
© 2012 Mary E. Rodman
Submitted in Partial Fulfillment
of the Requirements
for the Degree of
Doctor of Philosophy
May 2012

The dissertation of Mary E. Rodman was reviewed and approved* by the following:
Richard A. Walter
Associate Professor of Education
Dissertation Advisor
Chair of Committee
Professor in Charge of Graduate Programs in Workforce Education and Development
Edgar P. Yoder
Professor of Extension Education
Cynthia A. Pellock
Associate Professor of Education
Robert E. Clark
Associate Professor of Education
*Signatures are on file in The Graduate School.
ii

ABSTRACT
Despite years of educational reform, secondary students have demonstrated only modest
increases in achievement. Career and technical education students have not demonstrated
the same level of performance as non-career and technical education students. Except for
teachers, principals have the greatest influence over student achievement. What should
effective principals be able to do and how should they do it? Using the Vanderbilt
Assessment of Leadership in Education (VAL-ED), this quantitative research study
investigated the learning-centered leadership skills of principals in 16 area career and
technical education schools. The study addressed four research questions. The study
determined the extent to which (a) learning-centered leadership skills were demonstrated
by career and technical education principals; (b) perceptions of leadership skills differed
among principals, supervisors, and teachers; (c) leadership skills of career and technical
education principals differed from the national norm; and (d) an association existed
between leadership skills and student achievement on the NOCTI assessment. The
results suggested that career and technical education principals demonstrated leadership
to a level of proficiency similar to the national norm and that there were no significant
differences between the perceptions of leadership skills among the principals,
supervisors, and teachers. The study showed no direct association between the leadership
skills of the subject principals and student achievement measured by the NOCTI
assessment, and reinforced the complex indirect relationship that exists. This study may
be of value to those who deliver Pennsylvania Inspired Leaders programs, those who
deliver core certification programs that prepare principals for their future roles in career
and technical education, and principals who engage in focused professional education
experiences for the purpose of increasing student achievement.
iii
TABLE OF CONTENTS
List of Tables.................................................................................................................vii
List of Figures ................................................................................................................. x
Acknowledgements ........................................................................................................ xi
Chapter 1. INTRODUCTION ......................................................................................... 1
Historical Perspective........................................................................................... 1
The Problem ........................................................................................................ 4
Significance of the Research ................................................................................ 8
Research Questions ............................................................................................ 10
Limitations of the Research ................................................................................ 11
Definitions of Terms .......................................................................................... 13
Assumptions ...................................................................................................... 14
Conceptual Framework ...................................................................................... 15
Chapter Summary .............................................................................................. 17
Chapter 2. LITERATURE REVIEW ............................................................................ 20
Effective Schools Research ................................................................................ 21
Changing Role of the Principal........................................................................... 26
Related Leadership Theories .............................................................................. 32
Trait Theory ........................................................................................... 33
Contingency Theory ............................................................................... 34
Transactional and Transformational Leadership ...................................... 36
Distributed Leadership ........................................................................... 40
Collective Leadership ............................................................................. 41
Instructional Leadership ......................................................................... 42
Change Leadership ................................................................................. 44
Appreciative Inquiry ...................................................................... 46
Evolving View of Action Research ................................................ 47
Conceptual Framework of Learning-Centered Leadership .................................. 52
Constructs of Learning-Centered Leadership .......................................... 54
Core Components ................................................................................... 54
Key Processes......................................................................................... 59
Interstate School Leaders Licensure Consortium..................................... 62
Measuring and Assessing School Leadership ..................................................... 64
What to Assess ....................................................................................... 66
How to Assess ........................................................................................ 68
Validity and Reliability........................................................................... 70
Context of Career and Technical Education ........................................................ 71
National Occupational Competency Testing Institute ......................................... 79
iv
Chapter Summary .............................................................................................. 80
Chapter 3. METHODOLOGY ...................................................................................... 84
The Problem ...................................................................................................... 84
Research Questions ............................................................................................ 85
Population and Sample ....................................................................................... 86
Population .............................................................................................. 86
Sample ................................................................................................... 88
Demographic Data ............................................................................................. 94
Recruitment and Survey Process ............................................................. 95
Variables ............................................................................................................ 95
Independent Variables ............................................................................ 96
Dependent Variables .............................................................................. 97
Instrumentation ................................................................................................ 100
Validity ................................................................................................ 103
Reliability ............................................................................................. 105
Pilot Study ....................................................................................................... 108
Data Collection ................................................................................................ 108
Human Subject Protection .................................................................... 109
Data Storage ......................................................................................... 110
Data Analysis ................................................................................................... 110
Chapter Summary ............................................................................................ 115
Chapter 4: FINDINGS ................................................................................................ 115
Sample Description .......................................................................................... 116
Data Analysis and Outliers ............................................................................... 118
Missing Data .................................................................................................... 121
Research Question One .................................................................................... 125
Research Question Two ................................................................................... 137
Research Question Three.................................................................................. 142
Research Question Four ................................................................................... 148
Chapter 5: DISCUSSION AND RECOMMENDATIONS .......................................... 156
Restatement of the Problem.............................................................................. 156
Discussion........................................................................................................ 161
Implications from Research Questions and Recommendations for
Professional Practice ................................................................................... 166
v

Limitations ....................................................................................................... 174
Recommendations for Future Research ............................................................ 175
Conclusion ....................................................................................................... 177
References ................................................................................................................... 180
Appendices .................................................................................................................. 198
Appendix A, Letter of Invitation ...................................................................... 198
Appendix B, Email Recruitment Information ................................................... 201
Appendix C, Consent to participation in the Study of Leadership in
Career and Technical Education Schools ....................................................... 203
Appendix D, Informed Consent – Instructional Leaders ................................... 204
Appendix E, Informed Consent – Supervisors .................................................. 206
Appendix F, Notice of Participation ................................................................. 208
Appendix G, Implied Consent – Teachers ........................................................ 209
Appendix H, Communication from Discovery Education –
Change in VAL-ED from 72 to 36 Item Analysis for Teachers ................... 211
Appendix I, VAL-ED Implementation Model .................................................. 213
Appendix J, VAL-ED Consideration f or Implementation ................................ 214
Appendix K, Email Communication, VAL-ED Confidentiality and Security .... 216
Appendix L, Researcher’s Additional Instructions for Completing VAL-ED .... 217
Appendix M, VAL-ED’s Instructions for Completing VAL-ED ....................... 218
Appendix N, Discovery Education Contact Information for VAL-ED .............. 219
vi

LIST OF TABLES
Table 1: Characteristics of Transformational and Transactional Leaders .................. 37
Table 2: Vanderbilt Assessment of Leadership in Education:
Intersection of Core Components and Key Processes
With ISLLC Standards ............................................................................... 61
Table 3: Percentage of Public High School Graduates Who
Completed an Occupational Concentration in 2005 by
Selected Characteristics .............................................................................. 74
Table 4: Percentage of Public High School Graduates in 2005 Who Were
Occupational Concentrators and Nonconcentrators by Selected
Characteristics ............................................................................................ 75
Table 5: Consolidated Annual Report Submitted to the U.S. Office of
Education by the Pennsylvania Department of Education, Bureau
of Career and Technical Education ............................................................. 77
Table 6: Comparison of the Percentage of 2008-2009 Grade 11 Career and
Technical Students to All Students Who Scored Proficient and
Advanced Proficient on the PSSA .............................................................. 78
Table 7: Comparison of the Percentage of 2008-2009 Grade 11 Career and
Technical Students to All Students Who Scored Proficient and
Advanced Proficient on the PSSA .............................................................. 88
Table 8: Comparison of Personal Attribute Data of Statewide and Research Sample
Career and Technical Education Instructional Leaders ................................ 94
Table 9: Leadership Skill Descriptors on the Five-Point Likert Scale ....................... 96
Table 10: Vanderbilt Assessment of Leadership in Education:
Intersection of Core Components and Key Processes with the
ISLLC Standards ........................................................................................ 98
Table 11: Educational Leadership Policy Standards Adopted by the Council
of Chief State School Leaders and the National Policy Board for
Educational Leadership: Interstate School Leaders Licensure
Consortium 2008 Professional Standards .................................................... 99
Table 12: Variable Types and Scale of Measurement ............................................... 100
Table 13: Assessment Instruments Analyzed by Condon and Clifford and the
Year of Development ............................................................................... 102
vii
Table 14: Descriptors and Mean Cut Scores Associated with VAL-ED
Proficiency Levels .................................................................................... 106
Table 15: Estimates of Internal Consistency Reliability for VAL-ED Form C .......... 107
Table 16: Data Analysis Strategies for Research Questions ...................................... 112
Table 17: Personal Attributes of Statewide Career and Technical Education
Instructional Leaders Compared to Personal Attributes of
Research Study Sample ............................................................................ 117
Table 18: Analysis of Differences between Statewide Sample of Leaders in
Career and Technical Education Schools and Research Sample ................ 118
Table 19: Leadership Skill Descriptors on the Five-Point Likert Scale ..................... 122
Table 20: Summary of Missing and Valid Data for Leadership Survey Variables ..... 123
Table 21: Comparison of VAL-ED Study and Research Study Missing Data by
Core Component and Key Process ............................................................ 124
Table 22: Mean Values from Collective Respondents for Core Component and
Key Process Variables .............................................................................. 127
Table 23: Rank Order of Key Processes from Highest to Lowest Mean Value .......... 129
Table 24: Rank Order of Core Components from Highest to Lowest Mean Value .... 130
Table 25: Overall Mean Proficiency Rating of Principals by Respondent Group ...... 131
Table 26: Descriptors and Mean Cut Scores Associated with VAL-ED
Proficiency Levels .................................................................................... 133
Table 27: Number and Percent of Principals by Proficiency Level for Core
Components and Key Processes ............................................................... 134
Table 28 Proficiency Levels of Principals for Each of the VAL-ED
Leadership Variables ................................................................................ 135
Table 29: Correlation between Principals’ Biographical Data and Mean
Proficiency Ratings .................................................................................. 136
Table 30: Comparison of VAL-Ed Secondary School National Norm
Principals’ to Research Study Principals’ Proficiency Rating ................... 138
viii

Table 31: Comparison of Secondary School Principals’ National Norm
to Research Study Principals’ Proficiency Rating by
Respondent Group .................................................................................... 139
Table 32: Differences between Research Study Principals’ Proficiency Rating
And VAL-ED National Norm Proficiency Rating by
Respondent Group .................................................................................... 140
Table 33: Mean Proficiency Rating of Principals by Respondent Group ................... 143
Table 34: Summary Descriptive Statistics and ANOVA Results by
Respondent Group .................................................................................... 144
Table 35: Relationship between Principal Qualitative Performance Rating
and Student Performance Rating on the NOCTI Assessment .................... 152
Table 36: Cross Tabulation of Student Performance Rating on the NOCTI
Assessment and Principal Performance Rating on the VAL-ED................ 153
Table 37: Chi-Square Tests of the Relationship between Principals’
Qualitative Performance Rating and Students’ Performance
Rating on the NOCTI Assessment ............................................................ 154
Table 38: Symmetric Measures of Cross Tabulation Analysis of Principals’
Performance Rating Measured by the VAL-Ed with Student
Performance Measured by the NOCTI Assessment................................... 155
ix

LIST OF FIGURES
Figure 1: Model Illustrating How Leadership Indirectly Affects Student
Learning ..................................................................................................... 27
Figure 2: Sullivan and Rothwell’s Change Model ...................................................... 48
Figure 3: The Rigor and Relevance Framework Quadrants Used to Examine
Curriculum, Instruction, and Assessment at the International
Center for Leadership in Education ............................................................ 57
Figure 4: An Illustration of the Comparison of the Mean Values of the Research
Study Principals and the National Norms Established for Secondary
School Principals ...................................................................................... 141
x

ACKNOWLEDGMENTS
An acknowledgment of the support and guidance from my Committee Advisor,
Dr. Richard A. Walter is first and foremost. Your encouragement kept me on task and
committed to this project. Your attention to details and timely responses were an
inspiration. Dr. Yoder, your assistance was fundamental to completion of this project. In
coursework, meetings, and correspondence, your gentle manner and patience helped me
personally and professionally more than you know. To my Joint Operating Committee
members who supported my aspirations, I thank you for affording me this opportunity.
To the administrative team at CPAVTS, Diane Franklin, Justin Bruhn, and Frank
Flamini, I owe you a debt of gratitude for stepping forward in your leadership roles at
distinguished performance levels which allowed me to pursue my own educational goals.
To my brothers, sisters, and friends, thank you for patiently waiting for me to
finish. To my children, Richard, Jr., Marie, and Katherine, thank you for your fierce
independence and maturity at such young ages that enabled me to work. You thrived and
have made me immensely proud of your accomplishments and the adults you are today.
To my grandson, Richard William, you changed me. Being a grandparent is far more
important than anything else in my life. To my partner, Michael Curley, words cannot
express my appreciation and love for the support and encouragement you gave me from
the start to the end of this project. You never doubted or gave me a moment’s peace until
my goal was attained. I am forever grateful to Bernie and Florence, two strong-willed,
loving women and mothers whose support helped me to achieve this goal. To my mother
and father, Monica and Dave Zezza, the best teachers in my life. You have always been
my inspiration and my aspiration. My heart’s desire is to love as you have loved me,
unconditionally and never-ending.
xi

1
Chapter 1
INTRODUCTION
Historical Perspective
In 1983, the National Commission on Excellence in Education published a now
famous report on the condition of public schools, A Nation at Risk. This report launched
a flood of school reforms that focused attention on improving the effectiveness of public
schools. More recently, the No Child Left Behind Act of 2001, global competition,
implementation of state academic standards, and school accountability systems have
focused attention on school leadership as the means to ensure the effectiveness of
schools. These efforts have made improvements in the quality of public schools. Yet
reform efforts have failed to yield successful and sustained education reform that
produced measureable and significant improvements in student achievement. According
to the United States Department of Education, “The average reading and mathematics
scores on the long-term trend National Assessment of Educational Progress were higher
in 2008 than in the early 1970s for 9- and 13-year-olds; scores for 17-year-olds were not
measurably different from the early 1970s” (U.S. Department of Education, 2010).
Because reform initiatives have not sustained educational improvements, student
achievement remains at the forefront of state and national agendas (Bureau of Career and
Technical Education, 2011; Davis, Darling-Hammond, LaPointe, & Meyerson, 2005).
Research related to student achievement began prior to 1970. However, the focus
in research on effective schools began in the 1970’s in response to a report called The
Concept of Equality in Educational Opportunity. Coleman (1967) posited that family
background and socioeconomic status were the most influential factors in student

2
achievement, largely underplaying any influence that schools had on student
achievement. Coleman’s report stated that little research existed to determine what
school factors (elements), if any, were influential for student achievement. However, he
theorized that schooling had a minimal effect on student achievement and that if any
measurement of the effects of schooling on student achievement did exist, it was subject
to “sharp disagreement” (p. 17). Coleman’s report launched a movement of research
designed to prove that schools did have a direct impact on student achievement. This
research transitioned to identifying the common factors that existed exclusively in
effective schools. Researchers began to analyze effective schools that existed despite
school size, economic makeup, or minority status of the student population (Edmonds,
1982). This body of research produced a prescriptive list of seven common traits found
in effective schools that were not present in ineffective schools (Lezotte, 1991). Among
the seven characteristics, the researchers noted that each of the effective schools studied
had strong instructional leadership.
The continued quest to produce better schools resulted in more demands on the
principal to demonstrate effective leadership. Several different leadership philosophies
have been proposed to be the conceptual framework necessary to create increasingly
effective schools. These philosophies aim to identify the leader’s role in creating
effective schools by supporting teachers in their practice of delivering instruction
(Supovitz & Buckley, 2008). The relevant leadership philosophies include those
described by Bass (as cited in Leithwood and Jantzi, 2000) as transformational leadership
and the philosophy described by Spillane (2005) as distributed leadership.

3
Transformational leadership is built on a foundation of the leader motivating
others to higher levels of commitment to the goals of the organization, and as a result,
achieving higher degrees of effectiveness in reaching those goals. Distributed leadership
has as its foundation the emphasis on the process through which instructional leaders
produce changes that result in effective schools. The research surrounding these
leadership philosophies as they relate to learning-centered leadership will be examined in
depth through the review of relevant literature in Chapter 2.
A second focus of research on leadership deals with the qualities of effective
teachers and their direct effect on student achievement (Lezotte, 1991, 2004; Marzano,
Pickering, & Pollock, 2001; Stronge, 2007; Wright, Horn, & Sanders, 1997). Through
this research, the effects of instructional leadership on student achievement have been
demonstrated. Waters, Marzano, and McNulty (2003) conducted a meta-analysis review
of research over a 30-year period studying the relationship between instructional
leadership and student achievement. This review identified a “balanced leadership
framework which describes the knowledge, skills, strategies, and tools leaders need to
positively impact student achievement” (p. 2). Although there has been much debate
about the exact nature and extent of the impact, the educational community generally
accepts the concept that instructional leadership has an indirect influence on student
achievement (Hallinger, Bickman, & Davis, 1996; Hallinger & Heck, 1998; Leithwood,
Harris, & Hopkins, 2008; Marzano, Waters, & McNulty, 2005; Wahlstrom, Louis-
Seashore, Leithwood, & Anderson, 2010). Because of the generally accepted view that
there is a link between principal leadership behaviors and student achievement, and
further because of the continued pressure to improve student achievement through

4
effective schools, principal effectiveness has become the subject of significant recent
research (LaPointe & Davis, 2006).
The Problem
The purpose of this research study was to investigate the learning-centered
leadership skills of principals in selected area career and technical schools using the
Vanderbilt Assessment of Leadership in Education (VAL-ED) principal assessment
instrument. The study determined the extent to which leadership skills align with or
differ from the national norm. The study determined the extent to which, if any, there
were different perceptions in leadership skills among principals, supervisors, and
teachers. Further, it determined the extent to which a relationship existed between
specific leadership skills and student achievement. Leadership skills were analyzed
within the unique context of the career and technical education school.
The 360-degree feedback instrument used in this study to assess the leadership
skills of principals has been judged psychometrically valid and reliable. It is aligned to the
professional standards of the Interstate School Leaders Licensure Consortium (ISLLC)
2008. The focus of this research was to assess the extent of learning-centered leadership
skills of principals in selected area career and technical education schools. If gaps exist in
the skills of principals in area career and technical education schools, and these gaps may
be determined, then principals, principal preparation program providers, and Act 45
program providers may be better able to design focused professional education experiences
to improve the leadership practices of principals and increase school effectiveness.
The role of the principal is highly complex and has changed over the years. The
complexity and change in roles have required principals to demonstrate a more complex
5
set of leadership skills (Hallinger & Heck, 1998). Prior to reforms initiated after the
publication of The Nation at Risk, the principal’s role was primarily limited to managing
the building, reacting to student discipline, and responding to the school superintendent
(Ashby & Krug, 1998, as cited in Normore, 2006). Since the new millennium, however,
there are far more competing priorities for the principal’s time. Principals may be
responsible for financial operations; building maintenance; hiring, firing, supervising,
and evaluating professional and non-professional personnel; public relations;
recommendation and implementation of school policy; and implementation of the
school’s entire instructional program (Davis et al., 2005; Goodwin, Cunningham, &
Childress, 2003). The primary role, however, in creating effective schools is impacting
student achievement by influencing the instructional practices of teachers (Goodwin et
al., 2003; O’Donnell & White, 2005; Printy, 2010).
A review of the research refers to the term principal interchangeably with the
school’s instructional leader. As instructional leaders, it is increasingly important that
principals possess the leadership skills to supervise teachers and the process skills to
create effective schools. It is through these two skill sets that the principal’s work
influences and improves student achievement (Davis et al., 2005; Printy, 2010).
Many facets of instructional leadership have been studied. Researchers have
investigated the traits of effective leaders (Crow, Hausman, & Shribner, 2002), the
behaviors of instructional leaders and what effective instructional leaders do (Blase &
Kirby, 2000; Marzano, Waters, & McNulty, 2005), problems with and types of
instructional leadership (Marks & Printy, 2003), and claims about successful school
leadership (Leithwood, Harris, & Hopkins, 2008). This has not made instructional

6
leadership any more definitive or easier to demonstrate. Despite an extensive review of
literature exploring the role of the principal in affecting student achievement, Hallinger
and Heck (1998) made no specific conclusions about the exact manner in which
principals contribute to school effectiveness. The review of research found the process
that principals implement in creating effective schools “as well as the interplay with
contextual forces that influence the exercise of school leadership” (p. 186) to be highly
complex and beyond any one definition. The literature pointed to the need for future
research on the principal’s role in creating school effectiveness through vision, mission
and goals, and the interaction of “school goals, school structure and social networks,
people, and organizational culture” (p. 187).
Researchers have studied principal preparation programs to determine if
principals are being adequately prepared for the complex positions and the competing
demands placed upon them (Blum, Butler, & Olson, 1987). The principals’ perceptions
of their own preparation programs are not encouraging. In a report by Public Agenda for
the Wallace Foundation, 925 members of the National Association of Secondary School
Principals expressed opinions through a mail survey (Farkas, Johnson, & Duffet, 2003).
As a whole, these principals expressed negative opinions about the preparation and
education they received in their graduate school programs to prepare them for leadership
positions. Only four percent of those surveyed felt that their graduate school programs
were most valuable in preparing them for their positions. Davis et al. (2005) conducted a
review of research and went as far as to state that “principal candidates and existing
principals are often ill-prepared and inadequately supported to organize schools to
improve learning while managing all of the other demands of the job” (p. 4).

7
If it is true that principal preparation programs have inadequately prepared
principals for their current positions, at least two avenues exist for increasing the
effectiveness of schools through the leadership of principals. One avenue is to better
prepare future principals through an improvement in principal preparation programs. A
second avenue is to improve the skills of the principals currently practicing in the field.
There is a wealth of research about principal leadership. Researchers have
acknowledged, however, that knowing what to do and being able to do it are two
different skill sets (Huff, 2009). For example, knowing that effective communication is a
key skill for principals in helping teachers to improve does not mean that principals know
how to communicate effectively. More so, while principals may believe they are
effectively communicating, the participants in that communication may not agree.
Assuming that principals desire to perform effectively in their roles, then formative and
summative feedback from those in the school environment, including supervisors and
subordinates, is important for principals to assess how well their performance is meeting
the expected standards of performance and the goals of the organization (Smither,
London, & Reilly, 2005).
Part of the difficulty in giving feedback to principals and in principals’
evaluations, both of which are designed to improve the performance of the principal, is
determining what to assess and how to assess it (Catano & Stronge, 2007; Glasman &
Heck, 1992). If principals are to be accountable for student achievement through their
roles as instructional leaders, and they are to improve their leadership skills, it is
imperative that they know and understand the expectations, measures, and current level
of their performance. Without the knowledge of the expectations and measures, as well

8
as the level of performance, as the foundation for professional education, efforts to
improve deficiencies in performance are not likely to be productive (Huff, 2009).
As both a formative and summative process, much criticism currently exists about
the effectiveness of evaluating principals’ leadership skills (Goldring, Cravens, et al.,
2009; Samuels, 2011). Research findings have demonstrated that the context in which
principals perform their work has a significant impact upon the effectiveness of their
leadership skills. The contextual factors include the school grade levels, the
socioeconomic makeup of the student population, the curricular content, and the attitudes
of the staff (Glasman & Heck, 1992; Servais & Sanders, 2006; Thomas, Holdaway, &
Ward, 2000).
Despite the extensive research and knowledge that exists about leadership skills,
principals’ leadership characteristics, styles of leadership, traits, and behaviors, student
achievement continues to fall short of expectations (U.S. Department of Education,
2010). In particular, this continues to be true regarding the academic achievement of
students enrolled in career and technical education schools. Career and technical
education participants at the secondary level have “less advantaged educational
backgrounds than nonparticipants” (U.S. Department of Education, 2008, p. xi).
Significance of the Research
A scan of Eric, ProQuest, Google Scholar, and other databases illustrated that little
research exists on the effectiveness of school principals in the context of the area career
and technical education school. The educational environment of the area career and
technical education school is unique for several reasons. First, the educational context is
unique because of the career and technical education curricular content. Second, the

9
student population is unique. Based on 2009 data submitted by the Pennsylvania
Department of Education, Bureau of Career and Technical Education for the U.S.
Department of Education Consolidated Annual Report (CAR), more students who have
individualized education plans (IEP) enroll in career and technical education schools (U.S.
Department of Education, 2008). In addition, the CAR data demonstrated that students
who enrolled in career and technical education schools tended to come from lower
socioeconomic backgrounds than those who did not enroll in career and technical
education schools (L. Burket, personal communication, October 26, 2010). Because of the
unique education environment, the outcome of this research is significant in determining
the skills of principals in the context of the area career and technical education schools.
Schools in the Commonwealth of Pennsylvania are far from reaching the
performance standards of the No Child Left Behind Act of 2001 (U.S. Department of
Education, 2010). Students in part-time area career and technical education schools
perform below the norm of secondary high school students on the Pennsylvania System of
School Assessment (Bureau of Career and Technical Education, Pennsylvania Department
of Education, 2010). Because career and technical education students as a whole
consistently perform below the proficiency level of all students in the Commonwealth of
Pennsylvania, career and technical schools may be considered low-performing schools.
In a report for the U.S. Department of Education, the Institute of Education
Sciences, National Center for Education Evaluation and Regional Assistance, researchers
made four recommendations for turning around low-performing schools, one of which was
to signal the need for dramatic change with strong leadership (U.S. Department of
Education, 2008). If our schools’ instructional leaders are to make changes in their

10
leadership skills or if the chief school leaders are to change the individuals in instructional
leadership positions, they need to know what leadership skills they are looking for,
particularly in the context of the part-time area career and technical education schools.
In addition to the Pennsylvania System of School Assessment, students in approved
career and technical education programs participate in an end-of-program assessment of
the skills learned in the approved program developed by the National Occupational
Competency Testing Institute (NOCTI). The NOCTI assessment is mandated by the
Pennsylvania Department of Education, Bureau of Career and Technical Education, as a
measure of program performance that meets the accountability demands of the No Child
Left Behind Act (2001), and the Carl D. Perkins Career and Technical Education
Improvement Act (2006).
The link between principal leadership and student achievement, although indirect,
has been accepted as a viable concept. Improving the skills of those currently serving as
the instructional leaders in schools is an important strategy in creating effective schools
(Lezotte, 2004). Research findings have shown that principal leadership is second only to
teacher quality in creating effective schools (Leithwood, Harris, & Hopkins, 2008;
Marzano, Waters, & McNulty, 2005). Those who supervise principals need a reliable and
valid instrument by which to assess principal effectiveness and provide feedback to
principals that will enable them to improve their skills. The strategy to provide feedback
to principals in this research project was the 360-degree feedback instrument.
Research Questions
There were four research questions for this study related to the conceptual
framework of learning-centered leadership.

11
1. To what extent did principals in selected career and technical schools demonstrate
learning-centered leadership skills as measured by the Vanderbilt Assessment of
Leadership in Education?
2. To what extent, if any, did principals in selected career and technical schools
demonstrate learning-centered leadership skills different from the national norm?
3. To what extent, if any, did the perceptions of leadership skills differ among
principals, teachers, and supervisors?
4. To what extent, if any, did the leadership skills of selected career and technical
education principals show an association with student achievement as measured by
the National Occupational Competency Testing Institute (NOCTI) end-of-program
assessment?
Limitations
This study investigated principals’ learning-centered leadership skills in 16 part-
time area career and technical education schools in central Pennsylvania measured by the
Vanderbilt Assessment of Leadership in Education (VAL-ED) assessment instrument.
This study did not represent a scientific random sample of all career and technical
education schools or part-time area career and technical education schools in the
Commonwealth of Pennsylvania. Even though every effort was made to match the
characteristics of instructional leaders (principals) in this study to the characteristics of
the population of instructional leaders in all career and technical education schools in
Pennsylvania, the results of this research study may not be generalized to the population
of part-time or comprehensive area career and technical education schools.

12
Each school’s administrative director in this study was asked to select an
assessment monitor whose responsibility it was to read a script prepared by the researcher
describing the purpose of the study and providing instructions to completing the online
survey instrument. Every attempt was made to standardize verbal instructions given to
participants to ensure that all participants received the same information, but it cannot be
assured that each monitor followed the script as requested.
Although there is widespread support for the professional standards of the
International State School Leaders Consortium (ISSLC), it is not universally accepted
that these standards are sufficient or appropriate for feedback or assessment (English,
2003). The VAL-ED instrument is based heavily on the ISSLC standards.
The process of 360-degree feedback has inherent weaknesses because it is based
on perceptions. If the perceptions of the principal’s supervisor are not accurate, the
feedback to the principal may not be useful. If the teachers are reacting emotionally to
the behaviors and actions of the principal who is performing the responsibilities of the
job, the feedback may not be accurate. The ability of the principal to self-assess his or
her own skills may also be a limitation.
Finally, the cost of the VAL-ED instrument ($360.00 per principal) limited the
number of part-time area career and technical schools selected for this study. It was
expected, given the extent of the involvement of the principals, the principals’ teachers,
and the principals’ supervisor, that the outcome of this study would produce a low rate of
return unless a school’s administration made a personal commitment. For this reason,
part-time area career and technical education schools whose instructional leaders met the
statewide characteristics were selected (gender, years of experience as a principal, and

13
years of experience as a teacher). The researcher then personally contacted the
administrative directors and encouraged a cross section of schools from the three regions
of the state based on the teacher preparation programs served by Indiana University of
Pennsylvania, Pennsylvania State University, and Temple University (western, central,
and eastern parts of the state, respectively).
Definitions of Terms
Instructional leadership is defined by two core functions: providing direction to
teachers and exercising influence over instruction (Seashore-Louis, Leithwood,
Wahlstrom, & Anderson, 2010). Principals have direct supervision over teachers. For
the purpose of this research, the term principal was used to describe the individual
responsible for instructional leadership in the school. In some career and technical
schools, the position of Assistant Director directly supervised teachers. In these cases,
the assistant director was assessed. In other schools, the principal directly supervised
teachers. In these cases, the principal was assessed.
Goldring, Porter, Murphy, Elliott, and Cravens (2009) defined two intersecting
elements about which the instructional leader is assessed using the Vanderbilt
Assessment of Leadership in Education. Core components are the characteristics of
schools that support student learning and enhance the ability of teachers to teach. Key
processes refer to how leaders create those core components.
The Pennsylvania Department of Education (2010), Bureau of Career and
Technical Education defined part-time area career and technical education school
(ACTES) in terms of what it is not and does not provide, as opposed to what it is and
does provide.

14
The term ‘area career and technical education school’ means— a public school
that provides vocational technical education to secondary school students, out-of
school youth and adults in a geographical area comprised and operated by one or
more school districts and established under Sections 1840-1853 of the School
Code (24 P.S. 18-1840-18-1853). (p. 4)
A part-time career and technical education school is also distinguished from a
comprehensive career and technical education school that “provides both basic and
career and technical education. A part-time area career and technical education school
does not provide basic education” (Pennsylvania Department of Education, p. 5).
Assumptions
At the foundation of this research was the premise that teachers have direct
influence over the quality of instruction and student achievement, and principals have a
direct influence over teachers. The subject of study in this research was the instructional
leader who had a direct supervisory role over teachers and, as a result, had an indirect
impact upon student achievement. Regarding the professional preparation and licensure
for the leadership position, it was assumed that the person in the position of instructional
leader was properly certified in the Commonwealth of Pennsylvania by the Bureau of
School Leadership and Teacher Quality for the position to which he or she was assigned.
This study assumed that the research used to determine the objectivity, reliability,
and validity of the Vanderbilt Assessment of Leadership in Education (VAL-ED)
instrument was accurate and that it accurately portrayed the key processes and core
components of learning-centered leadership for effective schools.

15
It was assumed that the teachers who were absent on the day of assessment would
rate their principal similarly to the teachers who were present. It was also assumed that
the responses of the teachers and supervisors of their principals were reliable and without
favoritism, bias or unfairness, and that the principals accurately assessed their own skills.
Conceptual Framework
The link between effective schools and effective leaders, although indirect, has
been demonstrated by researchers over the past four decades. There is no doubt that
effective schools require effective leaders. If principals are not coming to their roles with
the leadership skills necessary for effective schools and if they are not receiving
appropriate feedback and focused professional education to improve their leadership
skills, schools will not improve (Catano & Stronge, 2007). The use of a research-based
instrument to provide an assessment of the learning-centered leadership skills of
principals for the purpose of formative and summative feedback is critical to improving
school leadership and creating school effectiveness (Goldring, Cravens, et al., 2009).
Principals may use this feedback to form the basis of their own professional education
and learning or to engage in professional learning communities related to their own
leadership practice.
Learning-centered leadership is the conceptual framework that defines the
leadership behaviors for creating vision for learning, instructional program, curricular
program, assessment program, community of learning, resource acquisition and use,
organizational culture, and social advocacy (Murphy, Elliott, Goldring, & Porter, 2006).
The Learning-Centered Leadership model moves the center of emphasis of the school and
principal from a focus on teaching inputs to a focus on student learning outputs. It is

16
upon this focus of student learning that the Vanderbilt Assessment of Leadership in
Education is based.
The conceptual framework of Learning-Centered Leadership is based on two key
dimensions of principals’ leadership behaviors, core components and key processes.
In our framework, core components refer to the characteristics of schools that
support the learning of students and enhance the ability of teachers to teach
(Marks & Printy, 2003; Sebring & Bryk, 2000). Key processes are leadership
behaviors, most notably aspects of transformational leadership traditionally
associated with processes of leadership that raise organizational members’ level
of commitment and shape organizational culture (Burns, 1978; Conley &
Goldman, 1994; Leithwood, 1994). (Goldring, Porter, et al., 2009, p. 5)
Using this definition, the framework includes both the what and the how. The
core components are the specific conditions (what) that school leaders create to produce
student learning. The key processes define how school leaders create those outcomes to
produce student learning. The assessment of learning-centered leadership skills, then,
focuses on the intersection of these two dimensions.
The conceptual model begins with the precursors to leadership behaviors. These
are knowledge and skills, personal characteristics, and values and beliefs that the
principals hold about students, learning, effective schools, and other attributes that form
the basis of their behaviors in the performance of their professional roles. These
precursors form the basis of the leader’s behavior related to the core components of high
standards for student learning, rigorous curriculum, quality instruction, culture of
learning and professional behavior, connections to external communities, and

17
performance accountability. The precursors are not assessed in the Learning-Centered
Leadership conceptual model, however, because the model focuses on the intersection of
core components and key processes as they relate to student learning within the context
of the principals performing their jobs. The model assumes this intersection of core
components and key processes is what creates student success. The model does not
assume a direct relationship between principal leadership behaviors and student success.
It does assume that leadership behaviors indirectly influence student success by leading
to changes in school performance (Goldring, Cravens, et al., 2009). The value added to
student success is measured by student achievement, student attendance, student
graduation, and college enrollment.
In the Learning-Centered Leadership conceptual model, the context in which the
leadership skills are assessed is considered and viewed as an integral part of the
assessment. However, the context is not used as an excuse for lack of leadership skill
performance. This is one of the reasons that the context of the part-time area career and
technical education school is particularly important.
The six core components and six key processes are grounded in research and the
professional standards of the Interstate School Leaders Licensure Consortium (ISLLC).
The review of related literature in Chapter 2 of this research study describes the research
base for the core component and key processes in detail.
Chapter Summary
Since 1970 a significant body of research has been created that demonstrated
conclusively that student achievement is based on effective schools. In addition,
Leithwood, Harris, and Hopkins (2008) asserted that large-scale quantitative and

18
qualitative data supported that the leadership efforts of principals is second only to that of
teachers in creating effective schools that lead to high levels of student achievement. The
research base indicating the need for particular kinds of leadership skills from effective
principals has shifted from the need for management skills to instructional leadership
skills in the 1980’s to learning-centered leadership skills in 2010.
In Pennsylvania, one measure of student achievement is the Pennsylvania System
of School Assessment. On the PSSA, career and technical education students typically
do not perform as well as noncareer and technical education students. A second measure
of student achievement for career and technical education students is the National
Occupational Competency Testing Institute (NOCTI) end-of-program assessment. The
NOCTI assessment meets the accountability demands of No Child Left Behind of 2001
and Carl D. Perkins Career and Technical Education Act of 2006. Because the NOCTI
assessment is a measure of student achievement only for career and technical education
schools, a student comparison to noncareer and technical education students was not
possible. However, it is clear from the results of PSSA data that career and technical
education schools are in need of effective school leaders.
This study added to the body of research related to the conceptual framework of
learning-centered leadership with its focus on core components and key processes, and its
relationship to student achievement. The study determined the extent of learning-
centered leadership skills of principals in the unique context of the part-time career and
technical schools. It determined the difference, if any, in the leadership skills of
principals in career and technical education from the national norm. It determined the
difference, if any, among the perceptions of leadership of principals, supervisors, and

19
teachers, and the extent to which an association existed between specific leadership skills
and student achievement measured by the NOCTI assessment.
With this additional knowledge, principals may be better able to plan focused
professional education experiences that will enhance their leadership skills, and as a
result, have a more significant positive impact on student learning. Further, for those
who analyze principal preparation programs, this study may support the need for
modifications to preparation programs to better prepare principals for their future roles in
career and technical education schools.

20
Chapter 2
LITERATURE REVIEW
Introduction
The purpose of this research study was to investigate the learning-centered
leadership skills of principals in selected career and technical education schools using the
Vanderbilt Assessment of Leadership in Education (VAL-ED) principal assessment
instrument. The uniqueness of this research study was that it examined leadership from
the conceptual framework of the learning-centered leadership model and in the context of
the part-time career and technical education school. The results of this study are not
generalizable because it did not include a random sample of all career and technical
education schools in Pennsylvania. However, the value in this study is that the findings
may assist principals in part-time career and technical education schools in their efforts to
focus professional education activities on specific aspects of their personal leadership
performance where deficiencies may exist which will lead to increased student
achievement. The results may also provide insight to those responsible for principal
preparation programs and those developing professional education activities for
principals whose careers lay in career and technical education.
The review of literature in this chapter begins with a review of effective schools
research and the relationship between effective schools research and leadership. The
changing roles of the principal are explored as they relate to various leadership theories.
This discussion includes current thought and theory on the characteristics, behaviors, and
processes required for effective leadership within the field of education.

21
The next section includes a review of leadership theories applicable to the
conceptual framework of learning-centered leadership. These include trait theory,
contingency theory, shared and distributed leadership, transactional and transformational
leadership, change leadership, and instructional leadership.
Following the review of leadership theories is a discussion of the research base
for the conceptual framework of learning-centered leadership. The conceptual
framework of learning-centered leadership described in detail in this section is the
foundation of the Vanderbilt Assessment of Leadership in Education (VAL-ED). This
section includes the relationship of the conceptual framework to the professional
standards of the Interstate School Leaders Licensure Consortium 2008 adopted by the
Council of Chief School Officers and the National Policy Board for Educational
Administration.
An analysis of the research surrounding the complexity of principal assessment is
presented as evidence of the need for a valid and reliable assessment instrument, such as
the VAL-ED. Finally, the context of the part-time career and technical education school
is presented and discussed as the unique educational environment in which leadership
skills of the instructional leaders in this study were assessed.
Effective Schools Research
Research studies to examine the characteristics of effective schools have been
conducted since 1970. Edmonds (1982; 1983) conducted prominent studies of high-
poverty, high-minority, high-performing elementary schools. He was one of several
researchers of that period to respond to criticism of the public school system. In his
report on programs of school improvement, he noted, “much had been made recently of
22
the decline of teaching and learning in public schools” (p. 3). Research as early as 1977
conducted by Brookover and Lezotte (as cited in Edmonds, 1983) was dedicated to
proving the theory that although family background and socioeconomic conditions may
have had an impact on student achievement, schools themselves had a greater impact on
student achievement. This research was in response to James Coleman’s (1967) work for
the Equal Educational Opportunity Study, which advanced that the conditions that
mattered least for student achievement were facilities, curriculum, and teachers.
According to Coleman, the conditions that mattered most for student achievement were
the educational and economic background parents and of the fellow students.
A group of researchers in the period between the period 1970 and 1985 focused
on instructional effectiveness that Edmonds (1983) defined as “when all students obtain
at least minimum academic mastery as measured by standardized achievement tests”
(p. 2). This was to be distinguished from academic quality where higher-order thinking
skills and intellectual capacity were demonstrated. Collectively, these studies spurred a
movement dedicated to creating a body of empirical research that Edmonds initially
described as school effects and that would become commonly referred to as effective
schools research.
Although not listed in rank order, Edmonds (1983) noted five characteristics of an
effective school, the first of which was “the leadership of a principal notable for
substantial attention to the quality of instruction” (p. 8). The other critical characteristics
were a pervasive focus on academics, a safe and orderly learning environment, teacher
behaviors that demonstrated they believed all students could achieve minimum mastery,
and monitoring student progress for the purpose of program evaluation. Edmonds noted

23
that none of the characteristics were independent of the others and that all must exist
collectively to produce effective schools. Edmonds further noted that in order to produce
effective schools when leadership was deficient, a needs assessment of the principal’s
leadership was necessary to create a remediation plan to correct weaknesses and
deficiencies before any other changes be implemented in the school.
From 1980 to 1996, several other key researchers focused on characteristics found
in effective schools. Zigarelli (1996) conducted an empirical analysis of data from the
National Educational Longitudinal Study. He analyzed the research conclusions from
other key researchers of the time, including Block (1983), Coyle and Witcher (1992),
Downer (1991), and Purkey and Smith (1983) (as cited in Zigarelli, 1996). Each study
identified some aspect of principal leadership as central to effective schools. With
phrases such as “principal supports teachers, principal facilitates an academic climate,
principal spends significant portion of the day on instruction-related activities” (p. 104),
the emerging body of effective schools research consistently supported the dominant role
principals played as instructional leaders in the creation and development of effective
schools.
As of 2010, the five characteristics of effective schools originally defined by
Edmonds have remained, but they have been further refined and expanded by Lezotte
(2004) and other researchers. The definition of effective schools expanded to include
higher-order thinking skills and intellectual capacity that were specifically omitted from
the original definition of effective schools (Edmonds, 1982; 1983). Effective schools
research transitioned from a study and description of the characteristics that existed in
schools already found to be effective to a study on the conditions and processes that were

24
necessary to create effective schools. In order to make this shift from descriptive to
prescriptive, effective schools researchers focused on the processes necessary to produce
effective schools, now known as the Seven Correlates of Effective Schools (Lezotte, n.d.).
Other concepts of effective schools research including distributed leadership,
organizational management, and organization culture are embedded in what has become
known as the Seven Correlates of Effective Schools (Lezotte, 2004). This body of
effective schools research focused on the role of principals in bringing about the
conditions for effective schools. The process included communicating a clear and
consistent vision for student achievement, aligning school resources and personnel to the
vision, and engaging key stakeholders (teachers, parents, community members, and
students) in achievement of the vision (Hallinger & Heck, 1998; O’Donnell & White,
2005). Fundamental to the correlates is the focus on student learning. The key to
successful implementation of the correlates rests on the focus on student outcomes, not
on the inputs. This concept of focusing on student outcomes is central to the conceptual
framework of learning-centered leadership (Murphy et al., 2006).
Carter (2000) added to the research of effective schools in a study of 21
successful schools characterized by high poverty. Although 75 percent or more qualified
for the federal lunch program, median national standardized test scores were above the
65th percentile. Eleven of 21 schools performed at or above the 80
th percentile. The
schools included charter schools, private schools, and 15 public schools. Carter found
that strong principals who held students and teachers accountable for meeting high
performance standards led each of these schools. Carter also found that schools in which

25
extreme educational deficiencies existed were most impacted by effective leadership.
Seven common traits were identified in high poverty, high performing schools:
Principals were free to use their resources, hire, and determine the curriculum.
Measureable goals were used to monitor achievement, and teachers were personally
responsible for student performance.
Principals created a culture of learning for teachers through use of master teachers.
Principals focused on regular testing to monitor student and teacher performance.
Principals created a positive climate of school discipline through student
achievement.
Principals actively engaged parents to make the home a center of learning.
Principals demanded that their students and teachers devote more time to the task of
teaching and learning.
Chenoweth (2010) found common characteristics in approximately 24 high
performing, high poverty, and high minority schools. The schools she studied did not
have entrance requirements for admission. She found five common characteristics that
add to the body of effective schools research.
First, all adults were responsible for their own performance in the school. The
principals delegated, shared, and distributed leadership, and held adults accountable for
performing their responsibilities. Second, she found that principals who inspected what
they expected achieved high results. Principals inspected lesson plans, evidence of
student work that demonstrated higher-order thinking, and classrooms to confirm that
students were highly engaged. Third, principals were “relentlessly respectful and
respectfully relentless” (Chenoweth, 2010, p. 20). Principals brought urgency to the

26
discussion of student achievement and did not accept excuses for lack of performance.
When excuses were offered, the principal brought the discussion back to the teacher
being responsible for student performance. Fourth, principals used student achievement
data to make decisions. If the data showed something was working, principals continued
it. If the data showed the contrary, principals directed the resources to another strategy.
Fifth, principals felt responsible for doing whatever it took to ensure that students
learned. If that meant fundraising for textbooks or cleaning the halls, principals
delegated or completed the tasks themselves.
The body of research on effective schools since the 1980s demonstrated a shift in
focus from the characteristics of effective schools to the process of creating such schools.
Central to successful school implementation was a leadership focus of making a positive
impact on instructional practices through high expectations, high accountability, and a
measurement of success based on student achievement, by creating a culture of
professional learning, and by engaging parents and students. Effective leadership had a
more significant effect on student achievement in low-performing schools (Lezotte,
2004.)
Changing Role of the Principal
Leadership in schools may be distributed, shared, or delegated to others, but the
ultimate responsibility for leadership rests with the school principal (Leithwood, Harris,
& Hopkins, 2008). The school principal’s role and responsibilities have changed and
become far more complex over the past twenty years. However, there is little debate that
effective leaders play a critical role in creating and maintaining an effective school
system. From Edmonds (1982) to Leithwood et al. (2008) researchers make strong

27
claims that school leadership matters. It has an indirect effect on student achievement,
and one is unlikely to find an effective school without an effective school leader. The
model depicted in Figure 1 illustrates the indirect effect that leadership has on student
learning.
Figure 1. Model illustrating how leadership indirectly affects student learning. School
leadership directly effects teachers, classroom conditions, and school conditions, and
through these factors, influences student learning. Adapted from “ Investigating the Links
to Improved Student Learning: Executive Summary of Research Findings” by K. L.
Wahlstrom, K. Louis-Seashore, K. Leithwood, & S. E. Anderson, 2010, retrieved from
http://www.wallacefoundation.org/KnowledgeCenter /KnowledgeTopics
/CurrentAreasofFocus/EducationLeadership/Documents/Learning-from-Leadership-
Investigating-Links-Ex-Summary.pdf , p. 6. Copyright 2010 by the Wallace Foundation.
Student/Family
Background
State Leadership,
Policies, and
Practices
District
Leadership,
Polices, and
Practices
SCHOOL
LEADERSHIP
Other
Stakeholders
Leaders
Professional
Development
Experiences
Classroom
Conditions
Teachers
School
Conditions
Student
Learning
28
The school principal’s role evolved from the manager of the building to “street
level bureaucrat, instructional manager, instructional leader, and transformational leader,
as well as several other images that describe changes in perceptions about the role”
(Glasman & Heck, 1992, p. 8). While it is true that the role has changed, expectations of
the principal continued to include elements from each of the previous roles.
Goodwin et al. (2003) conducted a two-part study of secondary school principals
to identify how principals believed their roles had changed over the years. Forty-five role
descriptors were identified from the National Policy Board for Educational
Administration (as cited in Goodwin et al., 2003). The first part of the study involved a
Delphi process. The Delphi participants were selected based on their status as Principals
of the Year in 2000-2001 in the MetLife-NASSP (National Association of Secondary
School Principals) recognition program. Based on the findings from the Delphi
methodology, the Principal’s Role Questionnaire was developed. The questionnaire was
distributed to 375 additional NASSP principals. The study validated the increasing
complexity of the role of the principal, the competing priorities for the principal’s time,
accountability conflict, autonomy conflicts, and responsibility conflicts. The principals
noted that although their roles had changed from building managers to instructional
leaders over the life of their tenure, no responsibilities had been removed from their list
of duties. They identified important responsibilities in five leadership areas:
instructional leadership, organizational leadership, strategic leadership, community
leadership, and political leadership. They also supported the notion that leadership is
distributed to and shared with the various professionals with whom they work,
complicating their roles and responsibilities all the more.
29
The literature dating back to Edmonds (as cited by Witziers, Bosker, & Kruger,
2003) sought to define specific leadership characteristics or behaviors that lead to
positive outcomes of student achievement. “According to these findings, principals
should have high expectations of teachers and student achievement, supervise teachers,
coordinate the curriculum, emphasize basic skills, and monitor student progress” (p. 401).
The early quantitative research studies sought to establish a direct relationship
between leadership and student achievement. This approach led to mixed, limited, or null
effects. The effect on student achievement was demonstrated, however, using an indirect
approach of studying the outcomes brought about by a change in teaching performance,
school focus, and organizational culture. Research to prove a direct relationship
continued to demonstrate mixed results, however, even when school leadership was
defined in varying ways (Witziers et al., 2003).
The most significant relationships have been demonstrated when leadership has
been defined with elements of transformational leadership (Leithwood & Jantzi, 2000;
2005). As principals change the school culture through transformational leadership
practices, Leithwood and Jantzi (2005) demonstrated the indirect effects on student
achievement were statistically significant and clear. They analyzed three broad practices
associated with transformational leadership: setting the direction, developing people, and
redesigning the organization. The third category, redesigning the organization, took into
account the mediating effects in which leadership was demonstrated. They further
studied the extent to which mediating effects influenced leadership. Through this
research, it was demonstrated that similar leadership characteristics implemented through
similar processes did not bring about the same level of school transformation that led to

30
an increase in student achievement. It was suggested that context played a major role in
the extent to which leadership is effective. Still, leadership was not proven to have a
causal relationship with student achievement (Leithwood & Jantzi, 2005).
Research has sought to synthesize in a concise list what it is that effective
principals should be able to do. Cotton (2003) defined a list of 25 categories of principal
behaviors based on a narrative review of 81 research reports between 1983 and 2003.
The study reported that these 25 categories of behaviors had a positive effect on student
achievement as well as student attitudes, teacher behaviors, and student retention rates.
The behaviors were
creating a safe and orderly school environment;
identifying and communicating vision and goals focused on high levels of student
learning;
demonstrating and demanding high expectations for student learning;
demonstrating self-confidence, responsibility, and perseverance;
being visible and accessible to teachers and students;
creating a positive and supportive school climate;
providing emotional and interpersonal support;
engaging parents and the community;
creating school rituals;
creating a culture of shared leadership staff empowerment;
collaborating with others;
pursuing personal growth and professional development;
aiming for high levels of student learning;

31
expecting and planning for continuous improvement;
focusing the discussion on instructional issues;
observing and providing feedback to teachers;
supporting teacher autonomy;
supporting risk taking;
providing teachers with professional education opportunities;
protecting professional time;
monitoring student progress;
sharing student outcomes and findings;
using student progress data for program improvement
recognizing student and staff achievement; and
role modeling.
Witziers, Bosker, and Kruger (2003) and Cotton’s (2003) research complemented
the findings of Marzano, Waters, and McNulty (2005). Cotton’s findings were based on
narrative review of literature of the same 20-year period of leadership research, although
she included more studies than Marzano et al. (81 versus 69, respectively). Weitzers et
al. used many of the same studies in the analysis as Marzano et al., but Weitzers et al.
were trying to demonstrate a direct effect between leadership and student achievement.
Weitzers et al. found almost no relationship between principal behavior and student
achievement (r = .02). Weitzers et al. suggested findings that were more impressive
might be found using a more robust analysis or through a study of an indirect
relationship. That turned out to be accurate, as Marzano et al. found a higher correlation
(r = .25) “between the leadership behavior of the principal in the school and the average

32
academic achievement of students in the school” (p. 10) using a model that tested for an
indirect relationship.
Marzano et al. (2005) used the term responsibilities to define leadership
characteristics and practices. The 21 responsibilities were affirmation; change agent;
contingent rewards; communication; culture; discipline; flexibility; focus; ideas/beliefs;
teacher input; intellectual stimulation; involvement in curriculum, instruction, and
assessment; knowledge of curriculum, instruction, and assessment; monitoring/
evaluating; optimizer; order; outreach; relationships; resources; situational awareness;
and visibility. The ten responsibilities having the greatest influence on student
achievement in order of the highest to lowest correlation (r) were situational awareness
(context); flexibility; monitoring and evaluating; outreach; discipline; change agent;
culture; knowledge of curriculum, instruction, and assessment; teacher input; order; and
resources.
The role of principals has changed dramatically over the years. Most notably,
responsibilities have been added to the role of the principal, but few responsibilities have
been eliminated. This serves to add to the complexity of the job, as principals seek to
meet or exceed the increasing performance expectations of the position.
Related Leadership Theories
Numerous leadership theories are found throughout the literature that attempt to
define and describe traits, characteristics, behaviors, attitudes, and performances that
constitute effective leadership. The sheer number of different theories denotes the
complex nature of leadership, leadership behaviors, and performance expectations.
Leaders are expected to solve complex problems, build collaborative relationships, create

33
vision and shared values, in addition to the responsibilities necessary to maintain an
orderly, efficiently run building, and to provide for appropriate student discipline (Cotton,
2003; Marzano, Waters, & McNulty, 2005; Waters, Marzano, & McNulty, 2003). The
review of related research regarding leadership demonstrates complementary and
opposing conclusions at times.
Leadership may be defined in a variety of ways. Seashore-Louis, Leithwood,
Wahlstrom, and Anderson (2010) defined leadership by two core functions: providing
direction and exercising influence. Defining leadership does not make the ability to
demonstrate effective leadership any less complex. Effective leadership is influenced and
challenged by the environmental context in which leadership is demonstrated and the
degree to which stability or change exists within the organization (Seashore-Louis et al.,
2010). Further, leadership skills must be adapted to the degree of change being sought.
Theories of leadership have evolved. Older theories were simplistic in an
understanding that leaders were born, not made (Kirkpatrick & Locke, 1991). Newer
theories pointed toward the complexity of leadership that required leaders to transform
organizations, build relationships, collaborate with and motivate others (Sanders &
Servais, 2006).
Trait theory.
Trait theory, sometimes referred to as the great man theory, has a long history in
research. Even so, it has implications for the conceptual framework of learning-centered
leadership. Trait theory was based on the assumption that leaders are born, not made,
that certain traits make for more effective leaders than others. Kirkpatrick and Locke
(1991) studied traits of effective leaders. Their research suggested that six traits were
34
consistent within each of the effective leaders they studied. They found that “leaders
who have the requisite traits—drive, desire to lead, self-confidence, honesty (and
integrity), cognitive ability, and industry knowledge—have a considerable advantage
over those who lack these traits” (p. 58).
The findings demonstrated that some aspects of leadership may be learned and
developed, such as self-confidence and industry knowledge. Some traits are innate,
desire to lead, honesty, and integrity. Cognitive ability was not defined as knowledge. It
was defined as “intelligent enough to formulate suitable strategies, solve problems, and
make correct decisions” (p. 55). Kotter (as cited in Kirkpatrick and Locke, 1991),
described it as a “keen mind and being able to multitask, think strategically, and
demonstrate strong analytical ability and good judgment” (p. 55). Kirkpatrick and Locke
found that experience may allow a leader to further develop these abilities, but cognitive
ability was least likely to be developed through experience or by increasing one’s
knowledge. The findings pointed to the necessity for personal characteristics for
leadership success, but possessing these traits did not assure success in and of itself. This
also supports the importance of precursors to leadership behavior identified through the
learning-centered leadership framework. This study also demonstrated that it is the
context in which leadership skills are practiced that influences effectiveness.
Contingency Theory.
In its simplest and briefest form, contingency theory states that context matters
(Goldring, May, & Huff, 2010). Contingency theory suggests that an effective leader in
one school may not achieve the same level of effectiveness in another school because of
the different context and situations in which the leadership skills are demonstrated.

35
Researchers have suggested that school size, grade level configuration, curricular content,
ethnic and socioeconomic makeup and diversity of the student population alter the effects
of leadership within the school setting. However, Leithwood, Harris, and Hopkins (2008)
proposed that it was leader’s responsiveness to the context that created and increased
effectiveness, rather than the context of the educational environment mediating the
effects of leadership. This is in contrast to the findings of other research.
Situational theory, a close concept to contingency theory, supports that not only is
the context of the school influential, but each specific situation also affects the
effectiveness of leadership. According to situational theory, a principal would use
different strategies working with a first year teacher than would be appropriate and
effective to use with a 30-year teacher in discussing elements of an effective lesson.
Likewise, an emergency would require different leadership skills than introducing a new
instructional technique (Goldring, May, et al., 2010).
Goldring, May, et al. (2010) cautioned that contingency and situational theories
are so significant that success or failure of leaders depends on their understanding of this
important concept. The contextual variables included in this study were economic
disadvantage, as measured by students receiving free and reduced lunch prices, African-
American student population, and students receiving special education services. With the
exception of more African-American students, these variables mirror the student
population of career and technical education schools that tend to have student populations
that are more economically disadvantaged and more in need of special education services
than the populations of the sending school districts from which the students originated
(U.S. Department of Education, 2008). Goldring, May, et al. found that leaders who

36
failed to respond to these contextual variables in the learning environment were far less
effective that those who acknowledged and were responsive to the context by altering the
allocation of their time. Rather than the context defining leadership, the leader accurately
defined the context and the needs of situation.
Transactional and Transformational Leadership.
The discussion of the need for transactional and transformational leadership is
germane to this research because schools are increasingly in a continuous state of change.
Changes in the schools are inevitable as administrative and instructional staff members,
the standards and measures of effective schools, the student body, and other internal and
external forces mandate change. Schools are a reflection of the world in which we live
where change is constant. Change theory will be discussed in its own section.
Transformational leadership is a key theory behind the learning-centered
leadership framework. Transformational leadership itself has been studied, described,
and detailed differently through the research of various authors. Burns (as cited by Bass,
1990) described transformational leadership as leadership behaviors that motivate others
to a higher commitment to the organizational goals. Through the interaction of the leader
and followers, the commitment and motivation becomes more than the sum of the parts,
as both leaders and followers act to motivate each other to higher levels of performance.
The intrinsic behaviors of the leader place the interests of the leader behind the interests
of the organization, described in Kirkpatrick and Locke (1991) as the desire to lead.
Bennis and Nanus (as cited in Leithwood & Jantzi, 2005) described transformational
leadership in the context of leadership behaviors demonstrated by “developing a vision
for the organization, developing commitments and trust among workers, and facilitating

37
organizational learning” (p. 177). Bass (1990) defined the differences between the
characteristics of transformational and transactional leaders clearly and found them to be
contrasting leadership styles.
Table 1
Characteristics of Transformational and Transactional Leaders
Trait Transformational Leaders
Charisma Provides vision and sense of mission, instills pride, gains
respect and trust.
Inspiration Communicates high expectations, uses symbols to focus
efforts, expresses important purposes in simple ways.
Intellectual Stimulation Promotes intelligence, rationality, and careful problem
solving.
Individualized Consideration Gives personal attention, treats each employee
individually, coaches, advises
Trait Transactional Leaders
Contingent Reward Contracts exchange of rewards for effort, promises
rewards for good performance, recognizes
accomplishments.
Management by Exception
(active)
Watches and searches for deviations from rules and
standards, takes corrective action.
Management by Exception
(passive)
Intervenes only if standards are not met.
Laissez-Faire Abdicates responsibilities, avoids making decisions
Note. Adapted from “From Transactional to Transformational Leadership: Learning to
Share the Vision,” by B. M. Bass (1990), Organizational Dynamics, 18(3), p. 22.
Copyright 1990 by Elsevier Science Publishing Company, Inc.

38
Bennis (1959) described the difficulty in defining in a theoretical framework any
form of leadership and the extreme complexity, in particular, of transformational
leadership. The ability to integrate the needs of the organization with the needs of the
individual points to the intricate skills necessary for the transformational leader, as these
needs are thought to be incompatible with each other. The needs of the individual are
motivated by what is best for the individual, while the needs of the organization are
motivated by what is best for the organization. Bennis made the point that it is the role of
the transformational leader to align the needs of the individual to that of the organization
in a manner that makes them one and the same. In doing so, individuals seem to be
acting in their own best interest when they act in the best interest of the organization.
The complexity of transformational leadership is further demonstrated by the
descriptions and discussions of transformational leadership in the literature, depending
upon the author, as being either in contrast or complementary to transactional leadership
(Bass, 1990). Several authors will be referenced to illustrate this difference.
Leithwood (1994) conducted research to determine the effect of transformational
leadership on student achievement, particularly as it related to the need to change schools
to make them more effective. The research included seven quantitative studies of 289
schools. The research demonstrated a direct impact on producing school change
associated with positive effects on student achievement. The discussion and conclusions
cited in this work were that transformational and transactional leadership should be
viewed as two distinct models. However, there were tenets of transactional leadership
that increased the likelihood of successful change. Because of this, Leightwood proposed
that transformational leadership complemented transactional leadership.
39
Leithwood (1994) concluded that transformational leaders worked toward three
key goals that lead to their effectiveness:
1. They developed a collaborative climate within the school.
2. They contributed to the continuous professional development of teachers.
3. They expanded the problem-solving capacity of the school.
Further, the findings demonstrated that successful implementation of transformational
leadership skills was based largely on the context in which the skills were demonstrated.
Schools in various stages of change required more characteristics of either transactional
or transformational leadership. At the beginning stages of change, transactional
leadership was productive. Once moving in a positive direction toward effective schools
models, the more transformational leadership skills that were necessary. Consistent with
other researchers, Leithwood concluded that leaders who understood the context and the
situation were better able to use transactional or transformational leadership skills as
necessary to bring about the desired results.
The model of transformational leadership developed from our own research in
schools including factor analytic studies, describes transformational leadership
along six dimensions: building school vision and goals; providing intellectual
stimulation; offering individualized support; symbolizing professional practices
and values; demonstrating high performance expectations; and developing
structures to foster participation in school decisions (Leithwood & Jantzi, 2000,
Transformational leadership section, para. 5)
Leithwood and Jantzi’s (2005) review of transformational research in schools
found four key transformational leadership behaviors that had a positive yet indirect

40
effect on student achievement. They were setting directions, which included Bass’s
(1990) charisma component, helping people, redesigning the organization, and
transactional and managerial skills. In a review of 170 research studies, Leithwood and
Jantzi (2000) concluded that broadly defined to include aspects of transactional
leadership, transformational leadership had a positive and significant impact on
perceptions of organizational effectiveness, student outcomes, and student engagement.
Distributed Leadership.
Included in the research on transformational leadership and change theory is the
concept of distributed leadership. In studies of organizations, no organizations were
effective without an effective leader, and none of the theories on effective leadership
attributed the organization’s success to the skills of the leader alone. It was the through
the behaviors of and processes put in place by the leader that the organization achieved
its goals. Distributed leadership is defined in Spillane, Halverson, and Diamond (2001)
“around four ideas: leadership tasks and functions, task enactment, social distribution of
task enactment, and situation distribution of task enactment” (p. 23). The research on
distributed leadership demonstrates that the context is the determining factor in when,
how, and with whom leadership is distributed. Using transformational leadership as the
backdrop, distributed leadership includes the process of empowering others to act or
motivating others to act to meet the goals of the organization. Through distributed
leadership, the leader analyzes the context and the followers in determining how the
leader’s actions support others to achieve the desired results.
Distributed leadership is the practice of leadership and viewed “as a product of
interactions of school leaders, followers, and the situation” (Spillane, 2005, p. 144). In

41
this way, distributed leadership is defined by the interactions between leaders and
followers in a particular situation more so than about power being distributed to or shared
with others as in shared, collaborative, or collective leadership. Important to the concept
of distributed leadership is the understanding that interactions are not merely influenced
by, but are dependent upon, the task and context in which leadership is demonstrated.
The context defines the leadership interactions of leaders and followers.
Printy (2010) conducted a review of the literature since 2000 on principal
leadership practices influencing student achievement. This review was divided based on
the methodology used in each study. This work analyzed the context of leadership within
the interactions of principals and teachers in a distributed leadership practice. The studies
that were reviewed reinforced the central role that the principal plays in student
achievement through a distributed leadership approach. The findings also demonstrated
that the actions of transformational principals were critical in motivating teachers to
move beyond their previous roles and comfort routines of imparting knowledge to
achieve new ways of teaching, motivating, and engaging students.
Distributed leadership has a key role in the conceptual framework of learning-
centered leadership. The interaction of the core components and key processes define the
leadership skill or context. For example, the leader’s interactions with others while
performing the key process of supporting instruction would not be the same as that
demonstrated when supporting curriculum (Murphy, Elliott, Goldring, & Porter, 2006).
Collective Leadership.
Collective leadership “refers to the extent of influence that organizational
members and stakeholders exert on decision-making in their schools” (Seashore-Louis et

42
al., 2010, p. 19). “In a study of 4,491 teachers in 43 districts in 157 schools, with a
response rate of 67%, and 3,900 teachers in 40 districts in 134 schools, with a response
rate of 55%” (p. 44), the research demonstrated that collective leadership had a stronger
influence on student achievement than individual leadership. Almost all of the teachers
in high-performing schools perceived that they had a greater influence than those in low-
performing schools. Principals and district personnel retained the most influence on
decisions, but the study found that teachers did not perceive that principals lost influence
as others gained influence. The study demonstrated that a key cultural norm found in
schools with high collective leadership was trust. This supported Leithwood, Harris, and
Hopkins’ (2008) data that demonstrated “school leadership has a greater influence on
schools and students when it is widely distributed” (p. 27).
Instructional Leadership.
The concept of instructional leadership dates back to the 1980’s (DuFour, 2002).
Principals as instructional leaders were advised to focus their time on supervising
teachers in their practice, monitoring the curriculum and lesson plans, and learning and
modeling instructional strategies. In order to demonstrate effective instructional
leadership, the leader demonstrated qualities of transformational leadership (Marks &
Printy, 2003). Instructional leadership worked closely with the theory of distributed
leadership, the interactions between the instructional leader and followers in the context
of the situation. In contrast to the strict definition of distributed leadership posited by
Spillane (2005), it further included shared leadership or collective leadership among the
instructional leader and followers, specifically teachers.

43
The research conducted by Marks and Printy (2003) included 24 restructured
elementary, middle and high schools. The statistical results, concluded through use of a
hierarchical linear model, was that neither transformational nor instructional leadership
by itself created the environment and conditions for increasing student achievement.
Leadership that reflected transformational, transactional, and shared instructional
leadership between the principal and the teachers was found to create the environment
and conditions for increasing student achievement. The results, although not
generalizable to other schools because of the qualitative method, did represent promising
practices for other schools and the need for further research.
The significance of instructional leadership is the direct relationship it has on
teachers and the indirect relationship it has on student achievement (Printy, 2010). Printy
analyzed quantitative and qualitative research to examine the process through which
instructional leadership created effective schools. Marks and Nance (as cited in Printy,
2010) suggested the benefits of mutuality in leadership as having a high influence on
changes in teacher performance. Mutuality, described similarly to Spillane’s (2005)
concept of distributed leadership, is the leadership that exists in the interactions between
principals and teachers. It is a mutually reciprocal process. Reviews of other significant
quantitative and qualitative studies in Printy’s work confirmed the “centrality of the
principal and show the multiple opportunities principals have to mediate district policies
at the school level. What principals say makes a difference to teachers” (Printy, 2010,
p. 124). Even more than what they say, what principals do makes a difference in the
effectiveness of their instructional leadership in terms of implementing changes that lead
to school effectiveness (Blasé & Blasé, 2000).

44
Change Leadership.
“There is no ‘one best way’ to manage change, when (in reality) organization
transformation may require a range of models to be used selectively” (Rothwell &
Sullivan, 2005, p. 75). A literature review of any topic related to leadership and
leadership theories would not be complete without a discussion of change leadership.
Particularly if schools are to change a key element of school culture from a focus on the
inputs of teaching to the outcomes of learning, change leadership will be critical. The
call for restructuring constitutes significant change efforts that fall well beyond the scope
of mere tinkering or altering a few school processes (Fullan, 2007).
Change leadership is intertwined in effective instructional and transformational
leadership. Change leadership is a complex and comprehensive topic unto itself, and this
research study could easily become lost in the review of literature related to this topic.
For the purpose of this study, the literature review is confined to a discussion of
organization change as it relates to implementation in schools.
Lewin’s (1947) early concept of implementing change at the organization level
required a three-step phase of “unfreezing, moving, and freezing of group standards”
(p. 34). This seemingly simple concept was highly complex as it took into consideration
resistance to change, group dynamics, organization culture, and organization values. The
three-stage theory was based on the individual’s and group’s need for equilibrium within
the organization. Lewin used the concept of a force field to describe organization
change.
Rothwell and Sullivan (2005) defined organization change as a “departure from
the status quo. It implies a movement toward a goal, an idealized state, or a vision of

45
what should be and movement away from present conditions, beliefs, or attitudes”
(p. 22). This definition encompassed the various types and definitions of change
described in the research literature.
In the literature review, types of change are defined as alpha, beta, and gamma
change by Golembiewski (as cited in Rothwell & Sullivan, 2005); first- and second-order
change (Marzano, Waters, & McNulty, 2005); and first-, second-, and third-order change
(Bartenek & Moch, 1987). First-order change involves changing a practice or a process;
it is incremental; and is called single-loop change when an organization works to solve
the problem with strategies that have worked well in the past (Marzano et al., 2005).
Second-order change may be defined as deep change. “Deep change alters the system in
fundamental ways, offering a dramatic shift in direction and requiring new ways of
thinking and acting” (Marzano et al., 2005, p. 66.). Bartenik and Moch describe third-
order change as the continuous change of the organization as the conditions require. This
model of change assumes that conditions will not remain stagnant, and the leaders of the
organization must be aware of the forces acting upon it necessitating change and respond
appropriately to those forces. These types of change illustrate the expectations of schools
charged with restructuring to meet the needs of learners (Kotter, 2008).
The field of organization development (OD) defines the types of change as
developmental, transitional, and transformational change, noted in the order of
complexity as well as the expected levels of resistance to change (Gilley, McMillan, &
Gilley, 2009; Rothwell & Sullivan, 2005). In a qualitative study of organizations
perceived by the employees to have successfully implemented change, Gilley et al. found
leaders of successful change efforts were perceived by their employees to have

46
demonstrated common leadership behaviors. These behaviors were coaching,
communicating, involving others, motivating, rewarding, and building teams. “The most
significant behaviors in implementing successful change were found to be motivating
others, communication, and building teams” (Gilley et al., 2009, p. 43). Using OD’s
definition and framework, then, principals are considered to be the change agents of the
school, as they are the individuals responsible for implementing change in curriculum
and instructional practices, culture, mission, and focus of the school (Rothwell &
Sullivan, 2005).
Organization design theory supports four models for organizational change
(Rothwell & Sullivan, 2005). “They are (1) the critical research model; (2) the traditional
action research model; (3) appreciative inquiry; and (4) our evolving view of the action
research model” (p. 40). For the purpose of this review, appreciative inquiry and the
evolving view of the action research model will be discussed.
Appreciative inquiry. A complement to action research and transformational
leadership is the change theory of appreciative inquiry founded by David Cooperidder in
the mid-1980s. Appreciative inquiry is a vehicle for transformational change of the
organization through the leader’s deliberate and purposeful actions of using positive
experience and the power of imagination and visioning to create and sustain action that
implements the desired changes. It is a form of persistent and consistent visioning on the
individual and group level that motivates change. By working with individuals and
groups to visualize the best of what is, the ideals of what might be, agreement of what
should be, and the experience of what can be, appreciative inquiry capitalizes on the
positive experiences of the organization to create the synergy to implement and sustain

47
transformational change (Barrett, Cooperrider, & Fry, 2005; Cooperrider & Svivastva,
1987).
Appreciative inquiry takes as its foundation an emphasis on what individuals can
do as opposed to identifying how to fix what they are unable to do. It is based on
encouraging the members of the organization to visualize the changes they desire through
positive experiences and working to achieve what they visualize.
The approach to transformational organization change is rooted in seeking
creative and innovative strategies that more closely approach third-order change because
the organization is constantly evolving based on visioning for the future. Related to the
educational institution, as student achievement starts and continues to improve,
appreciative inquiry would call for strategizing new ways of engaging students instead of
working through a deficit model of fixing what is not working (Barrett et al., 2005).
Appreciative inquiry focuses on the future versus the past, and is driven by the outcomes,
not the inputs.
Evolving view of action research. “What is needed is a new model to guide
change that does not assume a beginning, middle, and end to a change effort. Instead,
change efforts are regarded as continuing” (Rothwell & Sullivan, 2005, p. 53). Figure 2
describes the Sullivan/Rothwell Change Process Model. Note the full circle that
continues the process of scanning, planning, acting, and re-acting. Then the cycle repeats
itself. This evolving view of action research seems to recognize that organization change
is no longer an event or a project. It is a continuous cycle reflective of the demands of
both the internal and external environment.

48
Marketing
Pre-Launch
Transformational Launch
Separation
Figure 2. Sullivan and Rothwell’s change process model. Adapted from “Models for
Change” in Practicing Organization Development: A Guide for Consultants, by W.
J. Rothwell and R. L. Sullivan, p. 59. The actions are continuous. The model is
based on work with an external change leader or consultant. The change leader
becomes involved prior to the scanning phase and exits the process after the act phase
when the organization leadership continues the process. Copyright 2005 by John
Wiley & Sons, Inc.
Scan
Plan Act
ReAct
Continual
Implementation and
Adoption of Diverse
Interventions

49
Kotter’s (1995; 2008) model of bringing about organizational change rests on an
eight-step approach that involves creating a sense of urgency, forming a guiding coalition
of support, creating a vision, communicating the vision, empowering others to act on the
vision, planning for and creating short-term wins, consolidating improvements and
providing still more change, and institutionalizing new approaches. His contribution to
the literature is a departure from change being a function of things or actions other people
take. Kotter contends that organizations do not change; people change. His approach
rests on touching the feelings of others and influencing them. Creating a vision is
important in his change strategy, but it is a vision built on a personal story. His theory is
that change efforts fail when people circumvent, misinterpret, or quickly work through
one of the eight steps.
Gardner (as cited in Fullan 2007) “says that the most important thing to do in
changing someone’s mind is to connect to the person’s reality as the point of departure
for change” (p. 43). Fullan’s expertise on educational change is widespread. His theory
of change leadership in education expands the view of vision-driven leadership as the one
trait that affects and causes effective schools. The vision-driven leadership has four key
aspects: (a) creating, (b) communicating, (c) building commitment to, and (d) aligning to
the vision.
Restructuring schools for student achievement involves change leadership,
according to Fullan (2007), that focuses on changing people’s beliefs first and their
actions will change accordingly. Fullan describes his elements of effective school
restructuring as
measuring improvement in student achievement;

50
attending to the three basics of education necessary for every child: literacy,
numeracy, and emotional well-being;
appealing to people’s dignity and self-respect;
ensuring the best people are working on the problem;
recognizing that all successful strategies are social based and action oriented;
building internal accountability linked to external accountability;
establishing conditions for evolution of positive pressure; and
building public confidence.
Fullan (2007) seeks to move teachers through effective leadership that causes
them to see the school and school culture as ours versus mine. Fullan’s contribution to
the research is dissimilar to most of the literature reviewed in this chapter. Rather than
reporting on research findings of successful strategies occurring in the past, he cites
strategies and proposes that he believes will lead to effective school results in the future.
Change theory as it relates to transformational leadership and creating effective
schools is integrated throughout the literature review. Marzano, Waters, and McNulty
(2005) make a distinction between first- and second-order change. “First-order change is
incremental. It can be thought of as the next most obvious step to take in a school or a
district. Second-order change is anything but incremental. It involves dramatic departure
from the expected, both in defining a given problem and in finding a solution” (p. 66).
First-order change is systematic, expected, and much more likely to lead to success
because it is not based on strongly held beliefs, values, or the culture of the organization.
Second-order change requires a change in the foundation of the organization. It is
required when the problems or expected changes in outcomes cannot be addressed by the

51
current thinking. Marzano et al. contends that second-order change is most likely to
occur through leadership that demonstrates transformational skills. However, a litany of
research and corporate results demonstrate that transformational change is rarely
achieved (Gilley et al., 2009). Kotter’s (2005) rationale as to why transformation efforts
fail rests on the theory that the change process is concrete and finite, and it cannot be
short-changed. Skipping steps, not taking enough time, or erring in any of the eight steps
may slow momentum, negate gains, or halt change entirely.
Reeves (2009) contributed to the research review by offering several important
strategies to leading change in schools. The first strategy is that school leaders must
decide what should be eliminated before adding to the list of responsibilities that teachers
currently hold. The literature review of the changing role of principals highlighted that
principals felt the same way—new responsibilities were added with each new role, but no
responsibilities were eliminated. Reeves refers to this key first step in implementing
change as “pulling the weeds before you plant the flowers” (p. 13).
The second important contribution of Reeves’ (2009) work is the four imperatives
of cultural change. This work is consistent with Kotter (2008) and Marzano et al. (2005).
The first imperative is defining what will not change. This is important for maintaining
trust and the cultural values of the organization. The second imperative is that leadership
actions must change as the impetus for the organizational change. Changing others when
leadership is not willing to change serves to diminish trust and the spirit of collaboration
that is critically important in transformational leadership. Third, use the appropriate
tools, including role modeling, vision, and training. Fourth, cultural change requires that
leaders personally attend to the change by doing the scut work, meaning anything that

52
needs to be done, no matter how small or unpleasant. The imperatives are consistent with
Kotter’s (1995) eight steps in transforming the organization.
The review of the literature on leadership illustrates the vast body of research and
the myriad of associated leadership theories. Some theories complement each other, such
as change leadership, transformational leadership, and instructional leadership, while
others seem to be in opposition to each other, such as transactional leadership and
transformational leadership. There does not appear to be agreement among researchers
that transactional and transformational leadership are complementary or in opposition to
each other.
Whether it is transforming the organization by creating a sense of urgency,
understanding the four imperatives of cultural change, using appreciative inquiry, or
implementing an action research model, it is clear that elements of this body of research
are critical in creating the changes necessary to bring about an effective school. In
particular, the more significant the change, the more complex the leader’s role becomes.
There exists a recurring concept in the literature concerning the leadership of
principals. It appears to demonstrate that there is a shift in focus from the inputs of
teaching to the outcomes of learning. However, instructional leadership continues to be
important in creating effective schools.
Conceptual Framework of Learning-Centered Leadership
The conceptual framework of learning-centered leadership is based on measuring
the most important indicators of effective school leadership related to school performance
and student achievement (Goldring, Cravens, et al. 2009). Learning-centered leadership
is proposed as the next step of leadership after instructional leadership, or perhaps in

53
combination with instructional leadership. The literature shows a trend in focus shifting
away from teacher activities to student activities. The concept of a learning culture does
not stop with students. Teachers and principals are part of this learning-centered culture.
To illustrate the attention on teacher learning, Toll (2010) identified six steps for
principals to model learning for teachers that encourage a learning culture.
Expect that teachers are learning and support them in their learning. Ask questions
about what they are learning and how their learning influences their teaching.
Demonstrate that principals are learners by participating in group learning, such as
study groups or professional learning communities.
Support learning as a function of hospitality where all students and teachers are
invited to participate.
Provide new visions of what might be, and encourage new ways of seeing what
exists.
Ask questions that indicate to teachers what you value. Ask about their learning, and
more importantly, ask what the students are learning.
Understand that learning involves three phases of knowing, doing, and being. Unless
they are supported by learning-centered principals, teachers are likely to settle back
into old comfortable ways of doing things. They do not institutionalize the new
learning into their being.
The new focus on student achievement as one key measure of teacher and principal
performance provides the impetus for a new concept of leadership.

54
Constructs of Learning-Centered Leadership.
Beyond the leadership theories necessary for transformational leadership,
instructional leadership, distributed leadership, and change leadership is the construct of
learning-centered leadership. With instructional leadership, the focus is on the inputs:
curriculum, instructional planning, and teaching. With learning-centered leadership, the
focus is on the outcome of student learning. Learning-centered leadership embodies more
than just student learning. It includes leader (principal) and teacher learning, as well.
The National Association of Elementary School Principals (2008) identified five
constructs of today’s effective principal, one of which was that “effective principals must
be the lead learners in their schools” (p. 2). The organization defined six standards for
principals as members of their school learning communities, one of which was creating a
culture of continuous learning for adults tied to student learning and other school goals.
The addition of student learning is central to the learning-centered leadership framework.
The learning-centered leadership framework is based on the intersection of six
core components and six key processes grounded in research and the professional
standards of the Council of Chief State School Officers and the National Policy Board for
Educational Administration, Interstate School Leaders Licensure Consortium 2008. The
references to the core components and key processes of this conceptual framework
appeared throughout the literature review in this chapter.
Core Components.
The first core component is high standards for student learning. This component
has deep roots in research and can be traced back to the Seven Correlates of Effective
Schools that evolved from the 1980’s (Edmonds, 1982; 1983). In the conceptual

55
framework of learning-centered leadership, there are four constructs to high standards for
student learning.
The first construct is performance standards. There are four critical
characteristics of performance standards. First, they are intended to be absolute rather
than normative. Second, they are expected to be set at high, global levels. Third, a
relatively small number of levels (e.g., advanced, proficient) are typically identified.
Finally, they are expected to apply to all students rather than a selected subset, such as
college-bound students seeking advanced placement (Linn, 2000). Blasé and Kirby
(2000) refer to strong leadership factors that include high expectations. The Seven
Correlates of Effective Schools refers to this component as high expectations for success
(Lezotte, n.d.). Marzano, Waters, and McNulty (2005) refer to this focus as “establishing
high, concrete goals and expectations that all students will meet them” (p. 50).
Robbins and Alvy (2004) refer to this component when they speak about
“offering quality, meaningful, and engaging work to all students” (p. 93). In a discussion
on curriculum and instruction, they describe this component as more than a
responsibility, but as a moral imperative. In fact, they proceed further to state that the
objective of success for all is more than a moral imperative; it is a basic tenet of the
original body of effective schools research. Success for all, then, refers back to effective
schools research. This concept of success for all students is fundamental to the No Child
Left Behind Act of 2001 and the professional standards of the Interstate School Leaders
Licensure Consortium, 2008.
The second core component is rigorous curriculum. The learning-centered
leadership concept assumes that the rigorous curriculum is for all students and in all

56
content areas. This would be applicable to both the core academic subjects and the
approved career and technical program areas. It is expected that the rigorous curriculum
will be provided to all students, regardless of their disability (Goldring, Cravens, et al.,
2009). Given the needs of students with IEP’s who enroll in approved career and
technical education programs, this component is particularly relevant to the context of the
career and technical education school.
The notion of curriculum, instruction, and assessment is core to the rigor and
relevance framework proposed by the International Center for Leadership in Education
(Daggett & McNulty, 2010). The concept is based on the four quadrants, which include
the six levels of Bloom’s taxonomy and the five levels of the application model. The
purpose of the rigor and relevance framework is to guide leaders and teachers to design
curriculum, instruction, assessments that move the expectations for students to Quadrant
D, which is presented as the most challenging and relevant to higher-order thinking.
Quadrant D also represents the expectations of the business community for employees.
Figure 3 describes the nature of the student’s work in each quadrant and the desired
outcome in Quadrant D of a rigorous curriculum.
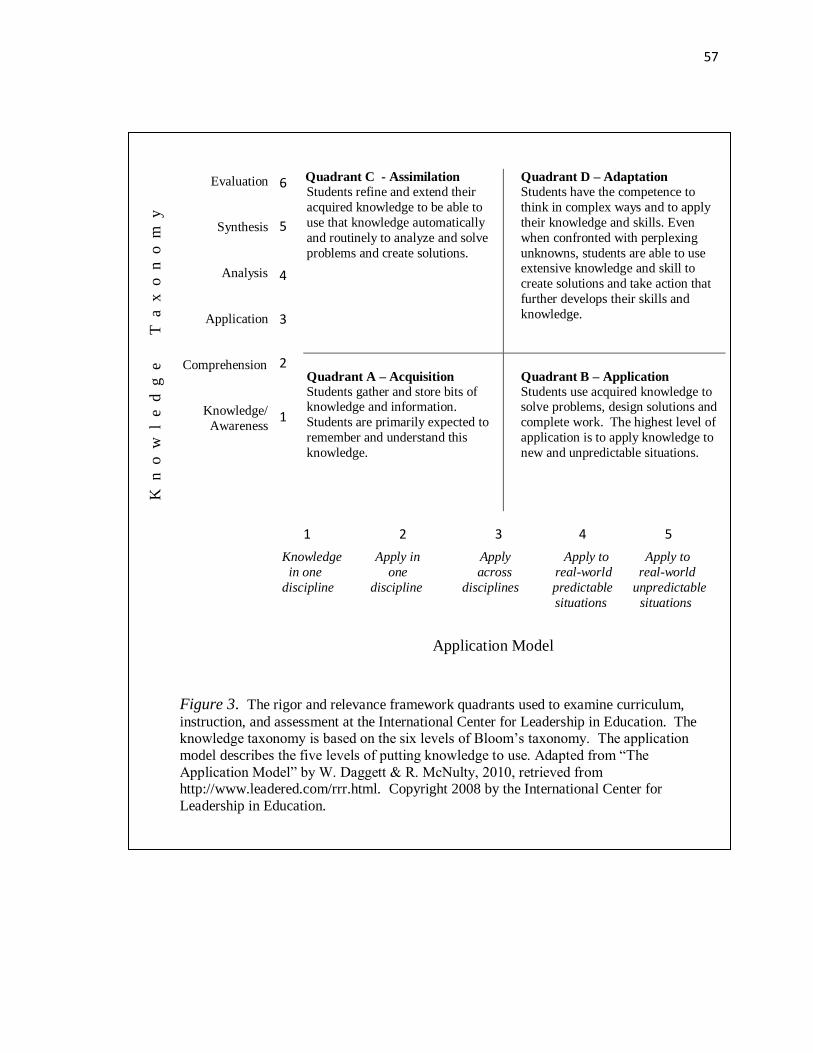
57
Quadrant C - Assimilation
Students refine and extend their
acquired knowledge to be able to
use that knowledge automatically
and routinely to analyze and solve
problems and create solutions.
Quadrant D – Adaptation
Students have the competence to
think in complex ways and to apply
their knowledge and skills. Even
when confronted with perplexing
unknowns, students are able to use extensive knowledge and skill to
create solutions and take action that
further develops their skills and
knowledge.
Quadrant A – Acquisition
Students gather and store bits of knowledge and information.
Students are primarily expected to
remember and understand this
knowledge.
Quadrant B – Application
Students use acquired knowledge to solve problems, design solutions and
complete work. The highest level of
application is to apply knowledge to
new and unpredictable situations.
Figure 3. The rigor and relevance framework quadrants used to examine curriculum,
instruction, and assessment at the International Center for Leadership in Education. The knowledge taxonomy is based on the six levels of Bloom’s taxonomy. The application
model describes the five levels of putting knowledge to use. Adapted from “The
Application Model” by W. Daggett & R. McNulty, 2010, retrieved from http://www.leadered.com/rrr.html. Copyright 2008 by the International Center for
Leadership in Education.
6
5
4
3
2
1
Application Model
Knowledge Apply in Apply Apply to Apply to
in one one across real-world real-world
discipline discipline disciplines predictable unpredictable
situations situations
1 2 3 4 5
K
n o w
l
e d g e
T
a
x
o
n
o m
y
Evaluation
Synthesis
Analysis
Application
Comprehension
Knowledge/
Awareness

58
The third core component is quality instruction. This component relates to the
pedagogy as opposed to the content of the rigorous curriculum cited in the second core
component. Quality instruction is created and defined when effective instructional
practices maximize student academic and social learning (Goldring, Cravens, et al.,
2009). A review of the literature further defines quality instruction as that which includes
active student engagement, clear instructional goals that are effectively communicated to
students, connection of previous learning to new learning, expert use of instructional
materials, differentiated instruction, and frequent formative assessments (Marzano, 2007;
Stronge, 2007).
The fourth core component is a culture of learning and professional behavior.
There are three dimensions to this component. The first is that the professional
community places student learning as its top priority. Student learning is at the heart of
all decisions and is highly valued (Goldring, Cravens, et al., 2009). The second is that
students learn in a safe and orderly school climate. Finally, the school community
supports students both academically and socially. The research base for this core
component comes from several sources including Blasé and Kirby (2000) and Lezotte’s
(2004) research for effective schools
The fifth core component is connections to the external communities. This
component relates to communications with parents, parent committees, parent education
programs, and the overall involvement of parents and the business community in schools.
It also includes avenues for parents and the business community to have input into the
school goals, culture, and decisions (Murphy, Elliott, Goldring, & Porter, 2006).

59
The final core component is systematic performance accountability. This refers to
accountability both internal and external to the organization. There are external
accountability demands placed on all schools because of state and national performance
standards. For example, in addition to the Pennsylvania System of School Assessment,
area career and technical education schools are subject to the accountability standards of
the Carl D. Perkins Career and Technical Education Improvement Act of 2006. The
systematic performance accountability refers equally to the internal systems of
accountability—those systems that hold individual staff accountable for student
achievement. Internal assessment systems that provide benchmark data helpful in
determining progress toward meeting the state and national standards and that are tied to
individual teacher and student results are part of a comprehensive system of performance
accountability (Hanushek & Raymond, 2005).
Key Processes.
Key processes are the practices through which the core components are
implemented by the principal within the organization over time. The “six key processes,
[are] based upon the prevailing views of effective leadership and the research on school
improvement: planning, implementing, supporting, advocating, communicating, and
monitoring” (Goldring, Cravens, et al., 2009, p. 10).
We define planning as articulating shared direction and coherent policies
practices, and procedures for realizing high standards of student performance. . . .
After planning, leaders implement; they put into practice the activities necessary
to realize high standards for student performance . . . .

60
Leaders create enabling conditions; they secure and use the financial, political,
technological, and human resources necessary to promote academic and social
learning . . . .
Leaders promote the diverse needs of students within and beyond the school . . . .
Leaders develop, utilize, and maintain systems of exchange among members of
the school and with its external communities . . . .
Monitoring refers to systematically collecting and analyzing data to make
judgments that guide decisions and action for continuous improvement.
(Goldring, Porter, et al., 2009).
The research base for the key processes includes Blasé and Kirby (2000), Davis,
Darling-Hammond, LaPointe, and Meyerson (2005), Hallinger and Heck (1998),
Leithwood and Jantzi (2000; 2005), Lezotte (2004), Marks and Printy (2003), Marzano,
Waters, and McNulty (2005), Seashore-Louis (2010), and Servais and Sanders (2006), all
of which have been discussed in detail throughout this literature review.
The conceptual framework of learning-centered leadership assesses leadership
skills at the intersection of the core components and key processes. The intersection of
core components and key processes is illustrated in Table 2. Each cell in Table 2
includes the specific professional standard of the Interstate School Leaders Licensure
Consortium 2008.

61
Note. The number within each cell indicates the specific standard of the Interstate School
Leaders Licensure Consortium 2008. Adapted from “Assessing Learning-Centered
Leadership: Connections to Research, Professional Standards, and Current Practices,” by
E. B. Goldring, A. C. Porter, J. Murphy, S. N. Elliott, & X. Cravens, 2009, Leadership
and Policy in Schools, 8(1), p. 5.
Core
Components
Key Processes
Planning Implementing Supporting Advocating Communicating Monitoring
High Standards
for Student
Learning
ISLLC Standard 1
Rigorous
Curriculum
(content)
2 2 2 2 2 2
Quality
Instruction
(pedagogy)
2 2 2 2 2 2
Culture of
Learning & Prof. Behavior
2, 3 2, 3 2, 3 2, 3, 5 2, 3, 5 2, 3
Connections to
External
Communities
4 4 4 4, 6 4, 6 4
Systematic
Performance
Accountability
5 5
Table 2
Vanderbilt Assessment of Leadership in Education: Intersection of the Core Components
and Key Processes with the ISLLC Standards

62
Interstate School Leaders Licensure Consortium.
The National Policy Board for Educational Administration (NPBEA) created the
Interstate School Leaders Licensure Consortium (ISLLC) in 1994 with the goal of
developing professional standards for administrators (Murphy & Shipman, 1999). At the
time it was formed, the consortium consisted of 24 state members (Murphy, 2003). The
model of leadership defined by the consortium was influenced by two points of view: the
changing environment in which schools operated and research about appropriate models
of education for the 21st century (Murphy & Shipman, 1999).
The changing environment in which schools operated included the economic
forces driving the American economy and business’ dissatisfaction with education’s
ability to create a workforce prepared for global competition. Social forces influenced
the framing of the leadership model as the U.S. saw an increase in the number of limited
English language learners, an increase in minority enrollment in the schools, and an
increase in two-parent incomes. The third force affecting education was the political
element bringing pressure on schools and teacher unions, working to diminish the power
of these groups while increasing the power and influence of parent and governmental
bodies (Murphy & Shipman, 1999).
Research on effective schools challenged the former notion that focused attention
on teachers and replaced it with a notion that learning is the primary objective. Superior
learning was the new priority rather than superior teaching, and learning was defined as a
subjective activity, dependent on the person trying to learn and the context in which
learning takes place (Murphy & Shipman, 1999).

63
Research on leadership, the changing role of principals as school leaders, and the
widespread knowledge that leadership was essential to effective schools brought four
new dynamic roles for administrators. These four new leadership roles were community
servant, organizational architect, social architect, and moral educator (Murphy &
Shipman, 1999). In 1998 the ISLLC standards were adopted and disseminated by the
Council of Chief School Officers and the National Policy Board for Educational
Administration.
The outcomes anticipated by states’ participation in the ISLLC were to increase
the rigor and relevance of administrator preparation programs and better assess those
administrators currently in leadership roles (Murphy, 2005). After ten years of use, the
ISLLC standards were reassessed, revised, and renamed ISLLC 2008.
All 50 states have adopted the ISLLC 2008 standards; many use them as the basis
for administrative licensure and professional education. The standards represent a
research base of 105 studies by almost as many different research teams spanning the
period from 1980 through 2006. There are 6 standards and 93 performances that are
expected of principals. Administrative licensure in Pennsylvania is based on the ISLLC
2008 standards.
The ISLLC are not without critics. Anderson et al. (2002) criticized the
standards’ emphasis upon business leadership models that were outside of the educational
organization research as well as the influence of business itself in the field of educational
leadership. Their concern was the emphasis upon national standards, testing, and
curricula versus local control. They also criticized the standards as a weak tool for social
justice. Anderson et al. cited concerns about the licensure exam, as well. English (2003)

64
cited the standards as flawed because professional consensus was used to arrive at the
standards rather than empirical evidence.
Robinson (2004) conducted a survey of Michigan public school superintendents.
She found no statistical difference between schools where the superintendents used the
ISLLC standards to assess principals and those that did not. She also found that most of
the superintendents were not even aware of the ISLLC standards. Further, most of the
superintendents who did not perceive that use of the ISLLC standards had an impact on
the performance of principals also did not perceive that use of the ISSC standards had an
impact upon student achievement.
To summarize the conceptual framework of learning-centered leadership, six core
components and six key processes are the foundation. They are grounded in theories of
effective schools research, theories of leadership, and are based on the professional
standards adopted by the Council of Chief State School Officers, ISLLC 2008, and the
National Policy Board for Educational Administration. Originally adopted in 1998, the
standards were updated in 2008 to reflect the changing role and new expectations for
educational leadership and effective schools. Although not without controversy, the
ISLLC 2008 standards have been adopted by all 50 states and the District of Columbia,
and are used for both licensure and professional development purposes.
Measuring and Assessing School Leadership
The continued focus on increasing student achievement has brought with it an
increased demand for accountability on schools and school principals (Catano & Stronge,
2007). However, this is not a new phenomenon. There has been a long-term need to
determine the effectiveness of principals (Condon & Clifford, 2009; Glasman & Heck,

65
1992; Heck & Marcoulides, 1996). Principal effectiveness is an on-going problem for
which a solution has yet to be determined or systematically put in place (Reeves, 2009).
The goal of measuring school leadership skills has not changed over the years.
The goal is to improve performance, and the methodology tends to be formative
(Ginsberg & Berry, 1990; Josephsen, 2007; Valentine, 1986). What has changed,
however, is the pressure to link principal evaluations directly to student performance
(“Linking performance,” 2009). In applications for approximately $4.35 billion in
competitive funding from the U.S. Department of Education in 2009, states were required
to implement a system of performance evaluation system for teachers and principals that
linked the evaluations of these professionals to student achievement.
Glasman and Heck (1992) found the study of principal assessment had not been
guided by theoretical considerations nor had it been adequately addressed by research.
Catano and Stronge (2007) argue that not much has changed since 1992. In addition to
scant research and lack of theoretical foundation for the evaluation of principals is the
problem of the changing roles of principals. The role of principal has not been a stagnant
one and any valid and reliable instrument developed ten or even five years ago would
hardly be sufficient today (Catano and Stronge, 2007). Further issues compounding the
problems with assessment are the numerous leadership theories and less-than clearly
defined performance standards upon which the evaluation of principals should be based
(Amsterdam, Johnson, Monrad, & Tonnsen, 2005; Catano and Stronge, 2007; Goldring,
Cravens, et al., 2009).
Measuring the skills of school leaders is a difficult prospect for many reasons.
Determining what to measure and how to measure it are but a few of the significant

66
challenges that face those who supervise principals with the goal of providing accurate
quality feedback for improving performance (Goldring, Cravens, et al., 2009;
Marcoulides, Larsen, & Heck, 1995).
What to assess.
The research points to inconsistencies in the domains or criteria upon which
principals should be assessed. Marcoulides, Larsen, and Heck (1995) conducted research
involving 140 elementary and secondary principals to establish a valid and reliable
generalizable performance model of principal leadership upon which assessment should
be based. They sought to establish the domains of adaptation, maintenance, integration,
and attainment of student achievement goals. Adaptation was an understanding of the
external demands on the school. Maintenance was monitoring the value structure of the
school. Integration was organizing and coordinating the instructional process. The study
concluded that although this model, focused on instructional leadership, was a promising
start, a comprehensive system of principal evaluation should include the context of the
school environment. They proposed that for principal assessment to be useful, it must be
valid, reliable, and aligned to the theoretical constructs of the position.
Rallis and Goldring (1993) reported on a principal survey conducted by the
National Center for Education Statistics at the U.S. Department of Education. (This
researcher could not locate the original report.) Seventy-two percent of the principals
(n = 402) responded to a national study that originally included approximately 60,000
students in about 1,000 secondary schools. The principal survey was randomly
distributed to about half the original study participants. These principals reported that
four categories of their performance were assessed in their own instruments. These

67
categories were (a) efficient administration, (b) good disciplinary environment, (c) parent
or community reaction, and (d) student performance on standardized tests or college
admission. Their findings suggested that principals largely believed the most important
aspects of their performance were maintaining an efficient building and good student
discipline. Student performance had very little impact on their performance evaluations.
Fourteen years later, Josephsen (2007) studied the performance evaluations of 109
elementary, middle, and secondary school principals. Her research found that the criteria
used most often in principal evaluations were monitoring curriculum; instruction and
assessment; being knowledgeable about curriculum, instruction, and assessment; and
advocating and sustaining a culture of learning. Her study demonstrated that the
evaluation methods used most often included scale, self-evaluation, and narrative essay.
Goldring, Cravens, et al. (2009) asserted from their analysis of 65 instruments at
both the district and state levels that principal evaluations did not focus on student
achievement, curriculum, or quality instruction. Their review of local and state
instruments suggested four approaches being used to determine the aspects of the
principal’s performance that should be assessed (a) responsibilities, (b) knowledge and
skills, (c) processes, and (d) organizational outcomes.
A thorough literature review supported that using a list of principal
responsibilities in determining what to assess was the predominant view until 1990 when
high stakes testing and school accountability made this basis of evaluation inadequate
(Catano & Stronge, 2007; Goldring, Cravens, et al., 2009; Thomas, Holdaway, & Ward,
2000). The focus on knowledge, skills, and processes alone also provide insufficient data
when the expected outcome for effective principals includes student achievement. The

68
principal’s knowledge and skills may not produce the desired student achievement; yet, a
focus on student achievement alone assumes a direct relationship between principal
leadership and student achievement that has not been proven to exist (Goldring, Cravens,
et al, 2009; Hallinger & Heck, 1998; Seashore-Louis et al., 2010).
Several research studies since 2000 have demonstrated the wisdom of assessing
principals against standards that have been proven to affect student performance in a
positive manner, albeit indirectly (Catano & Strong, 2007; Condon & Clifford, 2009;
Reeves, 2009; Thomas, Holdaway, & Ward, 2000). The Educational Leadership Policy
Standards, Interstate School Leaders Licensure Consortium (ISLLC) 2008 were
developed to reflect the performance standards of principals based on current school
leadership research (Condon & Clifford, 2009; Goldring, Cravens, et al., 2009). “The
ultimate goal of these standards, as with any set of education standards, is to raise student
achievement” (Council of Chief State School Officers, 2008, p. 5).
How to assess.
The Goldring, Cravens, et al. (2009) study involved a systematic approach for
assessing leadership assessment practices. Their sample included 74 districts in 43 states
and the District of Columbia. Based on their analysis, “the practices of leadership
assessment do not align with the Personnel Evaluation Standards in terms of assessment
utility and accuracy. Most concerning is the lack of clear documentation that aligns with
these important personnel evaluation quality measures” (p. 28).
Other literature discussing the methods through which principals are assessed
included questionnaires, checklists, interviews, observations, scales, and critical
incidents. However, these procedures measured the frequency of specific behaviors

69
rather than the quality or outcomes produced as a result of the principals’ behaviors or
characteristics (Catano & Stronge, 2007; Thomas, Holdaway, & Ward, 2000), or the
instruments contained unclear standards and were ambiguous regarding the expected
performance levels (Ginsberg & Berry, 1990; Reeves, 2009).
Josephsen’s (2007) study found that principals preferred a 360-degree process in
the assessment of their leadership skills. Marcoux, Brown, Irby, and Lara-Alecio (2003)
found that self-assessment as a reflective practice contributed to principals’ learning and
improvement. They found that leaders who conducted an accurate self-assessment were
more likely to improve and to seek ways to continue to improve. They conducted a case
study based on portfolio development. It was not generalizable, but it did contribute to
the body of research on principal evaluation in several ways. They proposed that one of
the purposes of evaluation was to encourage the principal to reflect on performance as a
means to improve. They also recommended that the process be valid and reliable in order
for the process to support improvements in student achievement.
The conceptual framework of learning centered leadership supports the use of the
Vanderbilt Assessment of Leadership in Education as a performance measure. This
instrument is unique from other measures of leadership in several respects. First, it does
not measure the frequency of leadership behaviors. It measures the perceived
effectiveness of leadership behaviors as they relate to intersection of core components
and key processes based on the observations of the individuals completing the
assessment. These perceptions are based on the principal’s self-assessment, the
principal’s supervisor, and the teachers supervised by the principal (Murphy et al. 2006).
The inclusion of the 360-degree feedback instrument is consistent with recommendations

70
from Josephsen (2007). This type of assessment provides a triangulation of data for the
benefit of the individual being assessed. Second, the conceptual framework is based on
assessing the principal’s leadership skills in the context of their performance on the job
and not in a global or theoretical sense. Third, it is based on a comprehensive range of
both behaviors and processes. It is based on what they do and how they do it. Because
of this, it is not a one-dimensional assessment that includes only traits, only behaviors, or
only outcomes (Reeves, 2009). Finally, it focuses on the objective data of student
learning outcomes as opposed to the inputs of teachers’ instructional practices (Goldring,
Cravens, et al., 2009).
Validity and Reliability.
In addition to determining what to assess and the method by which to assess
leadership skills, both the validity and reliability of the assessment instruments are
significant considerations (Amsterdam, Johnson, Monrad, & Tonnsen, 2005; Condon &
Clifford, 2009; Goldring, Cravens, et al., 2009). Reeves (2009) asserted that leadership
evaluation must be robust in order to achieve the intended result of improving
performance. That is, it must be proactive, reciprocal, empowering, standards based,
truthful, and objective. Reeves’ acronym for assessment was presto.
Yet in most schools, local assessments are used to provide feedback to principals
about their skills for which there is little, if any, determination of the validity or reliability
of the instrument (Reeves, 2009). While accountability and demands for principal
performance have increased considerably over the past two decades, the quality of
measurement instruments used to evaluate principal performance has not improved
(Condon & Clifford, 2009; Glasman & Heck, 1992; Thomas et al., 2000).

71
Measuring and assessing leadership is a daunting task. Determining what to
assess is more than reviewing a job description. Determining how to assess is equally
challenging. The research findings suggests that both functions (what and how) should
be grounded in research, and based on a valid and reliable instrument. Further, for
assessment to be effective, the individual being assessed should be included in the
assessment activity and required to reflect upon the strengths and weaknesses of their
own performance (Josephsen, 2007).
Finally, an impetus for moving to a learning-centered leadership assessment
model has been generated by the federal government. It is anticipated that the
reauthorization of the No Child Left Behind Act of 2001 will include a mandate that
student achievement be tied to teacher and principal performances. Evidence of this is
indicated by the Race to the Top Application for Initial Funding (U.S. Department of
Education, 2009), and from personal communications with Thomas Gluck, Secretary of
Education for the Pennsylvania Department of Education (Gluck, September 8, 2010). In
his personal communication at the Capital Area Intermediate Unit, Gluck encouraged
districts to work through internal processes to implement a system of assessment tied to
student achievement or wait until the federal government mandated the federal system of
assessment through requirements for the acceptance of federal funds.
Context of Career and Technical Education
The context of the learning environment is important in many considerations of
leadership theories, leadership performance, and student achievement (Coleman, 1967;
Edmonds, 1983; Goldring, May, & Huff, 2010; Hallinger, Bickman, & Davis, 1996).
However, research on effective leadership in career and technical education schools is

72
almost non-existent. Only one study on leadership in a career and technical school
setting was found using multiple search engines and library resources. A descriptive
study was conducted in Mississippi on the perceptions of teachers and principals about
the leadership functions of the principal. In a study of teachers (n = 564), Long (2008)
found that framing school goals was the most important leadership skill demonstrated by
career and technical principals as perceived by both teachers and administrators.
Goldring et al. (2010) studied 65 principals in 45 schools in an effort to determine
the extent that context influenced leadership practices. They found that principals in
larger schools tended to spread their time evenly over a wide array of responsibilities
with no one emphasis on any one activity. They also found that principals tended to
spend much larger periods on activities related to instructional leadership activities in
schools with larger percentages of minority, economically disadvantaged, or special
education students.
Contingency theory of leadership researchers cited previously have tried to
determine the specific characteristics and behaviors necessary for principals to create
effective schools and high levels of student achievement. As such, it is necessary to
examine the unique educational context in which principals in career and technical
education schools demonstrate leadership. Contingency and shared leadership theories
have been demonstrated to improve the effectiveness of leadership skills (Blasé & Kirby,
2000; Spillane, Halverson, & Diamond, 2001; Waters, Marzano, & McNulty, 2003).
Table 3 illustrates the composition of career and technical education students
across the country. Overall across the United States, career and technical education
served more male students, more disabled students, fewer students with limited English
73
proficiency, more students taking lower-level math courses in Grade 9, and more students
from the smaller high schools (U.S. Department of Education, 2008).
Table 4 shows the national comparison of occupational concentrators to
nonconcentrators of the grade 12 graduates in 2005. More male than female students and
more disabled than nondisabled students completed a program of study that qualified as
an occupational concentration. In addition to the data in Table 4, special education data
indicate that 78 percent of the students with mental retardation were enrolled in at least
one vocational course and 62 percent enrolled in an occupationally specific program.
Seventy-one percent of low-functioning students and 68 percent of moderately-
functioning students with mental retardation were enrolled in a prevocational course,
which is significantly higher than the 43 percent of high-functioning students with mental
retardation who enrolled in prevocational courses (U.S. Department of Education, 2009).
Table 4 illustrates that fewer limited English proficient students completed an
occupational concentration. Of the students who graduated in 2005, fewer students took
geometry or higher levels of math in grade 9 and more took pre-algebra, algebra, low-
level, or no mathematics. Most of the students who completed an occupational
concentration came from schools that enrolled less than 1,500 students. Using the grade
9 mathematics course as an indicator of college preparedness or career success, students
who completed an occupational concentration tended to be less prepared for college or
career success than nonconcentrators.

74
Table 3
Percentage of Public High School Graduates Who Completed an Occupational
Concentration in 2005 by Selected Characteristics
________________________________________________________________________
Student characteristic
Percentage who completed
an occupational concentrationa
All graduates 20.8
Race/ethnicityb
White
Black
American Indian
Hispanic
Asian/Pacific Islander
Otherc
21.8
21.2
19.2
18.2
12.6
15.2
Sex
Male
Female
25.3
16.5
Disability status in grade 12
Disabled
No reported disability
25.6
20.5
Limited English Proficiency in grade 12
Limited English proficient
No reported Limited English proficient
11.8
21.3
Grade 9 mathematics
Geometry or higher
Prealgebra or algebra
Low-level or no mathematics
16.2
21.7
25.0
Size of 12th
-grade school
1-499 students
500-999 students
1,000-1,499 students
1.500-1,999 students
2,000 or more students
28.4
23.8
21.6
19.3
16.2
Note. Adapted from “Career and Technical Education: 1990 to 2005 Statistical Analysis
Report” by U.S. Department of Education (2008), p. 31. aCompleting an occupational concentration is defined as earning 3.0 credits or more in
any one occupational program. bBlack includes African American, Hispanic includes
Latino, Pacific Islander includes native Hawaiian, and American Indian includes Alaska
Native. cOther includes multiple races.

75
Table 4
Percentage of Public High School Graduates in 2005 Who Were Occupational
Concentrators and Nonconcentrators by Selected Characteristics
Student characteristic
Occupational
Concentratorsa
Nonconcentrators
All graduates 100.0 100.0
Race/ethnicityb
White
Black
Hispanic
Asian/Pacific Islander
American Indian
Otherc
71.3
13.9
10.8
2.7
0.8
0.4
67.2
13.6
12.7
5.0
0.9
0.6
Disability status in grade 12
Disabled
No reported disability
10.6
89.4
8.1
91.9
Limited English Proficiency in grade 12
Limited English proficient
No reported Limited English proficient
1.9
98.1
3.7
96.3
Sex
Male
Female
59.2
40.8
45.9
54.1
Grade 9 mathematics
Geometry or higher
Prealgebra or algebra
Low-level or no mathematics
18.9
66.6
14.5
25.6
63.0
11.4
Size of 12th
-grade school
1-499 students
500-999 students
1,000-1,499 students
1.500-1,999 students
2,000 or more students
15.9
19.4
26.2
19.5
19.0
10.6
16.5
25.2
21.7
26.1
Note. Adapted from “Career and Technical Education: 1990 to 2005 Statistical Analysis
Report” by U.S. Department of Education (2008), p. 41. aCompleting an occupational concentration is defined as earning 3.0 credits or more in
any one occupational program. bBlack includes African American, Hispanic includes
Latino, Pacific Islander includes native Hawaiian, and American Indian includes Alaska
Native. cOther includes multiple races.

76
In Pennsylvania, students who enrolled in career and technical education tended
to be less well prepared for college and careers, based on the results of the 2008-2009
grade 11 performance on the Pennsylvania System of School Assessment. There were 85
area career and technical education schools in Pennsylvania in 2002. The State Director
of the Bureau of Career and Technical Education, Dr. Lee Burket, supplied the data in
Table 5 in a personal email communication (Burket, October 26, 2010). The data were
taken from a much larger overall report to the U.S. Department of Education, 2009
Consolidated Annual Report, and constituted data on students enrolled in career and
technical education during the 2008-2009 school year. Of those enrolled in career and
technical education programs in Pennsylvania in 2008-2009, approximately 34 percent
were economically disadvantaged based on participation in the federal school lunch
program, 27 percent were educationally disabled (as defined by having an IEP), while 0.7
percent were gifted.
Table 6 shows the performance data for all students in Pennsylvania who
participated in the Pennsylvania System of School Assessment during 2008-2009.
Compared to all students in Pennsylvania on the statewide assessment in reading and
math, career and technical students performed less well in math (35 percent versus 56
percent) and in reading (43 percent versus 64 percent).

77
Table 5
Consolidated Annual Report Submitted to the U.S. Office of Education by the
Pennsylvania Department of Education, Bureau of Career and Technical Education
Percentage proficient and above
2008 PSSA Results for
Concentrators Reading Math
All Career and Technical
Students 43.4 35.0
Female 46.6 31.1
Male 41.2 37.6
American Indian 46.6 33.3
Asian 57.0 56.0
Black 30.7 22.5
Hispanic 31.2 23.0
Multi-Racial 47.5 36.6
White 45.4 37.0
Individuals With Disabilities 42.4 32.0
Disability Status (IEP) 14.8 12.4
Economically Disadvantaged 35.6 28.2
LEP 7.90 13.6
Gifted 82.6 80.7
Tech Prep 50.2 41.3
Note. Adapted from personal communication with L. Burket, October 26, 2010, from data
submitted by the Pennsylvania Department of Education, Bureau of Career and Technical
Education, to the U.S. Department of Education on the 2009 U.S.D.O.E. Consolidated
Annual Report.

78
Table 6
Comparison of Percentage of 2008-2009 Grade 11 Career and Technical Students to All
Students Who Scored Proficient and Advanced Proficient on the PSSA
Note. Adapted from “Pennsylvania Department of Education, School Assessments,” retrieved
September 8, 2010, from http://www.portal.state.pa.us/portal/server.pt/community/school_
assessments /7442/2007-2008_pssa_and_ayp_results/507514 and from personal communication with L. Burket, October 26, 2010. The all students’ data were retrieved from the Pennsylvania
Department of Education portal. The career and technical students’ data were reported in
personal communication from Dr. L. Burket and based on the Consolidated Annual Report submitted to the U.S. Department of Education by the Pennsylvania Department of Education,
Bureau of Career and Technical Education, which has not yet been made a public document by
the U.S. Department of Education.
Career and technical education schools represent a unique educational
environment. The grade level of students includes grades 9 or 10 through grade 12.
Most part-time career and technical education schools in Pennsylvania include grades 10-
12 (Association for Career and Technical Education, 2009). Nationally, career and
technical education students tend to be less well prepared than their non-career and
technical education counterparts based on the level of grade 9 math that they completed
and on standardized state-wide assessments. They tend to be from lower socioeconomic
backgrounds than their non-career and technical education peers. The data suggest that
Math
Reading
Group Number Tested
Percentage
Proficient and
Above
Number
Tested
Percentage
Proficient and
Above
All Students 135,137 55.9 135,015 63.7
Career and
Technical
Students
15,375 43.4 15,396 35.0

79
career and technical education schools would be more favorably impacted by effective
leadership skills demonstrated through the learning-centered leadership model than
higher performing schools (Brady, 2003).
National Occupational Competency Testing Institute (NOCTI) assessment.
In addition to the assessments required as part of the Pennsylvania System of
School Assessment (PSSA), students enrolled in career and technical education programs
in Pennsylvania participate in occupational testing developed by NOCTI, an end-of-
program assessment of their technical skills (“Secondary Performance Measures and
Standards,” 2008). Public Law 109-270, also known as the Carl D Perkins Career and
Technical Education Improvement Act (2006), requires Pennsylvania to assess core
indicators of academic and technical performance. The PSSA meets the requirements for
an assessment of academic performance. NOCTI meets the Pennsylvania Department of
Education, Bureau of Career and Technical Education, requirements for student
occupational skill performance (Kister, n.d.; “Secondary Performance Measures and
Standards, 2008).
It includes measures of both technical knowledge and skills (based on industry-
validated standards) and technical literacy aligned with state and national standards.
It measures progress against clear technical skill standards benchmarked at the
national level.
It meets the standards of quality assessments identified by the American
Psychological Association in that it is reliable, valid, fair and non-biased, and secure.
NOCTI is used in Pennsylvania to meet the measure of technical skill attainment.

80
“All students who complete a career and technical education program will attain
the knowledge and skills that meet program defined and industry validated career and
technical skill standards” (“Secondary Performance Measures and Standards,” 2008,
p. 2). The 2010 state performance goal was 56 percent of the students who participate in
the NOCTI would achieve scores at or above the competency level (Bureau of Career and
Technical Education, 2010).
As NOCTI is required for all students who complete career and technical
education programs, it serves as a uniform measure of student technical skill achievement
across all schools in Pennsylvania. Unlike the PSSA which is administered to all
students in grade 11, NOCTI is only administered to students in career and technical
education at the end of the technical program in grade 12. NOCTI will serve as the
measure of student performance for the purpose of this research study.
Chapter Summary
This chapter focused on a review of literature relevant to the conceptual
framework of learning-centered leadership. Relevant literature included effective schools
research, the changing role of the principal, theories of leadership, the conceptual
framework of learning-centered leadership, measuring and assessing schools leadership,
and finally, the unique context of the career and technical education school.
The impetus for effective schools research was an effort to prove that schools
made a difference in student achievement more so than socioeconomic background.
Research of high-poverty, high-achieving schools demonstrated that the tenets of
effective schools had a direct effect on student achievement to a much greater degree than
the socioeconomic background of students.

81
Social, political, and internal demands have changed the role of the principal over
the past 40 years. The roles included building and people manager, instructional leader,
change leader, and transformational leader. The literature demonstrated that with each
new role, principals were not been relieved of past responsibilities. The increasing
complexity and high demands of the position only added to the evolution of leadership
theories that lead to effective schools. Descriptions in the literature suggested that
principals are expected to assume a new role, that of learning-centered leader.
The focus on learning in learning-centered leader applies to students, teachers,
and principals. The concept of learning-centered leadership brings with it an
understanding of the core components and key processes that have been demonstrated to
have a positive, although indirect, effect on student achievement. The core components
and key processes are the outcome of a thorough body of research that together aligns to
the standards adopted by the Council of Chief State School Officers and the National
Policy Board for Educational Administration, the Interstate School Leaders Licensure
Consortium (ISLLC) 2008.
The research demonstrates that knowing what to do and how to do it is not the
same body of knowledge. Further, for principals to know exactly what to do and how to
do it, they must understand the context in which they are performing. Principals must be
aware of the school and staff attributes in which they work, and alter their leadership
behaviors accordingly. A learning-centered leadership style shows promise for having a
greater impact in low performing schools.
The body of research surrounding measurement and assessment of leadership
skills is scant. Measures of principal performance at the local level are most times based

82
on job descriptions that may not be aligned to the current demands of the principal’s
position. Further, few local instruments have been constructed to pass standards for
validity or reliability. The research suggests the need for a valid and reliable instrument.
The Vanderbilt Assessment of Leadership in Education (VAL-ED) shows promising
results in that it meets these criteria.
The review of literature has consistently pointed to the context of leadership skills
as an important element in school effectiveness. Career and technical schools represent a
unique context and school population. The curriculum of each class or program in a
career and technical school is dramatically unique, and the principal is unlikely to hold
expertise in more than one class or program. The student population is generally less
well prepared than students who do not enroll in career and technical education. The
students demonstrate less proficiency on statewide assessments, and, as a whole, more
students with individualized education plans enroll in career and technical education than
not.
The National Occupational Competency Testing Institute (NOCTI) student
occupational assessment is mandated by the Pennsylvania Department of Education,
Bureau of Career and Technical Education, as a measure of career and technical
education students’ technical skills. This assessment is unique to students enrolled in
career and technical education. It will provide consistent data that may be used for
comparison purposes across career and technical education schools in Pennsylvania.
The student attributes of those enrolled in career and technical education point to
a student population most in need of effective principal leadership. The research on
career and technical education schools and leadership in career and technical education

83
schools is meager at best. This study adds to the body of knowledge about effective
leadership practices in the context of the career and technical education school.
84
Chapter 3
METHODOLOGY
Chapter 3 provides an overview of the research problem related to this study. It
includes the research questions, measurement, description and explanation of the
dependent and independent variables, data collection, and data analysis. A more
thorough discussion of the commercial instrument used in this study, the Vanderbilt
Assessment of Leadership in Education (VAL-ED), is provided, as well as a description
of the reliability and validity assessment for this commercially available instrument.
The Problem
Numerous studies have linked effective leadership with positive student
achievement (Edmonds, 1982; Farkas, Johnson, & Duffet, 2003; Glasman & Heck, 1992;
Hallinger & Heck, 1998; LaPointe & Davis, 2006). Principals find themselves
accountable and under increasing pressure to create the conditions in schools under which
students demonstrate high achievement (Hallinger, 2005). Schools that demonstrate high
student achievement are more likely to have instructional leaders who exhibit strong
organizational management skills (Hornig & Loeb, 2010). In general, career and
technical education students are not academically prepared as well and do not perform as
well as their noncareer and technical education counterparts on state assessments of
academic achievement (Personal communication, Dr. Lee Burket, October 27, 2010; U.S.
Department of Education, 2008). Career and technical education schools are in need of
effective leaders.
The purpose of this study was to investigate the leadership skills of principals in
selected part-time area career and technical schools using the Vanderbilt Assessment of

85
Leadership in Education (VAL-ED) principal instrument. This study determined the
extent to which the leadership skills differed from the national norm. It also identified
differences in the perceptions of leadership among principals, supervisors, and teachers.
Further, it determined the extent to which a relationship existed between specific
leadership skills and student achievement. The measure of student achievement was the
Pennsylvania end-of-program occupational assessment developed by the National
Occupational Competency Testing Institute (NOCTI).
Research Questions
Four research questions analyzed the leadership skills of principals from the
conceptual framework of learning-centered leadership. The research questions follow.
1. To what extent did principals in selected career and technical schools demonstrate
learning-centered leadership skills measured by the Vanderbilt Assessment of
Leadership in Education?
2. To what extent, if any, did principals in selected career and technical schools
demonstrate learning-centered leadership skills different from the national norm?
3. To what extent, if any, did the perceptions of leadership skills differ among
principals, teachers, and supervisors?
4. To what extent, if any, did the leadership skills of selected career and technical
education principals show an association with student achievement measured by the
National Occupational Competency Testing Institute (NOCTI) end-of-program
assessment?

86
Population and Sample
Population.
The population for this study was instructional leaders in part-time career and
technical education schools in the Commonwealth of Pennsylvania. The term principal
was used to identify the instructional leader in each school system regardless of the actual
position held by the instructional leader. Area career and technical education schools
may also be referred to as regional career and technical education centers.
Career and technical education in Pennsylvania is delivered through 85 regional
career and technical education centers and approximately 300 comprehensive high
schools (Association for Career and Technical Education, 2009). According to the most
recent publicly available data (2006-2007), 12 schools provide comprehensive education
programs and the remaining schools provide career and technical education programs.
Approximately 113,000 students were enrolled in a career and technical education
program. Most of the students enrolled in career and technical education programs were
enrolled in grades 10-12 (Association for Career and Technical Education, 2009).
This study focused on part-time area career and technical education schools that
represented a consortium of school districts in a stand-alone educational setting under
school leadership separate from a school district. The individuals in an area or regional
school are more likely to report to a single administrative or executive director who then
reports directly to a joint area committee or school board. In some smaller area career
and technical education schools, the instructional leader may be the director who reports
directly to the joint operating committee. In any case, an area career and technical
education principal is more likely to be working in an autonomous situation than a

87
principal who is one of several principals working in a comprehensive school district
under the supervision of or in collaboration with other administrators under the direct
supervision of a full-time superintendent who, in turn, reports directly to the Board of
Education.
It is particularly important to study career and technical education principals
because very little literature exists on the leadership skills of principals in this school
setting. The research that does exist on principal leadership illustrates that the context in
which leadership skills are demonstrated has an important influence upon the
effectiveness of those skills (Blasé & Kirby, 2000; Hallinger, Bickman, & Davis, 1996).
As shown in Table 6, this population of principals is significant because students in
career and technical education schools consistently perform below the state standard on
academic achievement measured by the Pennsylvania System of School Assessment
(PSSA), and they perform lower than non-career and technical education students
perform. In addition, the student population is unique. Career and technical schools
typically enroll a higher percentage of students with IEPs (educationally disadvantaged or
handicapped) and a higher percentage of students who are less well prepared for college
and career success defined by the level of mathematics in grade 9 (Bureau of Career and
Technical Education, 2011; U.S. Department of Education, 2008).
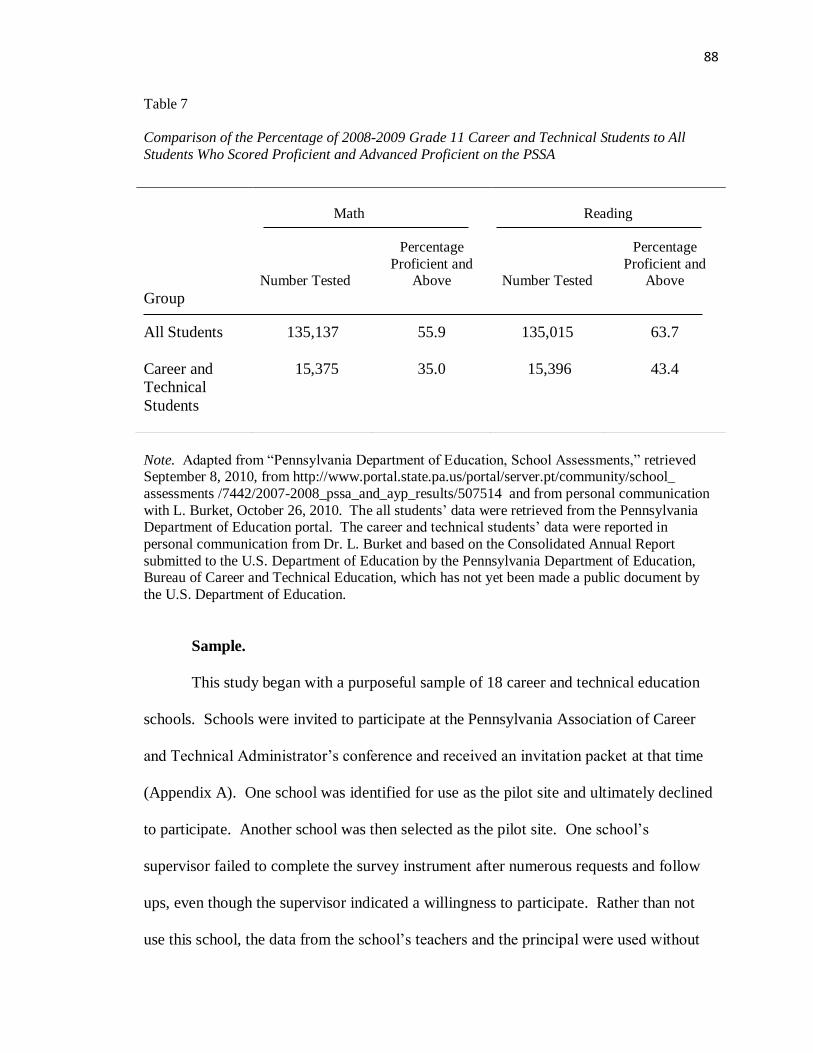
88
Table 7
Comparison of the Percentage of 2008-2009 Grade 11 Career and Technical Students to All
Students Who Scored Proficient and Advanced Proficient on the PSSA
Note. Adapted from “Pennsylvania Department of Education, School Assessments,” retrieved September 8, 2010, from http://www.portal.state.pa.us/portal/server.pt/community/school_
assessments /7442/2007-2008_pssa_and_ayp_results/507514 and from personal communication
with L. Burket, October 26, 2010. The all students’ data were retrieved from the Pennsylvania Department of Education portal. The career and technical students’ data were reported in
personal communication from Dr. L. Burket and based on the Consolidated Annual Report
submitted to the U.S. Department of Education by the Pennsylvania Department of Education, Bureau of Career and Technical Education, which has not yet been made a public document by
the U.S. Department of Education.
Sample.
This study began with a purposeful sample of 18 career and technical education
schools. Schools were invited to participate at the Pennsylvania Association of Career
and Technical Administrator’s conference and received an invitation packet at that time
(Appendix A). One school was identified for use as the pilot site and ultimately declined
to participate. Another school was then selected as the pilot site. One school’s
supervisor failed to complete the survey instrument after numerous requests and follow
ups, even though the supervisor indicated a willingness to participate. Rather than not
use this school, the data from the school’s teachers and the principal were used without
Math
Reading
Group
Number Tested
Percentage
Proficient and Above
Number Tested
Percentage
Proficient and Above
All Students 135,137 55.9 135,015 63.7
Career and
Technical
Students
15,375 35.0 15,396 43.4

89
the supervisor’s responses. Because of this, there are only 15 supervisor’s responses but
16 schools included in the data analysis.
The original schools were selected based on their geographic location within the
Commonwealth and the biographical characteristics of the instructional leader. The focus
of this research was the instructional leader who had at least the same number years of
experience as there were in the school’s delivery system. By selecting leadership
participants in this way, it allowed the researcher to make a reasonable assertion that the
instructional leader’s skills had an indirect influence on the student achievement of the
students within the school because the leader had been in the leadership role for the
duration of the students’ enrollment period in that particular school.
Although not generalizable to all career and technical education schools in
Pennsylvania, valuable information was learned from this study. This researcher used a
criterion-based sample that provided a representative sample that reflected similar
proportions as the population of career and technical education school principals in terms
of years of experience in the principal’s position and years of prior teaching experience
(Huck, 2008; Leedy, 2009; Patton, 2002; Sirkin, 1999). For different sampling
techniques, a population may comprise four characteristics: (a) a homogenous group of
individuals; (b) groups roughly equal in size; (c) proportions within the population; and
(d) discrete clusters heterogeneous to the total population (Leedy, 2009). The purposeful
sample for this study contained similar proportions in terms of years of experience in
teaching and years of experience in administration as those that exist within the larger
target population of Pennsylvania career and technical education instructional leaders.

90
Lee and Baskerville (2003) found there are methods of using proportions within
the population of a smaller sample that are as valid as a random sample of the population.
Because of this, value exists in studies that include less than a random sample.
In a statistical study, the researcher may appropriately test a theory with the help
of measurements of population characteristics through sample points that are
generalizable to sample estimates. . . however, it would be inappropriate to
criticize a theory for a lack of generalizability to other settings; the reason is that,
as a consequence of Hume’s truism, a theory may never be generalized to a
setting where it has not yet been empirically tested and confirmed. (Lee &
Baskerville, 2003, p. 241)
They further stated that “there is only one scientifically acceptable way to establish a
theory’s generalizability to a new setting: It is for the theory to survive an empirical test
in that setting” (p. 241). These researchers concluded that there is value in a study that
includes less than a random sample if the sample studied mirrors the characteristics of the
population as a whole.
Strata may exist in career and technical education instructional leaders. As stated
in Krueger (2001), “. . . estimates of sample size have been intended for populations
that were absent of strata that may affect the variable being measured” (p. 252).
Research findings suggests that the number of years of previous teaching experience and
the years of experience in the role of a principal are personal characteristics and
antecedent variables that have an effect on leadership skills (Erwin, Winn, Gentry, &
Cauble, 2010; Hallinger, Bickman, & Davis, 1996; Lindahl, 2007; St. Germain & Quinn,
2005).

91
Erwin et al. (2010) conducted a quantitative analysis of principals from 784
elementary, middle, and high schools in Texas. The schools included 248 urban, 277
suburban, and 259 rural schools. Their findings indicated differences in the leadership
styles of principals at the urban, suburban, and rural schools and the need for additional
study of principals by personal attributes, including gender, years of experience as a
teacher, and years of experience in the role of principal. Hallinger, Bickman, and Davis
(1996) also found a relationship between principal leadership skills and gender. St.
Germain and Quinn (2005) found a relationship between leadership effectiveness and
years of experience. Clark, Martorell, and Rockoff (2009) found a positive association
between the number of years of experience in the principal’s position and school
performance measures, particularly math achievement and student absences. Rice (2010)
further reported that effective and experienced school principals are less likely to be
working in low-achieving schools. The study proposed by this researcher adds to the
body of research by providing knowledge of these personal attributes as they relate to
learning-centered leadership skills of career and technical education principals. Despite
the conclusions of Erwin et al., as well as Krueger (2001), and Lee and Baskerville
(2003), it is cautioned that generalizability may not be appropriate from this study, given
that it does not include a scientific random sample of part-time career and technical
education schools in the Commonwealth of Pennsylvania and the respective instructional
leaders in those schools.
The sample was drawn based on specific profile data supplied by two subject
matter experts in the field of career and technical education in Pennsylvania, as well as
data collected through an email survey of career and technical education directors
92
conducted through the Pennsylvania Association of Career and Technical Education
Administrators (PACTA) in November 2011. The subject matter experts were the State
Director of the Bureau of Career and Technical Education, Dr. Lee Burket, and the
Executive Director of the Pennsylvania Association of Career and Technical
Administrators (PACTA), Ms. Jackie Cullen. Since 1981, Dr. Burket has served in the
field of career and technical education. In 2006 she was named to the position of State
Director of Career and Technical Education within the Pennsylvania Department of
Education. Previous to her appointment as the Executive Director of PACTA in 1989,
Ms. Jackie Cullen served as the State Director of the Bureau of Career and Technical
Education for two years.
The school’s profile data included its geographic location and the principal’s
years of experience as a teacher and as a principal. Based on the proportions of these
three demographic descriptors, 18 schools were elected within Pennsylvania.
Following a modified design for a sample defined by Krueger (2001) and Leedy
(2009), this research study estimated the sample size for the entire population. Given that
there are 85 school systems, 12 of which are comprehensive career and technical
education schools and excluded from the population, the sample size based on a 95
percent confidence level and a three percent margin of error would be 60 career and
technical education principals (Krueger, 2001). The sample of 18 instructional leaders
was purposefully selected in the same proportion found within the total population by
years of experience as a teacher and years of experience in the role of the principal as
representative of the population of career and technical education school principals, as

93
determined by the subject matter experts. Schools were selected across the three
geographic regions of the state: western, central, and eastern.
Table 8 illustrates the personal characteristics of typical instructional leaders as
collected through an informal email survey conducted November 2010 and verified by
the subject matter experts as being reflective of statewide principals or those serving as
instructional leaders. According to the subject matter experts and the email survey to
career and technical directors of which 50.7 percent of 85 part-time career and technical
education schools responded, the specific positions responsible for instructional
leadership in career and technical education schools includes approximately 56.8 percent
directors, 21.6 percent principals, 13.5 percent supervisors, and 8.1 percent other
positions. The gender proportion of instructional leaders is approximately 51.4 percent
female and 48.6 percent male.

94
Table 8
Comparison of Personal Attribute Data of Statewide and Research Sample Career and
Technical Education Instructional Leaders
Characteristic Statewide Sample
Average Number of Years in Teaching
Prior to Becoming an Administrator 11.2 12.6
Average Number of Years in Current Position 4.7 4.6
Average Total Number of Years in an
Instructional Leadership Position 7.2 6.8
Note. Data adapted from an informal email survey conducted through the Pennsylvania
Association of Career and Technical Administrators, November 2010, and verified as
typical of career and technical education school leaders by subject matter experts.
Response rate of part-time career and technical education schools was 50.7 percent.
Demographic Data
School demographic data included location of the school and percentage of
students enrolled with IEPs and percentage of students participating in the federal free
and reduced lunch program. Of the 16 schools providing data, 12 (75 percent) were
classified as urban and 4 (25 percent) were classified as rural, as defined by the U.S.
Department of Health and Human Services Office of Rural Health Policy based on the
Metropolitan Statistical Area (MSA) designation. Related to serving students with IEPs,
5 schools identified between 21 and 30 percent and 11 schools identified between 31 and
50 percent. Related to students participating in the federal free and reduced lunch
program as an indicator of economic background, nine schools reported between 21 and
30 percent participation, four schools reported between 31 and 50 percent participation,
and three schools reported more than 51 percent participation.

95
Personal attributes of the schools’ principals were compared to the proportion that
existed in the population related to years of experience as a teacher and years of
experience as a principal. The demographic data were useful in describing the
characteristics of the principals assessed in this study. Demographic data of the school
and school population collected in this study included the type of school (urban or rural),
the percentage of special education students enrolled during the same school year in
which the National Occupational Competency Testing Institute (NOCTI) end of program
assessment data were collected, and the percentage of students participating in the federal
school lunch program. The year of NOCTI testing was the 2010-2011 school year.
Recruitment and survey process.
After the initial presentation to schools at the Pennsylvania Association of Career
and Technical Administrator’s (PACTA) conference, directors received the recruitment
information (Appendix A), email recruitment information outlining the purpose of the
survey and the process to be followed (Appendix B), and the consent to participate form
(Appendix C). Instructional leaders and supervisors were emailed a copy of the Informed
Consent forms approved by the Institutional Review Board (IRB) (Appendices D and E).
Once the school director approved and the informed consent forms were returned, the
teachers were sent a notice of participation (Appendix F) and Implied Consent forms
(Appendix G).
Variables
Nominal, ordinal, and interval or ratio data were analyzed in this study.
Leadership skills were assessed using the five-point Likert scale illustrated in Table 9.
Interval and ratio data are data that “contain information about both relative value and

96
distance” (Urdan, 2005, p. 4). Responses to individual Likert items represent relative
value at best. However, summated Likert subscale values developed from subscales
where the summated subscale score is based on an acceptable level of score reliability
have commonly been treated as approaching interval data. The developers of the VAL-
ED instrument suggest the summated subscales may be treated as interval data (Porter,
Murphy et al., 2008, p. 20).
Table 9
Leadership Skill Descriptors on the Five-Point Likert Scale
Descriptor (Anchor) Scale Value
Ineffective 1
Minimally effective 2
Satisfactorily effective 3
Highly effective 4
Outstandingly effective 5
Note. Adapted from “Vanderbilt Assessment of Leadership in Education: Technical
Manual,” by A. C. Porter et al., 2008, retrieved from the Wallace Foundation website.
Copyright 2008 by Vanderbilt University.
Independent variables.
Personal attributes of the principals were used as independent variables to
determine any association with the years of experience as a teacher and years of
experience as a principal with leadership skill values measured on the VAL-ED (research
question one).

97
Dependent variables.
Two primary outcomes represent dependent variables, depending upon the
research question being analyzed. The first primary dependent variable was the
leadership skills defined by the criteria that represent the intersection of the six core
components and six process leadership skills assessed by the VAL-ED instrument. Each
intersection of core components with key processes was defined by one cell. Leadership
skills were also considered an independent variable when analyzed for an association
with NOCTI proficiency (research question four). Leadership skills were treated as
nominal data for the purpose of conducting a log-linear analysis with NOCTI scores.
A second dependent variable (research question four) was the percentage of
students achieving proficiency on the end-of-program assessment developed by the
National Occupational Competency Testing Institute (NOCTI) assessment. These tests
are considered job ready assessments because they measure the skills of an entry-level
worker or an individual who has completed course work in a secondary career and
technical program. Student performance was divided into four categories: advanced,
competent, basic, and below basic. For analysis in this study, the four categories were
collapsed into two categories: competent and advanced, and basic and below basic.
Table 10 illustrates the leadership skills to be assessed at the intersection of the
six core components with the six key processes. Table 11 identifies the educational
leadership policy standards, the Interstate School Leaders Licensure Consortium (ISLLC)
2008 to which the numbers within each cell of Table 10 refer. Table 12 identifies each
dependent and independent variable and the measurement of scale.

98
Note. The number within each cell indicates the specific standard of the Interstate School
Leaders Licensure Consortium 2008. Adapted from “Assessing Learning-Centered
Leadership: Connections to Research, Professional Standards, and Current Practices,”
Leadership and Policy in Schools, 2009, p. 5, by E. B. Goldring, A. C. Porter, J. Murphy,
S. N. Elliott, & X. Cravens.
Core
Components
Key Processes
Planning Implementing Supporting Advocating Communicating Monitoring
High Standards
for Student
Learning
ISLLC Standard 1
Rigorous
Curriculum
(content)
2 2 2 2 2 2
Quality Instruction
(pedagogy)
2 2 2 2 2 2
Culture of
Learning &
Prof. Behavior
2, 3 2, 3 2, 3 2, 3, 5 2, 3, 5 2, 3
Connections to
External
Communities
4 4 4 4, 6 4, 6 4
Systematic
Performance
Accountability
5 5
Table 10
Vanderbilt Assessment of Leadership in Education: Intersection of the Core Components
and Key Processes with the ISLLC Standards

99
Table 11
Educational Leadership Policy Standards Adopted by the Council of Chief State School
Leaders and the National Policy Board for Educational Leadership: Interstate School
Leaders Licensure Consortium 2008 Professional Standards
Standard
Description
Standard 1 An education leader promotes the success of every student by
facilitating the development, articulation, implementation, and
stewardship of a vision of learning that is shared and supported by
all stakeholders.
Standard 2 An education leader promotes the success of every student by
advocating, nurturing, and sustaining a school culture and
instructional program conducive to student learning and staff
professional growth.
Standard 3 An education leader promotes the success of every student by
ensuring management of the organization, operation, and resources
for a safe, efficient, and effective learning environment.
Standard 4 An education leader promotes the success of every student by
collaborating with faculty and community members, responding to
diverse community interests and needs, and mobilizing community
resources.
Standard 5 An education leader promotes the success of every student by
acting with integrity, fairness, and in an ethical manner.
Standard 6 An education leader promotes the success of every student by
understanding, responding to, and influencing the political, social,
economic, legal, and cultural context.
Note. Adapted from Council of Chief State School Officers and National Policy Board
for Educational Administration, 2008, Educational leadership policy standards: ISLLC
2008. Copyright 2008 by the Wallace Foundation.

100
Table 12
Variable Types and Scale of Measurement
Variable Type Scale of Measurement
Leadership skills Dependent Ordinal—
Independent (RQ-4) collapsed to
Nominal
NOCTI results Dependent Interval/ratio—
collapsed to
Nominal
Years of teaching experience Independent Ordinal
Years in current position Independent Ordinal
Years of principal experience Independent Ordinal
Note. RQ-4 represents research question number 4.
Instrumentation
This study represented quantitative, descriptive correlational research. A survey
through use of an on-line questionnaire, called the Vanderbilt Assessment of Leadership
in Education (VAL-ED), was used to collect data about the perceptions of the learning-
centered leadership skills of the principal. The questionnaire was completed by the
principal, the principal’s supervisor, and the teachers supervised by the principal. VAL-
ED represents a multi-source assessment instrument. Smither, London, and Reilly (2005)
conducted a meta-analysis of 24 longitudinal studies of multi-source feedback
instruments. They found that it was “unrealistic for practitioners to expect large, across-
the-board performance improvements after people receive multi-source feedback.
Instead, it appears that some feedback recipients will be more likely to improve than
others” (p. 60). Their findings suggested that improvements were likely to occur when
101
recipients perceive that change is necessary, change is feasible, and recipients have a
positive orientation to feedback. In addition, if recipients are able to set appropriate goals
and take appropriate actions, improvements in performance are likely to occur.
The VAL-ED was nationally field tested in 2009 in 300 schools (100 elementary,
100 middle, and 100 high schools) in 27 states. It is based upon the Interstate School
Leaders Licensure Consortium (ISLLC) standards developed by the Council of Chief
State School Offices (CCSSO) in 1998 and revised in 2008. The National Policy Board
for Educational Administration (NPBEA) adopted the ISLLC standards in December
2007. The NPBEA is an organization that provides a forum for collaborative actions by
organizations interested in the advancement of school and school-system leadership
(National Policy Board for Educational Administration, 2010). The standards were
developed through four phases including input from educational and administrative
experts in the field, a multi-person analysis of 83 empirical research studies, and testing
in the field. The empirical research studies include quantitative, qualitative, and mixed
methods that spanned the period from 1986 to 2007.
Although there is much interest in principal leadership skills, there are few valid
and reliable instruments available to measure these skills in use at the local level (Condon
& Clifford, 2009; Goldring, Cravens, et al., 2009; Heck and Marcoulides, 1996). Condon
and Clifford (2009) found only twenty principal assessment instruments using Google
Scholar that were commercially available. Eight instruments were selected for analysis
because they met three criteria for the study. The criteria were that the assessments were
(a) intended for use as a performance assessment instrument, (b) psychometrically tested
for reliability and validity, and (c) publicly available for purchase. Table 13 identifies the

102
assessments evaluated, the developer of the assessment, and the year in which the
assessment was developed. Given the changing role of the principal between 1990 and
2010, older instruments may assess leadership skills that are no longer priorities or
relevant in order for principals to be effective.
Table 13
Assessment Instruments Analyzed by Condon and Clifford, and the Year of Development
Assessment Name
Developer
Year
Leadership Practices Inventory
Kouzes and Posner
2002
Performance Review Analysis and
Improvement System for Education
Knoop and Commons
1985
Principals Instructional Management-
Rating Scale
Hallinger and Murphy
1985
Principal Profile (revised)
Leithwood
1987
Change Facilitator Style Questionnaire
Vandenberghe
1988
Diagnostic Assessment of School and
Principal Effectiveness
Ebmeier
1992
Leadership Activity Questionnaire
Larsen
1987
Vanderbilt Assessment of Leadership in
Education
Porter et al.
2006
Note. Data in the table are adapted from “Measuring Principal Performance: How Rigorous Are
Publicly Available Principal Performance Assessment Instruments?” by C. Condon and M.
Clifford, 2009. Copyright 2010 by Learning Point Associates.

103
Principals, supervisors, and teachers in this study assessed leadership skills using
the on-line VAL-ED questionnaire. VAL-ED provides both a norm-referenced, criterion-
referenced assessment of the Learning Centered Leadership of the principal, using the
Interstate School Leadership Licensure Consortium (ISLLC) 2008 standards developed
by the Council of Chief State School Offices (CCSSO). Criterion-referenced profiles
were created by VAL-ED to determine the rating of distinguished, proficient, basic, and
below basic described in Table 14.
VAL-ED was developed through a multi-stage development process to ensure
reliability and validity, including cognitive labs, pilot tests, and field tests. The process
was guided by the American Educational Research Association’s 1999 Standards for
Educational and Psychological Testing (Porter et al., 2008).
Validity.
Content validity was first based on an examination of the research literature
related to the learning-centered leadership framework. A sorting study was then designed
to empirically test the validity of each of the 36 cells created by the intersection of the
core components with the key processes. A panel of nine principals served as subject
matter experts for this phase. Principals were randomly divided into three subgroups and
each given 98 of the 294 items that represented the 36 cells. The results of the sorting
study indicated that the core components and key processes demonstrated content validity
based on the principals’ sorting of the items into the correct cell for the conceptual
framework. The items were then revised in several says to further improve the content
validity of the VAL-ED.

104
Two rounds of cognitive labs were conducted to address “the complexity of the
question items, the possibility of socially desirable responses, and the likelihood of
unintentionally misleading responses (Biemer, Groves, Lybert, Mathiowetz, & Sudman,
1991; Desimone & LeFloch, 2004)” (as cited in Porter et al., 2008, p. 26). The cognitive
labs included participation of one school each from three urban districts: elementary,
middle, and high school. A second round of cognitive labs included “three respondents
each in three districts, two urban and one suburban” (p. 27) that included elementary,
middle and high school principals. Based on the recommendations of the participants in
the two cognitive labs, questions were removed that created redundancy, key words and
phrases were revised, and additional modifications were made to reach a high degree of
agreement that the instrument was measuring the leadership behaviors that were most
important to effective school leadership.
The VAL-ED instrument was subjected to a bias review committee of nine
individuals (six female and three male; four Caucasians, two Hispanics, two African
Americans, and one Asian-American) to ensure it was bias-free and reflective of
measuring the leadership skills it was intended to measure. These individuals were from
several urban districts and were trained and tested on the Educational Testing Service
International Principles of Fairness Review of Assessments Guidelines before they
reviewed the VAL-ED.
VAL-ED underwent two rounds of pilot tests and one field test. The first pilot
test included nine schools, which included urban, suburban, and rural schools. The
second pilot test included 11 schools, also including urban, suburban, and rural schools
(Porter, Murphy, et al, 2008). It was field tested in 2008 with approximately 300 schools:

105
100 elementary, 100 middle, and 100 high schools. Based on the field test, descriptors
and mean cut scores for each proficiency level were established. The descriptors and
mean cut score for each proficiency level are illustrated in Table 14.
The overall content and construct validity of VAL-ED was verified through a
sorting study, two series of cognitive interviews, a bias review, a nine-school pilot test,
and an 11-school pilot test (Porter, Murphy, et al, 2008). After each phase, modifications
were made to the instrument to increase the content and construct validity. At the
conclusion of the validity tests, it was then subjected to the 300 school national field test
in 2008.
Reliability.
There are four general types of reliability. Inter-observer reliability is used to
assess the degree to which different observers give the same rating to the same
observation or characteristic. Test reliability assesses the consistency of a measure from
one time to another. Parallel-forms reliability assesses the consistency of the results of
two assessment forms used to assess the same content domain. Internal consistency
reliability assesses the consistency of results across items within a test.
Only internal-consistency reliability could be conducted in the pilot study of nine
schools for the teacher raters. Cronbach’s Alpha reliabilities for individual teacher scores
ranged from .92 to .97. Total score reliabilities were greater than .98. Reliabilities for
core components tended to be higher than for key processes (Porter et al., 2008). Table
15 identifies the estimates of internal consistency reliability for Form C, the VAL-ED
form used in this study.

106
Table 14
Descriptors and Mean Cut Scores Associated with VAL-ED Proficiency Levels
Level
Descriptor
Score Range
Below Basic A leader at the below basic level of proficiency
exhibits leadership behaviors of core components
and key processes at levels of effectiveness that
over time are unlikely to influence teachers to bring
the school to a point that results in acceptable value-
added to student achievement and social learning
for students.
1.00 – 3.28
Basic
A leader at the basic level of proficiency exhibits
leadership behaviors of core components and key
processes at levels of effectiveness that over time
are likely to influence teachers to bring the school
to a point that results in acceptable value-added to
student achievement and social learning for some
sub-groups of students, but not all.
3.29 -3.59
Proficient A proficient leader exhibits leadership behaviors of
core components and key processes at levels of
effectiveness that over time are likely to influence
teachers to bring the school to a point that results in
acceptable value-added to student achievement and
social learning for all students.
3.60 – 3.99
Distinguished A distinguished leader exhibits leadership behaviors
of core components and key processes at levels of
effectiveness that over time are virtually certain to
influence teachers to bring the school to a point that
results in strong value-added to student
achievement and social learning for all students.
4.00 – 5.00
Note. In the study of 300 principals in the spring of 2008 to determine the cut score
range, 17% scored below basic, 33% scored basic, 36% scored proficient, and 14%
scored distinguished (Porter et al., 2008).

107
Table 15
Estimates of Internal Consistency Reliability for VAL-ED Form C
Criteria Cronbach’s α
High standards for student learning 0.97
Quality instruction 0.95
Rigorous curriculum 0.97
Culture of learning and professional behavior 0.96
Connections to external community 0.97
Performance accountability 0.97
Planning 0.95
Implementing 0.95
Supporting 0.96
Advocating 0.96
Communicating 0.97
Monitoring 0.96
Total 0.99
Adapted from “Vanderbilt Assessment of Leadership in Education: Technical Manual,”
by A. C. Porter, J. Murphy, E. Goldring, S. N. Elliott, M. S. Polikoff, & H. May, 2008,
p. 38. Retrieved from The Wallace Foundation website at http://www.wallacefoundation
.org /KnowledgeCenter/KnowledgeTopics/CurrentAreasofFocus/EducationLeadership
/Pages/Vanderbilt-Assessment-of-Leadership-in-Education-Technical-Manual-1.aspx
Copyright 2008 by Vanderbilt University.

108
Pilot Study
This researcher conducted a pilot study for administration of the VAL-ED after
approval of the study by the Institutional Review Board (IRB) and the researcher’s
doctoral committee in April 2011. The original site selected to participate as the pilot site
ultimately declined to participate. A second school from one of the remaining 17 schools
was then selected as the pilot site. The principal, principal’s supervisor, and teachers
were invited to participate in the pilot study through initial contact at the Spring 2011
conference of the Pennsylvania Association of Career and Technical Education
Administrators.
Lessons learned from the pilot study data collection process, the approximate time
required for the principal, supervisor, and teachers to complete the assessment
instrument, and other knowledge gained from the pilot study was used to schedule the
parameters for assessment administration in late spring 2011. The pilot study served to
provide the researcher with one commercially prepared principal’s report from which
knowledge about the contents of the VAL-ED commercial report was gained, such as the
report details and alignment with the core components and key processes. As a result of
the pilot study, however, there were no major changes or modifications made to the
scripts, forms, or procedures implemented at the remaining 16 research sites.
Data Collection
In March 2011, the researcher presented at the Pennsylvania Association of
Career and Technical Administrators (PACTA) Winter Symposium soliciting participants
interested in learning about the purpose of the study. After approval by the IRB, the
researcher acquired the appropriate consent forms and explained the time line and

109
assessment process. The researcher scheduled dates for the assessment monitor to
administer the VAL-ED on line. The principal, principal’s supervisor, and teachers
completed the VAL-ED prior to June 15, 2011.
Each participant in the survey received an individual User ID and Survey Code
aligned to the specific school’s principal. Because the survey was online, if a teacher was
absent on the day of the data collection, the responses of that teacher could be included in
the data collection at a later date. The participants had the option to complete the survey
at the time of the introduction by the school monitor or at an off-site location at another
convenient time. As each participant received a unique User ID and Survey Code, it
ensured that each participant could respond only once.
Human subject protection.
The researcher complied with all requirements of the Institutional Review Board
(IRB) regarding the protection of human subjects. The human subjects protected in this
study were the principal, the supervisor, and the teachers supervised by the principal.
Data was collected and detailed by school principal. Each school participating in this
research study document was coded to ensure anonymity of principals, principals’
supervisors, and teachers supervised by the principals. Each principal and supervisor was
given a description of the study and a copy of the informed consent statement. Principals
and supervisors signed the informed consent statement prior to participation. Teachers
received an implied consent form and notice of participation prior to participating in the
study. Principals were emailed a link to a website that provided their individual
assessment results. Assessment results were not provided to the schools’ teachers or the
principals’ supervisors.

110
Data storage.
Discovery Education owns the rights to the VAL-ED assessment. Hardin Daniel,
Vice President of Discovery Education, provided a written statement of data security and
protection. This statement included the security measures taken to protect the data, the
identification of the length of time the data will be retained on their servers, and the
process followed to destroy the data. The statement from Discovery Education is
included as Appendix K.
Data Analysis
The VAL-ED developers provided raw data in an Microsoft® Excel format for
analysis by the researcher. The data were imported into SPSS to conduct the statistical
analysis necessary to complete this study.
To answer research question 1, descriptive statistics (means, median, frequency,
and standard deviation) were calculated and analyzed using the statistical software
program, SPSS, to determine the extent of principal leadership skills. A subpart of this
analysis involved using correlations to assess the relationship of demographic
characteristics with the leadership skills.
To answer research question 2, descriptive statistics (means, frequency, and
standard deviation) were used to calculate a percentage rank against the national norm. A
national norm does not exist for career and technical education principals. A national
norm exists for secondary school principals. The national norm was created based on
100 high school principals. A one-sample t test was used to determine if the principal’s
leadership skills were significantly higher or lower than the national norm value
secondary school principals from the VAL-ED pilot study.

111
To answer research question 3, inferential statistics were used to perform an
Analysis of Variance (ANOVA) to determine the extent to which there were differences
in the perceptions among the three multi-rater groups completing the assessment:
principal, principal’s supervisor, and teachers supervised by the principal.
To answer research question 4, SPSS was used to perform a chi-square with
Kendal’s Tau-b to determine if a relationship existed between leadership skills and
student achievement measured by the NOCTI end-of-program assessment. These
nominal variables were compared in a 2 x 2 chi-square table. This analysis was used to
determine if the principal leadership skills identified by VAL-ED had a particular
association with student achievement measured by NOCTI proficiency.
Table 16 summarizes the data analysis strategies that were compiled through this
study. Additional data were collected to conduct the analysis of the instructional leader’s
demographic data in association with leadership skills.

112
Table 16
Data Analysis Strategies for Research Questions
Research Question
Key Variable(s)
Data Analysis Strategies
Descriptive
Inferential
To what extent do
principals in selected
career and technical
schools demonstrate
learning-centered
leadership skills as
measured by the Vanderbilt Assessment of
Leadership in Education?
A subpart of this question
was to assess the
influence of demographic
characteristics (gender
and educational
experience variables) with
leadership skills.
Summated Subscales of VAL-ED
Core Components Subscales
Student Learning
Rigorous Curriculum
Quality Instruction
Culture of Learning & Prof. Beh. Connection to External Com.
Performance Accountability
Key Process Subscales
Planning
Implementing
Supporting
Advocating
Communicating
Monitoring
Mean
Frequency (n)
Standard
deviation
Normality of the
subscale scores using skew and
kurtosis values
was checked.
Pearson
correlation.
To what extent, if any, do
principals in selected
career and technical
schools demonstrate
learning-centered
leadership skills different
from the national norm?
The variables for research question
two are identical to the variables
listed for research question one.
The purpose here was to determine
the extent the Pennsylvania subscale
values differed from the national
norms.
Mean
Frequency (n)
Standard
deviation
Bar chart graph
A one-sample t
test in SPSS was
used to
determine if the
PA subscale
values differ
significantly
from the
national norm
values.
To what extent do the
perceptions of leadership
skills differ among
principals, teachers, and
supervisors?
The dependent variables for research
question three are identical to the
subscales listed above for research
question one.
The purpose here was to determine
the extent to which the Pennsylvania
subscale values differed among the
respondent groups, the independent variable. This independent variable
has three levels (principal, teacher,
and supervisor).
Mean
Frequency (n)
Standard
deviation
Analysis of
Variance

113
Research Question
Key Variable(s)
Data Analysis Strategies
Descriptive
Inferential
To what extent do the
leadership skills of
selected career and
technical education
principals show an
association with student
achievement as measured
by the National
Occupational Competency
Testing Institute (NOCTI)
end-of-program assessment?
Principals Performance Standard
(Below Basic, Basic, Proficient,
Distinguished). This variable
represents a nominal variable or one
could argue it represents ordered
categories.
The subscale scores from the VAL-
ED instrument were scored using the
VAL-ED Technical Manual
information so that each principal was classified into a Principal
Performance Standard.
Student achievement (NOCTI end of
program assessment) represents the
other key variable for question four.
This variable indicates percent of
students proficient or not proficient
on the NOCTI. It was reduced to
two nominal categories.
Crosstabs table
showing
frequency (n) and
relative percent
Chi-square with
Kendall’s Tau-b
was used.

114
Chapter Summary
Leadership has been found to be second only to teaching in terms of the influence
leadership has in creating effective schools. Because effective leadership has a positive,
indirect effect on student achievement, it is important to assess the extent to which
leadership skill exist, to compare the leadership skills to a national norm, determine
differences in perceptions of leadership skills among principals, teachers, and principals’
supervisors, and determine an association between specific leadership skills and student
achievement measured by the NOCTI.
This research study included a quantitative, correlational design using an on-line
multi-source assessment of leadership skills called the Vanderbilt Assessment of
Leadership in Education (VAL-ED). The leadership skills assessed included the six core
components and the six key processes of the learning-centered leadership conceptual
framework.
Data were collected from a purposeful sample of 17 area career and technical
education schools. Data from one school were used for the pilot study. Of the 16
remaining schools, 15 school supervisors’, 16 principals’ and 315 teachers’ data were
used. Data were analyzed using the IBM SPSS19.0 statistical software. Descriptive and
inferential statistics were computed.

115
Chapter 4
FINDINGS
Chapter 4 begins with a description of the sample selected for this study from the
career and technical education schools in the Commonwealth of Pennsylvania. A
discussion about the treatment of missing data follows. Finally, this chapter includes
descriptive data about the data collected and the analysis of this data relative to the four
research questions in this study.
The four research questions in this study analyzed the leadership skills of
instructional leaders from the conceptual framework of learning-centered leadership. The
instructional leader was defined as the person who had primary responsibility for teacher
supervision and evaluation. The term principal was used to identify the instructional
leader in each school system, regardless of the actual name of the position held. The four
research questions follow.
1. To what extent did principals in selected career and technical schools demonstrate
learning-centered leadership skills as measured by the Vanderbilt Assessment of
Leadership in Education (VAL-ED)?
2. To what extent, if any, did principals in selected career and technical schools
demonstrate learning-centered leadership skills different from the national norm?
3. To what extent, if any, did the perceptions of leadership skills differ among
principals, teachers, and supervisors?
4. To what extent, if any, did the leadership skills of selected career and technical
education principals show an association with student achievement measured by the

116
National Occupational Competency Testing Institute (NOCTI) end-of-program
assessment?
Sample Description
Seventeen schools participated in this research study in the spring of 2011 to
identify and analyze the leadership skills of instructional leaders in career and technical
education schools. One of these 17 schools was designated as the pilot study, and the
data from this school were not included in the data analysis. The remaining 16 schools
were located throughout Pennsylvania where five schools were in the western, six
schools were in the central, and five schools were in the eastern regions. Classification
by region was determined by the Pennsylvania Department of Education in the
designation of each school to a teacher preparation program. Schools designated for
attendance at Indiana University of Pennsylvania, Pennsylvania State University, and
Temple University were identified as western, central, and eastern regions, respectively.
Of the instructional leaders participating in the study, 67.0 percent (ten) were
male and 33.0 percent (six) were female. The schools were 75 percent urban and 25
percent rural as defined by the U.S. Department of Health and Human Services Office of
Rural Health Policy. Student participation in the federal free and reduced lunch program
ranged from a low of 22 percent to a high of 75 percent. Schools serving students with
IEPs ranged from a low of 23 percent to a high of 43 percent.
Table 17 illustrates additional personal attributes for the instructional leaders who
participated in this study compared to the statewide characteristics of all instructional
leaders in career and technical education schools. Table 18 illustrates that none of the
differences between the mean values of the research sample were statistically different

117
(p < .05) from the mean values of the statewide population of career and technical
education instructional leaders. All of the sample means were well within the 95 percent
confidence interval of the difference between the means.
Of the 16 schools that participated in the research study, 100 percent of the
principals (16/16), 93.0 percent of the supervisors (15/16), and 79.7 percent of the
teachers (315/395) completed the survey instrument. This compared favorably to the
nine-school pilot test conducted by Vanderbilt University in 2008 where 88.9 percent of
the principals (8/9), 100 percent of the supervisors (9/9), and 72.5 percent of the teachers
(319/440) participated in the survey.
Table 17
Personal Attributes of Statewide Career and Technical Education Instructional Leaders
Compared to Personal Attributes of Research Study Sample
Characteristic Statewide Research
Sample Sample
Average Number of Years in Teaching
Prior to Becoming an Administrator 11.2 12.6
Average Number of Years in Current Position 4.7 4.6
Average Number of Years in All
Instructional Leadership Positions 7.2 6.8
Note. Statewide sample data adapted from an informal email survey conducted through
the Pennsylvania Association of Career and Technical Administrators, November 2010,
and verified as typical of career and technical education school leaders by subject matter
experts. Response rate from half-day career and technical education schools was 50.7
percent.

118
Table 18
Analysis of Differences Between Statewide Sample of Instructional Leaders in Career
and Technical Education Schools and Research Sample
Personal
Attributes
t df
Sig. (2-
tailed)
Mean
Difference
95% CI
of the differences
Lower Upper
Years as a
teacher
.972
15
.347
1.363
-1.63
4.35
Years in current
position
-.111
15
.913
-.075
-1.52
1.37
Years in a
principal’s
position
-.333
15
.744
0.388
-2.87
2.09
Note. CI = Confidence Interval.
Data Analysis and Outliers
The raw data extracted from the survey respondents were provided by Discovery
Education™, owner of the Vanderbilt Assessment of Leadership in Education (VAL-
ED), in Microsoft® Excel 2010 format. The data were imported into IBM SPSS 19.0
statistical software. To maintain confidentiality and anonymity of the data, VAL-ED
survey codes were used to identify responses for the variables associated with each
school and school leader.
Principals and supervisors answered 72 questions about the principal, 2 for each
of the 36 variables representing the 6 core components and 6 key processes. For
teachers, one of these two questions for each core component and key process was

119
randomly generated by computer. This created one response for each of the 36 variables.
Each variable was then reviewed using the SPSS19 Explore function to determine that all
responses were within the expected range of 1 to 6 on the Likert response scale (a
response of 6 indicated Don’t know). All of the values fell within the expected range.
Prior to the data analysis for each of the research questions, the supervisor and principal
responses were recoded and calculated to produce responses to the 36 variables to be
consistent with the teacher data.
Once the principal and supervisor data were recalculated into variables similar to
the teachers, univariate data analysis was conducted to explore each variable in the data
set. The range of values and the central tendency were reviewed. A frequency table was
generated for each of the 36 variables to review the pattern of responses to each variable
to determine if any were outside the range of valid responses. None of the variables was
outside of the expected range of valid responses.
Upon more in-depth review of the data, however, three cases were problematic.
Case 154 responded to all 36 variables with a response of Don’t know. Case 134 left all
responses blank. Case 168 answered with one incidence of Don’t know and the
remaining responses were left blank. Since none of these cases added any value or
produced any useful information, all three cases were excluded from the data analysis. A
total of 346 cases were ultimately analyzed: 16 principal responses, 15 supervisor
responses, and 315 teacher responses.
Using SPSS 19.0’s Explore function to detect anomalies, four additional cases
were identified. The SPSS anomaly detection procedure searched for unusual cases
based on deviations from the norms of their cluster groups. These four cases represented

120
teacher responses from three different schools. The mean scores from two cases were
substantially (approximately three standard deviations) lower than all other teacher
response scores from their schools, and the scores in the other two cases were a perfect
5.0. Case 147 from school five demonstrated a mean of 1.61 in a range of means
between 3.44 and 5.0, excluding Case 147. Case 305 from school 14 demonstrated a
mean of 1.39 in a range of means between 3.14 and 4.36, excluding Case 305. Cases 74
and 87 both from the same school demonstrated an overall score of 5.0 in a range of
means between 2.14 and 4.28, excluding Cases 74 and 87.
The decision was made to include the four cases in the aggregate analysis. If it
was assumed that the four extreme evaluations were based fairly on the objective
observation, documents, or reports from others evaluating the principal, then they should
be included in the data analysis. If they were not biased, then perhaps they were based on
different aspects of the principal’s responsibilities of which other teachers were unaware.
Teachers may observe different aspects of a principal simply by chance. A teacher may
have missed a meeting where the principal discussed connections to the external
community, and as a result, the teachers may not have been aware of all the activities
related to that core component. On the other hand, the teachers may have given the
principal the benefit of the doubt because he or she was highly effective in some other
aspect of their performance. Finally, if it was assumed that the four cases were biased
either for or against the principal for reasons outside of the principal’s performance, then
it is quite possible that other scores for those same principals were the result of bias for or
against the principal but within the expected range. Since the reasons for the anomalies

121
were indistinguishable from other internally consistent responses, the decision was made
to include these cases in the data analysis.
A review of the descriptive statistics and graphical boxplots was conducted for
each variable and by school. The graphical boxplot representations produced four outlier
cases. Case 331 produced significantly lower responses for the variables Planning,
Implementing, Advocating , Supporting, Monitoring, High Standards for Student
Learning, Rigorous Curriculum, and Culture of Learning and Professional Behavior.
Case 304 produced significantly lower responses for the variables Planning,
Implementing, High Standards for Student Learning, Rigorous Curriculum, and Culture
of Learning and Professional Behavior. Cases 22 and 264 produced significantly lower
responses for the variables Advocating and High Standards for Student Learning. All of
the outlier responses were more than three standard deviations below the mean. There
were no outlier responses three standard deviations above the mean. These cases were all
included in this data analysis.
Missing Data
Possible responses ranged from 1 to 5 on a Likert response scale (and 6, which
indicated Don’t know) as indicated in Table 19. In addition, there were two ways that
respondents might choose not to complete a survey item. They could select 6 to respond
Don’t know, or they could leave an item blank. Principals did not have the option to
select Don’t know about their own performance.

122
Table 19
Leadership Skill Descriptors on the Five-Point Likert Scale
Descriptor (Anchor) Scale Value
Ineffective 1
Minimally effective 2
Satisfactorily effective 3
Highly effective 4
Outstandingly effective 5
Note. Adapted from “Vanderbilt Assessment of Leadership in Education: Technical
Manual,” by A. C. Porter et al., 2008, retrieved from the Wallace Foundation website.
Copyright 2008 by Vanderbilt University.
Missing data were analyzed using SPSS 19.0 Missing Values Analysis (MVA).
Responses of Don’t know ranged from a low of 12 responses (3.5%) for Supporting a
Rigorous Curriculum and Communicating Quality Instruction to a high of 138 responses
(39.9%) for Monitoring Connections to the External Community. Missing (blank)
responses ranged from a low of one for Planning High Standards for Student
Achievement to a high of six for Monitoring Performance Accountability.
Of the 346 responses, 31.5 percent (109) were complete cases; 68.5 percent (237)
had missing data for one or more variables. Table 20 summarizes the variables where the
percentage of missing data exceeded ten percent.

123
Table 20
Summary of Missing and Valid Data for Leadership Survey Variables
Leadership Variable
Missing Valid
n Percent
n Percent
Monitoring Connections to External Communities 138 39.9 208 60.1 Advocating Connections to External Communities 136 39.3 210 60.7
Communicating Connections to External Communities 130 37.6 216 62.4
Communicating Performance Accountability 112 32.4 234 67.6 Advocating for Performance Accountability 108 31.2 238 68.8
Advocating for Quality Instruction 103 29.8 243 70.2
Implementing Connections to External Communities 96 27.7 250 72.3
Monitoring Performance Accountability 95 27.5 251 72.5 Planning Connections to External Communities 90 26.0 256 74.0
Planning Quality Instruction 82 23.7 264 76.3
Planning Rigorous Curriculum 75 21.7 271 78.3 Advocating Culture of Learning & Prof. Behavior 72 20.8 274 79.2
Implementing Rigorous Curriculum 72 20.8 274 79.2
Monitoring Culture of Learning & Prof. Behavior 69 19.9 277 80.1 Communicating Culture of Learning & Prof. Behavior 65 18.8 281 81.2
Planning Culture of Learning & Prof. Behavior 60 17.3 286 82.7
Monitoring Rigorous Curriculum 60 17.3 286 82.7
Implementing Performance Accountability 58 16.8 288 83.2 Monitoring High Standards for Student Learning 56 16.2 290 83.8
Supporting Connections to External Communities
Implementing Quality Instruction Planning Performance Accountability
Monitoring Quality Instruction
Advocating Rigorous Curriculum
Supporting Performance Accountability Advocating High Standards for Student Learning
Implementing High Standards for Student Learning
Supporting Quality Instruction Planning High Standards for Student Learning
55
55 51
50
47
47 46
40
40 35
15.9
15.9 14.7
14.5
13.6
13.6 13.3
11.6
11.6 10.1
291
291 295
296
299
299 300
306
306 311
84.1
84.1 85.3
85.5
86.4
86.4 86.7
88.4
88.4 89.9
Note. Data in Table 20 are listed for variables with more than ten percent missing responses.
The VAL-ED Technical Manual v. 1.0 (Porter et al., 2008) indicated a low of 2.6
percent missing to a high of 18.5 percent missing data per variable for the pilot study. A
comparison of missing data by core component and key process for the VAL-ED study
and this research study is shown in Table 21. In the VAL-ED pilot study, incentives for

124
complete surveys were provided to the participants’ schools. In this research study, no
incentives were provided to the participants or to the schools for complete surveys. The
readers of this research are encouraged to draw their own conclusions about the power of
this study’s internal validity based on the extent of missing data.
Table 21
Comparison of VAL-Ed Study and Research Study Missing Data by Core Component and
Key Process
Core Component or
Key Process
VAL-ED
Study
Research
Study
High standards
2.6%
9.7%
Culture of learning and
professional behavior
4.3%
14.5%
Rigorous curriculum
5.0%
13.5%
Supporting
5.2%
8.8%
Communicating
5.7%
16.9%
Quality instruction
5.8%
16.1%
Planning 6.0% 18.6%
Implementing
6.1%
16.2%
Advocating
7.6%
23.9%
Performance accountability
9.6%
22.3%
Monitoring 10.0% 22.2%
Connections to external
communities
13.4%
30.7%
Note. Data from VAL-ED study adapted from “VAL-ED Technical Manual, v. 1.0” by
A. C. Porter et al. (2008).

125
Research Question 1
To what extent, if any, did principals in selected career and technical schools
demonstrate learning-centered leadership skills measured by the Vanderbilt Assessment
of Leadership in Education?
There were 36 variables formed by the intersection of six core components and
six key processes. The core components were (a) high standards for student learning,
(b) rigorous curriculum, (c) quality instruction, (d) culture of learning and professional
behavior, (e) connections to external communities, and (f) performance accountability.
The key processes were (a) planning, (b) implementing, (c) supporting, (d) advocating,
(e) communicating, and (f) monitoring. Effectiveness ratings were examined from the
intersection of the core components and key processes, the composite core component
scales, and the composite key process scales. Mean values were computed and totaled to
determine the highest effectiveness ratings for career and technical education principals
in specific key processes and core components.
Tables 22 illustrates the mean, standard deviation, skewness, and kurtosis for each
of the 36 variables formed by the intersection of the six core components and six key
processes. The means in Table 22 were calculated based on all of the variables and equal
treatment weight of each principal, supervisor, and teacher responses calculated
separately as separate groups, rather than individually by each of the 16 schools. Each
response from one teacher, one principal, and one supervisor was treated with the same
weight within the group. This was consistent with the process used in the VAL-ED
Technical Manual (Porter et al., 2008). Table 22 illustrates the mean for each variable
based upon the collective responses of the 346 respondents.

126
The aggregate responses to all of the variables were slightly skewed negatively,
most of the distribution of responses was to the right indicating that most of the responses
were around the mean or higher. A mean response between 3.60 and 3.99 indicated a
Proficient performance rating for the principal. Ratings for 27 of the 36 variables
resulted in ratings of Proficient. Ratings for 9 of the 36 variables resulted in ratings of
Basic (3.29 – 3.59).
Variables had one or more blank or Don’t know responses. Blank responses
accounted for between one (.29%) and six (1.73%) of the responses for any one variable.
Don’t know responses accounted for between 12 (3.5%) and 138 (39.9%) of the
responses for any one variable. Of the 346 cases, 109 were complete cases with no
missing responses. All 16 schools’ data were analyzed in the aggregate. The highest
aggregate mean rating (3.82) was given for Planning Quality instruction. The lowest
aggregate mean rating (3.39) was given for Planning Rigorous curriculum. The least
number of Don’t know responses (12) was given for Supporting Rigorous curriculum and
Communicating Quality instruction. The most number of Don’t know responses (138)
was given for Monitoring Connections to external communities. On the surface at least,
this appears to make practical sense to an educator, as teachers are less likely to be aware
of the principal’s efforts in working with or monitoring the external communities, such as
community-based and post-secondary partnerships. On the other hand, principals are
very likely to be communicating to teachers directly about the need for quality instruction
and significant efforts to support a rigorous curriculum.

127
Table 22
Mean Values from Collective Respondents for Core Component and Key Process Variables
Components and
Processes
Mean
(n)
Std.
Deviation
Skewness
Kurtosis
Rating
QI – Planning 3.82 (264) 0.993 -0.661 0.221 P
CL – Advocating 3.82 (274) 0.931 -0.423 - 0.055 P CL – Implementing 3.80 (322) 0.990 -0.472 - 0.460 P
QI – Communicating 3.79 (332) 1.009 -0.534 - 0.192 P
QI – Monitoring 3.78 (296) 1.051 -0.632 - 0.106 P CL – Monitoring 3.77 (277) 1.017 -0.545 - 0.027 P
HS – Communicating 3.76 (329) 0.960 -0.390 - 0.327 P
CEC – Supporting 3.76 (291) 0.981 -0.561 0.082 P
CL – Communicating 3.74 (281) 1.019 -0.638 0.108 P QI – Supporting 3.73 (306) 0.945 -0.442 0.046 P
HS – Supporting 3.71 (329) 0.993 -0.578 0.065 P
RC – Advocating 3.70 (299) 0.953 -0.465 0.022 P RC – Monitoring 3.70 (286) 1.054 -0.489 - 0.198 P
HS – Implementing 3.69 (306) 0.933 -0.636 0.589 P
HS – Advocating 3.69 (300) 0.989 -0.653 0.290 P CL – Supporting 3.69 (325) 1.053 -0.715 0.185 P
PA – Monitoring 3.67 (251) 0.994 -0.463 - 0.014 P
HS – Planning 3.66 (311) 0.930 -0.557 0.394 P
HS – Monitoring 3.66 (290) 1.025 -0.590 0.076 P PA – Planning 3.66 (295) 0.982 -0.499 0.219 P
CEC – Communicating 3.64 (216) 1.099 -0.615 - 0.030 P
PA – Communicating 3.64 (234) 1.116 -0.535 - 0.262 P RC – Communicating 3.63 (324) 1.037 -0.517 - 0.170 P
CEC – Advocating 3.63 (210) 1.014 -0.480 0.101 P
PA – Supporting 3.61 (299) 1.025 -0.456 - 0.078 P
CEC – Monitoring 3.60 (208) 1.121 -0.482 - 0.319 P PA – Advocating 3.60 (238) 0.975 -0.109 - 0.512 P
QI – Advocating 3.59 (243) 1.046 -0.543 0.007 B
RC – Supporting 3.58 (332) 1.097 -0.444 - 0.381 B PA – Implementing 3.58 (288) 1.013 -0.372 - 0.104 B
CEC – Implementing 3.55 (250) 1.097 -0.455 - 0.345 B
QI – Implementing 3.54 (291) 1.077 -0.396 - 0.384 B CL – Planning 3.51 (286) 0.997 -0.328 - 0.078 B
RC – Implementing 3.46 (274) 0.983 -0.376 - 0.116 B
CEC – Planning 3.42 (256) 1.074 -0.264 - 0.416 B
RC – Planning 3.39 (271) 1.005 -0.228 - 0.140 B
Note. HS = High standards for student learning; RC = Rigorous curriculum; QI = Quality
Instruction; CL = Culture of learning and professional behavior; CEC = Connections to External Communities; PA = Performance accountability. Ratings were based on a five-point Likert
response scale: 1 = Ineffective; 2 = Minimally effective; 3 = Effective; 4 = Highly effective;
5 = Outstandingly effective. Mean cut scores for principal effectiveness: 1.00 – 3.28 = Below Basic (BB), 3.29 – 3.59 = Basic (B), 3.60 – 3.99 = Proficient (P), 4.00 – 5.00 = Distinguished (D).
Maximum possible n = 346. See Table 26 for qualitative effectiveness descriptors.

128
Tables 23 and 24 illustrate the rank order of the aggregate combinations of
variables into the six core component and six key process subscales based on the VAL-
ED Technical Manual (Porter et al., 2008) from highest to lowest mean values. The
means illustrated in Tables 23 and 24 were calculated in the same manner as those in
Table 22—each response was aggregated without regard to respondent group or school.
This was consistent with the method described in the VAL-ED Technical Manual (Porter
et al., 2008).
Principals received the highest rating for Monitoring and received the lowest
rating by respondents for Planning. In the core components, principals received the
highest rating for Creating a culture of learning and professional behavior, and they
received the lowest rating by respondents for Rigorous curriculum.

129
Table 23
Rank Order of Key Processes from Highest to Lowest Mean Value
CC
Communicating Monitoring Supporting Advocating Implementing Planning
HS 3.76 3.66 3.71 3.69 3.69 3.66
RC 3.63 3.70 3.58 3.70 3.46 3.39
QI 3.79 3.78 3.73 3.59 3.54 3.82
CL 3.74 3.77 3.69 3.82 3.80 3.51
CE 3.64 3.60 3.76 3.63 3.55 3.42
PA 3.64 3.67 3.61 3.60 3.58 3.66
Total of
Means 22.20 22.18 22.08 22.03 21.62 21.46
Note. The data in this table represent the aggregate responses for all schools without regard to
respondent group or school, and mean values could range from a low of 1 to a high of 5. See Table 19 for complete rating scale and Table 26 for qualitative descriptors for each rating. The
range of values for each qualitative rating was 1.00 – 3.28 = Below Basic; 3.29 – 3.59 = Basic;
3.60 – 3.99 = Proficient; 4.00 – 5.00 = Distinguished. Each school’s data at the intersection of
the core components and key processes were computed by respondent type. The respondent types were then aggregated by group and weighted equally to create an overall mean for each
variable identified in this table consistent with the method used in the VAL-ED Technical
Manual. Core Components (CC) are abbreviated in the first column as follows: HS = High standards for student performance; RI = Rigorous curriculum; QI = Quality instruction; CL =
Culture of learning and professional behavior; CE = Connections to external communities; and
PA = Performance accountability.

130
Table 24
Rank Order of Core Components from Highest to Lowest Mean Value
KP
Culture of
Learning and
Professional
Behavior
Quality
Instruction
High
Standards
for Student
Learning
Performance
Accountability
Connections to
External
Communities
Rigorous
Curriculum
PL 3.51 3.82 3.66 3.66 3.42 3.39
IM 3.80 3.54 3.69 3.58 3.55 3.46
SU 3.69 3.73 3.71 3.61 3.76 3.58
AD 3.82 3.59 3.69 3.60 3.63 3.70
CO 3.74 3.79 3.76 3.64 3.64 3.63
MO 3.77 3.78 3.66 3.67 3.60 3.70
Total of
Means 22.33 22.25 22.17 21.76 21.60 21.46
Note. The data in this table represent the aggregate responses for all schools without regard to
respondent type of school, and mean values could range from a low of 1 to a high of 5 (See Table 19 for complete rating scale and see Table 26 for qualitative descriptors for each rating.). The
range of scores for each qualitative rating was 1.00 – 3.28 = Below Basic; 3.29 – 3.59 = Basic;
3.60 – 3.99 = Proficient; 4.00 – 5:00 = Distinguished. Each school’s data at the intersection of the core components and key processes were computed by respondent type. The respondent
types were then aggregated by group and weighted equally to create an overall mean for each
variable identified in this table. Key processes are abbreviated in the first column as:
PL = Planning; IM = Implementing; SU = Supporting; AD =Advocating; CO = Communicating; and MO = Monitoring.
Table 25 illustrates the overall proficiency rating for the 16 principals. The means
for this table were calculated by respondent group: principals, supervisors, and teachers.
The effectiveness rating mean was determined by calculating the mean values by
respondent group and then dividing by three. This composite score gave equal weight to
each of the three respondent groups, rather than the teacher (n=315) respondent rating
outweighing the supervisors (n=15) and principals (n=16). This method was consistent
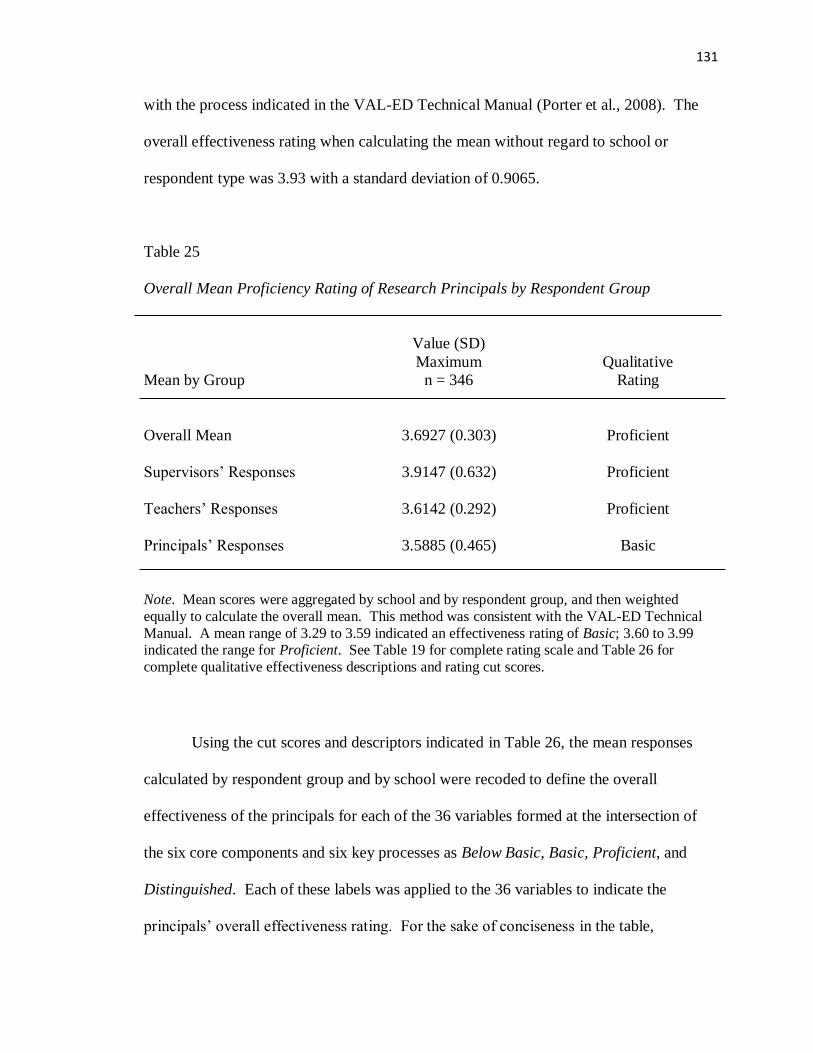
131
with the process indicated in the VAL-ED Technical Manual (Porter et al., 2008). The
overall effectiveness rating when calculating the mean without regard to school or
respondent type was 3.93 with a standard deviation of 0.9065.
Table 25
Overall Mean Proficiency Rating of Research Principals by Respondent Group
Mean by Group
Value (SD)
Maximum
n = 346
Qualitative
Rating
Overall Mean
3.6927 (0.303)
Proficient
Supervisors’ Responses 3.9147 (0.632) Proficient
Teachers’ Responses 3.6142 (0.292) Proficient
Principals’ Responses 3.5885 (0.465) Basic
Note. Mean scores were aggregated by school and by respondent group, and then weighted
equally to calculate the overall mean. This method was consistent with the VAL-ED Technical
Manual. A mean range of 3.29 to 3.59 indicated an effectiveness rating of Basic; 3.60 to 3.99 indicated the range for Proficient. See Table 19 for complete rating scale and Table 26 for
complete qualitative effectiveness descriptions and rating cut scores.
Using the cut scores and descriptors indicated in Table 26, the mean responses
calculated by respondent group and by school were recoded to define the overall
effectiveness of the principals for each of the 36 variables formed at the intersection of
the six core components and six key processes as Below Basic, Basic, Proficient, and
Distinguished. Each of these labels was applied to the 36 variables to indicate the
principals’ overall effectiveness rating. For the sake of conciseness in the table,

132
effectiveness ratings were combined into two subgroups: Below basic/Basic and
Proficient/Distinguished. The results of these two subgroups for the core components
and key processes are illustrated in Table 27.
Of special note are those core components and key processes where more than
half the principals were rated as Basic or Below basic. Advocating Quality Instruction
(81%), Implementing Rigorous Curriculum (75%), Planning Connections to External
Communities (75%), Communicating Performance Accountability (75%),
Communicating Connections to External Communities (75%), Planning Culture of
Learning and Professional Behavior (68%), Implementing Connections to External
Communities (68%), Implementing Performance Accountability (68%), Advocating
Performance Accountability (68%), Monitoring Connections to External Communities
(68%), Advocating Connections to External Communities (62%), and Planning Rigorous
Curriculum (56%) were rated by respondents as Basic or Below Basic. For the remaining
24 variables, principals were rated as Proficient or Distinguished.
A subset of research question one was to determine if there was any correlation
between the mean effectiveness of each principal with years of experience as a teacher,
years of experience in the current position, and years of experience as a principal. A
Pearson’s product-moment correlation analysis was conducted using SPSS 19.0 to
determine the strength of any association between these characteristics and the principal
performance rating. The results of the analysis are included in Table 28. The analysis
did not show any statistically significant correlations between the principals’ mean
ratings with the principals’ years of experience as a teacher, as a principal, or in the
current position.

133
Table 26
Descriptors and Mean Cut Scores Associated with VAL-ED Proficiency Levels
Level
Descriptor
Score Range
Below Basic A leader at the below basic level of proficiency
exhibits leadership behaviors of core components
and key processes at levels of effectiveness that
over time are unlikely to influence teachers to bring
the school to a point that results in acceptable value-
added to student achievement and social learning
for students.
1.00 – 3.28
Basic A leader at the basic level of proficiency exhibits
leadership behaviors of core components and key
processes at levels of effectiveness that over time
are likely to influence teachers to bring the school
to a point that results in acceptable value-added to
student achievement and social learning for some
sub-groups of students, but not all.
3.29 -3.59
Proficient A proficient leader exhibits leadership behaviors of
core components and key processes at levels of
effectiveness that over time are likely to influence
teachers to bring the school to a point that results in
acceptable value-added to student achievement and
social learning for all students.
3.60 – 3.99
Distinguished A distinguished leader exhibits leadership behaviors
of core components and key processes at levels of
effectiveness that over time are virtually certain to
influence teachers to bring the school to a point that
results in strong value-added to student
achievement and social learning for all students.
4.00 – 5.00
Note. In the pilot study of 300 principals to determine cut score ranges, 17% scored below basic, 33% scored basic, 36% scored proficient, and 14% scored distinguished. Adapted from
“Vanderbilt Assessment of Leadership in Education: Technical Manual,” by A. C. Porter et al.,
2008, retrieved from the Wallace Foundation website. Copyright 2008 by Vanderbilt University.

134
Table 27
Number and Percent of Principals by Proficiency Level for Core Components and Key
Processes
Key Processes
and Core
Components
Planning
Implementing
Supporting
Advocating
Communicating
Monitoring
BB P BB P BB P BB P BB P BB P
High standards
for student
learning
8
50%
8
50%
5
31%
11
69%
4
25%
12
75%
7
44%
9
56%
7
44%
9
56%
6
38%
10
62%
Rigorous
curriculum
9
56%
7
44%
12
75%
4
25%
5
32%
11
68%
6
38%
10
62%
7
44%
9
56%
7
44%
9
56%
Quality
instruction
5
32%
11
68%
7
44%
9
56%
3
19%
13
81%
13
81%
3
19%
6
38%
10
62%
8
50%
8
50%
Culture of
learning and
prof. behavior
11
68%
5
32%
3
19%
13
81%
7
44%
9
56%
6
38%
10
62%
5
32%
11
68%
6
38%
10
62%
Connections to
external
communities
12
75%
4
25%
11
68%
5
32%
7
44%
9
56%
10
62%
6
38%
12
75%
4
25%
11
68%
5
32%
Performance
accountability
7
44%
9
56%
11
68%
5
32%
8
50%
8
50%
11
68%
5
32%
12
75%
4
25%
7
44%
9
56%
Note. n = 16. BB = Below Basic and Basic performance levels were collapsed into one subgroup; P = Proficient and Distinguished performance levels were collapsed into one subgroup. Performance
ranges were 1.00 – 3.28 = Below basic; 3.29 – 3.59 = Basic; 3.60 – 3.99 = Proficient; 4.00 – 5.00 =
Distinguished.

135
Table 28 illustrates the overall effectiveness rating of the 16 principals in the
aggregate for each of the 36 variables assessed through the VAL-ED instrument. Nine
variables were rated at the Basic level (3.28 – 3.59) and 27 variables were rated at the
Proficient level (3.60 – 3.99).
Table 28
Proficiency Levels of Principals for Each of the VAL-ED Leadership Variables
Components
and
Processes
Planning
Implementing
Supporting
Advocating
Communicating
Monitoring
High
standards for student
performance
Proficient
Proficient
Proficient
Proficient
Proficient
Proficient
Quality
instruction
Proficient
Basic
Proficient
Basic
Proficient
Proficient
Rigorous
curriculum
Basic
Basic
Basic
Proficient
Proficient
Proficient
Culture of learning &
professional
behavior
Basic
Proficient
Proficient
Proficient
Proficient
Proficient
Connections
to external
communities
Basic
Basic
Proficient
Proficient
Proficient
Proficient
Internal
performance
accountability
Proficient
Basic
Proficient
Proficient
Proficient
Proficient

136
Table 29
Correlation Between Principals’ Biographical Data and Mean Proficiency Ratings
Description
Total
Mean
Principals’
Response
Mean
Supervisors'
Response
Mean
Teachers'
Response
Mean
Years in
Current
Position
Years
as a
Principal
Years
as a
Teacher
Total Mean Pearson Cor. 1 .672** .765** .359 -.101 .235 -.192
Sig. (2-tailed)
.004 .001 .172 .709 .380 .477
N 16 16 15 16 16 16 16
Principals'
Responses – Mean
Pearson Cor. .672** 1 .165 .102 -.288 .226 -.125
Sig. (2-tailed) .004
.556 .708 .279 .401 .645
N 16 16 15 16 16 16 16
Supervisors’
Responses – Mean
Pearson Cor. .765** .165 1 -.143 .189 .275 -.311
Sig. (2-tailed) .001 .556
.611 .499 .322 .260
N 15 15 15 15 15 15 15
Teachers’
Responses – Mean
Pearson Cor. .359 .102 -.143 1 -.333 -.195 .013
Sig. (2-tailed) .172 .708 .611
.207 .470 .961
N 16 16 15 16 16 16 16
Years in Current
Position
Pearson Cor. -.101 -.288 .189 -.333 1 .513* .533*
Sig. (2-tailed) .709 .279 .499 .207
.042 .033
N 16 16 15 16 16 16 16
Years as a Principal Pearson Cor. .235 .226 .275 -.195 .513* 1 .247
Sig. (2-tailed) .380 .401 .322 .470 .042
.356
N 16 16 15 16 16 16 16
Years as a Teacher Pearson Cor. -.192 -.125 -.311 .013 .533* .247 1
Sig. (2-tailed) .477 .645 .260 .961 .033 .356
N 16 16 15 16 16 16 16
Note. **Correlation is significant at 0.01(two-tailed); * Correlation is significant at 0.05 (two-tailed). Mean was calculated by aggregating
responses by school and respondent group, and evenly weighting the group responses of principals, supervisors, and teachers.
Statistic
136

137
Research Question 2
To what extent, if any, did principals in selected career and technical schools
demonstrate learning-centered leadership skills different from the national norm?
In research question two, the variables were the same as those in research
question one. There were six core components and six key processes. The core
components were (a) high standards for student learning, (b) rigorous curriculum,
(c) quality instruction, (d) culture of learning and professional behavior, (e) connections
to external communities, and (f) performance accountability. The key processes were
(a) planning, (b) implementing, (c) supporting, (d) advocating, (e) communicating, and
(f) monitoring.
The purpose of research question two was to determine if the career and technical
education principals demonstrated leadership skills to a greater or lesser degree than the
national norm established by the Vanderbilt Assessment of Leadership in Education
(VAL-ED) for secondary school principals. To determine the extent of the differences, if
any, between leadership skills demonstrated by career and technical education principals
and the national norm, the overall mean effectiveness rating was computed by school and
respondent group, weighted evenly among the respondent groups, and then compared to
the national norm. This was calculated in the same manner as the total aggregate mean
score identified for the national norm in the VAL-ED pilot study as a function of the
responses to all items “across the supervisor, the principal, and the teachers, where
supervisor, principal, and teachers are weighted equally” (Porter et al., 2008, p. 121).
VAL-ED has established no specific national norm for secondary career and
technical education principals. However, there is a national norm for secondary school

138
principals. The secondary school principals’ national norm was used for comparative
purposes with the career and technical education principals; the comparison is illustrated
in Table 30.
Table 30
Comparison of VAL-ED Secondary School National Norm Principals to Research Study
Principals’ Proficiency Rating
Group Secondary Norm CTE Principal
Overall 3.52 (62) 3.69 (346)
Supervisor 3.60 (75) 3.92 (15)
Teacher 3.52 (76) 3.61 (312)
Principal 3.45 (70) 3.59 (16)
Note. Sample sizes are given in parenthesis. CTE is Career and Technical Education.
National norm data were adapted from Vanderbilt Assessment of Leadership in Education
Technical Manual, v. 1.0, by A.C. Porter et al. (2008), p. 54. Copyright 2008 by
Vanderbilt University.
Table 31 illustrates the comparison of the percentage of principals from the VAL-
ED study that were rated in each qualitative category (Below Basic, Basic, Proficient, and
Distinguished) to the percentage of career and technical education principals that were
rated in each category from this research study. The career and technical education
principals were rated consistently in the percentages at Below Basic, Basic, Proficient and
Distinguished compared to the secondary school principals in the VAL-ED study that
created the national norm.

139
Table 31
Comparison of Secondary Principals’ National Norm to Research Study Principals’
Performance Rating by Respondent Group
Effectiveness
Rating
National
Norm
Research
Study
Below Basic 17.0 % 12.5%
Basic 33.0% 25.0%
Proficient 36.0% 50.0%
Distinguished 14.0% 12.5%
Note. For determination of national norm, n =300; for Research study, n = 16.
A one sample t-test was conducted in SPSS 19.0 to determine if there was a
significant difference between the principals’ means scores as rated by the principals,
supervisors, and teachers versus the national norm mean scores. The results shown in
Table 32, although higher than the national norm, illustrate no statistical difference
between the effectiveness rating of the career and technical education principals and the
national norm.
Figure 4 illustrates the comparative data of the principals’ effectiveness rating for
the research study principals, the national norm principals, and the mean values for career
and technical education principals. There is, however, no statistical difference between
the mean values.

140
Table 32
Differences Between Research Study Principals’ Proficiency Rating and VAL-ED
National Norm Proficiency Rating by Respondent Group
Descriptor
t
df
Sig.
(two-
tailed)
Mean
Difference
95% CI
Lower
Upper
Overall composite
mean (3.6927) vs.
Test value of 3.52
SD = 0.30322
2.278
15
.038
.1727
.0111
.3343
Supervisors’
mean (3.9147) vs.
Test value of 3.60
SD = 0.63210
1.928
14
.074
.3147
-0.353
.6648
Teachers’
mean (3.6142) vs.
Test value of 3.52
SD = 0.29198
1.290
15
.217
.0942
-.0614
.2498
Principals’
Mean (3.5885) vs.
Test value of 3.45
SD = 0.46506
1.192
15
.252
.1375
-.1093
.3864
Note. Supervisors’ n = 15; principals’ n = 16; teachers’ maximum n = 346. CI = Confidence
interval.

141
1 2 3 4 5
Overall Mean
Principal Mean
Teacher Mean
Supervisor Mean
Research Group
National Norm
3.92 3.60
3.61 3.52
3.59 3.45
3.69 3.52
Figure 4. An illustration of the comparison of the mean values of the research study
principals and the national norms established for secondary school principals. The
participants (principals, teachers, and supervisors) responded to a five-point Likert
response scale with 1 = Ineffective; 2 = Minimally Effective; 3 = Effective; 4 =
Highly Effective; 5 = Outstandingly Effective. The range of values for each
qualitative rating are 1.00 – 3.28 = Below Basic; 3.29 – 3.59 = Basic; 3.60 – 3.99 =
Proficient; 4.00 – 5.00 = Distinguished.

142
Research Question 3
To what extent, if any, did the perceptions of leadership skills differ among principals,
teachers, and supervisors?
The purpose of this research question was to determine if a similar understanding
existed among the principal, the supervisor, and the teachers about what effective
leadership is, what it looks like, and how it is demonstrated. If a clear understanding
exists, it ensures that the principal has an accurate perception of the supervisor’s
performance expectations. In addition, for those aspiring to leadership positions within
the ranks of the teachers, it ensures that they accurately perceive the skills, knowledge,
and behaviors that are expected of them should their reach a leadership position.
There were three levels of the independent variable to this research question.
These were the three groups of respondents: principals, supervisors, and teachers. The
dependent variables were the 36 subscale values at the intersection of the six core
components and six key processes. To begin the analysis, Table 33 shows the total mean
rating for the composite principal effectiveness means of the 36 variables. The composite
mean was calculated by school and by respondent and then weighted evenly for each of
the six core components and six key processes. This is consistent with the process
illustrated in the VAL-ED Technical Manual (Porter et al., 2008).

143
Table 33
Mean Proficiency Rating of Principals by Respondent Group
Principal
Mean
n = 16
Supervisor
Mean
n = 15
Teacher
Mean
n = 315
Overall
Mean
n = 346
Mean
3.589
3.915
3.614
3.693
Std. Deviation 0.465 0.632 0.292 0.303
Skewness 1.623 -1.913 0.412 -0.337
Kurtosis 3.203 5.463 0.676 0.850
Note. Mean was calculated by respondent type and by school for each of the six core
components and six key processes. Then each mean was weighted equally to calculate an
overall mean. This is consistent with the calculation of the national norms (Porter et al.
2008).
Table 34 indicates the descriptive statistics (mean, standard deviation, standard
error, 95 percent confidence interval, minimum and maximum values) by respondent
group for each of the six core components and six key processes. Each of the respondent
types were analyzed collectively from the 16 schools because the intent in research
question three was to determine differences in the collective perceptions rather than the
perceptions of respondent types at any one of the individual schools. It was not important
to determine that School 1 or School 16 had similar or different perceptions. Rather, the
intent was to determine if the groups, in general, varied in their perceptions of leadership
skills of principals. The analysis indicated that none of the ratings varied significantly in
any of the core components or key processes based on respondent group.
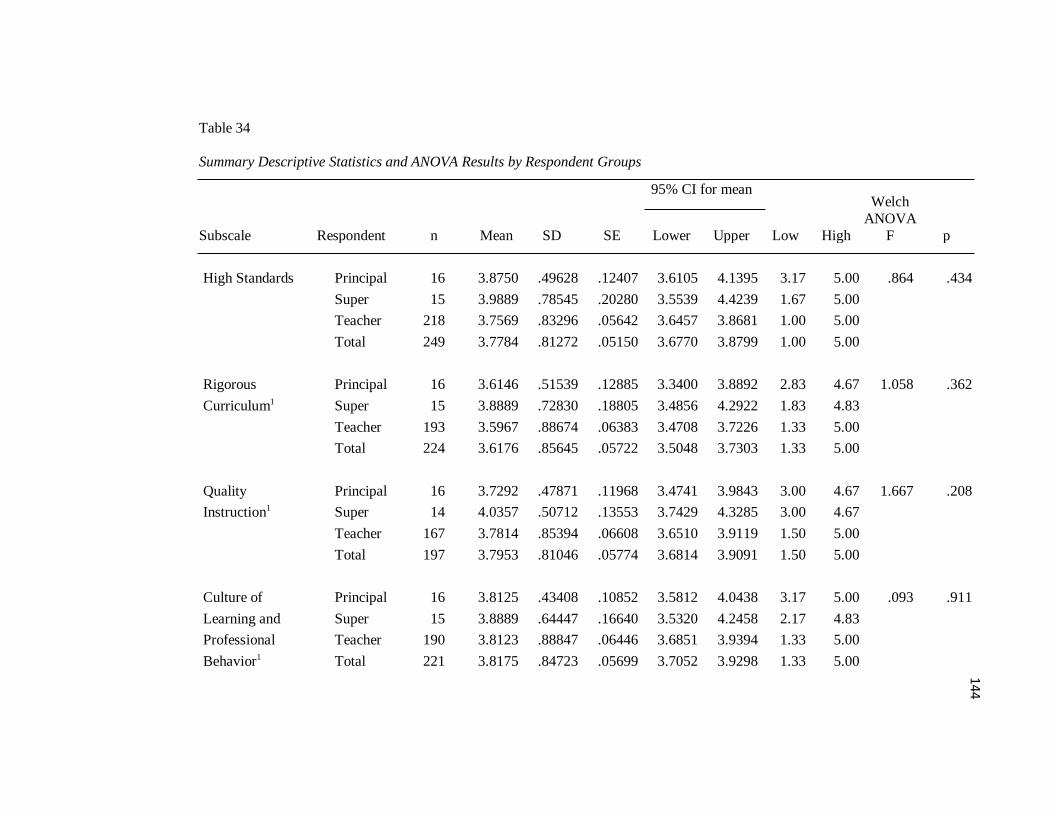
144
Table 34
Summary Descriptive Statistics and ANOVA Results by Respondent Groups
Subscale Respondent n Mean SD SE
95% CI for mean
Low High
Welch
ANOVA
F
p Lower Upper
High Standards Principal 16 3.8750 .49628 .12407 3.6105 4.1395 3.17 5.00 .864 .434
Super 15 3.9889 .78545 .20280 3.5539 4.4239 1.67 5.00
Teacher 218 3.7569 .83296 .05642 3.6457 3.8681 1.00 5.00
Total 249 3.7784 .81272 .05150 3.6770 3.8799 1.00 5.00
Rigorous
Curriculum1
Principal 16 3.6146 .51539 .12885 3.3400 3.8892 2.83 4.67 1.058 .362
Super 15 3.8889 .72830 .18805 3.4856 4.2922 1.83 4.83
Teacher 193 3.5967 .88674 .06383 3.4708 3.7226 1.33 5.00
Total 224 3.6176 .85645 .05722 3.5048 3.7303 1.33 5.00
Quality
Instruction1
Principal 16 3.7292 .47871 .11968 3.4741 3.9843 3.00 4.67 1.667 .208
Super 14 4.0357 .50712 .13553 3.7429 4.3285 3.00 4.67
Teacher 167 3.7814 .85394 .06608 3.6510 3.9119 1.50 5.00
Total 197 3.7953 .81046 .05774 3.6814 3.9091 1.50 5.00
Culture of
Learning and
Professional
Behavior1
Principal 16 3.8125 .43408 .10852 3.5812 4.0438 3.17 5.00 .093 .911
Super 15 3.8889 .64447 .16640 3.5320 4.2458 2.17 4.83
Teacher 190 3.8123 .88847 .06446 3.6851 3.9394 1.33 5.00
Total 221 3.8175 .84723 .05699 3.7052 3.9298 1.33 5.00
144

145
Subscale Respondent n Mean SD SE
95% CI for mean
Low High
F
p Lower Upper
Connections to
External
Community1
Principal 16 3.1979 .60620 .15155 2.8749 3.5209 2.33 4.83 4.675 .108
Super 13 3.8077 .58471 .16217 3.4544 4.1610 2.83 4.67
Teacher 116 3.6853 .96678 .08976 3.5075 3.8631 1.50 5.00
Total 145 3.6425 .91603 .07607 3.4922 3.7929 1.50 5.00
Performance
Accountability
Principal 16 3.3021 .73085 .18271 2.9126 3.6915 1.67 4.83 2.242 .109
Super 14 3.9048 .92152 .24629 3.3727 4.4368 1.33 4.83
Teacher 148 3.7601 .89304 .07341 3.6151 3.9052 1.00 5.00
Total 178 3.7303 .88866 .06661 3.5989 3.8618 1.00 5.00
Planning1 Principal 16 3.5417 .56601 .14150 3.2401 3.8433 3.00 5.00 .898 .421
Super 13 3.8205 .61411 .17032 3.4494 4.1916 2.33 4.67
Teacher 133 3.7218 .82718 .07173 3.5799 3.8637 1.17 5.00
Total 162 3.7119 .78921 .06201 3.5895 3.8344 1.17 5.00
Implementing1 Principal 16 3.6354 .48770 .12192 3.3755 3.8953 3.00 4.83 1.131 .338
Super 15 3.9778 .73156 .18889 3.5727 4.3829 1.83 5.00
Teacher 148 3.7331 .83520 .06865 3.5974 3.8688 1.33 5.00
Total 179 3.7449 .80248 .05998 3.6265 3.8632 1.33 5.00
145

146
95% CI for mean
Subscale Respondent n Mean SD SE Lower Upper Low High F p
Supporting1 Principal 16 3.7292 .40768 .10192 3.5119 3.9464 3.00 4.67 1.752 .193
Super 15 4.0778 .62319 .16091 3.7327 4.4229 2.17 4.67
Teacher 213 3.7786 .79955 .05478 3.6706 3.8866 1.00 5.00
Total 244 3.7937 .77189 .04942 3.6964 3.8911 1.00 5.00
Advocating1 Principal 16 3.5833 .42601 .10650 3.3563 3.8103 2.83 4.83 2.326 .115
Super 14 3.9048 .50937 .13614 3.6107 4.1989 2.50 4.67
Teacher 124 3.8333 .83157 .07468 3.6855 3.9812 1.67 5.00
Total 154 3.8139 .77613 .06254 3.6903 3.9374 1.67 5.00
Communicating1 Principal 16 3.5417 .56928 .14232 3.2383 3.8450 2.33 4.83 1.925 .168
Super 14 3.8452 .78573 .20999 3.3916 4.2989 2.00 4.83
Teacher 151 3.8543 .85099 .06925 3.7175 3.9911 1.50 5.00
Total 181 3.8260 .82642 .06143 3.7048 3.9472 1.50 5.00
Monitoring Principal 16 3.5000 .60553 .15138 3.1773 3.8227 2.50 4.83 2.011 .137
Super 12 3.9444 .59175 .17082 3.5685 4.3204 2.67 4.83
Teacher 139 3.9257 .84465 .07164 3.7840 4.0673 1.17 5.00
Total 167 3.8862 .81569 .06312 3.7616 4.0108 1.17 5.00
Note. 1Test for equal variance was not met for these subscales. Results for these subscales utilized Welch corrected ANOVA.
14
6

148
Research Question 4
To what extent, if any, did the leadership skills of selected career and technical education
principals show an association with student achievement measured by the National
Occupational Competency Testing Institute (NOCTI) end-of-program assessment?
The principals’ composite effectiveness rating by school ranged from a low of
3.01 to a high of 4.24. Table 26 defines the qualitative effectiveness rating descriptors
and cut score ranges for each qualitative value of Below Basic, Basic, Proficient, and
Distinguished. Table 30 illustrates the overall performance ratings of the 16 principals in
this research study. Two were rated as Below Basic, four were rated as Basic, eight were
rated as Proficient, and two were rated as Distinguished. This first variable, the
principal’s performance rating, in research question four represents a nominal variable, or
one could argue that it represents ordered categories. For the purpose of the chi-square
test, principals’ performance ratings were reduced to two qualitative values: Basic/Below
Basic and Proficient/Distinguished. The null hypothesis tested was that there was no
relationship between the principals’ qualitative rating and student achievement.
The second variable in research question four was student achievement. Each
career and technical education school is mandated by the federal Carl D. Perkins
legislation to administer an end-of-program assessment. The Pennsylvania Department
of Education, Bureau of Career and Technical Education, utilized an assessment created
by the National Occupational Competency Testing Institute (NOCTI) for career and
technical education students to meet this standard (Carl D. Perkins Career and Technical
Education Improvement Act, 2006). The NOCTI assessment outcomes for each school
represented the student achievement data in this study. Student performance on the

149
NOCTI assessment was rated qualitatively as Below Basic, Basic, Competent, and
Advanced based on Pennsylvania Department of Education cut scores. For this research
question, the student achievement variable represented the percentage of students who
earned a rating of Competent or Advanced on the assessment, which translated into an
overall student achievement performance rating. Each school’s student performance was
reduced to one of nominal values: Above the State Average or Below the State Average.
In personal correspondence (email) with Kevin Springman (October 28, 2011), an
Educational Research Association for the Pennsylvania Department of Education, Bureau
of Career and Technical Education, he stated that 76.1 percent of all students who
participated in the NOCTI assessment in 2011 earned a qualitative rating of Competent or
Advanced.
Table 35 illustrates the relationship between the principals’ qualitative composite
performance rating and the students’ qualitative performance rating on the NOCTI
assessment for each of the 16 schools that participated in this research study. The
number of the school represents the rank order of the students’ performance data. The
lowest overall student performance was 0.69 and the highest overall student performance
was 0.96. This represented the percent of the students that participated in the NOCTI
assessment at each school who earned a qualitative rating of Competent or Advanced.
There did not appear to be any association between the principal’s qualitative
performance rating and the student’s performance rating on the NOCTI assessment. As
noted in Table 35, the schools with the lowest overall student performance score of 0.69
and the school with the highest overall student performance score of 0.96 both had
principals with a qualitative performance rating of Proficient; the two lowest principal

150
ratings of Below Basic were in schools that ranked in the 5th
and the 9th position based on
the highest overall student performance scores. The schools with the two highest rated
principal performance ratings ranked in the 3rd
and the 4th position based on overall
student performance ratings.
Table 36 illustrates the cross tabulation of the principals’ qualitative performance
rating and each of the schools’ overall student performance ratings. According to
personal communication with Kevin Springman, an Educational Research Associate for
the Pennsylvania Department of Education, Bureau of Career and Technical Education,
76.1 percent of all secondary student participants in the NOCTI assessment earned a
qualitative score of Competent or Advanced on the 2011 assessment.
Table 36 illustrates that three of five schools with student achievement below the
state average had principals that were qualitatively rated as Proficient. It also illustrates
that four of seven schools that performed above the 2011 state average of 76.1 percent
had principals who were rated as Basic or Below Basic. See Table 26 for cut score ranges
and descriptors. Five schools’ student performance ratings were below the state average
and 11 schools’ student performance were above the state average. Six principals were
rated as Basic or Below Basic and ten principals were rated as Proficient or
Distinguished. Table 37 illustrates that the principals’ qualitative performance ratings
were within the expected ranges if no association existed between their performance and
student performance. The null hypothesis was not shown to be false by the data.
Table 37 demonstrates the chi-square test measures. The continuity correction
was applied because of the small sample size (16). In addition, three of the cells (75
percent) had expected counts less than five. Because of the low expected count, the

151
Fisher’s exact test was performed. Review of the results of the continuity correction and
the Fisher’s exact test illustrated no association between the principals’ qualitative
performance rating and the students’ performance rating on the end-of-program
assessment.
The test for the strength of a relationship between the principals’ qualitative
performance rating and the students’ performance on the NOCTI assessment was the
Kendall’s Tau-b. This is illustrated in Table 38. The higher values of this statistic
indicated that the observed outcomes of the students’ performance on the NOCTI
assessment was more likely to occur by chance rather than because of an association with
the principals’ qualitative performance rating.

152
Table 35
Relationship between Principal Qualitative Performance Rating and Student
Performance Rating on the NOCTI Assessment
School Principal’s Qualitative
Performance Rating
Students’ NOCTI
Performance Rating
1 Proficient 0.96
2 Proficient 0.94
3 Distinguished 0.93
4 Distinguished 0.90
5 Below Basic 0.89
6 Basic 0.87
7 Basic 0.87
8 Proficient 0.86
9 Below Basic 0.86
10 Proficient 0.84
11 Proficient 0.81
12 Basic 0.77
13 Proficient 0.75
14 Proficient 0.73
15 Basic 0.73
16 Proficient 0.69
Note. Students’ NOCTI Performance Rating percentages are given for the students who
tested and scored Competent or Advanced on the NOCTI assessment in 2011. The line
space break between schools 12 and 13 illustrates those schools above and below the
2011 state average of 76.1 percent (percentage of students who scored Competent or
Advanced on the NOCTI assessment). Principal’s Qualitative Performance Rating was
based on principal cut scores and rating descriptors identified in Table 26. NOCTI is the
National Occupational Competency Testing Institute assessment, the Pennsylvania
Department of Education, Bureau of Career and Technical Education, mandated end-of-
program assessment for career and technical education schools.
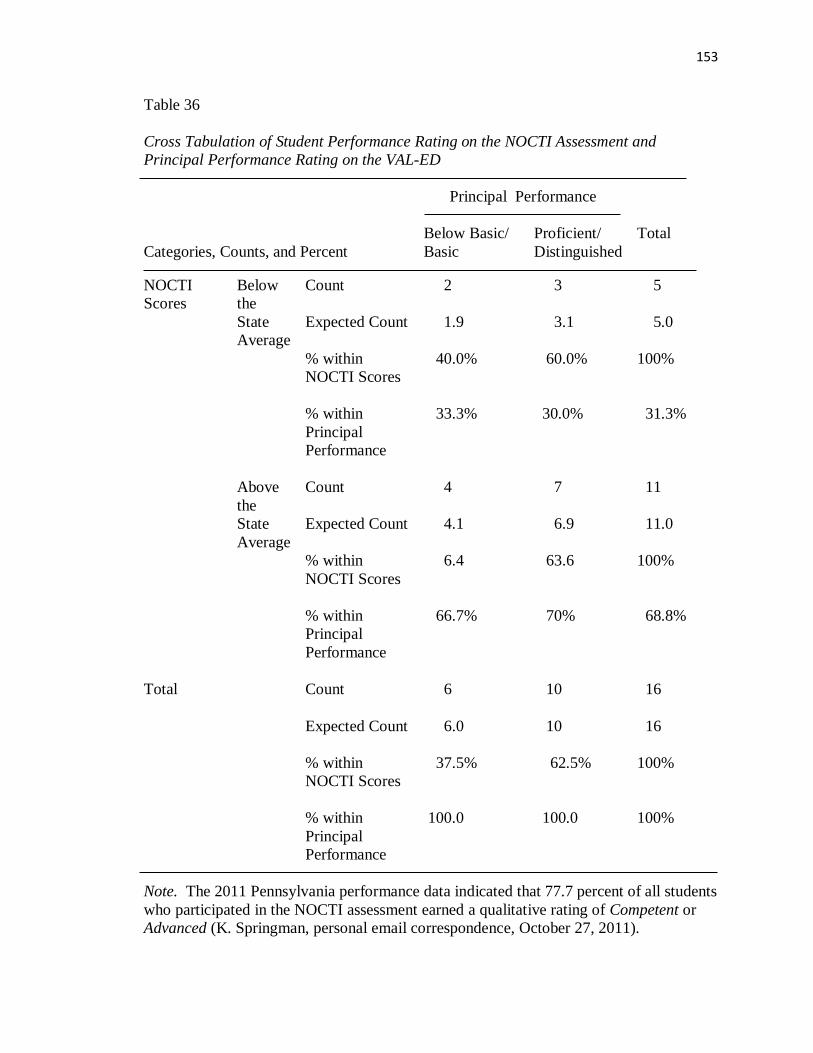
153
Table 36
Cross Tabulation of Student Performance Rating on the NOCTI Assessment and
Principal Performance Rating on the VAL-ED
Categories, Counts, and Percent
Principal Performance
Total Below Basic/
Basic
Proficient/
Distinguished
NOCTI
Scores
Below
the
State
Average
Count 2
3
5
Expected Count 1.9 3.1 5.0
% within
NOCTI Scores
40.0% 60.0% 100%
% within
Principal
Performance
33.3% 30.0% 31.3%
Above
the
State
Average
Count
4 7 11
Expected Count 4.1 6.9 11.0
% within
NOCTI Scores
6.4 63.6 100%
% within
Principal
Performance
66.7% 70% 68.8%
Total Count
6 10 16
Expected Count
6.0 10 16
% within
NOCTI Scores
37.5% 62.5% 100%
% within
Principal
Performance
100.0 100.0 100%
Note. The 2011 Pennsylvania performance data indicated that 77.7 percent of all students
who participated in the NOCTI assessment earned a qualitative rating of Competent or
Advanced (K. Springman, personal email correspondence, October 27, 2011).

154
Table 37
Chi-Square Tests of the Relationship Between Principal Qualitative Performance
Rating and Student Performance Rating on the NOCTI Assessment
Analysis Value df
Asymp.
Sig.
(2-sided)
Exact Sig.
(2-sided)
Exact Sig.
(1-sided)
Pearson Chi-
Square
0.019a 1 .889
Continuity
Correctionb
.000 1 1.000
Likelihood Ratio .019 1 .889
Fisher's Exact Test
1.000 .654
Linear-by-Linear
Association
.018 1 .893
n 16
aThree cells (75.0%) have expected count less than five. The minimum expected count is 1.88.
bComputed only for a 2 x 2 table.

155
Table 38
Symmetric Measures of Cross Tabulation of Principal Performance Rating Measured by
the VAL-ED with Student Performance Rating Measured by the NOCTI Assessment
Statistic
Value
Asymp. Std.
Errora
Approx. Tb
Approx. Sig.
Ordinal by
Ordinal
Kendall’s
tau-b
.035
.252
.138
.890
Kendall’s
tau-c
.031
.226
.138
.890
Spearman
Correlation
.035
.252
.130
.898c
Interval by
Interval
Pearson’s R
.035
.252
.130
.898c
N 16
Note. NOCTI is the National Occupational Competency Testing Institute. The NOCTI assessment is mandated by the Pennsylvania Department of Education as the end-of-program
student performance assessment. aNot assuming the null hypothesis.
bUsing the asymptotic standard error assuming the null
hypothesis. cBased on normal distribution.

156
Chapter 5
DISCUSSION AND RECOMMENDATIONS
This chapter includes a restatement of the problem and a discussion of the
significant findings related to the four research questions. It includes a section on the
implications of the findings for career and technical education school instructional
leaders and those who provide professional education programs for administrators. The
last part of this chapter includes a discussion of the limitations of the study and
recommendations for future research.
Restatement of the Problem
Many aspects of instructional leadership have been studied. Researchers have
investigated the traits of effective leaders (Crow, Hausman, & Shribner, 2002), the
behaviors of instructional leaders and what effective instructional leaders do (Blase &
Kirby, 2000; Marzano, Waters, & McNulty, 2005), the problems with and types of
instructional leadership (Marks & Printy, 2003), and claims about successful school
leadership (Leithwood, Harris, & Hopkins, 2008). Instructional leadership, however, is
not any more definitive or easier to demonstrate. Despite an extensive review of
literature exploring the role of the principal in affecting student achievement, Hallinger
and Heck (1998) made no specific conclusions about the exact manner in which
principals contribute to school effectiveness. The review of research conducted by
Hallinger and Heck (1998) found the process that principals implement in creating
effective schools “as well as the interplay with contextual forces that influence the
exercise of school leadership” (p. 186) to be highly complex and beyond any one
definition. The literature pointed to the need for future research on the principal’s role in
157
creating school effectiveness through vision, mission and goals, and the interaction of
“school goals, school structure and social networks, people, and organizational culture”
(p. 187).
There is a wealth of research about principal leadership. Researchers have
acknowledged, however, that knowing what to do and being able to do it are two
different skill sets (Huff, 2009). For example, while principals may believe they are
effectively communicating, the other participants in that communication may not agree.
Assuming that principals desire to perform effectively in their roles, then formative and
summative feedback from those in the school environment, including supervisors and
teachers, is important in order for principals to assess how well their performance is
meeting the expected standards of performance and the goals of the organization
(Smither, London, & Reilly, 2005).
Part of the difficulty in giving feedback to principals and in principals’
evaluations, both of which are designed to improve the performance of the principal, is
determining what to assess and how to assess it (Catano & Stronge, 2007; Glasman &
Heck, 1992). If principals are to be accountable for student achievement through their
role as instructional leaders, and they are to improve their leadership skills, it is
imperative that they know and understand the standards, measures, and level of their
daily performance. Without the knowledge of the expectations and measures, as well as
the level of their performance as the foundation for professional education, efforts to
improve deficiencies in performance are not likely to be productive (Huff, 2009).
As both a formative and summative process, much criticism exists about the
effectiveness of evaluating principals’ leadership skills (Goldring, Cravens, et al., 2009;

158
Samuels, 2011). Research findings have demonstrated that the context in which
principals perform their work has a significant impact upon the effectiveness of their
leadership skills. The contextual factors include the school grade levels, the
socioeconomic makeup of the student population, the curricular content, and attitudes of
the staff (Glasman & Heck, 1992; Servais & Sanders, 2006; Thomas, Holdaway, &
Ward, 2000). These factors point to the need to study principal effectiveness in the
context of specific school environments.
Researchers have studied principal preparation programs to determine if
principals are being adequately prepared for the complex positions and the competing
demands placed upon them (Blum, Butler, & Olson, 1987). The principals’ perceptions
of their own preparation programs are not encouraging. In a report by Public Agenda for
the Wallace Foundation, members of the National Association of Secondary School
Principals expressed their opinions (Farkas, Johnson, & Duffet, 2003). As a group, these
principals expressed negative opinions about the preparation and education they received
in their graduate school programs to prepare them for leadership positions. Only four
percent of those surveyed felt that their graduate school programs were most valuable in
preparing them for their positions. Davis et al. (2005) conducted a review of research
and stated that “principal candidates and existing principals are often ill-prepared and
inadequately supported to organize schools to improve learning while managing all of the
other demands of the job” (p. 4).
If principals believe that their preparation programs have inadequately prepared
them for their current administrative positions, there are at least two avenues that exist for
increasing the effectiveness of schools through the leadership of principals. One avenue

159
is to better prepare future principals through an improvement in principal preparation
programs. A second avenue is to improve the skills of those principals currently
practicing in the field.
Despite the extensive research and knowledge that exists about leadership skills,
principals’ leadership characteristics, styles of leadership, traits, and behaviors, little
research exists about leadership specifically in the context of career and technical
education. Student achievement continues to fall short of expectations (U.S. Department
of Education, 2010). In particular, this continues to be true regarding the academic
achievement of students enrolled in career and technical education schools. Career and
technical education participants at the secondary level have “less advantaged educational
backgrounds than nonparticipants” (U.S. Department of Education, 2008, p. xi).
The purpose of this research study was to investigate the learning-centered
leadership skills of principals in selected area career and technical schools using an
instrument made commercially available in 2008 called the Vanderbilt Assessment of
Leadership in Education (VAL-ED). It is an online survey instrument that may be
purchased through Discovery Education™. In this research study, leadership skills of
secondary school principals were analyzed within the unique context of the career and
technical education school.
A review of the research refers to the term principal interchangeably with the
school’s instructional leader. In this study, the term principal was used interchangeably
with the school’s instructional leader, regardless of the actual title of the person in the
position. The positions in which the subjects of this research were employed included
assistant director, principal, supervisor, and director of secondary education.

160
Review of the Survey Instrument
The instrument used in this research study, VAL-ED, is a proprietary instrument
developed by researchers at Vanderbilt University in Nashville, TN. As of this
dissertation printing, it is owned by Discovery Education™. The VAL-ED was
administered online to participants. There were 36 variables for teachers, the principal,
and the principal’s supervisor to assess about the principal. Teachers, supervisors, and
principals from each of 16 schools completed the survey to rate the principal on the 36
variables. Responses were categorized separately by respondent group and by school.
This method was consistent with the method adopted by the researchers who developed
VAL-ED (Porter et al., 2008), conducted the pilot studies, and established the national
norms. Because of the volume of teacher responses for each principal, one question was
used to represent each variable. Because the principal rated him or herself and was
considered a group of one, two questions were used for each variable to ensure greater
reliability. Similarly, two questions were used for each supervisor respondent.
The 360-degree feedback instrument used in this study to assess the leadership
skills of principals was evaluated and judged to be psychometrically valid and reliable. It
was aligned to the professional standards of the Interstate School Leaders Licensure
Consortium (ISLLC) 2008. It was administered electronically online. Information about
the assessment is included as Appendix N.
Participants responded to each variable on a Likert response scale from 1 to 5,
with 1 = Ineffective; 2 = Minimally effective; 3 = Satisfactorily effective; 4 = Highly
effective; and 5 = Outstandingly effective. Respondents could refuse to answer any of

161
the questions in two ways: leave the item blank or select response item 6 to represent
Don’t know from the list of possible responses.
Mean scores were aggregated and reported in the manner similar to that
conducted by Discovery Education™ in the preparation of written reports provided to
principals (Porter et al., 2008) and in the calculation of the national norms. The mean
value for teachers was aggregated and then weighted evenly with the responses for the
principal and the supervisor from each school to create a mean for each of the 36
variables formed at the intersection of six core components and six key processes.
Variables were combined in the manner similar to that conducted by Discovery
Education™ to create 12 subsets that corresponded to six key processes and six core
components studied in this research. The overall composite principal mean effectiveness
score was calculated by aggregating all 36 variables by response group and weighting
them equally. The composite principal mean effectiveness score was compared to the
nominal category ranges identified in Table 26 to label each principal as Below Basic,
Basic, Proficient, or Distinguished.
Discussion
Of the 16 schools participating in the study, 16 (100 percent) of the principals, 15
of the supervisors (93 percent) and 315 (79.7 percent) of the teachers completed the
survey instrument. Missing data accounted for between 4 and 39.9 percent (valid n =
208) of the responses for the 36 variables. No incentives or encouragement were given to
participants to provide a rating for every variable because it was reasonable to assume
that a teacher might simply not have personal knowledge of the effectiveness of the
principal for every given performance skill. An incentive may have persuaded the

162
teachers to provide a rating even though they had no objective data upon which to base a
rating. It is assumed that the lack of first-hand information accounted for the large
percentage of Don’t know responses to survey questions from the teacher group.
Four research questions in this study analyzed the leadership skills of instructional
leaders from the conceptual framework of learning-centered leadership. The
instructional leader was defined as the person who had primary responsibility for teacher
supervision and evaluation. The term principal was used to identify the instructional
leader in each school system, regardless of the actual name of the position held.
Discussion regarding the implications for each of the four research questions follows.
Research Question One.
Research question one was, to what extent, if any, did principals in selected
career and technical schools demonstrate learning-centered leadership skills as
measured by the Vanderbilt Assessment of Leadership in Education? The subset key
process variables were (a) planning, (b) implementing, (c) supporting, (d) advocating, (e)
communicating and (f) monitoring. The subset core component variables were (a) high
standards for student learning, (b) rigorous curriculum, (c) quality instruction, (d) culture
of learning and professional behavior, (e) connections to external communities, and (f)
performance accountability. The overall composite rating for all 16 principals (all
variables and the subsets) as a group was proficient (3.69 within the proficient range of
3.60 – 3.99). Of the key processes, the highest mean ratings were for supporting,
communicating, and monitoring; the lowest mean ratings were for planning,
implementing, and advocating. Of the core components, the highest mean ratings were
for culture of learning and professional behavior, quality instruction, and high standards

163
for student learning; the lowest mean ratings were for performance accountability,
connections to external communities, and rigorous curriculum.
Conducting a more detailed analysis of the intersection of the core components
and key processes showed areas in which more than half of the principals were rated as
Below basic or Basic: Planning: Rigorous curriculum (56%), Culture of learning and
professional behavior (68%), and Connections to external communities (75%);
Implementing: Rigorous curriculum (75%), Connections to external communities (68%),
and Performance accountability (68%); Advocating: Quality instruction (81%),
Connections to external communities (62%), and Performance accountability (68%); and
Communicating: Connections to external communities (75%), and Performance
accountability (75%). Overall, the ratings were lowest in the key processes of Planning,
Implementing, and Advocating, and in the core components of Rigorous curriculum,
Performance accountability, and Connections to external communities. The only process
related to Connections to external communities where more than half the principals were
rated as proficient was Advocating. In each of the other five key processes, more than
half the principals were rated at the level of Basic.
A subset of research question one was to determine if there was any correlation
between the mean effectiveness rating of each principal compared to years of experience
as a teacher, years of experience in the current position in their school, and years of
experience as a principal. A Pearson’s product-moment correlational analysis was
conducted. It did not show any statistically significant correlations between these factors
and the principals’ mean effectiveness rating. However, given the small sample in this
research study from the population of career and technical education principals, as well as

164
the purposeful sample used to mirror the population of career and technical principals at
large, it is not surprising that the data did not show an association between the principals’
demographic characteristics and their performance ratings.
Research Question Two.
Research question two was, to what extent, if any, did principals in selected
career and technical schools demonstrate learning-centered leadership skills different
from the national norm? The performance ratings of the national norm comparison
group of secondary school principals were 3.52, 3.60, 3.52, and 3.45 for overall,
supervisor ratings, teacher ratings, and principal ratings, respectively. This was
compared to the research group of 3.69, 3.92, 3.61, and 3.59 for overall, supervisor
ratings, teacher ratings, and principal ratings, respectively. A one sample t test was
conducted. Although the career and technical education principals were rated somewhat
higher than the national norm values, the one sample t test showed no statistically
significant difference between the mean ratings of the research group and the national
norm group. This suggests that the career and technical education principals appear to be
performing at least as effectively as the non-career and technical education secondary
school principals who were rated as part of the Vanderbilt Assessment of Leadership in
Education (VAL-ED) pilot study group used to establish the national norms.
Research Question Three.
Research question three was to what extent, if any, did the perceptions of
leadership skills differ among principals, teachers, and supervisors? Based on the data
that exist for the national norm, no statistical difference was shown to exist between the
perceptions of the teachers, principals, and supervisors of the principals’ effectiveness,

165
although the ratings of the principals by the principals were the lowest of the three
groups. The supervisors tended to have the highest ratings among the groups. In the
research study, the same basic themes existed.
An analysis of variance was conducted, and it demonstrated no statistical
difference between the ratings of the three groups, although the principals rated
themselves lower than either the supervisors or the teachers. In both the national data and
the research study, the supervisors rated principals the highest, and the principals rated
themselves the lowest.
Research Question Four.
Research question four was, to what extent, if any, did the leadership skills of
selected career and technical education principals show an association with student
achievement as measured by the National Occupational Competency Testing Institute
(NOCTI) end-of-program assessment? The end-of-program assessment required for
students enrolled in career and technical education schools is distributed by the National
Occupational Competency Testing Institute (NOCTI). The NOCTI student assessment
served as the measure of student achievement for this research study. Qualitative ratings
of students based on state-created cut scores were translated into nominal categories of
Below Basic, Basic, Competent, and Advanced. For each school, the percentage of
students who scored in each of the four categories was reported by the school’s
administrative director. These scores were then collapsed into two nominal categories:
Above the state average and Below the state average. The statistics on student
performance in Pennsylvania showed that 76.1 percent of the students who participated in
the NOCTI assessment in 2011 scored in the Competent and Advanced category ranges.

166
Similarly, each school principal’s overall mean effectiveness rating was reviewed
and collapsed into two nominal categories. Utilizing the overall composite mean ratings,
the 16 principals were rated qualitatively as Below Basic, Basic, Proficient, or
Distinguished based on the value ranges and descriptors in Table 26. The principals’
qualitative ratings were then collapsed into two categories: Below basic/Basic and
Proficient/Distinguished. Six principals were rated in the Below basic/Basic category
and 11 principals were rated in the Proficient/Distinguished category.
A chi-square table was constructed and a Fisher’s exact test was performed. The
continuity correction was applied as a conservative adjustment to chi-square because 75
percent of the cells had frequencies less than five (Garson, 2009). These calculations
demonstrated no direct association between the qualitative effectiveness rating of the
principal and the qualitative performance of the students measured by the NOCTI
assessment.
Implications and Recommendations for Professional Practice
At the beginning of this project, the researcher expected to add to the body of
research related to leadership skills of career and technical education principals in an
effort to focus the professional education efforts in those areas that would have the
greatest impact upon student achievement. Additionally, it was expected that personnel
in administrative preparation programs and Act 45 Providers might gain knowledge of
the skills most critical to create highly effective schools and high student achievement. A
discussion of the implications and recommendations for the professional practice follow.
Critical to the improvement of the performance of instructional leaders is
formative and summative feedback (Reeves, 2009). Learning-centered leadership skills

167
provides the conceptual framework for this feedback. This research study provided
specific feedback to the principals about their level of effectiveness in each of the core
components and key processes that have an association with increasing student
achievement. This feedback is necessary for them to improve the leadership skills that
will have a positive impact upon student achievement. The first discussion item for the
principals’ supervisors is the extent to which principals in their schools regularly receive
this type of specific feedback. If principals and supervisors are knowledgeable about the
leadership framework necessary for effective schools and the principals’ level of
effectiveness in each area, improvements in student achievement are virtually certain to
occur (Murphy, Elliott, Goldring, & Porter, 2006). By understanding these components
and the processes that are necessary to create them, principals should clearly understand
the expectations for their positions, and supervisors should be able to give specific
feedback. If teachers are knowledgeable about the components and processes, they will
be aware of the conditions that principals are trying to create to have a positive impact
upon student achievement. An important contribution from this research study to the
collective body of knowledge is that principals need to have a solid understanding of the
what and how of their positions—what conditions they should create (core components)
and how they should create them (key processes). When principals, their supervisors,
and their teachers all share a common understanding of the desired school conditions and
how they are expected to bring them about, achieving the conditions in which student
achievement increases should be virtually certain to occur.
A second recommendation for the practice is to examine our perceptions about the
purposes of feedback and evaluation. Feedback and evaluation are necessary for each of

168
us to improve our practice. Without specific feedback, improvement is unlikely. It was
interesting to note that the principals in this study seemed to be their own biggest critics.
They appeared to be more keenly aware of their shortcomings and potential areas for
growth than the teachers and the supervisors. In addition, several supervisors appeared
uncomfortable or reluctant to provide direct feedback to their principals by completing
the survey instrument as opposed to the teachers in this study who provided feedback
under the cover of anonymity. This may account for the highest ratings of the principals
by their supervisors. An interesting question raised by this research study is why would
supervisors be uncomfortable giving direct feedback to principals? Supervisors should
be well versed and practiced in providing specific feedback and evaluative data to
principals about their performance. Supervisors should assess and overcome any
reluctance on their part to provide formative and summative feedback related to effective
school performance. Only through frank conversations will principals be able to improve
their leadership skills and bring about the changes in our school systems that result in
higher student achievement.
A review of the literature regarding effective schools in Chapter 2 pointed to the
need for and success of distributed and shared leadership theories (Bass, 1990; Blasé &
Blasé, 200; Clark, Martorell, & Rockoff, 2009; Gronn, 2002; Printy, 2010; Spillane,
2005). These leadership theories point to the higher success rates in school reform efforts
when teachers are involved in the planning and implementing. Joint planning and
implementing alone, however, may not result in sustainable reforms that lead to increased
student achievement. Empowering teachers to act in ways that improve school
performance and student achievement implies that the teachers have knowledge of the

169
core components and key processes that lead to effective schools. This is an education
and training opportunity waiting to be implemented.
The high percentage of teacher responses of Don’t Know for the leadership
variables in this study is noteworthy. It may be an indication that career and technical
education principals are more prone to autocratic leadership styles as opposed to
distributed leadership styles where teachers play an active role in planning,
implementing, advocating, supporting, communicating, and monitoring the core
components that lead to highly effective schools. Professional development related to
distributed leadership models may better enable principals to collaborate with teachers in
the leadership style that encourages synergy and produces more effective schools.
Improvements in education begin with a planning strategy (Lezotte, 2004;
Marzano, Waters, & McNulty, 2005). Once the plan is formed, implementation
strategies are employed to meet objective outcomes. If these two primary skills are
lacking to the extent demonstrated in this research, it should be expected that the desired
outcomes in terms of student achievement may be much more difficult or impossible to
achieve. Without effective planning and implementation strategies, improvements in
student achievement may be chance byproducts of the principal’s performance, at best.
With other administrators, in particular with the principal’s supervisor and with the
school’s teachers, collaborative planning and implementation should be the norm for new
and experienced principals. Through collaboration and a team approach, the practices of
planning and implementation are more likely to end with the desired student achievement
outcomes, given the principles of collaborative and distributed leadership (Spillane, 2005;
Spillane, Halverson, & Diamond, 2001).

170
Curriculum based on high standards is the core of effective instruction
(Pennsylvania Department of Education, SAS, n.d.). Performance accountability or
measuring performance against prescribed goals as a performance improvement strategy
is critical (Cromwell, 2010). If these two critical skills (rigorous curriculum and
performance accountability) are not firmly in place, it will be difficult to achieve
sustained improvements in student performance. Preparation and professional education
programs must ensure that principals acquire the skills and knowledge to plan and
implement a rigorous curriculum, regardless of the content area in order to increase
student achievement. In addition, Act 45 program providers should be encouraged to
design and enhance focused professional education experiences for principals in these
lowest rated skill areas (planning, implementing, rigorous curriculum and performance
accountability) to improve the leadership practices and school effectiveness as the vehicle
to increase student achievement.
Between 62 percent and 75 percent of the principals were given Basic
performance ratings related to all aspects of Connections to external communities except
Supporting. This is a strong indication that principals need to demonstrate more efforts
and focus on engaging the external communities in the aspects of the school. This may
include Local Advisory Committees, parent groups, outreach and participation in
Chambers of Commerce, Workforce Investment Boards, Youth Councils, service
organizations, and professional organizations.
A final implication of the findings in research question one relates to
communication. The key process of Communicating, overall, was perceived as one of the
highest key processes. It is interesting to note, however, that Communicating Connections

171
to external communities, Communicating Performance accountability, and Communicating
Culture of learning and professional behavior were among the variables with the highest
percentage of missing data defined by Don’t Know responses by participants. If
communication was highly effective in these three areas, teachers and supervisors should
be knowledgeable of the principal’s performance and better able to provide appropriate
feedback. Perhaps there is a distinction here to be made between perception and reality.
The data in this research project showed that career and technical education
principals were perceived by respondents to be performing as well as the principals in the
national norm. It is generally accepted that principal leadership is second only to
teachers in terms of its effect on student achievement (Leithwood, Harris, & Hopkins,
2008). Research conducted by others showed that effective principals have a modest but
significant effect in schools in general, but the effects are far more significant in schools
where more challenges exist. “Especially when we think of leaders in formal
administrative roles, the greater the challenge, the greater the impact of their actions on
learning” ((Leithwood, Seashore-Louis, Anderson, & Wahlstrom, 2004, p. 5). With the
higher incidence of students enrolled in career and technical education that have
individual education plans, are members of an at-risk population, or performing below
the state average on state academic assessments, the career and technical education
principal serves a population in greater need of effective leaders (Pennsylvania
Department of Education, 2009-2010 PSSA). Because of these challenging student
needs, it is important that career and technical education principals be more effective than
the national norm.

172
State and national educational policy make it clear that increasing student
performance is the educational priority. One of the essential strategies to improving
performance is measuring performance in the areas most likely to lead to increased
student achievement (Reeves, 2009). Principal assessment instruments are woefully
inadequate or outdated where they exist at all (Catano & Stronge, 2007; Condon &
Clifford, 2009; Linn, 2000; Thomas, Holdaway, & Ward, 2000). Administrators
responsible for supervising and evaluating principals must utilize a valid and reliable
assessment instrument in a consistent manner to drive improvements in principals’
practices. The data from research question two demonstrated that career and technical
principals were performing at the national norm levels, but if principals are to perform
above the norm levels, it is imperative that supervisors provide timely, specific, and
accurate formative feedback (Catano & Stronge, 2007; Cromwell, 2010). The principals
in this research study may be served by focusing professional education efforts to
improve the processes of (a) planning in the core component areas of culture of learning
and professional behavior, connections to external communities, and rigorous curriculum;
(b) implementing in the core component areas of quality instruction, performance
accountability, connections to external communities, and rigorous curriculum; (c)
supporting in the component area of rigorous curriculum; and (d) advocating in the
component area of quality instruction. These were the variables where the principals
were perceived by respondents as performing below the level of proficiency.
Because principals rated themselves the lowest of the three groups of respondents
(teachers, supervisors, and principals), it can be assumed that principals have very high
expectations for themselves and for their own performance. They tended to evaluate

173
themselves more critically than either their supervisors or their teachers. In this respect,
principals may be more keenly aware of their own shortcomings and needs for specific
professional education than others observing their behavior. It illustrates an encouraging
view about principals’ self-reflection on their performance. A critical component of their
professional growth and desire to increase student learning would be for supervisors to
encourage and financially support principals in their desire to participate in professional
education related to the principals’ perceived shortcomings. It appears that no one may
know better what a principal needs to do a better job than the principal him or herself. If
this implication is accurate, it is very good news. Assuming ownership of the problem
and accepting constructive criticism are important first steps in making improvements in
one’s own performance (Cromwell, 2010).
The data in this research study showed no direct association between the
principals’ performance and student achievement. The implication that the principal’s
performance does not impact student achievement is contrary to many significant studies
that involved far more robust data samples and analysis, beginning with effective schools
research from 1970 (Clark, Martorell, & Rockoff, 2009; Cotton, 2003; Edmonds, 1982;
Erwin, Winn, Gentry, & Cauble, 2010; Leithwood, Louis, Anderson, & Wahstrom,
2004; Lezotte, 1991, 2004). This research study sought to demonstrate a direct
relationship between leadership and student achievement. While a direct relationship was
not demonstrated, this is not surprising. The finding in this research study appears to
confirm the highly complex relationship that does exist between leadership and student
achievement. It confirms the complexity of the intermediary variables shown in Figure 1.
These variables, such as previous experiences, family educational and economic
174
background, school climate, school policies and practices, all play a critical part in
student achievement. The school leader, by creating the conditions for effective schools
does have an indirect and positive impact upon student achievement.
Limitations of the Study
First, this research study may not be generalized to the entire population of career
and technical administrators because it fell far short of involving a random sample of the
population. Only 19% (16 of 83) of the career and technical education schools in
Pennsylvania participated in this study. Additionally, this research involved only part-
time career and technical education schools. Other delivery systems, including senior
only and full-time, comprehensive career and technical education schools were not
included in this study.
This study involved a purposeful sample of 16 schools from the population of 83
career and technical education schools in Pennsylvania. Schools were selected from the
western, central, and eastern regions as defined by their participation in one of the three
teacher preparation programs. Five schools were located in western Pennsylvania, six in
central Pennsylvania, and five schools in eastern Pennsylvania.
Schools were selected based on the instructional leader’s characteristics that most
closely matched the characteristics of the statewide population in terms of experience as a
principal and experience as a teacher, but not the characteristic of gender. In 2010, the
statewide population included approximately 51.0% female and 49.0% male instructional
leaders; this research sample included 33.0% female and 67.0% male instructional
leaders.

175
The evaluation instrument, the Vanderbilt Assessment of Leadership in Education
(VAL-ED), is a 360° assessment instrument. Teachers and supervisors rated the
instructional leaders, and the instructional leaders rated themselves. This study was
limited to the extent that the evaluators were able to accurately rate the instructional
leader’s effectiveness in each of the variables based on personal observations, documents,
reports from others, school projects and activities, or other objective sources of data. For
some variables, less than 50 percent of the participants were able to rate the principal.
An unexpected limitation of this study was the extent to which the teachers and
supervisors were able to rate the instructional leader, as noted by the number of values
labeled as Don’t know. In the pilot study conducted by Vanderbilt University in 2008,
there were significantly fewer Don’t know responses. This may have been due, in part, to
the financial incentive provided to schools with complete answers, or it may be an
indication that career and technical school principals have a more limited type and
content of communications and interactions with their teachers and supervisors. Career
and technical education principals may perform their duties and responsibilities more in
isolation from their teachers and supervisors than secondary school principals or may not
communicate their activities as clearly or frequently as other secondary school principals.
Recommendations for Future Research
Career and technical education remains an accessible area of research. According
to the 2010 Consolidated Annual Report (CAR), grade 11 career and technical education
students represented about 12 percent of the total grade 11 statewide population. Yet,
this population of schools, teachers, and administrators has taken part in little research
designed to solicit information and best practices that have the potential to improve this

176
and other aspects of the profession. Because career and technical education is unique in
serving more students with individualized education plans than that which exists in
regular education, and because, as a whole, career and technical education students do not
perform as well as their non-career and technical education counterparts on high-stakes
academic assessments, career and technical education schools may be considered low
performing schools. The research demonstrates that effective leadership has a more
significant impact in low performing schools. More research in career and technical
education schools would benefit the profession and may increase student achievement.
A second strand of future research is recommended to examine the effectiveness
rating of career and technical education principals trained through specific principal
preparation programs. Significant dollars are invested by individuals and by schools
through tuition reimbursements to their administrators for advanced certification and
degrees. In this day of best practices and performance accountability, it would be highly
valuable for individuals and for the schools hiring administrators to know which
programs help principals demonstrate the most effective performances.
A third possibility for future research exists with the Bureau of Career and
Technical Education. Since 2008-2009, the Bureau of Career and Technical Education
has provided financial and professional development supports to career and technical
education schools through the Technical Assistance Program (TAP). The TAP program
has provided professional education programs for significant numbers of teachers and
administrators. The foci of the professional education for these groups (as of the 2011 -
2012 school year) have been on improving student performance in the end-of-program
assessment provided by the National Occupational Competency Testing Institute

177
(NOCTI), improving the integration of academics (specifically, numeracy, literacy) in the
career and technical program areas, highlighting best educational practices for special
education students, coaching, and Standards Aligned System (SAS). Of the schools
participating in this research study, four schools took advantage of the supports through
the TAP beginning in 2008-2009, three schools began in 2009-2010, five schools began
in 2010-2011, and one school began in 2011-2012. Three of the schools that participated
in this research study had yet to participate in TAP as of September 2011 (Bureau of
Career and Technical Education, 2010). Research to determine the extent to which the
TAP has had a positive influence on leadership would benefit the profession.
Finally, it would be of value to learn more about the specific leadership styles of
principals who create highly effective schools. As noted previously, this study produced
a high percentage of Don’t know responses from the participants. It would be particularly
insightful to learn if highly effective principals demonstrate distributed leadership
approaches in their management practices to a greater extent. If the high percentage of
Don’t know responses is an indication of principals working in isolation from their
teachers to create highly effective schools, and if those principals who practice a
distributed leadership style create more effective schools, it would be valuable to provide
coursework, internships, and more professional development emphasis upon distributed
leadership practices.
Conclusion
The purpose of this research study was to assess the extent of leadership skills of
principals in part-time career and technical education schools selected as a purposeful
sample. The term principal was used to designate the school’s instructional leader,

178
regardless of the actual position in which the instructional leader was employed. Actual
positions of employment included supervisor, assistant director, principal, and director of
secondary education. There were four research questions in this research study. The four
questions were as follows.
1. To what extent did principals in selected career and technical schools demonstrate
learning-centered leadership skills as measured by the Vanderbilt Assessment of
Leadership in Education?
2. To what extent, if any, did principals in selected career and technical schools
demonstrate learning-centered leadership skills different from the national norm?
3. To what extent, if any, did the perceptions of leadership skills differ among
principals, teachers, and supervisors?
4. To what extent, if any, did the leadership skills of selected career and technical
education principals show an association with student achievement measured by the
National Occupational Competency Testing Institute (NOCTI) end-of-program
assessment?
The research findings demonstrated that the overall composite effectiveness rating
of the principals in this research study was in the Proficient category (3.69 on a 5-point
Likert response scale in the proficiency range of 3.60 – 3.99) based on values assigned to
four categories of Below Basic, Basic, Proficient, and Distinguished. This rating was
consistent with the national norm for secondary school principals (3.59). The research
findings in this project demonstrated that no significant differences in the perceptions of
leadership skills among principals, supervisors, and teachers. Finally, no association was

179
found in this research between the principals’ performance rating measured by the VAL-
ED and the students’ performance rating measured by the NOCTI assessment.
This research demonstrated that principals rated themselves most conservatively,
perhaps knowing their needs better than others. The profession would benefit by
ensuring principals receive specific and frequent formative and summative assessment
data about their performance from their supervisors, as well as financial and professional
support in their professional development efforts directed toward shortcomings that have
the greatest impact on student achievement. For the principals participating in this
research study, the key processes of Planning, Implementing, and Advocating, and the
core components of Quality Instruction, Rigorous curriculum, Connections to external
communities, and Performance accountability were the areas that received the lowest
ratings. Based upon this research study, pre-service and in-service training in these
concepts may assist career and technical education principals lead their schools to
become high performance organizations.

180
References
Amsterdam, C. E., Johnson, R. L., Monrad, D. M., Tonnsen, S. L. (2005). A collaborative
approach to the development and validation of a principal evaluation system: A
case study. Journal of Personnel Evaluation in Education, 17(3), 221-242.
Anderson, G. L., Creighton, T., Dantley, M., English, F., Furman, G., Gronn, P., &
Marshall, C. (2002, Spring). Problematizing the ISLLC Standards and exam.
American Education Research Association (AERA) Division A-Educational
Division Newsletter. Retrieved from http://www.aera.net/uploadedFiles
/Divisions/Administration_%28A%29/Newsletters/spring02.pdf
Association for Career and Technical Education. (2009, March 24). Pennsylvania CTE
state profile. Retrieved from ACTE website: http://www.acteonline.org/profile
_pa.aspx
Barrett, F. J., Cooperrider, D. L., & Fry, R. E. (2005). Bringing every mind into the game
to realize the positive revolution in strategy: The appreciative inquiry summit. In
W. J. Rothwell & R. L. Sullivan (Eds.), Practicing organization development, (pp.
510-538). San Francisco, CA: Pfeiffer.
Bartunek, J. M., & Moch, M. K. (1987). Interventions: A cognitive approach. Journal of
Applied Behavioral Science, 23, 483-500. doi:10.1177/002188638702300404
Bass, B. M. (1990). From transactional to transformational leadership: Learning to share
the vision. Organizational Dynamics, 18(3), 19-31. Retrieved from ABI/INFORM
Global. (Document ID 704687)

181
Bennis, W. G. (1959). Leadership theory and administrative behavior: The problem of
authority. Administrative Science Quarterly, 4(3), 259-301. Retrieved from
Business Source Premier database. (Access No. 6440984)
Blasé, J. & Blasé, J. (2000). Effective instructional leadership: Teachers' perspectives on
how principals promote teaching and learning in schools. Journal of Educational
Administration, 38(2), 130-141. Retrieved from ABI/INFORM Global. (Document
ID 115722148)
Blasé, J, and Kirby, P. C. (2000). Bringing out the best in teachers. (2nd
ed.). Thousand
Oaks, CA: Corwin Press.
Blum, R., Butler, J., & Olson, N. (1987). Leadership for excellence: Research based
training for principals. Educational Leadership, 44(1), 25-29.
Brady, R. C. (2003). Can failing schools be fixed? Washington, D.C.: Thomas B.
Fordham Foundation. Retrieved from http://www.edexcellence.net/detail
/news.cfm?news_id=2
Bureau of Career and Technical Education, Pennsylvania Department of Education
(2010). Career and technical education secondary student achievement. Paper
presented at Technical Assistance Program, June 17, 2010, State College, PA.
Bureau of Career and Technical Education, Pennsylvania Department of Education
(2011). Career and technical education student achievement. Paper presented at
Technical Assistance Program, July 26, 2011, State College, PA.

182
Career and technical education assessment information. (n.d.) Retrieved from the
Pennsylvania Department of Education, Bureau of Career and Technical
Education website: http://www.portal.state.pa.us/portal/server.pt/community
/assessment_information/7385
Carl D. Perkins Career and Technical Education Improvement Act of 2006, Public L. No.
109-270, 120 Stat. 683 (2006).
Carter, S. C. (2000). No excuses: Lessons from 21 high-performing, high-poverty schools
Washington, DC: The Heritage Foundation. Retrieved from ERIC database.
(ED440170)
Catano, N. & Stronge, J. (2007). What do we expect of school principals: Congruence
between principal evaluation and performance standards. International Journal of
Leadership in Education, 10(4), 379-399.
Chenoweth, K. (2010, November). Leaving nothing to chance. Educational Leadership,
68(3), 16-21.
Clark, D., Martorell, P., & Rockoff, J. (2009, December). School principals and school
performance. National Center for Analysis of Longitudinal Data in Education
Research. (Working Paper 38). Washington, D.C.: The Urban Institute.
Coleman, J. (October 1967). The concept of equality of educational opportunity. Paper
presented at a conference held by the U.S. Office of Education, Harvard University
Graduate School of Education. Retrieved from ERIC database. (ED015157)
Condon, C. & Clifford, M. (2009, December). Measuring principal performance: How
rigorous are publicly available principal performance assessment instruments?
(Issue Brief). Naperville, IL: Learning Point Associates.

183
Cooperrider, D., & Srivastva, S. (1987). Appreciative inquiry in organizational life.
Research in organizational change and development. (Vol. 1). JAI Press Inc.
(pp. 129-169). Retrieved from http://www.margiehartley.com/home/wp-
content/uploads/file/APPRECIATIVE_INQUIRY_IN_Orgnizational_life.pdf
Cotton, K., (2003). Principals and student achievement: What the research says.
Alexandria, VA: Association for Supervision and Curriculum Development.
Council of Chief State School Officers and National Policy Board for Educational
Administration. (2008). Educational leadership policy standards: ISLLC 2008.
Washington, DC. Retrieved from The Wallace Foundation website:
http://elan.wallacefoundation.org/TR/KnowledgeCategories/Leadership%20Standar
ds/Leader%20Standards/Pages/leader_educational.aspx
Cromwell, S. E. (2010). Unpublished materials from World Campus course, Needs
Assessment for Industrial Trainers, WF ED 573. Pennsylvania State University,
State College, PA.
Crow, G., Hausman, C., & Scribner, J. (2002). Reshaping the role of the school principal.
The Educational Leadership Challenge: Redefining Leadership for the 21st
Century (ed. Joseph Murphy). Chicago, IL: National Society for the Study of
Education.
Daggett, W., & McNulty, R. (2010). Rigor/relevance framework. International Center
for Leadership in Education website: http://www.leadered.com/rrr.html
Davis, S., Darling-Hammond, L., LaPointe, M., & Meyerson, D. (2005). School
leadership study: Developing successful principals. Stanford, CA: Stanford
University, Stanford Educational Leadership Institute.

184
DuFour, R. (2002). The learning-centered principal. Educational Leadership, 59(8), 12-
15.
Edmonds, R. R. (1982, February). Programs of school improvement: An overview. Paper
presented at the National Invitational Conference, Research on Teaching:
Implications for Practice, Warrenton, VA. Retrieved from ERIC database.
(ED221536)
Edmonds, R. R. (1983, October). An overview of school improvement programs. Institute
for Research on Teaching, College of Education, Michigan State University.
(Occasional Paper No. 67). Retrieved from ERIC database. (ED250790)
English, F. (Ed.). (2003). The ISLLC standards: The deskilling and deprofessionalization
of educational administrators. The postmodern challenge to the theory and practice
of educational administration (pp.102-131). Springfield, IL: Charles C. Thomas.
Erwin, S., Winn, P., Gentry, J., & Cauble, M. (2010, April 30-May 4). A comparison of
urban, suburban, and rural principal leadership skills by campus student
achievement level. Paper presented at the American Educational Research
Association Annual Conference, Denver, CO. Retrieved from ERIC database.
(ED509493)
Farkas, S., Johnson, J., & Duffett, A. (with Syat, B. & Vine, J.) (2003). Rolling up their
sleeves: Superintendents and principals talk about what's needed to fix public
schools. New York: Public Agenda. Retrieved from http://www.wallacefoundation
.org /SiteCollectionDocuments/WF/Knowledge%20Center/Attachments
/PDF/rolling_up_their_sleeves.pdf

185
Fullan, M. (2007). The new meaning of educational change. (4th ed.). New York, NY:
Teachers College Press.
Garson, G. D. (2009). "Chi-square Significance Tests," from Statnotes: Topics in
Multivariate Analysis. Retrieved October 25, 2011, from
http://faculty.chass.ncsu.edu/garson/pa765/statnote.htm
Gilley, A., McMillan, H. S., & Gilley, J. W. (2009). Organization change and
characteristics of leadership effectiveness. Journal of Leadership & Organizational
Studies, 16, 38-47.
Ginsberg, R., & Berry, B. (1990). The folklore of principal evaluation. Journal of
Personnel Evaluation in Education, 3, 205-230.
Glasman, N. S., & Heck, R. H. (1992). The changing role of the principal: Implications
for principal assessment. Peabody Journal of Education, 68(1), 5-24.
Goldring, E. B., Cravens, X., Murphy, J., Porter, A. C., Elliott, S. N., & Carson, B.
(2009). The evaluation of principals: What and how do states and urban districts
assess leadership? The Elementary School Journal, 110(1), 19-39.
Goldring, E. B., May, H., & Huff, J. (2010). Principals’ leadership practices over time:
Contextual influences on what principals do. In W. K. Hoy & Dipaola, (Eds.).
Analyzing school context: Influences of principals and teachers in the service of
students. (pp. 103-133). Charlotte, NC: Information Age Publishing Inc. Retrieved
from http://books.google.com/books?id=_Dmculu4BjgC&pg=PA103&lpg=PA103
&dq=contextual+influences+on+what+principals+do&source=bl&ots=TNO_do5ob
0&sig=yGGsY8e0Fo2wbMNpGlYqi4JWEUA&hl=en&ei=fqzDTKThFoK0lQfB0Z

186
wD&sa=X&oi=book_result&ct=result&resnum=1&ved=0CBgQ6AEwAA#v=onep
age&q=contextual%20influences%20on%20what%20principals%20do&f=false
Goldring, E. B., Porter, A., Murphy, J., Elliott, S. N. & Cravens, X. (2009). Assessing
Learning-Centered Leadership: Connections to Research, Professional Standards,
and Current Practices. Leadership and Policy in Schools, 8(1), 1-36.
doi:10.1080/15700760802014951
Goodwin, R., Cunningham, M., & Childress, R. (2003). The changing role of the
secondary principal. National Association of Secondary School Principals,
87(634), 26-42.
Gronn, P. (2002). Distributed leadership as a unique of analysis. The Leadership
Quarterly, 13(4), 423-451.
Hallinger, P. (2005). Instructional leadership and the school principals: A passing fancy
that refuses to fade away. Leadership and Policy in Schools, 4, 221-239.
Hallinger, P., Bickman, L., & Davis, K. (1996). School context, principal leadership, and
student reading achievement. The Elementary School Journal, 96(5), 527-549.
Hallinger, P. & Heck, R. H. (1998). Exploring the principal's contribution to school
effectiveness: 1980-1995. School Effectiveness and School Improvement 9(2),
157-191.
Hanushek, E., & Raymond, M. (2005). Does school accountability lead to improved
student performance? Journal of Policy Analysis and Management, 24(2), 297-327.
Retrieved October 4, 2010, from http://edpro.stanford.edu/Hanushek/admin/pages
/files/uploads/accountability.jpam.journal.pdf

187
Heck, R. H., & Marcoulides, G. A. (1996). The assessment of principal performance: A
multilevel evaluation approach. Journal of Personnel Evaluation in Education, 10,
11-28.
Hornig, E., & Loeb, S. (2010). New thinking about instructional leadership. Phi Delta
Kappan, 92(3), 66-69.
Huck, S. W. (2008). Reading statistics and research. Boston, MA: Pearson Allyn &
Bacon.
Huff, J. T. (2009). Knowing “how” is more than knowing “that”: Efforts to measure
educational leadership expertise (Doctoral dissertation, Vanderbilt University).
Retrieved from http://etd.library.vanderbilt.edu/available/etd-03232009-
131605/unrestricted/JasonHuffDissertation.pdf
Josephsen, K. B. (2007). A descriptive study of the perceptions of California principals
regarding their evaluation and instructional leadership (Doctoral dissertation
Abstract, University of La Verne). Retrieved from Dissertations & Theses: A&I.
(Publication No. 3290078)
Kirkpatrick, S. A., & Locke, E. A. (1991). Leadership: Do traits matter? Academy of
Management Executive, 5(2), 48-60.
Kister, J. (n.d.). Using standardized test data to improve instruction in career-technical
Education: A perspective for practitioners. (White paper). Big Rapids, MI:
National Occupational Competency Testing Institute. Retrieved from NOCTI
website: http://www.nocti.org/PDFs/NOCTIWhitePaper.pdf
Kotter, J. P. (1995, March/April). Leading change: Why transformational efforts fail.
Harvard Business Review, 73(2), 59-67.

188
Kotter, J. P. (2008). Creating a sense of urgency. Boston, MA: Harvard Business Press.
Krueger, P. E. (2001). Determining appropriate sample size. In E.I. Farmer and R.W.
Rojeski (Eds.). Research pathways: Writing professional papers, theses, and
dissertations in workforce education (pp. 247-258). Lanham, MD: University
Press of America, Inc.
LaPointe, M., & Davis, S. H. (2006). Effective schools require effective principals.
Leadership, 36(1), 16-38. Retrieved from http://proquest.umi.com.ezaccess.
libraries.psu.edu/pqdlink?vinst=PROD&fmt =6&startpage=-1&ver
=1&vname=PQD&RQT=309&did=1133866511&exp=10-05-2015
&scaling=FULL&vtype=PQD&rqt=309&TS=1286390124&clientId=9874
Lee, A. S., & Baskerville, R. L. (2003). Generalizing generalizability in information
systems research. Information Systems Research, 14(3), 221-243.
Leedy, P. D. (2009). Practical research: Planning and design (9th ed.). Upper Saddle,
NJ: Prentice Hall.
Leithwood, K. (1994). Leadership for school restructuring. Educational Administration
Quarterly, 30(4), 498-518.
Leithwood, K., Harris, A., & Hopkins, D. (2008). Seven strong claims about successful
school leadership. School Leadership and Management, 28(1), 27-42.
Leithwood, K., & Jantzi, D. (2000). The effects of transformational leadership on
organizational conditions and student engagement with school. Journal of
Educational Administration, 38(2), 112-129. Retrieved from ABI/INFORM
Global. (Document ID 115722153)

189
Leithwood, K., & Jantzi, D. (2005). A review of transformational school leadership
research 1996-2005. Leadership and Policy in Schools, 4, 177-2005.
Leithwood, K., Seashore-Louis, K., Anderson, S., & Wahlstrom, K. (2004). How
leadership influences student learning. Retrieved from
http://www.wallacefoundation.org/ knowledge-center/school-leadership/key-
research/Documents/How-Leadership-Influences-Student-Learning.pdf
Lewin, K. (1947). Frontiers in group dynamics: Concept, method and reality in social
science; social equilibria and social change. Human Relations, 1(5), doi:10.1177
/001872674700100103
Lewis, T. (2001). Designing quantitative research. In E.I. Farmer and R.W. Rojeski
(Eds.). Research pathways: Writing professional papers, theses, and
dissertations in workforce education (pp. 175-199). Lanham, MD: University
Press of America, Inc.
Lezotte, L.W. (n.d.). Effective schools: Past, present, and future. Retrieved August 5,
2010, from http://www.effectiveschools.com/images/stories/brockpaper.pdf.
Lezotte, L.W. (1991). Correlates of Effective Schools: The First and Second Generation.
Okemos, MI: Effective Schools Products, Ltd.
Lezotte, L.W. (2004). The nexus of instructional leadership and effective schools. The
School Administrator, 51(6), 20-23.
Lindahl, R. A. (2007). Why is leading school improvement such a difficult process?
School Leadership and Management, 27(4), 319-332.

190
Linking performance key to Race to the Top access. (2009, August). Education
U.S.A., 6(1), p. 5. Retrieved from ProQuest Education Journals. (Document
ID 1844905371)
Linn, R. (2000). Assessments and accountability. Educational Researcher, 29, 4-16.
Long, C. L. (2008). Instructional leadership: Perceptions of Mississippi career and
technical education administrators and teachers. (Doctoral dissertation). Retrieved
from http://www.acteonline.org/uploadedFiles/About_CTE/files/Instructional
%20leadership%20Perceptions%20of%20MS%20CTE%20administrators.pdf
Marks, H. & Printy, S. (2003). Principal leadership and school performance: An
integration of transformational and instructional leadership. Educational
Administration Quarterly, 39(3), 370-397.
Marcoulides, G. A., Larsen, T., & Heck, R. H. (1995). Examining the generalizability of
a leadership model: Issues for assessing administrator performance. International
Journal of Educational Management, 9(6), 4-9.
Marcoux, J., Brown, G., Irby, B., & Lara-Alecio, R. (2003, April). A case study on the
use of portfolios in principal evaluation. Paper presented at the annual conference
of the American Educational Research Association, Chicago, IL. Retrieved from
ERIC database. (ED475710)
Marzano, R. J. (2007). The art and science of teaching: A comprehensive framework for
effective instruction. Alexandria, VA: Association for Supervision and Curriculum
Development.

191
Marzano, R. J., Pickering, D. J., & Pollock, J. E. (2001). Classroom instruction that
works: Research-based strategies for increasing student achievement. Aurora, CO:
Mid-continent Research for Education and Learning.
Marzano, R. J., Waters, T., & McNulty, B. A. (2005). School leadership that works.
Alexandria, VA: Association for Supervision and Curriculum Development.
McDonald, J. H. (2009). Handbook of biological statistics (2nd ed.). Sparky House
Publishing, Baltimore, Maryland, pp. 57-63.
Murphy, J. (2003). Reculturing educational leadership: The ISLLC standards ten years
out. Paper prepared for the National Policy Board for Educational Administration.
Retrieved from http://www.npbea.org/Resources/ISLLC_10_years_9-03.pdf
Murphy, J. (2005). Unpacking the foundations of ISLLC standards and addressing
concerns in the academic community. Educational Administration Quarterly, 41,
154-191.
Murphy, J., Elliott, S. N., Goldring, E. B., & Porter, A. C. (2006, August). Learning-
centered leadership: A conceptual foundation. Retrieved from ERIC database.
(ED505798)
Murphy, J. & Shipman, N. (1999). The Interstate School Leaders Licensure Consortium:
A standards-based approach to strengthening educational leadership. Journal of
Personnel Evaluation in Education, 13(3), 205-224.
National Association of Elementary School Principals (2008). Leading learning
communities: What principals should know and be able to do. Alexandria, VA:
Author. Retrieved from http://www.naesp.org/resources/1/Pdfs/LLC2-ES.pdf

192
Normore, A. (2006). Leadership recruitment and selection in school districts: Trends and
issues. The Journal of Educational Thought, 40(1), 41-73.
O'Donnell, R. & White, G. (2005). Within the accountability era: Principals' instructional
leadership behaviors and student achievement. National Association of Secondary
School Principals' Bulletin, 89(645), 56-71.
Patton, M. Q. (2002. Qualitative research and evaluation methods (3rd
ed.). Thousand
Oaks, CA: SAGE Publications.
Pennsylvania Department of Education. 2009-2010 PSSA and AYP results. Retrieved
October 27, 2010, from http://www.portal.state.pa.us/portal/server.pt/community
/school_assessments/7442/2009_-2010_pssa_and_ayp_results/770183
Pennsylvania Department of Education, Bureau of Career and Technical Education
(2010). 2008-2013 Perkins IV local plan funding guidelines - updates. Retrieved
August 15, 2010, from http://www.portal.state.pa.us/portal/server.pt
/community/perkins/7338
Pennsylvania Department of Education, EdNA, (n.d.). Education names and addresses.
Retrieved from http://www.edna.ed.state.pa.us/EntitySearchResult.asp
Pennsylvania Department of Education, (n.d.). Standards Aligned System (SAS).
Retrieved from http://www.pdesas.org/
Pennsylvania School Boards Association. (2007). School facts and figures. Retrieved
from http://www.psba.org/issues-advocacy/issues-research/schools-
schoolboards/facts-figures-2007.asp
Porter, A. C., Murphy, J., Goldring, E. B., Elliott, S. N., Polikoff, M. S., & May, H.
(2008). Vanderbilt Assessment of Leadership in Education: Technical Manual

193
(version 1). Retrieved from The Wallace Foundation website:
http://www.wallacefoundation.org /KnowledgeCenter/KnowledgeTopics
/CurrentAreasofFocus/EducationLeadership/Pages/Vanderbilt-Assessment-of-
Leadership-in-Education-Technical-Manual-1.aspx
Porter, A. C., Polikoff, M. S., Goldring, E. B., Murphy, J., Elliott, S. N., & May, H.
(2010). Developing a psychometrically sound assessment of school leadership:
The VAL-ED as a case study. Educational Administration Quarterly, 46(2), 135-
173.
Printy, S. (2010). Principals' influence on instructional quality: Insights from U.S.
schools. School Leadership & Management, 30(2), 111-126.
Rallis, S. F., & Goldring, E. B. (1993). Beyond the individual assessment of the principal:
School-based accountability in dynamic schools. Peabody Journal of Education,
68(2), 3-23.
Reeves, D. B. (2009). Leading change in your school: How to conquer myths, build
commitment, and get results. Alexandria, VA: Association for Supervision and
Curriculum Development.
Reeves, D. B. (2009). Assessing educational leaders: Evaluating performance for
improved individual and organizational results. Thousand Oaks, CA: Corwin
Press.
Rice, J. K. (2010, April). Principal effectiveness and leadership in an era of
accountability: What research says. (Issue Brief 8). National Center for Analysis
of Longitudinal Data in Education Research. Washington, DC: The Urban
Institute.

194
Robbins, P., & Alvy, H. (2004). The new principal’s fieldbook: Strategies for success.
Alexandria, VA: Association for Supervision and Curriculum Development.
Robinson, R. N. (2004). Michigan public school superintendents’ perceptions of the
Interstate Leadership Licensure Consortium standards for principals (Doctoral
dissertation abstract, Wayne State University). Retrieved from ProQuest
(Document No. 828403371)
Rojewski, J. W. (2001). Analyzing categorical data with chi-square and log-linear
models. In E. I. Farmer and R. W. Rojeski (Eds.). Research pathways: Writing
professional papers, theses, and dissertations in workforce education (pp. 286-
303). Lanham, MD: University Press of America, Inc.
Rothwell, W. J., & Sullivan, R. L. (2005). Practicing organization development: A guide
for consultants (2nd
ed.). San Francisco, CA: Pfieffer.
Samuels, C. A. (2011, July 14). Principals’ job reviews getting a fresh look. Education
Week. Retrieved from http://e-news.edweek.org/ct/12200691:14727804727:m
:1:1601005561:BB8A6E7F704701F21F8BD2AA78996701
Sanders, K., & Servais, K. (2006, September 8). Principal performance in high-need
schools. Success in High-Need Schools, 2(2). Retrieved from
http://www.successinhighneedschools.org/journal/article/principal-performance-
high-need-schools
Seashore-Louis, K., Leithwood, K., Wahlstrom, K., & Anderson, W. (2010). Learning
from Leadership: Investigating the links to improved student learning. Center for
Applied Research and Educational Improvement, University of Minnesota, and
Ontario Institute for Studies in Education, University of Toronto. Retrieved from

195
http://www.wallacefoundation.org/KnowledgeCenter/KnowledgeTopics
/CurrentAreasofFocus/EducationLeadership/Documents/Learning-from-
Leadership-Investigating-Links-Final-Report.pdf
Secondary performance measures and standards. (2008, April 22). Retrieved June 18,
2008, from http://www.pde.state.pa.us/career_edu/lib/career_edu/Secondary
_Performance _Measures_and_Standards.pdf
Sirkin, M. R. (1999). Statistics for the social sciences (2nd ed.). Thousand Oaks, CA:
Sage Publications.
Smither, J., London, M., & Reilly, R. (2005). Does performance improve following
multisource feedback? A theoretical model, meta-analysis and review of empirical
findings. Personnel Psychology, 58(1), 33-66.
Spillane, J. P. (2005). Distributed Leadership. The Educational Forum, 69(2), 143-
150. Retrieved from ProQuest Education Journals. (Document ID 784756091)
Spillane, J. P., Halverson, R., & Diamond, J. (2001). Investigating School Leadership
Practice: A Distributed Perspective. Educational Researcher, 30(3), 23-28.
St. Germain, L., & Quinn, D. M. (2005). Investigation of tacit knowledge in principal
leadership. The Educational Forum, 70(1), 75-90.
Stronge, J. (2007). Qualities of effective teachers (2nd ed.). Alexandria, VA:
Association for Supervision and Curriculum Development.
Supovitz, J., & Buckley, P. (March 2008). The practice and process of instructional
leadership. Paper presented at the American Educational Research Association,
New York. Retrieved from http://www.cpre.org/images/stories/cpre_pdfs
/aera2008_supovitz_buckley.pdf

196
Thomas, D., Holdaway, E., & Ward, K. (2000). Policies and practices involved in the
evaluation of school principals. Journal of Personnel Evaluation in Education,
14(3), 215-240.
Toll, C. A. (2010, June). Six steps to learning leadership. The Journal of the National
Staff Development Council, 31(3), 50-56.
U.S. Department of Education, National Center for Education Evaluation and Regional
Assistance. (2008). Turning around chronically low-performing schools. Institute
of Education Sciences (NCEE 2008-4020). Retrieved from http://ies.ed.gov
/ncee/wwc/pdf/practiceguides/Turnaround_pg_04181.pdf
U.S. Department of Education, National Center for Education Statistics. (2008). Career
and technical education in the United States 1990 to 2005: Statistical analysis
report. (NCES 2008-035). Retrieved from http://nces.ed.gov/pubs2008
/2008035.pdf
U.S. Department of Education, National Center for Education Statistics. (2010). The
condition of education. Retrieved August 15, 2010, from http://nces.ed.gov
/programs/coe/2010/section2/indicator13.asp
U.S. Department of Education, Office of Elementary and Secondary Education (2009).
Race to the top fund. Retrieved October 4, 2010, from http://www2.ed.gov
/programs/racetothetop/index.html
Urdan, T. C. (2005). Statistics in plain English. Mahwah, NJ: Lawrence Erlbaum
Associates, Inc.

197
Valentine, J. (1986, October). Performance/outcome based principal evaluation: A
summary of procedural consideration. Paper presented at the National Middle
School Association Annual Convention, Atlanta, GA.
Wahlstrom, K., Seashore-Louis, K., Leithwood, K., & Anderson, S. (2010). Executive
summary of research findings: Investigating the links to improved student
learning. Learning from Leadership Project. Wallace Foundation. Retrieved from
http://www.wallacefoundation.org/KnowledgeCenter/knowledgeTopics/CurrentAr
easofFocus/EducationLeadership/Documents/Learning-from-Leadership-
Investigating-Links-Final-Report.pdf
Waters, T., Marzano, R. J., & McNulty, B. A. (2003). Balanced leadership: What 30
years of research tells us about the effect of leadership on student achievement. (A
Working Paper). Retrieved from ERIC database. (ED481972)
Witziers, B., Bosker, R. J., & Kruger, M. L. (2003). Educational leadership and student
achievement: The illusive search for an association. Educational Administration
Quarterly, 39(3), 398-425.
Wright, S., Horn, S., & Sanders, W. (1997). Teacher and classroom context effects on
student achievement: Implications for teacher evaluation. Journal of Personnel
Evaluation in Education, 11, 57-67.
Zigarelli, M. (1996). An empirical test of conclusions from effective schools research.
Journal of Educational Research, 90(2), 103-110.

198
Ma
ry E
. Ro
dm
an
3
8 S
kylin
e D
rive
, Me
ch
an
icsb
urg
, PA
17
050
m
er2
65@
psu
.ed
u
4
12
.55
4.1
753
Appendix A
Letter of Invitation
Dear Career and Technical Education School Director:
Leadership is second only to teaching in influencing student learning. In
addition, leadership has the greatest impact in schools that have the greatest
needs.
Career and technical administrators are under great pressure to increase the
academic achievement of their students. Our career and technical education
students consistently perform below non-career and technical education students
on standardized achievement tests. The chart on page 2 illustrates the
performance of career and technical education students and non-career and
technical education students on the 2009 Pennsylvania School of School
Assessment.
Learning-centered leadership consists of six core components and six key
processes that have been demonstrated through research to have a positive
influence on student learning.
The core components are
High standards for student learning,
Rigorous curriculum,
Quality instruction,
Culture of learning and professional behavior,
Connections to external communities,
Systemic performance accountability.
The key processes are the means through which the core components are created
and delivered. They key processes are
Planning,
Implementing,
Supporting,
Advocating,
Communicating,
Monitoring.
The core components and key processes form the basis of the Vanderbilt
Assessment of Leadership in Education, a very new commercially available valid
and reliable assessment instrument. It sells for $360 per principal. Through
your participation in this study, this reliable and valid $360 assessment will be
provided free of charge to your instructional leader.

199
March 3, 2011
Page 2
Your instructional leader will receive a detailed report of the triangulated data about the
extent of his or her leadership skills. This information may be used by the instructional
leader to focus professional education experiences to create a positive influence on
student learning. In addition, you will receive a copy of the complete report that details
the aggregated data on learning-centered leadership in career and technical education
schools in Pennsylvania.
I am asking you to be a part of this research study. It will involve less than one hour of
time for you, your instructional leader, and your teachers to complete an on-line
questionnaire in the comfort of your school on a day and time of your convenience
between April and May 2011. The average time to complete the survey is 20 to 25
minutes.
For my doctoral study through The Pennsylvania State University, I am studying
leadership in career and technical education schools. My research questions are
1. To what extent, if any, do instructional leaders in career and technical education
schools
demonstrate learning-centered leadership?
2. To what extent, if any, do the learning-centered leadership skills of instructional
leaders in
career and technical education schools differ from the national norm?
3. To what extent, if any, do the perceptions of learning-centered leadership skills differ
among teachers, instructional leaders, and supervisors of instructional leaders?
4. To what extent, if any, is there an association between specific learning-centered
leadership skills and student achievement on NOCTI?
If you are willing to participate in this important research, please complete the enclosed
authorization form and return it to me by email ([email protected]) or in the self-
addressed envelope provided for that purpose. More detailed information will be
provided to you after I receive your authorization form to participate. I sincerely
appreciate your cooperation with this study.
Sincerely,
Mary E. Rodman

200
0 10 20 30 40 50 60 70
Career and Technical Students
Non-Career and Technical Students
Reading
Math
Non-CTE students n = 135,137 (approximately) CTE students
Figure 1 Comparison of the Percentage of 2008-2009 Grade 11 Career and Technical
Education Students to All Students Who Scored Proficient and Advanced Proficient on the
PSSA

201
Appendix B
Email Recruitment Information
A Study of Leadership in Career and Technical Education Schools
Mary Rodman, [email protected]
As a part-time career and technical education school, you are being asked to participate in
a study of learning-centered leadership in career and technical education schools in the
Commonwealth of Pennsylvania being conducted by Mary Rodman, doctoral candidate,
through The Pennsylvania State University. Your participation in this study is voluntary.
Your decision not to participate will not result in any loss of benefits to you.
Learning-centered leadership is the description given to six core components (what
instructional leaders do) and key processes (how instructional leaders bring about the
core components) that research has demonstrated to have a positive influence on student
learning. The core components are high standards for student learning, rigorous
curriculum, quality instruction, culture of learning and professional behavior, connections
to external communities, and systemic performance accountability. The key processes
are planning, implementing, supporting, advocating, communicating, and monitoring.
The study involves administration of an on-line survey instrument about the instructional
leadership that exists in your school. The survey is a 360-degree instrument, meaning
that the instructional leader completes the survey about him or herself; the instructional
leader’s supervisor completes the survey about the instructional leader; and the teachers
supervised by the instructional leader complete the same survey. The responses of the
teachers are confidential. Because there is only one instructional leader and one
supervisor per school, the responses of the instructional leader about him or herself and
the responses of the supervisor will be obvious to the instructional leader who receives
the only copy of the individualized report. As the instructional leader, you may choose
not to participate. As the supervisor of the instructional leader, you may choose not to
participate. As a teacher, you may choose not to participate. This survey will be
conducted in 16 schools and 1 pilot site in Pennsylvania. In order for your school to
participate, the director, instructional leader, and the supervisor of the instructional leader
must all choose to participate. Teachers will voluntarily participate by attending a
voluntary faculty meeting after receiving the Notice of Participation.
The survey instrument takes less than one hour to complete. The average time to
complete the survey is 20-25 minutes.
The data used for the research study will not identify specific schools or specific
instructional leaders. A detailed report for your school’s instructional leader will be
provided only to the instructional leader. It is the decision of the instructional leader to
share the report. The data used in the research study will detail the results from the 16
schools in this study. Information about any one school or one instructional leader will
not be reported.

202
I will send to you via email, provide to you in person, or mail through US mail a copy of
the Participation Form. The Participation Form allows your site to be used to collect the
data. Also included will be the instructions to be read at the time of the survey
administration. Informed Consent Form for the instructional leader; the informed consent
for the supervisor of the instructional leader; the Implied Consent Form for the teachers,
whose responses will be confidential; an Overview of the Vanderbilt Assessment of
Leadership in Education (VAL-ED); a summary of the psychometrics for the VAL-ED;
a sample report for the instructional leader, which will be provided only to the
instructional leader; a visual representation of the study; and the study abstract. It is
expected that the survey will be conducted in late April or May, if the Participation Form,
and two Informed Consent Forms (one from the instructional leader and one from the
supervisor of the instructional leader) are returned to me.
In order for your school to participate, your director must allow the participants to use the
school site to administer the survey. In addition, the instructional leader and the
supervisor of the instructional leader must both choose to participate. If your school
participates, your school will receive a copy of the full study detailing the aggregated
data. If the instructional leader chooses to participate, he or she will receive a detailed
report that may provide the basis for professional education activities that have a direct
impact upon student learning. The results of this study may also serve as the basis for a
Pennsylvania Inspired Leader program for career and technical education school
administrators.
You may complete the survey between now and June 15, 2011.

203
Appendix C
Consent to Participate in the Study of Leadership in Career and Technical Education Schools
As the Administrative or Executive Director for my school system, I agree to participate in the
Study of Leadership in Career and Technical Education Schools conducted by Mary Rodman,
researcher, through Pennsylvania State University and to invite the school’s teachers and
instructional leader to complete the web-based survey on the school premises.
Signature _________________________________________________________
Print Name Date
School Name
Administrative Director
Contact Phone for Administrative Director
Address
Administrative/Executive Director’s Email Address
The instructional leader is defined as the person who directly supervises teachers.
Instructional Leader’s Name
□Female □Male
Instructional Leader’s Job Title: □Principal □Supervisor □Assistant Director □Other*
*If Other, print position name here
Contact Phone for Instructional Leader
Instructional Leader’s Email Address
Instructional Leader’s Supervisor’s Name
Supervisor’s Email Address
Number of Teachers Supervised by the Instructional Leader
204
Appendix D
Informed Consent Form for Social Science Research- Instructional
Leader
The Pennsylvania State University
Title of Project: A Study of Leadership in Career and Technical Education
Principal Investigator: Mary E. Rodman, [email protected]
38 Skyline Drive, Mechanicsburg, PA 17050
412.554.1753
Advisor: Richard A. Walter, [email protected]
301A Keller Building, University Park, PA
814.865.2133
1. Purpose of the Study: The purposes of this research study are to investigate (1) the extent of learning-centered leadership skills in selected area career and technical education schools; (2)
the extent of differences in leadership skills from the national norm; (3) the extent of
differences in perceptions of leadership skills among instructional leaders, teachers, and supervisors; and (3) an association, if any, of leadership with student performance on NOCTI.
The survey will be conducted using a commercially prepared instrument, the Vanderbilt
Assessment of Leadership in Education (VAL-ED). Sixteen schools will be recruited to
participate.
2. Procedures to be followed: You will be asked to complete a 72-item on-line questionnaire about yourself as the instructional leader in your building. The instructional leader is defined
as the person in your school system that directly supervises teachers. Your supervisor and
the teachers you supervise will be asked to complete the same 72-item on-line questionnaire about you. Only you will receive a detailed report of the aggregated data from your school.
For the purpose of the research study, only aggregated data will be used. Individual schools
will not be identified in the study, nor will individual school data be reported. Individually identifiable information about you will not be provided about you.
3. Duration/Time: It is expected that you will complete the questionnaire in one session of less
than 60 minutes. Average response time is 20-25 minutes.
4. Benefits: If you are the instructional, the benefits to you include access to the summary
report from your school that indicates the perceptions of the teachers and your supervisor of
the learning-centered leadership skills you demonstrate in your school. The benefits to the career and technical education community include providing insight about the learning-

205
centered leadership in career and technical education schools and highlighting areas in which
additional professional education may produce positive outcomes related to student achievement.
5. Statement of Confidentiality: Because there is only one supervisor and only one
instructional leader per school, the supervisor’s responses and your own responses will be obvious to you. Data reported by the teachers will be aggregated and not individually
identifiable. The data will be stored and secured in Nashville, TN, in a password-protected
file on a server monitored daily for security purposes. In the event of a publication or presentation resulting from the research, no personally identifiable or school identifiable
information will be shared.
Participants will be provided with an entry access code that will be associated with a specific
instructional leader. Entry codes will not be individually assigned to or associated with the
respondent. Aggregated data about the instructional leader will only be provided to the
instructional leader. Aggregated data from all of the schools participating in this study (about
16 schools) will be used by the researcher for the purpose of this study. No individually
identifiable information will be used in the research study results. Summary data only will be
used.
6. On-line internet survey: Your confidentiality will be maintained to the degree permitted by the technology being used. No guarantees can be made regarding the interception of data sent
via the Internet by any third parties.
7. Right to Ask Questions: Please contact Mary Rodman at 412.554.1753 with questions,
complaints or concerns about this research.
8. Voluntary Participation: Your decision to be in this research is voluntary. You can stop at any time. You do not have to answer any questions you do not want to answer. Refusal to
take part in or withdrawing from this study will involve no penalty or loss of benefits you
would receive otherwise. You must be 18 years of age or older to consent to take part in this research study. If you agree to
take part in this research study and the information outlined above, please sign your name and
indicate the date below.
Please keep a copy of this form for your records or future reference.
__________________________________________________ __________________
Instructional Leader’s Signature Date
(Please print your name here) ______________________________________________________
___________________________________________________ __________________
Signature of Researcher Date

206
Appendix E
Informed Consent Form for Social Science Research – Supervisor
The Pennsylvania State University
Title of Project: A Study of Leadership in Career and Technical Education
Principal Investigator: Mary E. Rodman, [email protected]
38 Skyline Drive, Mechanicsburg, PA 17050
412.554.1753
Advisor: Richard A. Walter, [email protected]
301A Keller Building, University Park, PA
814.865.2133
1. Purpose of the Study: The purposes of this research study are to investigate (1) the
extent of learning-centered leadership skills in selected area career and technical
education schools; (2) the extent of differences in leadership skills from the national
norm; (3) the extent of differences in perceptions of leadership skills among instructional
leaders, teachers, and supervisors; and (3) an association, if any, of leadership with
student performance on NOCTI. The survey will be conducted using a commercially
prepared instrument, the Vanderbilt Assessment of Leadership in Education (VAL-ED).
Sixteen schools will be recruited to participate.
2. Procedures to be followed: As the supervisor of the instructional leader, you will be
asked to complete a 72-item on-line questionnaire about the instructional leader in your
building. The instructional leader is defined as the person in your school system that
directly supervises teachers. Only the instructional leader will receive a detailed report of
the aggregated data from your school. For the purpose of the research study, only
aggregated data will be used. Individual schools will not be identified in the study, nor
will individual school data be reported.
3. Duration/Time: It is expected that you will complete the questionnaire in one session of
less than 60 minutes. Average response time is 20-25 minutes.
4. Benefits: As the supervisor of the instructional leader, the benefits to you include
providing valuable feedback to your instructional leader about leadership skills that have
an influence on student learning. The benefits to the career and technical education
community include providing insight about the learning-centered leadership in career and

207
technical education schools and highlighting areas in which additional professional
education may produce positive outcomes related to student learning.
5. Statement of Confidentiality: Because there is only one supervisor and only one
instructional leader per school, your responses to the instructional leader will be obvious.
The data will be stored and secured at Discovery Education, Nashville, TN, in a
password-protected file on a server monitored daily for security purposes. In the event of
a publication or presentation resulting from the research, no personally identifiable or
school identifiable information will be shared. You will be provided with an entry access
code that will be associated with your school’s instructional leader. Your response and
aggregated data from the teachers about the instructional leader will only be provided to
the instructional leader. Aggregated data from all of the schools and schools’
instructional leaders and supervisors participating in this study (about 16 schools) will be
used by the researcher for the purpose of this study. No individually identifiable
information will be used in the research study results. Summary data only will be used.
6. On-line internet survey: Your confidentiality will be maintained to the degree
permitted by the technology being used. No guarantees can be made regarding the
interception of data sent via the Internet by any third parties.
7. Right to Ask Questions: Please contact Mary Rodman at 412.554.1753 with questions,
complaints or concerns about this research.
8. Voluntary Participation: Your decision to be in this research is voluntary. You can stop
at any time. You do not have to answer any questions you do not want to answer. Refusal
to take part in or withdrawing from this study will involve no penalty or loss of benefits
you would receive otherwise.
You must be 18 years of age or older to consent to take part in this research study. If you agree to
take part in this research study and the information outlined above, please sign your name and
indicate the date below.
Please keep this form for your records or future reference.
_____________________________________________________ ________________
Supervisor’s Signature Date
(Please print your name here)
______________________________________________________ ________________
Signature of Researcher Date

208
Appendix F
Notice of Participation
A Study of Leadership in Career and Technical Education Schools
Mary Rodman, [email protected]
As a teacher in __________________________________[school name], you are being
asked to participate in a statewide study of instructional leadership in career and technical
education schools conducted by Mary Rodman, doctoral student, at The Pennsylvania
State University.
The study will take less than one hour of your time. It will be conducted on-site at your
school on ________________________________[date] at __________[time]. Your
participation is voluntary. Should you choose not to participate, you will lose no
benefits or suffer any penalty.
Your participation in this study may assist the instructional leader in your building
____________________________ [name] to participate in professional education
activities that have an influence on student learning. Your participation may also assist in
the development of Pennsylvania Inspired Leaders (PIL) programs that have an influence
on student achievement.
We appreciate your participation in this study.
209
Implied Consent Form for Social Science Research - Teachers
The Pennsylvania State University
Title of Project: A Study of Leadership in Career and
Technical Education
Principal Investigator: Mary E. Rodman, [email protected]
38 Skyline Drive, Mechanicsburg, PA 17050
412.554.1753
Advisor: Richard A. Walter, [email protected]
301A Keller Building, University Park, PA
814.865.2133
1. Purpose of the Study: The purposes of this research study are to investigate (1) the extent of
learning-centered leadership skills in selected area career and technical education schools; (2)
the extent of differences in leadership skills from the national norm; (3) the extent of
differences in perceptions of leadership skills among instructional leaders, teachers, and supervisors; and (3) an association, if any, of leadership with student performance on NOCTI.
The survey will be conducted using a commercially prepared instrument, the Vanderbilt
Assessment of Leadership in Education (VAL-ED). Sixteen schools will be recruited to
participate.
2. Procedures to be followed: You will be asked to complete a 72-item on-line questionnaire
about the instructional leader in your building. The instructional leader is defined as the person in your school system that directly supervises teachers. Your responses will be
anonymous. Only the instructional leader in your school will receive a detailed report of the
aggregated data from your school. For the purpose of the research study, only aggregated data will be used. Individual schools will not be identified in the study, nor will individual
school data be reported.
Individual responses from teachers will not be identified in any way.
3. Discomforts and Risks: There are no risks in participating in this research beyond those
experienced in everyday life. All of the questions relate to behaviors of the instructional
leader. You may experience emotional discomfort in providing anonymous feedback to the instructional leader with whom you work. The data you provide to the instructional leader
will be aggregated in the report. No personally identifiable data about teachers will be
recorded.
4. Benefits: The benefits to you include providing your school’s instructional leader with your
perceptions of the extent of his or her leadership skills that research has shown to have a
positive influence student achievement. This will allow the instructional leader in your school the opportunity to focus professional education on those activities that lead to
attainment of these leadership skills. The benefits to the career and technical education
community include providing insight about the learning-centered leadership in career and technical education schools and highlighting areas in which additional professional education
for instructional leaders may produce positive outcomes related to student achievement.
Appendix G

210
5. Duration/Time: It is expected that you will complete the questionnaire in one session of less
than 60 minutes during normal workday hours between 7:30am and 4:00pm. Average response time is 20-25 minutes.
6. Statement of Confidentiality: Teachers’ participation in this research is confidential. The
data will be aggregated by group (teachers, instructional leader, and supervisor). Because there is only one supervisor and only one instructional leader per school, the supervisor’s
responses and the instructional leader’s responses about his or her own performance will be
obvious to the instructional leader. The data will be stored and secured at Discovery Education in Nashville, TN, in a password-protected file on a server monitored daily for
security purposes. The Pennsylvania State University’s Office for Research Protections, the
Institutional Review Board and the Office for Human Research Protections in the Department of Health and Human Services may review records related to this research study. In the event
of a publication or presentation resulting from the research, no personally identifiable or
school identifiable information will be shared.
Participants will be provided with an entry code and password that will be associated with a
specific instructional leader’s identification number. Entry codes will not be assigned to or
associated with specific teachers. Only aggregated data about the instructional leader will be provided to the instructional leader. Aggregated data will be used by the researcher for the
purpose of this study. No individually identifiable information will be used in the research
study results. Summary data only will be used.
7. On-line internet survey: Your confidentiality will be maintained to the degree permitted by
the technology being used. No guarantees can be made regarding the interception of data sent
via the Internet by any third parties.
8. Right to Ask Questions: Please contact Mary Rodman at 412.554.1753 with questions,
complaints or concerns about this research. You can also call this number if you feel this study has harmed you. If you have any questions, concerns, problems about your rights as a
research participant or would like to offer input, please contact The Pennsylvania State
University’s Office for Research Protections (ORP) at (814) 865-1775. The ORP cannot
answer questions about research procedures. Questions about research procedures can be answered by the researcher.
9. Voluntary Participation: Your decision to be in this research is voluntary. You can stop at any time. You do not have to answer any questions you do not want to answer. Refusal to
take part in or withdrawing from this study will involve no penalty or loss of benefits you
would receive otherwise.
You must be 18 years of age or older to consent to take part in this research study.
Completion and return of the survey implies that you have read the information in this form and
consent to take part in the research.
Please keep this form for your records or future reference.

211
Dear VAL-ED Customer:
Thank you for your partnership with Discovery Education Assessment (DEA) through the use of the Vanderbilt Assessment for Leadership in Education (VAL-ED). Demand for VAL-ED has grown across the nation as states and districts utilize this instrument for both formative and summative purposes to develop and support learning-centered leaders. I am pleased to share several new updates regarding VAL-ED.
Based on feedback from the field on how to make the program more effective, the VAL-ED authors have completed studies that show the reliability and validity of the results from the instrument are in no way compromised when teachers answer only half of the 72 items (half of the teachers in the school answering one half of the 72 items and the other half of the teachers answering the other half of the items). The instrument has been changed, and as of April 1, 2011, all new VAL-ED activations will have 36 questions for teacher respondents, which will nearly halve the time for teachers to complete the survey. Other respondent groups--principal and supervisor--will remain with 72 questions because the reliability of their survey with only one respondent would be negatively affected by reducing the number of questions.
In the past year, DEA has launched comprehensive VAL-ED implementation training to support districts in their roll-out of the VAL-ED instrument. Please click here to learn more about the VAL-ED implementation training resources available from Discovery Education. In addition to the implementation training available, Discovery now offers free modules on the VAL-ED tool to all customers to help better understand the instrument and to assist districts in the set-up and administration of their surveys. You can find these modules in the Help Tab at valed.discoveryeducation.com. If you have misplaced your VAL-ED log-in information, please contact DEA customer support at 1-866-814-6685, option 2.
My team and I look forward to our continued work together to support your district's principal leadership efforts. Please contact our customer support team by email at [email protected] or by phone if we can answer any questions and/or provide any additional information. Thank you.
Sincerely,
Appendix H

212
Hardin Daniel, Vice President
Discovery Education Assessment
This email was sent to: [email protected]
This email was sent by: Discovery Education
One Discovery Place Silver Spring, MD 20910 USA
We respect your right to privacy - view our policy
Manage Subscriptions | Update Profile | One-Click Unsubscribe

213
Appendix I

214
The Vanderbilt Assessment of Leadership in Education
Considerations for VAL-ED Implementation VAL-ED is a research based instrument that measures the effectiveness of school leaders by
providing a detailed assessment of a principal's perceived performance. The 360º survey is taken
by teachers, principals and administrators to provide comprehensive and constructive feedback to
the principal. The results of the survey provide rich and specific detail of skills and behaviors that the principal can use, as a baseline, to measure continuous improvement.
Recommended Steps/Considerations for VAL-ED Implementation:
Project Management:
1) Select a VAL-ED district coordinator 2) Develop a timeline for the VAL-ED implementation (an illustrative example is listed
below)
3) Discuss VAL-ED implementation training needs with Discovery Education VAL-ED training staff
4) Schedule training dates and secure meeting times and locations
5) Select a teacher leader coordinator at each school site to manage the distribution of survey codes and serve as the lead teacher on VAL-ED for the school. It is highly
recommended that this individual be a respected member of the teaching faculty who is
viewed as fair and impartial
Messaging & Communication:
6) Determine use of VAL-ED Instrument (formative or summative purpose or a combination of both)
7) Determine the messaging for the use of the instrument to district and school staff and
which communication vehicles will be utilized in relaying the information.
8) Determine if the first year of VAL-ED implementation will be used for baseline purposes. If the data collected will be used for baseline purposes, you may consider
relaying that information to principals.
9) In order to stress the district level commitment to the use of the instrument, you may consider a special message or letter from the superintendent or area superintendent(s) to
teachers, the principal and supervisor(s). This is in addition to the template letters to the
survey respondents provided by Discovery Education. 10) Consider the use of district and school communication systems to remind all teachers to
complete their survey.
11) Illustrative Timeline* *for a new VAL-ED district with purchase up to 50 VAL-ED licenses
Appendix J
215
Implementation trainings are listed in bold. Please see Implementation Training Overview for a
full description of each of the trainings. PLEASE NOTE: The VAL-ED Authors recommend that teachers have a minimum of three months working with the principal before the survey is
administered.
Month One Prepare and Organize Training for district staff and coordinators One Day In-Person Training
Month One Select teacher coordinator in each school
Month One Letters sent to teachers, principal and supervisor(s) Month Two Principal Implement Training (25 principals)
One Day In-Person Training
Month Two Teacher Coordinator Implement Training (25 teacher coordinators)
One Day In-Person Training
Month Two Survey administration for all school teachers
Month Three Analyze Training for district staff One Day In-Person Training
Month Three Discussions with principals
Month Three Discussions on individual and district-wide professional development opportunities
Following months Implement professional development
VAL-ED Resources
Download sample VAL-ED reports and surveys at DiscoveryEducation.com/VAL-ED.
Additional information and resources on VAL-ED are available in the VAL-ED user site
(valed.discoveryeducation.com), the VAL-ED User’s Guide, and the VAL-ED Handbook.
Please visit the Help Tab in the valed.discoveryeducation.com site for videos on key features on
the VAL-ED instrument and “How To” guides.
For research studies and journal articles on VAL-ED, please visit www.valed.com.
For suggestions on professional development providers for principals which align leadership
trainings to the VAL-ED core components and key processes, please contact Joni Henderson at 240.662.6737 or [email protected].
Contacts
For VAL-ED sales inquiries, please contact Discovery Education Assessment – the exclusive
distributor of VAL-ED - at 1.866.814.6685
For information or questions regarding set-up, login or report information, please contact
VAL-ED Customer Service at 1.866.814.6685
For VAL-ED Implementation Training, please contact Donna Neblett at 731.885.2334 or
216
Email Communication from Hardin Daniel, Vice President of Assessment Sales and Development concerning confidentiality and security.
· How is the confidentiality of the principal, principal’s supervisor, and teachers
maintained? (Is it stored by email address only, for example?)
We provide codes that are used to access the survey. We can track responses back to codes but we never gather identifying information for the survey takers except for the principal's
name. The program administrator distributes the codes to the respondents and so the
confidentiality at that level resides in the hands of the customer.
· How is the individual electronic assessment data protected and secured on the servers
housing the data? Where is the server and is it password protected?
Security is maintained on Discovery Communication (parent company of Discovery Education
Assessment and Discovery Channel) servers that feature multi-tiered security, network monitoring and protection on a 24 hr./7 day/week schedule. Using the latest technology for
monitoring security, traffic volumes and hardware, they provide a dependable load balanced
service to our school customers. Security on individual server hosts is provided by a multi-tiered level of password protection with users defined as to their privileges, maximizing the security of
program functions.
All Discovery Education Assessment work is performed on these same servers housed in
redundant locations. This increases the probability that any breach of the security system would
be detected by employees as they go about their daily tasks. Social and work engineered security
may be the best security of all.
Discovery Education is more than an assessment company, more than a provider of instructional
resources. Discovery Communications Inc. has experience with server and data security. The Discovery Communication web-based stores (The Discovery Teacher Store and The Discovery
Channel Store have utilized these servers and security systems with credit card and membership
transactions for years without breach. These same security systems that protect school information also protect Discovery Channel and related media based intellectual properties.
Computer security is an essential business priority for Discovery Communications Inc.
For how long is the electronic assessment data maintained on the servers?
This is only the second full year maintaining VAL-ED assessment data. Our policy for other assessment services is to maintain customer data indefinitely to provide access for longitudinal
studies. If no longer a customer, our policy is to maintain the data for 5 years.
· What is the process for destroying the electronic assessment data on the servers?
Data is hard deleted from production database, development database and all redundant, backup
databases to ensure data is fully purged from the system.
Discovery Education Assessment, 2416 21st Ave S Suite 300, Nashville, TN 37212
Office: (615) 324-6090, Fax: (615) 383-6158, www.discoveryeducation.com/assessment
Appendix K

217
Mary E. R
od
man
38 Skylin
e D
rive, Mech
anicsb
urg, P
A 17050
mer265@
psu
.edu
412.5
54.1753
Instructions for Completing the
Vanderbilt Assessment of Leadership in Education (VAL-ED)
Thank you for agreeing to participate in this research study of career and technical
education leadership.
The results of questionnaire data from 16 schools will form the basis of the research
required for completion of my doctoral degree. No individually identifiable data will
be collected. Only aggregated data will be used in the study.
The questionnaire should take less than 60 minutes.
Enclosed in this packet are the following items:
Implied Consent Form – Please distribute one implied consent form to each
teacher, instructional leader and supervisor.
VAL-ED Instruction Sheet – This sheet is necessary for the participants to
complete the questionnaire. It includes the address for the website.
Survey ID and Access Code sheet. All survey codes are the same for the
instructional leader in your school; each person has a different Access Code.
(Instructional leader Access Codes begin with a P; Supervisor Access Codes begin
with an S; Teacher Access Codes begin with a T.)
You may stop at any time. You may go back and change any answers. You may
refuse to answer any of the questions. You will not be penalized in any way.
When you have completed the ratings for the 72 leadership behaviors, you have
completed your participation in this study.
Thank you for your participation in this study!
Appendix L

218
Appendix M

219
VAL-ED: Professional Accountability
The Vanderbilt Assessment of Leadership in Education (VAL-ED) is a
researched-based evaluation tool that measures the effectiveness of school leaders by providing a
detailed assessment of a principal's perceived performance. VAL-ED focuses on learning-centered
leadership behaviors that influence teachers, staff, and most importantly, student achievement. VAL-ED is
also a 360° assessment, intended to be taken by not only the principal, but by teachers and the principal’s
supervisor, ensuring that the very best feedback is given to principals.
Measure leadership skills of school principals
Focus on learning-centered leadership behaviors that influence teachers, staff, and student achievement
Interpret against both norm-referenced and standards-referenced criteria
Assess principals against six key processes and six core components
Develop effective leadership for school improvement
Would you like to learn more? Call 800.323.9084
Contact Us Call 866.814.6685 Request a Preview
Copyright © 2011 Discovery Education. All rights reserved.
Discovery Education is a subsidiary of Discovery Communications, LLC.
Ap
pen
dix M
213
Appendix N

217
VITA
Mary E. Rodman
38 Skyline Drive, Mechanicsburg, PA 17050; Ph. 412.554.1753, [email protected]
EDUCATION
The Pennsylvania State University, University Park, PA, Ph.D., May 2012 (anticipated) California University, Charleroi, PA, M. Ed., May 2000
University of Pittsburgh, Pittsburgh, PA, B.S., December 1978
AREAS OF CERTIFICATION
Superintendent Letter of Eligibility, California State University, 2001
Principal, California State University, 1999
Vocational Administrative Director, Indiana University of Pennsylvania, 1993 Supervisor Comprehensive Vocational Education, Indiana University of Pennsylvania, 1992
Teacher – Accounting, Typing, Bus. Law, Shorthand, Cooperative Education, Marketing/DE
EMPLOYMENT HISTORY
Cumberland Perry AVTS, Mechanicsburg, PA, 17050
Administrative Director, October 2002 to August 2012 Eastern Westmoreland Career and Technology Center, Latrobe, PA 15650
Administrative Director, November 1992 to October 2002
School District of Penn Hills, Pittsburgh, PA 15235
Interim Vocational Administrative Director, Student Assistance Program Coordinator, Cooperative Education, Perkins Plan Coordinator, Teacher
February 1978 to October 1992
PRESENTATIONS (Limited to the previous two years)
Response to Pathways to Prosperity, February 2012. Panel presenter at the Pennsylvania
Association of Career and Technical Administrators Symposium, Hershey, PA.
Career and Technical Education: Working for America, November 2011. Presentation given to the Carlisle Sunrise Rotary Club, Carlisle, PA.
Learning-centered Leadership, February 2011. Presentation conducted at Pennsylvania
Association of Career and Technical Administrators Symposium, Hershey Lodge and Convention Center, Hershey, PA.
Walk-throughs: Making it easy, March 2011. Presentation conducted at the Pennsylvania
Association of Career and Technical Education Special Populations Mid-winter Conference, Hershey, PA.
Walk-throughs, July 2010. Presentation conducted at the Pennsylvania Association of Career
and Technical Administrators Summer Seminar, State College, PA.
JOC-PAC and Solicitor Relations, August 2010. Presentation conducted for the New Director’s Workshop, Pennsylvania Inspired Leaders, State College, PA.
Coaching, August 2010. Presentation conducted for the New Director’s Workshop,
Pennsylvania Inspired Leaders program, State College, PA.
PROFESSIONAL ASSOCIATIONS AND MEMBERSHIPS
Pennsylvania Association of Career and Technical Administrators, Association for Career and
Technical Education, Cumberland County Economic Development, West Shore Chamber of Commerce, Rotary Club of Mechanicsburg-North