A Study Of Currency Market Volatility In India During Its ... · PDF fileA Study Of Currency...
17
ISSN: 2348 9510 International Journal Of Core Engineering & Management (IJCEM) Volume 1, Issue 6, September 2014 104 A Study Of Currency Market Volatility In India During Its Pre And Post Derivative Period *Saurabh Singh Assistant Professor, Graduate School of Business, Devi Ahilya Vishwavidyalaya, Indore – 452001 (M.P.) India [email protected] **Dr. L.K Tripathi Coordinator, University Minority Cell, Devi Ahilya Vishwavidyalaya, Indore – 452001 (M.P.) India [email protected] Abstract The paper is aimed at examining the impact of introduction of currency derivatives on exchange rate volatility of Pound. The data used in this paper comprises of daily exchange rate of Pound in terms of Indian rupees for the sample period April 2006 to December 2013. To explore the time series properties Unit Root Test and ARCH LM test have been employed and to study the impact on underlying volatility GARCH (1, 1) model has been employed. The results indicate that the introduction of currency futures trading has helped in reducing the exchange rate volatility of the foreign exchange market in India. Further, the results are also indicative of the fact that the importance of recent
-
Upload
nguyenthien -
Category
Documents
-
view
219 -
download
1
Transcript of A Study Of Currency Market Volatility In India During Its ... · PDF fileA Study Of Currency...

ISSN: 2348 9510
International Journal Of Core Engineering & Management (IJCEM)
Volume 1, Issue 6, September 2014
104
A Study Of Currency Market Volatility In India During Its Pre And
Post Derivative Period
*Saurabh Singh
Assistant Professor,
Graduate School of Business,
Devi Ahilya Vishwavidyalaya, Indore – 452001 (M.P.) India
**Dr. L.K Tripathi
Coordinator,
University Minority Cell,
Devi Ahilya Vishwavidyalaya, Indore – 452001 (M.P.) India
Abstract
The paper is aimed at examining the impact of introduction of currency derivatives on
exchange rate volatility of Pound. The data used in this paper comprises of daily
exchange rate of Pound in terms of Indian rupees for the sample period April 2006 to
December 2013. To explore the time series properties Unit Root Test and ARCH LM test
have been employed and to study the impact on underlying volatility GARCH (1, 1)
model has been employed. The results indicate that the introduction of currency futures
trading has helped in reducing the exchange rate volatility of the foreign exchange market
in India. Further, the results are also indicative of the fact that the importance of recent

ISSN: 2348 9510
International Journal Of Core Engineering & Management (IJCEM)
Volume 1, Issue 6, September 2014
105
news on spot market volatility has decreased and the persistence effect of old news has
declined with the introduction of currency futures trading.
Keywords: Currency Futures, Exchange Rate, Forex Market, GARCH, Volatility.
Introduction
During the early 1990s, India entered on a series of structural reforms in the foreign
exchange market. The movement away from pegged exchange rate regime to partially
floated in 1992 and fully floated in 1993 was influential in developing a market-
determined exchange rate of the rupee and was a significant step in the progress towards
total current account convertibility.
In order to advance Indian foreign exchange market to international standards, a well
developed foreign exchange derivative market was essential which started in 2008.
The exchange rate policy does not aim at a fixed target or a pre-announced target or a
band but is supported by the ability of Reserve Bank to interfere in the markets, if and
when necessary, only to smoothen any unnecessary volatilities or disorderly market
behavior, while allowing the underlying demand and supply conditions to determine the
exchange rate movements over a period in an orderly manner.
Currency futures trading in INR-USD started on August 29, 2008, till January 2010,
exchange rate futures was available only for INR-USD. Exchange-traded currency
futures have now been expanded to the Euro, Pound and Yen pairing. At the time of
introduction of currency futures in India, it was thought that the currency futures market
in India would make a prominent contribution towards improving the list of options
available for currency risk management.
International experience of the emerging markets with the introduction of currency
futures is a mixed one. In several cases, the volatility is found to be reduced following the
constitution of currency futures market, though empirical evidence to the contrary also
exists. The transaction volumes in currency futures in these countries have remained too
small to put any significant upward pressure on exchange rate volatility. Also, there is no

ISSN: 2348 9510
International Journal Of Core Engineering & Management (IJCEM)
Volume 1, Issue 6, September 2014
106
clear evidence to prove that futures contracts traded on exchanges result in increased
volatility in the prices for the underlying commodity. In the light of the above, it will be
interesting to observe and analyze the effect of introduction of currency futures on spot
market for exchange rate. This research looks into this aspect and attempts to find out
whether introduction of currency futures and currency future trading activity in INR-GBP
has increased due to the volatility in spot market or not.
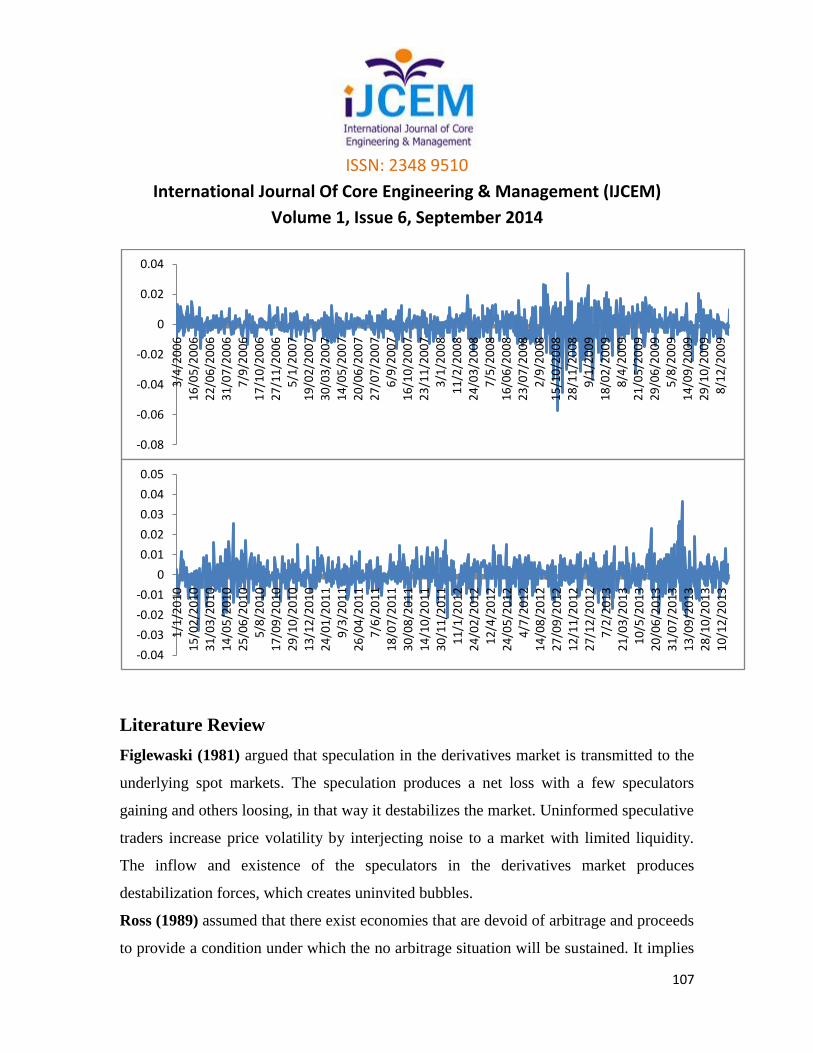
The fig-1 below shows the volatility of Pound Log Return over the period 2006-2009 and
2010-2013 respectively
Fig. 1
ISSN: 2348 9510
International Journal Of Core Engineering & Management (IJCEM)
Volume 1, Issue 6, September 2014
107
Literature Review
Figlewaski (1981) argued that speculation in the derivatives market is transmitted to the
underlying spot markets. The speculation produces a net loss with a few speculators
gaining and others loosing, in that way it destabilizes the market. Uninformed speculative
traders increase price volatility by interjecting noise to a market with limited liquidity.
The inflow and existence of the speculators in the derivatives market produces
destabilization forces, which creates uninvited bubbles.
Ross (1989) assumed that there exist economies that are devoid of arbitrage and proceeds
to provide a condition under which the no arbitrage situation will be sustained. It implies
-0.08
-0.06
-0.04
-0.02
0
0.02
0.04
3/4
/20
06
16
/05
/20
06
22
/06
/20
06
31
/07
/20
06
7/9
/20
06
17
/10
/20
06
27
/11
/20
06
5/1
/20
07
19
/02
/20
07
30
/03
/20
07
14
/05
/20
07
20
/06
/20
07
27
/07
/20
07
6/9
/20
07
16
/10
/20
07
23
/11
/20
07
3/1
/20
08
11
/2/2
00
82
4/0
3/2
00
87
/5/2
00
81
6/0
6/2
00
82
3/0
7/2
00
82
/9/2
00
81
5/1
0/2
00
82
8/1
1/2
00
89
/1/2
00
91
8/0
2/2
00
98
/4/2
00
92
1/0
5/2
00
92
9/0
6/2
00
95
/8/2
00
91
4/0
9/2
00
92
9/1
0/2
00
98
/12
/20
09
-0.04
-0.03
-0.02
-0.01
0
0.01
0.02
0.03
0.04
0.05
1/1
/20
10
15
/02
/20
10
31
/03
/20
10
14
/05
/20
10
25
/06
/20
10
5/8
/20
10
17
/09
/20
10
29
/10
/20
10
13
/12
/20
10
24
/01
/20
11
9/3
/20
11
26
/04
/20
11
7/6
/20
11
18
/07
/20
11
30
/08
/20
11
14
/10
/20
11
30
/11
/20
11
11
/1/2
01
22
4/0
2/2
01
21
2/4
/20
12
24
/05
/20
12
4/7
/20
12
14
/08
/20
12
27
/09
/20
12
12
/11
/20
12
27
/12
/20
12
7/2
/20
13
21
/03
/20
13
10
/5/2
01
32
0/0
6/2
01
33
1/0
7/2
01
31
3/0
9/2
01
32
8/1
0/2
01
31
0/1
2/2
01
3

ISSN: 2348 9510
International Journal Of Core Engineering & Management (IJCEM)
Volume 1, Issue 6, September 2014
108
that the variance of the price change will be equal to the rate of information flow. The
implication of this is that the volatility of the asset price will increase as the rate of
information flow increases. Thus, if derivatives market increases the flow of information,
the volatility of the spot price must change in the absence of arbitrage opportunity.
In contrast, Danthine (1978) argued that the futures markets improved market depth and
reduced volatility because the cost to informed traders of responding to mispricing is
reduced.
Kumar and Seppi (1992) and Jarrow (1992) studied the impact of currency derivatives
on spot market volatility and found that speculative trading executed by big players in the
derivatives market increases the volatility in the spot exchange rate. Hence, currency
futures trading increases the spot market volatility.
Glen and Jorion (1993) examined the utility of currency futures/forwards and concluded
that currency risk can be minimized through futures/forward hedging.
Chatrath, Ramchander and Song (1996) analyzed the impact of currency futures
trading on spot exchange rate volatility by establishing relationship between level of
currency futures trading and the volatility in the spot rates of the British pound, Japanese
yen, Canadian dollar, Deutsche mark and Swiss franc. They concluded that there exists a
causal relationship between currency futures trading volume and exchange rate volatility
and also found that the trading activity in currency futures has a positive impact on
conditional volatility in the exchange rate changes. Further, futures trading activity has
declined on the day following increased volatility in spot exchange rates.
Shastri, Sultan and Tandon (1996) investigated the effect of the introduction of options
on the volatility of currency markets and concluded that options contracts complete and
stabilize the spot currency markets.
Jochum and Kodres (1998) examined the impact of the introduction of the futures
market to the spot currency markets, and report varying results depending on the market

ISSN: 2348 9510
International Journal Of Core Engineering & Management (IJCEM)
Volume 1, Issue 6, September 2014
109
they studied. For Mexico, they find that the introduction of currency futures help reduce
the volatility of the spot currency market, while for Hungary and Brazil, they find no
discernible impacts.
Adrangi and Chatrath (1998) determined the impact of currency futures commitments
and found that the overall growth in currency futures commitments has not caused
exchange rates to be more volatile. However, increase in the participation of large
speculators and small traders do destabilize the markets.
Butterworth (2000) also argued that introduction of the derivative trading leads to more
complete market enhancing the information flow. Derivatives market allows for new
positions and extended investment sets and enables to take position at lower cost.
Derivatives trading bring more information to the market and allows for quicker
disseminations of the information. The transfer of the speculative activity from spot to
futures market decreases the spot market volatility.
Bologna and Cavallo (2002) argued that the speculation in the derivatives market also
leads to stabilization of the spot prices. Since derivatives are characterized by high degree
informational efficiency, the effect of the stabilization permits to the spot market. The
profitable speculation stabilizes the spot price because informed speculators tend to buy
when the price is low pushing it up and sell when the price is high causing it to fall.
These opposing forces constantly check the price swings and guide the price towards to
the mean level. Uninformed speculators are not successful and are eliminated from the
market. This profitable speculation in the derivatives market leads to a decrease in spot
price volatility.
The abovementioned fact has provided impetus to explore the influence of currency
derivatives in the context of emerging markets which in turn, necessitates further

ISSN: 2348 9510
International Journal Of Core Engineering & Management (IJCEM)
Volume 1, Issue 6, September 2014
110
empirical investigation on the impact of currency futures trading on spot exchange rate
volatility.
Objectives of the study
The study has been made to fulfill the following objectives:
1. The estimate the level of volatility prevailing in the Indian currency market.
2. To examine whether volatility is stationary or it has changed over time.
3. To examine whether the introduction of derivatives been really successful in
reducing the volatility in the currency market.
Hypotheses of the Study
H01: there is no volatility in the Indian Currency Market.
H02: there is no significant change in level of currency market volatility after introduction
of derivatives.
H03: derivatives introduction has not been successful in reducing the volatility.
Methodology and Techniques
The methodology used in the study of volatility is briefly described on the following
points:
i. Data and Sample
ii. Normality Test of the Data
iii. Stationarity Test on the Data
iv. Presence of Heteroscedasticity Test

ISSN: 2348 9510
International Journal Of Core Engineering & Management (IJCEM)
Volume 1, Issue 6, September 2014
111
v. Development of Volatility Models for Estimation of Volatility
Data Collection
The historical currency values time series data have been collected from the official
website of Reserve Bank of India i.e. www.rbi.org.in . Daily closing currency values will
be used to find the impact of derivatives trading on currency market volatility.
The data set comprises of time series data on currency pair of GBPINR. The data
analyzed for a span of 8 years starting from1st April, 2006 - 31st December, 2013 coving
a total observations of 908 during Pre-Derivative Period and 972 in Post Derivative
Period respectively. Eight years will be quite a good span of time to study the impact of
any policy implication. In order to study the impact of derivatives on currency market
volatility, the whole study period for GBPINR has been bifurcated as follows:
Pre derivatives period: 1st April 2006 – 31st December 2009
Post Derivatives period: 1st January 2010 – 31st December 2013
Derivatives trading started in Indian markets on 28th August 2008 with the launch of
futures contract of USDINR at NSE. The full set of currency derivatives products was
only available after January 2010 i.e. for GBPINR, JPYINR and EURINR.
Thus January 2010 has been used as cutoff date to study the impact of introduction of
derivatives on volatility.
Daily rate of return is calculated by taking natural logarithm of the ratio of present day
index level with the previous day index level. The return series over the period of study
(Yt) constitutes the time series currency market data for the purpose of the study.
ISSN: 2348 9510
International Journal Of Core Engineering & Management (IJCEM)
Volume 1, Issue 6, September 2014
112
Normality Test
The Data distribution is said to be normal if its skewness is zero and kurtosis is three. The
descriptive statistics like mean, standard deviation skewness and kurtosis of the return
data over the period study for GBPINR. The normality test of the descriptive statistics is
carried on by using an asymptotic Jarque-Bera (1981) test statistic. The formula of
Jarque-Bera (JB) statistics is stated below:
𝐽𝐵 𝑆𝑡𝑎𝑡𝑖𝑠𝑡𝑖𝑐𝑠 = 𝑇 𝑆2
6+
𝐾 − 3 2
24
T = No. of observations
S = Skewness coefficient
K = Kurtosis coefficient
JB test of normality is the test of the joint null hypothesis if S & K are ‘O’ and 3,
respectively.
Stationarity Test on the Data
Before estimating the models, the unit root properties for the time series data have been
tested individually for entire currency sets using Graphical method & ADF test statistic.
Graphical method gives a visual estimate of the stationarity of the series which has been
confirmed by ADF test statistic. Augmented Dickey fuller test is given by the following
equation:
𝐴𝐷𝐹 = α∆𝑦𝑡−1 + 𝑥′𝑡𝛿 + 𝑒𝑡
Where α & δ are parameters to be estimated & et is white noise error term
The ADF tests the following hypothesis:
H0: α =0 (series has a unit root)

ISSN: 2348 9510
International Journal Of Core Engineering & Management (IJCEM)
Volume 1, Issue 6, September 2014
113
H1: α <0 (series does not have a unit root) and is evaluated using t ratio.
Presence of Heteroscedasticity Test
This is a Lagrange multiplier (LM) test for autoregressive conditional heteroskedasticity
(ARCH) in the residuals. It tests the null hypothesis that there is no ARCH effect up to
order q in the residuals. After we run the usual ARMA model (mean equation), we obtain
the residuals. To test for any ARCH effects the residuals are regressed upon their own
values by using the following equation:
𝑒𝑡2 = 𝛽0 + 𝛽𝑖
𝑞
𝑖=
𝑒𝑡−12 + 𝑣𝑡
Where, e = residual
ARCH LM test approximates chi square distribution with q degrees of freedom.
LM ~ χq (chi-square with d.f. q).
The null hypothesis of no ARCH effects is rejected if LM > critical values.
Development of Volatility Models for Estimation of Volatility
The GARCH model
GARCH models explain variance by two distributed lags, one on past squared residuals
to capture high frequency effects or news about volatility from the previous period
measured as the lag of the squared residual from mean equation, and second on lagged
values of variance itself to capture long term influences. In the GARCH (1, 1) model, the
variance expected at any given data is a combination of long run variance and the
variance expected for the last period, adjusted to take into account the size of the last
periods observed shock.
GARCH (1, 1) model is given as:

ISSN: 2348 9510
International Journal Of Core Engineering & Management (IJCEM)
Volume 1, Issue 6, September 2014
114
𝜎𝑡2 = 𝛼0 + 𝛼𝑖
𝑞
𝑖=1
휀𝑡−12 + 𝛽𝑖
𝑝
𝑗=1
𝜎𝑡−12
Parameter constraints:
𝛼0 > 0
𝛼1 > 0
𝛽 ≥ 0
and 𝛼1 + 𝛽 < 1
Where q represents the lags of the moving average terms and p representing the lags of
the autoregressive terms. The above parameter constraints have been discussed for p=1.
GARCH Framework helps to detect variations in both level & structure of volatility
where alpha (ARCH coefficient) shows the impact of current news on volatility; GARCH
coefficient shows the impact of old news on volatility indicating the persistence of
previous information. The sum of both ARCH & GARCH coefficient shows the
persistence in volatility i.e. the speed at which old shocks to the return die out. A
straightforward interpretation of the estimated coefficients of the GARCH equation is
that the constant term 𝛼0 is the long-term average volatility, i.e. conditional variance,
whereas et and 𝜎𝑡2 represent how volatility is affected by current and past information,
respectively.
Analysis of the Results
ISSN: 2348 9510
International Journal Of Core Engineering & Management (IJCEM)
Volume 1, Issue 6, September 2014
115
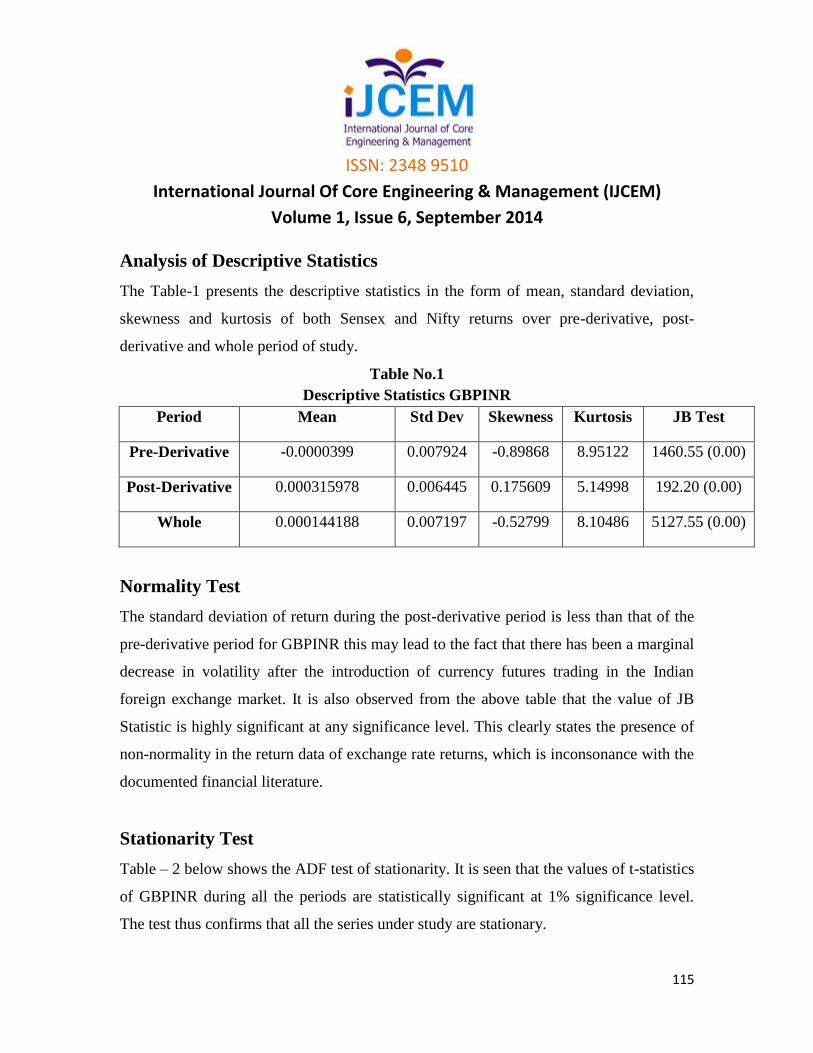
Analysis of Descriptive Statistics
The Table-1 presents the descriptive statistics in the form of mean, standard deviation,
skewness and kurtosis of both Sensex and Nifty returns over pre-derivative, post-
derivative and whole period of study.
Table No.1
Descriptive Statistics GBPINR
Period Mean Std Dev Skewness Kurtosis JB Test
Pre-Derivative -0.0000399 0.007924 -0.89868 8.95122 1460.55 (0.00)
Post-Derivative 0.000315978 0.006445 0.175609 5.14998 192.20 (0.00)
Whole 0.000144188 0.007197 -0.52799 8.10486 5127.55 (0.00)
Normality Test
The standard deviation of return during the post-derivative period is less than that of the
pre-derivative period for GBPINR this may lead to the fact that there has been a marginal
decrease in volatility after the introduction of currency futures trading in the Indian
foreign exchange market. It is also observed from the above table that the value of JB
Statistic is highly significant at any significance level. This clearly states the presence of
non-normality in the return data of exchange rate returns, which is inconsonance with the
documented financial literature.
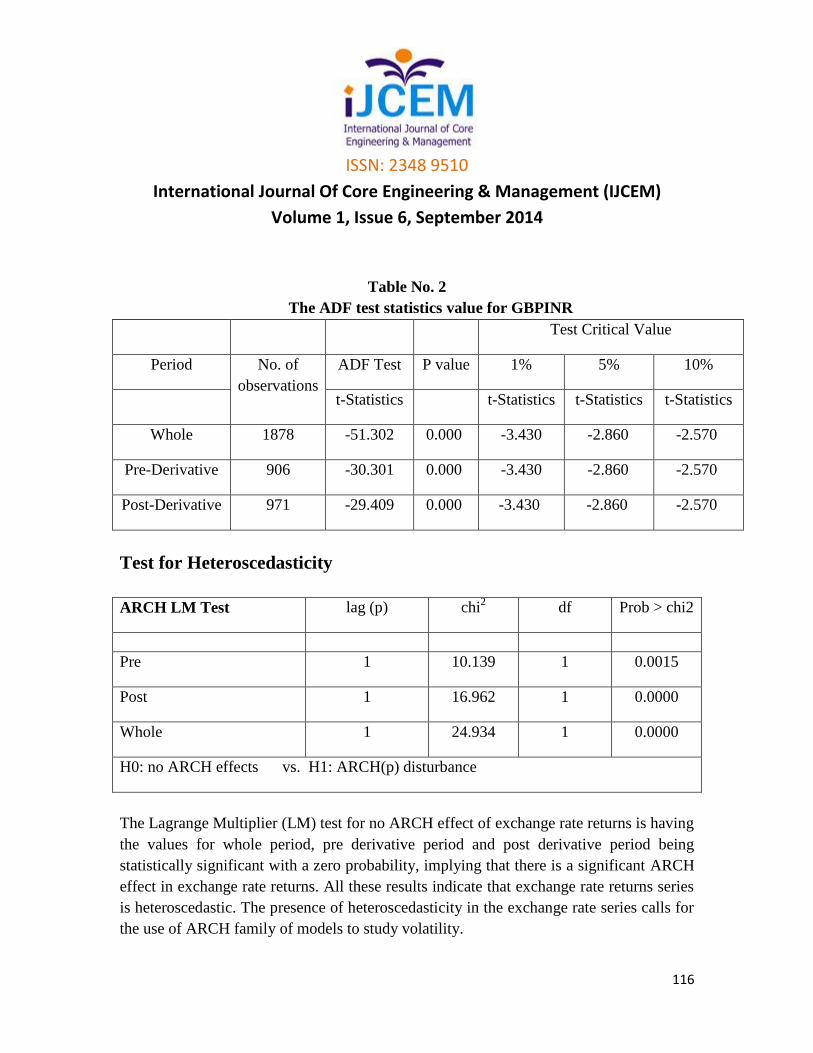
Stationarity Test
Table – 2 below shows the ADF test of stationarity. It is seen that the values of t-statistics
of GBPINR during all the periods are statistically significant at 1% significance level.
The test thus confirms that all the series under study are stationary.
ISSN: 2348 9510
International Journal Of Core Engineering & Management (IJCEM)
Volume 1, Issue 6, September 2014
116
Table No. 2
The ADF test statistics value for GBPINR
Test Critical Value
Period No. of
observations
ADF Test P value 1% 5% 10%
t-Statistics t-Statistics t-Statistics t-Statistics
Whole 1878 -51.302 0.000 -3.430 -2.860 -2.570
Pre-Derivative 906 -30.301 0.000 -3.430 -2.860 -2.570
Post-Derivative 971 -29.409 0.000 -3.430 -2.860 -2.570
Test for Heteroscedasticity
ARCH LM Test lag (p) chi2 df Prob > chi2
Pre 1 10.139 1 0.0015
Post 1 16.962 1 0.0000
Whole 1 24.934 1 0.0000
H0: no ARCH effects vs. H1: ARCH(p) disturbance
The Lagrange Multiplier (LM) test for no ARCH effect of exchange rate returns is having
the values for whole period, pre derivative period and post derivative period being
statistically significant with a zero probability, implying that there is a significant ARCH
effect in exchange rate returns. All these results indicate that exchange rate returns series
is heteroscedastic. The presence of heteroscedasticity in the exchange rate series calls for
the use of ARCH family of models to study volatility.
ISSN: 2348 9510
International Journal Of Core Engineering & Management (IJCEM)
Volume 1, Issue 6, September 2014
117
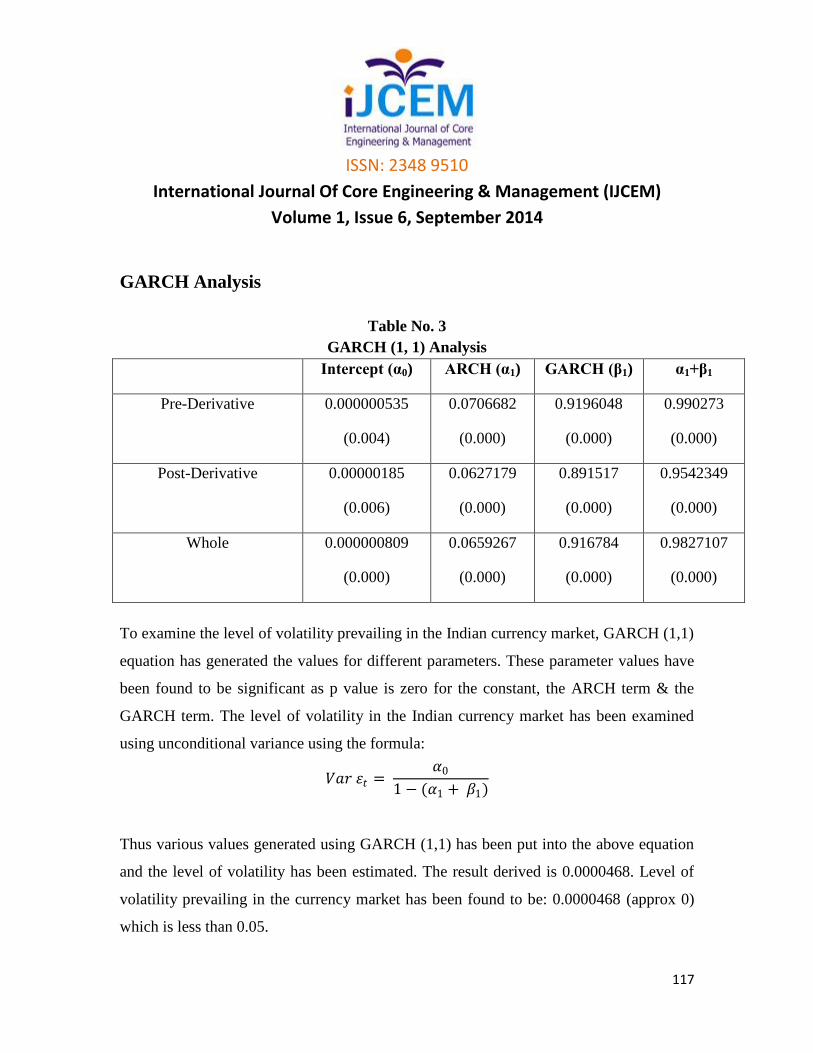
GARCH Analysis
Table No. 3
GARCH (1, 1) Analysis
Intercept (α0) ARCH (α1) GARCH (β1) α1+β1
Pre-Derivative 0.000000535
(0.004)
0.0706682
(0.000)
0.9196048
(0.000)
0.990273
(0.000)
Post-Derivative 0.00000185
(0.006)
0.0627179
(0.000)
0.891517
(0.000)
0.9542349
(0.000)
Whole 0.000000809
(0.000)
0.0659267
(0.000)
0.916784
(0.000)
0.9827107
(0.000)
To examine the level of volatility prevailing in the Indian currency market, GARCH (1,1)
equation has generated the values for different parameters. These parameter values have
been found to be significant as p value is zero for the constant, the ARCH term & the
GARCH term. The level of volatility in the Indian currency market has been examined
using unconditional variance using the formula:
𝑉𝑎𝑟 휀𝑡 = 𝛼0
1 − (𝛼1 + 𝛽1)
Thus various values generated using GARCH (1,1) has been put into the above equation
and the level of volatility has been estimated. The result derived is 0.0000468. Level of
volatility prevailing in the currency market has been found to be: 0.0000468 (approx 0)
which is less than 0.05.

ISSN: 2348 9510
International Journal Of Core Engineering & Management (IJCEM)
Volume 1, Issue 6, September 2014
118
So, we Reject the Hypothesis H01 that there is no volatility in the Indian currency market
The results in Table 3 show that the there has been a decrease in ARCH term in the post
derivatives period as compared to pre derivatives period i.e. from 0.0706682 to
0.0627179 and the GARCH term has also shown a decrease from 0.9196048 to 0.891517.
This shows that that the impact of recent news and of old news on volatility has declined.
The sum of ARCH & GARCH term has decreased i.e. the persistence of volatility has
decreased in the post derivative period. Thus we can say that markets have become
efficient after index introduction of derivatives.
So, we Reject the Hypothesis that:
H02 there is no significant change in level of currency market volatility after introduction
of derivatives and
H03 derivatives introduction has not been successful in reducing the volatility
Conclusion
The volatility in Indian currency market exhibits the characteristics with respect to the
stylized features like autocorrelation, volatility clustering, asymmetry and persistence in
its daily return. The impact of financial derivatives on the volatility of exchange rate of
GBPINR is significant under GARCH (1, 1) model. It was found that volatility prevailing
in the Indian currency market and it is due to the derivatives, the daily volatility during
post derivative period is low in comparison to pre-derivative and whole period. The
Indian currency market data is non-normal and stationary.

ISSN: 2348 9510
International Journal Of Core Engineering & Management (IJCEM)
Volume 1, Issue 6, September 2014
119
References
1. Bhargava V., Malhotra D.K., (2007), The relationship between futures trading
activity and exchange rate volatility, revisited, Journal of Multinational Financial
Management, Vol. 17: pp.95-111.
2. Bollerslev, T., (1986), Generalized Autoregressive Conditional Heteroscedasticity,
Journal of Econometrics, Vol. 31: pp.307-327.
3. Bologna, P. and Cavallo, L., (2002), Does the introduction of Stock Index Futures
Effectively Reduce Stock Market Volatility? Is the ‘Futures Effect’ Immediate?
Evidence from the Italian stock exchange using GARCH, Applied Financial
Economics, Vol. 12: pp.183-92.
4. Chatrath, A., Ramchander, S. and Song, F.,(1996), The Role of Futures Trading
Activity in Exchange Rate Volatility, The Journal of Futures Markets, Vol.16(5):
pp.561- 584.
5. Danthine, J., (1978), Information, futures prices, and stabilizing speculation, Journal
of Economic Theory, Vol. 17: pp.79-98.
6. Figlewski, S., (1981), Futures Trading and Volatility in the GNMA Market, Journal
of Finance, Vol. 36: pp.445-84.
7. Glen, J. and Jorion, P., (1993), Currency Hedging for International Portfolios, Journal
of Finance, Vol. 48: pp.1865-86.
8. Glosten, L.R., Jagannathan, R. and Runkle, D.E., (1993), On the Relations between
the Expected Value and the Volatility of the Nominal Excess Returns on Stocks,
Journal of Finance, Vol.48:pp.1779-91.
9. Jarrow, R.A., (1992), Market Manipulation, Bubbles, Corners, and Short Squeezes,
Journal of Financial and Quantitative Analysis, Vol. 27(3): pp.311- 336.

ISSN: 2348 9510
International Journal Of Core Engineering & Management (IJCEM)
Volume 1, Issue 6, September 2014
120
10. Kumar, P. and D.J. Seppi (1992), Futures Manipulation with Cash Settlement, The
Journal of Finance, Vol. XLVII (4): pp.1485-1501.
11. Ross, S.A., (1989), Information and volatility: The no-arbitrage martingale approach
to timing and resolution irrelevancy, Journal of Finance, Vol. 44: pp.1-17.
12. Sharma, S., (2011), An Empirical analysis of the relationship between Currency
futures and Exchange Rates Volatility in India, Working Paper Series, Reserve Bank
of India, 1/2011.