A study of consumers’ perception and key factors in ...
58
A STUDY OF CONSUMERS’ PERCEPTION AND KEY FACTORS IN DECISION-MAKING TOWARD ELECTRIC CARS IN BANGKOK METROPOLITAN REGION BY MR. VOTSAWAT CHAICHITTI AN INDEPENDENT STUDY SUBMITTED IN PARTIAL FULFILLMENT OF THE REQUIREMENTS FOR THE DEGREE OF MASTER OF SCIENCE PROGRAM IN MARKETING (INTERNATIONAL PROGRAM) FACULTY OF COMMERCE AND ACCOUNTANCY THAMMASAT UNIVERSITY ACADEMIC YEAR 2018 COPYRIGHT OF THAMMASAT UNIVERSITY Ref. code: 25616002040845PKB
Transcript of A study of consumers’ perception and key factors in ...
A STUDY OF CONSUMERS’ PERCEPTION AND KEY
FACTORS IN DECISION-MAKING TOWARD
ELECTRIC CARS IN
BANGKOK METROPOLITAN REGION
BY
MR. VOTSAWAT CHAICHITTI
AN INDEPENDENT STUDY SUBMITTED IN PARTIAL
FULFILLMENT OF THE REQUIREMENTS FOR THE DEGREE
OF MASTER OF SCIENCE PROGRAM IN MARKETING
(INTERNATIONAL PROGRAM)
FACULTY OF COMMERCE AND ACCOUNTANCY
THAMMASAT UNIVERSITY
ACADEMIC YEAR 2018
COPYRIGHT OF THAMMASAT UNIVERSITY
Ref. code: 25616002040845PKB


(1)
ABSTRACT
The automotive industry has had an important role in Thailand’s economy for
many years. In 2017, this industry contributed nearly 12% of the country’s GDP with
up to two million vehicles being produced (OICA, 2017), As a consequence, this has
made the country be ranked as the number one largest automotive producer in
Southeast Asia, fifth in Asia, and 12th in the world. In fact, the global automotive
industry has been moving toward zero carbon transport by reducing pollutant
emissions in the world. Therefore, the electric car revolution has become an attractive
investment market in recent years. However, building a domestic market for electric
cars is still a challenge and will likely take years to penetrate the Thai market due to a
variety of obstacles.
This study is a contemporary topic in applied marketing that focuses on the
subject area of the technological issue of electric cars in Thailand.
The purpose of this study aimed to understand the need for electric cars in the
Thai consumers’ mind focusing on the potential customers based on individual
characteristics, and the key driven factors that impact on purchasing electric cars. The
study was conducted using exploratory research and descriptive research. The
Independent Study Title A STUDY OF CONSUMERS’ PERCEPTION
AND KEY FACTORS IN DECISION-MAKING
TOWARD ELECTRIC CARS IN BANGKOK
METROPOLITAN REGION
Author Mr. Votsawat Chaichitti
Degree Master of Science Program in Marketing
(International Program)
Major Field/Faculty/University Faculty of Commerce and Accountancy
Thammasat University
Independent Study Advisor Professor K. Douglas Hoffman, Ph.D.
Academic Years 2018
Ref. code: 25616002040845PKB
(2)
exploratory research consisted of secondary research and in-depth interviews of four
respondents. The descriptive research was conducted using an online questionnaire
with 160 respondents. All the target respondents were Thai people aged 25-49 years
who lived in the Bangkok Metropolitan Region. The data acquired from the
questionnaire results were analyzed using the Statistical Package for the Social
Sciences (SPSS) in order to provide the result findings for each research objective.
As a result of the study, the respondents were grouped into three segments
based on attitude and lifestyle: 1) High-end Tech Savvy Consumers, 2) Eco-conscious
Consumers, and 3) Independent Quality-oriented Consumers. Furthermore, the key
important factors that significantly had an impact on the purchasing decision were the
Reliability of the technology, Design, Lower tax on EVs, and Charging stations
coverage in major cities.
Therefore, the findings would be beneficial for businesses or related
parties that are involved in the electric vehicle (EV) industry from the government,
public or private charging infrastructure, and auto manufacturers. This would be in
preparation for attracting early adopters of the brand new technology of EVs in
Thailand.
Keywords: Electric Cars, EVs, Automotive Industry
Ref. code: 25616002040845PKB

(3)
ACKNOWLEDGEMENTS
First of all, I would like to express my appreciation and gratitude to my
advisor, Professor K. Douglas Hoffman, for his support and guidance throughout the
entire independent study. His knowledge, dedication and positive attitude always
guided me along the way from emails to personal meetings.
I would also like to express my appreciation to all respondents who spent their
time and effort on the interviews and online survey. Lastly, I would like to thank all
my friends, colleagues, and, especially my family for their continuous support and
encouragement throughout my master’s degree journey.
Mr. Votsawat Chaichitti
Ref. code: 25616002040845PKB
(4)
TABLE OF CONTENTS
Page
ABSTRACT (1)
ACKNOWLEDGEMENTS (3)
LIST OF TABLES (7)
LIST OF FIGURES (8)
CHAPTER 1 INTRODUCTION 1
1.1 Background 1
1.1.1 Thailand Market Situation 2
1.2 Research Purpose 5
1.3 Research Objectives 5
CHAPTER 2 REVIEW OF LITERATURE 6
2.1 Electric Vehicles 6
2.2 Global Electric Vehicle Overview 7
2.3 Thailand’s Current Market Situation 7
2.4 Thailand’s Market Segment Situation 7
2.5 Thailand’s Market Research Situation 8
2.6 Summary of Literature Review 9
CHAPTER 3 RESEARCH METHODOLOGY 10
3.1 Exploratory Research Design 10
Ref. code: 25616002040845PKB

(5)
3.1.1 Secondary Research 10
3.1.2 In-depth Interview 11
3.2 Descriptive Research 11
3.2.1 Online Questionnaire 11
3.3 Sampling Plan 12
3.4 Recruitment Plan 12
3.4.1 Recruitment Criteria 12
3.4.2 Recruitment Method 13
3.5 Identification of Key Research Variables 13
3.6 Data Analysis Plan 14
CHAPTER 4 RESULTS AND DISCUSSION 15
4.1 Key Findings from the In-depth Interviews 15
4.1.1 In-depth Analysis 15
4.1.2 Preferences for Purchasing a Car 15
4.1.3 Consumers Knowledge about an Electric Car 16
4.1.4 Key Factors in Changing to an Electric Car 16
4.2 Key Findings from the Questionnaire Survey 17
4.2.1 Respondents’ Demographics 17
4.2.2 Consumer Segments by Attitude and Lifestyle 17
4.2.3 Consumers’ Perception toward Electric Cars 21
4.2.4 Electric Cars’ Attributes that Impact the Purchasing Decision 22
4.2.5 External Purchasing Factors on Electric Cars 24
4.2.6 Impact between Consumers’ Attitudes and the Purchasing
Factors 26
4.2.6.1 Impact of Electric Cars’ Attributes 26
4.2.6.2 Impact of External Purchasing Factors 27
Ref. code: 25616002040845PKB

(6)
4.2.7 Consumers’ Attitudes toward the Intention to Find More
Information on Electric Cars 28
4.2.8 Consumers’ Attitudes toward the Intention to Purchase Electric
Cars in the Future 29
4.2.9 Consumers’ Willingness to Pay 30
CHAPTER 5 CONCLUSIONS AND RECOMMENDATIONS 31
5.1 Key Findings from the Questionnaire Survey 31
5.1.1 Thai Consumers’ Perception toward Electric Cars 31
5.1.2 Key Electric Cars’ Attributes toward the Purchasing Decision 31
5.1.3 External Purchasing Factors on Electrics Cars 32
5.1.4 Thai Consumer Segments 32
5.1.5 Thai Consumers’ Intention to Purchase Electrics Cars 32
5.2 Recommendations 33
5.2.1 The Most Desired Segments 33
5.2.2 Focus on the Early Adopter Segments 33
5.2.3 Key Factors in Purchasing Electric Cars 34
5.3 Research Limitations 34
5.4 Suggestions for Future Research 35
REFERENCES 36
APPENDICES
APPENDIX A: In-depth Interviews Questions 39
APPENDIX B: Online Questionnaire Questions 40
APPENDIX C: Respondents’ Demographic Data 45
BIOGRAPHY 47
Ref. code: 25616002040845PKB
(7)
LIST OF TABLES
Tables Page
3.1: Participants collection 12
4.1: Finding key factors using the factor analysis 18
4.2: Segments from the cluster analysis 19
4.3: Consumers’ perception toward electric cars by segments 22
4.4: Importance of electric cars’ attributes toward the purchasing
decision by segments 23
4.5: Comparison of electric cars’ attributes between segments 24
4.6: Importance of external purchasing factors by segments 25
4.7: Comparison of the external purchasing factors between segments 26
4.8: Regression analysis between consumers’ attitudes and seven
electric cars’ attributes that had an impact on the purchasing decision 27
4.9: Regression analysis between consumers’ attitudes and seven external
factors that had an impact on purchasing electric cars 28
4.10: Consumers’ intention to seek more information by segments 29
4.11: Consumers’ intention to purchase electric cars by segments 29
4.12: Willingness to pay for an electric car by segments 30
Ref. code: 25616002040845PKB

(8)
LIST OF FIGURES
Figures Page
1.1: World vehicle production in 2017 2
1.2: World vehicle sales in 2017 3
1.3: Eighteen auto assemblers in Thailand 4
2.1: Age distribution of likely electric vehicle buyers 8
3.1: Research process 10
3.2: Conceptual model 13
3.3: Data analysis plan for the quantitative data 14
4.1: Association between the characteristics in each segment 20
Ref. code: 25616002040845PKB

1
CHAPTER 1
INTRODUCTION
1.1 Background
The global automotive industry is rapidly changing; consequently, the electric
car revolution has become an attractive investment market in recent years, as many
believe it will transform the future of transportation. However, the world is still in the
early stages of the adoption of electric vehicles (EVs) making up less than 1% of new
car sales globally. Currently, the factors on the supply side are accelerating electric
vehicle development, which includes government support on taxes, incentives as well
as regulations on pollutant emissions that are also pushing car manufacturers to invest
in research and development (R&D), particularly in the top three EVs’ markets of
China, Europe, and the US (Yun, 2018).
EVs are slowly gaining a reputation in the automotive industry, offering low
or zero carbon transport that many people say will eventually dominate our roads in a
few years. Globally, EVs are on the rise with the market reaching 1.2 million sales in
2017, 57% higher than in 2016. China is leading the market with a 48% market share
that accounts for 580,000 unit sales followed by Europe with 26%, and North
America with 18% (Frost and Sullivan, 2018). The latest forecast expects sales of
EVs to increase to 11 million in 2025, and 30 million in 2030 (Bloomberg NEF,
2018). By 2040, 60 million EVs are projected to be sold, equivalent to 55% of the
global passenger car market.
Due to the rise of technology from EVs and environmental policies, many
developed countries are preparing themselves to adopt this future change that soon
will become a norm in the automotive market. On the other hand, in Thailand, electric
cars were launched for the first time in 2009, in the form of hybrid electric vehicles
(HEVs). Moreover, plug-in hybrid electric vehicles (PHEVs) have been assembled
locally in Thailand by luxury brands; such as, Mercedes-Benz and BMW since 2016
(Panyaarvudh, 2018). Nonetheless, the overall market penetration of EVs is still
limited. This is because the market has mainly focused on high-end customers as the
Ref. code: 25616002040845PKB

2
early adopter of this new technology due to the relatively higher price compared to
internal combustion engine (ICE) vehicles.
According to the Department of Land Transport report (2017), EVs comprise
less than 1% of the total number of passenger cars in Thailand. At present, the
majority of them are HEVs and PHEVs (more than 100,000 units), but the number of
total EVs is quite small, which is approximately more than 1,000 units on the road.
Overall, Thai consumers are now more comfortable with HEVs and PHEVs, which
still have an ICE using petrol along with large batteries while the adoption of total
EVs, which have no such engines, is still in the very early stage due to the lack of
public charging infrastructure. Additionally, the price of EVs is nearly US$61,000 due
to the high import duties while locally assembled models are not yet available
(Wijayasinha, 2018).
1.1.1 Thailand Market Situation
Thailand’s automotive industry has had an important role in the
country’s economy for many years. The industry contributed nearly 12% of
Thailand’s GDP with more than 1.98 million vehicles produced in 2017 (OICA,
2017). This success ranked the country as the number one largest automotive
producer in Southeast Asia, fifth in Asia, and 12th in the world (refer to Figure 1). By
2020, Thailand expects to increase its production to 3.5 million units of vehicles, or
an 80% rise from 2017.
(Source: International Organization of Motor Vehicle Manufacturers, 2017.)
Figure 1.1: World vehicle production in 2017
Ref. code: 25616002040845PKB

3
The country has a well-known reputation by all the world’s leading
automakers and assemblers that are located in Central Thailand. Global companies;
such as, Toyota, Isuzu, Honda, Mitsubishi, Nissan, BMW and others together account
for a share of nearly two million vehicles produced yearly (Helven, 2018; Rastogi,
2018). More than half of the total production is commercial vehicles (58%) with the
remainder comprising passenger cars (42%) (OICA, 2017). Thailand’s automotive
industry is almost 60% export-oriented. In recent years, the country exported over 1.1
million vehicles to ASEAN countries, Australia, the Middle East and Europe, which
generated more than US$18 billion for the country (Thailand Board of Investment,
2017).
In terms of unit sales for the domestic market, Thailand ranked second in
Southeast Asia, sixth in Asia and 20th in the world, which was over 0.8 million-unit
sales in 2017 (refer to Figure 2). This accounted for 46% of the total number of
vehicles distributed to the local market, which comprised 34% of passenger cars with
1,500 cc or smaller engines, including eco-cars, and 12% with 1,501 cc or larger
engines. With a total of 18 auto assemblers in Thailand (refer to Figure 3), this would
help ensure that Thailand’s economy would grow even stronger. The forecast for the
automotive sector will likely increase in both the domestic and export markets, by 5-
7%, and 3-5%, respectively (Yongpisanphob, 2018).
(Source: International Organization of Motor Vehicle Manufacturers, 2017.)
Figure 1.2: World vehicle sales in 2017
Ref. code: 25616002040845PKB

4
(Source: Thailand Board of Investment, 2017.)
Figure 1.3: Eighteen auto assemblers in Thailand
On the other hand, despite the high potential automotive market in Thailand,
the number of electric vehicle sales has remained rather small. According to the
consulting firm KPMG (2018), it has been forecast that electric vehicle sales in
Thailand would remain low in the near future, and comprise only 1% of all passenger
vehicles in the country. With the global trend, EVs are expected to gain up to 35% of
the total number of vehicles worldwide in 2040 (Bloomberg NEF, 2018). This is
because of the concern for improving air quality throughout many countries, as well
as reducing emission-driven cars to changing vehicles to having more
environmentally friendly technology, which is gaining popularity. By 2036, Thailand
is expected to have 1.2 million EVs with more than 690 charging stations nationwide
(Yongpisanphob, 2018).
The long-term plan from the government’s policy emphasizes on the
development of electric vehicle technology with the goal that Thailand will become a
regional electric vehicle production hub. Unfortunately, building a domestic market
for electric vehicles is still a challenge, and it is likely to take many years for EVs to
penetrate the Thai market. This is because EVs remain expensive, and there is a
limited number of charging stations, which do not cover the entire country (ibid)
The automotive industry is a crucial sector for both the domestic and export activity
of Thailand’s economy, which the industry is consistently growing. Therefore, the
study of this subject was considered to be significant because it would provide a better
understanding about Thai consumers and the key driven factors that would prepare the
automotive industry to further accelerate in the future.
Ref. code: 25616002040845PKB
5
1.2 Research Purpose
The purpose of this study aimed to understand the needs of EVs in the Thai
consumers’ mind focusing on the potential that customers perceive on electric cars
based on individual characteristics, and the key driven factors to buy electric cars. The
participants were a group of Thai people aged between 25-49 years who live in
Bangkok Metropolitan Region.
Therefore, this study would be beneficial for businesses or related parties that
are involved in the electric vehicle industry from the government, public or private
charging infrastructure, and auto manufacturers. This would be in preparation for
attracting the early adopter of the brand new technology of EVs in Thailand. The
concept of a contemporary topic in applied marketing was implemented in this study
under the subject area of the technological issue on the electric car in Thailand.
1.3 Research Objectives
The objective of the study was to identify in depth the potential that customers
perceive on electric cars based on individual characteristics and key factors driving
the intention to buy electric cars. This study included the following main objectives:
1.3.1 To determine the current perception and attitude of the Thai people
toward an electric car in Bangkok Metropolitan Region.
a. To determine the advantages of an electric car in the consumers’
perspective.
b. To determine the disadvantages of an electric car in the consumers’
perspective.
1.3.2 To identify important factors, which would influence the intention to
purchase an electric car in the future.
a. Electric car’s attributes that impact on purchasing decision
b. External factors that impact on purchasing decision
1.3.3 To define the electric car’s consumers’ segmentation based on
demographic and psychological factors.
Ref. code: 25616002040845PKB

6
CHAPTER 2
REVIEW OF LITERATURE
2.1 Electric Vehicles
There are three main types of electric vehicles (EVs) classified by the degree
that electricity is used as their energy source. Hybrid electric vehicles (HEVs) are
powered by both gasoline and electricity. The electric energy is generated by the car’s
own braking system to recharge the battery. HEVs start by using the electric motor
then the gasoline engine becomes activated as the speed rises to about 3.2 kilometers
(EVgo, 2018). HEVs are not plug-ins, as they cannot be recharged from the power
grid (BC Hydro, 2018).
Plug-in hybrid electric vehicles (PHEVs) can recharge the battery through
both regenerating braking and plugging in to an external power. Compared to the
regular HEVs, which can travel about 3.2 kilometers before the gasoline engine turns
on, PHEVs can go up to 16-64.5 kilometers before the gas engines start to operate
(EVgo, 2018).
Battery electric vehicles (BEVs) that are more often called electric vehicles
(EVs), are fully electric with rechargeable batteries and no gasoline engine. The
battery power is used to run the electric motor and all onboard electronics. The best
thing about battery electric vehicles is that they do not release any harmful emissions.
They are charged from only an external power source (ibid).
2.2 Global Electric Vehicle Overview
With the decreasing supplies of oil, the world is turning to electric mobility.
The majority of today's cars are still using an internal combustion engine (ICE) even
though hybrid cars are becoming a normal sight nowadays and total electric ones are
also gaining recognition. This could be seen with the global share of plug-in cars
reaching 2% in December 2017 (EVvolumes, 2017). They are actually simpler to
manufacture and to maintain, but the range is lower than that of cars with ICE since
Ref. code: 25616002040845PKB

7
battery technology has yet to offer the same energy density as gasoline. The charging
time and charger availability are also preventing the adoption of electric cars;
however, this is accelerating and expected to comprise 55% of all new car sales by
2040 (Bloomberg NEF, 2018).
Many countries have vowed to clean up their cities, air, and energy. The
Netherlands and Norway declared that they would end gas and diesel car sales by
2025. India pledged to do the same by 2030. Scotland will end the sales of such cars
by 2032, and England and France by 2040. Germany has also stated the same, but has
not yet set a date (Enyedi, 2018). China, selling 30% of passenger vehicles around the
world, also announced in September 2017, that the government is working on a
schedule to end the sale of ICE cars, but also to gradually reduce the subsidies for
electric cars (Roberts, 2017).
2.3 Thailand’s Current Market Situation
In Thailand, electric cars were launched for the first time in 2009, in the form
of hybrid electric vehicles (HEVs). In 2016, German brands implemented plug-in
hybrid electric vehicles (PHEVs) to serve the high-end automotive market (Bangkok
Post, 2018). Since then, electric cars have only comprised 1% of the total number of
passenger cars in Thailand with less than 85,000 hybrids and plug-in hybrids in the
country (Consultancy.asia, 2018; Nation, 2018). Although demand for electric cars is
expected to remain low in the near future, increased incentives, lower prices, and
better infrastructure will boost adoption in the long term (KPMG, 2018).
2.4 Thailand’s Market Segment Situation
Despite the low adoption rate of electric cars in Thailand, a study for Nissan
Motor (Thailand) Co., Ltd. conducted by Frost and Sullivan (2018) has shown that for
Thailand, there is a significant latent demand for electric vehicles in the Kingdom
with 44% of 300 respondents saying they would undoubtedly consider an EV when
they make their next purchase decision (Nissan Motor Thailand, 2018). The survey
also found that potential electric vehicle buyers are relatively young and have a strong
Ref. code: 25616002040845PKB

8
concern about the environment, with prospective customers ready to pay up to 50%
more to own an electric vehicle than they would for a comparable conventional ICE
car (Frost and Sullivan, 2018).
Figure 2.1 shows further details on the research showed that 60% of potential
electric car customers were relatively young, less than 40 years old, which 26% of the
respondents were aged 20-29 years, and 37% were aged 30-39 years, respectively.
From the key factors of the adoption of electric cars, two out of three consumers
identified safety standards as the most important factor if purchasing an electric car.
Charging convenience was identified as the second-most important issue
(Newsroom.nissan-global, 2018).
(Source: Frost and Sullivan, 2018)
Figure 2.1: Age distribution of likely electric vehicle buyers
2.5 Thailand’s Market Research Situation
Even though, the potential demand for electric cars is significant, there are still
many adoption barriers that need to be resolved. With many global studies and
research having been conducted on the electric car market, there are still no studies
focusing specifically on the consumers’ perception and key factors in their decision-
making toward electric cars in Bangkok Metropolitan Region. The only research that
has been published is from Frost and Sullivan (2018) that widely focused on
Southeast Asia. If the research could identify in depth on the potential of how
customers perceive electric cars based on individual characteristics and key factors
driving the intention to buy electric cars, this would help marketers implement the
Ref. code: 25616002040845PKB

9
right strategies and raise awareness to attract more customers in the market in the
future. As such, this current research included: 1) research on potential customers’
characteristics based on the age of 25-49 years, 2) key factors driving the adoption of
electric cars, and 3) the intention to purchase electric cars. This would be developed
further with an insight on the findings of these three areas of study.
2.6 Summary of Literature Review
From a summary of the literature review, it was found that (1) research on
electric vehicles and Thai consumers was limited, (2) research on electric vehicles and
consumers had not determined any consumers’ perception and attitude toward electric
vehicles in Bangkok Metropolitan Region, and (3) research on electric vehicles and
consumers had not determined any psychological factors that would drive the
individuals’ need toward purchasing electric vehicles. Thus, this proposed study
would provide contributions in these three areas.
Ref. code: 25616002040845PKB
10
CHAPTER 3
RESEARCH METHODOLOGY
This research study was conducted using two main research methods, which
were exploratory research and descriptive research. The exploratory research
consisted of secondary research and qualitative research (in-depth interviews). The
findings from the exploratory research were used as a basis to develop quantitative
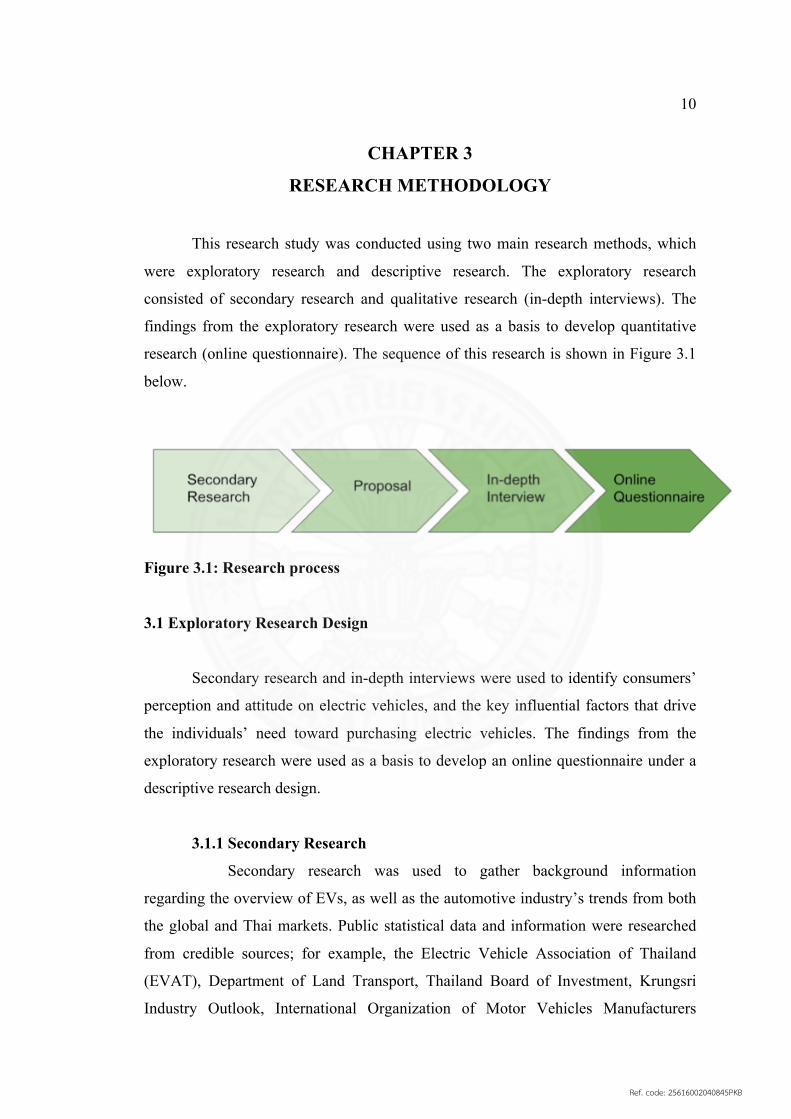
research (online questionnaire). The sequence of this research is shown in Figure 3.1
below.
Figure 3.1: Research process
3.1 Exploratory Research Design
Secondary research and in-depth interviews were used to identify consumers’
perception and attitude on electric vehicles, and the key influential factors that drive
the individuals’ need toward purchasing electric vehicles. The findings from the
exploratory research were used as a basis to develop an online questionnaire under a
descriptive research design.
3.1.1 Secondary Research
Secondary research was used to gather background information
regarding the overview of EVs, as well as the automotive industry’s trends from both
the global and Thai markets. Public statistical data and information were researched
from credible sources; for example, the Electric Vehicle Association of Thailand
(EVAT), Department of Land Transport, Thailand Board of Investment, Krungsri
Industry Outlook, International Organization of Motor Vehicles Manufacturers
Ref. code: 25616002040845PKB

11
(OICA), KPMG Industry Focus, and Frost and Sullivan. In addition, journals and
online articles from reliable sources were used to identify the driven factors and
barriers of EVs among potential buyers.
3.1.2 In-depth Interview
An in-depth interview was conducted during October 2018 by
interviewing four Thai people who lived in Bangkok Metropolitan Region. The in-
depth interview took approximately 30 minutes per respondent. The objectives of the
in-depth interviews were to discover the respondents’ knowledge, perception and
attitude of EVs in term of performance, safety, expense, social impact, key factors in
switching, and barriers from preventing them from using these vehicles. The example
of the questions for the in-depth interview is shown in Appendix A.
3.2 Descriptive Research
Descriptive research was conducted using an online questionnaire, which was
designed based on the key findings and insights from the exploratory research. The
descriptive research aimed to quantity the data to allow for the statistical analysis of
potential consumers’ characteristic, perception, and key factors in their decision-
making toward EVs.
3.2.1. Online Questionnaire
The survey research was conducted through an online channel with a
total of 160 respondents. The online questionnaire consisted of screening questions,
perception and attitude questions, key factors in decision-making, barriers of adoption
of EVs, and demographic questions. The example of the online questionnaire is
shown in Appendix B.
Ref. code: 25616002040845PKB

12
3.3 Sampling Plan
The sampling procedure employed for this project was based on the non-
probability technique. The convenience sampling allowed for convenient accessibility
in conducting the research that comprised an in-depth interview of four participants
and online questionnaire of 160 respondents. Prior to the launching of the
questionnaire, five pilot tests were conducted to validate the understanding of the
survey. Table 3.1 shows the sample size of each collection method.
Table 3.1: Participants collection
Data Collection Method
Sampling Method
Sampling Criteria
Pilot Study Sample Size
In-depth Interview
Convenience
Sampling
Male and Female,
25-49 years old,
Bangkok
Metropolitan
Region
-
4 people
Online
Questionnaire
Convenience
Sampling
Male and Female,
25-49 years old,
Bangkok
Metropolitan
Region
5 people
160 people
3.4 Recruitment Plan
3.4.1 Recruitment Criteria
This research study focused on Thai people aged between 25-49 years
who lived in the urban area of Bangkok Metropolitan Region. According to a survey
Ref. code: 25616002040845PKB

13
conducted by Frost and Sullivan (2018), the findings showed that people aged
between 20-49 years had a strong interest in buying EVs, or accounting for 84% of all
age ranges. As electric vehicle technology is still new in the Thai market, it could take
up to 10 years to influence the industry. Thus, this created an ideal study to
investigate this group of people, as they will become the potential customers of EVs.
3.4.2 Recruitment Method
Due to time constraints, a non-probability convenience sample was used
for all in-depth interviews and the online questionnaire. All respondents had to pass
the recruitment criteria to be able to participate in this research. Personal connections
were used to achieve the qualified participants for the in-depth interviews.
The online questionnaire used screening criteria questions to identify the
qualified participants. The online questionnaire was distributed through personal
contacts by means of social media applications; such as, LINE, Facebook and through
online public forums related to EVs; such as, Pantip and Facebook pages. The length
of the survey took approximately 10 minutes for the respondents to complete.
3.5 Identification of Key Research Variables
The independent variables and dependent variables in this study are
described in Figure 3.2 below.
Figure 3.2: Conceptual model
Ref. code: 25616002040845PKB

14
3.6 Data Analysis Plan
The key findings from the exploratory research were used as a guideline to
develop the descriptive research. The responses from the online questionnaire were
grouped and coded to ensure data accuracy for the data analysis. The Statistical
Package for the Social Sciences (SPSS) was used to analyze the frequency,
percentage and mean, conduct factor analysis and cluster analysis, and determine the
differences between the clusters. Figure 3.3 below shows an example of the data
analysis plan for the quantitative data.
Figure 3.3: Data analysis plan for the quantitative data
Ref. code: 25616002040845PKB
15
CHAPTER 4
RESULTS AND DISCUSSION
4.1 Key Findings from the In-depth Interviews
4.1.1 In-depth Analysis
A total of four in-depth interviews were conducted to understand the
consumers’ perception, basic knowledge and key factors in changing to use an electric
car in the Bangkok Metropolitan area. The questions covered the consumers’
preferences on purchasing a car, consumers’ knowledge about electric cars,
consumers’ perception of electric cars compared to internal combustion engine (ICE)
vehicles, and the key factors for changing to an electric car.
The interviewees were collected using convenience sampling with a
variety of career fields. One respondent was a female aged 26 years old who was
employed as a marketing promotion officer. Another two were males aged 28 years
old who worked as a dentist and interior designer, respectively. The last one was a
male aged 31 years old who worked as a sales manager and was about to have his first
child this year. All the respondents had their own cars and lived in the Bangkok
Metropolitan Region. The key findings of each interview are mentioned below.
4.1.2 Preferences for Purchasing a Car
In terms of choosing a car, three out of four respondents said they chose
a car based on the look and design of the vehicle as the most important factor.
However, the other one said he focused on the brand that had a high dealership
coverage in many cities to ensure the availability of maintenance services.
Nevertheless, all of them mentioned about the car’s performance, pricing and
maintenance costs.
On the types of cars, two out of four respondents said they owned a SUV
because they loved the versatility, greater space, and more passenger room. They also
mentioned that they felt safer driving a four-wheel drive vehicle, and it also served
their lifestyle of going on road trips quite often. The other two owned compact cars,
Ref. code: 25616002040845PKB

16
which they mostly used for the daily commute from their home to the office.
Moreover, these two respondents were more concerned on saving gas than the SUV
owners.
4.1.3 Consumers Knowledge about an Electric Car
All of the respondents did not fully understand what types of electric
cars were available in the market. They often got confused between hybrid, plug-in
hybrid, and full electric. In particular, they broadly associated hybrid and plug-in
hybrid as “hybrid cars” without knowing the differences. The full electric car was the
one they called an “electric car”, as they perceived it as the one that needed a charger.
However they could not differentiate electric cars while on the road.
Three out of four respondents associated hybrid cars with brands like
Toyota, Mercedes Benz, and BMW, as these were the vehicles they had seen the most
in the market. Moreover, the only full electric car on their mind was Tesla, which all
of them mentioned.
4.1.4 Key Factors in Changing to an Electric Car
All of the respondents had no concerns about the safety of electric cars,
as they said if the vehicles had already passed the manufacturer’s quality assurance,
then there should not be any safety problem. Moreover, they seemed to agree on the
saving of gas from electric cars, but two of them mentioned that they were skeptical
about the maintenance costs, as it could be more expensive in the long term.
Three of the respondents firmly pointed out about the charging
infrastructure, as they tended to go out of the city more, and this was a major factor of
using electric cars. However, one person said what would happen if she was caught in
traffic for two hours, and there were no charging stations nearby. This was a major
issue for them. Most of them strongly believed that electric cars would help reduce air
pollution. On the other hand, one person said it would only temporarily help the
environment because in the long run, if coals that are used to make electricity were
depleted, we would need to find a new solution for the environment again.
Ref. code: 25616002040845PKB

17
4.2 Key Findings from the Questionnaire Survey
4.2.1 Respondents’ Demographics
The online questionnaire was distributed to 243 respondents using
Surveymonkey.com However, 160 respondents met the criteria and completed the
questionnaire survey. The other 54 respondents did not qualify to pass the screening
questions, and the remaining 29 respondents did not fully complete the questionnaire
survey.
Number of Respondents: 160 people
Gender: 42% male and 58% female.
Age: The majority of respondents were aged between 25-29 years old (48%)
followed by the group aged 30-34 years old (22%).
Education: The majority of respondents had a bachelor’s degree or equivalent
(52%) as their highest level of education followed by the group with a
master’s degree (44%).
Occupation: The majority of respondents were officer workers (59%)
followed by a group of business owners (21%).
Monthly Income: 31% of respondents had a monthly income of
20,001 – 40,000 Baht/month followed by 30% of respondents that earned
40,001 – 60,000 Baht/month.
Fortunately, all target respondents were Thai nationals aged between 25-
49 years old, male and female, who lived in the Bangkok Metropolitan Region (refer
to Appendix C)
4.2.2 Consumer Segments by Attitude and Lifestyle
The factor and cluster analysis were conducted to classify all
respondents into segments based on their lifestyle and attitude. Initially, the factor
analysis was applied on 12 independent variables using the “Varimax Rotation”. The
results showed that those variables were grouped into four critical factors (refer to
Ref. code: 25616002040845PKB

18
Table 4.1), which were: 1) early adopter of technology with details oriented, 2) high-
end lifestyle, 3) adventure and independence, and 4) social responsibility.
Table 4.1: Finding key factors using the factor analysis
Rotated Component Matrix
Component
Early Adopter of Technology with Details
Oriented
High-end Lifestyle
Adventure and Independence
Social Responsibility
Q1 I am usually among the first to try new products.
.705 .221 .061 -.270
Q2 I like to update myself on new technology.
.799 -.057 .087 -.139
Q3 I want to look different than others. .570 .384 .020 .148
Q4 I like to pay attention to details when selecting products.
.653 -.085 .020 .310
Q5 I believe a higher price means higher quality.
.040 .857 .022 -.121
Q6 I prefer high-end products with a high reputation.
.104 .841 -.062 0.72
Q7 I like to do volunteer work. -.005 -.104 .444 .580
Q8 I prefer not to use plastic bags. -.036 .010 .053 .835
Q9 I like to try new activities. .157 .029 .752 .249
Q10 I like outdoor sports. -.092 -.094 .820 -.048
Q11 I love freedom. .275 .142 .354 .339
Q12 I dare to take a risk. .397 .076 .282 .122
Extraction Method: Principal Component Analysis. Rotation Method: Varimax with Kaiser Normalization.
Ref. code: 25616002040845PKB

19
In the second step, cluster analysis was applied to determine the attitude and
lifestyle patterns, which differentiated respondents into their own segments. As a
result, all respondents were divided into three segments: 1) High-end Tech Savvy
Consumers, 2) Eco-conscious Consumers, and 3) Independent Quality-oriented
Consumers (refer to Table 4.2).
Table 4.2: Segments from the cluster analysis
Final Cluster Centers
Cluster Factors
High-end Tech Savvy Consumers
(n=37)
Eco-conscious Consumers
(n=65)
Independent Quality-oriented
Consumers (n=58)
Early adopter of technology with details oriented.
.83901 .22134 -.78328
High-end lifestyle. .61910 -.78674 .48674
Adventure and independence. -.58879 .08413 .28132
Social responsibility. -.56899 .54568 -.24856
Ref. code: 25616002040845PKB

20
Figure 4.1: Association between the characteristics in each segment
The three segments can be described as below:
Segment 1: “High-end Tech Savvy Consumers” (n=37)
This segment represented the group of people who were early adopters of new
technology and always maintained their knowledge through the latest IT news. They
paid a lot of attention to details when selecting their products, which they did not
mind paying a premium price if the product quality and reputation were at the high-
end level. However, they did not pay much attention on saving the world by reducing
plastics or helping in voluntary work.
Segment 2: “Eco-conscious Consumers” (n=65)
This segment comprised the group of people who loved to make the world a
better place. They always showed concern for the environment by helping to reduce
all kinds of plastics and helping other people by doing voluntary work in their free
time. Moreover, they moderately maintained their know-how about the latest
technology with the willingness to adopt, as long as the technology could help shape
Ref. code: 25616002040845PKB

21
the world in a better way. However, they did not prefer luxury products or conduct
any extravagant buying.
Segment 3: “Independent Quality-oriented Consumers” (n=58)
This segment consisted of the group of people who loved freedom, activities
and high-quality products. They also liked to explore and try new activities, especially
outdoor activities and sports. Moreover, they preferred high-quality products with a
high reputation and did not mind spending for a premium price. Nevertheless, when it
came to technology, this group was low-tech, as they did not maintain an interest in
new technology and were the last group of people who would adopt it, as they found
it hard to learn new technology.
4.2.3 Consumers’ Perception toward Electric Cars
The respondents were asked to rate the following statements by using a
five-point Likert scale (1 Strongly Disagree - 5 Strongly Agree) on their opinions
about an electric car. According to the results from all respondents, the top four
positive statements were: 1) “EV is a gas saver.” (mean = 4.53), 2) “EV is the future
of transportation.” (mean = 4.48), 3) “EV is environmentally friendly.” (mean = 4.43),
and 4) “EV is advanced technology.” (mean = 4.26). Surprisingly, all three segments
positively agreed on the top four perception statements toward electric cars, as the
means were determined by each segment (refer to Table 4.3).
On the other hand, the two lowest statements that respondents seem to
somewhat disagree were: “EV charging stations are widely accessible.” (mean = 2.35)
and “EV can be driven in a long distance.” (mean = 2.71). This indicated the negative
perception toward electric cars in those two aspects.
Moreover, the analysis of variance (ANOVA) was applied to determine
whether there were significant differences among the three segments. The results from
Table 4.3 show that there was only one significant statement with p < 0.05: “EV is
smooth and silent.” Both the High-end Tech Savvy Consumers and Eco-conscious
Consumers had an equal means of 4.03, but Independent Quality-oriented Consumers
only had a mean of 3.71. Hence, the conclusion showed that there was no statistically
significant difference in the means from other statements between the three segments.
Ref. code: 25616002040845PKB

22
Table 4.3: Consumers’ perception toward electric cars by segments
All Respondents
(n=160)
High-end Tech Savvy Consumers
(n=37)
Eco-conscious Consumers
(n=65)
Independent Quality-oriented
Consumers (n=58)
ANOVA between
Segments
Perception Statements
toward Electric Cars
Mean S.D. Mean S.D. Mean S.D. Mean S.D. F Sig.
EV is advanced technology.
4.26 .63 4.22 .79 4.35 .51 4.19 .63 1.176 .311
EV is a gas saver. 4.53 .51 4.51 .51 4.62 .49 4.43 .53 2.014 .137
EV is environmentally friendly.
4.43 .63 4.41 .72 4.54 .56 4.33 .63 1.771 .174
EV is the future of transportation.
4.48 .59 4.46 .61 4.58 .50 4.38 .67 1.889 .155
EV has a higher safety standard.
3.51 .78 3.41 .86 3.62 .80 3.47 .68 1.028 .360
EV is worth the value.
3.53 .85 3.32 1.08 3.60 .81 3.59 .70 1.451 .237
EV has low maintenance cost.
2.84 1.10 2.51 1.22 3.05 1.18 2.83 .88 2.827 .062
EV charging stations are widely accessible.
2.35 1.22 2.24 1.34 2.42 1.36 2.34 .98 .232 .794
EV can be driven in a long distance.
2.71 1.07 2.70 1.08 2.86 1.18 2.55 .90 1.301 .275
EV is smooth and silent.
3.91 .77 4.03 .80 4.03 .79 3.71 .70 3.321 .039
4.2.4 Electric Cars’ Attributes that Impact the Purchasing Decision
As Table 4.4 shows, the respondents were asked to rate the importance
of electric cars’ attributes toward the purchasing decision by using a five-point Likert
scale (1 Not Important - 5 Very Important). The results showed that the top three
important attributes were: 1) “Safety standard” (mean = 4.68), 2) “Performance”
(mean = 4.43), and 3) “Maintenance costs” (mean = 4.39).
Ref. code: 25616002040845PKB

23
Table 4.4: Importance of electric cars’ attributes toward the purchasing decision
by segments
All Respondents (n=160)
High-end Tech Savvy Consumers
(n=37)
Eco-conscious Consumers
(n=65)
Independent Quality-oriented
Consumers (n=58)
Electric Cars’ Attributes
Mean S.D. Mean S.D. Mean S.D. Mean S.D.
Performance 4.43 .58 4.41 .60 4.54 .56 4.33 .57
Design 4.24 .58 4.27 .61 4.31 .61 4.14 .51
Safety standard 4.68 .53 4.59 .64 4.77 .46 4.62 .52
Competitive price 4.38 .61 4.32 .71 4.54 .59 4.24 .54
Maintenance costs 4.39 .65 4.32 .71 4.49 .66 4.33 .57
Reliability of the technology
4.38 .62 4.32 .71 4.55 .56 4.21 .59
Dealer coverage in my area
4.19 .75 4.05 .74 4.23 .84 4.22 .62
According to the ANOVA analysis among the segments, there were two
significant purchasing factors between segments with p < 0.05, which were
“Competitive price” and “Reliability of the technology”. Follow-up tests showed that
the mean score on both factors for Eco-conscious Consumers (mean = 4.54) and
(mean = 4.55) were significantly higher than the mean score for Independent Quality-
oriented Consumers (mean = 4.24), and (mean = 4.21) (refer to Table 4.5).
Ref. code: 25616002040845PKB

24
Table 4.5: Comparison of electric cars’ attributes between segments
Comparison of the Column Means a
High-end Tech Savvy Consumers
(n=37)
Eco-conscious Consumers
(n=65)
Independent Quality-oriented
Consumers (n=58)
ANOVA between
Segments
Electric Cars’
Attributes
(A) (B) (C) F Sig.
Performance 2.112 .124
Design 1.410 .247
Safety standard 1.757 .176
Competitive price C 3.948 .021
Maintenance costs 1.282 .280
Reliability of the technology
C 5.189 .007
Dealer coverage in my area
.770 .465
The results were based on two-sided tests assuming equal variances with a significance level of .05. For each significant pair, the key of the smaller category appeared under the category with a larger mean. a a. Tests were adjusted for all pairwise comparisons within a row of each innermost sub table using the Bonferroni correction.
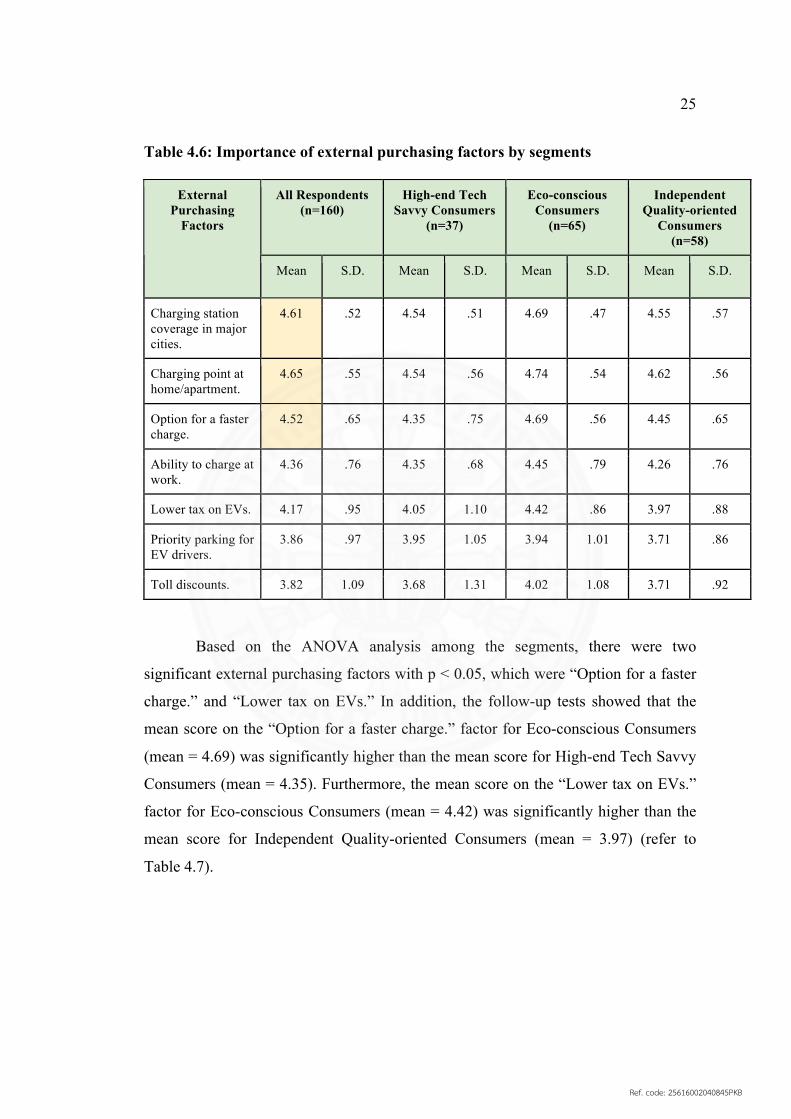
4.2.5 External Purchasing Factors on Electric Cars
As seen in Table 4.6, the respondents were asked to rate the importance
of the external factors that had an impact on purchasing electric cars using a five-point
Likert scale (1 Not Important - 5 Very Important). From the results from all
respondents, the top three important factors were: 1) “Charging point at
home/apartment.” (mean = 4.65), 2) “Charging station coverage in major cities.”
(mean = 4.61), and 3) “Option for a faster charge.” (mean = 4.52). Additionally, all
three segments strongly agreed on the top three external factors that they saw as the
most important points.
Ref. code: 25616002040845PKB
25
Table 4.6: Importance of external purchasing factors by segments
All Respondents (n=160)
High-end Tech Savvy Consumers
(n=37)
Eco-conscious Consumers
(n=65)
Independent Quality-oriented
Consumers (n=58)
External Purchasing
Factors
Mean S.D. Mean S.D. Mean S.D. Mean S.D.
Charging station coverage in major cities.
4.61 .52 4.54 .51 4.69 .47 4.55 .57
Charging point at home/apartment.
4.65 .55 4.54 .56 4.74 .54 4.62 .56
Option for a faster charge.
4.52 .65 4.35 .75 4.69 .56 4.45 .65
Ability to charge at work.
4.36 .76 4.35 .68 4.45 .79 4.26 .76
Lower tax on EVs. 4.17 .95 4.05 1.10 4.42 .86 3.97 .88
Priority parking for EV drivers.
3.86 .97 3.95 1.05 3.94 1.01 3.71 .86
Toll discounts. 3.82 1.09 3.68 1.31 4.02 1.08 3.71 .92
Based on the ANOVA analysis among the segments, there were two
significant external purchasing factors with p < 0.05, which were “Option for a faster
charge.” and “Lower tax on EVs.” In addition, the follow-up tests showed that the
mean score on the “Option for a faster charge.” factor for Eco-conscious Consumers
(mean = 4.69) was significantly higher than the mean score for High-end Tech Savvy
Consumers (mean = 4.35). Furthermore, the mean score on the “Lower tax on EVs.”
factor for Eco-conscious Consumers (mean = 4.42) was significantly higher than the
mean score for Independent Quality-oriented Consumers (mean = 3.97) (refer to
Table 4.7).
Ref. code: 25616002040845PKB

26
Table 4.7: Comparison of the external purchasing factors between segments
Comparison of the Column Means a
High-end Tech Savvy Consumers
(n=37)
Eco-conscious Consumers
(n=65)
Independent Quality-oriented
Consumers (n=58)
ANOVA between
Segments
External Purchasing
Factors
(A) (B) (C) F Sig.
Charging stations coverage in major cities.
1.543 .217
Charging points at home/apartment.
1.659 .194
Option for a faster charge.
A 3.980 .021
Ability to charge at work.
.945 .391
Lower tax on EVs. C 3.957 .021
Priority parking for EV drivers.
1.080 .342
Toll discounts. 1.692 .187
The results were based on two-sided tests assuming equal variances with a significance level of .05. For each significant pair, the key of the smaller category appeared under the category with a larger mean. a a. Tests were adjusted for all pairwise comparisons within a row of each innermost sub table by using the Bonferroni correction.
4.2.6 Impact between Consumers’ Attitudes and the Purchasing Factors
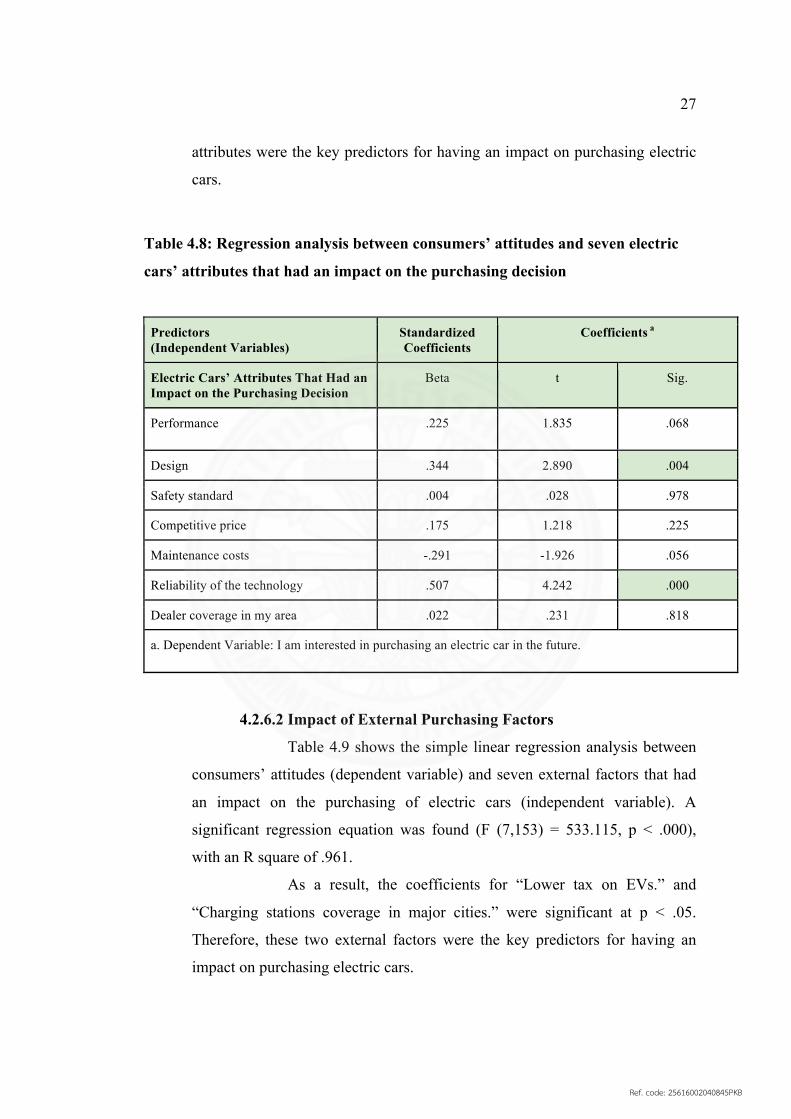
4.2.6.1 Impact of Electric Cars’ Attributes
Table 4.8 shows the simple linear regression analysis between
consumers’ attitudes (dependent variable) and seven electric cars’ attributes
that had an impact on the purchasing decision (independent variable). A
significant regression equation was found (F (7,153) = 623.297, p < .000),
with an R square of .966.
As a result, the coefficients for the “Reliability of the
technology” and “Design” were significant at p < .05. Therefore, these two
Ref. code: 25616002040845PKB
27
attributes were the key predictors for having an impact on purchasing electric
cars.
Table 4.8: Regression analysis between consumers’ attitudes and seven electric
cars’ attributes that had an impact on the purchasing decision
Predictors (Independent Variables)
Standardized Coefficients
Coefficients a
Electric Cars’ Attributes That Had an Impact on the Purchasing Decision
Beta t Sig.
Performance .225 1.835 .068
Design .344 2.890 .004
Safety standard .004 .028 .978
Competitive price .175 1.218 .225
Maintenance costs -.291 -1.926 .056
Reliability of the technology .507 4.242 .000
Dealer coverage in my area .022 .231 .818
a. Dependent Variable: I am interested in purchasing an electric car in the future.
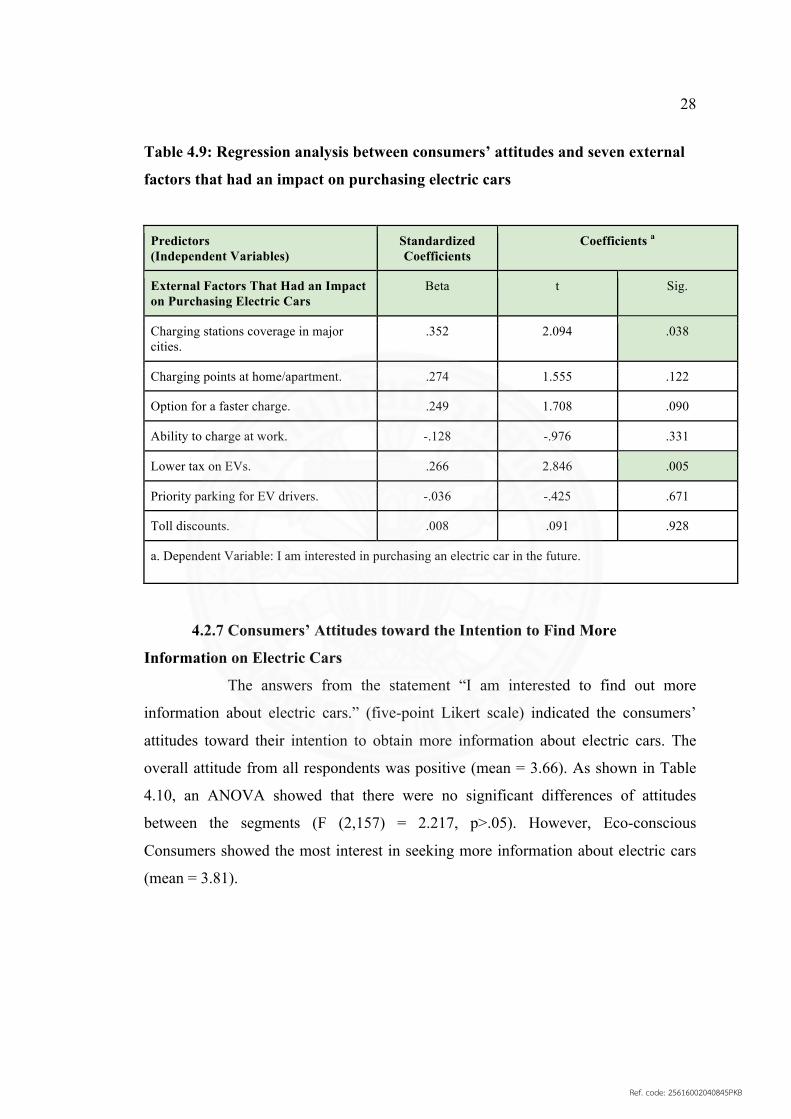
4.2.6.2 Impact of External Purchasing Factors
Table 4.9 shows the simple linear regression analysis between
consumers’ attitudes (dependent variable) and seven external factors that had
an impact on the purchasing of electric cars (independent variable). A
significant regression equation was found (F (7,153) = 533.115, p < .000),
with an R square of .961.
As a result, the coefficients for “Lower tax on EVs.” and
“Charging stations coverage in major cities.” were significant at p < .05.
Therefore, these two external factors were the key predictors for having an
impact on purchasing electric cars.
Ref. code: 25616002040845PKB
28
Table 4.9: Regression analysis between consumers’ attitudes and seven external
factors that had an impact on purchasing electric cars
Predictors (Independent Variables)
Standardized Coefficients
Coefficients a
External Factors That Had an Impact on Purchasing Electric Cars
Beta t Sig.
Charging stations coverage in major cities.
.352 2.094 .038
Charging points at home/apartment. .274 1.555 .122
Option for a faster charge. .249 1.708 .090
Ability to charge at work. -.128 -.976 .331
Lower tax on EVs. .266 2.846 .005
Priority parking for EV drivers. -.036 -.425 .671
Toll discounts. .008 .091 .928
a. Dependent Variable: I am interested in purchasing an electric car in the future.
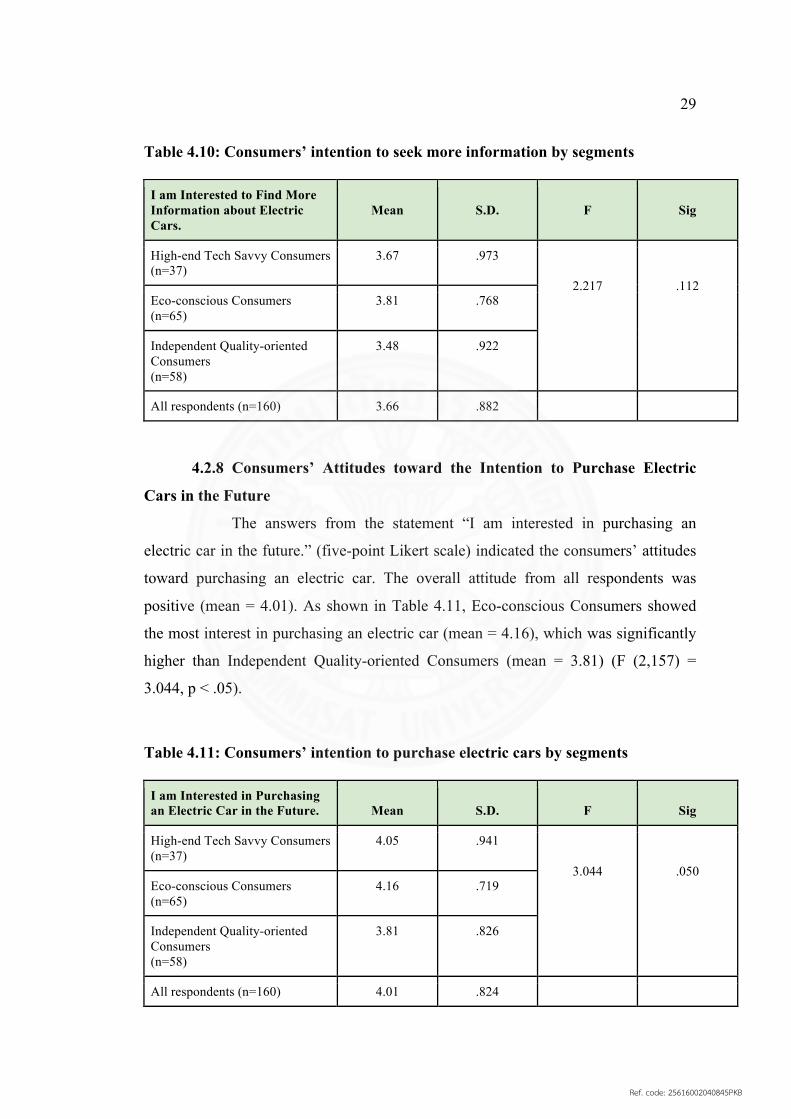
4.2.7 Consumers’ Attitudes toward the Intention to Find More
Information on Electric Cars
The answers from the statement “I am interested to find out more
information about electric cars.” (five-point Likert scale) indicated the consumers’
attitudes toward their intention to obtain more information about electric cars. The
overall attitude from all respondents was positive (mean = 3.66). As shown in Table
4.10, an ANOVA showed that there were no significant differences of attitudes
between the segments (F (2,157) = 2.217, p>.05). However, Eco-conscious
Consumers showed the most interest in seeking more information about electric cars
(mean = 3.81).
Ref. code: 25616002040845PKB
29
Table 4.10: Consumers’ intention to seek more information by segments
I am Interested to Find More Information about Electric Cars.
Mean
S.D.
F
Sig
High-end Tech Savvy Consumers (n=37)
3.67 .973
Eco-conscious Consumers (n=65)
3.81 .768
Independent Quality-oriented Consumers (n=58)
3.48 .922
2.217
.112
All respondents (n=160) 3.66 .882
4.2.8 Consumers’ Attitudes toward the Intention to Purchase Electric
Cars in the Future
The answers from the statement “I am interested in purchasing an
electric car in the future.” (five-point Likert scale) indicated the consumers’ attitudes
toward purchasing an electric car. The overall attitude from all respondents was
positive (mean = 4.01). As shown in Table 4.11, Eco-conscious Consumers showed
the most interest in purchasing an electric car (mean = 4.16), which was significantly
higher than Independent Quality-oriented Consumers (mean = 3.81) (F (2,157) =
3.044, p < .05).
Table 4.11: Consumers’ intention to purchase electric cars by segments
I am Interested in Purchasing an Electric Car in the Future.
Mean
S.D.
F
Sig
High-end Tech Savvy Consumers (n=37)
4.05 .941
Eco-conscious Consumers (n=65)
4.16 .719
Independent Quality-oriented Consumers (n=58)
3.81 .826
3.044
.050
All respondents (n=160) 4.01 .824
Ref. code: 25616002040845PKB
30
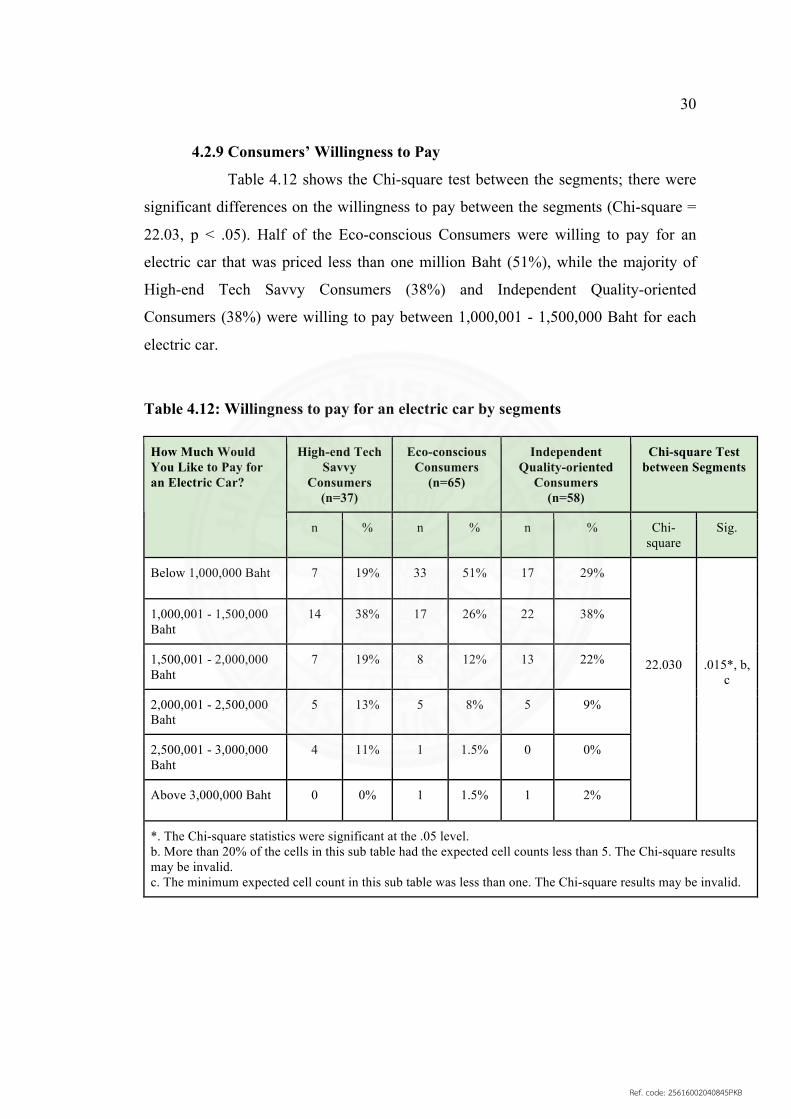
4.2.9 Consumers’ Willingness to Pay
Table 4.12 shows the Chi-square test between the segments; there were
significant differences on the willingness to pay between the segments (Chi-square =
22.03, p < .05). Half of the Eco-conscious Consumers were willing to pay for an
electric car that was priced less than one million Baht (51%), while the majority of
High-end Tech Savvy Consumers (38%) and Independent Quality-oriented
Consumers (38%) were willing to pay between 1,000,001 - 1,500,000 Baht for each
electric car.
Table 4.12: Willingness to pay for an electric car by segments
High-end Tech Savvy
Consumers (n=37)
Eco-conscious Consumers
(n=65)
Independent Quality-oriented
Consumers (n=58)
Chi-square Test between Segments
How Much Would You Like to Pay for an Electric Car?
n % n % n % Chi-square
Sig.
Below 1,000,000 Baht 7 19% 33 51% 17 29%
1,000,001 - 1,500,000 Baht
14 38% 17 26% 22 38%
1,500,001 - 2,000,000 Baht
7 19% 8 12% 13 22%
2,000,001 - 2,500,000 Baht
5 13% 5 8% 5 9%
2,500,001 - 3,000,000 Baht
4 11% 1 1.5% 0 0%
Above 3,000,000 Baht 0 0% 1 1.5% 1 2%
22.030
.015*, b, c
*. The Chi-square statistics were significant at the .05 level. b. More than 20% of the cells in this sub table had the expected cell counts less than 5. The Chi-square results may be invalid. c. The minimum expected cell count in this sub table was less than one. The Chi-square results may be invalid.
Ref. code: 25616002040845PKB

31
CHAPTER 5
CONCLUSIONS AND RECOMMENDATIONS
5.1 Key Findings from the Questionnaire Survey
5.1.1 Thai Consumers’ Perception toward Electric Cars
The top four statements, which had a positive perception toward electric
cars were: 1) EV is a gas saver (mean = 4.53), 2) EV is the future of transportation
(mean = 4.48), 3) EV is environmentally friendly (mean = 4.43), and 4) EV is
advanced technology (mean = 4.26). On the other hand, the two statements with a
negative perception indicated by the lowest means were: 1) EV charging stations are
widely accessible (mean = 2.35), and 2) EVs can be driven in a long distance (mean =
2.71). As a result, the majority of respondents still believed in the lack of charging
stations and the lack of sufficient battery performance for a long driving distance.
However, these statements may not be believed in the mind of auto manufacturers or
charging station companies, as both aspects of perception are a main area for
improvement toward a better understanding in the consumers’ mind.
5.1.2 Key Electric Cars’ Attributes toward the Purchasing Decision
The top three electric cars’ attributes toward the purchasing decision
were: 1) Safety standard (mean = 4.68), 2) Performance (mean = 4.43), and 3)
Maintenance costs (mean = 4.39). The remaining attributes were also important as
they had a mean of > 4.00; these were the Reliability of the technology, Competitive
price, Design, and Dealer coverage in my area.
However, from the results of the simple linear regression analysis
between the consumers’ attitude (dependent variable) and seven electric cars’
attributes on the purchasing decision (independent variable), the two attributes
“Reliability of the technology” and “Design” were the significant predictors that had
an impact on purchasing electric cars, even though their means were not the highest.
Ref. code: 25616002040845PKB

32
5.1.3 External Purchasing Factors on Electrics Cars
The top three external purchasing factors were: 1) Charging point at
home/apartment (mean = 4.65), 2) “Charging station coverage in major cities” (mean
= 4.61) and 3) “Option for a faster charge” (mean = 4.52).
However, from the results of the simple linear regression analysis
between the consumers’ attitude (dependent variable) and seven external factors that
had an impact on purchasing electric cars (independent variable), the two external
factors “Lower tax on EV” and “Charging stations coverage in major cities” were the
significant predictors that had an impact on purchasing electric cars.
5.1.4 Thai Consumer Segments
The respondents were classified into three segments according to their
attitude and lifestyle. The three segments were: 1) High-end Tech Savvy Consumers,
2) Eco-conscious Consumers, and 3) Independent Quality-oriented Consumers.
Segment 1: “High-end Tech Savvy Consumers” were people who loved new
technology and high-end products, but they did not pay attention to being
environmentally friendly. Segment 2: “Eco-conscious Consumers” were people who
loved to make the world a better place. They cared about environmental issues and
also maintained an interest in technology, but they were price sensitive. Segment 3:
“Independent Quality-oriented Consumers” were people who loved new activities and
outdoor sports. When it came to products, they were willing to pay more for better
product quality. However, they were low-tech and barely had any interest in
technology.
5.1.5 Thai Consumers’ Intention to Purchase Electrics Cars
Eco-conscious Consumers were the segment that had the highest
intention to purchase electric cars, which was significantly higher than the
Independent Quality-oriented Consumers segment. The consumers’ attitude was the
key predictor for the intention to purchase electric cars.
Ref. code: 25616002040845PKB
33
5.2 Recommendations
The results from this study provided important findings, which would truly be
beneficial for all types of organizations and companies involved in this early stage of
electric car technology in Thailand.
5.2.1 The Most Desired Segments
Base on the results, “Eco-conscious Consumers” were the most desired
group of people with the highest mean of intention to purchase an electric car and also
the biggest segment (41%) among the three. This group of people searched for the
best for society and was environmentally friendly, which was aligned with the electric
cars’ purpose to reduce air pollution. Moreover, these people were willing to adopt
new technology and ready to change to use EVs, so to make the world a better place.
Nevertheless, one of the major concerns of this group was they were price sensitive
and lacked purchasing power.
Even though they would love to adopt this technology, due to the early
stage of electric cars in Thailand, the majority of global auto manufacturers have set
the premium price at a minimum of 1,500,000 Baht or above. According to the
results, the majority of this group (77%) was willing to pay the maximum of
1,500,000 or below, which did not meet with the current market pricing. In fact, this
could indicate that this group would not be among the early adopters at this point in
time in Thailand. This would be because there is still some gap between the supply
and demand in pricing. In the future, this group might have a major role in being
potential customers, as the price could remain the same until electric cars became
more popular and all the well-known automakers decided to introduce lower tier
models with more affordable prices.
5.2.2 Focus on the Early Adopter Segments
“High-end Tech Savvy Consumers” were a group of people who were
obsessed with new technology, and usually among the first to adopt new products. As
well, they always searched for the best or high-quality product with a high reputation.
Ref. code: 25616002040845PKB
34
Compared to the other two segments, this group accounted for only 23% of all
respondents. However, they had a higher purchasing power; up to 43% of this
segment said they were willing to pay between 1,500,000 - 3,000,000 Baht for an
electric car.
As a consequence, there would be no doubt that this segment would be
an early adopter of electric cars at this point in time. To match with the target
preference in seeking for high technology and premium car, automakers should focus
more on presenting the latest and most innovative technology of their own brands;
such as, an example of self-driving technology, a faster charging option, and/or
unique design that represents an innovative perception. Likewise, this group was the
early adopter of new products, as they also wanted to be different and more unique
than other people. Therefore, electric cars would be the preferred option to serve the
High-end Tech Savvy Consumers’ lifestyle and needs the most. Lastly, it would prove
fruitless to promote electric cars in an eco-friendly campaign, as this group do not
value the environment that much when compared to the latest technological features.
5.2.3 Key Factors in Purchasing Electric Cars
As mentioned above, design and the reliability of the technology would
play a big part of the consumers’ adoption of electric cars. In fact, “High-end Tech
Savvy Consumers” would not have any problem finding high-end electric cars before
anyone else. However, the other two external factors, which could lead to purchasing
by “Eco-conscious Consumers” would be a lower tax on EVs and charging stations
coverage in major cities, as these are the main priorities for this price sensitive group.
They would appreciate a reduced price, the coverage of charging stations and the
reliability of the technology. Even though they loved the eco-friendly concept and had
the highest intention to purchase, their biggest concern was still how much would they
have to spend on every aspect of an electric car.
5.3 Research Limitations
Due to the time constraint, a convenience sampling was used for the data
collection and the respondents were invited based on personal connections. Moreover,
Ref. code: 25616002040845PKB

35
the study would not represent the entire population of the age range of 25-49 years old
in the Bangkok Metropolitan Region.
In addition, this study on electric cars in Thailand is still limited and lacks
previous academic studies. Therefore, the secondary resources and global academic
studies on electric cars were utilized as the guideline for this study, which sometimes
the references could lead to global implications and trends.
5.4 Suggestions for Future Research
This study did not cover any particular brand of electric car, brand association
with the intention to purchase, comparison between the competitors in the market, or
focus on customers’ satisfaction if electric cars were more accepted in the Thai
market.
Thus, future research should consider the above objectives to examine the key
factors in purchasing electric cars more in-depth. In particular, brand association to
gain more insights and see the impact of each brand on consumers’ attitudes and
perception toward electric cars should also be investigated.
In conclusion, if in the future electric cars do become more well-known and
gain more reputation on the road, by studying the consumers’ satisfaction and
dissatisfaction would be ideal to continuously improve the automotive industry to
serve both the global and domestic markets even better.
Ref. code: 25616002040845PKB
36
REFERENCES
Bangkok Post. (2018, February). Powering the EV surge. Retrieved from
https://www.bangkokpost.com/business/news/1414335/powering-the-ev-surge
BC Hydro. (2018). Electric vehicle technologies & types. Retrieved from
https://www.bchydro.com/powersmart/electric-vehicles/owning-an-electric-
vehicle/technology.html
Bloomberg NEF. (2018). Electric Vehicle Outlook 2018 | Bloomberg New Energy
Finance. Retrieved from https://about.bnef.com/electric-vehicle-outlook/
Consultancy.asia. (2018, April). Study shows popularity of electric vehicles in
Thailand remains low. Retrieved from
https://www.consultancy.asia/news/754/study-shows-popularity-of-electric-
vehicles-in-thailand-remains-low
Enyedi, S. (2018). Electric cars — Challenges and trends. 2018 IEEE International
Conference on Automation, Quality and Testing, Robotics (AQTR).
doi:10.1109/aqtr.2018.8402776
EVgo. (2018). Battery & Plug-in Hybrid Electric Vehicles. Retrieved from
https://www.evgo.com/why-evs/types-of-electric-vehicles/
EVvolumes. (2017). Global Plug-in Sales for 2017-Q4 and the Full Year (prelim.).
Retrieved from http://www.ev-volumes.com/news/global-plug-in-sales-for-2017-
q4-and-the-full-year-prelim/
Frost & Sullivan. (2018). Global Electric Vehicle Market Outlook. Retrieved from
http://www.frost.com/sublib/display-report.do?id=MDAB-01-00-00-
00&bdata=bnVsbEB QEJhY2tAfkAxNTQ0MTY0ODIwOTE1
Ref. code: 25616002040845PKB
37
Frost & Sullivan. (2018, January). The Future of Electric Vehicles in South East Asia.
Retrieved from https://go.frost.com/AT_FutureofElectricVehicles_SA
Helven, Y. (2018, February 15). Automotive Outlook Thailand. Retrieved from
https://www.globalfleet.com/en/manufacturers/asia-pacific/features/automotive-
outlook-thailand
KPMG. (2018, January). Electric vehicle trends. Retrieved from
https://home.kpmg.com/th/en/home/insights/2018/02/th-electric-vehicles-industry-
focus.html
Newsroom.nissan-global. (2018). One in three Southeast Asian consumers open to
buying electric car. Retrieved from https://newsroom.nissan-
global.com/releases/one-in-three-southeast-asian-consumers-open-to-buying-
electric-car
Nissan Motor Thailand. (2018). Some 44% of Thai consumers will consider an EV
when making their next vehicle purchase decision, research shows. Retrieved
from https://en.nissan.co.th/news/purchase-decision-research.html
OICA. (2017). Production Statistics. Retrieved from
http://www.oica.net/category/production-statistics.
Panyaarvudh, J. (2018, September 26). Electric vehicles on the fast track in Thailand.
Retrieved from
http://www.nationmultimedia.com/detail/Startup_and_IT/30354739
Rastogi, V. (2018, August 13). Thailand's Automotive Industry: Opportunities and
Incentives. Retrieved from
https://www.aseanbriefing.com/news/2018/05/10/thailands-automotive-industry-
opportunities-incentives.html
Ref. code: 25616002040845PKB

38
APPENDICES
Ref. code: 25616002040845PKB

39
APPENDIX A
IN-DEPTH INTERVIEWS QUESTIONS
1. What is your favorite type of car?
2. What are the main factors in buying a car?
3. What are the top three factors in choosing a car? Please rank them from the
most important to the third most important.
4. What kind of car do you have?
5. Why did you decide to buy this car?
6. Do you have any ideas about electric cars?
7. What comes to your mind first when you think about electric cars?
8. What type of electric cars have you seen in Thailand?
9. Do you know the difference between hybrid, plug-in hybrid and battery
electric cars?
10. What do you think about electric cars in Thailand?
11. How often have you seen electric cars in Bangkok?
12. Do you know any electric car brands?
13. How did you hear about them?
14. Compared with normal gasoline cars, what way do you think electric cars are
different in terms of performance? Positive or Negative? Please explain?
15. What about in terms of safety?
16. In terms of costs and expenses?
17. What impacts do you think electric cars can have on the environment and
society?
18. If you ever decide to buy an electric car, what would be the most important
factors for you to switch from a gasoline car? Please rank the top three
factors?
19. Do you think our country is ready for electric cars now?
20. What about in the future? What would need to be done for people to start
using electric cars?
Ref. code: 25616002040845PKB

40
APPENDIX B
ONLINE QUESTIONNAIRE QUESTIONS
Part 1: Screening Questions
1. Do you live in Bangkok Metropolitan area?
• Yes
• No (End of survey)
2. How old are you?
• Below 25 (End of survey)
• 25-29
• 30-34
• 35-39
• 40-44
• 45-49
• Above 49 (End of survey)
Part 2: Personality
3. Please rate how much do you agree or disagree on the following statements.
(1 Strongly Disagree - 5 Strongly Agree)
• I am usually among the first to try new products
• I like to update myself on new technology
• I want to look different than others
• I like to pay attention in details when selecting products.
• I believe higher price means higher quality
• I prefer high-end products with a high reputation
• I like to do volunteer work
• I prefer not to use plastic bags
• I like to try new activities
• I like outdoor sports
• I love freedom
Ref. code: 25616002040845PKB
41
• I dare to take a risk
Part 3: Electric car introduction
4. Do you know electric car?
• Yes
• No
In this survey, we will only focus on electric cars that need a plugin charging
with external power, which are 2 main types.
Plug-in hybrid electric vehicles (PHEVs) can recharge battery through both
regenerating braking and plugging in to an external power. Plug-in hybrid electric
vehicles can go up to 10-40 miles before the gas engines start to operate.
Battery electric vehicles (BEVs) are more often called as electric vehicles (EVs), are
fully electric with rechargeable batteries and no gasoline engine. The battery power is
used to run the electric motor and all onboard electronics. The best thing of battery
electric vehicles is that they do not release any harmful emissions. Battery electric
vehicles are charged from external power source only.
5. Have you ever seen electric car?
• Yes
• No
Part 4: Perception and attitude toward electric car
6. Please rate the following statements on how you think about electric car. (1
Strongly Disagree - 5 Strongly Agree)
• EV is advanced technology
• EV is a gas saver
• EV is environmental friendly
• EV is the future of transportation
• EV has a higher safety standard
Ref. code: 25616002040845PKB

42
• EV is worth the value
• EV has low maintenance cost
• EV charging stations are widely accessible
• EV can be driven in a long distance
• EV is smooth and silent
7. Please rate the following statements on how you think about people driving an
electric car. (1 Strongly Disagree - 5 Strongly Agree)
• A person is a tech savvy
• A person is concerned on the environment
• A person is wealthy
• It might be for old people
• This is a family person
• A person is smart
• A person is stylish
• A person is ready to take risk
8. I am interested to find our more information about electric car.
Please rate. (1 Strongly Disagree - 5 Strongly Agree)
Part 5: Factors on purchasing electric car
9. Please rate the following attributes that impact you on purchasing electric car
in the future. (1 Not Important - 5 Very Important)
• Performance
• Design
• Safety Standard
• Competitive Price
• Maintenance Cost
• Reliability of Technology
• Dealer coverage in my area
Ref. code: 25616002040845PKB
43
10. Please rate the following external factors that impact you on purchasing
electric car in the future. (1 Not Important - 5 Very Important)
• Charging station coverage in major cities
• Charging point at home/apartment
• Option for a faster charge
• Ability to charge at work
• Lower Tax on EVs
• Priority Parking for EV drivers
• Toll Discounts
11. I am interested in purchasing electric car in the future.
Please rate. (1 Strongly Disagree - 5 Strongly Agree)
12. How much would you like to pay for an electric car?
• Below 1,000,000 Baht
• 1,000,001 – 1,500,000 Baht
• 1,500,001 – 2,000,000 Baht
• 2,000,001 – 2,500,000 Baht
• 2,500,001 – 3,000,000 Baht
• Above 3,000,000 Baht
Part 6: Personal Information
14. Gender
• Male
• Female
15. What is your marital status?
• Single
• In a relationship
• Married
• Divorced
Ref. code: 25616002040845PKB

44
• Widowed
16. What is your highest level of education?
• Lower than High School
• High School
• Bachelor’s Degree
• Master’s Degree
• Doctoral Degree
• Others
17. What is your current job?
• Student
• Government Officer
• Office Worker
• Business Owner
• Freelance
• Unemployed
• Other (Please specify)
18. How much do you make per month?
• Below 20,000 Baht
• 20,001 - 40,000 Baht
• 40,001 - 60,000 Baht
• 60,001 - 80,000 Baht
• 80,001 - 100,000 Baht
• Above 100,000 Baht
Ref. code: 25616002040845PKB

45
APPENDIX C
RESPONDENTS’ DEMOGRAPHIC DATA
Demographics Frequency (n=160)
Percent
Male 67 42%
Female 93 58%
Gender
Total 160 100%
25-29 77 48%
30-34 35 22%
35-39 18 11%
40-44 18 11%
45-49 12 8%
Age (Years)
Total 160 100%
High school or equivalent 2 1%
Bachelor’s degree or equivalent
84 52%
Master’s degree 70 44%
Doctor of Philosophy 4 3%
Highest Level of Education
Total 160 100%
Ref. code: 25616002040845PKB

46
Demographics Frequency (n=160)
Percent
Government officer 9 6%
Office worker 95 59%
Business owner 34 21%
Freelancer 10 6%
Unemployed 3 2%
Others 9 6%
Occupation
Total 160 100%
Less than 20,000 14 9%
20,001 - 40,000 49 31%
40,001 - 60,000 48 30%
60,001 - 80,000 17 11%
80,001 - 100,000 12 7%
More than 100,000 20 12%
Monthly Income (Baht)
Total 160 100%
Ref. code: 25616002040845PKB

47
BIOGRAPHY Name Mr. Votsawat Chaichitti
Date of Birth September 2, 1989
Educational Attainment 2013: Bachelor of Science in Media Arts,
Web Design,
Platt College San Diego
Work Position UI/UX Designer / Developer
VSSL Agency
Work Experiences 2015 – Current: UI/UX Designer / Developer
VSSL Agency
2014 – 2015: Front-End Developer and UI/UX Designer
Bike Bandit, LLC
2014: Web Designer and Front-End Developer
Hanhan Interactive
Ref. code: 25616002040845PKB