
A Study of Consumer Purchasing Behaviour in Emerging...
19
Global Journal of Emerging Trends in e-Business, Marketing and Consumer Psychology (GJETeMCP) An Online International Research Journal (ISSN: 2311-3170) 2016 Vol: 1 Issue 1 361 www.globalbizresearch.org A Study of Consumer Purchasing Behaviour in Emerging Markets – The Case of Indonesia and Smartphones Alexander Wollenberg, Bina Nusantara University, Binus Business School, Jakarta, Indonesia. E-mail: [email protected] ___________________________________________________________________________________ Abstract This paper provides a quantitative analysis on consumer purchasing behaviour in the smartphone market in West Java, Indonesia, using Jakarta as an example. Various handset characteristics, operating systems, and country of origin of diverse smartphone makers were operationalised in order to provide an overview of consumer preferences according to demographic factors. The findings of the study could be important to the marketing strategies of smartphone makers in emerging markets. ___________________________________________________________________________ Key Words: Consumer Behaviour, Innovation, Emerging Markets, Indonesia, Quantitative, Marketing
Transcript of A Study of Consumer Purchasing Behaviour in Emerging...

Global Journal of Emerging Trends in e-Business, Marketing and Consumer Psychology (GJETeMCP)
An Online International Research Journal (ISSN: 2311-3170)
2016 Vol: 1 Issue 1
361 www.globalbizresearch.org
A Study of Consumer Purchasing Behaviour in Emerging Markets –
The Case of Indonesia and Smartphones
Alexander Wollenberg,
Bina Nusantara University,
Binus Business School,
Jakarta, Indonesia.
E-mail: [email protected]
___________________________________________________________________________________
Abstract
This paper provides a quantitative analysis on consumer purchasing behaviour in the
smartphone market in West Java, Indonesia, using Jakarta as an example. Various handset
characteristics, operating systems, and country of origin of diverse smartphone makers were
operationalised in order to provide an overview of consumer preferences according to
demographic factors. The findings of the study could be important to the marketing strategies
of smartphone makers in emerging markets.
___________________________________________________________________________
Key Words: Consumer Behaviour, Innovation, Emerging Markets, Indonesia, Quantitative,
Marketing

Global Journal of Emerging Trends in e-Business, Marketing and Consumer Psychology (GJETeMCP)
An Online International Research Journal (ISSN: 2311-3170)
2016 Vol: 1 Issue 1
362 www.globalbizresearch.org
1. Introduction
Recently mobile phone market has emerged as a most important in electronic sector. There
are various companies which are in this market but are battling for survival in competitive
market. McNeal (2001) stated that an organization can leave behind the competition inly if it
keenly studies its present users and prospective users.
In recent era, it has been observed that users of mobile phones is increasing day by day.
Handset manufacturing organizations in present times are eager to know what factors influence
buying behaviour of an individual. It has been continuously observed that decision making
process for buying a product is built upon past experiences and perception of customer also to
include the offers by the organization and level of customer satisfaction. This study is an
attempt is discover the factors which influence of decision making process of a customer in
mobile handset buying, customer satisfaction and customer loyalty.
1.1 Consumer Behaviour
Consumer behaviour is defined as a field of study, focusing on consumer activities.
(Blackwell, et al., 2001). Consumer behaviour is also defined as the behaviour that consumers
display in searching for purchasing, using, evaluating and disposing of products and services
that they expect will satisfy their needs (Schiffman & Kanuk, 2004).
Consumer behaviour is defined as activities people undertake when obtaining, consuming
and disposing of products and services. Obtaining refers to the activities leading up to and
including the purchase or receipt of the product. Some of these activities include searching for
information regarding the product features and choices, evaluating alternative products or
brands, and purchasing (Blackwell, et al., 2001).
1.2 Consumer decision making process
Schiffman and Kanuk (2004) has identified that consumer goes through a process for
decision making. Consumer is diverse and have complex behaviour. The figure 1.1 explain the
process of decision making.
1.3 Variables studied in the study
This section of the chapter provides an overview of the variables which are being examined
in the study. The variables which are being examined are (1) characteristics of handset, (2) style
of handset, (3) country of origin, (4) customer satisfaction, and (5) customer loyalty.
1.4 Characteristics of Handset
Characteristics of handsets comprise of the desired characteristics by the customer which
he/she wants to avail in the handset. The desired characteristics of handset were identified by
Kannan (2013) in his doctoral thesis. He elaborated that shape, attractiveness, size, weight,
screen, hardware, operating system, games, music player, internet, battery size, ringtones,
network coverage, speaker phone, camera, RAM and SAR value as important characteristics of

Global Journal of Emerging Trends in e-Business, Marketing and Consumer Psychology (GJETeMCP)
An Online International Research Journal (ISSN: 2311-3170)
2016 Vol: 1 Issue 1
363 www.globalbizresearch.org
handset perceived by consumer. Characteristics play an important role in consumer’s decision
making process. He looks out for important characteristics in handset which he/she wishes to
have according to his use.
1.5 Style of Handset
Kannan (2013) in his study also explained that style of handset also is an important factor
which affects buy behaviour of an individual. He emphasized that an individual looks for a
mobile which suits its personality, it should the current fashion, it should have latest operating
system, preinstalled applications also should be present and the handset should also be well
known among user’s peers.
1.6 Country of Origin
Upadhyay et al. (2006) studied ethnocentrism in Indonesian context and found that
consumers are also effected by the country of origin of the product. The perception is created
by the consumer about the product by adjudging the country to which it belongs. The best
examples can be like Italy is famous for its designs, USA for sturdy products and Japan for
technologically advanced products. Country of origin is also found to play as an important
influencer when consumer goes to buy a product.
1.7 Customer Satisfaction
Customer satisfaction, as a business term, is a measurement of how products and services
supplied by a company meet or surpass customer expectation. It is seen as a key performance
indicator within business and is part of the four of a Balanced Scorecard.
In a competitive marketplace where businesses compete for customers, customer
satisfaction is seen as a key differentiator and increasingly has become a key element of
business strategy.
However, the importance of customer satisfaction diminishes when a firm has increased
bargaining power. For example, cell phone plan providers, such as AT&T and Verizon,
participate in an industry that is an oligopoly, where only a few suppliers of a certain product
or service exist. As such, many cell phone plan contracts have a lot of fine print with provisions
that they would never get away if there were, say, a hundred cell phone plan providers, because
customer satisfaction would be way too low, and customers would easily have the option of
leaving for a better contract offer.
1.8 Customer Loyalty
Customer loyalty is referred as intention of repurchasing a product repeatedly. From a
seller’s point of view, recognized it as a key path to profitability. Early views of brand loyalty
focused on repeat purchase behaviour. Brown (1952) classified loyalty into four categories, (1)
Undivided loyalty, (2) Divided loyalty, (3) Unstable loyalty, and (4) No loyalty, based on

Global Journal of Emerging Trends in e-Business, Marketing and Consumer Psychology (GJETeMCP)
An Online International Research Journal (ISSN: 2311-3170)
2016 Vol: 1 Issue 1
364 www.globalbizresearch.org
the purchase patterns of consumers. Jacoby (1971) expressed the view that loyalty is a biased
behavioural purchase process that results from a psychological process. Assael (1992) defined
brand loyalty as “a favorable attitude towards a brand resulting consistent purchase of brand
over-time. Gremler (1995) suggested that both the attitudinal and behavioural dimensions need
to be incorporated in any measurement of loyalty. More the customer is loyal, more the level
of profit is earned by the seller.
2. Objective of the Study
The main objective of the study was to identify the factors which help a consumer
determine or take a buying decision for mobile handset. The major objective have been
bifurcated in to following objectives.
1. To determine the factors affecting the buying behaviour of individual of mobile
handset.
2. To determine which characteristics of handset influenced buying behaviour of
individual.
3. To determine did style of handset influenced buying behaviour of individual.
4. To determine whether country of origin influenced buying behaviour of individual.
5. To determine whether demographic profiles like gender, age and income influenced
buying behaviour of individual.
2.1 Research Questions
From the literature provided in earlier part of the chapter following research questions were
found to be answered.
1. What characteristics do buyers seek in handsets before making a purchasing decision?
2. Does demography affect purchasing decisions?
3. Are customers who are using handsets are satisfied?
4. Are customers loyal to the handset manufacturing company?
2.2 Statement of Problem
Indonesia is the second largest market in terms of volume of goods supplied and it is one
of the fastest growing markets in telecommunications. Consumers in Indonesia belong to
different sociocultural classes and are diversified. The researcher tries to identify the
characteristics of handsets consumers look for before making a purchasing decision and to
evaluate post-purchase decisions, including satisfaction with the purchase and likelihood of
repeat purchases.
2.3 Importance of the Study
The study by Morrison (1979) elaborately discussed purchasing intentions of individual
consumers. This study also ascertains purchasing intentions and factors which individual
consumers seek before making purchasing decisions for smartphones.

Global Journal of Emerging Trends in e-Business, Marketing and Consumer Psychology (GJETeMCP)
An Online International Research Journal (ISSN: 2311-3170)
2016 Vol: 1 Issue 1
365 www.globalbizresearch.org
3. Literature Review
3.1 Consumer Behaviour
The challenge for marketers is to understand the diversity of consumer behaviour and offer
goods and services accordingly. The success of the firm is, to a large extent, determined by how
effective it has been in meeting diverse consumer needs by offering products and services to
suit needs and creating sustainable value and relationship with the consumer (Nair, 2004).
The American Marketing Association has defined consumer behaviour as, “The dynamic
interaction of affect and cognition, behaviour, and the environment by which human beings
conduct the exchange aspects of their lives.” (Anderson & Bennett, 1988)
Marketers have come to realise that their effectiveness in meeting consumer needs directly
influence their profitability. The better marketers understand the factors underlying consumer
behaviour, the better they are able to develop effective marketing strategies to meet consumer
needs (Assael, 1987).
The term consumer behaviour is defined as the behaviour that consumers display in
searching for, purchasing, using, evaluating and disposing of products and services that they
expect will satisfy their needs. Consumer behaviour focuses on how individuals make decisions
to spend their available resources (time, money, effort) on consumption related items -
including what they buy, why they buy it, when they buy it, where they buy it, how often they
buy it, how often they use it, how they evaluate it after the purchase and the impact of such
evaluations on future purchases, and how they dispose of it.
Marketers thus need to understand the personal and group influences that affect consumer
decisions and how these decisions are made (Schiffman & Kanuk, 2007)
Consumer behaviour reflects the totality of consumers’ decisions with respect to the
acquisition, consumption, and disposition of goods, services, time, and ideas by (human)
decision making units [overtime] (Hoyer & Macinnis, n.d.).
Sirgy (1982) argued that idolisation of image of self-influences purchasing decisions. Sirgy
(1982) found that gender plays an important role in selecting a product, and he stated that self-
concept theory is useful in creation of attitudinal models for consumer behaviour and should be
researched more.
Palan (2001) examines consumer behaviour grounded in theoretical models of gender
identit. Palan (2001) evaluated whether gender identity research is still warranted, and proposes
specific research questions to guide future research:
1. Which gender variable(s) is (are) most relevant to the study under consideration?
2. What additional personality traits or sub-dimensions of instrumental and expressive traits
that are associated with gendered responses exist?

Global Journal of Emerging Trends in e-Business, Marketing and Consumer Psychology (GJETeMCP)
An Online International Research Journal (ISSN: 2311-3170)
2016 Vol: 1 Issue 1
366 www.globalbizresearch.org
3. What is the relationship between gendered personality traits and gender salience in different
contexts?
Palan (2001) stated that “gender identity” is a much broader concept and more empirical
work is required to enhance understanding of this concept. Gender identity is a complex, often
misunderstood concept (Palan, 2001).
Jarvis , Mackenzie and Podaskoff (2003) in their empirical study discussed the distinction
between formative and reflective measurement models. They developed a set of conceptual
criteria which could be further used to determine whether a construct should be modeled as
having formative or reflective indicators. They also reviewed the marketing literature to obtain
an estimate of the extent of measurement model misspecification in the field (Jarvis et al.,
2003). Their results indicated that there are important theoretical and empirical distinctions
between formative and reflective indicator measurement models, and that as many as 28% of
the latent constructs with multiple indicators published in the top marketing journals were
incorrectly specified as reflective when they should have been formative (Jarvis et al., 2003).
They also indicated that a substantial proportion of the empirical results in the literature may
be potentially misleading.
3.2 Research Questions
The following additional research questions can be developed based on the previous part
of the literature review.
1. What characteristics do buyers seek in handsets before making purchasing decisions?
2. How does demography affect purchasing decisions?
3. Are customers satisfied with their handsets?
4. How loyal customers to the handset manufacturing company?
3.3 Research Methods
The quantitative part of the study in this research involved the collection of primary data
from customers who were buying electronic products and their buying behaviour in the capital
district of Jakarta, Indonesia’s main economic centre. A structured questionnaire was designed
for the purpose of data collection.
3.4 Hypotheses Framed
In this dissertation, hypotheses are formed centered on the research about the factors that
affect the purchasing behaviour and decision-making process in electronic goods. A “null"
hypothesis is used in this paper, claiming impact and factors affecting purchasing behaviour,
which is to be disproven. The hypotheses use customer purchasing behaviour of electronic
goods as dependent factors and examine the factors which affect buying behaviour decision as
an independent variable. The process of testing the hypothesis is described in the figure 1 below.

Global Journal of Emerging Trends in e-Business, Marketing and Consumer Psychology (GJETeMCP)
An Online International Research Journal (ISSN: 2311-3170)
2016 Vol: 1 Issue 1
367 www.globalbizresearch.org
Figure 1: Process of Testing Hypothesis
Making Assumption
Select Appropriate Method
Collect Information
Interpreting Methods of Analysis
Hypotheses
AcceptedHypotheses
Rejected
True False
3.5 Hypothesis
Figure 1 illustrates the building process of the following hypotheses:
H01: Characteristics of handset does not affect consumer purchasing behaviour
H02: Style of handset has no effect on consumer purchasing behaviour
H03: There is no significant difference in purchasing behaviour according to age
H04: Country of origin has no effect on purchasing behaviour
H05: There is no significant difference in purchasing behaviour of customer according to
income group
H06: There is no significant difference in purchasing behaviour of customer according to
Gender.
H07: The customer is not satisfied with the purchase of a mobile phone
3.6 Sampling
This study required a self-administered questionnaire as many variables needed to be
explored. The questionnaire consisted of 57 questions, including 5 demographic questions, 46
questions to measure preference of consumer towards cellular phones and 6 questions to
measure intention to repurchase and refer cellular phone to other customers.
Anecdotal observations indicated that mail interviews would be difficult in Indonesia where
there is a tendency to discard such mail. Malhotra & Peterson (2001) also noted that the mail
interview method is not popular in developing countries, as postal addresses are often not
available.
4. Scope of the Study
This study focuses on how the concepts of factors of decision making process which effects
consumer buying behaviour particularly in smartphones in the Jakarta region. Respondents here

Global Journal of Emerging Trends in e-Business, Marketing and Consumer Psychology (GJETeMCP)
An Online International Research Journal (ISSN: 2311-3170)
2016 Vol: 1 Issue 1
368 www.globalbizresearch.org
belong to multiple socio-economic classes and income groups. A wide variety of respondents
can thus be obtained from Jakarta.
4.1 Subject Selection and Sample
The study was set in Jakarta. This area was taken for study because it is considered as
greatest diversified population area in Indonesia. The sampling plan was non-probability,
mainly convenience sampling.
Jakarta is divided into 5 parts - north, central, south, east and west. These five parts have been
further divided into 10 zones.
4.2 Sample Profile, Distribution of Sample, and Frequencies of Respondents
In order to understand the profile of the sample, data was analysed with the help of SPSS
20.0.
The total sample of customers consisted of 129 responses. With the help of cross-tabulation
researcher had identified that from which occupation how much data (in different categories)
had been collected.
From table 2 it can be deduced that out of the total 129 responses 49.6 % (64) were male
and 50.4% (65) were females (refer figure 1).
Table 2: Gender
Frequency Percent
Gen
der
Male 63 48.4
Female 66 51.6
Total 129 100.0
Figure 1: Gender
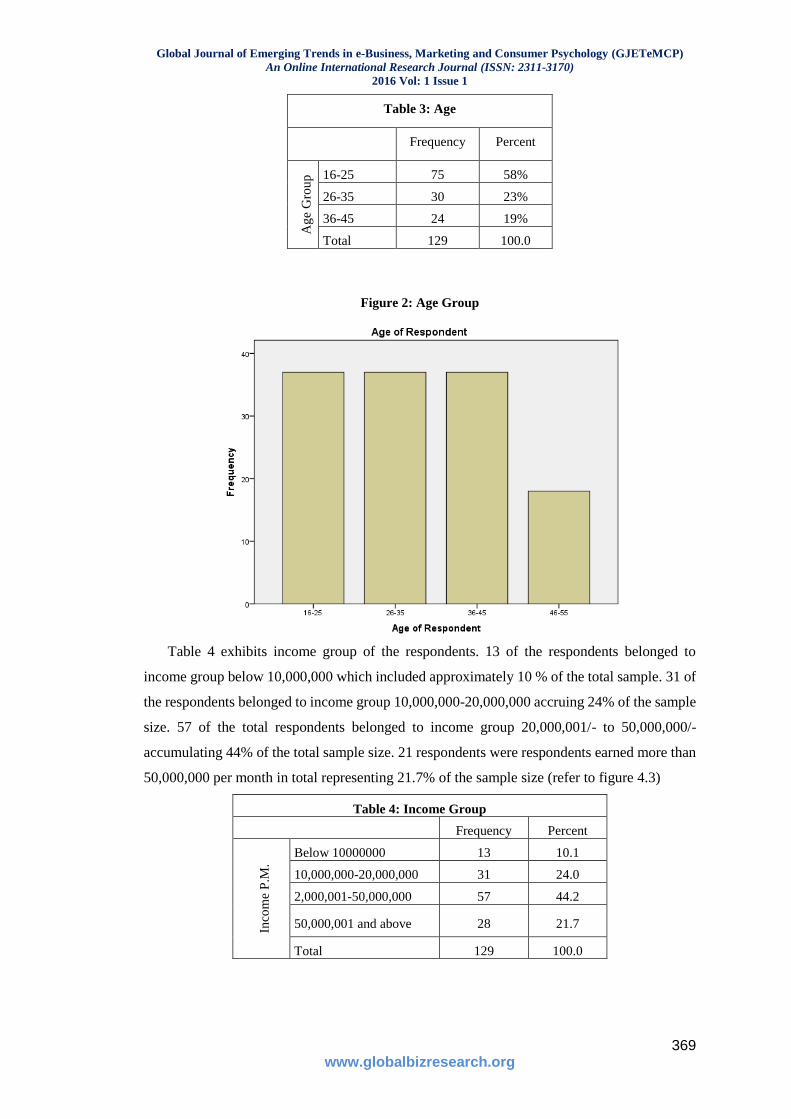
Table 3 exhibits the distribution of the age group of the respondents. 58% (75 responses)
were aged in between 16 years to 25 years. Again 23 % (30 responses) were aged between 26-
35 years. And finally 19 % (18 responses) were aged between 46-55 years (refer figure 4.2)
Global Journal of Emerging Trends in e-Business, Marketing and Consumer Psychology (GJETeMCP)
An Online International Research Journal (ISSN: 2311-3170)
2016 Vol: 1 Issue 1
369 www.globalbizresearch.org
Table 3: Age
Frequency Percent
Ag
e G
rou
p 16-25 75 58%
26-35 30 23%
36-45 24 19%
Total 129 100.0
Figure 2: Age Group
Table 4 exhibits income group of the respondents. 13 of the respondents belonged to
income group below 10,000,000 which included approximately 10 % of the total sample. 31 of
the respondents belonged to income group 10,000,000-20,000,000 accruing 24% of the sample
size. 57 of the total respondents belonged to income group 20,000,001/- to 50,000,000/-
accumulating 44% of the total sample size. 21 respondents were respondents earned more than
50,000,000 per month in total representing 21.7% of the sample size (refer to figure 4.3)
Table 4: Income Group
Frequency Percent
Inco
me
P.M
.
Below 10000000 13 10.1
10,000,000-20,000,000 31 24.0
2,000,001-50,000,000 57 44.2
50,000,001 and above 28 21.7
Total 129 100.0

Global Journal of Emerging Trends in e-Business, Marketing and Consumer Psychology (GJETeMCP)
An Online International Research Journal (ISSN: 2311-3170)
2016 Vol: 1 Issue 1
370 www.globalbizresearch.org
Figure 3: Income per month
4.3 Measure of Reliability
It is important to assess the reliability of instruments in order to design good scales for
measurement. Reliability can be defined as the extent to which measures are free from error
and thus yield consistent results (Zikmund, 1994). Reliability is construed as the internal
consistency of items comprising a construct and repeatability of the measure (Avkiran, 1995).
Stone (1978) postulated that internal consistency addresses the homogeneity of a measure.
Nunnally (1978) recommended calculation of coefficient alpha (also known as Cronbach
alpha) in order to assess the reliability of a multiple-item variable. Churchill and Peter (1984)
suggested an accepted level for the alpha coefficient. According to them a value of alpha below
0.60 is undesirable. Nunnally (1978; 1988) indicated that new developed measures can be
accepted with an alpha value of 0.60, otherwise, 0.70 should be the threshold. However,
considering the use of these scales for the first time in a new culture, the cut off value for the
alpha coefficient was set up for 0.60 for all the scales (self-developed scales).
The reliability of the questionnaire was computed by using SPSS 20.0 software. Cronbach’s
alpha reliability coefficients were computed for all the items in the questionnaire.
Table 5: Reliability Statistics
Cronbach's Alpha N of Items
.868 32
It is considered that the reliability value more than 0.6 is good and it can be seen that most
of the important reliability methods applied here, reliability value was higher than the standard
value, therefore, all the items in the questionnaire were highly reliable.
4.4 Analysis of variance within subjects for variables of Characteristics of handset
(income-wise)
A one-way within subjects ANOVA was conducted on the score of variables to compare
the opinion differences of different income groups. Results of ANOVA reported in table 6 and
it suggested that 14 out of 17 variables were found with significantly different opinions about

Global Journal of Emerging Trends in e-Business, Marketing and Consumer Psychology (GJETeMCP)
An Online International Research Journal (ISSN: 2311-3170)
2016 Vol: 1 Issue 1
371 www.globalbizresearch.org
characteristics of handset. To know how their opinion was different mean plots were prepared
to measure actual differences in opinion. Because only 14 variable were reported significantly
different, which is why 14 mean plots were prepared for actual measurement of opinion
differences.
Table 6: ANOVA (income-wise*Characteristics)
Sum of Squares df Mean Square F Sig.
Char 1
Between Groups 1.653 3 .551 1.755 .159
Within Groups 39.246 125 .314
Total 40.899 128
Char 2
Between Groups 4.516 3 1.505 2.344 .076
Within Groups 80.290 125 .642
Total 84.806 128
Char 3
Between Groups 7.170 3 2.390 3.283 .023
Within Groups 90.986 125 .728
Total 98.155 128
Char 4
Between Groups 5.057 3 1.686 4.174 .007
Within Groups 50.478 125 .404
Total 55.535 128
Char 5
Between Groups 8.257 3 2.752 4.454 .005
Within Groups 77.246 125 .618
Total 85.504 128
Char 6
Between Groups 13.959 3 4.653 7.899 .000
Within Groups 73.638 125 .589
Total 87.597 128
Char 7
Between Groups 4.064 3 1.355 2.740 .046
Within Groups 61.812 125 .494
Total 65.876 128
Char 8
Between Groups 26.883 3 8.961 15.004 .000
Within Groups 74.652 125 .597
Total 101.535 128
Char 9
Between Groups 4.978 3 1.659 2.794 .043
Within Groups 74.246 125 .594
Total 79.225 128
Char 10
Between Groups 27.809 3 9.270 15.914 .000
Within Groups 72.812 125 .582
Total 100.620 128
Char 11
Between Groups 18.191 3 6.064 9.935 .000
Within Groups 76.290 125 .610
Total 94.481 128
Char 12 Between Groups 32.935 3 10.978 14.252 .000

Global Journal of Emerging Trends in e-Business, Marketing and Consumer Psychology (GJETeMCP)
An Online International Research Journal (ISSN: 2311-3170)
2016 Vol: 1 Issue 1
372 www.globalbizresearch.org
Within Groups 96.290 125 .770
Total 129.225 128
Char 13
Between Groups 31.705 3 10.568 16.243 .000
Within Groups 81.333 125 .651
Total 113.039 128
Char 14
Between Groups 15.891 3 5.297 5.947 .001
Within Groups 111.333 125 .891
Total 127.225 128
Char 15
Between Groups 18.436 3 6.145 5.268 .002
Within Groups 145.812 125 1.166
Total 164.248 128
Char 16
Between Groups 54.442 3 18.147 17.646 .000
Within Groups 128.551 125 1.028
Total 182.992 128
Char 17
Between Groups 4.881 3 1.627 1.518 .213
Within Groups 133.957 125 1.072
Total 138.837 128
4.5 Analysis of variance within subjects for variables of country of origin of handset (age
group-wise)
A one-way within subjects ANOVA was conducted on the score of variables to compare
the opinion differences of both genders. Results of ANOVA reported in table 7 and it suggested
that none of 2 variables were found to significantly different opinions about country of origin.
To know how their opinion was different mean plots were prepared to measure actual
differences in opinion. Because no variables showed significant differences, no mean plots were
prepared for actual measurement of opinion differences.
Table 7: ANOVA (Country of origin*Age group)
Sum of
Squares df
Mean
Square F Sig.
Country 1 Between Groups 1.550 2 .775 .605 .548
Within Groups 161.380 126 1.281
Total 162.930 128
Country 2 Between Groups 2.709 2 1.355 1.321 .270
Within Groups 129.167 126 1.025
Total 131.876 128
4.6 One sample T-test within subjects to examine satisfaction and loyalty of customers
Table 8 exhibits the level of satisfaction and loyalty of customer among the customers of
mobile phone users. It can be observed that proper after-sales service must be provided by the
handset manufacturers, including a reasonable service fee if outside the warranty period.

Global Journal of Emerging Trends in e-Business, Marketing and Consumer Psychology (GJETeMCP)
An Online International Research Journal (ISSN: 2311-3170)
2016 Vol: 1 Issue 1
373 www.globalbizresearch.org
Customers were also satisfied with the retailer where they had bought the handset. Customers
also believe that the prices are competitive from the retailer where the phone was purchased.
Customer is also satisfied from the battery performance of the handset (refer table 4.13). The
p=0.000 and df= 128, thus indicating that customer is satisfied from the handset he/she is using.
Loyalty is also indicated in table 8 indicating that customer will recommend handset to other,
and using other products of the handset manufacturer and will upgrade the handset by the same
manufacturer if offered (p=0.000, df=128).
Table 8: One-Sample Test on satisfaction and loyalty
Test Value = 0
t df Sig. (2-tailed)
Mean
Difference
95% Confidence
Interval of the
Difference
Lower Upper
Satis 1 45.147 128 .000 3.039 2.91 3.17
Satis 2 54.125 128 .000 3.380 3.26 3.50
Satis 3 36.732 128 .000 3.504 3.32 3.69
Satis 4 41.866 128 .000 3.078 2.93 3.22
Satis 5 26.283 128 .000 2.659 2.46 2.86
Loyal 1 23.084 128 .000 2.705 2.47 2.94
Loyal 2 39.990 128 .000 2.984 2.84 3.13
Loyal3 59.360 128 .000 3.457 3.34 3.57
It is observed from the one sample t test that customers are satisfied from the handset which
they are using in present and are willing to continue usage of their current handset manufacturer
and also are willing to suggest the
4.7 One-Sample Komlogorov Smirnov test (gender-wise, income group-wise and age
group-wise)
One-Sample Komlogorov Smirnov test was applied on the score of variables to compare the
opinion differences of both genders, income groups and age groups. Results of statistical
procedure reported in table 9.
Table 9: One-Sample Komlogorov Smirnov test
(Gender, income group and age group-wise)

Global Journal of Emerging Trends in e-Business, Marketing and Consumer Psychology (GJETeMCP)
An Online International Research Journal (ISSN: 2311-3170)
2016 Vol: 1 Issue 1
374 www.globalbizresearch.org

Global Journal of Emerging Trends in e-Business, Marketing and Consumer Psychology (GJETeMCP)
An Online International Research Journal (ISSN: 2311-3170)
2016 Vol: 1 Issue 1
375 www.globalbizresearch.org
Table 10: Summary of major hypotheses tested for this study (as submitted in proposal)
Summary of Hypothesises Tested for Study
Hypothesis
No.
Reference Null Hypotheses Result Alternate
Hypothesis
Resulted Hypotheses
H01 Table 4.15
(Char1-
Char17)
Characteristics of handset does not affect
consumer purchasing behaviour Alternative
hypothesis accepted
(1-tailed;sig: 0.000)
H01a Characteristics of handset does affect
consumer purchasing behaviour
H02 Table 4.15
(Style1-
Style5)
Style of handset has no effect on consumer
purchasing behaviour Alternative
hypothesis accepted
(1-tailed;sig: 0.000)
H02a Style of handset has significant effect on
consumer purchasing behaviour
H03 Table 4.15
(Char1-
Country2)
There is no significant difference in
purchasing behaviour according to age Alternative
hypothesis accepted
(1-tailed;sig: 0.000)
H03a There is significant difference in purchasing
behaviour according to age
H04 Table 4.15
(Country1-
Country2)
Country of origin has no effect on
purchasing behaviour Alternative
hypothesis accepted
(1-tailed;sig: 0.000)
H04a Country of origin has positive effect on
purchasing behaviour
H05 Table 4.15
(Char1-
Country2)
There is no significant difference in
purchasing behaviour of customer
according to income group
Alternative
hypothesis accepted
(1-tailed;sig: 0.000)
H05a There is significant difference in purchasing
behaviour of customer according to income
group
H06 Table 4.15
(Char1-
Country2)
There is no significant difference in
purchasing behaviour of customer
according to Gender
Alternative
hypothesis accepted
(1-tailed;sig: 0.000)
H06a There is significant difference in purchasing
behaviour of customer according to Gender
H07 Table 4.15
(Char1-
Country2)
The customer is not satisfied with the
purchase of cell phone Alternative
hypothesis accepted
(1-tailed;sig: 0.000)
H07a The customer is satisfied with the purchase of
cell phone

Global Journal of Emerging Trends in e-Business, Marketing and Consumer Psychology (GJETeMCP)
An Online International Research Journal (ISSN: 2311-3170)
2016 Vol: 1 Issue 1
376 www.globalbizresearch.org
5. Findings of the Study
The following are developed from analysis of the data.
1. The collected data represents that all of the respondents belonged to age group between
16 years to 45 years.
2. Males and females equally use handsets as the 66 were male and 63 were female
respondents.
3. It is observed in the study that characteristics of handset are considered very important
by all respondents regardless of their demographic profile and all respondents were
influenced by handset characteristics in their purchasing decision. However, the least
influenced group were males between 36-45 years.
4. Country of origin was not considered significantly important for the purchasing
decision of the customer.
5. The study found that nearly all customers from different demographic profiles were
satisfied with the handset which they used.
6. 4G connectivity was most preferred by respondents in age group 16-25 years.
7. Availability of camera in the handset was most preferred by respondents in age group
26-35 years.
8. Respondents from age group 26-35 years considered that handset which they are using
should enhance and suit their personality.
9. Respondents from age group 16-25 years considered that the handset should have a
long talk time/battery life and short recharge time.
10. Screen size and its quality was considered an important influencing factor in purchasing
decisions by respondents from age group 36-45 years.
11. The study also found that female respondents preferred availability of a speaker phone
in the handset and considered its features an important factor in making a purchasing
decision.
6. Limitations of the Study
1. The study was carried out in the Jakarta region of West Java, Indonesia. The sample
size was small only 129 respondents took part in the study. Thus the results cannot
necessarily be generalised for the country.
2. The study was carried out only on wireless telecommunication devices and could have
been carried out on different electronic products so that the results could be more
representative. For this purpose, a cross-national comparison could also have been
carried out.
3. The data collected only covered age group from 16 years to 45 years. The collected
responses could cover more age groups.

Global Journal of Emerging Trends in e-Business, Marketing and Consumer Psychology (GJETeMCP)
An Online International Research Journal (ISSN: 2311-3170)
2016 Vol: 1 Issue 1
377 www.globalbizresearch.org
4. The variables which constitute customer satisfaction should be studied thoroughly to
enhance understanding of consumer behaviour.
5. The study only used quantitative data to elaborate the hypothesised relationships.
6. The study should also incorporate the influence of family and social circles on
purchasing decisions of handsets should also be examined.
7. Conclusion
The mobile phone industry is one of the largest in the world. All mobile handset
manufacturers have their own identity in the market. Changing consumer preferences, high
impulse purchases, seasonality and intense price competition are among the main factors that
contribute to high uncertainty in consumer demand. In addition to the above, situational factors
including finance options, sales terms, short prodc life cycles are also important factors
confronting the mobile phone industry? Individual purchasing decisions involve cognitive
processes (e.g. motivation, perceptions and attitudes), decision-making steps, interaction of the
consumer with other groups including friends, family and colleagues, resulting in selection of
the brand and outlet depending on features and emotional appeal (marketing mix elements in a
given environment). A particular model and brand receive preference only when both model
and brand live up to the consumer’s expectations. A marketer should use all means of promoting
its product so that an image is created in the minds of customers in order to affect the purchasing
decision.
References
Anderson, P. F., & Bennett, P. D. (1988). Dictionary of Marketing Terms. Chicago: American Marketing
Association.
Assael, A., 1992. Consumer Behavior and Marketing Action.. 1st ed. Boston: PWS-KENT Publishing
Company..
Assael, H. (1987). Consumer Behaviour and Marketing Action. Boston: Kent Publishing Company.
Avkiran, N. K. (1995). A multivariate model of integrated branch performance and potential focusing on
personal banking. Unpublished Ph.D. thesis. Melbourne, Victoria: Victoria University of Technology.
Babbie, E. (1990). Survey Research Methods. Belmonte: Wadworth Publishing Company.
Berg, B. L., 1995. Quantitative Research Methods for Social Sciences. Needham Heights: Allyn &
Vacon.
Blackwell, R. D., Miniard, P. & Engel, J., 2001. Consumer Behaviour. 9th ed. New Delhi: Vikas
Publishing House Pvt Ltd.
Brassington, F. a. (2000). Principles of marketing. Vol. 134. Financial Times Prentice Hall.
Brown, G. H., 1952. Brand Loyalty – Fact or Fction? Advertising Age, 9 June, pp. 53-55.
Brown, J. V. & Churchill, R. V., 1996. Complex Variables and Application. New York: Mac-Graw Hill.
Bryman, A. (1984). The Debate about Quantitative and Qualitative Research: A Question of Method or
Epistemology. The British Journal of Sociology, 35(1), 75-92.
Bryman, A. (1988). Quantity and Quality in Social Research. London: Unwin Hyman.
Bryman, A. (1989). Research Methods and Organizational Studies. London: Unwin and Hyman Ltd.
Bryman, A., 1988. Quantity and Quality in Social Research. London: Unwin Hyman.

Global Journal of Emerging Trends in e-Business, Marketing and Consumer Psychology (GJETeMCP)
An Online International Research Journal (ISSN: 2311-3170)
2016 Vol: 1 Issue 1
378 www.globalbizresearch.org
Bryman, A., 1989. Research Methods and Organizational Studies. London: Unwin and Hyman Ltd.
Coakes, S. J. & Steed, L. G., 2001. SPSS – Analysis without Anguish. Milton, Queensland: John Wiley
and Sons Australia, Ltd...
Cox, K., 1996. Hello. hello. hello. in India, there is still a busy signal. World Business, 2(2), pp. 5-5.
Creswell, J., 1994. Research Design: Qualitative and quantitative Approach. Thousand Oaks, California:
Sage Publications.
Das, T. H., 1983. Qualitative research in organizational behaviour. Journal of Management Studies,
20(3), pp. 300-314.
Dwivedi, R. S., 1997. Research Methods in Behavioural Sciences. Delhi: Macmillan Publishers India
Ltd..
Gremler, D. D., 1995. The Effect of Satisfaction, Switching Costs, and Interpersonal Bonds on Service
Loyalty. s.l.:Unpublished Doctoral Thesis, Arizona State University.
Hair, J. F., Anderson, R. E., Tatham, R. L. & Black, W. G., 1998. Multivariate Data Analysis. 5th ed.
Upper Saddle River, New Jersey: Prentice-Hall, Inc...
Hoyer, W. D., & Macinnis, D. J. (n.d.).
Huang, C. L., 1998. Canadian business pursuits in the PRC, Hong Kong and Taiwan, and Chinese
perception of Canadians as business partners. Multinational Business Review, 6(1), pp. 73-82.
Jarvis , C. B., Mackenzie, S. B., & Podaskoff, P. M. (2003). A Critical Review of Construct Indicators
and Measurement Model Misspecification in Marketing and Consumer Research. Journal of Consumer
Research, 199-218.
Kannan, K., 2013. Study of Consumer Buying Behavior towards Smart Phones in Kerla. Madurai:
University Press.
Kaurav, R. P. S. & Baber, R., 2009. Selection of Geographical Area for Researches. New Delhi: Wisdom
Publication.
Keller, & Kotler. (2012). Framework for marketing management. Pearson Education India.
KEYS, T. P. (2011). The Painter's Keys. Retrieved from
http://quote.robertgenn.com/: auth_search.php?authid=6466
Kuester. (2012). Strategic Marketing & Marketing in Specific Industry. University of Mannheim.
Malhotra, N. K. & Peterson, M., 2001. Marketing research in the new millennium: emerging issues and
trends. Marketing Intelligence and Planning, 19(4), pp. 216-235.
Reichardt, C. S. & Cook, T. D., 1979. Beyond qualititative versus quantitative methods. In: Qualititative
and Quantitative Methods in Education Research. s.l.:s.n.
Schiffman, L. & Kanuk, L., 2004. Consumer Behaviour. 8th ed. New Delhi: Prentice-Hall of India Pvt.
Ptd.
Schiffman, L. B., & Kanuk, L. L. (2007). Consumer Behaviour. New Delhi: Dorling & Kindersley (India)
Pvt. Ltd.
Siegel, S. & Castellan, J. N., 1988. Nonparametric Statistics for the Behavioural Science. New Delhi:
McGraw-Hill.
Sirgy, M. J. (1982). Self-concept in Consumer Behavior: A Critical Review. Journal of Consumer
Research, 287-300.
Tesch, R., 1990. Qualitative Research: Analysis and Software Tools. Hampshire: Falmer Press.
Trachtman, J. N., Giambalvo, V. & Dippner, R. S., 1978. On the assumptions concerning the assumptions
of a t-test. The Journal of General Psychology, 99(1), pp. 107-116.
Upadhyay, Y., Singh, S. K. & Sharma, D. K., 2006. Consumer Ethocentrism: A Study of Indian
Consumers. Vision: Journal of Management, 7(4), pp. 111-123.
Zikmund, G. W., 2000. Business Research Methods. 6th ed. New York: The Dryden Press, Harcourt
College Publishers.

Global Journal of Emerging Trends in e-Business, Marketing and Consumer Psychology (GJETeMCP)
An Online International Research Journal (ISSN: 2311-3170)
2016 Vol: 1 Issue 1
379 www.globalbizresearch.org
Zikmund, W. G. (1994). Business Research Methods (4th ed.). New York: Harcourt Brace College
Publishers.
Zikmund, W. G., 2003. Business Reasearch Method. New Delhi: Cengage Learning India pvt ltd.