A study of attrition relative to institutional performance ...
147
University of Massachusetts Amherst University of Massachusetts Amherst ScholarWorks@UMass Amherst ScholarWorks@UMass Amherst Doctoral Dissertations 1896 - February 2014 1-1-1978 A study of attrition relative to institutional performance policies A study of attrition relative to institutional performance policies within the context of the unique environment of Springfield within the context of the unique environment of Springfield Technical Community College. Technical Community College. J. Stanley Cummings University of Massachusetts Amherst Follow this and additional works at: https://scholarworks.umass.edu/dissertations_1 Recommended Citation Recommended Citation Cummings, J. Stanley, "A study of attrition relative to institutional performance policies within the context of the unique environment of Springfield Technical Community College." (1978). Doctoral Dissertations 1896 - February 2014. 3385. https://scholarworks.umass.edu/dissertations_1/3385 This Open Access Dissertation is brought to you for free and open access by ScholarWorks@UMass Amherst. It has been accepted for inclusion in Doctoral Dissertations 1896 - February 2014 by an authorized administrator of ScholarWorks@UMass Amherst. For more information, please contact [email protected].
Transcript of A study of attrition relative to institutional performance ...

University of Massachusetts Amherst University of Massachusetts Amherst
ScholarWorks@UMass Amherst ScholarWorks@UMass Amherst
Doctoral Dissertations 1896 - February 2014
1-1-1978
A study of attrition relative to institutional performance policies A study of attrition relative to institutional performance policies
within the context of the unique environment of Springfield within the context of the unique environment of Springfield
Technical Community College. Technical Community College.
J. Stanley Cummings University of Massachusetts Amherst
Follow this and additional works at: https://scholarworks.umass.edu/dissertations_1
Recommended Citation Recommended Citation Cummings, J. Stanley, "A study of attrition relative to institutional performance policies within the context of the unique environment of Springfield Technical Community College." (1978). Doctoral Dissertations 1896 - February 2014. 3385. https://scholarworks.umass.edu/dissertations_1/3385
This Open Access Dissertation is brought to you for free and open access by ScholarWorks@UMass Amherst. It has been accepted for inclusion in Doctoral Dissertations 1896 - February 2014 by an authorized administrator of ScholarWorks@UMass Amherst. For more information, please contact [email protected].


A STUDY OF ATTRITION RELATIVE
TO INSTITUTIONAL PERFORMANCE AND MANAGEMENT POLICIES
WITHIN THE CONTEXT OF THE UNIQUE ENVIRONMENT OF
SPRINGFIELD TECHNICAL COMMUNITY COLLEGE
A Dissertation Presented
By
J. Stanley Cummings
Submitted to the Graduate School of the
University of Massachusetts in partial fulfillment
of the requirements of the degree of
DOCTOR OF EDUCATION
February 1978
EDUCATION

(c) J. Stanley Cummings 1977
All Rights Reserved

A STUDY OF ATTRITION RELATIVE
TO INSTITUTIONAL PERFORMANCE AND MANAGEMENT POLICIES
WITHIN THE CONTEXT OF THE UNIQUE ENVIRONMENT OF
SPRINGFIELD TECHNICAL COMMUNITY COLLEGE
A Dissertation Presented
By
J. Stanley Cummings
School of Education
• iii

ACKNOWLEDGEMENTS
During the development of this dissertation, many contributed much.
Fi^st and foremost, my wonderful wife, Clare. More than anyone, including
in some respects, myself, she is responsible for what is here. During
this project she was, just as she has always been since we first met,
unselfish, giving, encouraging. Without her love and Interest and, above
all, her patience and understanding, my aspirations would have been in
vain.
Secondly, our children, Carolyn, Lisa and Margo. My thanks to them
for their support throughout and for foregoing many of the small pleasures
they might have otherwise enjoyed in order that I might complete this
paper.
Third, my committee; Chairman Jack Hruska, Ken Ertel and Harry
Schumer. And a personal word to each. To Jack for making me "see"
what my topic should be and then getting me started on it. To Ken for
truly being my mentor during my long sojourn on the Amherst campus.
And to Harry, a recent friend whom I truly value and who was helpful
beyond my fondest hopes.
Fourth, a very special thanks to two fine people: Linda Puchalski,
typist and proofreader extrordinaire and a special person to boot. And
Leah Hutten—her untiring help and genuine interest are reflected on many
pages of this book.

And a final word of gratitude to a small group who provided those
incentives which most doctoral candidates need at one time or another-a
threat here, a criticism there and a push somewhere else; but mainly
encouragement throughout. Bob Tinker, Bill Ullery and Cherry Mlchelman-
I thank the three of you.
V
ABSTRACT
A Study of Attrition RelativeTo Institutional Performance and Management PoliciesWithin the Context of the Unique Environment of
Springfield Technical Community College
(February 1978)
J. Stanley Cummings, B.S., University of PennsylvaniaM.Ed., University of MassachusettsEd.D., University of Massachusetts
Directed by: Professor Jack Hruska
Over the past decade more and more institutions of higher
education have found themselves under mounting pressures to justify and
defend their operating policies especially those that have fiscal impli-
cations. One indicator of the "holding power" of an institution is its
student attrition record. Although for some students, dropping out of
college may be beneficial- for both the early leaver and the institution,
few educators would dispute that withdrawing from college before
graduation can be a costly experience, taking its toll emotionally and
financially on the student, in diminished prestige and nonproductive
effort for the school and, in the opinion of many, in misspent public%
dollars.
The major purpose of this investigation is to determine the
relationship between various student and departmental characteristics
and the attrition rate in career-oriented divisions of a two-year technical
school, Springfield Technical Community College in Springfield,
Massachusetts.
vi
analysis procedureStudent attrition was explored using a discriminant
for the total student sample and for each of the three career divisions.
Departmental characteristics were derived for the same thirty-five
career departments in the technical, health and business fields from
which the student sample was drawn. Six departmental indicators were
examined with rankings made by department heads and deans using
available data.
The relationship between departmental rankings on six indicators
and established attrition patterns was explored using canonical
correlation.
Results and Conclusions .
Student characteristics . Two significant discriminant functions
beyond the .001 level resulted from the discriminant analysis of student
characteristics. The strongest set of predictors (Wilks Lambda = .833;
p is less than .0001) found was the combination high school rank and
sex. Females with high ranks tended to be graduates (persisters and
finishers). The second function (Wilks Lambda = .924; p. is less than
.0001) was primarily an age function which distinguished persisters and%
defaulters from the four other attrition groups.
The discriminant analyses executed separately for each of the three
career divisions were parallel in results to the overall analysis reported
above. Within the business division, the SES variate appeared as a
predictor, a result that did not occur elsewhere.
Department characteristics . A single canonical correlation
(Wilks Lambda = .079; p less than .0001) was found in analyzing the
vii

relationship of departmental characteristics to attrition. Generally, the
higher a department was ranked on any characteristic, the greater was the
percentage of persisters. The single best set of predictors from the
canonical analyses was number of openings and selectivity in admissions
policy. The results indicate that a department that has fewer numbers of
openings relative to number of applicants and which is more selective in
its admissions policy is more likely to have more of its students graduate.
viii

TABLE OF CONTENTS
ACKNOWLEDGEMENTS .
ABSTKACT
LIST OF TABLES . .
Page
iv
vi
xiii
CHAPTER
I INTRODUCTION TO THE PROBLEM 1
Statement of Research .• 1
Problem to be Solved 1
Specific Objectives 2
Justification for Study 3
Attrition: Growing in Significance as a
Measure of Institutional Performance 4
Interest in Attrition 6
Events Leading to Current Heightened Concernabout Institutional Performance 9
Higher Education in 1977—InstitutionalRetrenchment a Fact of Life 15
The Experience of the City University
of New York: An Omen for the Future? 17
The Urban Community College: A Dual Clientele .... 19
The Special Dilemma of Inner-City Colleges 20
Springfield Technical Community College 23
Definitions 25
Attrition 25
Open Door • • • 27
Limitations of Study!
* *
Organization of Study 28
II REVIEW OF LITERATURE
Events Leading to the History of a Literature
to DropoutsTypes of Attrition Literature
Institutional Environment as a Factor in
Attrition • • •
ix

CHAPTERPage
III METHODOLOGY
Background to Methodology Employed 41Description of Attrition and EvolvingAttrition Categories 42
Attrition: Definition 42Attrition Categories 43Student Sample 46Limitations of the Sample '47Number of Students Studied 48
Description of Attrition in Terms ofStudent Characteristics 48
Student Characteristics 48Sex of Student 49Marital Status 49Socio-economic Status 49High School Rank 1 51Veteran Status 53Economic Independency/Dependency Status .... 53
Classroom and Other Departmental Characteristics 54Faculty Salaries 54
Academic Credentials 56
Demand for Program (Number of Openings Comparedto Number of Eligible Applicants 57
Admissions Criteria (Degree of Selectivityin Student Selection) 58
Student-Faculty Ratio 58
Facilities 59
Methods of Analysis 61
Descriptive Statistics 61
Collapse of Categories 61
Description of Statistics on MajorAttrition Categories 62
Discriminant Analysis of Student Characteristics . . 63
Analysis of Institutional Characteristics ....'.. 63
Interaction Analysis • 64
IV ANALYSIS OF DATA 66
Introduction 66
Description of Overall Attrition Patterns 66
Description of Attrition in Terms of Student
Characteristics
X

CHAPTERPage
IV ANALYSIS OF DATA
Exploration of Attrition by Sex of Student ... 68Exploration of Attrition by Marital Status ... 69Exploration of Attrition by Socio-economicStatus
Exploration of Attrition by High School Rank . . 70Exploration of Attrition by Veteran Status ... 71Exploration of Attrition by EconomicIndependency/Dependency Status 71
Exploration of Attrition by Age 72Results of Discriminant Analysis of StudentCharacteristics for Total Student Sample 73Univariate F-ratios 73Intercorrelation of Predictors 74
Discriminant Functions 75First Function -i .
‘ 75Second Function 75Third Function 76
Description of Attrition Patterns inDivisions 78Description of Student Characteristics inDivisions 80
Sex Distribution of Students in Terms ofStudent Characteristics by Division 80
Marital Status by Division 81Socio-economic Status by Division 82
High School Rank by Division 82
Veteran Status by Division 83
Economic Independency/Dependency Statusby Division 83
Age by Division 84
Results of Discriminant Analysis of StudentCharacteristics for Technical, Health and
Business Divisions » . . 84
Introduction 84
Technical 85
Health 86
Business 89
Attrition Patterns by Department 91
Analysis of Institutional Characteristics 96
Dropouts 97
Persisters 97
Finishers 97
Defaulters 97
Stopouts 98
Non-finishers 98
xi

CHAPTERPage
V SUMMARY AND CONCLUSIONSj^q3
IntroductionMethodology
• • .
Findings and ConclusionsOverall Student Sample
’
’
iq?Overall Student Characteristics 108Discriminant Analysis—Overall StudentCharacteristics HO
Student Characteristics in Division 110Discriminant Analysis of the ThreeDivisions 112
Technical 112Health 12^2
Business 112Attrition Patterns by Department 113Institutional Characteristics Results 114
Results and Conclusions 115Recommendations 116Suggestions for Additional Research 118
FOOTNOTES 120
BIBLIOGRAPHY 124
xii

LIST OF TABLES
TABLEPage
1 NUMBER OF STUDENTS BY DIVISION 48
2 SOCIO-ECONOMIC CLASSIFICATIONS 51
3 DISTRIBUTION OF STUDENTS INTO ATTRITION CATEGORIES . . 67
4 ATTRITION CLASSIFICATION BY SEX OF STUDENT 68
5 ATTRITION CLASSIFICATION BY MARITAL STATUS 69
6 ATTRITION CLASSIFICATION BY SOCIO-ECONOMIC STATUS . . 70
7 ATTRITION CLASSIFICATION BY HIGH SCHOOL RANK 70
8 ATTRITION CLASSIFICATION BY VETERAN STATUS 71
9 ATTRITION CLASSIFICATION OF ECONOMICINDEPENDENCY/DEPENDENCY STATUS 72
10 - ATTRITION CLASSIFICATION BY AGE 73
11 RANK ORDERING OF PREDICTIONS BY UNIVARIATEF-RATIOS FOR DISCRIMINANT ANALYSIS 74
12 INTERCORRELATION OF PREDICTORS FORDISCRIMINANT ANALYSIS 75
13 DISCRIMINANT SIGNIFICANCE OF FUNCTIONS 77
14 STANDARDIZED DISCRIMINANT WEIGHTS FOR THREEFUNCTIONS 77
15 CENTROIDS OF GROUPS ON THREE DISCRIMINANT FUNCTIONS. . 78
16 DISTRIBUTION OF STUDENTS INTO ATTRITION CATEGORIES
BY DIVISION 79
17 DIVISION CLASSIFICATION BY SEX OF STUDENT 81
xiii

18
19
20
21
22
23
24
25
26
27
28
29
30
31
32
33
34
DIVISION CLASSIFICATION BY MARITAL STATDB * • • «
DIVISION CLASSIFICATION BY SOCIO-ECONOMIC STATUS
DIVISION CLASSIFICATION BY HIGH SCHOOL RANK• • •
DIVISION CLASSIFICATION BY VETERAN STATUS• • • •
DIVISION CLASSIFICATION BY ECONOMICINDEPENDENCY /DEPENDENCY STATUS
DIVISION CLASSIFICATION BY AGE
SIGNIFICANCE OF FUNCTIONS IN DISCRIMINANTANALYSIS FOR TECHNOLOGIES
STANDARDIZED DISCRIMINANT WEIGHTS FOR TWOFUNCTIONS FOR TECHNOLOGIES
CENTROIDS OF GROUPS ON DISCRIMINANT FUNCTIONFOR TECHNOLOGIES
SIGNIFICANCE OF FUNCTIONS DISCRIMINANT ANALYSISFOR HEALTH
STANDARDIZED DISCRIMINANT WEIGHTS FOR ONEFUNCTION FOR HEALTH
CENTROIDS OF GROUPS ON ONE DISCRIMINANTFUNCTION FOR HEALTH
Page
82
82
83
83
84
84
86
86
86
88
88
88
SIGNIFICANCE OF FUNCTION IN DISCRIMINANTANALYSIS FOR BUSINESS 90
STANDARDIZED DISCRIMINANT WEIGHTS FOR THREEFUNCTIONS FOR BUSINESS 90
CENTROIDS OF GROUPS ON THREE DISCRIMINANTFUNCTIONS FOR BUSINESS 91
NUMBER OF STUDENTS BY DEPARTMENT 92
DISTRIBUTION OF STUDENTS INTO ATTRITIONCATEGORIES BY DEPARTMENT 93
xiv
TABLEPage
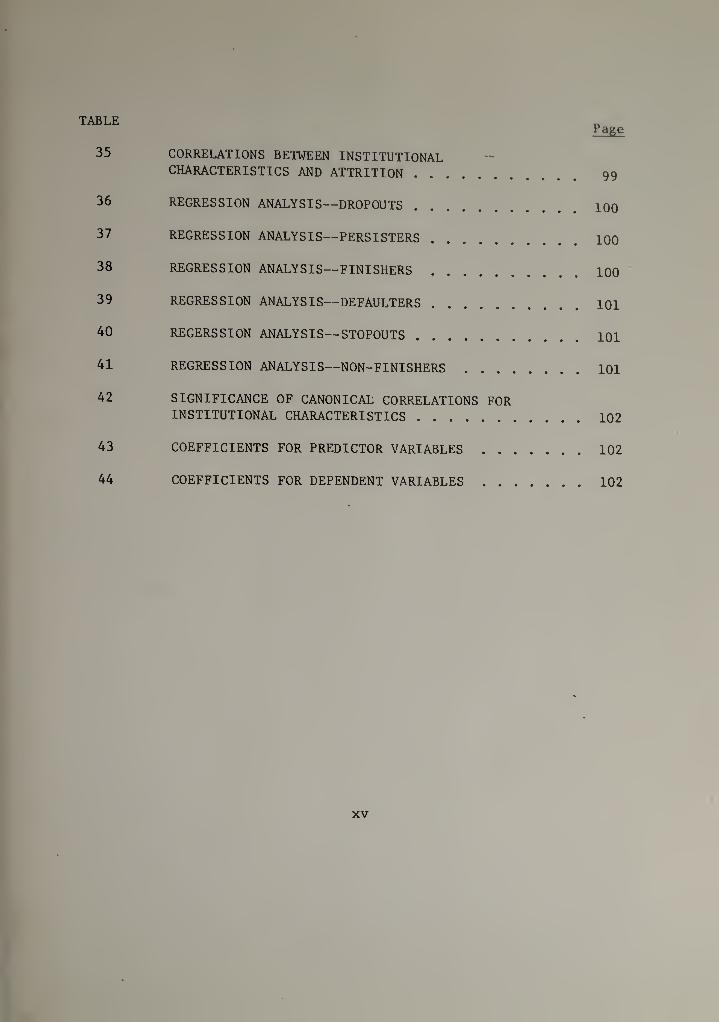
35 CORRELATIONS BETWEEN INSTITUTIONALCHARACTERISTICS AND ATTRITION 99
36 REGRESSION ANALYSIS—DROPOUTS 100
37 REGRESSION ANALYSIS—PERSISTERS 100
38 REGRESSION ANALYSIS—FINISHERS 100'
39 REGRESSION ANALYSIS—DEFAULTERS 101
40 REGERSSION ANALYSIS—STOPOUTS 101
41 REGRESSION ANALYSIS—NON-FINISHERS 101
42 SIGNIFICANCE OF CANONICAL CORRELATIONS FORINSTITUTIONAL CHARACTERISTICS 102
43 COEFFICIENTS FOR PREDICTOR VARIABLES 102
44 COEFFICIENTS FOR DEPENDENT VARIABLES 102
XV

CHAPTER I
INTRODUCTION TO THE PROBLEM
Statement of Research
As will be shown in this study, there is a growing belief among
educators that an increasing number of U.S. colleges have arrived at
the point where the need for institutional development and a continuing
improvement process has become the sine qua non of their future opera-
tional stability and, in some instances, possibly of their survival as
viable facilities of higher learning. This concern suggests that unless
positive steps are taken to counteract: (1) a widespread dissatisfaction
with much that has happened and is happening in colleges and universities,
and (2) the increasing reluctance of funders, especially those involved
with public higher education, to maintain adequate budget levels, these
two factors could easily result in the failure of many such institutions
to bring about these crucial improvements. Thus any plan which leads to
more effective and efficient management should enhance these schools'
potential for obtaining the additional financial resources they require
to assure academic responsiveness, scholarly integrity and the capability
to function as healthy, purposeful organizations. One such plan is an
improvement in student retention.
Problem to be Solved
The problem this study is designed to solve is an examination of
selected variables relating to the dropout records of students in three

2
major divisions (and their respective departments) at Springfield
Technical Community College (STCC) in Springfield, Massachusetts and
includes a correlation of such attrition data with the results of an
analysis of the configuration of these divisions and departments in
respect to their individual admissions criteria and classroom
characteristics. This information is to be used to meet the study's
basic goal which is to develop policies aimed at bettering student
staying power at STCC.
This intelligence should, in turn, enable the college to propose
acceptable solutions including policies of intervention aimed at
decreasing attrition and thereby affect operating efficiences and
economies within the context of STCC's unique environment, its student
clientele and the stated mission and goals of the college.
The study's purpose is to collect such attrition data for use as
part of the college's total information base needed for planning
operational strategies-for the improvement of STCC's overall institutional
management
.
Specific objectives . In acquiring this data, the following objectives
will be sought:
— Identify those variables common to students falling
within the attrition categories designated for the study;
— Identify selected characteristics of divisions and
departments within divisions;
— Correlate student data within and across divisions and
and departments;

3
Relate this information to acceptable solutions designed
to improve student retention.
Justification for study . The pattern of a growing number of poorly
prepared applicants combined with the continuing effort on the part of
STCC to offer academically demanding career training to those who
qualify have created a non-linear demand on the college's limited resources
and have already forced the institution to cut corners in its attempts to
respond to its total students needs, retrenching at the very time when it
actually requires a larger per student financial commitment merely to
keep up with its past performance. New multiplying and compounding
factors such as dwindling tax revenues, inflation, rising budgets, faculty
wage demands, high energy costs and a need to continually update training
facilities (critical in a technical institution) could easily culminate
in a static or even regressive growth pattern at STCC in the years ahead.
Even the current trend toward level budget funding carries with it the
implication of cutbacks since inflation cannot be factored into a pure
level funding formula without an offsetting decrease in staff and
services. This situation has been further exacerbated at STCC and at
many inner-city colleges by the demands placed on their resources in the
area of compensatory and remedial education. With the presence of such
constricting factors, the potential for harsh staff, program and student
reductions is always present. Therefore, any steps which lead to a
bettering of student retention and, by extention, to an improvement in
the school's overall performance record are highly desirable.
A
Due to the costly ramifications of a high dropout rate, the
rationale for selecting a study of attrition and proposing policies
of intervention designed to decrease withdrawals can be justified in
that such activities should be an integral part of the planning process
of every institution of higher learning, particularly in fiscally
perilous times. This rationale becomes even more valid at tax-supported
community colleges faced with the challenge of meeting the widely diverse
needs of a heterogeneous student population. Analyzing attrition on
division and department levels and developing policies to minimize
withdrawals based on such data are part of the effort educators should
make in an era of mounting emphasis on accountability. For, as already
stated, increasingly, in a very tangible way, the vitality and, in some
cases, the future of many urban colleges may hinge upon their overall
performance records and, one aspect of that performance is student
retention. For this reason, the availability of accurate attrition data
should be a major component in an institution's total information base
for formulating broad, effective strategies leading to improved management.
Attrition: Growing in Significance as a
Measure of Institutional Performance
It should be noted that in conducting this study and analysis, the
author makes no contention that high attrition or the term "dropout"
necessarily carry a negative implication. For, as will be seen in
this section, there is a sizeable school of opinion which holds that
withdrawing from college may be entirely appropriate and even beneficial
for the withdrawer depending upon his or her individual situation.

5
Rather, in view of pressures now being placed upon administrators
regarding total institutional accountability, the author maintains that
since improving student retention is one measure receiving additional
scrutiny by funders, an analysis of institutional attrition performance
close exsinins t lOTi by scsdoinic reseercheirs
•
Granting the validity of the argument that dropping out is not per-
force a negative experience, a college's dropout rate is nevertheless
one aspect of its record which many non-academicians, as well as many
'•within education itself, tend to correlate with success when evaluating
institutional performance. If a school has good "holding" power, it is
doing a good job; conversely, a high rate of early leavers is often
construed as evidence that education is failing its mission. Moreover,
in a public college or university, this reasoning may lead to the
inference that a large number of non-persisters can be directly equated
with a wasting of tax revenue.
As previously stated, it is true that not everyone shares the
feeling that withdrawing is detrimental to the dropout. Some dispute
the onus commonly attached to leaving school early and challenge the
"A high dropout rate is bad" syllogism as spurious and overly simplistic.
They claim, for instance, that "stopouts"—students who leave school to
work, travel or even do nothing, later return better prepared, at least
psychologically, to undertake academic pursuits. Likewise, others feel
that "jobouts"—those who withdraw from college before graduation for
permanent employment (often related to their previous studies)—are
inappropriately categorized as dropouts since these leavers may be better
suited and happier as fulltime members of the workforce than in the
classroom.

6
Granting the plausibility of such arguments, the author feels it
IS difficult to challenge the general connotation of lack of success
which has traditionally been associated with leaving school early. It
is still common, for example, to hear of official college attitudes which
allude to the act of students withdrawing as being a kind of death,
albeit only an intellectual one. In educational circles, those who '
depart from school before their classmates are regularly referred to as
casualties or non-survivors. And who has not heard the dropout figure
called the "mortality rate?" Moreover, there are probably few inside,
ot outside, of education who would argue, regardless of their personal
feelings on the matter, that dropping out of school can be an expensive
experience taking its toll financially (and sometimes emotionally) on
the student, in diminished cost-effectiveness and lowered prestige on
the institution and, in the minds of many, in misspent public dollars.
Interest in attrition . As seen in Chapter II (Review of Literature)
,
researchers and educators have not been lacking in interest in the
problem of dropouts. To the contrary, it is a subject which has
received intense scrutiny for decades .1 Their concern, however, seems to
have been, by and large, related to the fact that if one loses thirty
percent of a group, as educators, they wanted to be certain these students
were lost for "good" reasons. Administratively, of course, each college
had to decide for itself what represented a reasonable dropout rate
and what constituted a "good" reason for withdrawal.
Nevertheless, the dropout stigma seems to persist. And given the
mounting emphasis on institutional cost effectiveness and administrative
belt-tightening, the implications of high attrition rates may become

7
even more important in the years ahead placing those colleges with
high withdrawal patterns in an increasingly untenable and insecure position.
Profile of a Dropout, Schreiber provides a clue why attrition may
become such a pivotal factor for measuring institutional performance—and
thus impinge directly on budgetary allocations—in the near future.
The concern for the school dropout is not a new phenomenon, but'the problem of the school dropout is. Less than two decades ago,when more students dropped out of school than graduated, therewas no noticeable public concern. A boy could leave school, find^ job, and become an adult j today he quickly finds out that he isno longer wanted by industry. Instead of a job, he has a promiseof long periods of unemployment, interspersed with short periodsof working at dead-end, unskilled jobs for low wages. ^
While Profile of a Dropout deals with secondary schools, the current
large-scale movement of high school graduates, many of marginal abilities,
into college, especially two-year public colleges, could well portend
such institutions experiencing similar problems and criticisms if their
dropout rates are highu- And ironically, when college enrollments level
off, as most population experts predict will be the case in the early or
mid-1980s, the dilemma may become even more agonizing since one of the
basic criteria used by funders when structuring budgets is absolute
numbers. Thus it might be postulated that while little or nothing can
be done to counter the predicted trend of diminishing numbers of enrollees,
it would seem that one task incumbent upon all institutions of higher
learning would be to analyze those variables which characterize their
students and departments in order to take steps to improve overall
performance in the area of student retention if such facilities are to
remain viable and healthy.
As far back as 1968, twenty-three community colleges in Northern
California agreed to form a consortium to engage in research on issues

8
Its members considered Important. The first problem identified when the
group reviewed national community college enrollments was that, typically,
second-year student classes were forty-eight percent the size of freshman
enrollments. As a result, the need to understand a possible attrition
rate of fifty-two percent and find ways to reduce this figure was given
top priority by the group.
^
In the lead article of the September 22, 1975 Chronicle of Higher
Education, MacMillan and Kester described a survey conducted by the Iowa
Board of Regents to find what measures were used when academic programs
were eliminated in other states. Based on a poll originally suggested by
the Education Commission of the States, the two criteria cited by the
largest number of respondents (e.g., states) as reasons for discontinuing
programs pertained directly to enrollments and attrition. The largest
(total) number of states reporting a single reason responded that the
number of graduates from a program in each of the previous five years was
the primary reason for maintaining or dropping a program. Ten states, the
second largest aggregate number answering, stated that the number of
students enrolled in a program and the number leaving it before graduation
were the major factors for considering the possible elimination of programs.
Further evidence of the rising Importance of attrition was evidenced in a
survey of top officials at 1200 colleges and universities which predicted
that a sharp increase in (1) the elimination and consolidation of programs
and (2) institutions being phased out of existence altogether either
through diminishing enrollments or attrition would be a likely occurrence
during the next fifteen years

9
These multiplying and compounding problems are not only noticeably
straining the fiber of higher education at present but may become even
more acute later on given the f^ accompli of dwindling enrollments in
primary and secondary school populations-the college matriculants of the
near future. One result of this changing climate is that funders, and
many in the. general public as well, caught between the economic realities
of inflation and diminishing revenues and a network of tax-supported
institutions (academic and others), each of which is constantly seeking
additional support, are no longer requesting, but are demanding that
those charged with conducting the affairs of public facilities provide a
strict accounting of their stewardships. Educators, who in the past
were often accused of retreating to their ivory towers, would appear to
no longer have even that option as they find themselves under increasing
pressure to justify and defend academic and operating policies especially
those having fiscal implications. And since total institutional
performance is more of a factor influencing budgetmakers each year,
virtually every aspect of an institution's operating policy from hiring
and grading to salaries and the number of students graduating may be
considered to have fiscal ramifications of one sort or another.
Events Leading to Current Heightened Concernabout Institutional Performance
From approximately the period of Sputnik (1957) through the early
1970s, American education obtained a massive infusion of funding, support
unprecedented in the history of this nation. Schools and colleges found
themselves on the receiving end of a dollar pipeline whose source was

10
various government agencies and private foundations and whose treasuries,
it appeared to many, were virtually bottomless. This was the era when,
for the first time, the U.S. government moved toward large-scale
financing of all sectors of education on a regular, on-going basis and in
a myriad of areas which had hithertofore not received significant federal
support or attention. As enrollments soared and the economy kept pace,
educators discovered that obtaining increased annual budget allocations
and gaining access to special funding categories were not difficult and
billions were spent on a vast array of new programs. Proposals claiming
to meet special needs, open up learning opportunities, add relevance,
develop innovative approaches and, often, simply improve the general
quality of education were drafted, endorsed and underwritten. Education
also experienced a "boom" in construction as thousands of primary and
secondary schools were built and expanded and new colleges founded
including hundreds of two-year community colleges as well as many
non-traditional "alternative" institutions. To many; bureaucrat, politician,
foundation director, educator and average citizen, the classroom was
looked upon as an almost ideal vehicle for providing the solutions to
some of the country’s most pressing problems. Financially, this was
probably education's finest hour—its "Golden Age." "Golden" certainly
in the sense that enormous support was showered on schools, colleges and
universities, but also because growing enrollments led to an almost
idyllic optimism about the future.
As the Vietnam War began to wind down in early 1973, education’s
"gold" began to lose some of its shine. More rapidly than many thought
11
possible, administrators found themselves, some for the first time,
operating in an academic and economic climate which at marked variance
with the previous decade and which forced them to confront the challenge
of maintaining their institutions’ health, vitality and accomplishments
in a drastically altered setting characterized by inflation, static and
shrinking revenues and other constraints. Unrestrained optimism about
the future became increasingly difficult in stark contrast to the previous
ten or twelve years when funding largesse and rapid expansion had been
the hallmarks of the era.
Moreover, as the nation headed into the mid-1970s, academic
administrators discovered that their problems were not all financial.
More and more, education, especially higher education, found itself the
target of a wide range of charges. Writers, legislators and voters,
many disillusioned by much that had taken place during education’s
so-called "turmoil years," aimed their barbs at the nation’s colleges.
And while many of the tumultuous, sometimes violent, campus confrontations
of that period took place over issues over which college leaders had
little, if any, control—civil rights, the draft, Vietnam and an
unpopular president—many felt that the educational establishment somehow
bore a major share of the responsibility for these disruptions!
Contributing also to this legacy of mistrust was the disapproval
by many of the government’s use of schools and colleges, starting in
the late 1950s, to enforce federal enactments designed to open up and
extend learning and similar "quality of life" opportunities to
minorities and others who were economically or educationally disadvantaged.
To those not favoring the intent of such legislation, the dramatic and,

12
to some, radical changes In education and even In society In general which
began in the early 1960s were, at least In part, also the fault of
educators because of the role schools were given In this legislatively-
mandated change process.'^
By 1974, when the vice of severe recession and unemployment had
begun to tighten its grip on the nation’s economy, a mood of skepticism
and questioning was clearly present in the minds of many citizens
regarding America’s educational system and its goals. Reports decrying
institutional "results" appeared with increasing frequency on school
committee agendas and at state and Congressional hearings. A relatively
rare occurrence only a few years earlier, bonding issues for school
construction and other educational purposes were rejected more often than
approved by voters. The media harped about huge sums spent on special
remedial programs during the 1960s and early 1970s. Surveys showed that
many high school (and college) students could not write an elementary
English composition or perform basic mathematical computations. Articles
scoring grade inflation, reverse discrimination in admission decisions,
social promotion, a dramatic dip in SAT results and striking facilities
were published widely. Particularly criticized were the thousands of
innovative and exemplary programs conducted during the previous era in
an effort to meet special needs; programs which were often scuttled after
large expenditures with little to show for results. And although
unemployment at all age levels and in all stratas of the population was
the greatest since the Depression, critics were quick to point out that
among those who had spent two or four years in college, joblessness and
underemployment were the highest in history. Publicity of this type did
13
little to strengthen the credibility of educators and education In theeyes of the public.
Still other factors in the early seventies led to education’s
descent from its earlier pinnacle of favor and support. A drastic
reordering of public concerns brought about a nudging at first, then a
vigorous pushing aside of education in terms of funding priorities as
the struggle for a larger share of an increasingly limited number of
dollars intensified among various interest groups. By 1975-76, a
preoccupation with a severely depressed national economy, runaway
inflation, an unprecedented energy crisis and, in particular, widespread
unemployment had clearly emerged as the compelling legislative and
taxpayer concerns of the land.
At this same time, a new and, for schools and colleges, ominous
factor developed: the spector of retreating enrollments plainly visible
on the immediate horizon. Since 1970, elementary school figures had
been dropping steadily and forecasts called for secondary school
populations to peak in 1978-79 with colleges receiving the full impact
of the birth drop about 1983. Moreover, Department of Health, Education
and Welfare figures predicted this downward trend would continue for
several years before leveling off.
Other reports were even less sanguine. Stephen Dresch, Director
of Research in the Economics of Higher Education at Yale, estimated that
between 1980 and 1990 undergraduate enrollments could shrink by as much
as forty-six percent.^ And according to findings published in 1976 by
the National Center for Education, the total college population at public
and private institutions, up 0.4 percent over a year earlier (two-year

14
schools increased 2.1 percent) would represent the last or next to last
enrollment Increase In higher education for the next decade or possibly
fifteen years
Less quantifiable than population statistics, but also casting
education in a difficult position were studies showing the college
graduate of today pays more for an education, but earns less than in 'the
past. One Harvard University report published in 1976 stated that for
the first time in American history the earning power—in real dollars—of
college graduates had dropped significantly.^ In a related article,
Spekke claimed that the rate of return on a college undergraduate
education fell from eleven-twelve percent in 1969 to seven-eight percent
in 1974. Equally sobering was the fact that while by the end of 1976
about 1.3 million people in the United States held undergraduate and
advance college degrees (nearly double the figure of ten years earlier)
,
during the same period the number of professional, managerial and tech-
nical jobs in the country grew by only about one-third. Published reports
of this kind have done little to buttress the already tenuous position
educators vis-a-vis those who control their pursestrings.^^
Not all reports shared such gloom, however. As recently' as
1976, the Carnegie Commission wrote that the passing of higher education's
fiscal dilemmas appeared imminent. The Commission's prediction was
based on an anticipated improved national economy, increased revenues
and a decrease in welfare payments. But while it did state that,
"Because of falling enrollments in primary schools, competition for tax
funds for education will be reduced," the Report also conceded the
uncertainty of accurately predicting economic conditions.^ Paradoxically,

15
Slenny, in data provided in another report written for the same Co-isalon.
gave the warning that one-tenth of the nation's eolleges and universities
would go out of business, merge or undergo other radical changes by 1980.
High attrition was cited as one of the prime reasons for these anticipated
changes. O'Brien cited a survey which indicated that half the colleges
he polled expected that by 1980 their enrollments would Increase by more
than ten percent and the same percentage of those surveyed foresaw little
or no increase in operating expenses between 1974 and 1980.^^ Likewise,
the New York Times reported in June 1977 that the private sector of
higher education, despite continuing, fiscal problems, was holding its
13own.
Such optimism notwithstanding, taking into account the upcoming
dwindling numbers of college-age students, an inflationary spiral which
does not appear to be abating and the possibility of a semi—permanent
energy shortage with its attendant costs, such reports may have been,
at best, somewhat naive. At any rate, given the fiscal realities of 1977
combined with new public priorities and a pervasive mood of skepticism
about education in general, it would appear that academia's "Golden Age"
is definitely over as both man-in-the-street and legislative budgetmaker
alike seem to no longer subscribe to the once popularly-held proposition
that the classroom is an ideal and potent remedy for much that is wrong
with the nation.
Higher Education in 1977—InstitutionalRetrenchment -a Fact of Life
Education has traditionally been a labor intensive industry—it
spends more for employee services than it does on products and materials.

16
Until recently, colleges and universities were able to adjust faculty
and other personnel salaries to offset rises in the cost of living through:
(1) increasing tuitions, (2) obtaining higher budget allocations from
their principle sources of support, (3) utilizing federal and other
soft monies, (4) using interest from endowments and investments.
None of these options is nearly as "available" in 1977. Additional'
tuition hikes may well price colleges out of the market for their
consumers; many states have revised their funding priorities and inflation
is impacting on all legislative allocations; grant money to higher
education has diminished considerably and institutional portfolios have
decreased drastically in value due to depressed stock market prices as
well as inflation. Colleges have found that it has become all but
impossible to match recent large jumps in consumer prices. As a result,
faculty and wages for higher education employees have generally lagged
behind increases in the price level. Further contributing to the current
institutional wage-price spiral has been the advance in the cost of
contracted services, supplies and equipment, and in particular, the
soaring costs of fuel and other energy
In 1976, Gov. Milliken of Michigan was quoted, when discussing
the role of higher education in his state’s upcoming "austere budget,"
as saying, "We are going to see constraints the likes of which you and I
have not seen in this capitol. "^^On the lighter side, the Chronicle of
Higher Education of July 26, 1976, focused on the dilemma of funding
public higher education in a facetiously entitled article, "U. of
* 1
Washington Stops Cutting Grass and Starts Cutting Vice-Presidents."

17
An increasing number of public colleges and universities have
adopted enrollment restrictions to defend their thinly stretched budgets
against the pressure for increased admissions. Michigan State University,
the University of North Carolina, and the University of Illinois enacted
such rules in 1976 as part of a nationwide move being supported by many
legislators to limit public higher education growth not only due to
fiscal problems, but because of the forecasted downturn of applicants
within the next few years.
The experience of the City University of New York: an omen for the
future ? Probably no clearer example of the impact of fiscal exigency
in higher education exists than the City University (System) of New York
(CUNY) . The combined issues of inflation, controversial admissions
policies, changing enrollment patterns, racism, special student needs,
and fundamental, often violent disagreements on priorities, all compounded
by a massive city-wide money crisis, have generated spectacular problems
for CUNY, the largest university in the world (270,000 students in 1976).
As a result of New York City’s flirtation with involvency, there is now
concrete evidence of the devastating impact budgetary slashes can have
on publicly- funded education. For example, in June 1975, the New York
City Board of Education employed 72,959 teachers, supervisors,
counselors and other staff at the primary and secondary levels. A year
and a half later, in December of 1976, there were 57,038 employees in
these same categories. Actual classroom teachers paid from city revenues
declined from 56,623 to 43,630. Yet during this same 18-month period, the
school population shifted only slightly—from 1,098,894 pupils to 1,095,290 18

18
However, it has been on the postsecondary level where the heaviest
force of New York City’s fiscal crisis has been felt and most visible.
Cuts have been bone deep and sweeping with all signs pointing to
further retrenchments. In an interview with the New York Times on
July 25, 1976, City University Chancellor, Robert J. Kibhee, made several
chilling predictions concerning the effect of budget deficits on his
system's enrollments and staffing. One of Kibhee’s primary concerns was
the suggested (since implemented) imposition of tuition on CUNY
19matriculants. He felt that the University could and would lose 35,000
fulltime students if tuitions were imposed and admissions requirements
stiffened (e.g., elimination of open admissions) within the following
three years. He further anticipated the need to drop 2,000 fulltime
and 6,000 parttime faculty. The elimination of open admissions alone,
the Chancellor felt, would have the greatest single effect, and he
predicted that this factor coupled with tviition charges would bring about
the immediate disappearance of 10,000 applicants, a quantum decrease
even for a system of CUNY's magnitude. Stricter enrollment requirements
and the charging of tuition did, in fact, bring about a severe drop of
applicants in September 1976 with an even greater decline in the fall,
1977.
Willie any discussion relating to CUNY's difficulties must obviously
he considered in the context of New York City's overall fiscal woes,
a review of educational budget decision-making trends in other areas of
the nation suggests that the crisis facing CUNY may not be that unusual.
Higher education periodicals in 1977 are replete with articles describing
mlcrocosmic CUNY-type situations simmering and flaring up nationwide.

19
Perhaps none is quite as serious or far-reaching as New York's, but for
the institutions and students involved, each is potentially just as
ominous as signs across the country appear to point to a continuing
focus on education as a major target for mandating cost effectiveness
and its corollary, retrenchment.
The Urban Community College; A Dual Clientele
The United States has been the first nation to freely accept the
proposition that education beyond the secondary level should be made
available to every citizen.^l While such "availability" is still not
universal, the burgeoning construction of two-year junior and community
colleges between 1955 and 1974 moved this hope closer to reality. Such
a commitment is a fairly recent and radical departure from the past when,
in the case of many, especially private colleges, highly selective
admissions criteria evolved over a period of years producing an annual
pool of academically strong applicants. High entrance standards have
also been the rule in many large state universities especially in the
mid-west and far-west. Smaller and less prestigious schools developed
their own measures but, by and large, before World War II, access to
higher education was the exception, not the rule. On the other hand,
the recent and rapid emergence of the public-supported community college
meant that such schools had little or nothing in the way of historical
precedents to shape their acceptance policies. At these colleges,
enrollment practices must generally take into consideration the broader
spectrum of academic abilities of an entire local populus rather than
attempt to set up stringent selection criteria. Thus, while nationally.
20
admissions standards range from extremely rigid at a handful of select
four-year schools to something close to pure open admissions at a
few public Institutions, most two-year colleges choose not to or cannot
follow either extreme.
It would seem then that urban community colleges, more than their
rural or suburban counterparts, would hold special promise to the widest
range of potential matriculants. And in many ways, they do. They are
one vehicle, perhaps the only vehicle, for offering realistic learning
opportunities to many. And since often such schools eliminate many of
the traditional barriers to higher education by charging little or no
tuition, being less selective and frequently challenging popular notions
about academic standards, advancement criteria and even basic definitions
of failure and success, the city community college is especially attractive
to the educationally and economically disadvantaged who may not have
the means or the incentive to travel even-short distances to outlying
districts to obtain a college education.
Thus the emergence of community colleges as a major force in higher
education in the 1970s has generated a new clientele of students who now
seek low-cost postsecondary education in easily accessible locations in
the hope that such experiences will lead them to better lives. Providing
an opportunity for learning to these populations is, however, fraught
with a network of interrelated problems particularly in a period of
fiscal stress such as exists in 1977.
The special dilemma of inner-city colleges . Ironically, the crisis at
CUNY and fiscal problems at many other inner-city two-year and four-year
21
public colleges may be attributed in some respects to their past
successes in confronting two seemingly opposite academic objectives:
(1) providing a college education for an (often) academically unprepared
urban population and (2) offering high quality, academically rigorous
programs to those who qualify. Because of this challenge, many city
colleges and universities are finding themselves in a somewhat anomalous
posture regarding these tvw goals. For while in a time of continuing
erosion of their core cities, throvigh their education, community and
cultural programs, they have energetically and conscientiously striven
to maintain high academic standards,' their proximity to target area
disadvantaged and low-achieving applicants, many of whom require extensive
and costly support and remediation services, has concomitantly led them
to the very dilemma they now face. For any metropolitan college, whatever
Vits goals and no matter how altruistic its efforts to improve its respon-
siveness to the needs of the economically and educationally disadvantaged,
must also uphold its attraction to the best qualified students through a
broad, rigorous curriculum of traditional college-level subjects or
risk sinking into a morass of mediocrity.
Most experts agree that as colleges retrench, more often, than not,
the impact of cuts weighs most heavily on the "new” or non-traditional
student, that is, the student from socio-economic groups which
historically have not sent their children on to college. In discussing
the ramifications of CUNY’s forecasted enrollment cutbacks at a 1976
meeting of the American Education Association's affiliate, the Council
on Black America Affairs, it was claimed that while all aspiring students
would suffer, blacks and other minorities would receive the brunt of the

22
CUNY retrenchments. Other comments at this same meeting reflected the
feeling that since higher education does not seem to have the priorities
It once did, the ultimate effect may be to go back to an elitist type
of postsecondary Institution, a trend already noted In California and
Florida where legislators and politicians In their quest for economies
have chosen to cut those programs ottering compensatory education tor the
academically unprepared. ^2
Of equal concern to those involved in technical education is the
potential affect that severe fiscal exigency measures may have on
occupational programs. Measuring the cost and cost effectiveness of
occupational programs has been the subject of numerous studies. In
general, findings have shovm that training a student for a specific
occupation in college is far more costly than preparing the general
education or liberal arts students. Since the two factors usually
identified as contributing most to this higher figure are the raised cost
per student contact hour attributable to the lower level of utilization of
facilities, instruction and equipment and the greater number of contact
hours needed for technical training, any form of retrenchment will play
the greatest havoc in vocational- type programs which, ironically, often
lead to the best paying jobs for graduates.
To remain academically viable, the urban community college must not
only attract and meet the needs of those who have not met with success
in their earlier school careers but of all potential matriculants from
within its geographic base Including the academically talented. But
providing even adequate learning opportunities for these two groups has
become more complex and more costly each year. With resources to meet this

23
dual responsiblity diminishing and the cost of all programs rising,
colleges often find themselves understaffed and severely hampered by
over-extended counseling and remedial personnel, a rising
student-faculty ratio and deteriorating classroom and laboratory
facilities. Given these conditions, a large number of early leavers
may not be an unreasonable expectation. And yet because of the renewed
emphasis on institutional accountability, including attrition
accountability, the higher the dropout rate, the more likely the charge
a college is not living up to its potential, with negative budget
reprecussions a distinct possibility.’ Thus, paradoxically, in times of
severe fiscal exigency, a kind of Catch-22 dimension develops with schools
like STCC finding they may be denied the very means needed to overcome
the problems which are causing them to be fiscally penalized in the first
place.
Springfield Technical Community College— Located in a downtown setting
and possessing a strong occupational orientation of technical, health
and business programs, Springfield Technical Community College has perhaps
an even greater admissions challenge than most two-year city schools. As
%
a state-supported institution with relatively low tuition ($300 per year)
,
it is strategically situated in the midst of one of Springfield s most
severely depressed areas (where both youth and adult unemployment is
double that of the city as a whole) and, as a result, has become a beacon
of sorts to many target area citizens seeking to improve their basic
skills through remedial programs as well as to obtain specific job
training credentials needed for employment. Concomitantly, as the

2A
largest community college In the Commonwealth of Massachusetts and with
a statewide reputation for career offerings (it is the only public two-
year Massachusetts school incorporating the word "Technical" in its
name), its over forty career programs, many of which maintain strict
academic standards for admissions, draw students from all over Western
Massachusetts and beyond. With an increasing number of educationally
disadvantaged applicants from its predominantly low-income, disadvantaged
neighborhoods coupled with those academically well prepared who seek
entry to STCC's more rigorous programs, the varied intellectual
abilities and competencies of its student body produce a true academic
"melting pot."
In this respect and in response to the expanding focus on key
urban and social problems, STCC feels it has made unusual achievements
through its educational , community and cultural programs. The college has
become, in effect, a magnet—an integrated community college bringing
suburban matriculants back into the core area while expanding its services
to center-city minority and other disadvantaged students. And yet while
STCC feels it has made measurable progress in meeting these diverse
challenges up to this point, the high cost of offering such Specialized
programs in a climate of severe fiscal constraint has become increasingly
difficult.
Moreover, all signs indicate a continuing growth trend of low-income,
educationally disadvantaged students attending STCC. In the fall, 1976,
STCC had nearly eighteen percent of its enrollment from minority groups,
the highest proportion of the fifteen-member community college system with

25
the exception of Roxbury. Additionally, a significant proportion of
entering students at the college are both educationally and economically
disadvantaged. For example:
1973, one-third of all students were members of families
(parents or student heads of household) earning less than
$7,500 (median) annually. By 1976, this percentage had
grown to forty-five percent.
1976, one—third of STCC’s day students earned less than
$250 annually.
1976, one-third of entering students scored 350 points
or less on their verbal SATs.
Furthermore, in the same year over forty percent of the entering
matriculants could not even meet STCC’s minimum college entrance
competencies in mathematics and reading, such students requiring*
special services and developmental/remedial assistance as a condition of
acceptance. This proportion had grown by an average of five percent in
each of the past several years reflecting the increasing matriculation
of academically unprepared men and women. Thus, it can be assumed that
by 1977-78, or, at the latest, by 1979, more than one out of ^every two
first-time students at the college will be deficient by the school's
minimum standards in math, English, or both.
24Definitions .
Attrition . A precise definition or classification of attrition is
clearly essential to any dropout study but is a matter which has given
researchers serious problems over the years. The major difficulty has

26
been the temporariness of the statnQ of ^rne status of a given student leaver since, intheory, any dropout can go back to college at any point In time to
complete his or her degree requirements. What Initially appears to bea simple matter becomes a problem of choosing a definition unhedged by
qualifying conditions, exceptions, time constraints and the like.
A standard definition of attrition such as, "The Incidence of students
who leave college and do not graduate at the specific time designated for
their entering class to complete Its studies," is probably excessively
broad In that It falls to distinguish between successful perslsters and
those who drop out and return later .on. It also excludes those who eventually
succeed without leaving but take a longer time to complete their studies
than their fellow matriculants. Likewise, In a more abstract sense, this
definition may be too narrow In that It disregards, for all Intents and
purposes, those talented individuals who never attend college at all.
Nor does it address those who graduate on schedule hut whose intellectual
and psychological growth is never stimulated in college and whose per-
formances, therefore, fall far below their capacity. Further compounding
the problem of definition is the recent and growing phenomenon of vast
numbers of students of traditional college age as well as ol4er men and
women who obtain degrees outside of the regular two-year and four-year
>/timeframes by attending classes on weekends, in the evening, or inter—
mittently parttime and fulltime thereby spreading their academic careers
over an extended period of time.
In his definitive book on attrition. Preventing Students from
Dropping Out , Astin coped with this problem by identifying three
rather than the usual two categories of students: those who did not drop

27
out, those who clearly did, and a third group who interrupted their
studies but who, the author felt, had a reasonable chance of obtaining
their degrees in the near future based on data obtained from a
longitudinal survey he conducted. While Astin's definition effectively
removed much of the ambiguity connected with classifying dropouts, it
can be used only if data on students’ long-term academic aspirations are
available, material Astin gathered as part of his research activity.
Clearly such an approach is more difficult to adopt in, for example, a
two-year institution where many students have not crystallized their
thinking about their futures at the time they matriculate.^^
The definition of attrition used for this study is:
The incidence of students v/ho, after enrolling in a technical,health, or business division at STCC, do not graduate withinthe one or two year period designated by the college as neededto complete their programs.
Open Door . STCC does not have a pure "open door" policy in the
sense that any person (or number of persons) can enter the institution
to pursue whatever program he or she wishes. The college’s "open door"
as described in its catalog is as follows: "STCC has an 'Open Door'"
which means the college maintains an admissions policy allowing, within
%
the limits of its budget and certain academic requirements for individaul
programs, any high school graduate to enter the college as a fulltime
day student." ° It is obvious that the stated "conditions" substantially
alter the spirit of a pure "open door" in the respect that they impose
definite limits of acceptance. Nevertheless, the principle of the
"open door" policy is ascribed to, in principle at least, by STCC and the
Massachusetts Regional Community College System.

28
Limitations to Study
This study is designed to deal with the attrition performance of
STCC s career students and career divisions and departments proposing only
policies of intervention to improve student retention in those specific
areas. Strategies for overall institutional economies are not intended
or included.
The paper’s focus on the costs and complexities of offering large-
scale remedial and developmental programs to the educationally disadvantaged
is limited to STCC’s commitment to maintain a balance between these
services and its regular career offerings in a period of financial stress.
No examination of the college’s institutional mission is intended
nor is a follow-up of students about whom data were collected.
Finally, a description or exploration of potential funding sources
does not come within the purview of this project. Rather its fiscal
implications are limited solely to the potential favorable impact an
improved student retention rate might have on the school’s ability to
continue obtaining its regular budget allocations plus attract new
sources of institutional revenues.
Organization of Study
This study is composed of five sections: an introduction to the
problem, a review of the literature, a description of the methodological
approach used, an analysis of results and a final chapter containing a
summary of findings, conclusions and recommendations.

29
Chapter I . A statement of the research problem and the justification
of the study are followed by a discussion of the factors leading to the
current emphasis on institutional performance in higher education.
The current trend toward severe retrenchment practices in education is
described with the experience of the City University of New York (CUNY)
cited as a possible harbinger of things to come. The problem of the
dual clientele of many urban colleges is analyzed and is related to
Springfield Technical Community College. Relevant definitions and the
limitations to the study complete the chapter.
Chapter II . A brief history of attrition research and the reasons for
the existence of this body of literature are given. This is followed by
a discussion of various attrition writings with particular focus on
those studies dealing with environmental factors as they relate to the
dropout.
Chapter III . In this section a description of attrition, the various
attrition categories employed in the study and the student sample are
presented.- Details regarding the selection of various student and
institutional variables are explained. The chapter concludes with a
discussion of various forms of analysis selected to examine student
and college characteristics.
Chapter IV . This section includes a detailed analysis of the data
collected, a detailed explanation of the results obtained from an
examination of the total student sample and student, division and
department characteristics as well as the various discriminant analyses
performed on the data.

30
Chaet^. A sugary of findings and conclusions. reco™s.endatlons andsuggestions for needed research comprise the final chapter

31
CHAPTER II
REVIEW OF LITERATURE
Events Leading to the History of aLiterature on Dropouts
In his interpretive analysis of the dropout problem, Angus discusses
some of the major movements which have played a role in the emergence of
a distinct and sizeable body of secondary school and college attrition
literature. Historically, until recently, the rationale for conducting
most dropout research was the claim that staying in school impacted
positively on future employment and social mobility. Down through the
years, controversies and reform movements centering on this contention
have spawned hundreds of studies supporting or rebutting the premise.
In the early 1900s, child labor reformers ar.gued that the prime reason
for school withdrawal was dissatisfaction with curriculum while employers
of children held it was poverty. Just prior to World War I, the federal
government, which had previously been concerned with the causes of
attrition, shifted its focus to its economic consequences; this change
culminated, in the eyes of many, in a national educational system which
had many of the earmarks of a handmaiden to industry. The Crash of 1929
and ensuing Depression forced a re-examination of the government’s
position since enrollments remained high in this period but so did
unemployment, especially among youth from low-income families. It
was at this point that many researchers began to examine attrition data
by correlating pupil characteristics with academic performance; this
approach characterizing most of the research to this day. (Prior to
32
the 1930s, the majority of studies tended to emphasize the broader
economic or philosophical ramifications of leaving school early rather
than performing detailed analyses of dropouts themselves.) During all
these periods, including after the manpower crisis of World War II, the
government sponsored stay—in—school drives, often with questionable
results. The adoption of the GI Bill is credited as being the single'
greatest impetus (up to that time) to something approaching universal
postsecondary training and shortly after World War II college attrition
studies began to equal, for the first time, research on high school
dropouts. The launching of Sputnik turned the focus temporarily to
the academically talented and away from the dropout,but the eventual
relaxing of Cold War tensions and a shift of domestic problems ultimately
caused the government, once again, to increase its concern for attrition
because of the supposed economic drawbacks of withdrawing from school.
The implementation of Civil Rights legislation moved the justification
for studying early leavers away from claimed future employment benefits
of staying in school toward a more ideological stance which suggested
attrition should be reduced simply because all persons have a basic
inalienable "right" to succeed academically. Finally, the emergence of
nationwide community college system beginning in the late 1950s added
to this ideological thrust, particularly in view of the large number of
9 7non-traditional students enrolled in two-year colleges.
While this researcher has found that this rationale one s right
to succeed in school or college—has remained the major premise on which
much of the current attrition literature is predicated, articles in the
popular press seem to point to a trend reverting back once more to the

33
historic proposition that examining student data and proposing solutions
to improve retention rates are necessary because a large number of
non-persisters is "bad" for the nation as a whole (e.g., leads to
large scale unemployment and other social problems). This rationale,
however, is not evident in most major research sources such as
dissertations and journals.
Types of Attrition Literature
Hammond separates dropout research into six broad categories:
1. Census studies which attempt to document the magnitude of
attrition within and across institutions.
2. Studies which seek self-reported reasons (by students) for
leaving school.
3. Case studies which generally involve long-term follow-up of
students initially regarded as dropout risks at the time of
admission.
4. Studies which utilize a range of admission variables to generate
prediction equations of the potential for "success" in college.
5. Philosophical or theoretical studies which usually include
recommendations for action based on the assumption that
dropping out should be prevented.
6. Descriptive studies which describe the characteristics of
the dropout, how he/she lives, studies, etc.
Hammond concluded that most past Investigations of college attrition focused
on five basic variables: age, sex, ability, socio-economic background.

34
and personality and stated that, in his opinion, most yielded Inconclusive
results. 28 (This finding was confirmed by the investigator.)
An analysis of the representative works of four major educational
philosophies relative to their provision for dropouts was performed by
Partridge. In his study of essentialism, social realism, experimentalism-
reconstructionism and neo-Thomism, he suggests that no single philosophy or
writer (among them Dewey, Hutchins, Conant, Adler and others) was appraised
as adequate for the dropout’s educational experience since none provided
for either -individual personality development or individual social
relationships. 29
A recent trend in attrition research: an effort to improve the
prediction of academic success in college by the addition of non-intellective
variables to cognitive predictors is described by Aiken. He found that
variable studies alone or in combination with congitive predictors have
included personality variables (e.g., Grace 1957 ; Faunce 1960 );
motivational factors (e.g., Aiken 1964 ; Read 1968 ); biographical
characteristics (e.g., Astin 1964 ) and the interaction of character-
istics of the individual and the characteristics of the environment
(e.g., Astin 1964 ; Newman 1965 and Nasatir 1963 ). In all these
studies, the non-intellective variables were generated through 'survey
instruments filled out by students.
Kubiniec added another variable to the non-cognitive domain: that
of self concept which she defined as representing the individual's general
attitude toward himself/herself . Her hypothesis was the self-concept
is presumed to be more global than specific personality traits and, hence,
has more potential for improving the prediction of academic success.
35
While, in general, the Kubiniec study supported the prediction value
of the self-concept theory, results were, accordingto the author, somewhat
conflicting due to the many operational definitions of self-concept.
The rise of open admissions has prompted numerous studies aimed at
comparing the success of those students enrolled under traditional (past
performance) rules and those matriculating through the "open door." In
examining the termination among traditionally and non—traditionally
accepted students at CUNY, Berg’s major finding was that family support
(approval) is the most significant factor leading to persistence. Among
his other results was the finding that while the operationalizing of an
open admission policy caused some minor discontent among traditional
students, it had no measurable effect on their persistence. Another
conclusion was that for the non- traditional student, academic advisement
was a crucial factor in success. Citing the increasing number of college
programs admitting students who previously would not have gone to college,
Berg suggested additional studies on the impact of these more flexible
admissions policies.
Did they leave for the best of reasons ? was the rhetorical title
of Colozzi's study of persisters and dropouts at the Borough 'of Manhattan
Community College. His study, which also included both traditional and
non-traditional matriculants under CUNY’s "open door" policy, found
that the most significant factor leading to persistence in both categories
was student expectations; students of both groups who had well-defined
32goals tended to remain in school.

36
Institutional envionment as a factor in attrition . But what really is
known about the early college leaver? The literature is vast and
continues to grow rapidly forcing the serious researcher not only into
a selective review but, more important perhaps, into a more discriminating
choice of contributing factors and influences to be studied. Between
1960 and 1970, at least six in-depth reviews of the literature of college
dropouts were published; Knoell (1960, 1966), March (1966), Specton
(1965) ,Summerskill (1962) , Waller (1964) . Knoell herself suggests that
college dropout studies may soon rival college predictions studies in sheer
numbers and Summerskill made the point (in 1962) that research on college
dropouts had a history of at least forty years and the attrition rate had
not changed appreciably during that period. Spady stated that despite the
plethora of research, college dropouts still actually outnumber non-
dropouts with only about forty percent of the nation’s students graduating
on the date scheduled for the class in which they matriculated.
Research to date has tended to be microcosmic rather than macrocosmic
and the literature is filled with what Knoell calls "autopsy studies"
in which dropouts are queried about their reasons for withdrawing. Many
attrition experts suggest that researchers should devote increased
attention to the institutional environment as a potentially more
valuable variable than concentrating on further follow-up studies of
those who failed; studies which are frequently replete with conclusions
often drawn from students' personal perceptions. Indeed, the most articu-
late and perhaps most severe critic of our present educational institutions
Paul Goodman, places the blame for dropouts and student alienation squarely
in the laps of the schools themselves, specifically educational

37
administrators. Goodman feels that students' disenchantment with
schools does not necessarily center on lack of ability of students to
adapt to the schools, but rather in the schools' inability to adapt
to the pupils' special needs.
In what may have been the most exhaustive critical analysis of the
problems of dropping out up to that time (1958) , Blough examined a
^bibliography of 476 cited references and 325 supplemental references
dating from 1872. He arrived at 41 factors associated with students
•i leaving school early which he collapsed into eight major categories.
It is interesting to note that schools themselves, as the locus where
knowledge is ostensibly imparted, were not among these eight categorized
factors cited as bearing on persistence. While Blough' s report dealt
primarily with the secondary school sector, the review of literature
conducted by this investigator confirmed that a similar situation
prevails in most college attrition research; the use of variables relating
to an institution's physical and academic potential to increase learning
—
specifically variables such as classroom and laboratory facilities,
student-faculty ratios, academic credentials, and the like—are not
common in studies analyzing attrition performance in higher -education.
Turner addressed, then skirted, this issue by questioning the use
of student-generated data in studies about institutional environments
but concluded by suggesting a closer articulation between colleges and
secondary schools as the most important initial step toward decreasing
dropout rates.
While attrition studies of the institutional environment (often
labeled the environmental "press") do exist, they are relatively

38
recent development In academic research, the majority having been
conducted during the past decade, and they remain a distinct minority
among dropout studies. Feldman broke them down Into six basic
approaches: '
1. Anthropological vignette—actual student case studies
relating to students’ perceptions of their institutions
based on their college experience.
2. Conventional classification—type of school (liberal arts,
technical, etc.) geographic location, etc.
3. Attributes of students—average test scores, average IQ’s, etc.
4. Demographics—size of enrollment, operating budget, library, etc.
5. Social, structural and organizational dimensions—types of
control, institutional patterns of college.
6. "Climate of college"—aggregated perceptions of students in
college.
Since the overall environment or "press" of an institution, no
matter how measured, plays probably the major role in determining which
students go where, the college attended by the student (which is equiva-
lent to saying the general environment in which he/she is placed) obviously
affects to a greater or lesser degree, the general outcome of his/her college
stay. In this respect, Feldman notes the relationship between these six
approaches to attrition. But beyond this connection, such studies have
usually not been designed to address the influence of both the classroom
environment and selection criteria on success or non-success in college.

39
Astin, frequently cited as the preeminent attrition researcher of
the 1970s, defines the college environment as
Identifying and measuring those institutional characteristicswhich are likely to have some impact on the student's developmentincluding any characteristics which constitutes potential stimulusfor the student.
Four major measures of the college environment have been developed.
The first systematic empirical approach is the College Characteristic
Index (CCI) which is based on the notion that the college environment
can be characterized in terms of its potential for reinforcing certain
personality needs. Observers (almost always students) are asked to give
their impressions of some 330 items describing different aspects of the
college climate. The second measure is the College and University
Environment Scales (CUES), similar in approach to the CCI but using
different scoring methods. Astin and Holland produced a somewhat
different instrument for analyzing institutions—the Environment
Assessment Technique (EAT) which is based on the assumption that environments
are transmitted by people and college environments depend on the personal
characteristics of the entire college "family." The fourth method is
a specially designed instrument called the Inventory of College
Activities (ICA) which emphasizes the various "stimuli" which students'
actions produce on others, that is any behavior, event or other observable
characteristic of the institution which is capable of changing the
student's sensory input.
A problem inherent in all four approaches, although somewhat less in
the ICA, is the college "image" aspect of the instrument used. That
is, data are usually generated through questionnaires completed by

AO
undergraduates themselves, with all four methodologies examining
students perceptions of the environmental press.
Feldman, noting that the CCI, CUES, EAT and ICA rely primarily on
student images, used Path analysis to determine institutional
environment but found that the complexity of phenomon, the variety of
possible approaches and other conceptual and methodological difficulties
pose problems of great complexity to the researcher. 3^
Other than indirectly or casually, none of the above approaches
has been used to directly correlate institutional classroom character-
istics in attrition performance. Thus, the problem of which variables
or which environmental study approach to use (and how to study them)
has proven to be a difficult one. In a very traditional study which
produced only inconclusive results. Gum described just one of the
problems which researchers of attrition face. He noted that despite
all the studies which have been conducted on dropouts, one aspect of a
college—its institutional grading standards—may impact on attrition
as much as any other policy or student characteristic. To prove his
point, he posed the hypothetical question: Do the variables which
account for large differences in performance influence attrition if
performance levels are held constant? In other words, does a variable
such as verbal aptitude influence persistence in college only because
of its well-documented relationship with academic achievement or
do dropouts have lower verbal aptitude regardless of the grades they
receive?^^ Unwittingly perhaps, this investigator feels. Gum may have
precisely captured the historic dilemma of the attrition researcher.

41
CHAPTER III
METHODOLOGY
Background to Methodology Employed
A review of the literature indicates that, for the purposes of
comparison and analysis, attrition researchers most frequently have
focused on student variables alone or student variables jointly with
certain institutional attributes such as size of school, religious
affiliation, CO—education, residential facilities, location, academic
philosophies, athletic policies, costs or similar related factors. And
yet, despite the development of a distinct body of research on the
problem of the early leaver dating from before the turn of this century
and the myriad of institutional and student variables studied, the
dropout rate in colleges has not decreased appreciably in more than
forty years.
It is the contention of this investigator that measures relating
more directly to the actual learning environment, that is, the class-
room itself, combined with information pertaining to an institution’s
admissions practices may yield more meaningful and useful results in
terms of tracking dropout patterns and eventually improving student
persistence. It is suggested that certain elements may impinge most
directly and most frequently upon a school’s capability to impart know-
ledge namely faculty credentials, laboratory faciliites, student-
faculty ratios, professional salaries and the like and may well be
powereful variables for analyzing past student performance leading to a

42
superior method of charting students' academic potential. It is
further suggested that obtaining data on these factors from official
academic records and from professional administrators may be an effective
means of eliminating the possible bias present when such Information is
gathered through the use of student—answered surveys; the latter having
been the traditional method employed by most researchers to obtain data
about the actual classroom environment.
The purpose of this chapter is to describe in detail the procedures
applied in the Identifying, gathering and analyzing of such admissions
and classroom data and the reasons for using the methodological procedures
selected. The first part of the chapter defines attrition and describes
how attrition categories were developed. Next appears a description of
the sample of students used. Following this is an examination of the
student and classroom variables related to attrition. Finally, the
methods of exploration of the variables are described. In this final
section, attrition is explored by three methods. The first two sets of
analyses related to attrition based on student variables. These were
examined overall for the total student sample and then explored
individually for the three major career divisions at STCC: technical,
health, and business. The third set of analyses explored the institutional
charateristics which were obtained for all departments.
Description of Attrition and Evolving
Attrition Categories
Attrition; Definition . Attrition is defined as the incidence of
students who, after enrolling at STCC, did not graduate within the one
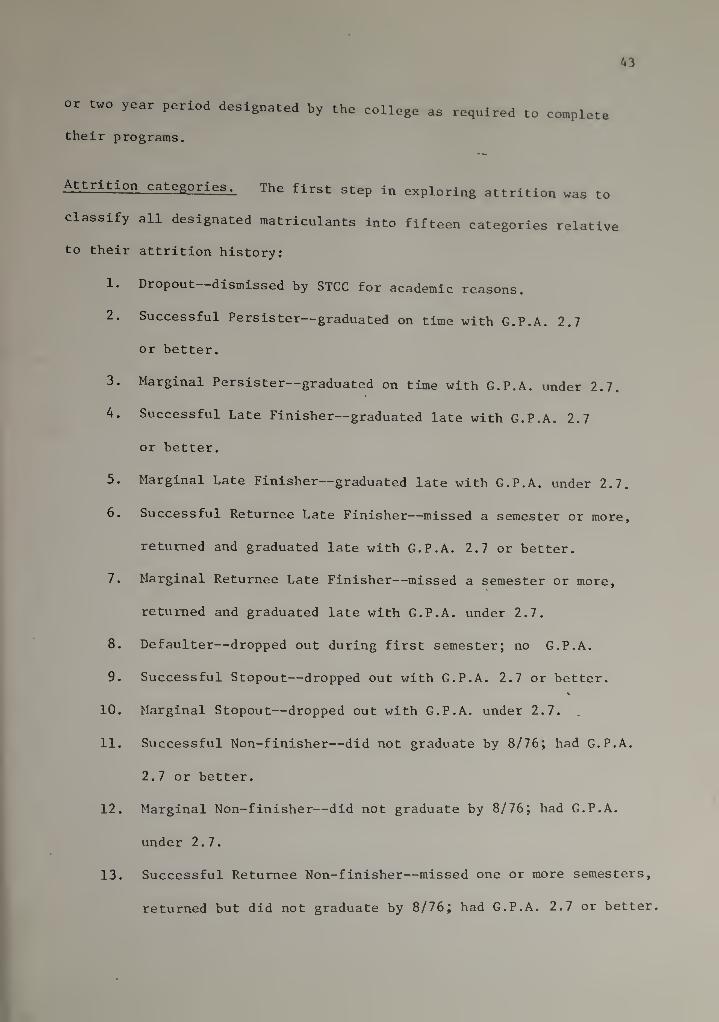
or two year period designated by the college as required to complete
their programs.
Attrition categories. The first step In exploring attrition was to
classify all designated matriculants Into fifteen categories relative
to their attrition history;
1. Dropout dismissed by STCC for academic reasons.
2. Successful Persister—graduated on time with G.P.A. 2.7
or better.
3. Marginal Persister—graduated on time with G.P.A. under 2.7.
4. Successful Late Finisher—graduated late with G.P.A. 2.7
or better.
5. Marginal Late Finisher—graduated late with G.P.A. under 2.7.
6. Successful Returnee Late Finisher—missed a semester or more,
returned and graduated late with G.P.A. 2.7 or better.
7. Marginal Returnee Late Finisher—missed a semester or more,
returned and graduated late with G.P.A. under 2.7.
8. Defaulter—dropped out during first semester; no G.P.A.
9. Successful Stopout—dropped out with G.P.A. 2.7 or better.
10. Marginal Stopout—dropped out with G.P.A. under 2.7.
11. Successful Non-finisher—did not graduate by 8/76; had G.P.A.
2.7 or better.
12. Marginal Non-finisher—did not graduate by 8/76; had G.P.A.
under 2.7.
13. Successful Returnee Non-finisher—missed one or more semesters,
returned but did not graduate by 8/76; had G.P.A. 2.7 or better.
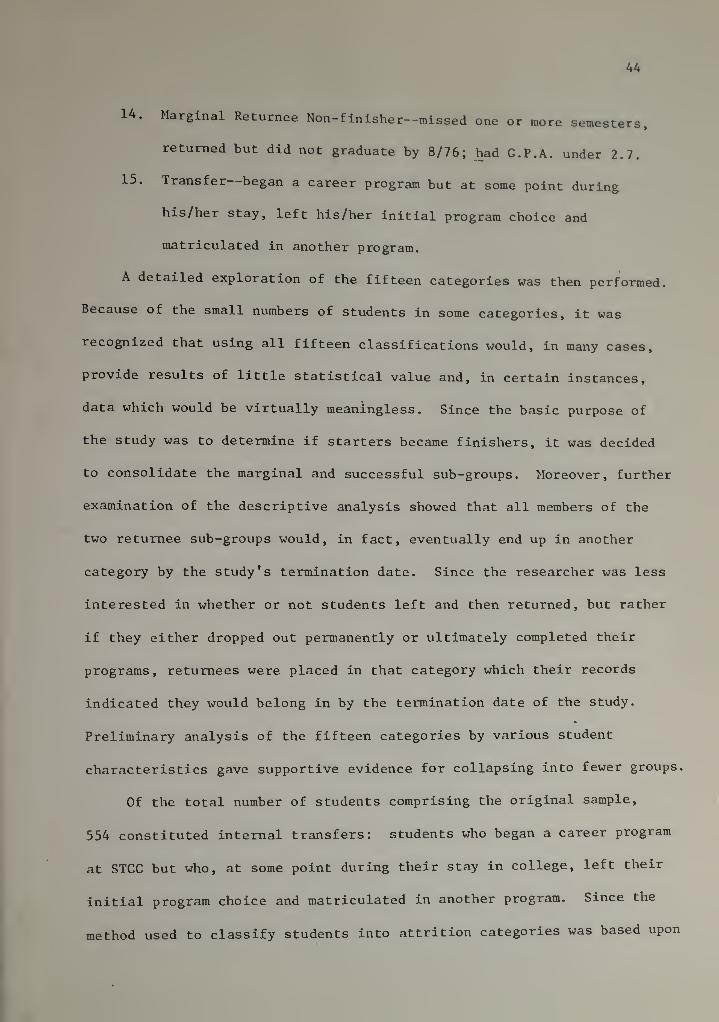
14. Marginal Returnee Non-finisher—missed one or more semesters,
returned but did not graduate by 8/76; had G.P.A. under 2.7.
15. Transfer—began a career program but at some point during
his/her stay, left his/her initial program choice and
matriculated in another program.
A detailed exploration of the fifteen categories was then performed.
Because of the small numbers of students in some categories, it was
recognized that using all fifteen classifications would, in many cases,
provide results of little statistical value and, in certain instances,
data which would be virtually meaningless. Since the basic purpose of
the study was to determine if starters became finishers, it was decided
to consolidate the marginal and successful sub-groups. Moreover, further
examination of the descriptive analysis showed that all members of the
two returnee sub-groups would, in fact, eventually end up in another
category by the study's termination date. Since the researcher was less
interested in whether or not students left and then returned, but rather
if they either dropped out permanently or ultimately completed their
programs, returnees were placed in that category which their records
indicated they would belong in by the termination date of the study.
Preliminary analysis of the fifteen categories by various student
characteristics gave supportive evidence for collapsing into fewer groups.
Of the total number of students comprising the original sample,
554 constituted internal transfers; students who began a career program
at STCC but who, at some point during their stay in college, left their
initial program choice and matriculated in another program. Since the
method used to classify students into attrition categories was based upon

45
dates enrolled and the number of semesters in which grades were received,
most students who transferred internally to another department would be
classified as non—finishers if their first department was considered, or
late— finishers with respect to their second department. Since neither
category sufficiently reflected college attrition (but rather only
departmental attrition) , and since there was no rational basis for
determining the category on either the first or second department, the
researcher selected to delete transfer students from the remainder of
analyses.
Following deletion of internal transfers, the remaining fourteen
attrition sub-groups were collapsed into six separate attrition categories.
The investigator believes these six groups represent the major persistence
and withdrawal patterns at the college. These categories were defined
as follows:
1. Dropout—a student who was dismissed by the college
for academic failure.
2. Persister— a fulltime day student who graduated at the time
scheduled for student's class to complete its regular courses
within the prescribed two or four semesters. This student did
not take any required subjects outside of the regular
scheduled daytime semesters.
3. Finisher—a student who graduated before the August, 1976
termination date set for the study. In addition to attending
classes during the prescribed fulltime two or four semester
day program period, student attended school in a summer,
evening or interim semester or extended his/her studies beyond

A6
the two or four semesters normally needed to graduate.
This group included students who may have dropped out of
school but who retuimed to complete their programs
before August 1976.
(Although these two categories, persisters and finishers,
were analyzed separately, they are also referred to jointly
in this study as completers. This is in line with the
researchers primary focus for the study, namely to compare
those who completed their programs, regardless of how or when
they finished, with those who did not finish, were dismissed,
or left of their own accord.)
4. Defaulter—a student who dropped out during the first
semester before receiving grades (up to the first thirteen
weeks of the semester)
.
5. Stopout—a student who dropped out after successfully
completing the first semester.
6. Non-finisher—a student who did not graduate by the August
1976 cutoff date for the study. Student may have left college
temporarily but did return to his/her original program
before the study's deadline.
Student sample . The sample employed in this study included all
matriculants who applied for fulltime status, were accepted, and paid
their fees and tuition to enter the first semester of a technical,
health or business program at Springfield Technical Community College
in September 1973 or September 1974.

47
student info™atlon was collected from two sources. Data on sexof student, veteran status, high school rank, age and marital status
were available In the college computer data bank, "xhe variables:
economic Independency/dependency and socio-economic status were
abstracted through an Individual review of student folders.
The total number of technical, health or business students comprising
the original study sample was 2387. With the deletion of the 554
transfer students, the total number of students whose academic records
were used to ascertain their attrition history for this study was 1833
limitations of the sample . The total number of fulltime day students
enrolled at STCC in September 1973 was 3108. Total enrollment In
September 1974 was 3341.
Since the purpose of this analysis was to examine only students
matriculating in career programs during the time periods set for the
study, students from the following divisions, departments, sections and
categories were not included:
Technical, health and business divisions—other than
September enrollees
— General studies
— Liberal arts
— Student development
— Summer and evening students
Summer, evening and interim-semester—other than September 1973
and September 1974 fulltime daytime matriculants who may have
taken a course (s) in these sections

48
CETA and other non—credit courses
Special veterans' courses and programs
— Remediation programs
— Seminars and conferences
Any other program not requiring fulltime, daytime attendance
Number of students studied . Table 1 displays the number and percent of
students in each of the three career divisions.
TABLE 1
NUMBER OF STUDENTS BY DIVISION
Technical Health Business Totals
Students 751 490 592 1833
Percentage 41.0 26.7 32.3 100.0
Description of Attrition in Terms ofStudent Characteristics
Student Characteristics . Seven student characteristics were used in
this study: sex, marital status, socio-economic status, high school
rank, veteran, economic independency/dependency and age. These seven
represented, in effect, the major informational data recorded ^d
available on the admissions applications of those men and women
comprising the student sample.
Family or personal income data were not requested on student
applications in 1973 and 1974. Such information pertaining to student
finances has long been recognized and accepted as an important variable
49
for use in college dropout studies. Therefore, it was decided to
include that information which was available on student applications and
which represented at least a general indication of students’ socio-economic
status, namely, the occupation of head of household (usually a parent)
for dependent students and occupation of student when applicant was
independent.
Neither the Scholastic Aptitude Test nor any other placement
examination was required for entering students at the time of this
study. In view of this, high school rank, as indicated on individual
transcripts, was used as evidence of prior academic achievement.
Additional details and specific procedures employed in formulating
individual student variables are provided in the description of each
characteristic.
Sex of student. Data on this characteristic were available for
all students in the computerized student records.
Marital status . Information on marital status on the 1973 and 1974
student applications included only two classifications: single and
married. A recent survey by the STCC Financial Aid Office showed that
approximately ten percent of the school’s aid recipients were divorced,
separated or widowed. However, the paucity of data available at the
time of the study precluded the inclusion of these additional classifi-
cations for this analysis.
Socio-economic status. While it is generally conceded that student
or family income is a superior measure for analysis in attrition studies,
a lack of data on student finances precluded that use of this varaible.

50
However, the researcher considered It Imperative to structure some
method of generating Information to at least broadly classify students
in respect to this characteristic. This was considered especially
important in view of the fact that it has long been assumed that STCC
draws a significant portion of its enrollments from students of limited
financial resources.
An extensive examination of census studies, employment reports and
labor surveys failed to develop a stratified (by income, economic
status or both) listing of employment categories suitable for use in
this study. The problem was twofold:' finding the right model which
would accurately reflect the diversity of jobs which were listed on
student applications as held by the head of hovisehold or the independent
student and extrapolating from these jobs accurate salary figures. A
solution was provided by conducting a review of individual student folders
of the entire study sample from which over 325 occupation classes emerged
ranging from unemployed and in prison to surgeon and bank president.
The researcher in turn consolidated these occupations into ten employment
groups broadly reflecting varying job classifications. For consistency,
in those cases where students listed both parents’ occupations', only that
job held by the head of household was used.
To determine socio-economic status, a decile rank was assigned to
each major group: one (1) equaling employment on the lower end of the
socio-economic scale and ten (10) signifying the most prestigious (and
well-paying) occupations. The scale used is given in Table 2.

51
TABLE 2
Socio-Economic Classification Typical Occupations
1. All others
2. Government assistancerecipient
Disabled, AFDC, welfare, wardof state, unemployed
3. Service employee Waitress, sales clerk, bartender,cashier, postal clerk, bus driver,lunchroom or health aid
4. Labor (unskilled) Janitor, truck driver, factorylaborer, farm worker
5. Tradesman, technician, smallfarm owner
Railroad engineer, foreman,machinist, inspector, meatcutter,skilled construction worker
6. White collar, small businessowner
Office worker, key puncher,telephone operator
7. Owner & manager or mid-levelemployee of middle-sizebusiness
Department head, salesman (otherthan small fim) purchasing agent,
programmer
8. Government, health servicesemployee
IRS agent, librarian, teacher,nurse, police, fire employee,dental hygienist
9. Executive Owner or manager of large busines:
high government official, airline
pilot
10. Professional Physician, lawyer, dentist,
engineer, chemist
High school rank . Along with standardized test scores, high school
rank has long been acknowledged as a valid measure of demonstrated
academic ability when evaluating potential for post-secondary success.
However, judging the probability for success in college through the use
of high school rank is complicated by two related factors. The first is
the need to discriminate between those students who take less rigorous
52
courses in secondary school and who, therefore, may receive better
grades and thus higher class standings upon graduation than their
possibly brighter classmates who pursue more demanding programs with
more competitive grading policies. Secondly, it is generally conceded
that various factors, not always subject to exact measurement, often
operate within a given high school which impinge directly (or indirectly)
upon the overall academic "reputation" of that school in the eyes of
college admissions officers. This has been known to result in a system
in which those making college selection decisions tend to rate the
academic worth of a given high school’s designated ranks as being
greater or less than identical ranks supplied by other schools.
To compensate for these differing perceptions, the researcher had
Intended to use a weighted formula designed to allow for
known differences in high school rankings. However, discussion with the
former STCC Director of Admissions as well as admissions officers at
eight other Massachusetts community colleges and the University of
Massachusetts revealed that the use of such formulas in the past has not
been especially successful; the problem having been one of too many
subjective variables making up the equation.
Both the former and current Directors of Admissions at STCC
advised the researcher that, based on their experiences, they tended to
accept the high school rank indicated on an applicant’s secondary school
transcript as generally coming reasonably close to reflecting the
applicant’s actual ability regardless of the high school courses pursued
or the scholastic "reputation" of the sending institution. Both cautioned,
however, that they also scrutinize the type of courses taken in high

53
school before arriving at a judgement regarding a candidate’s chances
for success in the particular STCC career program requested. Moreover,
they added that, in their opinion, the quality of the sending high
school is probably of less importance in community college selection
procedures than might be the case of admissions decisions at most
four-year colleges.
For this study, high school ranks were used exactly as recorded
on the transcript. These in turn were translated into deciles ranging
from one (1) for the upper ten percent of a graduating class to ten (10)
indicating that applicant was in the ’bottom tenth of the class. For
those students for whom no high school ranks were available (e.g., GED
recipients, some older students, others whose scales had been omitted),
a rank was used based on the median score of the total sample studied.
Veteran status . All students who were veterans were listed on
student records.
Economic independency/dependency status. In addition to seeking
data on students’ socio-economic status, it was considered desirable to
know whether or not students were self-supporting or dependent on their
families. Two categories were developed.
— Independency—students assigned to this category included
all veterans, married students, those twenty-one years of
age or older and students who listed a home address other
than their parents’ as their permanent residence.
— Dependency—all other students in the sample were considered
financially dependent.

5A
Age. Age, in years, was calculated (as of the cutoff date of the
study) from dates of birth in student records. Where this information
was missing, the median age of the student sample was used.
Classroom and other departmental characteristics . Information
pertaining to classroom characteristics was developed to identify those
variables believed to be significant in determining student performance
and withdrawal patterns. Data was obtained through discussion with the
former Deans of Faculty and Administration and the former Director of
Admissions, each of whom was in office at the time selected for this
study, and from other administrators and staff including division
and department heads. Other sources consulted were the STCC HEGIS Reports
of 1973-74 and 1974-75, salary schedules, physical plant plans,
laboratory maintenance reports, enrollment statistics, and departmental
records.
Data on the following six institutional characteristics were collected
for each department: faculty salaries, academic credentials, student
demand for program, admissions criteria, facilities, and student-faculty
ratios. Further information on the manner in which each institutional
characteristic was formulated is included in the detailed description
of each variable.
Faculty salaries . While the premise which correlates instructional
excellence to faculty pay is open to wide discussion, this investigator
suggests that in view of inflation and the rising emphasis in academic
circles on the issue of equitable wages, this factor may play a
telling role in the quality (or lack of same) of classroom instruction;
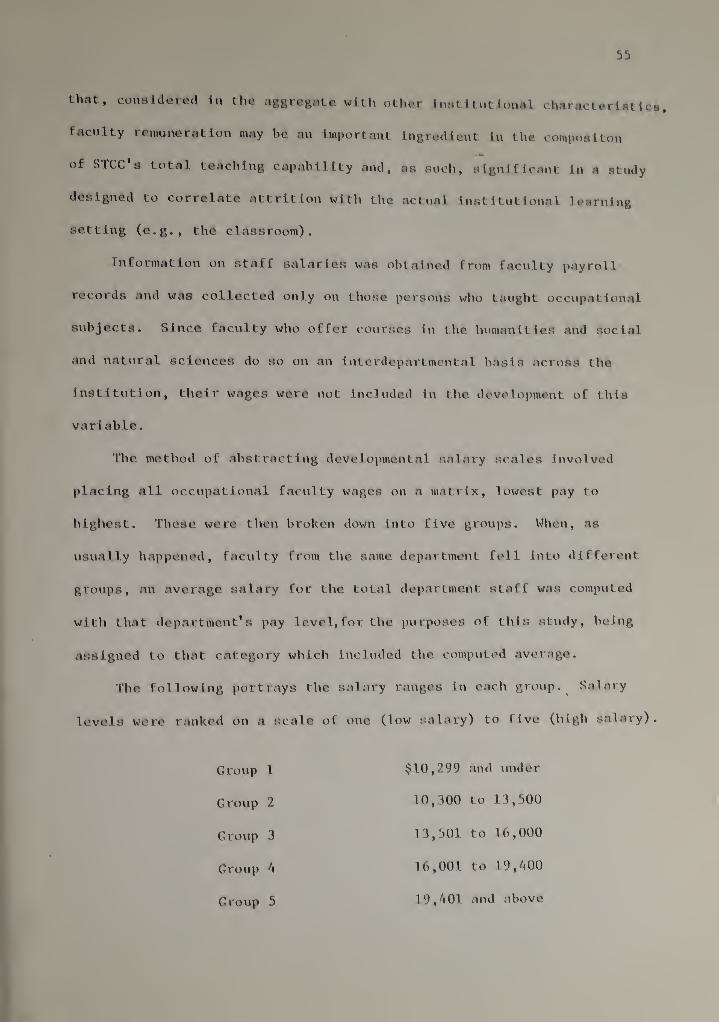
55
that, considered in the aggregate with other Institutional characteristics,
faculty renmneration may he an Important Ingredient In the composlton
of STCC s total teaching capability and, as such, significant In a study
designed to correlate attrition with the actual Institutional learning
setting (e.g., the classroom).
Information on staff salaries was obtained from faculty payroll
records and was collected only on those persons who taught occupational
subjects. Since faculty who offer courses In the humanities and social
and natural sciences do so on an Interdepartmental basis across the
Institution, their wages were not Included In the development of this
variable.
The method of abstracting developmental salary scales Involved
placing all occupational faculty wages on a matrix, lowest pay to
highest. These were then broken down into five groups. Wlien, as
usually happened, faculty from the same department fell Into different
groups, an average salary for the total department staff was computed
with that department's pay level, for the purposes of this study, being
assigned to that category which included the computed average.
The following portrays the salary ranges in each group.^
Salary
levels were ranked on a scale of one (low salary) to five (high salary).
Group 1 $10,299 and under
Group 2 10,300 to 13,500
Grovip 3 13,501 to 16,000
Group h 16,001 to 19,400
Group 5 19,401 and above

56
Academic credentials . Taken by themselves, the number and levels of
degrees attained by a group of faculty members may ’Be disputed as a valid
gauge by which to measure a department's potential for instructional
excellence. However, few would disagree that academic credentials do
provide some indication of the experience, goals and motivation of
professional educators. Therefore, this researcher contends that,
considered jointly with other departmental characteristics, the total
faculty academic achievement of a department may be an important element
in the overall ability of that department to develop a classroom climate
conducive to learning and, in this manner, relate directly to the
attrition performance of its students.
In a technical college, particularly one with vocational school
antecedents such as STCC, faculty often bring with them invaluable
experience in the private sector as part of their preparation for a
teaching career. An examination of faculty vitae revealed that every
teacher evaluated in developing this variable had such prior employment
in medical, industrial or business fields. Due to the inherent difficulty
of placing a precise value on the worth of these experiences, such
non-academic credentials were not used in formulating this variable but
rather were considered a given since private employment was a universal
trait among all faculty included in the development of this characteristic.
This variable was designed to measure academic credentials by
division and department in terms of the highest degrees obtained rather
than on a quantitative basis. In this manner, departments with larger

57
staffs did not artificially raise the ranking order used in evaulating
credentials.
The scale for measuring academic credentials ranged from one
(1) lowest level of academic achievement— to five (5)—highest level
attained.
Group 1 Associate Degree
Group 2 Bachelor’s Degree
Group 3 Bachelor’s and Master’s Degree
Group 4 Master’s Degree
Group 5 Doctoral Degree
Demand for program (number of openings compared to number of
eligible applicants) . Few would deny that the more candidates for a
limited number of class slots, the more selective selection procedures
tend to become. However, in a technical school, because of the high
cost of Instruction, another important factor may be the number of
persons applying for entrance to a department related to the number of
actual openings it has available. The contention here is that a
department may have a greater or lesser number of spaces and depending
on how much demand there is for that program, the instructional approach,
departmental effectiveness and, ultimately the performance of its
enrollees may be influenced by this demand.
Each department was judged on the number of applicants applying
for entry at the time of the study. Department heads and the former
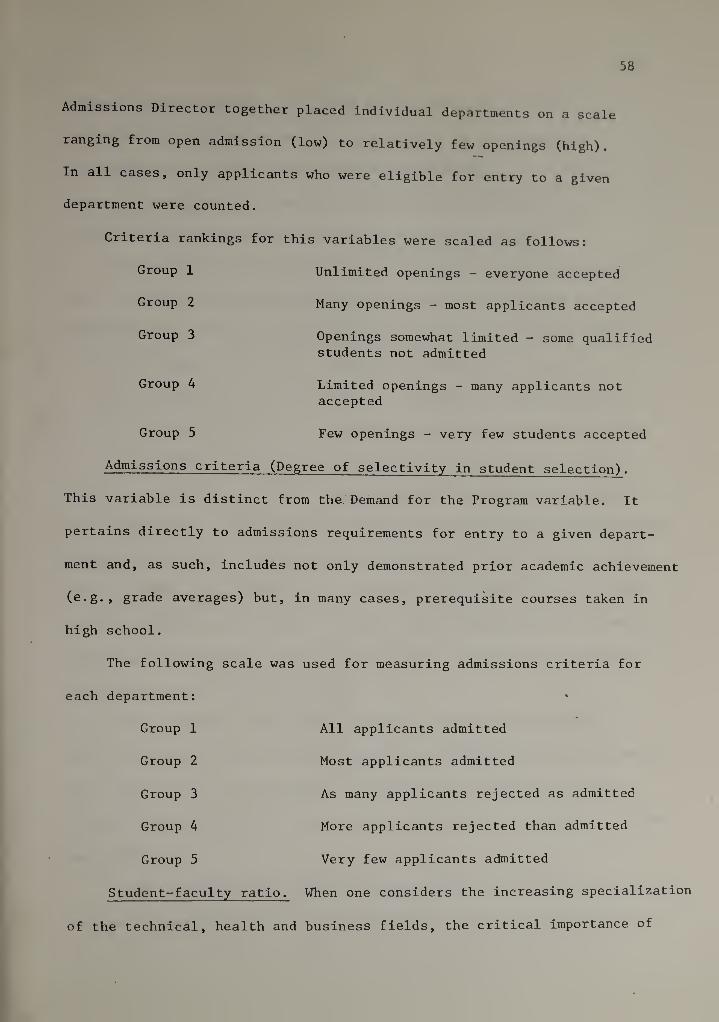
58
Admissions Director together placed individual departments on a scale
ranging from open admission (low) to relatively few openings (high).
In all cases, only applicants who were eligible for entry to a given
department were counted.
Criteria rankings for this variables were scaled as follows:
Group 1 Unlimited openings - everyone accepted
Group 2 Many openings - most applicants accepted
Group 3 Openings somewhat limited - some qualifiedstudents not admitted
Group 4 Limited openings - many applicants notaccepted
Group 5 Few openings - very few students accepted
Admissions criteria (Degree of selectivity in student selection).
This variable is distinct from the Demand for the Program variable. It
pertains directly to admissions requirements for entry to a given depart-
ment and, as such, includes not only demonstrated prior academic achievement
grade averages) but, in many cases, prerequisite courses taken in
high school.
The following scale was used for measuring admissions criteria for
each department:
Group 1 All applicants admitted
Group 2 Most applicants admitted
Group 3 As many applicants rejected as admitted
Group 4 More applicants rejected than admitted
Group 5 Very few applicants admitted
Student-faculty ratio. When one considers the increasing specialization
of the technical, health and business fields, the critical importance of
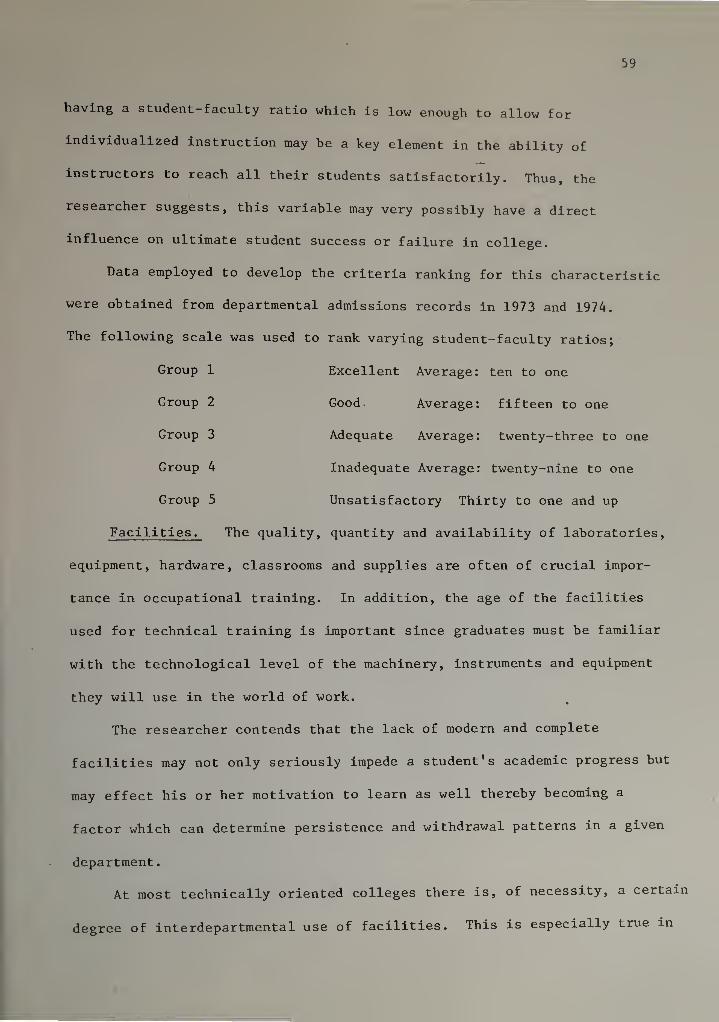
59
having a student faculty ratio which is low enough to allow for
individualized instruction may be a key element in the ability of
instructors to reach all their students satisfactorily. Thus, the
researcher suggests, this variable may very possibly have a direct
influence on ultimate student success or failure in college.
Data employed to develop the criteria ranking for this characteristic
were obtained from departmental admissions records in 1973 and 1974.
The following scale was used to rank varying student-faculty ratios;
Group 1 Excellent Average: ten to one
Group 2 Good. Average: fifteen to one
Group 3 Adequate Average: twenty-three to one
Group 4 Inadequate Average: twenty-nine to one
Group 5 Unsatisfactory Thirty to one and up
Facilities. The quality, quantity and availability of laboratories,
equipment, hardware, classrooms and supplies are often of crucial impor-
tance in occupational training. In addition, the age of the facilities
used for technical training is important since graduates must be familiar
with the technological level of the machinery, instruments and equipment
they will use in the world of work.
The researcher contends that the lack of modem and complete
facilities may not only seriously impede a student’s academic progress but
may effect his or her motivation to learn as well thereby becoming a
factor which can determine persistence and withdrawal patterns in a given
department.
At most technically oriented colleges there is, of necessity, a certain
degree of interdepartmental use of facilities. This is especially true in
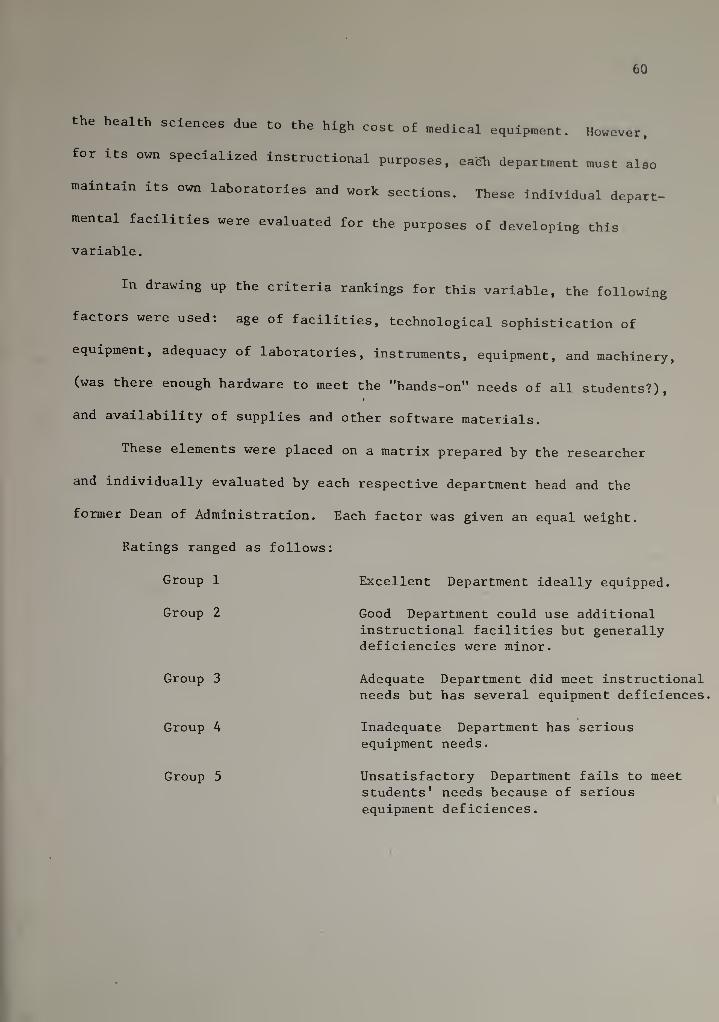
60
the health sciences due to the high cost of medical equipment. However,
for its own specialized instructional purposes, each department must also
maintain its own laboratories and work sections. These individual depart-
mental facilities were evaluated lor the purposes of developing this
variable.
In drawing up the criteria rankings for this variable, the following
factors were used: age of facilities, technological sophistication of
equipment, adequacy of laboratories, instruments, equipment, and machinery,
(was there enough hardware to meet the "hands-on" needs of all students?),
and availability of supplies and other software materials.
These elements were placed on a matrix prepared by the researcher
and individually evaluated by each respective department head and the
former Dean of Administration. Each factor was given an equal weight.
Ratings ranged as follows:
Group 1 Excellent Department ideally equipped.
Group 2 Good Department could use additionalinstructional facilities but generallydeficiencies were minor.
Group 3 Adequate Department did meet instructionalneeds but has several equipment deficiences.
Group 4 Inadequate Department has seriousequipment needs.
Group 5 Unsatisfactory Department fails to meetstudents* needs because of serious
equipment deficiences.
I

61
Methods of Analysis
Des_criptive
_ statlsitlcs . The descriptive statistics for this study
were developed in the following manner;
(1) The number of students in each of the fourteen attrition
sub-groups were counted by department. (Transfer students
were not included.)
(2) To provide empirical evidence for collapsing the sub-groups,
the mean, median, mode and standard deviation of the variables
^8®* high school rank, socio-economic status were computed.
A frequency count was made on the variables economic
independency/dependency status, veteran status, sex,
marital status, high school rank, and socio-economic status.
(3) For the total student sample, the mean, median, mode of the
variables age, high school rank and socio-economic status
were figured in order to be able to fill the appropriate
statistic for missing data.
Collapse of Categories . An examination of the totals of the fourteen
sub-categories revealed that the small numbers in certain groups tended
to render the results of little meaning which led to the collapsing of the
fourteen sub-groups into six major attrition categories. These, described
in detail earlier in this Chapter, were;
Persister—graduated on time
Dropout—dismissed by college
Defaulter—dropped out first semester with no grades
Stopout—dropped out after receiving grades
Finisher-graduated lateNon-finisher—did not graduate by August 1976.

62
Descriptive statistics on major attrition categories . The number of
students in each category by department was based on the mean and
standard deviation on sex, marital status, socio-economic status, high
school rank, veteran, economic independency/dependency status and age.
Discriminant Analysis of StudentCharacteristics
Discriminant analysis was selected for examining student
characteristics because it is a procedure which takes a multiple set of
predictors (the student characteristics) and is capable of finding the
combination or combinations of predictors which can most powerfully
distinguish between groups of subjects (attrition categories).
An assumption made in discriminant analysis and other parametric
statistical techniques is that the predictors are interval scaled
variables. The reader will have noted that four of the predictor
variables in this study are nominally scaled: sex of student, marital
status, veteran, economic independency/dependency status. The researcher
selected a procedure by which these nominal variables were dummy coded
as 1 = inclusion; and 0 = exclusion. This rationale can be found in
Fishbein and is an acceptable technique to use in the analysis of any
general linear mode.^^
The attrition data includes seven predictor variables (student
characteristics) and six attrition categories. It is therefore possible
to derive a maximum of five functions (or combinations of variables)
with which to predict attrition. Ideally, the researcher would desire
fewer functions so that they would give more meaningful interpretation.

63
Analysis of Student Characteristicsby Division
The researcher was interested in determining the potency of
predictors within each department but there was a major limitation to
attempting this analysis. This constraint was that many departments
had too few students to conduct such an analysis. (Some departments
had as few as three or four students). As an alternative to this method,
the researcher collapsed over departments into three divisions from
which students were sampled (technical, health and business) and
performed a discriminant analysis on each major career division.
Analysis of InstitutionalCharacteristics
Six institutional characteristics were gathered for thirty-five
departments. In addition, the analysis of student characteristics gave
the percent of students in each attrition category by department.
A procedure was sought for analyzing this data parallel to that
used for analyzing the student characteristic data. Due to the nature
of the variables to be predicted, that is a frequency distribution, it%
was not possible to use discriminant analysis. For purposes of this
study, the researcher assumed that the rankings of institutional
characteristics formed interval scales. Since each variable formed a
five point scale, this made the assumption of interval scales such as that
assumed in traditional attitude studies (Likert)
.
In the analyses of student characteristics, previously described, the
criterion variable used was the attrition category. When one looks at the
criterion variable (attrition) for each department, the data consists of

64
a frequency distribution representing the percentage of students In' each
of the six categories of interest. Although frequency distributions
or percents are generally viewed as non-parametrie data, the researcher
in this case made the assumption that these data formed parametric
scales because any single category or all categories taken together was
verified as equally valid measures of attrition. The researcher had the
option to create a single variable from the six percents (possibly a rank
for each department) to describe departmental attrition. However, he
felt this procedure would lose a great deal of detailed interpretation
allowed by using the six percentages. Consequently, the researcher assumed
parametric attributes and selected to do a multivariate regression analysis
which simultaneously yields the canonical correlation between the six
predictor variables and the dependent measures (percents of students in
six categories)
.
Interaction Analysis
A method was sought to perform as interaction analysis of the
influenece of student characteristics and institutional characteristics
on attrition. This method could use the department as the unit of
analysis and could potentially score each department on the six institu-
tional characteristics (as was already done) as well as come up with
some measure for each department reflecting student characteristics.
These representations of student characteristics in each department might
be ranks, ratios or other indicators.
The researcher chose not to employ any of these potential methods
because of the great amount of information that would be lost. In
addition, the following problems would have been encountered:

65
(1) As already pointed out, many departments had too
few students to give these statistics any meaningful values.
(2) Confounding of both sex of student and high school rank with
department would have resulted.
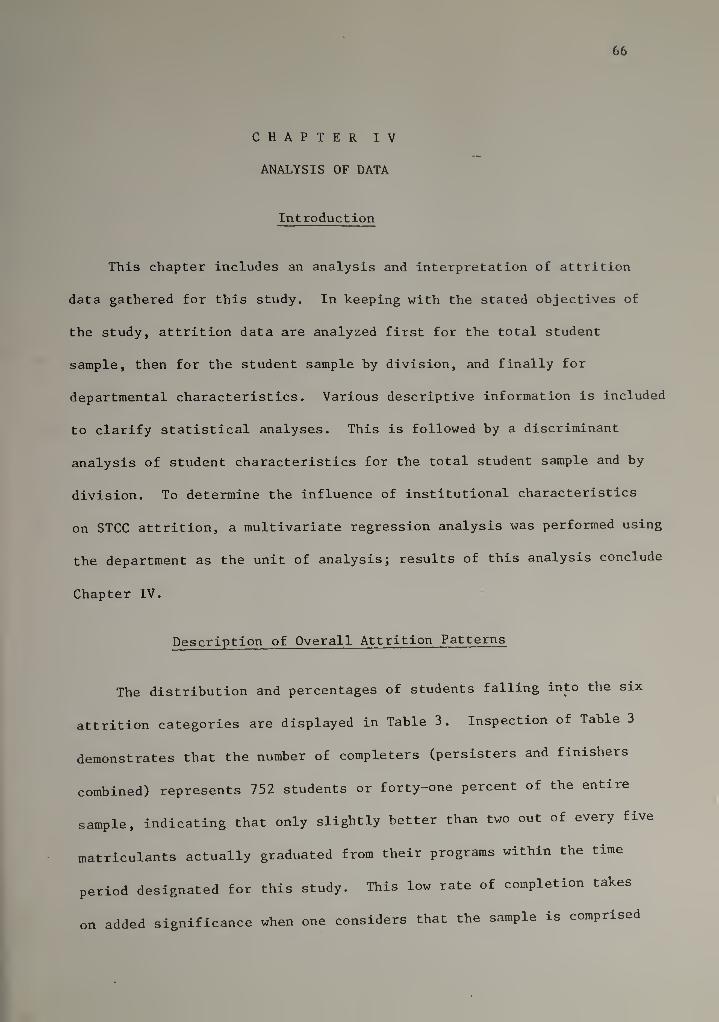
66
CHAPTER IV
ANALYSIS OF DATA
Introduction
This chapter includes an analysis and interpretation of attrition
data gathered for this study. In keeping with the stated objectives of
the study, attrition data are analyzed first for the total student
sample, then for the student sample by division, and finally for
departmental characteristics. Various descriptive information is included
to clarify statistical analyses. This is followed by a discriminant
analysis of student characteristics for the total student sample and by
division. To determine the influence of institutional characteristics
on STCC attrition, a multivariate regression analysis was performed using
the department as the unit of analysis; results of this analysis conclude
Chapter IV.
Description of Overall Attrition Patterns
The distribution and percentages of students falling into the six
attrition categories are displayed in Table 3. Inspection of Table 3
demonstrates that the number of completers (persisters and finishers
combined) represents 752 students or forty-one percent of the entire
sample, indicating that only slightly better than two out of every five
matriculants actually graduated from their programs within the time
period designated for this study. This low rate of completion takes
on added significance when one considers that the sample is comprised

67
of only career (occupational) students, a group generally believed to
have firmly established educational goals at matriculation time
(established enough, at least, to have selected a specific career
program)
.
TABLE 3
DISTRIBUTION OF STUDENTS INTO ATTRITION CATEGORIES
Dropout Persister Finisher Defaulter Stopout Non-finisher
Number ofStudents
51 289 463 498 215 317
Percentage 2.8 15.8 25.1 17.1 12.0 17.2
It should be pointed out that the 317 non-finishers no doubt include
some students who eventually completed their programs at STCC but who,
for a variety of reasons such as academic difficulty, taking a reduced
course load per semester, leaving school temporarily or other causes
did not finish by the study's cutoff date. While such potential graduates
would be counted as finishers if a subsequent STCC attrition study having
a completion point beyond the August 1976 termination date were conducted,
the significant finding here is that data available for this report
reveals that nearly one out of every five career students at' the college
did not finish his/her program by the end of summer 1976, even though
that individual began as a fulltime enrollee two or three years earlier.
Another sizeable group of matriculants fell into the defaulter
category—17.1 percent of the study sample. Nearly one-fifth of all
students who signed up for and paid all tuition and fees to take a
program did not remain in school even long enough to obtain their first
term grades (13 weeks). This is viewed as a significant finding.
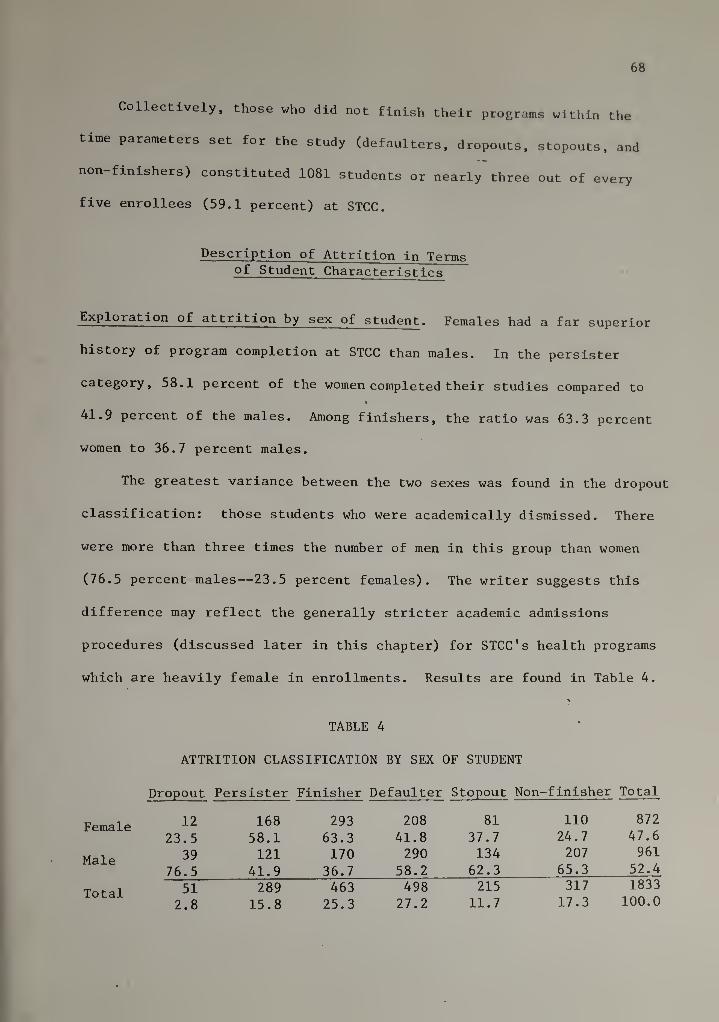
68
Collectively, those who did not finish their programs within the
time parameters set for the study (defaulters, dropouts, stopouts, and
non-finishers) constituted 1081 students or nearly three out of every
five enrollees (59.1 percent) at STCC.
Description of Attrition in Termsof Student Characteristics
Exploration of attrition by sex of student . Females had a far superior
history of program completion at STCC than males. In the persister
category, 58.1 percent of the women completed their studies compared to
41.9 percent of the males. Among finishers, the ratio was 63.3 percent
women to 36.7 percent males.
The greatest variance between the two sexes was found in the dropout
classification; those students who were academically dismissed. There
were more than three times the number of men in this group than women
(76.5 percent males—23.5 percent females). The writer suggests this
difference may reflect the generally stricter academic admissions
procedures (discussed later in this chapter) for STCC’s health programs
which are heavily female in enrollments. Results are found in Table 4.
TABLE 4
ATTRITION CLASSIFICATION BY SEX OF STUDENT
Dropout Persister Finisher Defaulter Stopout Non-finisher Total
Female 12 168 293 208 81 110 872
23.5 58.1 63.3 41.8 37.7 24.7 47 .
6
Male 39 121 170 290 134 207 961
76.5 41.9 36.7 58.2 62.3 65.3 52.4
Total 51 289 463 498 215 317 1833
2.8 15.8 25.3 27.2 11.7 17.3 100.0

69
Exploration of attrition by marltal^^ta^ Nine-tenths of all students
In the sample were single. All categories except one (non-f Inlshers)
fell within six percent of this average. Among the non-finishers,
single students accounted for 83 percent of the total and married
students for 17.8 percent. Thus nearly one out of every five non-finishers
was married. This latter result may be a reflection of the difficulties
which family commitments place upon spouses attending college.
TABLE 5
ATTRITION CLASSIFICATION BY MARITAL STATUS
Dropout Persister Finisher Defaulter Stopout Non-finisher Total
Single A8 277 408 454 192 263 164294.1 95.8 88.1 91.2 89.3 83.0 89.6
Married 3 12 55 44 23 54 1915.9 4.2 11.9 8.8 10.7 17.0 10.4
Total 51 389 463 498 215 317 18332.8 15.8 25.3 27.2 11.7 17.3 100.0
Exploration of attrition by socio-economic status . As can be seen in
Table 6, the variable, socio-economic status, did not produce any
important results relative to this chracteristic’ s influence on
attrition. Because the means are virtually the same for all six categories;
taken by itself, socio-economic status as a prediction of attrition was poor.

70
TABLE 6
ATTRITION CLASSIFICATION BY SOCIO-ECONOMIC STATUS
Mean Std Dev
Dropouts 5.8235 2.1043Persisters 5.6125 1.8415Finishers 5.6566 1.7447Defaulters 5.9558 1.5415Stopouts 5.9256 1.7546Non-finishers 5.5A26 1.7308
— at trition by high school rank. Prior academic achievement,
as measured by grade point average (GPA), has long been used as a variable
the prediction of academic success in college. It is equally
valuable in attrition analysis as a measure for correlating past (high
school) grades to college completion records. Table 7 is clear evidence
that, as expected, students who possessed the highest ranks in their
secondary school graduating classes were more likely to succeed at STCC
as both the greatest number of completers (persisters and finishers)
came from this group. Conversely, as anticipated, non-completers
included more students who had low high school ranks while dropouts
(those dismissed for academic reasons) had the lowest high school ranks
of the six groups.
TABLE 7
ATTRITION CLASSIFICATION BY HIGH SCHOOL RANK
Mean Std Dev
Dropouts 6.1569 2.1384
Persisters 4.4948 2.1508
Finishers 4.5616 2.3234
Defaulters 5.5241 2.1183
Stopouts 5.6791 2.0721
Non-finishers 5.5552 2.0160

71
Exfloratlon of attrition by veteran One out of every ten students
In the sample was a veteran. Within a five percent range, this ratio
remained constant for all attrition groups. While not as consistent an
indicator as others, generally non-veterans were more likely to be
perslsters. The highest number of veterans were found in the non-flnlsher
and stopout categories. An explanation for this finding may be that some
veterans at STCC have been known to matriculate in college study solely
to obtain government benefits with no more solid motivation for their
decision. Given the academic and other demands of attending college, this
may be the reason for the large number of veterans falling into these two
categories.
TABLE 8
ATTRITION CLASSIFICATION BY VETERAN STATUS
Dropout Persister Finisher Defaulter Stopout Non- finisher Total
Non- 46 277 427 447 186 272 1655veteran 90.2 95.8 92.2 89.8 86.5 85.8 90.3
Veteran 5 12 36 51 29 45 1789.8 4.2 7.8 10.2 13.5 14.2 9.7
Total 51 289 463 498 215 317 18332.8 15.8 25.3 27.2 11.7 17.3 100.0
Exploration of attrition by economic independency/dependency status.
A review of Table 9 displays only two meaningful results. Among persisters,
dependent status was somewhat higher than the norm—92.7 percent versus
83.8 percent. While in the non-finisher category, one in four (25.9
percent) belonged to the independent group.
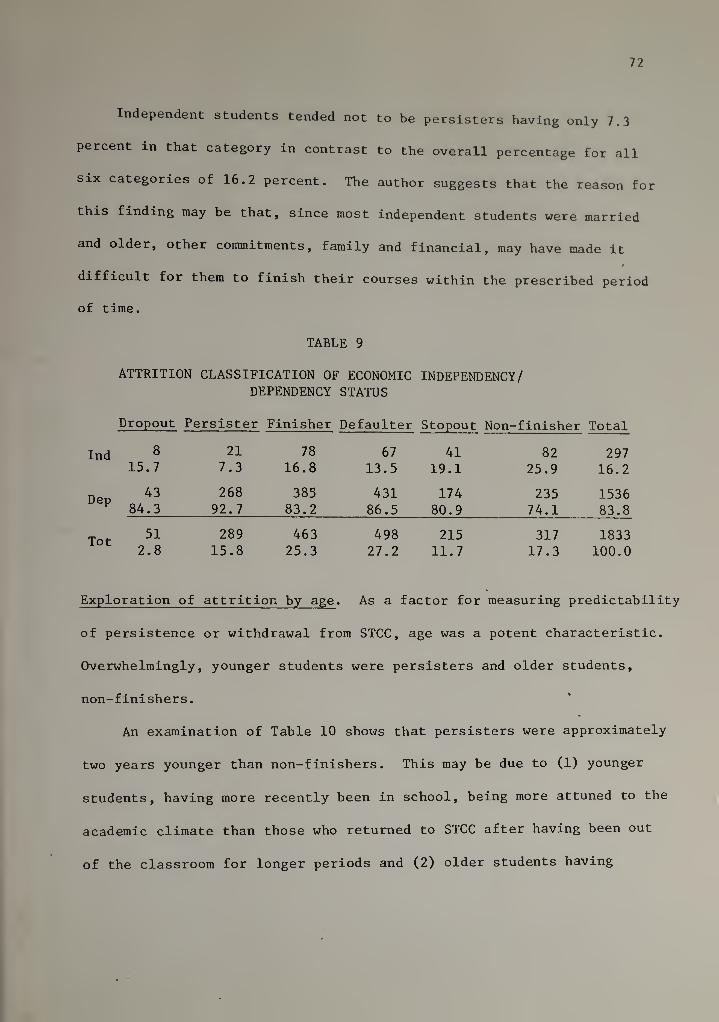
72
Independent students tended not to be persisters having only 7.3
percent in that category in contrast to the overall percentage for all
six categories of 16.2 percent. The author suggests that the reason for
this finding may be that, since most independent students were married
and older, other commitments, family and financial, may have made it
difficult for them to finish their courses within the prescribed period
of time.
TABLE 9
ATTRITION CLASSIFICATION OF ECONOMIC INDEPENDENCY/DEPENDENCY STATUS
Dropout Persister Finisher Defaulter Stopout Non-finisher Total
Ind 8 21 78 67 41 82 29715.7 7.3 16.8 13.5 19.1 25.9 16.2
Dep 43 268 385 431 174 235 153684.3 92.7 83.2 86.5 80.9 74.1 83.8
Tot51 289 463 498 215 317 18332.8 15.8 25.3 27.2 11.7 17.3 100.0
Exploration of attrition by age . As a factor for measuring predictability
of persistence or withdrawal from STCC, age was a potent characteristic.
Overwhelmingly, younger students were persisters and older students,
non-finishers.
An examination of Table 10 shows that persisters were approximately
two years younger than non-finishers. This may be due to (1) younger
students, having more recently been in school, being more attuned to the
academic climate than those who returned to STCC after having been out
of the classroom for longer periods and (2) older students having

73
more outside responsibilities calling on them making the completion of
a program in the normal one-year or two-year periods more difficult.
TABLE 10
ATTRITION CLASSIFICATION BY AGE
Mean Std Dev
Dropouts 23.3137 2.4207Persisters 22.7163 4.3830Finishers 24.2030 5.3393Defaulters 22.0080 .2764Stopouts 24.5070 6.6332Non- finishers 24.8644 6.2275
of Discriminant Analysis of StudentCharacteristics for Total Student Sample
Univariate F— ratios . The univariate F—ratios indicate to the experimenter
the power of each predictor taken by itself. They are a good estimate of
the strength of predictors in the multivariate analysis. Looking at the
univariate F-ratios for the seven student variables (Table 11), the
researcher noted that, as expected, high school rank and sex were the two
best predictors of attrition at STCC. Based on the findings of Astin,
it was also believed that socio-economic status would be important. But
in this analysis, as seen by the univariate F-ratios, this variable taken
alone turned out to be the weakest predictor of all. This may have been
a result of the study’s lack of income figures for use in the analysis
since the researcher had been unable to extrapolate wages from the
occupational titles derived from a record of individual folders. A
somewhat unexpected result was that, taken by itself, age showed up as the
third most powerful predictor. This is in keeping with Knoell’s earlier

lU
studies on four year college students which found age a meaningful
predictor, namely, the younger student has more chance of success in
college.
TABLE 11
RANK ORDERING OF PREDICTIONS BY UNIVARIATEF'-RATIOS FOR DISCRIMINANT ANALYSIS
Rank Variate Univariate I
1 Sex 22.60572 HS Rank 22.18673 Age 20.86844 Eco-Ind/Dep 8.78415 Mar Stat’ 6.19546 Vet 4.66237 Soc-eco 3.4650
Intercorrelation of predictors. In discriminant analysis
which share predictability power tend to confuse the interpretation of
discriminant function coefficients. When two variables contain the
same amount of power, often neither of them appears in the discriminant
function. Therefore, the researcher first verified the shared contri-
butions of predictors by examining the correlation matrix between
predictors as show in Table 12. Here it was shown that being independent,
being married, being older and being a veteran were highly related to
each other as was expected. Fortunately though, when the actual
discriminant function coefficients were examined, some of these variables
did demonstrate a unique contribution.

75
TABLE 12
INTERCORRELATION OF PREDICTORS F0R_DISCRIMINANT ANALYSIS —
Sex 1.00000Mar Stat .03072 1.00000Soc-eco .01928 .05189 1.00000HS Rank .19969 .06424 .00339 1.00000Vet .27843 .35898 .05178 .03839 1.00000Eco-Ind/Dep .06905 .57424 .07763 .01463 .50028 1. 00000
Age .00277 .53979 .05015 .00757 .33189 .57814
Discriminant Functions
In Table 13, three discriminant functions were found to be
significant at the .05 level. And in Table 14 which presents the
standardized discriminant function coefficients, the researcher elected
to interpret all of the non-zero coefficients using a cutoff of .5, but
in all cases examining -the weights of each variable. A discussion of the
three functions and their tables follows.
First function. The first function was found to be primarily composed
of the variables, high school rank and sex, each with a magnitude greater
than .6, the negative signs meaning that a person who scores highest on
fhis function will be a female who has high high school rank. Looking
at Table 15, Centroids of Groups on Three Discriminant Functions, it is
clear that this function distinguishes between persisters and finishers
(e.g., completers) who received high positive centroids of high high
school rank tended to have the greatest success in college.
Second function . The second discriminant function was primarily composed
Because of the negative weight on age, persons whoof the variable, age.

76
are younger should score highly on this function. It can be seen in
Table 15 that persisters and defaulters are distinguished as younger on
this function than all other attrition groups. Although the researcher
was unable to find any situation precisely parallel to this finding in
the literature, it may represent two types of students who come (or are
directed) to college directly from high school. One group is very goal
oriented and probably long before made a firm decision regarding their
career training. The second may simply be in college for something to do
or to please their parents. The result is that the former stay and
graduate while the latter only remain long enough to try "college" (or
say they "tried" it) and leave.
Third function . The third function was found to be a combination of
niarital status, economic independency/dependency status and age. Glancing
at Table 14 , one sees that persons who are married, financially independent
and younger score highly on this function. In Table 15, one sees that
late finishers, defaulters and non-finishers score the highest on this
function but the contrast between these three groups and other attrition
groups is not as striking as the contrasts found in the previous two
functions. The category scoring lowest on this function is the dropouts
Implying that this group tends to be single and dependent although some-
what older than other students at the college. The researcher suggests
that this function is descriptive of high school graduates who may have
been "hanging around" the house or locked into menial, deadend jobs and
who entered college either just to find something to do or to stop

their families from nagging them (or both). With these motivations
it Is hardly surprising this group comprise the lafgest number of
dropouts.
77
TABLE 13
DISCRIMINANT SIGNIFICANCEOF FUNCTIONS
Number EigenvalueCanonical
CorrelationWilksLambda Chi-Square D.F. Significance
1 .10945 .31409 .83258 334.65321 35 02 .06394 .24515 .92371 144.95079 24 .0003 .01052 .10203 .98277 31.74573 15 .007
TABLE 14
STANDARDIZED DISCRIMINANT WEIGHTSFOR THREE FUNCTIONS
Variable ..
SexMar StatSoc-ecoHS RankVetEco-Ind/DepAge
Function 1
-.60043-.15284-.15815-.64246-.01729-.20925.31597
Function 2
-.19763.51214.26271
-.05725.13127
-.06373-1.05042
Function 3
-.29916
.83167-.22119.00743
. .01384
.55597-.65256

78
TABLE 15
CENTROIDS OF GROUPS ON THREEDISCRIMINANT FUNCTIONS
Group Function 1 Function 2 Function !
Dropouts -.57064 -.09027 -.25700Perslsters .36596 .16890 -.11925Finishers .40632 -.09306 .05907Defaulters -.26810 .32454 .05542Stopouts -.23949 -.23308 -.16729Non-finlshers -.25168 -.35530 .09018
Description of Attrition PatternsIn Divisions
One result above all others stands out upon Inspecting Table 16
(Distribution of Students Into Attrition Categories by Division); the
superior performance of students In the health division compared with
those In the business and technical areas. By wide margins, health
nistrlculants scored highest In the completer group (perslsters and
finishers) and lowest among the non-completers (defaulters, non-f Inlshers
,
stopouts and dropouts). Additionally, the health division's record of
having less than one percent dropouts (compared to 3.2 percent In the
technologies and 3.9 percent In business studies) may also be a
reflection of Its (health's) more stringent and, perhaps, more realistic
admissions policies. Further evidence of this may be health's record
of having well over three out of every five students who began a medical
curriculum, completing his or her program by the study's cutoff date.
It is Important to note that despite a 68.6 percent record of
completers (perslsters and finishers), the number of finishers in the
health division Is nearly double the number of perslsters (220 to 116).
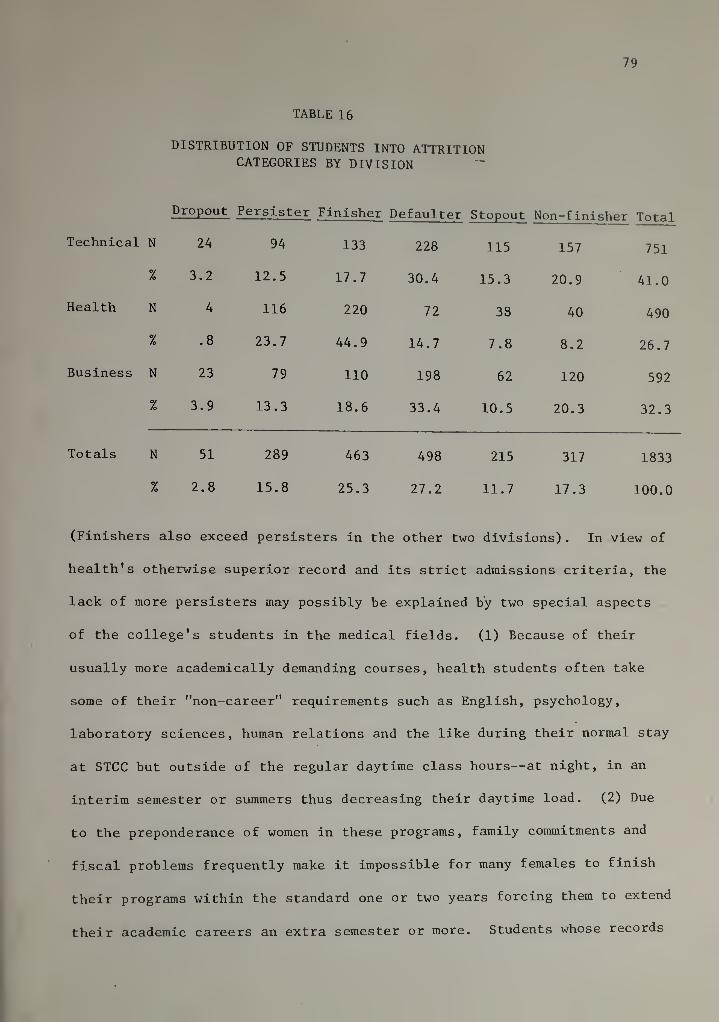
79
TABLE 16
DISTRIBUTION OF STUDENTS INTO ATTRITIONCATEGORIES BY DIVISION
Dropout Persister Finisher Defaulter Stopout Non-finisher Total
Technical N 2A 94 133 228 115 157 751
% 3.2 12.5 17.7 30.4 15.3 20.9 41.0
Health N 4 116 220 72 38 40 490
% .8 23.7 44.9 14.7 7.8 8.2 26.7
Business N 23 79 110 198 62 120 592
% 3.9 13.3 18.6 33.4 10.5 20.3 32.3
Totals N 51 289 463 498 215 317 1833
% 2.8 15.8 25.3 27.2 11.7 17.3 100.0
(Finishers also exceed persisters in the other two divisions) . In view of
health's otherwise superior record and its strict admissions criteria, the
lack of more persisters may possibly be explained by two special aspects
of the college’s students in the medical fields. (1) Because of their
usually more academically demanding courses, health students often take
some of their "non-career" requirements such as English, psychology,
laboratory sciences, human relations and the like during their normal stay
at STCC but outside of the regular daytime class hours—at night, in an
interim semester or summers thus decreasing their daytime load. (2) Due
to the preponderance of women in these programs, family commitments and
fiscal problems frequently make it impossible for many females to finish
their programs within the standard one or two years forcing them to extend
their academic careers an extra semester or more. Students whose records

80
indicated they pursued either of these two paths were automatically
placed in the finisher category although those who opted for the first
alternative (taking extra courses during the scheduled one or two years)
did, in fact, complete their programs on time.
Generally, entrance to the business programs is less selective than
to either the technology or health areas. This could account for the
large number - 33.4 percent, or 1 in 3 in the business division, who
i^to the defaulter group, those who leave college even before the
fi^st semester is over. This suggests that possibly some business
students opt for that division instead of the usually more rigorous
technical or medical fields and, who, shortly after matriculating, find
that business is not for them. The 30.4 percent defaulters in the
technical area might be accounted for by faculty admissions policies or
the academic rigor of these programs which are generally harder than in
business. Overall, the attrition record of both business and technical
were quite similar.
Description of Student Characteristicsin Divisions
%
Sex of student by division . STCC was not an exception to the traditional
preponderance of women enrollees' in its health programs. As can be seen
in Table 17 better than four out of every five medical trainees was a
female (84.7 percent).
Males, on the other hand, predominated in those programs historically
pursued by men; the technical division had 88.0 percent male enrollments.
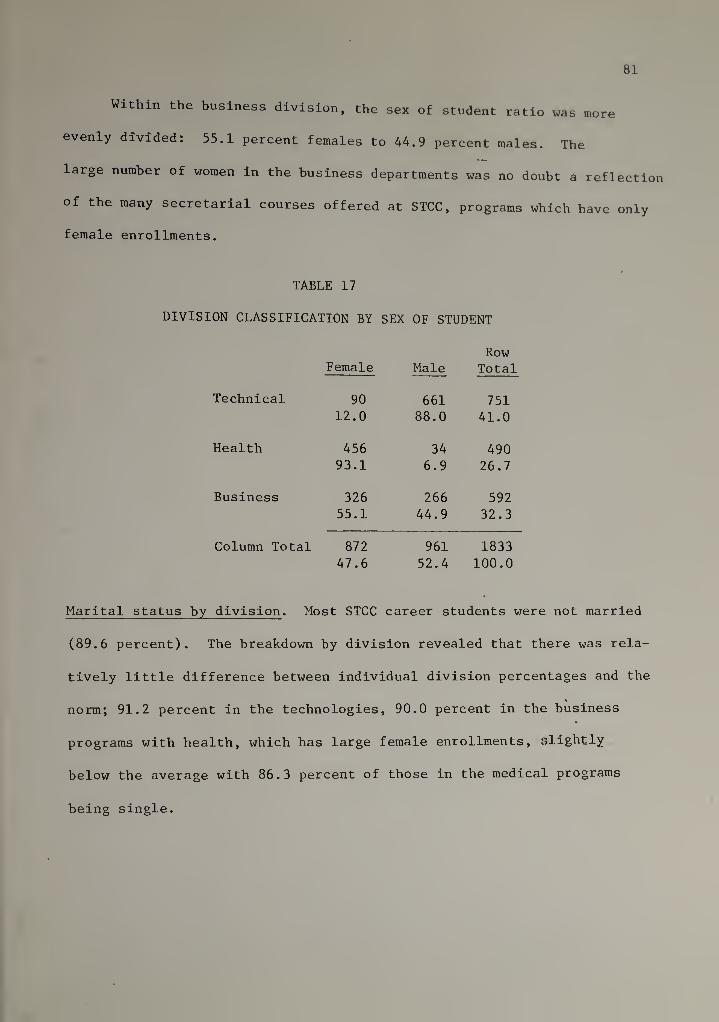
81
Within the business division, the sex of student ratio was more
evenly divided: 55.1 percent females to 44. 9 percent males. The
large number of women in the business departments was no doubt a reflection
of the many secretarial courses offered at STCC, programs which have only
female enrollments.
TABLE 17
DIVISION CLASSIFICATION BY SEX OF STUDENT
Female MaleRow
Total
Technical 90 661 75112.0 88.0 41.0
Health 456 34 49093.1 6.9 26.7
Business 326 266 59255.1 44.9 32.3
Column Total 872 961 1833
47.6 52.4 100.0
Marital status by division . Most STCC career students were not married
(89.6 percent). The breakdown by division revealed that there was rela-
tively little difference between individual division percentages and the
norm; 91.2 percent in the technologies, 90.0 percent in the business
programs with health, which has large female enrollments, slightly
below the average with 86.3 percent of those in the medical programs
being single.

82
TABLE 18
DIVISION CLASSIFICATION BY MARITAL STATUS
RowSingle Married Total
Technical 686 55 75191.3 8.7 41.0
Health 423 67 49086.3 13.7 26.7
Business 533 59 59290.0 10.0 32.3
Column Total 1642 191 183389.6 10.4 100.0
Socio-economic status by division . It is apparent from Table 19 that
there were virtually no differences across divisions regarding students'
socio-economic status. This characteristic had relatively little value as
a predictor of attrition.
TABLE 19
DIVISION CLASSIFICATION BY SOCIO-ECONOMIC STATUS
Mean Std Dev
Technical 5.7694 1.7133
Health 5.6853 1.8159Business 5.8079 1.7332
High school rank by division . It was generally found that students in
the health programs finished higher in their high school graduation
classes than students in either business or the technologies. Of these two,
students in business had the poorest overall secondary school performance.

83
TABLE 20
DIVISION CLASSIFICATION BY HIGH SCHOOL RANK
Mean Std Dev
Technical 5.6061 2.1501Health 4.5703 2.1760Business 5.3854 2.2419
Veteran status by division. Across STCC approximately one out of every
ten students was a veteran. Examining this characteristic by division
revealed that among technical students who are largely males, there were
more veterans than in the total population (14.0 percent to 9.7 percent)
while in the business programs there were fewer than the average (8.6
percent). Predictably, there were very few veterans among the health
students with their large numbers of female students—only 4.5 percent.
TABLE 21
DIVISION CLASSIFICATION BY VETERAN STATUS
Nonveteran VeteranRowTotal
Technical 646 105 75186.0 14.0 41.0
Health 468 22 49095.5 4.5 26.7
Business 541 51 592
91.4 8.6 32.3
Column Total 1655 178 1833
90.3 9.7 100.0
Economic independency/dependency status by division . As has already been
verified in the study, this variable was not especially powerful in
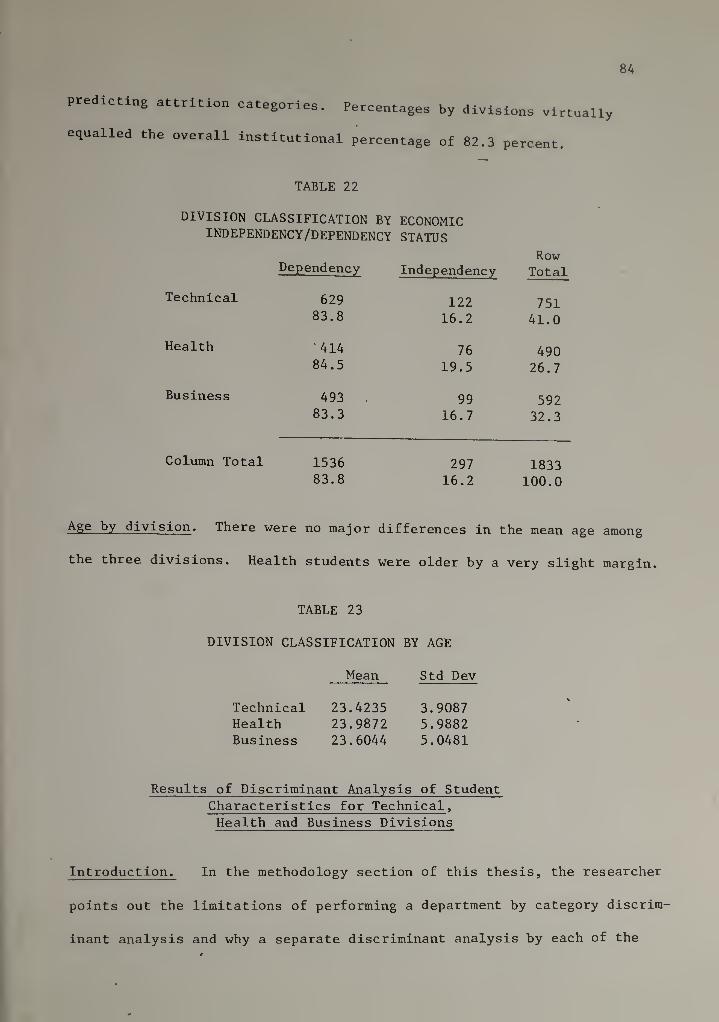
84
predicting attrition categories. Percentages by divisions virtually
equalled the overall Institutional percentage of 82.3 percent.
TABLE 22
DIVISION CLASSIFICATION BY ECONOMICINDEPENDENCY/DEPENDENCY STATUS
Dependency IndependencyRowTotal
Technical 629 122 75183.8 16.2 41.0
Health 414 76 49084.5 19.5 26.7
Business 493 . 99 59283.3 16.7 32.3
Column Total 1536 297 183383.8 16.2 100.0
Age by division . There were no major differences in the mean age among
the three divisions. Health students were older by a very slight margin.
TABLE 23
DIVISION CLASSIFICATION BY AGE
Mean Std Dev
Technical 23.4235 3.9087Health 23.9872 5.9882Business 23.6044 5.0481
Results of Discriminant Analysis of StudentCharacteristics for Technical ,
Health and Business Divisions
Introduction. In the methodology section of this thesis, the researcher
points out the limitations of performing a department by category discrim-
inant analysis and why a separate discriminant analysis by each of the

85
major career divisions within the college was performed instead. Because
of the confounding of the variable sex within divisions (that is, the
health fields are primarily enrolled with females), the analysis was
performed separately for each division rather than a division by category
(3x6 discriminant analysis). The reader will recall that the purpose of
the separate division analysis is to determine the potency of predictors
within the divisions and whether the results are different between
divisions and from the overall results previously described.
Technical . The results of the discriminant analysis performed on the
technical division are found in Tables 24, 25 and 26. Two functions
were found that were similar to the first two functions found in the
overall discriminant analysis already discussed. The most significant
function for technical students was composed of the variables age and
veteran status. - Persons who were older and non-veterans scored the
highest- on this function. These were primarily finishers. Persons who
were younger and veterans tended to be defaulters. This result is very
similar to the overall results, but in the overall results persisters were
also shown to be younger. This could be accounted for by the fact that
there were few persisters in the technical division.
The second significant function was primarily weighted by the
variable high school rank and is also similar to the first significant
function found in the overall discriminant analysis. Here, this function
separated persisters who had high high school ranks from all other
categories whereas in the overall discriminant function, finishers were
grouped with persisters on this function. This did not occur here because

86
finishers were so underrepresented in the technologies. Generally,
the results for the technical division discriminant analysis paralleled
the results for the overall discriminant analysis except for a third
function composed of other variables such as marital status and economic
independency/dependency status which did not appear as significant.
TABLE 2
A
SIGNIFICANCE OF FUNCTIONS IN DISCRIMINANT ANALYSISFOR TECHNOLOGIES
Number EigenvalueCanonicalCorrelation
WilksLambda Chi-Square D.F. Significance
1 .11578“ .32212 .82130 1A6. 56929 35 .0002 .06891 .25390 .91638 65.00881 24 .000
TABLE 25
STANDARDIZED DISCRIMINANT WEIGHTS FOR TWOFUNCTIONS FOR TECHNOLOGIES
Variable Function 1 Function 2
Sex .35841 -.07882Mar Stat -.40762 -.09210Soc-eco -.30260 -.12139HS Rank -.25792 -.91026Vet -.60403 -.03148Eco-Ind/Dep .26739 -.20858Age 1.05258 -.23848
CENTROIDS
TABLE 26
OF GROUPS ON DISCRIMINANT FUNCTION
Group
FOR TECHNOLOGIES
Function 1 Function 2
Dropouts .14115 -.34902Persisters .12343 .57977
Finishers .47162 .03357
Defaulters -.46711 .03501
Stopouts .06645 -.23232
Non-finishers .17682 -.24662

87
Hea^. In the discriminant analysis of the health division, only one
discriminant function was found. The results of these analyses are pre-
sented in Tables 27 through 29. This function was most highly weighted
by the variable, age, although economic independency/dependency status
and socio-economic status showed magnitudes of -.4 which were below the
.5 cutoff the researcher chose for interpretation of results. The
interpretation of this function is that students who were older, dependent
and had a low socio-economic status tended to be non-finishers in the
health division. Younger students here, as in the overall discriminant
analysis appeared as defaulters. In searching for an explanation as to
why persisters did not appear with defaulters on this function, the
reason appears to be that health students tended to be younger than others
at STCC and thus persisters were not found to be significantly younger.
A function composed of sex and high school rank did not appear for health
students because the majority of health students were females with high
high school ranks and thus these variables did not have variability in this
division. The health division, in contrast to technical and business,
demonstrated a far better pattern of graduating. Thus the admissions
department at STCC does not have to be overly concerned about' its typical
health student since that division showed little overall attrition. In
summary, relative to health, it is less easy to generalize the results
of these analyses since that division did not really reflect typical
patterns at STCC.

88
TABLE 27
SIGNIFICANCE OF FUNCTIONS DISCRIMINANTANALYSIS FOR HEALTH
Number Eigenvalue
1 .07106
Canonical WilksCorrelation Lambda
.25757 .86949
Chi-Square D. F. S
67.61551 35
TABLE 28
STANDARDIZED DISCRIMINANT WEIGHTS FOR ONEFUNCTION FOR HEALTH
Variable Function
Sex .10951Mar Stat -.13945Soc-eco -.38857HS Rank -.26565Vet -.08591Eco-Ind/Dep -.44269Age 1.21263
TABLE 29
CENTROIDS OF GROUPS ON ONE DISCRIMINANTFUNCTION FOR HEALTH
Group Function
Dropouts .20594Persisters -.06992Finishers .12925Defaulters .54791Stopouts .00023Non-finishers .45728
ignificance
.000

89
— Tables 30, 31 and 32 record the discriminant analysis performed
on the business division. Of the three groups technical, business and
health, business most highly reflected the patterns of the overall
discriminant analysis.
Three functions were found in business. But unlike the overall
discriminant analysis, the most significant function found in business
was composed mainly of the variable age. A glance at Table 31 shows
that within business, older students were non—finishers and stopouts and
the younger students tended to be persisters and defaulters (also true
in the overall analysis)
.
The second function was again the high school rank/sex function
but here rather than showing the contrast of completers versus others,
the major contrast was that dropouts tended to be mainly males with the
lowest high school ranks although the original contrast of persisters and
finishers versus the other categories does appear.
A consistency of results was also found in the third function.
This function is primarily weighted by the variable marital status, but
in addition high weights were found for age and socio-economic status as
well. Students who were married, younger and of low-income families scored
highly on this function. Single students who were older and had a somewhat
higher socio-economic status will score low on this function. It was
found that looking at Table 32 ,non-finishers were high on this function
and dropouts and stopouts were low. This closely paralleled the results
found in the overall analysis. This was the first function found in all
of the analyses performed to this point in which socio-economic appears
as a predictor. The researcher believes that this result is due to the

90
fact that the business field more than the technologies or health, has
a greater range on this variable although this was not confirmed by
G^flier results. Compared to the other divisions, the variety of
students at STCC is best reflected by the business division in that
there was no single characteristic that can best describe a business
student whereas being a female very well describes being a health student
and similarly, being a male and of low socio-economic status are
obvious characteristics of technical students at the college.
TABLE 30
SIGNIFICANCE OF FUNCTION IN DISCRIMINANTANALYSIS FOR BUSINESS
Number EigenvalueCanonicalCorrelation
WilksLambda Chi-Square D.F. Significance
0 .10036 .30200 .80279 128.61158 35 .000
1 .07383 .26221 .88336 72.61775 24 .000
2 .03491 .18367 .94857 30.91306 15 .009
3 .01175 .10776 .98169 10.82062 8 .212
4 .08233 .08233 .99322 3.98232 3 .263
TABLE 31
STANDARDIZED DISCRIMINANT WEIGHTS FOR
THREE FUNCTIONS FOR BUSINESS
Variate Function
Sex .04698
Mar Stat -.12849
Soc-eco -.16988
HS Rank -.06910
Vet .02218
Eco-Ind/D’fep .08561
Age 1.04365
Function 2 Function 3
.42891 -.31127
.02565 .91421
.15640 -.53554
.77172 .56595
.22634 -.15100
.15199 .27975
.16187 ,55951

91
TABLE 32
CENTROIDS OF GROUPS ON THREE DISCRIMINANTFUNCTIONS FOR BUSINESS "
Group Function 1 Function 2 Function
Dropouts -.11883 .70992 -.35694Persisters -.19835 -.26391 -.16736Finishers .24331 -.41816 .03124Defaulters -.32446 .14889 .06459Stopouts .48310 .08089 .35945Non- finishers .48755 .13353 .22962
Attrition Patterns by Department
As pointed out in Chapter II (Methodology), small enrollments in
certain departments tended to render results somewhat less meaningful when
attrition category data were analyzed on an individual department by
department basis. As a result, no discriminant analysis was performed.
However, three major findings regarding departmental data warrant mentioning.
First, the most obvious finding was the overwhelming superior per-
formance of students in the health departments in completing their programs.
Among those departments which had a seventy-five percent or better com-
pletion rate, all seven departments were medically oriented. One depart-
ment, Radiation Therapy, had a 100 percent completion record^. In the
fifty percent to seventy-five percent completion range, all but one
department, T.V. Communications, also belonged in the health areas.
Second, those departments having less than half their student
completers (but more than twenty-five percent) number fourteen in all
and were largely made up of secretarial programs and the technologies.
Third, six departments: Fire Protection, Business Administration-
Finance, Court Stenogrpaher ,Automotive, Environmental and Heat and

92
Power had the highest dropout rates with less than twenty-five percent
Of their students belonging to the completer group.
Table 33 provides information on the number and'percentages of
students in thirty-five departments. The 554 internal transfer students
are not represented in Tables 33 and 34.
TABLE 33
NUMBER OF STUDENTS BY DEPARTMENT
Department Students Percentage
AutomotiveBio-MedicalBusiness AdministrationBusiness Administration-FinanceCivil EngineeringCosmetologyCourt StenographyData ProcessingDental AssistingDental HygieneEarly ChildhoodElectricalElectronicElectronic BenchworkEnvironmentalExecutive SecretaryFire ProtectionGraphic ArtsHeat /PowerLandscape TechnologyLaw EnforcementLegal SecretaryMachine and ToolMedical AssistingMedical Lab TechnicianMedical SecretaryMental HealthNuclear MedicalNursingOperating Room TechnicianPhysical TherapyRadiation TherapistRadiology TechnicianRespiratory TherapistTelecommunications
Totals
56 3.147 2.6
314 17.132 1.747 2.648 2.612 .7
136 7.460 3.326 1.442 2.365 3.583 4.57 .4
11 .6
119 6.56 .3
77 4.256 3.172 3.939 2.159 3.225 1.453 2.930 1.656 3.138 2.15 .3
74 4.034 1.923 1.33 .2
28 1.526 1.424 1.3
1833 100.0

93
cn
w
H
tJ Z(1) cd
rH CO•
vo O 16 .3 CM cn oS iJ CO CD CO vo o
CM CO r-L^
• 4-»
TO CO rH OV VO CM 00 O 00 rH m(U CO • rH • rH •
S < rH O •d- COCO CO iH
4-1 4JH C CO O O rH 00 o C3V O I—
H
a) CO CO • iH •
M Q < iH O CO rHCO CO iH
1 oCO 4J o o rH rH CO ov CO CO 00W O (U • CM .
I—1• •Q u S CM rH vo
CO CO rH
pq 1
o z 00 OV CN cnCO •H (U O O m vo rH •
I—1 •W M S • cjv oM o CM 'd'Oh iHoO Cu CO
W CCJ 4-1 CM vo mt cm vO 00 CTV O- 00 -.d"H V4 >-l • iH • • rH • 1—1•
< o < CM CO •d" cnU iH CM CM
.
o rC rHM o o iH O CO O o O O vo oH cC O • • • rH • •
M S H CM vO O nTPi rH iH mT CMHH 4J •
C CO 5 (N \0 •d" iH CTV rH d- o VOQJ O • • • iH • •
O Z PM CO VO CO oH rH CM rH53M • •
CJ ^CO (U ^ O O o o rH CO vO CO a> cr>
H rH C rH • iH • CM rH •
Z Pt3 pq CM CO iH CMpq I—
1
iH CO CMQ
cj
CO CU CO VD CO 1—
!
00 CO CM 00 CTN COI
—
' • I—1 • • CM •
Pm PJ CO CM CO cn
O CM iH CO rH
zo cO c.
M 4J 0 'd' vO CO I—1 CO vO 00
H cO >-i • CM • iH • CO • rH •
z Q p^ O- CM rH
PQ rH 1—
1
CO rH
MpcJ
/II 1HCO
(y 4~
H C,
) o o o o iH o o rH
M •H Pi• •
Q Pm p.ivOiH
vOrH
VO
VO m
rH
r'' ov
'd-
00 >d-
COCM
rH O<}•
rH mCM •
ro
moCM
00 ro
CM
CM CMCM •
vO
vovO
uo
S 4-1
hJ wO O cTi CM 00
I—1•
om
O vO
mCM
•vf CO
ci
vO
m
o von .
CO ovm •
CM
O COvO .
CO
00 vo•
CM
r>. vo"d- •
CM
CM
m Ml-
CM .
vO I—
I
m •
CO
CO m00 •
uo mvO •
CO
vO MfCO •
rH
vO CO
CT\ rHCO •
CM
Z 6^ Z 6^ Z z Z Z Z ed
M V4
Dropouts
0)
4-1
CO
rHCO
V40)
PM
Finisher
0)4J
rHPJ
cOIH(U
Q
Stopout
Non-
fin.
Totals

DISTRIBUTION
OF
STUDENTS
INTO
ATTRITION
CATEGORIES
BY
DEPARTMENT
. JCo o<u ciH cuW pq
.
.
c bO(U
Q ffi]
•
na (J(U CU
s Vi
o(U oX cu
w c/5
rHnJ
bu CJ
(U (U
eJ c/5
P Or-l 33 CU
O PC_) cq
o3rH<D
H
1 3• 3
CO 33 •Hpq (P
3• •H
CO B3 'Opq <
X• pP r—
1
3 3(U 3m
p•rt •
O- pCO 30) r3PtH H
Pcu •
o- ao fX
CO p3
Xi Xtp H
9A
O O o o cq ON rH rq rH rq CN VO rsCNsi-
si-
iHsriH
00CN
.
O O iH 0022 .6 iH 00 rH 00 rH 00 vO
cq sr00
rq rq rqCN .
rH
O O rq CMrH •
in 001—
1 •rH inCN •
cq .4- rH VO rHrqCN
VOCN
t-^
r5m n.
m .
rq
cq m cq ONiH • 31 .1 rH in
•00 cq rq
CM OiH
VOCN cn
vOCN .
ONiH
o o 35.1
m <1-
rH .
mCN
2339.0
1118.6
711.9
ON CNm .
rq
o o o o iH cq rH rq CN ts. 00 CN r'.
00 00 VO VOr-H •
1—
1 VO
'd- o o o o0*Zl
rH CN rH CN VD OvOr—
1
oin
Sl-
<N
o o o o o o rH C5N o o iH rH CMrq fO •
VO rq rHON
o <r O CT. 00 rq r^ 00 00 rH r-^ m 'd* rHCN in • sT • 00 . rq . . rH •
CO m m m CN 'd- rorH iH CN rH CN r-H
O O 00 iH sr 00 iH 00 rH r-' sr CX) fH• • . . . ro
1—
1 00 rH rH 00 CMCN rH CN (N rH
o o C3N VO rH OO 00 iH 00 -d- -d- vO ^. • . . . CM •
vO cq o rq mCN CN cq iH
o o CN C3N .J- VO m rq 00 o o Sf ON. CN • . . rq .m O Sl- 00 rH
r-' rH
o o ON rH rq m o o o o rH rq cq rq. iH . . CN
CJN vO Sl- rHcq m
•x S'? X X ^s X ^ X X B'S
P p3 P 3 .
p P 3 P P 33 3 X rH 3 •H 3o •H 3 3 O m iHOi 3 •H 3 O. 1 3o P 3 ip o 3 pp 3 •H 3 p O oQ fp pH Q c/5 X H

DISTRIBUTION
OF
STUDENTS
INTO
ATTRITION
CATEGORIES
BY
DEPARTMENT
95
CO
rHccJ
4J
OH
512.8 289
15.8463
25.3498
27.2215
11.7317
17.3 1833 00.0
iH
co}-l rH rH o o O O CO CO CM CM m m rH \0•H> <y\ 00 m rH •
cw CM rH 'O'
>> 'X3
rH rH CH 00 CO o i-H CM vO CO vO CO 'O' in cs ro• rH • rH • . .
to x: 'O' rH VO 'O' 'O' ov CMw o CO CM rH rH
CO
Vi o o CM r'~ m CO m 00 rH 'O' iH cr\ O3 • m • . . rH • •
13 CM 'O' vD rH 'O' -d*1—
1
1—1• o o rH O CM O rH O o o rH O m CO
O 'T3 . . .
3 0) o o o CD^ S CM 'O' CM CM
•
• .c:
O o o vO 1—
t
m cTi 'O' CO CM rH rH vO 00 toCO CU 1—1
• . . . . CM •
H P'' 'O' CO rHm iH rH
•
'to CU o o CO o O O o o o o o o CO CMCO .G . •
Pi H oorH
1 CUn3 a rH vf vO CO -O' 'O' m C'' CM C'- 'O' 'O' CM Os
G G . 1—1• CM • t—1
• rH • •
G O rH 00 C3V 'O' vO <Ti CO
iG W I—
1
CO rH rH
rH•
“H •
;> w rH rH CO 'O' CM m O CO OV rH CM m \0
•H c . iH • 1
—
I• • rH • •
u w CM VO m 1—
1
cjv m CMCM CM rH CM
CO4-1 CO 'O' CO -O' O CJV "O' Gv I—
1
O' o 'vO rH
3 r-H • 1—1• • rH • m •
<3 in m C'' o vO m CO
iH CO rH CM
Z S'! 13 13 S'? 13 S'? 13 ^S 53
Vi VI
G Vi G •
4-1 4-1 G 4-1 VI c
Totals
Go
CO
•rH
XIW
1—
1
GGO
•rH
M-l
a.oV4
p
CO
Vi
GPM
•iH
G•iH
Pm
G<4-1
GP
PVo4-1
CO
co13

96
Analysis of Ins titutional Characterlst^ p«
To determine the influence of institutional characteristics on STCC
attrition, a multivariate regression analysis was performed with
department as the unit of analysis. In addition to the types of
information found in employing univariate regression analyses, the
multivariate procedure also gives the canonical correlation between the
predictors and attrition categories. Since the beta weights obtained
in the multivariate regression are somehwat difficult to Interpret, the
researcher instead reports the synonomous but more meaningful multiple
correlations from univariate regression analyses on the six attrition
categories. The regression results are found in Tables 36 through 41 .
Correlations between variates and categories are located in Table 42
and the multivariate results are given in Tables 36 through 41.
A glance at Table 35 demonstrates that positive characteristics on
any of the six predictors (high ranks) correlate significantly with high
percentages of persisters and finishers (completers). Whereas, poor
rankings on characteristics correlate highly with leaving (high negative
correlations) . These correlations show that if an institution wishes to
determine which students are going to graduate, it should look. basically
at the number of openings and the selectivity of the department
(e.g., admission criteria).
The canonical correlation shows this result more poignantly.
However, first the regression results will be presented for each attrition
category.

97
As already stated. Tables 36 through 41 represent sunmarles of the
multiple regression analyses performed for attrition categories. This
Information is more amenable to interpretation than the beta weights from
the multivariate regression analysis though the Information yielded is
synonymous
.
Dryouts . Table 36 displays results of the regression analysis predicting
placement into the dropout category. No variable actually related to
the percentage of dropouts. The variable with the highest, although
non-significant, Pearson Correlation is selectivity. Thus the more
selective the department, the fewer the number of dropouts. (In terms
of the overall analysis, this was not a significant result.)
— s ter
s
. In Table 37 it can be seen that selectivity of the department
is the most powerful predictor of success. This predictor by itself
accounts for twenty-three percent of the variability in predicting
membership in the persister category. Since all predictors correlated
positive with having high percentages of persisters in a department, the
inference to be drawn from this analysis is that high standards relate
to a high percentage of persisters.
Finishers . Table 38 also reflects that high standards relate to a high
percentage of finishiers. The single best predictor is having fewer
openings for a large number of eligible applicants.
Defaulters . This regression analysis clearly shows that having low
standards relates to having a high percentage of defaulters. The single
best predictor of defaulters is low selectivity.
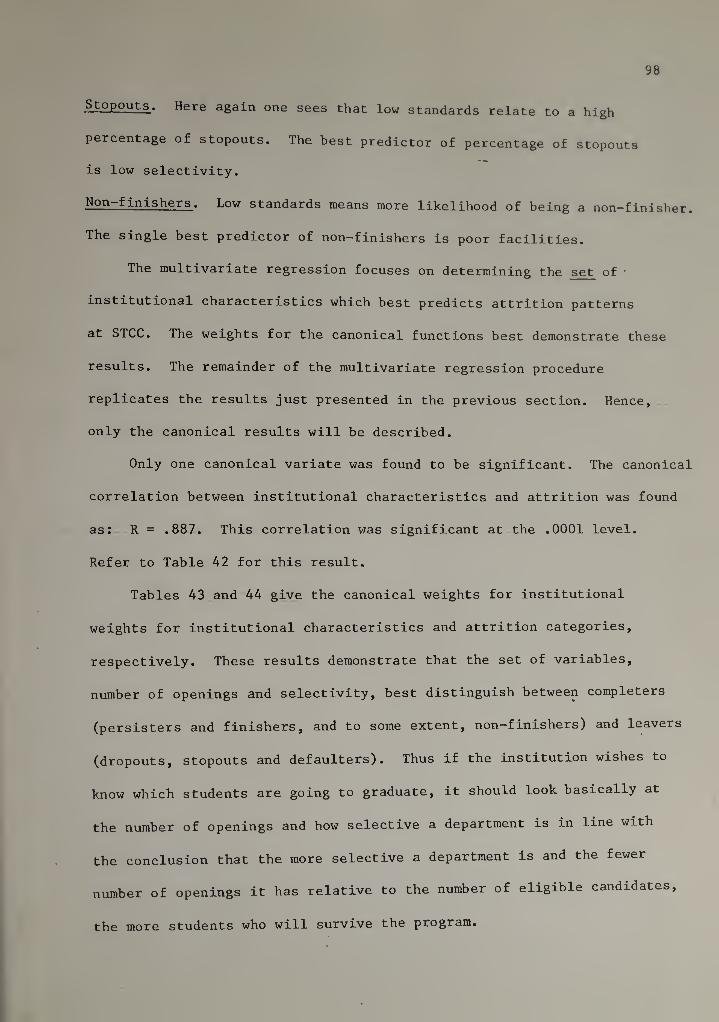
98
_̂ _opouts . Here again one sees that low standards relate to a high
percentage of stopouts. The best predictor of percentage of stopouts
is low selectivity.
Non-finishers . Low standards means more likelihood of being a non-finisher.
The single best predictor of non-finishers is poor facilities.
The multivariate regression focuses on determining the set of '
institutional characteristics which best predicts attrition patterns
at STCC. The weights for the canonical functions best demonstrate these
results. The remainder of the multivariate regression procedure
replicates the results just presented in the previous section. Hence,
only the canonical results will be described.
Only one canonical variate was found to be significant. The canonical
correlation between institutional characteristics and attrition was found
as:_ R = .887. This correlation v;as significant at the .0001 level.
Refer to Table 42 for this result.
Tables 43 and 44 give the canonical weights for institutional
weights for institutional characteristics and attrition categories,
respectively. These results demonstrate that the set of variables,
number of openings and selectivity, best distinguish between completers
(persisters and finishers, and to some extent, non-finishers) and leavers
(dropouts, stopouts and defaulters). Thus if the institution wishes to
know which students are going to graduate, it should look basically at
the number of openings and how selective a department is in line with
the conclusion that the more selective a department is and the fewer
number of openings it has relative to the number of eligible candidates,
the more students who will survive the program.

99
TABLE 35
CORRELATIONS BETWEEN INSTITUTIONALCHARACTERISTICS AND ATTRITION
Dropout Persister Finisher Defaulter Stopout Non-finisher
Salary r
Sig
Credentials
No. Openings
Selectivity
Stu-Fac Ratio
.0828.318
.3237
.029.1343.221
-.2794.052
-.1970.128
-.1950.131
.0417.406
.2994.040
.0015
.497
-.2541.070
-.1482.198
-.0363.418
-.2343.088
.3975.009
.6132
.001
-.4878.001
-.6151.001
-.4160.006
-.2693.059
.4801.002
.4375
.004
-.4924.001
-.6234.001
-.2766.054
.0868.310
.2352
.087
.1003
.283
_ -.3269.028
-.0162 _.463
-.0879.308
-.0979.288
.4052.008
.2611
.065
-.2725.057
-.1637.174
-.4465
.004
Facilities

100
TABLE 36
REGRESSION ANALYSIS—DROPOUTS
Multiple R R Square Simple R Overall F Significance
Salary .35056 .12289 .08276 2.24178 .123Credentials .36362 .13222 .04170 1.57442 .215Selectivity .26930 .07252 -.26930 2.58031 .118Stu-Fac Ratio .36997 .13688 .08675 1.18941 .336Facilities .37229 .13860 -.09875 .93324 .474
TABLE 37
REGRESSION ANALYSIS--PERSISTERS
Multiple R R Square Simple R Overall F Significance
Salary .62150 .38627 .32265 3.65037 .011Credentials .60736 .36889 .29941 6.03994 .002No. Openings .61560 .37897 .39751 4.57667 .005Selectivity .48012 .23051 .48012 9.88576 .004Stu-Fac Ratio .62247 .38747 .23524 2.95196 .023Facilities .54293 .29477 .40525 6.68770 .004
TABLE 38
REGRESSION ANALYSIS--FINISHERS
Multiple R R Square Simple R Overall F Significance
Salary .64749 .41924 .13427 5.41407 .002
Credentials .64872 .42084 .00146 4.21454 .005
No. Openings .61319 .37600 .61319 19.88455 .000
Selectivity .63085 .39797 .43751 10.57657 .000
Stu-Fac Ratio .64926 .42154 .10032 3.40078 .012
Facilities .64123 .41118 .26113 7.21582 .001
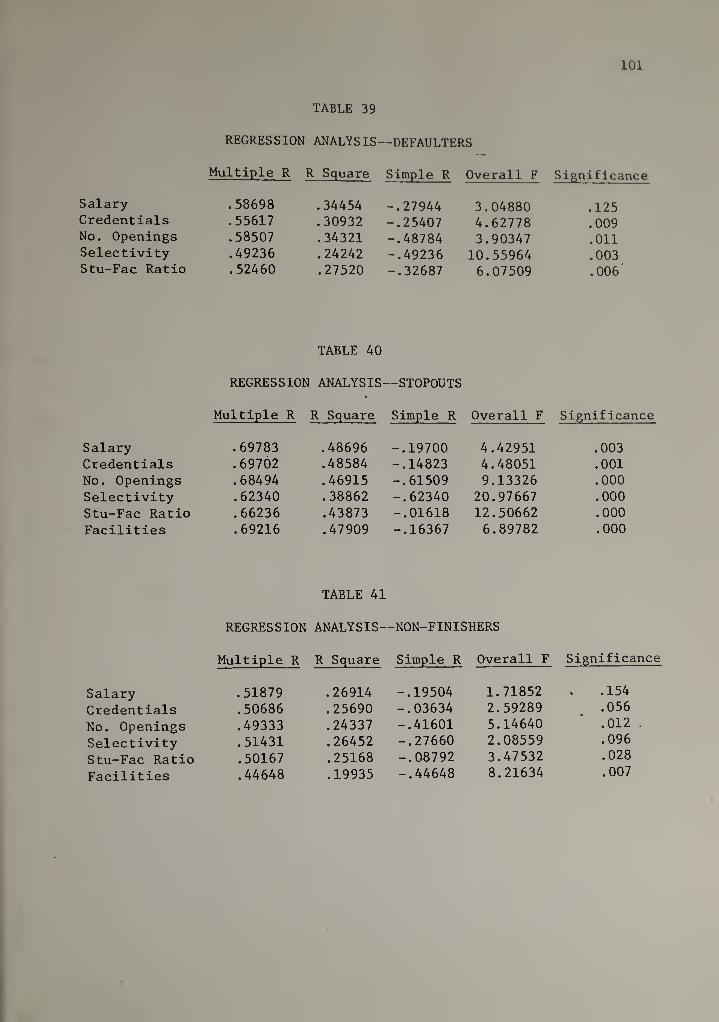
101
TABLE 39
REGRESSION ANALYSIS—DEFAULTERS
Multiple R R Square Simple R Overall F Significance
Salary .58698 .34454 -.27944 3.04880 .125Credentials .55617 .30932 -.25407 4.62778 .009No. Openings .58507 .34321 -.48784 3.90347 .011Selectivity .49236 .24242 -.49236 10.55964 .003Stu-Fac Ratio .52460 .27520 -.32687 6.07509 .006
TABLE 40
REGRESSION ANALYSIS- -STOPOUTS
Multiple R R Square Simple R Overall F Significance
Salary .69783 .48696 -.19700 4.42951 .003
Credentials .69702 .48584 -.14823 4.48051 .001
No. Openings .68494 .46915 -.61509 9.13326 .000
Selectivity .62340 .38862 -.62340 20.97667 .000
Stu-Fac Ratio .66236 .43873 -.01618 12.50662 .000
Facilities .69216 .47909 -.16367 6.89782 .000
TABLE 41
REGRESSION ANALYSIS—NON-FINISHERS
Multiple R R Square Simple R Overall F Significance
Salary .51879 .26914 -.19504 1.71852 .154
Credentials .50686 .25690 -.03634 2.59289 .056
No. Openings .49333 .24337 -.41601 5.14640 .012 .
Selectivity .51431 .26452 -.27660 2.08559 .096
Stu-Fac Ratio .50167 .25168 -.08792 3.47532 .028
Facilities .44648 .19935 -.44648 8.21634 .007

102
TABLE 42
SIGNIFICANCE OF CANONICAL CORRELATIONS FORINSTITUTIONAL CHARACTERISTICS
NumberCanonical
Eigenvalue CorrelationWilksLambda Chi-Square D. F. Significance
1 .28600 .88657 .07937 72.20888 36 .000
TABLE 43
COEFFICIENTS FOR PREDICTOR VARIABLES
Canvar 1 Canvar 2 Canvar 3 Canvar 4 Canvar 5 Canvar 6
Salary .09122 .13454 -.24501 -.04157 -.09479 1.31198Credentials -.17476 -.00919 -1.01000 -.09195 .12930 -.16178No. Openings -.64768 -.88475 -.41459 1.70706 .66825 .01353Selectivity -.35707 .22889 .77881 -1.75868 -.41786 -.20173Stu-Fac Ratio .00330 .43747 .21149 .08265 1.00859 .55696Facilities -.08973 .91384 -.12700 -.00316 -.83139 -.18250
TABLE 44
COEFFICIENTS FOR DEPENDENT VARIABLES
Canvar 1 Canvar 2 Canvar 3 Canvar 4 Canvar 5 Canvar 6
Dropout .10210 .33006 -.19250 .21163 .41000 .86356
Persister -.51646 1.25673 1.29501 -.54794 .1101 .42262
Finisher -.59818 .55832 1.67057 .48871 .35361 .28050
Defaulter .16037 .37922 1.42784 -.01806 -.37968. .69293
Stopout .28381 1.04345 .64314 .43359 .13919 -.39354
Non-finisher -.10997 .13494 1.42527 -.76192 .60283 .17528

103
CHAPTER V
SUMMARY AND CONCLUSIONS
Introduction
The dilemma of attrition and how to cope with it have long
challenged school and college administrators. At first glance, analyzing
the subject of the dropout may not appear especially complex. However,
the diversity of variables, the difficulty of accurately tracking
actual withdrawal patterns and even the matter of defining what attrition
is and is not, the earnest researcher soon becomes aware that the chal-
lenge of the dropout is one of no small magnitude and not a problem
lending itself to easy solutions.
Interest in student attrition has existed for decades increasing in
emphasis at some periods, declining in others. Causing renewed focus on
the dropout in the mid-1970s has been a series of fiscally- related
factors including inflation, rising budgets, faculty salary demands and a
national energy shortage. Added to this has been a general switch in
public priorities away from education to other areas. In part, this
latter development has been due to some general dissatisfaction with
education’s track record during and following the massive funding received
by schools and colleges during the past ten to fifteen years and, in part,
due to the press of other national problems, in particular unemployment.
Budget shortfalls, rising prices and diminishing public support have
occurred at an especially unpropitious time for higher education as
lowering enrollments have already made their presence felt at the primary
and secondary levels with the full impact of the national decline in
births due to arrive at colleges within the next few years. Further
complicating the picture has been a substantial increase in marginally
prepared persons seeking college entry; this factor placing an even
greater burden on higher education in terms of the need to provide
expensive remedial and compensatory programs for such students in order
to assure their ultimate academic success. Simultaneously< _
colleges
have found that they must maintain their attraction to those seeking more
academically rigorous courses or confront the very real risk of trying
to be all things to all people and failing to be anything to anyone.
This dilemma accurately describes the situation at Springfield Technical
Community College which draws large numbers of educationally and econom-
ically deprived students from its nearby low-income neighborhoods while
it also attempts to uphold the academic integrity of its more than forty,
often academically difficult, career programs.
One result of this constrained fiscal climate, especially at
tax-supported colleges like STCC, has been a move toward a recognition
of the need for greater institutional accountability. As taxpayers and
their elected officials become increasingly sensitive regarding the use
of government revenues, public institutions are being asked and, more
and more, being told, to provide concrete evidence of their effective
performance. And while even most laymen would acknowledge that much in
education is difficult to measure statistically, many persons, both
inside and outside academia, consider the matter of college attrition a
legitimate measure by which to measure efficiency and effectiveness.
Paradoxically, this rising emphasis on the withdrawal problem requires the
105
availability of even greater resources which are becoming simultaneously
and increasingly difficult to obtain.
Unfortunately an overlapping of student and institutional
characteristics from institution to institution makes it difficult to
make valid statistical adjustments to compensate for inequalities and
among different schools. And because students are never, in
actuality, assigned to colleges at random, generalizations, especially
about attrition, are difficult to make. However, irrespective of such
problems, the fiscal facts of life in 1977 clearly indicate that schools
no longer have the option of casually claiming certain pre-determlned
factors cause high or low attrition. Each institution would appear now
to have a mandate to improve its student retention rate using whatever, means
it needs.
Specifically, this particular study focused on an analysis of
attrition at STCC using selected student characteristics and the
configuration of various career (vocational) departments. The rationale
for selecting this method was that the actual learning setting, the
classroom, since this is the seat where cognitive learning in college
ostensibly take place, may have a significant influence on whether a
student remains in or leaves school.
The actual problem undertaken was to identify and measure these
variables as they related to attrition performance of selected students
at STCC with the intention of enabling the college to use this information
to propose acceptable solutions of intervention and thereby effect
operating efficiences within the context of STCC’s total management system.

106
To accomplish this, the following objectives were sought;
Identify those variables common to students falling
within certain attrition categories;
— Ascertain the configuration of individual departments and
divisions relative to their respective attrition performance;
— Correlate this data and use it to propose policies of
attrition reduction.
Methodology
Data was gathered on 1833 students who entered STCC as fulltime
students in the fall semester of 1973 and 1974. This sample was limited
to students in one and two-year programs in technical, health and business
divisions. Six categories of attrition were:
1. Dropout—a student who was dismissed by the college
for academic failure.
2. Persister—a fulltime day student who graduated within the
one or two year time period designated for his/her program.
3. Finisher— a student who graduated late or enrolled in
evening/ summer/ interim courses to graduate on time.
4. Defaulter— a student who voluntarily dropped out during
the first semester before receiving grades.
5. Stopout—a student who dropped out after successfully
completing the first semester.
6. Non-finisher—a student who did not graduate by the August
1976 cutoff date for the study.
107
Data defining student characteristics were collected from student
files from the college’s computer data base. Seven types of Information
were used: sex, marital status, socio-economic status, high school
rank, veteran, economic Indepdndency/dependency status and age.
Student attrition was explored using a discriminant analysis
procedure tor the total student sample and tor each of the three
career divisions.
Department characteristics were derived for the same thirty-five
career departments in the technical, health and business fields from
which the student sample was drawn. • Six departmental Indicators were
examined: faculty salaries, academic credentials, demand for program,
admissions criteria, student-faculty ratio and facilities. Rankings
were made by department heads and deans using available data.
The relationship between departmental rankings on six Indicators
and attrition patterns was explored using a canonical correlation.
Findings and Conclusions
Overall student sample . The analysis of the dropout performance of the
total student sample revealed that attrition at STCC constitutes a problem
of major proportions and one which requires the immediate attention of the
college administration. A contributing reason for the need for concern
is the documented trend at the college of poorly prepared matriculants,
a pattern cited in the study and one which could portend even greater
problems for the Institution later on unless steps are taken to Improve
student retention.

108
Only forty-one percent of the students included In the study actually
graduated from their programs within the time limits set for the report.
In view of the fact that, since all students in the study had selected
a specific program thus indicating at least minimally defined career
goals, the researcher considers this small number of finishers especially
disturbing.
Also significant was the fact that nearly one out of every five
students (17.1 percent) did not remain at STCC to complete a single
semester. The author suggests that other results of the study, specifically
the importance the selection criteria and the number of openings in each
department, would indicate that this high number of defaulters could be
due to lack of adequate academic preparation or poor counselling.
Overall student characteristics . In exploring student attrition by
student characteristics, seven different variables were examined: sex,
marital status, socio-economic status, high school rank, veteran, economic
independency /dependency status and age.
The exploration by sex of student showed females having a far better
history of program completions at STCC than males. Women rated better
than men in all six of the major attrition categories. In view of this
finding and in particular of the fact that more than three times the
number of men were in the dropout category (those academically dismissed)
,
the investigator suggests that this result is evidence of the superior
academic backgrounds females bring with them when they come to STCC, a
finding also born out in the results.

109
Economically independent students tended not to be persisters.
Since most independent students were married and older, these factors
may have contributed to their inability to complete their studies on
time.
The same explanation may be the reason why married students scored
high in the non-finisher group; this result being a reflection of the
constraints which family commitments place upon married persons attending
college.
As an influence on attrition, the variable, socio-economic status
did not produce any obvious results.' Family income has traditionally
been shown to be an important influence on attrition. It is possible
the author suggests, because of the manner in which this variable was
constructed (head of household’s occupation rather than income was used)
that this particular characteristic was not as precise, and thus less
valid, than using actual income figures.
When an examination was made of attrition groups by high school
rank, as expected, those students who possessed the highest ranks in the
secondary school graduating classes were shown more likely to succeed
at STCC. Non-completers, on the other hand, had the poorest high school
records.
Veterans accounted for approximately ten percent of the student
sample. The largest number of veterans were found in the non-finisher
and stopout categories. A reason for this result may be that some
veterans may enroll merely in order to obtain government benefits only
to find that the demands of the classroom are too strenuous.
110
Age was an important factor in measuring predicability of persistence
or withdrawal from STCC. Overwhelmingly, younger students were persisters
and older student, non-finishers. Pace confirmed this finding among
students in four-year colleges. This result is perhaps attributable
to the fact that students only recently graduated from high school have
the momentum and recent experience of the classroom and may be better
able to adjust to the demands of college. Older students, on the other
hand, needed more time to become acclimated to college and thus
required a longer period to complete their studies.
Discriminant analysis - overall student characteristics . Overall, the
discriminant analysis of the seven student characteristics yielded two
significant functions indicating that females with higher grades in'
high school and students who were younger tended to be graduates.
Student characteristics in division . Following the collapse of individual
departments across divisions, student variables were examined for the
three divisions: technical, health and business.
In analyzing the sex of students in the three major divisions, as
expected, females dominated the health areas (85 percent women) and
males, the technologies (68 percent men). The business area had slightly
more women (55.1 percent to 4A.9 percent males), no doubt due to the
large number of secretarial programs in this division.
Sex of student also played in role in the veterans classification
with the technologies enrolling 14 percent of STCC veterans as opposed
to the norm of 9.7 percent. Predictably, only 4.5 percent of the
largely female health students were veterans. This finding coincides

Ill
with virtually all of the results in the current literature.
Economic independency/dependency status was nat a good predictor.
The percentages by division practically equalled the overall institu-
tional percentage.
Likewise, the characteristic marital status did not exhibit any
significant difference between divisions with only the health programs,
with their large female populations, having slightly below the average
with 86.3 percent of the health students being single; the norm across
divisions was 89.6 percent. Since health students were slightly
older than average this finding is somewhat difficult to explain, and
the author was unable to find any comparable result in the literature.
Students studying the health programs came to STCC with better high
school records than students in the other two divisions. Business
students had the poorest overall academic ranks in high school. This
finding is no doubt, at least in part, evidence of the more selective
admissions criteria required in the medical and technical programs.
There was no significant difference in divisions regarding students*
socio-economic status. This result was not expected and is contrary to
many of the findings in the literature, especially results of studies
about four-year schools in the United States. As already discussed, a
reason for this, may have been the manner in which this characteristic
was structured since actual income was not part of the composition of
this variable.
Health students were older than students in the other two fields
but only by a slight margin. The author is unable to explain this finding
especially since, among the three divisions, fewer health students were
112
married, but again, by only a slight margin.
Discriminant analysis of the three divisions.
Technical . The most significant function for technical students
was composed of the variables age and veteran status. Persons who were
older and non—veterans were primarily finishers; those younger and «
veterans tended to be defaulters. A possible explanation of this result
is that there were fewer persisters in this division.
The second function was weighted primarily by the variable high
school rank and separated persisters. with high high school ranks from
all other categories.
Health. This function was most highly weighted by the variable age
with economic independency/dependency status and socio-economic status
having less magnitude than the .5 cutoff used for interpretations of
results. The interpretation here is that students who were older,
dependent and had a low socio-economic status tended to be non-finishers.
A function composed of sex and high school rank does not appear for
health students because the majority of these matriculants were females
with high high school ranks. Health results were somewhat more difficult
to make generalizations about since the health division, as already
explained, did not really reflect typical student patterns at STCC.
Business . Three functions were found in business. The first was
made up primarily of the variable age. Within business, older students
were non-finishers and stopouts and younger students tended to be
persisters and defaulters. This was true in the overall analysis.
High school rank and sex comprised the second function; the major
113
contrast being that dropouts tended to be mainly males with the lowest
high school ratings.
The third function showed students who were married, younger and
of low-income families scoring highest. Thus non-finishers were high
on this function up to this point in which socio-economic appeared as
a predictor.
Overall, the business field best reflected the variety of students
at STCC in that there was no single characteristic which best described
a business student while being a female was typical of health matriculants
and being male characteristic of technical division student.
Attrition patterns by department . In view of the small numbers of students
in certain departments, results of attrition patterns by department were
not as meaningful as those of the total sample or across divisions.
However, two significant patterns did emerge upon examination of the
dropout rates by department. The first was the overwhelming superior
performance of health students. All seven departments having a seventy-
five percent or better completion rate were medical programs and all but
one department in the fifty percent to seventy-five percent completers’
group were in the health division.
Conversely, the second result showed the overall poor to mediocre
record of the technologies and business divisions. All but one department
(Mental Health) in the group which had more dropouts than graduates
(twenty-five to fifty percent completers) were business and technical
programs and of the six departments having the highest dropout rates (only
twenty-five percent or less completions) , two were business and four
technologies.

Institutional characteristic results. Using a multivariate multiple
regression analysis, the author attempted to determine the influence of
institutional characteristics on STCC*s attrition rate.
Following are the major findings for each of the six major attrition
groups
:
1. Dropout—no standard actually related to the percentage
of dropouts.
2. Persister—selectivity of department was the single most
powerful predictor in attaining academic success and completing
a program on time.
3. Finisher—the single best predictor for this group was
having fewer openings for a large number of eligible applicants.
4. Defaulter— the regression analysis clearly showed that having
low standards (low selectivity) related directly to students
becoming defaulters.
5. Stopout—low department standards related to a large number
of stopouts.
6. Non-finisher—departments with low admissions standards
tended to have more non-finishers.
The variable with the highest non—significant Pearson Correlation
was selectivity. Thus the more selective the department, the fewer number
of dropouts.
Using variables as a set, the canonical correlation found that
departments which show overall high or positive characteristics will have
more persisters and finishers.

115
Results and Conclusions
Two significant discriminant functions beyond ‘the .001 level
resulted from the discriminant analysis of student characteristics.
(1) The strongest set of predictors found was that of the combination
of high school rank and sex. Females with good grades in high school
tended to be graduates (persisters and finishers). (2) The second
function was primarily an age function which distinguished persisters
and defaulters (younger) from the four other groups.
The discriminant analyses executed separately for each of the
three career divisions were parallel to the overall analysis reported
above. Within business, the socio-economic variate appeared as a
predictor, a result which did not occur elsewhere.
In the study of the departmental characteristics, a single
canonical correlation was found in analyzing the relationship of
departmental characteristics to attrition. Generally, the higher a
department was ranked on any characteristic, the greater was the
percentage of persisters and finishers. The single best set of
predictors from the canonical analyses was the number of openings and
selectivity in admissions policy. This set clearly separated graduates
from dropouts and other non-completers. The results indicate that a
department that had fewer number of openings relative to the number of
applicants and which was more selective in its admissions policies was
more likely to have more students graduate.

116
Recommendations
The data for this study was collected for entering students in the
fall semestersof 1973 and 1974, and this analysis and discussion are
based on the attrition patterns of those matriculants. While it is
possible that some action has been taken at STCC since that period to'
improve the student retention rate of the institution, the only step of
which the author is aware and which should improve the admissions
procedure, is a requirement that all students take the SATs. The fact
that this report is the only (known to the author) attrition study of
any type ever conducted at the college will mean, hopefully, that upon
reading the results herein, the college administration will take positive
steps to lower the dropout rate at STCC and thus improve its overall
institutional performance.
Based on the results of both the student analysis and the data
yielded from the study of departmental characteristics as they relate to
attrition, the author makes the following recommendations.
STCC should undertake a revamping of its institutional admissions
policies using data gathered and analyzed in this report as a mjaor
basis for change. The current requirement that all incoming freshmen
take the SATs is a move in the right direction.
A major effort should be made to avoid placing students in those
departments, especially the technologies, when there is any question
of the student’s ability to perform in math or the sciences.
Greater attention should be given increased counseling as part of
the intake process. This is particularly true for business students

117
where there appears to be a tendency to pursue a business program merely
for the sake of being in a career division but without any apparent
knowledge of what business studies are all about.
Older students, especially veterans should receive greater in-depth
counseling regarding course requirements and the difficulty of programs
selected.
A major review of curriculum requirements for all programs in the
business and technical areas should be undertaken.
Increased emphasis should be placed on all students' ability to
meet the minimum requirements for all career programs.
STCC should advise all department heads of the results of this
study, and of the school’s increasing need to improve its overall
performance including its student retention rate. Faculty should be
Involved in the planning of all new admissions policies.
Because retrenchment is already a serious concern at STCC, efforts
should be made to obtain supplemental funding (from an agency such as
the Fund for the Improvement of Post-secondary Education) in order to
support a major overhaul of the college’s intake process. Data
available from this study should be valuable in the preparation of such
a request.
An effort should be made to expand the orientation of incoming
students specifically in relation to the total aspects of a given
department, that is, in addition to admissions criteria, ultimate
employment opportunities, classroom approach used (e.g., great/small
emphasis on hands-on training, math or science requirements).

118
faculty expectations of students, etc. This might be accomplished
through individual, detailed brochures about each department, films or
personal discussions with department faculty before a student is admitted
to a program.
In view of its large number of defaulters, the business division
should undertake a special program to fulTy acquaint potential business
matriculants with every facet of that division’s operation relative to
what a student can expect and what will be expected of him or her.
Suggestions for Additional Research
This study addressed the attrition performance of STCC’s career
students only. In light of the high dropout rates of these career-
oriented students, the author is concerned about the retention records
of students in the two non-career divisions at STCC: general studies
and liberal arts. A longitudinal study of the attrition rates of these
two divisions would be valuable.
The Student Development Program at STCC is primarily a remedial
division preparing students for entry into one of the regular career
programs. It is suggested that an in-depth attrition analysis of
Student Development enrollees be conducted to track the record of these
students
.
Additional consideration should be given to the importance of
classroom characteristics as potential factors in attrition performance.
\,^xle results of this study showed that admissions practices Cselectivity
and number of students taken) were the most significant variables in
distinguishing between completers and leavers, additional examination

119
and/or use of variables such as student-faculty ratio, faculty credentials
and the like may be warranted.
Information on racial characteristics was not available for use in
this study. And yet STCC, because of its location, draws heavily from
its nearby Black and Hispanic neighborhoods. For this reason, in order
to better serve its minority students who are making up an increasingly large
percentage of the student body, the author suggests a joint study with the
Springfield Urban League, the Springfield Spanish American Union and
STCC to analyze the special needs of these students.

120
FOOTNOTES
^For example, in the Comprehensive Directory of Dissertations
—
Years 1861-1976, under a welter of related headings (Dropout, Dropouts,Dropped, etc.)» over 275 theses were written ranging from case studiesof sixth grade students Identifying those capable of high schoolgraduation and those likely to drop out to several studies devoted todropouts in doctoral programs. Approximately sixty additional studiesappear under Attrition and two entire pages of dissertation abstractsdeal with Student Persistence (or lack of same) . At least two thesesanalyze the literature of attrition stvidles.
2Daniel Schrelber, Profi l e o f the School Dropout, (New York;
Random House, 1967) p. 1.
^The NORCAL study lasted three years and gathered and analyzed datafor over 75,000 students. Because of the large number of schools involvedand varying types of methodologies used, the results, some of which wereconflicting, were less than clear.
^Thos. Macliillan and Donald Kester. "Promise to Keep: NORCALImpact on Student Attrition," The Community and Junior College Journal ,
Vol. A3, No. 5, Feb. 1973.
^ost experts use the year 1973 as the year the academic "crunch"
began in earnest. The business cycle confounded economists as the nation
continued in its worst recession since the 1930’ s Great Depression and
inflation showed no signs of abetting. Aside from a decline of births,
the three basic sources of funds had diminished, all in some degree due
to the increase of unemployii\ent which reduced the available financing
for higher education. These were (1) government grants, (2) parental
accumulations and (3) student eai*nlngs from parttime or summer employ-
ment. Edward H. Witkowskl, "The Economy and the University: Economic
Aspects of Declining Enrollments." The vTournal of Higher Education.
Vol. XV, No. 1, Feb. 1976.
^Department of Health, Education and Welfare, Back to School .
U.S. Government Printing Office, No. FSf . 280: 80053 ,Washington, D.C.
1976, pp. 6-lA.
^Dresch's study took into account changes in the demand for
college education, people in the labor force, changes in the supply of
young people in the population and in the proportion of yoving people
going to college. Stephen F. Dresch, Journal of Political Economy ,
Yale University Press, Sept. 1976.
^National Center for Education, Sixth Annual Report ,Washington,
1976, p. 91.

121
QThe author suggests that while there is definitely a net gain
involved in going to college, the gain is falling and for more and morepeople it may become reasonable not to go on to higher education.Richard Freeman, The Over-Educated American. (Harvard University PressBoston, MA 1976) p. 5.
l^Spekke computed this rate by projecting the lifetime earnings ofa college graduate, minus tuition and other costs and lost income whilein college. His data showed that while college graduates still exceedhigh school graduates in dollars earned, the ratio, stable since WorldWar II, dropped from 53 percent to 40 percent between 1969 and 1974.'Among 25 to 30 year olds, the ration plummeted from 39 percent to23 percent. Andrew Spekke, "Is Going to College Worth the Investment?"The Futuristic , Fall 1976, p. 297.
^^Camegie Foundation for the Advancement of Teaching, The Stateand Higher Education; A Proud and Vital Past and Vital Future,New York, May 1976, p. 67.
1 2Gale O’Brien, "Colleges Optimistic," Chronicle of Higher Education ,
Feb. 17, 1976, p. 1.
^^New York Times, Colleges Optimistic About Future , June 5, 1977,
p. 31.
Kent Halstead, Higher Education Prices and the Price Index ,
1961-75, U.S. Government Printing Office, Washington, D.C., 1976,
pp. 21-31.
Magarral, "Austere Budgets Ahead?" Chronicle of Higher
Education, Feb. 9, 1976, p. 1.
^^"Retrenchment Hits U. of Washington," Chronicle of Higher
Education ,July 26, 1976, p. 3.
l^ibid.
%
l^New York Times, City Schools Retrenching ,Jan. 3, 1977, p. 1.
l^This event, which took place officially on September 7, 1976,
formally ended the tradition of free education which had prevailed since
the University’s oldest unit. City College of New York, was founded in
1847.
2^ew York Times, Times Interviews Kibbee ,July 25, 1976, pp. 15-16.
^^In many ways this movement directly parallels the educational
policies of immediate post World War I when the first large-scale
effort to implement mandatory high school education took place.
122
22j. Magarral,”They’re Putting Lids on Enrollments,"Chronicle of Higher Education . Nov. 31, 1975.
23Advanced Institutional Development Program 'Grant Application,Title III. Springfield Technical Community College, Springfield,Mass., Oct. 1975, pp. 5-7.
0 /A subtle distinction of semantics distinguishes between the
words "attrition" and "dropout." Since attrition virtually alwaysexists (e.g., even at a school with almost no early leavers), theword should not necessarily have a negative connotation and, in fact,does not always carry one. Yet the same might be said of "dropout"(e.g., a school could have a one percent dropout record which would beoutstanding). Nevertheless, "dropout" over the years has definitelybecome more of a term of opprobrium than the word "attrition."
25A. Astin, Preventing Students from Dropping Out . San Francisco;
Jossey-Bass, 1975 pp. 1-21.
^^Springfield Technical Community College Catalog, 1973-74,Springfield, Mass., 1973.
27David L. Angus, The Dropout Problem: An Interpretive History ,
(Dissertation) Ohio State University, 1965.
^^Edward Henry Hammond, The Prediction of Early Attrition from
College , (Dissertation) University of Missouri-Columbia, 1971.
OQMilton Arthur Partridge, An Analysis of Selected Education
Philosophies as Pertinent to the Dropout Problem ,(Dissertation)
University of Cincinnati, 1964.
^^Cathlene M. Kubiniec, "The Relative Efficacy of Various
Dimensions of Self-Concept in Predicting Academic Achievement,"
American Educational Research Journal , May 1970.
^^Anne S. Berg, Selected Factors of Dropout and Non-Dropout
Freshman under Open Admissions at Queens ,(Dissertation) Fordham
University, 1973.
^^Edward Anthony Colozzi, Did They Leave for the Best of Reasons ,
A Study of Persisters and Dropouts in An Open Admissions Community
College ,(Dissertation), Columbia University, 1973.
^^A. W. Astin, Preventing Students from Dropping Out ,San Francisco
Jossey-Bass Publishers, 1975.
^^Kenneth Feldman, "Measuring College Environments; Some Uses
of Path Analysis," American Educational Research Journal ,Jan. 1971.

123
^^Harvey S. Gum, A Study of Dropout Propensity of Selected^nmiuni ty College Students , (Dissertation) Oregon State University, 1977.
Fishbein, "The Method of Constructing an'Attitude Scale(Rensis Likert) Readings in Attitude Theory and Measurement, New York:Wiley, 1967.

12A
BIBLIOGRAPHY
Advanced Institutional Development Program Grant Application, Title III,Springfield Technical Community College, Springfield, Mass.,October 1975, pp. 5-7.
Aiken, L. "The Production of Academic Success and Early Attrition by*
Means of a Multiple Choice Biographical Inventory." AmericanEducational Research Journal , May 1964.
Alfert, E. "Housing Selection, Need Satisfaction, and the Dropout fromCollege." Psychological Reports , 1966.
Angus, D. The Dropout Problem; An Interpretive History. (Dissertation),Ohio State University, 1965.
Astin, A. W. "An Empirical Characterization of Higher Education Institutions."Journal of Educational Psychology , 1962.
Astin, A. W. "Personal and Environmental Factors Associated withCollege Dropouts Among High Aptitude Students." Journal of
Educational Psychology , 1964.
Astin, A. W. Preventing Students from Dropping Out . San Francisco: Ca:
Jossey-Bass Publishers, 1975.
Astin, A. W. The College Environment . Washington, D.C: American Council
on Education, 1968.
Bayer, A. E. "The College Dropout: Factors Affecting Senior College
Complexion." Sociology of Education ,1968.
Berg, A. Selected Factors of Dropout and Non-Dropout Freshmen Under
Open Admissions at Queens College, CUNY. (Disseration) Fordham
University, 1973.
Berger, D. The New College Dropout: An Examination of Factors Associated
with Termination for Traditional and Non-traditional College Students .
(Dissertation) Columbia University, 1973.
Blough, T. B. A Critical Analysis of Selected Research Literature on the
Problem of School Dropouts . (Dissertation), University of Pittsburg,
1956.
Butler, F. C. Instructional Systems Development for Vocational and
Technical Training . Englewood Cliffs, N.J: Educational Technology
Publications, 1972.

125
Byrne, T. R. "Labor Market Indications in the Five City Area - 1974."A Report to the Labor Market Advisory Council for WesternMassachusetts , American International College, Business ResearchInstitute, Springfield, Mass., 1974.
Carnegie, C. I. "The College Dropout: His High School Prologue."Bulletin of the National Association of Secondary SchoolPrincipals, 1970, 54.
Carnegie Commission on Higher Education, More Time, Less Options,New York: McGraw-Hill, 1972.
Carnegie Foundation for the Advancement of Teaching. The State andHigher Education: A Proud and Vital Past and Vital Future.New York: McGraw Hill, May 1976, p. 67.
Cohen, A. M. , Drawer, F. B. , and Connor, A. Selected PersonalityCorrelates of Junior College Dropouts and Persisters. Paperpresented at California Educational Research Association.Los Angeles, March 1969.
Collozzi, E. A. Did They Leave for the Best of Reasons? A Study ofOpen Admissions Community College. (Dissertation) ColumbiaUniversity, 1973.
Committee on Labor and Public Welfare, (U.S. Senate), Subcommittee on
Education, Notes and Working Papers Concerning the Administration
of Programs Authorized under Vocational Education Act of 1963.
(Public Law 88-210, as amended) Washington, U.S. GovernmentPrinting Office, 1968, pp. 355-356.
Cronbach, L. S. and Suppes, P. "Research for Tomorrow’s Schools."
Report of the Commission on Educational Research of the National
Academy of Education , London, Eng: MacMillan Co. , 1969.
Davis, B. H. The Community Junior College Experience as Perceived by
Students who Have Withdrawn . (Dissertation) University' of
Florida, 1970.
'Department of Health, Education and Welfare. Back to School .
Washington, U.S. Government Printing Office, 1976.
DiCesare, A. C. ,Sedlacek, W. E.
,and Brooks, G. C., Jr. "Nonintelletcual
Correlates of Black Student Attrition." The Journal of College
Student Personnel , 1972.
Dresch, S. Journal of Political Economy , New Haven: Yale University
Press, Sept. 1976.

126
Eagle, N. "Dropout Prediction at an Urban Community College FollowingOpen Admissions." Paper read at American Educational ResearchAssociation meeting . New Orleans, February 1973.
Editors; Teachers College Record /Harvard Educational Review,Problems and Issues In Comtemporary Education, Glenview, 111: Scott,Foresman and Co., 1968.
Feldman, K. "Measuring College Environments; Some Uses of PathAnalysis." American Educational Research Journal, Jan. 1971.
Fishbein, M. "The Method of Constructing an Attitude Sclae (RensisLikert)." Readings In At titude Theory and Measurement
,New York;
Wiley, 1967.
Freeman, R. The Over-Educated American . Boston; Harvard UniversityPress, 1976, p. 5.
Fuller, J. A. A Comparison of the Characteristics of Early-Leaverswith those of Graduates from Technology Programs of Selected
Michigan Community Colleges . (Dissertation) Duke University, 1971.
Gum, H. S. A Study of Dropout Propensity of Selected Community
College Students . (Dissertation) Oregon State University, 1973.
Halstead, D. Higher Education Prices and the Price Index - 1961-75 .
Washington: U.S. Government Printing Office, 1976, pp. 21-31.
Hammond E. H. The Prediction of Early Attrition from College .
(Dissertation) University of Missouri, Columbia, 1971.
Johnson, D. E. "Personality Characteristics in Relation to College
Persistence." Journal of Counseling Psychology , 1970, 17.
Kubinlec, C. "The Relative Efficacy of Various Dimensions of Self-
Concept in Predicting Academic Achievement." American Educational
Research Journa l, May 1970.
Lawry, N. A Comparative Analysis of Selected Personal and Academic
Characteristics of Community College Graduates and Dropouts.
(Dissertation) Fordham University, 1973.
Lindquist, E. F. "An Evaulation of a Technique for Scaling High School
Grades to Improve Predictions of College Grades." Educational
and Psychologi cal Measurement , 1963, p. 23.
MacMillan, T. F. "NORCAL: The Key is Cooperation." Junior College
Journal , 1970.
MacMillan, T. F., and Kester, D. "Promises to Keep: NORCAL Impact
on Student Attrition." Community and Junior College Journal,
Feb. 1973, p. 5.

127
Middle States Accrediting Association. Evaluating Team Report forEmpire State College, Nov. 197A.
National Center for Education, Sixth Annual Report' Washington. 1976.p. 91.
Nelson, A. G. "College Characteristics Associated with FreshmanAttrition." The Personnel and Guidance Journal, 1966.
New York Times, City Schools Retrenching. January 3, 1977, p. 1.
New York Times, Times Interviews Kibbee . July 25, 1976, pp. 15-16.
O'Brien, G. "Colleges Optimistic." Chronicle of Higher Education ,
Feb. 17, 1976, p. 1.
Pace, C. Preliminary Technical Manual; College and University Scales .
Princeton, N.J: Educational Testing Service, 1963.
Pace, C. College and University Environment Scales (Second Edition):
Technical Manual. Princeton, N.J; Educational Testing Service,
1969.
Pace, C. and Stern, G. "An approach to the measurement of Psychological
Characteristics of College Environments." Journal of Educational
Psychology, 1958.
Partridge, M. An Analysis of Selected Educational Philosophies as
Pertinent to the Dropout Problem . (Dissertation) University of
Cincinnati, 1964.
Pervin, A. "The College as a Social System; A Fresh Look at Three
Critical Problems in Higher Education." Journal of Higher Education ,
1967.
Problems and Issues in Contemporary Education. Harvard Educational
Review , Glenview, 111; Scott, Foresman and Co., 1968. .
Pumroy, D. K. "Cigarette Smoking and Academic Achievement." The
Journal of General Psychology , 1967, 77, pp. 31-34.
Robinson, L. F. "Relation of Student Persistence to Satisfaction with
'Environmental' Factors." Journal of Educational Research ,
Sept. 1969.
Robinson, L. L. Classifying Dropouts Using the College Au^biographicaJ^
Scale . (Dissertation) University of Missouri, 1973.
Rossier, B. Student Perceptions of Institutional Environment and_^
Counseling Services at Selected Community Colleges. (Dissertation)
University of Southern California, 1971.

128
Saplin, S. "CUNY Imposes Tuition: Reopens with State Aid."Chronicle of Higher Education , June 21, 1976, p. 3.
Saplin, S. "The Board of Education and SUNY at an‘“Impasse.
"
Chronicle of Higher Education , Dec. 15, 1975, p. 3.
Schreiber, D. Profile of a Dropout . New York: Random House, 1967.
Snyder, B. " ’Creative' Students in Science and Engineering."Universities Quarterly, March 1967.
Spady, W. G. "Dropouts from Higher Education: An Interdisciplinary
Review and Synthesis." The Interchange ,April 1970, p. 64.
Spekke, A. "Is Going to College Worth the Investment?" The Futurist ,
Feb. 1975.
Stern, G. Scoring Instructions and College Norms: Activities
Index, College Characteristic Index. Syracuse, N.Y: Psychological
Research Center, Syracuse University, 1963.
Stern, G. People in Context: Measuring Person-Environment Congruence
in Educa'tion and Industry" New York: Wiley, 1970.
Stem, G. "Environments for Learning." In N. Sanford (Ed.). The
American College : A Psychological and Social Interpretation of
the Higher Learning-.- New York: Wiley, 1962.
Stem, G. '"The Measurement of Psychological Characteristics of Students
and Learning Environments." In S. Messick & J. Ross (Eds.), Measurement
in Personality and Cognition . New York: Wiley, 1962.
Summerskill, J. "Dropouts from College." The American Colleg^e^
New York: Wiley, 1962.
Turner, J. "The Half that Leaves: A Limited Survey of Attrition in
Co^unity Colleges." Florida Inter-Institutional Report, Gainesville,
Florida, 1970.
Venn, G. Man. Education and Work . Washington: American Council on
Education, 1964.
Werts E "The Study of College Environments Using Path Analysis."
NMSC Research Reports, Vol. 3, No. 4, Evanston, 111. Nations
Merit Scholarship Corporation, 1967.
Witkowski, E. "The Economy
Declining Enrollments."
No. 1, Feb. 1976, p. 4-8
and the University: Economic Aspects of
The Journal of Higher Education, Vol. XV