
A Study of Attrition in Higher Education with Implications ...
57
Marshall University Marshall Digital Scholar eses, Dissertations and Capstones 1-1-2004 A Study of Arition in Higher Education with Implications for Supportive Services Sabrina D. Simpson [email protected] Follow this and additional works at: hp://mds.marshall.edu/etd Part of the Higher Education Administration Commons is esis is brought to you for free and open access by Marshall Digital Scholar. It has been accepted for inclusion in eses, Dissertations and Capstones by an authorized administrator of Marshall Digital Scholar. For more information, please contact [email protected]. Recommended Citation Simpson, Sabrina D., "A Study of Arition in Higher Education with Implications for Supportive Services" (2004). eses, Dissertations and Capstones. Paper 171.
Transcript of A Study of Attrition in Higher Education with Implications ...
Marshall UniversityMarshall Digital Scholar
Theses, Dissertations and Capstones
1-1-2004
A Study of Attrition in Higher Education withImplications for Supportive ServicesSabrina D. [email protected]
Follow this and additional works at: http://mds.marshall.edu/etdPart of the Higher Education Administration Commons
This Thesis is brought to you for free and open access by Marshall Digital Scholar. It has been accepted for inclusion in Theses, Dissertations andCapstones by an authorized administrator of Marshall Digital Scholar. For more information, please contact [email protected].
Recommended CitationSimpson, Sabrina D., "A Study of Attrition in Higher Education with Implications for Supportive Services" (2004). Theses, Dissertationsand Capstones. Paper 171.

A STUDY OF ATTRITION IN HIGHER EDUCATION WITH IMPLICATIONS FOR SUPPORTIVE SERVICES
Thesis submitted to The Marshall University Graduate College
In partial fulfillment of the Requirements for the degree of
Education Specialist in the Department of Adult and Technical Education
By
Sabrina D. Simpson
Dr. Laura Wyant, Committee Chairperson Dr. Howard Gordon Dr. LeVene Olson
Marshall University
March, 2004
TABLE OF CONTENTS
LIST OF TABLES……………………………………………………………………… ii LIST OF FIGURES…………………………………………………………………….. iii ABSTRACT…………………………………………………………………….…….… iv CHAPTER I…………………………………………………………………….…….… 1
INTRODUCTION………………………………………………………..….…. 1 Research Questions..………………………………………………….… 3 Statement of the Problem…………………………………………….…. 3 Purpose……………….……………………………………………….… 6 Significance of the Study…………………………………………….…. 6 Limitations of the Study………………………………………………... 7 Definition of Terms……………………………………………………... 8
CHAPTER II………………………………………………………………………….… 9 REVIEW OF RELATED LITERATURE……………………………………… 9 CHAPTER III…………………………………………………………………………... 20 METHODODOLGY……………………………………………………………. 20 Population and Sample…………………………………………………. 20 Development of Instrument…………………………………………….. 20 Design……………………………………………………………….….. 23 Data Collection……………………………………………………….… 24 CHAPTER IV……………………………………………………………………….…. 26 RESULTS AND DISCUSSION…………………………………………….…. 26 CHAPTER V……………………………………………………………………….….. 36 SUMMARY, CONCLUSIONS AND RECOMMENDATIONS………….…... 36 Summary…………………………………………………………….…. 36 Conclusions………………………………………………………….…. 38 Recommendations……………………………………………………… 40 REFERENCES………………………………………………………………………… 41 APPENDIX A……………………………………………………………………….…. 48 APPENDIX B……………………………………………………………………….…. 49
i
List of Tables
Table Page
4.1 Gender of the respondents completing the survey………………………………… 26
4.2 Age of respondents completing the questionnaire………………………………… 27
4.3 Residency classification of respondents…………………………………………... 27
4.4 Percentage of students who participate in extra-curricular activities……………… 30
4.5 Percentage of students using tutoring services based on each course…………….. 31
4.6 Percentage of students who transferred to other institutions……………………… 33
4.7 Other factors that affected student’s decisions to not re-enroll…………………… 34
4.8 Percentage of students indicating whether their experience was enjoyable or not.. 35
ii
List of Figures
Figure Page
4.1 Students who did not participate in tutoring services and students who felt like they needed remedial work…………………………………. 32
4.2 Miles from home, had their own means of transportation, and
percentage of students who lived on campus…………………………….. 35
iii

Abstract
“A STUDY OF ATTRITION IN HIGHER EDUCATION WITH IMPLICATIONS FOR SUPPORTIVE SERVICES”
By Sabrina Simpson
The purpose of this study was to examine the reasons why students do not return to Marshall
University for a second semester. The intention was to ascertain the reasons why they choose
not to re-enroll at Marshall and to assess their level of satisfaction while they were enrolled.
Findings will indicate reasons why students consider other options for their second semester and
will show the basis as to why they chose not to re-enroll for a second consecutive semester.
Even though the enrollment at Marshall may be increasing, the ability to retain students is
becoming more complex. The data obtained through this study did reveal a need for additional
supportive services, and offers a better understanding of factors that contribute to students
deciding not to re-enroll at Marshall University.
iv

Chapter I
Introduction
Student attrition has been the focus of investigation for many years. Some have argued
that student completion rates are a fundamental measurement of student success. Student
attrition is one of the greatest areas of interest in higher education and has been a popular topic
for quite some time. Every year, institutions investigate retention through various forms of
assessment. Full- time enrollments are critical to an institution’s continued survival, and high
levels of attrition adversely affect an institution’s funding, facilities, and long term planning.
Declining enrollments could leave large numbers of part-time or academically under-prepared
students to increase the average cost per student. When an institution recruits new populations of
students, or increases the number of entering students, the college or university gains added
revenue.
There are several critical periods in a student’s career when interactions between the
institution and the individual most directly affect dropout. The first occurs during the application
process, when the individual first makes contact with the institution. It is during the process of
seeking out and applying for admission to a particular institution that first impressions are
formed about the social and intellectual character of the institution. Such impressions, which
arise in large measure from the printed materials the institution distributes to prospective
students, are instructional to life, and these expectations influence the quality of early
interactions within the institution (Frame, 2002).
A second critical time in the student’s career is the period of transition between high
school and college, which immediately follows entry to the institution. The first semester,
especially the first six weeks, can be most difficult. For many students, the speed and scale of
1
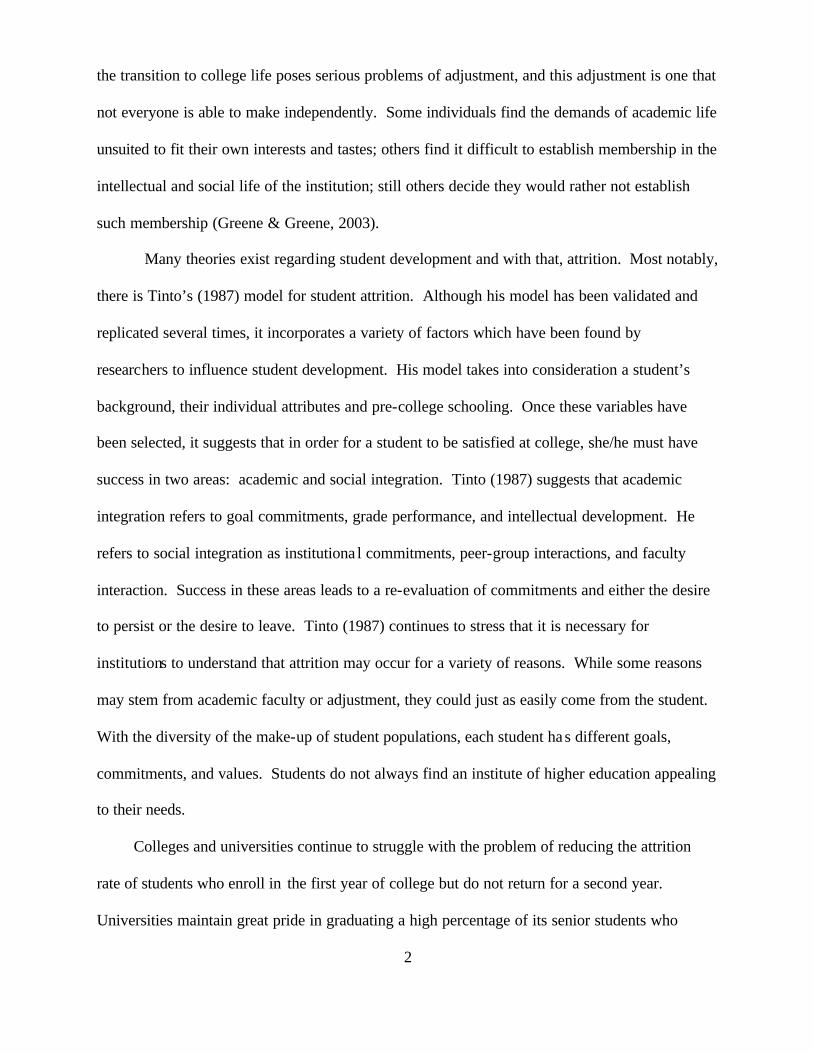
the transition to college life poses serious problems of adjustment, and this adjustment is one that
not everyone is able to make independently. Some individuals find the demands of academic life
unsuited to fit their own interests and tastes; others find it difficult to establish membership in the
intellectual and social life of the institution; still others decide they would rather not establish
such membership (Greene & Greene, 2003).
Many theories exist regarding student development and with that, attrition. Most notably,
there is Tinto’s (1987) model for student attrition. Although his model has been validated and
replicated several times, it incorporates a variety of factors which have been found by
researchers to influence student development. His model takes into consideration a student’s
background, their individual attributes and pre-college schooling. Once these variables have
been selected, it suggests that in order for a student to be satisfied at college, she/he must have
success in two areas: academic and social integration. Tinto (1987) suggests that academic
integration refers to goal commitments, grade performance, and intellectual development. He
refers to social integration as institutiona l commitments, peer-group interactions, and faculty
interaction. Success in these areas leads to a re-evaluation of commitments and either the desire
to persist or the desire to leave. Tinto (1987) continues to stress that it is necessary for
institutions to understand that attrition may occur for a variety of reasons. While some reasons
may stem from academic faculty or adjustment, they could just as easily come from the student.
With the diversity of the make-up of student populations, each student has different goals,
commitments, and values. Students do not always find an institute of higher education appealing
to their needs.
Colleges and universities continue to struggle with the problem of reducing the attrition
rate of students who enroll in the first year of college but do not return for a second year.
Universities maintain great pride in graduating a high percentage of its senior students who
2
entered bachelor degree programs. Not only is recruitment extremely important, but also the
retention of students to graduation is a mark of a quality education.
The study of dropout from higher education is extremely complex, for it involves not only
a variety of perspectives but also a range of differing types of dropout behavior. No one
definition of attrition is likely to capture entirely the complexity of its appearance in higher
education. Researchers and institutional officials have to choose with some care the definitions
that best suit their interest and goals. In doing so, they should recall the most important goal for
which higher education exists – primarily educating students.
Based on this research, this chapter discusses the significance and impact of attrition on
individuals, schools, and society. This chapter concludes with an explanation of the significance
of the study, definitions and limitations of the study.
Research Questions
1. What factors influence a student’s decision to not re-enroll at Marshall University? 2. What percentages of first time freshman students seek academic support?
3. What percentage of students who leave Marshall University transfer to other institutions of
higher education?
Statement of the Problem Academic institutions are concerned about the withdrawal of students and would like to
reduce the percentage of students who withdraw from their institution. In an attempt to gain a
greater understanding of why attrition rates exist at Marshall University, students enrolled in the
Fall 2002 semester but did not re-enroll for the Spring 2003 semester were surveyed.
3

Identifying those factors that might influence the withdrawal rate of students in higher
education has become of interest to institutions nationwide. It is anticipated that with the
knowledge or awareness of possible factors cont ributing to the drop out rate, an institution will
be able to initiate the action necessary to reduce the chance of withdrawal for a particular
student.
According to Tinto (1987), more than 40% of all college entrants leave higher education
without earning a degree, and 75% of these students drop out in the first 2 years of college.
Tinto (1987) also suggested that an institution could expect that 56% of a typical entering class
cohort will not graduate from that college. Chickering (1969) indicated that the transition to
college is challenging, complex, and requires a certain level of emotional, social, and academic
adjustment. Attrition rates as high as 20% are common during the freshman year alone
(Mallinckrodt & Sedlacek, 1987). Fortunately, some students find ways to make this transition
constructively and adapt to college, whereas others feel overwhelmed and unable to effectively
meet the demands of their new roles.
Colleges and universities with open admissions or minimal admission criteria experience
attrition rates from freshman fall semester to sophomore fall registration of 40% to 60% (White
& Bigham, 1982; White, Nylin, & Esser, 1985). Students enter colleges and universities with a
variety of background traits that contribute to initial commitment levels toward persistence and
matriculation.
Research indicates that attrition rates are higher for first-year students (Bank, Biddie, &
Slavings, 1990; Dodge, 1991; Fidler, 1991; Tinto, 1993). Research also indicates that more
students leave their college or university prior to degree completion than stay (Tinto, 1993).
Attrition from colleges and university adversely effect individuals, institutions, and society.
Vincent Tinto (1993) believes that institutional departure stems from a longitudinal process of
4

interaction between the individual and members of the academic and social systems of the
institution. These interactions promote either a commitment to complete a college degree or a
decision to depart from the institution prior to completing a degree.
It is also necessary to recognize that the drive, motivation, and skill of the individual are
important parts of the attainment process (Pascarella, 1991). It takes effort to complete a college
degree. It is regrettable and an unavoidable fact of higher education that a number of students do
not care enough or have the character to do what is required to complete their desired course of
study. Some individuals are not sufficiently committed either to completing college or to putting
forth the effort to attain that goal. For them, dropping out is more a result of not caring than it is
of not being able to meet the demands of college work (Hackman & Dysinger, 1970).
Even with sufficient commitment, meeting academic standards and attaining higher
educational goals require a range of adult intellectual and social skills that are of a higher level
and more complex than those needed to complete high school. It is becoming more evident that
not all individuals who gain entry to institutions of higher education possess those skills.
Making the transition to college occurs not only for the typical student who moves from a
small high school to a larger college, where she or he may reside away from home, but also for
the students to whom the college experience may be an entirely foreign concept. The preparation
for college should begin in the high school and realistic goals, achievements, and concepts
should be discussed. A college prep class should be implemented at the high school level to help
students gain a better understanding of college life.
Each withdrawal from an institution of higher education creates a vacancy in the student
body that might have been filled by someone who would have stayed. The departure of
individuals can cause serious financial strains upon the institution by undermining its continuing
source of revenue. The financial impact on the institution could also be quite large and a major
5
concern. Part of the administrative and/or overhead cost of registration and subsequent
withdrawal must be borne by the institution if the student withdraws prior to a specific date.
Institutions of higher education should strive to provide the best possible service available
in order to retain students. Services could be improved as specific problems are identified and
solved. By doing so faculty, professors, administration, students, and the institution would all
benefit. Retention is a campus wide effort.
In an attempt to reduce the student withdrawal rate in the future, this study surveyed
students who were enrolled in the Fall 2002 term, but did not return for the Spring 2003 semester
for the purpose of identifying specific factors, which might be used to predict potential reasons
for withdrawal.
Purpose
The purpose of this study was to examine the reasons why students who enrolled full-
time in the Fall 2002 semester at Marshall University did not return for the Spring 2003
semester. The outcome will allow Marshall University to understand why students did not return
in 2003, as well as provide the documentation necessary to encourage the implementation of
increased supportive services in order to retain currently enrolled students.
Significance of the Study
The significance of this study is to identify those factors that relate to the attrition rate of
students in higher education, or why they are dropping out. With the knowledge or awareness of
possible factors contributing to the withdrawal rate, an institution will be able to initiate the steps
necessary to reduce withdrawal rates.
6

The simple act of leaving an institution of higher education may have multiple and
disparate meanings to those who are involved in or are affected by that behavior. As with any
institution, there will always be some individuals whose educational goals are either more
limited or more extensive than when they first enrolled in a college or university. This assumes
that individuals enter college with clearly defined goals, when in fact that is not the case. A large
number of students enter college without really knowing why they are there, and they may not
have ever given serious thought to the institution they chose.
According to Pascarella (1991), the problem of defining individual perspectives as to why
they leave college is more complex than simply noting the goals and/or intensions, with which
the person entered the higher education system. Pascarella (1991) also believes that the reasons
students drop out of higher education institutions is dependent not only on individual intentions,
but also includes social and intellectual processes by which the student comes to realize their
desired goals within particular higher educational settings. Although a number of factors affect
these processes, it is true that individuals are still largely responsible for attaining desired goals
within the institution.
Limitations of the Study
The generalizations made from this research were subject to the following limitations: 1. The population sample was based on one institution, Marshall University.
2. The target population chosen was only undergraduate students.
3. Incoming freshman chosen were only chosen from the entering class for the Fall 2002 semester.
4. Only full-time students were chosen for the study.
7
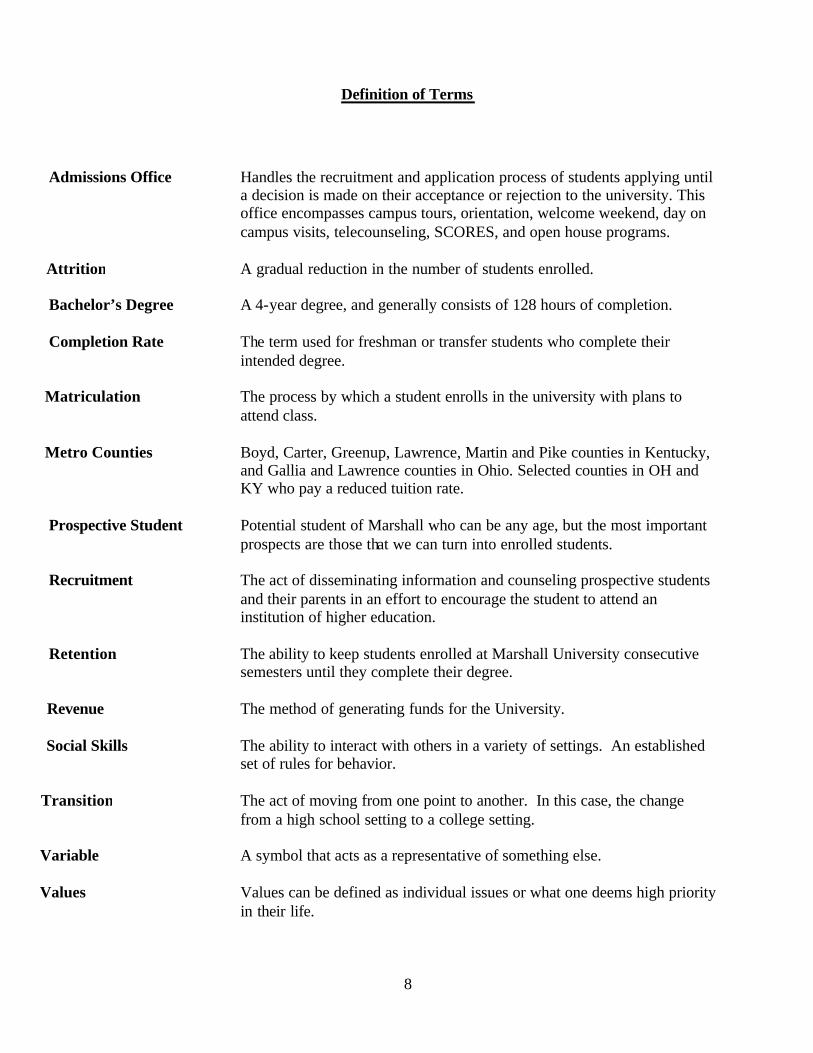
Definition of Terms
Admissions Office Handles the recruitment and application process of students applying until a decision is made on their acceptance or rejection to the university. This office encompasses campus tours, orientation, welcome weekend, day on campus visits, telecounseling, SCORES, and open house programs.
Attrition Attrition A gradual reduction in the number of students enrolled.
Bachelor’s Degree A 4-year degree, and generally consists of 128 hours of completion.
Completion Rate The term used for freshman or transfer students who complete their intended degree.
Matriculation The process by which a student enrolls in the university with plans to attend class.
Metro Counties Boyd, Carter, Greenup, Lawrence, Martin and Pike counties in Kentucky, and Gallia and Lawrence counties in Ohio. Selected counties in OH and KY who pay a reduced tuition rate.
Prospective Student Potential student of Marshall who can be any age, but the most important prospects are those that we can turn into enrolled students.
Recruitment The act of disseminating information and counseling prospective students
and their parents in an effort to encourage the student to attend an institution of higher education.
Retention The ability to keep students enrolled at Marshall University consecutive
semesters until they complete their degree.
Revenue The method of generating funds for the University.
Social Skills Social Skills The ability to interact with others in a variety of settings. An established set of rules for behavior.
Transition The act of moving from one point to another. In this case, the change from a high school setting to a college setting.
Variable Variable A symbol that acts as a representative of something else.
Values Values can be defined as individual issues or what one deems high priority in their life.
8
Chapter II
Review of Related Literature
The study of student attrition has become a national phenomenon and the most discussed
topic for institutions of higher education nation wide. There have been thousands of studies of
student attrition conducted throughout the years at colleges and universities. Understanding
student attrition can certainly help institutions of higher education ascertain ways to improve the
situation, and predict those students who are considered high risk. Studies have looked at
reasons students leave school such as: which students are likely to leave, do our programs have
an effect on attrition, and what characteristics do students who stay have versus those students
who leave.
The study of student attrition is not a new phenomenon, and research has offered a variety
of ways to measure student attrition, but generally the outcomes have all proven to be
significantly the same. The reasons students withdrawal, drop out, or stop going to school have
been similar for many years. There seems to be a variety of reasons as to why students stop
going to school, and this chapter will discuss many of those reasons
White and Mosely (1995) reported that pragmatically, higher student retention is a mark of
a quality institution. Student attrition has been found to be a multidimensional phenomenon
based on student’s demographic variables, educational background, financial status, marital and
family status (Garland, 1993). According to Tinto’s (1975) model of student attrition, the greater
the degree of integration into the college, the greater will be the student’s commitment to the
specific institution and to the goal to completing higher education. Similar findings were made
by Bean (1980), who discovered that commitment to the institution was primarily a significant
variable directly related to retention. Bean (1980) also believed that the perceived quality of
education is one of the most important variables connecting institutional commitment.
9

Motivation to learn, taking action to meet academic demands, a clear sense of purpose, and
general satisfaction with the academic environment are also important components of academic
adjustment (Baker & Siryk, 1984a, 1984b, 1989).
A growing body of literature suggests that a second dimension, social adjustment of
students, may be as important as academic factors in predicting persistence (Mallinckrodt, 1998;
Pantages & Creedon, 1978). Writers have emphasized integration into the social environment as
a crucial element in commitment to a particular academic institution (Spady, 1970; Tinto, 1975).
Some of the most commonly reported crises in the freshman year involve difficulties in social
adjustment manifested as feelings of homesickness and loneliness (Houston, 1971; Lokitz &
Sprandel, 1976; Rich & Scovel, 1987). Quality of informal contact with faculty has also been
considered to be a compounding factor in maintaining enrollment (Pascarella, 1980).
According to Chickering (1969), during the transition to college, students commonly
question their relationships, direction in life, and self worth. Tremendous inner turmoil may
result from questions about identity and can sometimes lead to personal crisis (Henton, Lamke,
Murphy & Haynes, 1980). A third factor to consider regarding retention is personal and
emotional distress. Anxiety has long been blamed for students dropping out of college (Pappas
& Loring, 1985).
Making the decision of where to spend the next four years of your life is a huge decision
for students, and the factors that influence this decision are very complex. The first year of
college is the most critical year, and it is a year filled with anxiety and apprehension as students
begin a new chapter in their lives. Complex issues such as fear, anxiety, and uneasiness can
sometimes follow students to college, and they highly contribute to the daily attitudes of
students. These extra constituting factors also require support in order for students to cope with
10

this new challenge. Levitz & Hovland (1998) believe that getting students started on the right
path through the institution to graduation begins with anticipating and meeting the needs of new
students.
Research consistently indicates that students who drop out of college do so by the time
they finish their first year (Noel, Levitz, & Saluri, 1985). There are several reasons why
freshman students do not return to college for their second semester or their sophomore year
(Terenzini, et al. 1996). Some of the reasons Terenzini (1996) indicated were changing career
and academic goals, poor institutional fit, personal circumstances, because they are unhappy with
the education they are receiving, and they may lack the motivation to do well in school.
Tinto (1987) suggests that the likelihood of students dropping out of college is determined
by how strongly that student develops an attachment to the school as an academic and social
entity. This social and academic attachment is determined by the amount of interaction a student
has with the school community (Tinto, 1987). Without an attachment to the school community,
students can begin to feel isolated. In interviews with school dropouts, the most frequently cited
school-related reasons for leaving school were boredom and not being able to communicate with
professors (Tidwell, 1988).
The transition from high school to college requires students to encounter academic
adjustment difficulties, because students are encountering larger and more complex
environments. The academic demands of students in college are far greater than the challenges
they face in high school. This new way of life requires students to mature as well as sever ties
they may have with younger students still in high school. While trying to adapt to their new
surroundings, students must keep in mind that other freshmen are going through the same
emotions and feelings. While students are seniors in high school, they sometimes consider
themselves on top, but once they begin college they are just a small fish in a big pond. Roderick
11
(1993) believes that the demands increase which requires students to change the way they are
used to producing material and the way they are used to learning. Institutions of higher
education are not unlike other human communities. The process of educational departure is not
substantially different from the other processes of leaving which occur among human
communities. In both instances, departure mirrors the absence of social and intellectual
integration into the mainstream of community life and the social support such integration
provides (Tinto, 1987).
A relatively new development in higher education is the rise of support programs. These
centers have shown results in keeping poorly prepared students in college, not only because they
assist with academic skills but also because they provide emotional support (Kemerer, Baldridge,
& Green, 1982; Astin, 1984a). Astin (1984a) suggests that students are less confident of
themselves today, and they can benefit from these support programs. College administrators are
learning that they must meet the needs of students in order to retain them in institutions of higher
education. To do this, they must help students recognize the ways in which their investment is
paying off, by indicating the benefits gained from a given course, contacts made during their
college experience, supportive services, and activities that prepare them for the “real” world
(Upcraft & Gardner, 1989).
Just about every college or university in the United States provides some supportive
service for students who are not ready to take certain courses. These services vary according to
the institution, and they range from formal education to informal. Maxwell (1997) believes that
supportive services have existed in one form or another since the earliest days of higher
education in the United States. The trend has appeared to change over the years, and a
restructuring of these courses has gradually taken place. The two most common organizational
structures are the learning assistance center and the developmental education program (Casazza
12
& Silverman, 1996). Learning centers typically provide some combination of individualized
instruction, tutoring, and workshops, while developmental education programs provide courses
and learning laboratories (Casazza & Silverman, 1996).
Several suggestions have been offered over the years as to how to address the issue of
student attrition. Ramist (1981) encouraged increased retention by enhancing re-enrollment, the
admissions process, orientation programs, improving financial aid availability, advising,
counseling, and career development. Looking at this process makes it very clear that retention is
then a campus wide problem. In order to increase the retention rate and to understand the
importance of lowering the attrition rate, faculty and staff campus wide must be empowered to
join with the Admissions Office in accepting new students. Green & Green (2003) suggests that
campuses provide the tools necessary that will enable students to choose their future home
without having to bend to the external forces of peer pressure, parental biases, and the superficial
rankings that go along with the hierarchy of what really matters in choosing a college.
There is no doubt that many external as well as internal factors play a major part in a
students decision to drop out of school or stay in school. Faculty plays a crucial role in
promoting growth among students. We are moving into the age where electronics are playing a
bigger role in our daily lives, and multimedia technology provides effective attention gathering
tools (Brace & Roberts, 1997). The statement that a picture is worth a thousand words can never
be overstated. In some instances, multimedia tools can remove barriers, such as language and
physical handicaps (Moore & Miller, 1996). Continuous interactions between students and their
academic advisors are also important, and e-mail is one good way for students and advisors to
communicate. Litten and Hall (1989) suggest that both prospective students and their parents
regard faculty as a credible source of information.
13

Even though it has been suggested that retention is a campus wide problem, the role of the
student cannot be overemphasized. Students also play a critical role in getting good grades,
getting involved in student organizations, and remaining in school. They must explore their
options and take advantage of what their individual colleges offer. Studies have indicated that
motivation is a prerequisite for student learning (Svinicki, Hagen, & Meyer, 1996) and that a
sense of belonging can ease the process of adapting to the institution.
When colleges and universities research retention there is one thing they must keep in mind
that students entering college today are much different than before. Today, students are coming
from broken homes, one-parent homes, and maybe even from one-sibling homes. These students
bring with them their own set of values and beliefs, and that sometimes can have a huge bearing
on their ability or willingness to stay in school. Students today have more material things than
students in the past, and they are not used to sharing their space with others. When these
students are required to live on college campuses, this becomes a huge barrier for them. Now
they are not only forced to share their room with someone else, but they must share facilities
with several other students. Gaither (1999) suggests that students today lack the level of
independence, skill, and savvy of students in years past. He (Gaither, 1999) believes that the
primary goal of institutions should be to move students from low or no levels of commitment to
the point where they become independent learners.
Gaither (1999) suggests a task force be organized to broaden the retention issues in order to
implement a step to jump-start and improve retention efforts. He suggested that institutions use
the Retention Management System (RMS) to identify the extent to which their incoming
freshmen are prone to drop out. The RMS uses scales to identify degrees of dropout rates, and
this will allow schools to immediately reach out to those students who are prone to dropout.
14

A whole host of factors will determine whether a particular student will graduate. Some of these
conditions are directly attributed to the institution or college, but most are associated more with
the individual student. Gaither (1999) indicate that if student were uniformly distributed across
all campuses, it would then be much more reasonable to expect all colleges to have or at least
similar graduation rates. This idea is of course is fallacious, because the variables and
characteristics among students and campuses are very different.
Numerous studies have found that basic student characteristics such as gender, age, race,
and family income are significantly correlated with both college graduation in general and length
of time to degree (Pascarella & Terenzini, 1991). Students take a variety of paths into the
collegiate system. Whatever time of entry, it is apparent that there are students who enter higher
education without ever planning to complete their degrees (Tinto, 1987). Rossman and Kirk
(1970) also believe that there are individuals who enter college seeking to gain additional skills,
learn a specific content area, and/or acquire an additional number of course credits. It is no
secret that some students enter one college with the intent to transfer to another. Tinto (1987)
believes that not all students enter college with a clear understanding of their long-term
educational goals, and even among those who have a moderately defined set of goals will change
their goals during the course of their college career. Tinto (1987) suggests that departure from
school is individual, but that there are a multitude of factors that influence that decision.
Being successful in college is vastly different than high school, and it is not uncommon for
bright students to struggle in the beginning of their college career. Some students struggle with
this adjustment, while others are able to adjust and adapt quicker to their new surroundings.
There are increasing arrays of students from a diversity of backgrounds who enter higher
education unprepared to meet the academic demands of college life (Moore & Carpenter 1985;
Cross 1971, 1981).
15
According to Hurte (2002), mentoring is one of the best methods of retention that is
seemingly overlooked. Mentors provide just what these students need to be successful in a
college and university settings, support, understanding, positive role modeling, and instruction
for people in different stations of life (Hurte, 2002). Mentoring has generally been a tool used
only for honor students, and not something that every student has had the opportunity to
experience. Frame (2002) believes that higher education institutions should adopt a strength-
based emphasis. Frame (2002) calls for the strength-based approach to be emphasized during the
sophomore year on career planning based on strengths, and this will allow students to develop a
clear understanding of their strengths and career direction. Most of the research has been
conducted regarding freshman students in their first year of college, and little has been done to
retain students in their sophomore year.
It should be noted that no one study, especially one institutional study, could include all of
the variables that affect the dropout rate. Each researcher will have to carefully select those
variables based on her/his knowledge, situation, and their definition of attrition. Colleges may
want to conduct more of their own research so that institutional data could provide administrators
a better understanding of the problems within their individual institutions, and this will allow for
a more comprehensive plan to address attrition and intervention.
As a society in general, we place high attrition rates as means of a quality education.
Improving retention means change, something that never comes easy. It is likely that the
spectrum of developmental or supportive programs will continue to increase in institutions of
higher education, and hopefully they will eventually lead to solutions to the problem of attrition
among students in postsecondary education (Upcraft & Gardner, 1989).
It is clear from this research that attrition has become the household word for institutions of
higher education. With each passing year, new students with different needs are enrolling in
16
college. Without the continued study of attrition, institutions of higher education will lose more
and more students. The long-term affects this will have on institutions of higher education will
be a direct financial loss, and with the financial condition of every state supported institution it is
clear that this will become a serious matter.
There are a variety of complex sources that affect student retention rates, some of which
are controllable by institutions of higher education, others that are not. Retention is a matter for
everyone from teachers/counselors in the high school preparing students for college, to Board of
Directions for Institutions of Higher Education creating a seamless transition (Terenzini, 1996).
It has already been established that the first year for freshman is the most critical (Noel,
Levitz, and Saluri, 1985), and that is when support is most crucial. Data collection is a key to
identification of “at risk” students, which of course will vary from institutions. According to
Seidman (1999), it is important to collect family information from students, because this
information could aid in a better understanding of individual students. Seidman (1999) believes
that we could make a difference in helping students attain their academic goals and institutions
increase their retention rate.
Crockett (1978) believed that academic advising was the cornerstone of student retention.
Wycoff (1999) stated that in order to establish a high degree of commitment to the academic
advising process, university and college administrators must become cognizant not only of the
educational values of advisors but of the role advising plays in the retention of students.
According to Astin (1975), changes that help students’ complete a college degree represent a
positive service to them. Institutional improvement should be a continuous process that will
show a positive influence on the retention process.
Tinto (1987) believes that what goes on after the entry matters more. He (Tinto, 1987)
stated that daily interaction with, other members of the college in both the formal and informal
17

academic and social domains of the college, of those interactions that in large measure determine
decisions as to stay or leave. This indicates that student retention is as much the responsibility of
the student as it is for the institution. Ender, Winston, & Miller (1984) conclude that the greatest
difficulty students cite with the quality of their academic experience is advising. Despite the
widespread dissatisfaction with advising, students express a strong desire for advisor contact and
place a high value on academic counseling relative to other student services (Wykoff, 1999).
Research indicates that three of every four students are uncertain or tentative about their
career choice at college entry (Titley & Titley, 1980; Frost, 1991). Over half of all students who
enter college change their mind at least once before they graduate (Foote 1980; Gordon, 1984),
and only one senior out of three will major in the same field they started out as a freshman
(Willingham, 1985). Upcraft, Finney, & Garland (1984) believe that some of the students
confusion about majors and careers, may result from students being pushed into careers by their
families.
Lenning, Beal, & Sauer (1980) also report that students’ goal motivation/commitment
correlates positively with persistence to graduation. Willinghouse (1985) believes that a poor
sense of direction to be one of he most frequently cited reasons identified by students as a factor
that distracted from their experiencing a successful, satisfying college career.
Haring (1997), reported that the number of colleges offering mentoring programs is on the
rise, and Walter & Taub (2001) believed that mentoring is being viewed as a tool for promoting
student retention. Rendon (1994) believed that first generation students, those for whom the
transition to college is not a normal routine or rite of passage, need some type of validation
experience. Research indicates that at least one-half of all students who drop out of college will
do so during their freshman year (Consortium for Student Retention Data Exchange, 1999).
18

Noel (1985) reported that the critical time in establishing one-to-one contacts between students,
teachers, and advisors occur during the first few weeks of the freshman year.
Although research has shown that there are a variety of programs that can be implemented
to assist with the retention rate, every institution must choose the programs that will best benefit
their population of students. This research has tried to suggest a variety of programs that have
been established for several institutions, and hopefully encourage those institutions that are
facing a problem with student attrition. Services must be implemented to serve students not only
by helping them develop confidence in their own strengths and abilities, but also by increasing
their awareness.
19
Chapter III
Methodology
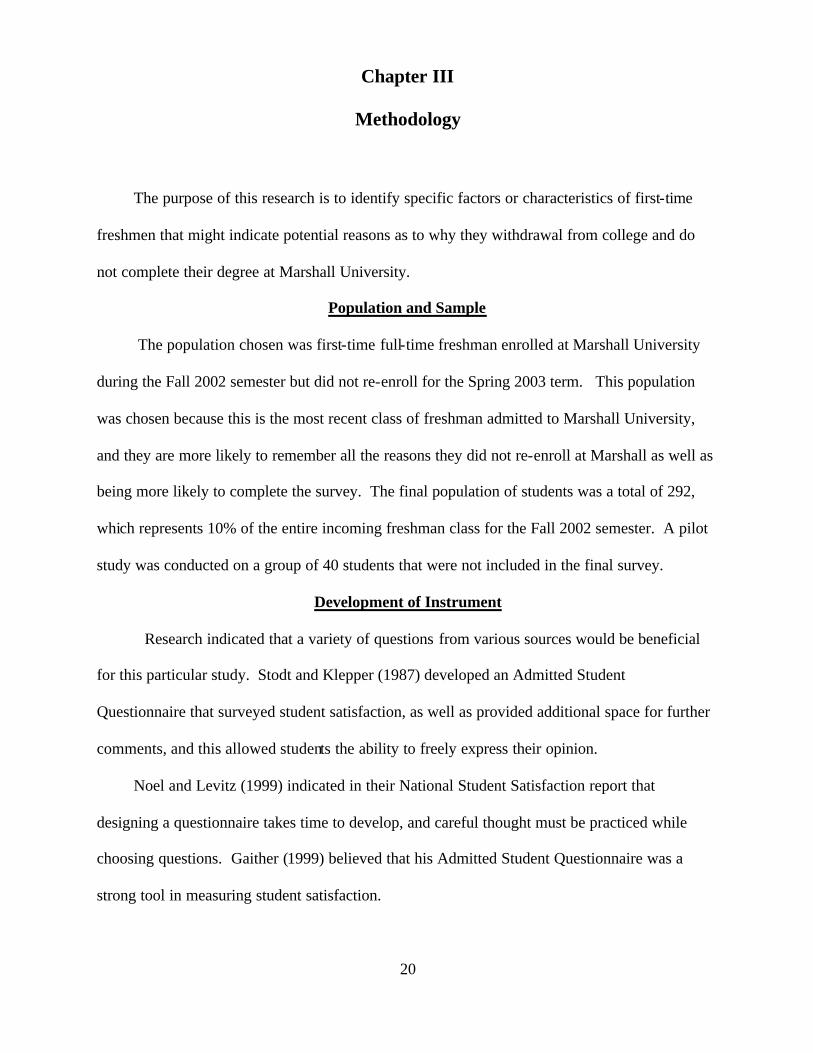
The purpose of this research is to identify specific factors or characteristics of first-time
freshmen that might indicate potential reasons as to why they withdrawal from college and do
not complete their degree at Marshall University.
Population and Sample
The population chosen was first-time full-time freshman enrolled at Marshall University
during the Fall 2002 semester but did not re-enroll for the Spring 2003 term. This population
was chosen because this is the most recent class of freshman admitted to Marshall University,
and they are more likely to remember all the reasons they did not re-enroll at Marshall as well as
being more likely to complete the survey. The final population of students was a total of 292,
which represents 10% of the entire incoming freshman class for the Fall 2002 semester. A pilot
study was conducted on a group of 40 students that were not included in the final survey.
Development of Instrument
Research indicated that a variety of questions from various sources would be beneficial
for this particular study. Stodt and Klepper (1987) developed an Admitted Student
Questionnaire that surveyed student satisfaction, as well as provided additional space for further
comments, and this allowed students the ability to freely express their opinion.
Noel and Levitz (1999) indicated in their National Student Satisfaction report that
designing a questionnaire takes time to develop, and careful thought must be practiced while
choosing questions. Gaither (1999) believed that his Admitted Student Questionnaire was a
strong tool in measuring student satisfaction.
20

The researcher developed a self-administered questionnaire survey for this particular study,
and it was created as a Microsoft Word document. The instrument developed was to establish
students’ perspective toward their enrollment at Marshall University, as well as produce
statistics, by gaining a more adequate understanding of why students do not re-enroll at Marshall
University. Subjects were chosen by selecting the entire population of students who did not re-
enroll at Marshall for the Spring 2003 semester. The survey consisted of approximately 25
questions, and based on the literature these questions were appropriate for attempting to
understand why students withdrawal from college.
The survey consisted of the following categories:
1. Student Demographic Information
2. Academic Success
3. Campus Involvement
4. Participation in tutoring services
5. Factors that influenced students decision to not re-enroll
6. Transfer rates
7. Whether the lived on or off campus
Once the survey was constructed, a panel of experts examined the survey instrument, and it
was then pre-tested in order to test for clarity of the instrument. The individuals chosen were
asked to complete the survey and then return it to the researcher. The surveys were returned with
a few suggestions for changes. A pilot test was administered to test the instructions of the cover
letter. The researcher received 100% of the surveys used in the pilot test.
The final survey was mailed to all students in the population chosen (n=292). A mail
survey was chosen based on the literature review due to the geographic locations of the sample
population, and this will allow the subjects time to think about their responses while providing
22
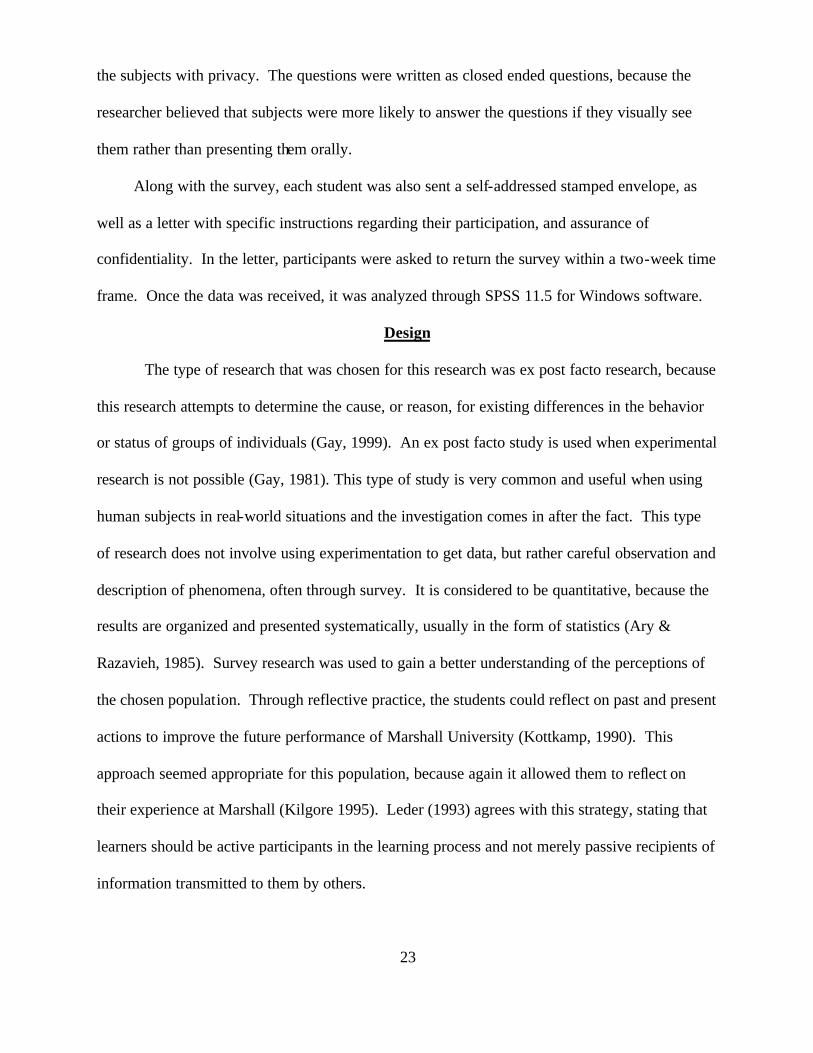
the subjects with privacy. The questions were written as closed ended questions, because the
researcher believed that subjects were more likely to answer the questions if they visually see
them rather than presenting them orally.
Along with the survey, each student was also sent a self-addressed stamped envelope, as
well as a letter with specific instructions regarding their participation, and assurance of
confidentiality. In the letter, participants were asked to return the survey within a two-week time
frame. Once the data was received, it was analyzed through SPSS 11.5 for Windows software.
Design
The type of research that was chosen for this research was ex post facto research, because
this research attempts to determine the cause, or reason, for existing differences in the behavior
or status of groups of individuals (Gay, 1999). An ex post facto study is used when experimental
research is not possible (Gay, 1981). This type of study is very common and useful when using
human subjects in real-world situations and the investigation comes in after the fact. This type
of research does not involve using experimentation to get data, but rather careful observation and
description of phenomena, often through survey. It is considered to be quantitative, because the
results are organized and presented systematically, usually in the form of statistics (Ary &
Razavieh, 1985). Survey research was used to gain a better understanding of the perceptions of
the chosen population. Through reflective practice, the students could reflect on past and present
actions to improve the future performance of Marshall University (Kottkamp, 1990). This
approach seemed appropriate for this population, because again it allowed them to reflect on
their experience at Marshall (Kilgore 1995). Leder (1993) agrees with this strategy, stating that
learners should be active participants in the learning process and not merely passive recipients of
information transmitted to them by others.
23
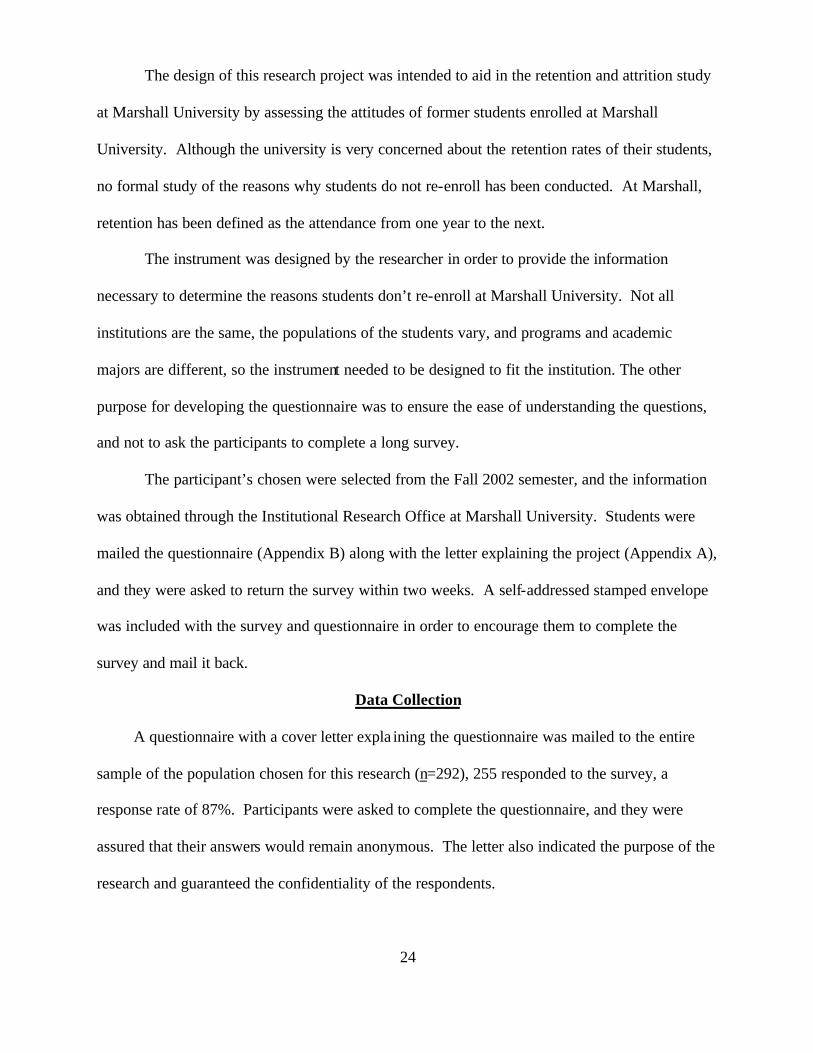
The design of this research project was intended to aid in the retention and attrition study
at Marshall University by assessing the attitudes of former students enrolled at Marshall
University. Although the university is very concerned about the retention rates of their students,
no formal study of the reasons why students do not re-enroll has been conducted. At Marshall,
retention has been defined as the attendance from one year to the next.
The instrument was designed by the researcher in order to provide the information
necessary to determine the reasons students don’t re-enroll at Marshall University. Not all
institutions are the same, the populations of the students vary, and programs and academic
majors are different, so the instrument needed to be designed to fit the institution. The other
purpose for developing the questionnaire was to ensure the ease of understanding the questions,
and not to ask the participants to complete a long survey.
The participant’s chosen were selected from the Fall 2002 semester, and the information
was obtained through the Institutional Research Office at Marshall University. Students were
mailed the questionnaire (Appendix B) along with the letter explaining the project (Appendix A),
and they were asked to return the survey within two weeks. A self-addressed stamped envelope
was included with the survey and questionnaire in order to encourage them to complete the
survey and mail it back.
Data Collection
A questionnaire with a cover letter expla ining the questionnaire was mailed to the entire
sample of the population chosen for this research (n=292), 255 responded to the survey, a
response rate of 87%. Participants were asked to complete the questionnaire, and they were
assured that their answers would remain anonymous. The letter also indicated the purpose of the
research and guaranteed the confidentiality of the respondents.
24

The survey instrument was designed based on the literature review, and an academic panel
of experts reviewed the instrument for structure, clarity, and perception. A pilot study was
conducted to determine the validity of the survey instrument, and those students who participated
in the pilot study were not included in the final outcome of the study.
The majority of the questions on the survey instrument were closed-ended questions.
Survey research was chosen because it involves the collection and quantification of data and
becomes a permanent source of information. This survey provided a descriptive assertion about
this particular population. This cross-sectional survey was used to collect data from a particular
term in order to suggest reasons why freshman students may not return to Marshall.
From the questions asked on the survey instrument, the researcher can identify reasons
students do not re-enroll at Marshall, as well provide a greater understanding of the average age
of students, what factors influenced their decision to leave, what (if any) organizations they were
involved in, if they took advantage of the free tutoring services offered at Marshall, if they lived
on campus while enrolled, if they indicated a desire to return, and if they transferred to another
institution.
As the questionnaires were returned, they were be coded for input into an SPSS
Database. The results were complied, charts created, and a better understanding of why students
do not re-enroll at Marshall was clarified.
25
Chapter IV
Results and Discussion
These chapter discuses the findings of the data that has been analyzed, and the research
questions will be addressed and supported. The final instrument contained 25 questions. The
reliability of the final survey was established by calculating a Cronbach’s Alpha for each factor
in order to measure the internal cons istency of the instrument. The Alpha value indicated a .99
coefficient. According to Oppenheim (1992), the concluding results indicated that the
instrument met reliability standards. Oppenheim (1992) recommends a minimum level of .7
values are dependent on the number of items in the scale, and with the Alpha value indicating
.99, it is clear that the instrument measured a positive consistency.
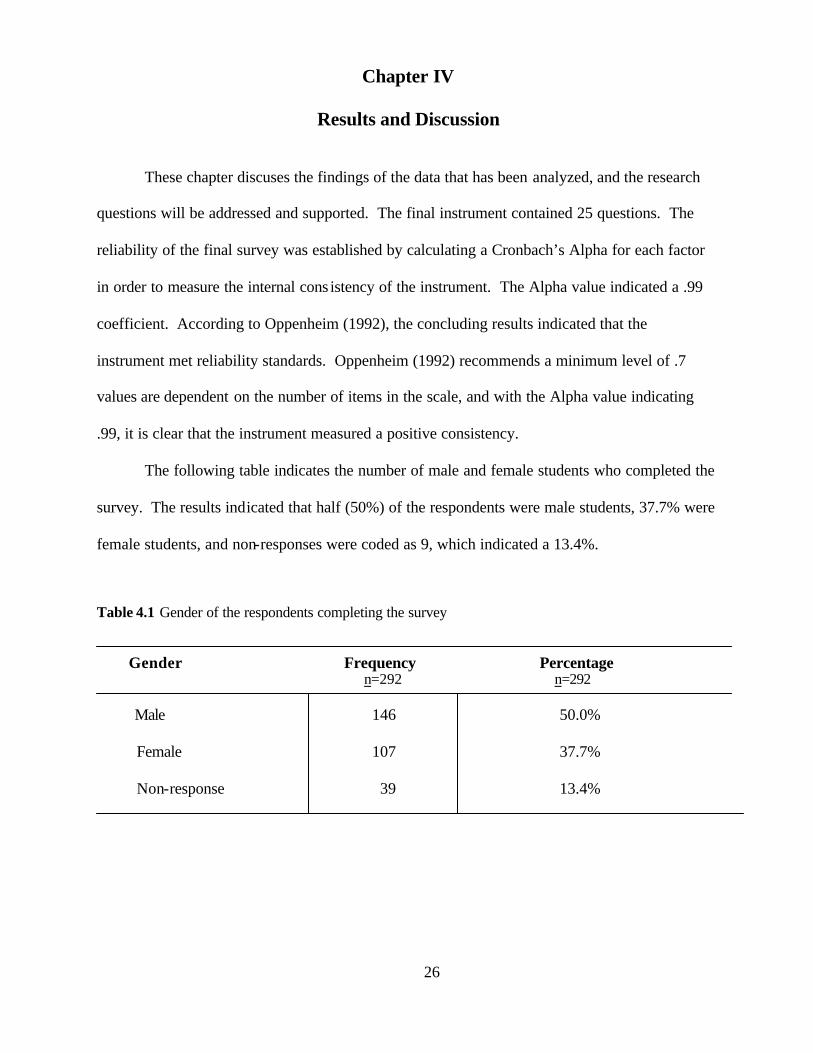
The following table indicates the number of male and female students who completed the
survey. The results indicated that half (50%) of the respondents were male students, 37.7% were
female students, and non-responses were coded as 9, which indicated a 13.4%.
Table 4.1 Gender of the respondents completing the survey
Gender Frequency Percentage n=292 n=292 Male 146 50.0%
Female 107 37.7%
Non-response 39 13.4%
26
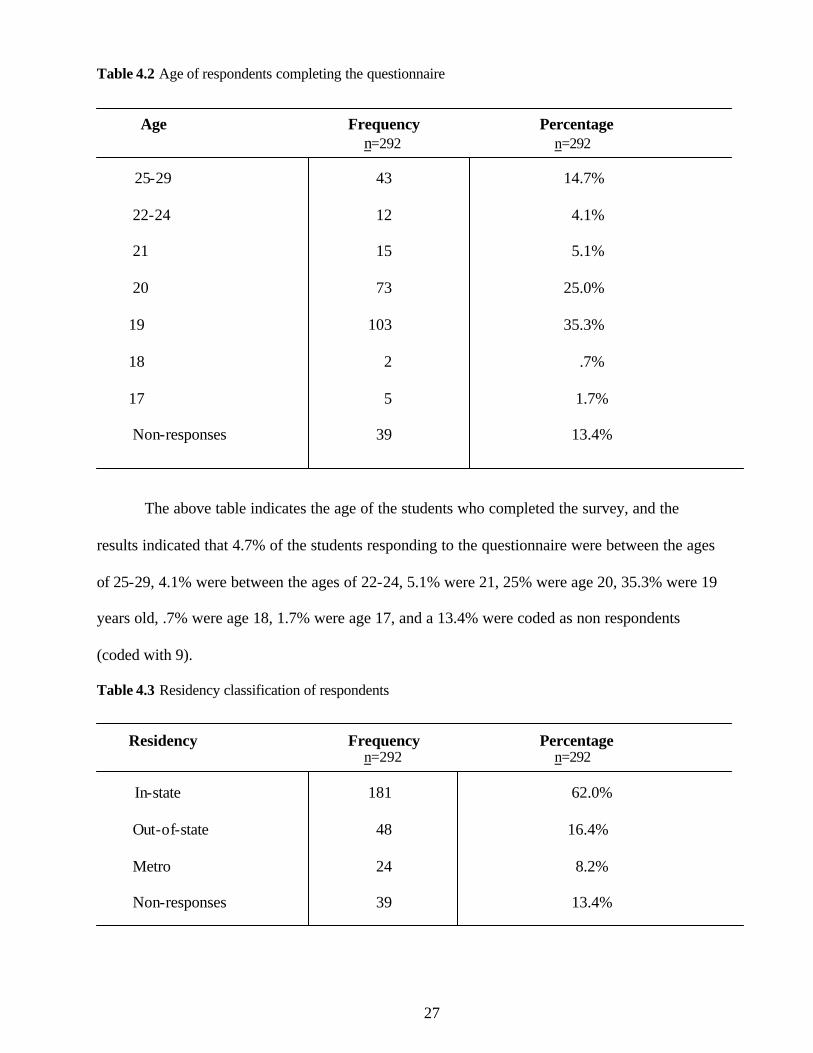
Table 4.2 Age of respondents completing the questionnaire
Age Frequency Percentage n=292 n=292 25-29 43 14.7%
22-24 12 4.1%
21 15 5.1%
20 73 25.0%
19 103 35.3%
18 2 .7%
17 5 1.7%
Non-responses 39 13.4%
The above table indicates the age of the students who completed the survey, and the
results indicated that 4.7% of the students responding to the questionnaire were between the ages
of 25-29, 4.1% were between the ages of 22-24, 5.1% were 21, 25% were age 20, 35.3% were 19
years old, .7% were age 18, 1.7% were age 17, and a 13.4% were coded as non respondents
(coded with 9).
Table 4.3 Residency classification of respondents
Residency Frequency Percentage n=292 n=292 In-state 181 62.0%
Out-of-state 48 16.4%
Metro 24 8.2%
Non-responses 39 13.4%
27
The residency classification chart indicates that the majority of the respondents were in-
state students by reporting over half (62%) were from the state of West Virginia. The out-of-
state-population made up 16.4% of the respondents, the metro counties reported 8.2%, and the
non-respondents coded with 9 made up 13.4%. To further breakdown the residency
classification of the reporting responses, there were 101 in-state male students responding and 80
females students responding, out-of-state male students responding were 34 with 14 female
students responding, metro reported 11 males students and 13 female students. These responses
are concurrent with the reporting of in-state vs. out-of-state students by the Marshall University
Office of Institutional Research. Currently they report 83.1% in-state students and 16.9% of out-
of-state students. These figures were reported by the Office of Institutional Research for the year
2002 – 2003, which is the most up-to-date figures reported by this division.
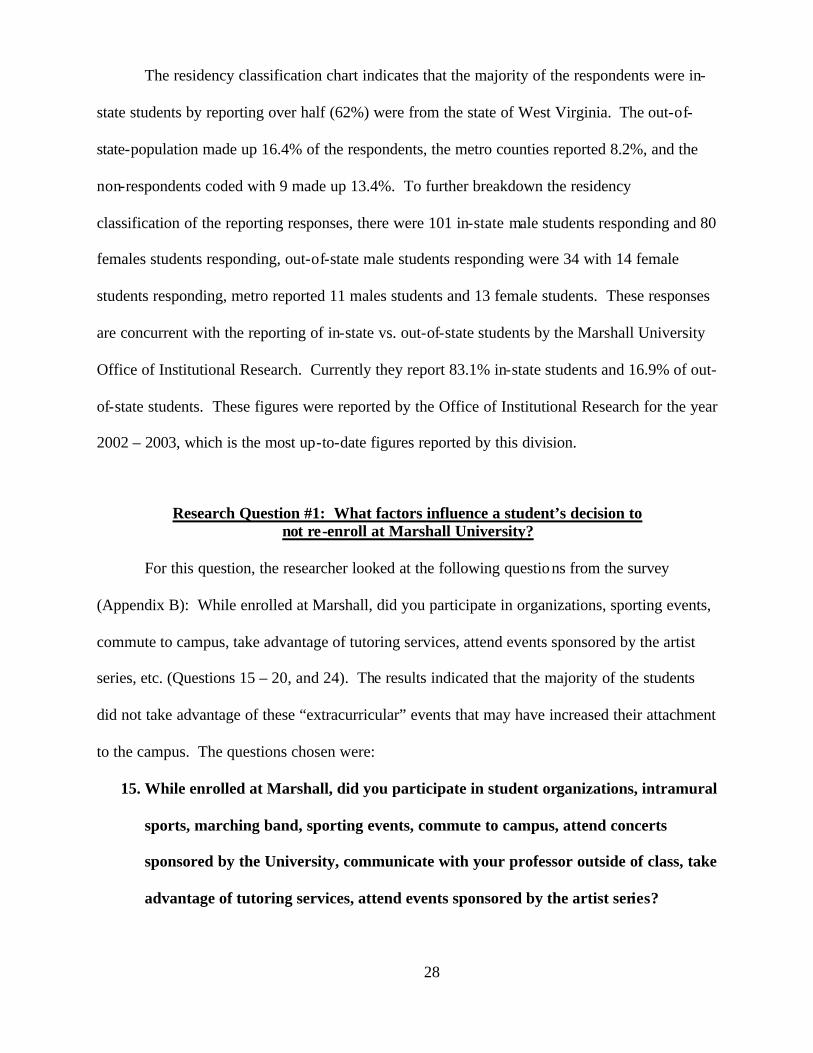
Research Question #1: What factors influence a student’s decision to not re-enroll at Marshall University?
For this question, the researcher looked at the following questions from the survey
(Appendix B): While enrolled at Marshall, did you participate in organizations, sporting events,
commute to campus, take advantage of tutoring services, attend events sponsored by the artist
series, etc. (Questions 15 – 20, and 24). The results indicated that the majority of the students
did not take advantage of these “extracurricular” events that may have increased their attachment
to the campus. The questions chosen were:
15. While enrolled at Marshall, did you participate in student organizations, intramural
sports, marching band, sporting events, commute to campus, attend concerts
sponsored by the University, communicate with your professor outside of class, take
advantage of tutoring services, attend events sponsored by the artist series?
28
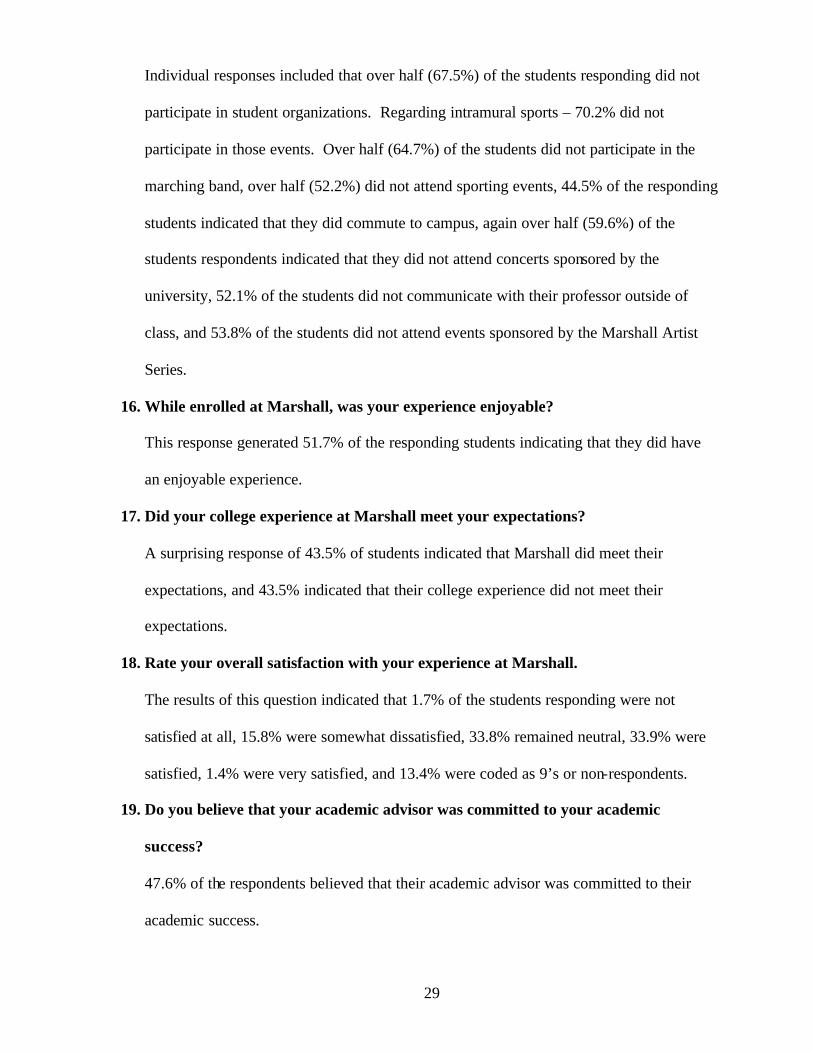
Individual responses included that over half (67.5%) of the students responding did not
participate in student organizations. Regarding intramural sports – 70.2% did not
participate in those events. Over half (64.7%) of the students did not participate in the
marching band, over half (52.2%) did not attend sporting events, 44.5% of the responding
students indicated that they did commute to campus, again over half (59.6%) of the
students respondents indicated that they did not attend concerts sponsored by the
university, 52.1% of the students did not communicate with their professor outside of
class, and 53.8% of the students did not attend events sponsored by the Marshall Artist
Series.
16. While enrolled at Marshall, was your experience enjoyable?
This response generated 51.7% of the responding students indicating that they did have
an enjoyable experience.
17. Did your college experience at Marshall meet your expectations?
A surprising response of 43.5% of students indicated that Marshall did meet their
expectations, and 43.5% indicated that their college experience did not meet their
expectations.
18. Rate your overall satisfaction with your experience at Marshall.
The results of this question indicated that 1.7% of the students responding were not
satisfied at all, 15.8% were somewhat dissatisfied, 33.8% remained neutral, 33.9% were
satisfied, 1.4% were very satisfied, and 13.4% were coded as 9’s or non-respondents.
19. Do you believe that your academic advisor was committed to your academic
success?
47.6% of the respondents believed that their academic advisor was committed to their
academic success.
29

20. All in all, if you had to do it over again, would you enroll at Marshall University?
Over half (50.3%) of the respondents indicated that they would re-enroll at Marshall.
21. What was the most important factor that contributed to your decision to not re -
enroll at Marshall? The most important factor indicated was parental influence
(31.6%). When asked about additional information that influenced their decision not to
return, the survey indicated that 23.6% of the students couldn’t find anything to do on the
weekends, 45.9% of the students surveyed transferred to another institution, and 20.5%
indicated that they were bored.
Table 4.4 Percentage of students who participate in extra-curricular activities
Event Did Participate Did not Participate n=292 n=292 Participate in Student Organizations 18.8% 67.5%
Participate in Intramural Sports 16.4% 70.2%
Participate in the Marching Band 21.9% 64.7%
Attend Sporting Events 28.4% 58.2%
Attend Concerts Sponsored by University 27.1% 59.6%
Communicate with Prof. out of class 35.6% 52.1%
Attend events sponsored by the Artist Series 32.9% 53.8%
It should also be noted that the responses given above indicate that students did not make
personal connections with the campus environment. Tinto’s (1975) model of attrition indicates
the importance of students integrating into the campus life. He (Tinto, 1975) believes that the
greater the degree of integration into the college, the greater the student’s commitment to the
institution will be.
30

Research Questions #2: What percentage of first time freshmen
students seek academic support?
The results of the survey indicated that 52.1% of the students who were enrolled
in the Fall 2002 semester did not take advantage of the tutoring services, and 34.5% of the
students enrolled that semester did take advantage of the tutoring services. As indicated
previously, non-respondents were coded as 9’s, and that resulted in a 13.4% response.
Table 4.5 Percentage of students using tutoring services based on each course
Course Did use Did not use n=292 n=292 Writing 0% .7%
Foreign Language 0% 2.1%
Social Studies 1.0% 1.7%
Reading 4.8% 4.8%
Science 7.5% 15.4%
English 11.6% 14.7%
Math 9.6% 12.7%
The chart above indicates the percentages of students who did and did not take advantage
of the free tutoring services offer, and they are broken down by course. The results
overwhelmingly indicated that the students who did not return to Marshall for the Spring 2003
semester did not participate in the tutoring services offered. The results indicated that none (0%)
of the students responded to the question regarding assistance with writing, used this service, and
only .7% responded indicating that they did not use. Results also indicated that none (0%) of the
31

students answered the question regarding Foreign Language course, and 2.1% indicated that they
did not participate in tutoring services in this course. 1.0% of the responding students indicated
that they did participate in tutoring services for Social Studies, and 1.7% responded they did not
participate . Reading generated a 4.8% response of students that did use this tutoring service,
and the same (4.8%) indicated that they did not use this service. Although the respondents
indicated that 7.5% did use the tutoring services offered in Science, 15.4% indicated that they
did not. English generated the most responses with 11.6% indicating that they did require
tutoring services in this subject, a response of 14.7% indicated that they did not use. The last
subject, Math, resulted in 9.6% of the students responding used this service, 12.7% indicated that
they did not.
Take Advantage of Tutoring Services
9YesNo
Per
cent
60
50
40
30
20
10
0
Did You Need Remedial Work
9
Mathematics
English
Science
Reading
Social Studies
Foreign Language
Writing
0
Cou
nt
100
80
60
40
20
0
Figure 4.1 Students who did participate in tutoring services and students who felt they needed remedial work.
Although the results indicated that only 34.5% of the students enrolled actually used
tutoring services, 86.4% of the students responding indicated that they needed remedial courses.
Which is a strong indication that this class of incoming freshman did not take advantage of the
services that were offered to them, but instead they chose not to take part of these services.
32
n=252 n=252

Research Question #3: What percentage of students who leave Marshall University
transfer to other institutions of higher education? According to the data gathered, 40.8% of the students who did not return to Marshall did
not re-enroll at another institution, 45.9% of the students who left did enroll at another
institution, and 13.4% did not respond. It appears that the data gathered indicates that not all
students leave Marshall to re-enroll at other institutions, and the responses of those who did and
did not re-enroll at other institutions were fairly close.
Table 4.6 Percentage of students who transferred to other institutions
Transferred Did not transfer n=292 n=292 45.9% 40.8%
When asked what other factors influenced their decision to leave Marshall, the results
varied. The results, however, indicated that 5.8% of the respondent’s asked did not do well
academically, 8.2% believed that the classes at Marshall were too big/small, 7.9% of the
respondents did not return because they wanted to join the workforce, 19.9% indicated that they
wanted to attend another university, a surprising 13.3% indicated that they did not feel prepared
for college, and 31.6% suggested that parental influence was a factor that influenced their
decision to leave.
From the analysis of this data, the influence of parents indicated a major influence on
their son/daughter’s decision to leave college. According to Gold (1995), a student’s family does
have an affect on student’s adaptation to the college environment. According to Gold (1995), the
college student moves from the family of origin to the university family, and these family
patterns change causing the student to adapt and adjust.
33

Table 4.7 Other factors that affected student’s decision to not re-enroll
Factor Percentage of Students n=292 n=292 Did not do well academically 5.8%
Classes were too big/small 8.2%
Wanted to join the workforce 7.9%
Decided to attend another university 19.9%
Didn’t feel prepared for college 11.3%
Parental influence 31.6%
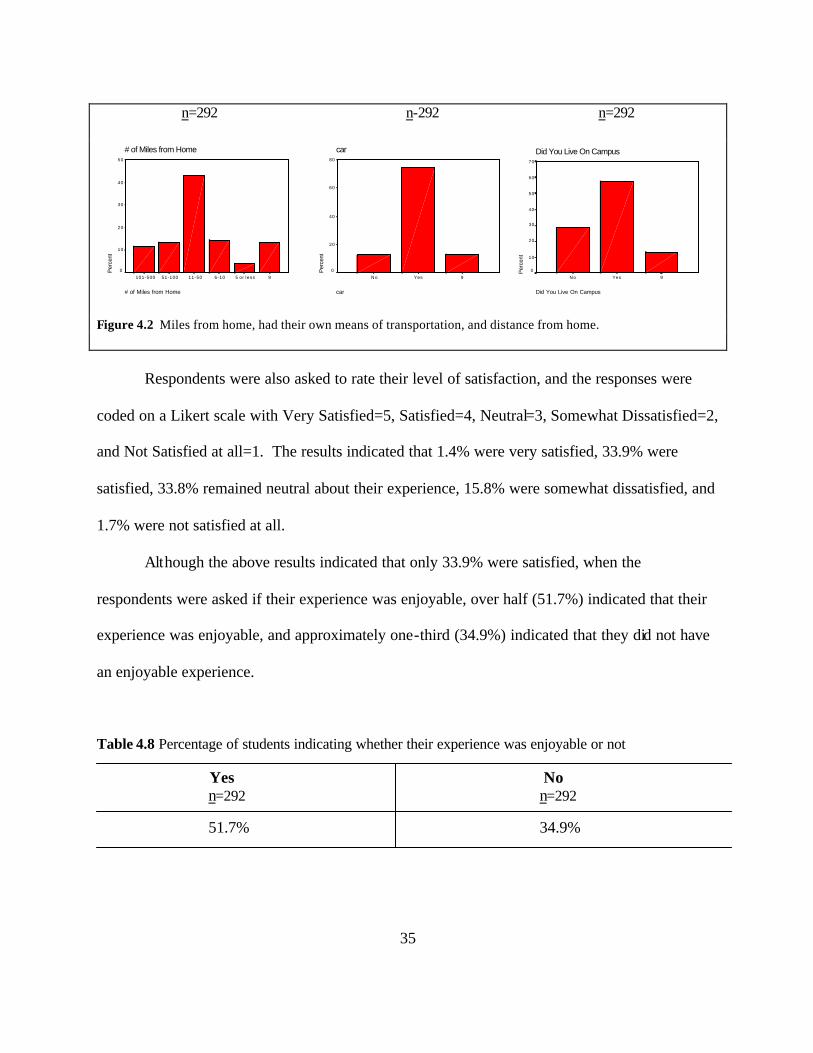
The findings indicate other factors that attribute to a student’s decision to leave was
whether or not they lived on or off campus, how many miles they lived from campus, and did the
student have their own means of transportation.
The results indicated that 12% of the students responding lived between 101 – 500 miles
from Marshall, students living 51 –100 miles away indicated a 17% response rate, a 43.2%
response rate resulted from students living between 11-50 miles from the institution, 14.4%
indicated they lived 6-10 miles away, and a 3.8% response rate resulted in students living 5 or
less miles from the campus.
The remaining results indicated that over half (57.5%) of the students surveyed indicated
that they did live on campus, and only 29.1% responding did not live on campus. Transportation
indicated that almost three-fourths (74.3%) responding did indeed have their own means of
transportation, and only 12.3% did not have transportation.
34
n=292 n-292 n=292
# of Miles from Home
# of Miles from Home
95 or less6-1011-5051-100101-500
Per
cent
50
40
30
20
10
0
car
car
9YesNo
Per
cent
80
60
40
20
0
Did You Live On Campus
Did You Live On Campus
9YesNo
Per
cent
70
60
50
40
30
20
10
0
Figure 4.2 Miles from home, had their own means of transportation, and distance from home. Respondents were also asked to rate their level of satisfaction, and the responses were
coded on a Likert scale with Very Satisfied=5, Satisfied=4, Neutral=3, Somewhat Dissatisfied=2,
and Not Satisfied at all=1. The results indicated that 1.4% were very satisfied, 33.9% were
satisfied, 33.8% remained neutral about their experience, 15.8% were somewhat dissatisfied, and
1.7% were not satisfied at all.
Although the above results indicated that only 33.9% were satisfied, when the
respondents were asked if their experience was enjoyable, over half (51.7%) indicated that their
experience was enjoyable, and approximately one-third (34.9%) indicated that they did not have
an enjoyable experience.
Table 4.8 Percentage of students indicating whether their experience was enjoyable or not
Yes No n=292 n=292 51.7% 34.9%
35
Chapter V
Summary, Conclusions and Recommendations
Summary The purpose of this research was to gain a greater understanding why students do not re-
enroll in Marshall University. In attempting to understand the reasons that students depart from
higher education, we have often been blocked by our inability to collect sufficiently detailed
information regarding the variety of departing behaviors.
With a response rate of 37%, the findings of the survey were exciting. Upon analyzing
the data, the researcher discovered that the largest population that responded to the survey was
female students with an 86.6% response rate, closely followed by male students responding with
a 50% rate. The largest percentage of surveyed students (35.3%) were students 19 years of age,
quickly followed by 25% of the students age 20.
Keeping up with the percentages of in-state vs. out-of-state students reported by Marshall
University, the data reported that 62% of the respondents were in-state-students, and 24.6% were
out-of-state (combined with metro students n=292). The Office of Institutional Research at
Marshall University recently reported (Fall 2003) that the percentage of (the entire student body
made up of 16, 551 students) in-state students were 83.1%, and 16.9% out-of-state students
reported.
When asked, students responding (51.7%) indicated that they did enjoy their experience.
Over half of the students responding (50.3%) replied that they would re-enroll at Marshall, even
though 45.9% of the students responding transferred to other institutions.
36

Students surveyed were also asked about other factors that influenced their decision to
leave Marshall, and the largest percentage (29.8%) was parental influence. The second largest
reporting factor was (19.9%) of the respondents indicating that they decided to attend another
university.
Students also reported that over half (57.5%) of the students responding lived on campus,
and only 29.1% lived off campus. Transportation did not appear to be an issue as over three-
fourths (74.3%) indicated that they had their own means of transportation. Even though 86.4%
indicated that they needed remedial work, only 34.6% actually participated in the services
provided for those courses.
When asked about other factors that may have affected their decision to leave Marshall,
students reported the following:
• Nothing to do on the weekends 23.6%
• Students were bored 20.5%
• Everyone went home on the weekends 17.8%
• Didn’t have any friends 16.1%
• Didn’t like it there 4.8%
• Personal/Family illness 3.8%
Students were also asked what degree they intended to obtain while enrolled at Marshall,
and over one-third (35.6%) indicated that they intended to obtain a bachelor’s degree. Only
24.7% indicated that they planned to obtain an associate’s degree, and a 4.1% indicated that they
had planned to pursue their master’s degree upon completing their bachelor’s degree. When
asked, students indicated that over half (50.7%) had taken courses at other four-year institutions,
and 22.9% indicated that they had take courses at a Community/Junior College upon leaving
Marshall.
37
Conclusions
Demographic distribution of the respondents were very similar with the corresponding
distributions of the student population; therefore, respondents were representative of the general
student population. Students who do not invest the time, energy, and resources into developing
social relationships with their peers do not take ownership of the institution at a level consistent
with those who do.
With only a 34.6% response rate of students actually taking advantage of the tutoring
services at Marshall, and 86.4% of them indicating that they indeed required remedial work, it
appears that this factor could be influential with student’s frustrations regarding their course
work. With 11.3% reporting that they did not feel prepared academically for college, and 5.8%
reporting they did not do well academically, the researcher believes that remedial courses could
have assisted with both of these influences. Since tutoring services are free at Marshall to full-
time students, this service could have aided in both of these situations for the better.
A national study on student retention completed by Adelman (1999), is an important
study to include in a review of recent retention research. This national study found that students,
who require remedial education, have a lower first term GPA, or interrupt their studies for one or
more terms, are less likely to complete a four-year degree. With the students responding to this
study, 86.4% indicated that they needed remedial work.
The number of students who did not participate in on-campus events rated very high.
When combining the total percentages of students who did and did not participate in each
individual on campus event asked, the combined scores indicated that only one-fourth (25.9%) of
the students surveyed participated in those events and 60.9% did not participate. Based on this
information student involvement is key to success in college. Even though over half (57.5%) of
38

the students surveyed lived on campus, a 60.9% reported that they did not participate in on-
campus events. According to Weaver (1994), what happens out of the classroom is just as
important as what takes place inside the classroom. He (Weaver, 1994) believes that students
should immerse themselves in the total college experience by getting involved, because time will
pass quickly. An active person in college will be active on the job and in life as well (Weaver,
1994).
With over half (51.7%) of the students responding indicating that their experience at
Marshall was enjoyable, and almost half (49.3%) indicating that Marshall was their first choice,
the researcher suggest that providing more opportunities for support may very well decrease the
rate of students not re-enrolling at Marshall.
Involved students are happy students. Aiken (1982) believes happiness that comes from
being involved will assist and enhance your survival as a student on campus. First-year students
that become involved in campus life are more likely to return to college as a sophomore than
uninvolved students. Becoming involved in a campus organization will definitely give you the
opportunity to meet new people and make new friends (Aitken, 1982).
Several issues regarding student retention emerged from this data. With the percentage
of students (57.5%) who lived on-campus verses the number of students (60.9%) who did not
participate in student organizations while attending Marshall, it is clear that a connection to the
campus was not made. Giving them a sense of community or an at home atmosphere, the lack of
which seems to be one of the complaints about Marshall, is a factor in retaining students. In
order to feel at home, students need to be made aware of services that are available to promote
their success. Strong student development services and other supporting programs will keep
students enrolled at Marsha ll for a longer period of time.
39

Recommendations for Future Studies
Based on the analysis of collected data, research, and the responses of the participants of
the study, the researcher recommends the following suggestions for future study:
1. This study should be replicated on a national basis, and should include universities of the
same size and with similar offerings.
2. The replication of this study should also include the final grade point average of the
students who did not re-enroll.
3. A longitudinal study should be conducted to determine whether students are successful at
other institutions upon transferring from Marshall.
4. A similar survey should be mailed to the parents of the non-returning students to
recognize the influence they have on their children, and to understand their fears and
frustrations.
5. Research should be conducted to compare in what ways students who left the university
significantly differ from the students that are currently enrolled.
6. Prospective researchers should also determine whether the population surveyed is first
generation college students.
7. This study should also include the percentage of students who complete a University 101
course, or some course developed for first time freshman to indicate the success of those
courses.
8. Research should also include determining what colleges or universities students are
attending upon leaving Marshall.
40

REFERENCES
Adelman, C. (1999). Answers in the tool box: Academic intensity, attendance patterns, and
bachelor’s degree attainment. Office of Educational Research Improvement.
Aitken, N. D. (1982). College student performance, satisfaction and retention: Specification and
estimation of a structural model. Journal of Higher Education, 53(1), 32-50.
Astin, A. W. (1975). Preventing students from dropping out. San Franciso: Jossey-Bass. Astin, A. W. (1984a). Look at pluralism in the contemporary student population. NASPA
Journal, 21, (3), 2-11.
Baker, R. W., & Siryk, B. (1984a). Measuring academic motivation of matriculating college
freshman. Journal of College Student Personnel, 25, 459-464.
Baker, R. W., & Siryk, B. (1984b). Measuring adjustment to college. Journal of Counseling
Psychology, 31, 179-189.
Baker, R. W., & Siryk, B. (1989). SACQ Student Adaption to College Questionnaire manual.
Los Angeles, CA: Western Psychological Services.
Bean, J.P. (1980). Dropout and turnover: The synthesis and test of a casual model of student
attrition. Research in Higher Education, 12, 155-187.
Brace, S., & Roberts, G. (1997). When payup becomes payback: A university’s return on
instructional technology investment. Syllabus, 11.1, 30-37.
Casazza. M., & Silverman, S. (1996). Learning assistance and developmental education. San
Francisco: Jossey-Bates.
Chickering, A.W. (1969). Education and Identity. San Francisco: Jossey-Bass.
41

Consortium for Student Retention Data Exhange (1999). Executive summary 1998-1999
SCSRDE report.\: The retention and graduation rates in 269 colleges and universities.
Norman, OK: Center of Institutional Data Exchange and Analysis, University of
Oklahoma.
Crockett, D. S. (1978). Academic advising: A cornerstone of student retention. In L. Noel
(ed.), Reducing dropout rate. San Francisco: Jossey Bass.
Cross, K. P. (1971). Beyond the open door: New students to higher education. San Francisco:
Jossey-Bass.
Cross. K. P. (1981). Adults as learners: Increasing participation and facilitating learning. San
Francisco: Jossey-Bass.
Ender, S.C., Winston, R.B., Jr., & Miller, T.K. (1984). Academic advising reconsidered. In R.
B. Winston, Jr., T. K. Miller, S.C. Ender; T. C. Grites, & Associates, Developmental
academic advising. San Francisco: Jossey Bass.
Foote, B. (1980). Determined - and undetermined – major students: How different are they?
Journal of College Student Personnel, 21(1), 23-28.
Frame, R. (2002). A Strengths-Based Approach and Student Retention Rates. Christianity
Today, 46, Issue 12.
Frost, S. H. (1991). Academic advising for student success: A system of shared responsibility.
ASHE-ERIC Higher Education Report No. 3. The George Washington School of
Education and Human Development, Washington DC.
Gaither, G. (1999). Promising practices in recruitment, remediation, and retention. San
Francisco: Jossey-Bass.
Garland, M. (1993). Student perception of the situational, institutional, dispositional, and
epsistemological barriers to persistence. Distance Education, 14:2, 181-198.
42

Gold, J. (1995). An Intergenerational Approach to Student Retention. Journal of College
Student Development , 36(2), 182-187.
Gordon, V. N. (1984). The undecided college student: An academic and career advising
challenge. Springfield, Illinois: Thomas.
Green, H, & Greene, M. (2003). Yes, student retention is an admissions issue. Retrieved
October 23, 2003, from http://www.greenesguide.com.
Griffin, C. & Kilgore, K. (1995). Framing the problems of practice: the effect of self-assessment
in a study of special education students’ internships. Teacher Education and Special
Education, Winter 18(1), 56-71.
Hackman, J. & Dysinger, W., (1970). Commitment to college as a factor in student attrition.
Sociology of Education, 43(3), 311-324.
Haring, M. J. (1997). Networking mentoring as a preferred model for guiding programs for
underrepresented students. In H.T. Frierson, Jr. (Ed.), Diversity in higher education.
Greenwich, CT: JAI Press.
Henton, J., Lamke, L., Murphy, C., & Haynes, L. (1980). Crisis reactions of college freshman as
a function of family support systems. The Personnel and Guidance Journal, 58, 508-
511.
Houston, B.K. (1971). Sources, effects, and individual vulnerability of psychological
problems for college students. Journal of Counseling Psychology, 18, 157-165.
Hurte, V. J. (2002). Mentoring: The forgotten retention tool. Black Issues in Higher Education,
19, Issue 18.
Kemerer, F., Baldridge, J., & Green K. (1982). Strategies for effective enrollment management .
Washington D.C.: American Association of State Colleges and Universities.
43
Kottkamp, R. (1990). Means for facilitating reflection. Education and Urban Society, February,
22(2), 182-203.
Leader, F. (1993). Constructivism: Theory for Practice? The case of Mathematics. Higher
Education Research and Development, 12(1), 5-20.
Lenning, O. T., Beal, P.E., & Sauer, K. (1980). Retention and attrition: Evidence for actions
and research. Boulder, CO: National Center for Higher Education Management
Systems.
Levitz, R., & Hovland, M. (1998). Dropout prone students. Iowa City: Noel-Levitz. Retrieved
October 23, 2003, from http://www.noellevitz.com.
Litten. J. H., & Hall A. E. (1989). In the eyes of our beholders: Some evidence on how high
school students and their parents view quality in colleges. Journal of Higher Education,
60, (2), 302-324.
Lokitz, B.D., & Sprandel, H. Z. (1976). The first year: A look at the freshman experience.
Journal of College Student Personnel, 17, 274-279.
Mallinckrodt, B. (1988). Student retention, social support, and dropout intention: Comparison
of Black and White students. Journal of College Student Development, 29, 60-64.
Maxwell, M. (1997). Improving student learning skills. Clearwater, FL: H and H Publishing
Co.
Moore, W., & Carpenter, L. (1985). Academically underprepared students. San Francisco:
Jossey-Bass.
Moore, R., & Miller, I. (1996). How the use of multimedia affects student retention and learning.
Journal of College Science Technology, 24.4, 289-293.
44
Noel, L., Levitz, R., Saluri, D., & Associates (1985). Increasing student retention: Effective
programs and practices for reducing the dropout rate. San Francisco: Jossey-Bass.
Noel, L. (1985). Increasing student retention: New challenges and potential. In L. Noel, R.
Levits, & D. Saluri (Eds), Increasing student retention. San Francisco: Jossey-Bass.
Noel, L., Levitz, R. (1999). National student satisfaction report. Retrieved November 15, 2003,
from http://noelevitz.com/res/research/99 studsatrep.pdf.
Oppenheim, A. (1992). Questionnaire design, interviewing and attitude measurement. London:
Printer.
Pantages, T. J. & Creedon, C.F. (1978). Studies of college attrition: 1950-1975. Review of
Education Research, 48, 49-101.
Pappas, J. P. & Loring, R. K. (1985). Increasing student retention: Effective programs and
practices for reducing the dropout rate. San Francisco: Jossey-Bass.
Pascarella, E., & Terenzini, P. (1991). How college affects students. San Francisco: Jossey-
Bates.
Pascarella, E. T. (1980). Student- faculty informal contact and college outcomes. Review of
Educational Research, 50, 545-594.
Ramist, L. (1981). College student attrition and retention. College Board Report No. 81-1, New
York: College Entrance Examination Board.
Rendon, L. I. (1994). Validating culturally diverse students: Toward a new model of learning
and student development. Innovative Higher Education, 19(1), 23-32.
Rich, A.R., & Scovel, M. (1987). Causes of depression in college students: A cross-lagged panel
correlational analysis. Psychological Reports, 60, 27-30.
Roderick, M. (1993). The path to dropping out. Westport, CT: Auburn House.
45

Rossman, J., & Kirk, B. (1970). Factors related to persistence and withdrawal among university
students. Journal of Counseling Psychology 17, 55-62.
Schon, D. (1995). Knowing- in-action: the new scholarship requires a new epistemology.
Change, November/December:27-34.
Seidman, A. (1996). Retention Revisited: RET = E Id + (E = I = C)Iv. College and University,
71(4), 18-20.
Shermis, M., & Lombard, D. (1999). A comparison of survey data collected by regular mail and
electronic mail questionnaires. Journal of Business and Psychology 14(2), 341-354.
Spady, W. G. (1970). Dropouts from higher education: An interdisciplinary review and
synthesis. Interchange, 1, 64-85.
Stoldt, M., & Klepper, W. (1987). Increasing retention: Academic and student affairs
administrators in partnership. San Francisco: Jossey-Bass.
Svinicki, M., Hagen, A., & Meyer, D. (1996). How research on learning strengthens instruction.
Teaching on solid ground: Using scholarship to improve practice. San Francisco:
Jossey-Bass.
Terenzini, P., (1996). Making the transition to college. San Francisco: Jossey-Bass.
Tidwell, R., (1988). Dropouts speak out: Qualitative data on early school departure. Adolescence
23, 92.
Tinto, V. (1987). Leaving College. Chicago, IL: University of Chicago Press.
Tinto, V. (1975). Dropout from higher education: A theoretical synthesis of recent research.
Review of Education Research, 45, 89-125.
Titley, R., & Titley, B. (1980). Initial choice of college major: Are only the “undecided”
undecided? Journal of College Student Personnel, 21 (4), 293-298.
46

Upcraft, M. L., Finney, J.E., & Garland, P. (1984). Orientation: A context in M. L. Upcraft (Ed.),
Orienting students to college. San Francisco: Jossey-Bass.
Upcraft, M. L., & Gardner, J. N. (1989). The freshman year experience. San Francisco: Jossey-
Bass, 1989.
Walker, S.C., & Taub, D. J. (2001). Variables correlated with satisfaction with a mentoring
relationship in first year college students and their mentors. Journal of the First Year
Experience and Students in Transition, 13(1), 47-67.
Weaver, R. (1994). Ten suggestions for making the most of a college education. Vital Speeches
of the Day. 61(1).
White, W. & Mosely, D. (1995). Twelve year pattern of retention and attrition in a commuter
type environment. Community College Journal, 64(4), 26-29.
Willingham, W. W. (1985). Success in college: The role of personal qualities and academic
ability. New York: College Entrance Examination Board.
Witmer, D., & Colman, R., & Katzman, S. (1999). From paper-and-pencil to screen-and-
keyboard: towards a methodology for survey research on the Internest, in S. Jones (ed).
Doing internet Research: critical issues and methods for examining the Net, Longdon:
Sage.
Wycoff, S. C. (1999). The academic advising process in higher education: History, research,
and improvement. Recruitment & Retention in Higher Education, 13 (1), 1-3.
47

Appendix A
December 1, 2003 Dear Participant:
Hello! My name is Sabrina Simpson, and I am a graduate student at Marshall University.
I am currently conducting a study on student retention as part of my graduate thesis, and I need
your help.
I am studying reasons why students do not re-enroll at Marshall, and your assistance in
this matter would be greatly appreciated. I have enclosed a copy of my survey and a self-
addressed stamped envelop for you to return the survey to me. This survey is voluntary, and
your response will be kept confidential. I do not need your name, just your information.
Please return the enclosed survey in the enclosed envelop to me by December 15, 2003.
If you have any questions, please feel free to contact me at (304) 696-2246 or
Again, your participation in this study is greatly appreciated, and I look forward to
receiving a survey from you soon.
Sincerely,
Sabrina D. Simpson
Enclosure
48
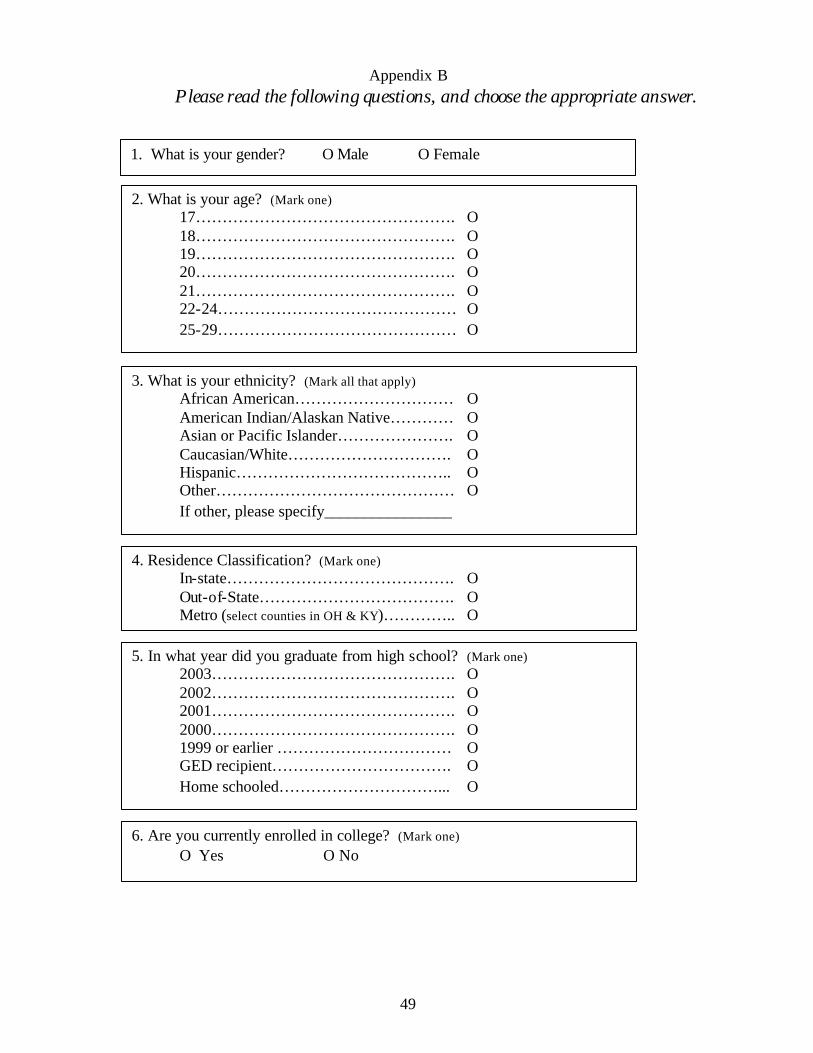
Appendix B
Please read the following questions, and choose the appropriate answer.
49
1. What is your gender? O Male O Female
2. What is your age? (Mark one) 17…………………………………………. O 18…………………………………………. O 19…………………………………………. O 20…………………………………………. O 21…………………………………………. O 22-24……………………………………… O 25-29……………………………………… O
3. What is your ethnicity? (Mark all that apply) African American………………………… O American Indian/Alaskan Native………… O Asian or Pacific Islander…………………. O Caucasian/White…………………………. O Hispanic………………………………….. O Other……………………………………… O If other, please specify________________
4. Residence Classification? (Mark one) In-state……………………………………. O Out-of-State………………………………. O Metro (select counties in OH & KY)………….. O
5. In what year did you graduate from high school? (Mark one) 2003………………………………………. O 2002………………………………………. O 2001………………………………………. O 2000………………………………………. O 1999 or earlier …………………………… O GED recipient……………………………. O Home schooled…………………………... O
6. Are you currently enrolled in college? (Mark one) O Yes O No

50
7. How many miles is Marshall from your permanent home? (Mark one) 5 or less…………………………………… O 6-10………………………………………. O 11-50……………………………………… O 51-100…………………………………….. O 101-500…………………………………… O
8. What was your average grade in high school? (Mark one) A+……………………………….. O A………………………………… O B+………………………………. O B………………………………… O C+………………………………. O C………………………………… O D+………………………………. O D………………………………… O
9. Upon leaving Marshall, have you taken courses at any other institution? (Mark all that apply)
Yes, at a Community/Junior College……… O Yes, at a 4yr. College or University………. O Yes, at some other postsecondary school…. O (For example, technical, vocational, business) Not applicable……………………………. O
10. While enrolled at Marshall, did you live on campus? (Mark one) Yes……………………………………….. O No………………………………………… O If yes, where?_______________________
11. Was Marshall your: (Mark one) First choice……………………………… O Second choice…………………………… O Third choice…………………………….. O Less than third choice…………………… O
12. What factors influenced your decision to leave Marshall? (Mark all that apply)
Financial Aid…………………………………….. O Parents…………………………………………… O School Location……………………………..…… O Dissatisfied with Education………………..……. O Major not offered………………………………… O Other_______________________________________

51
13. Did you have, or did you feel that you needed tutoring or remedial work in any of the following subjects? (Mark all that apply) English…………………………………. O Reading………………………………… O Mathematics…………………………… O Social Studies………………………….. O Science………………………………… O Foreign Language……………………… O Writing………………………………… O Not applicable…………………………. O
14. What is the highest academic degree that you intended to obtain (Mark one) Highest Highest Planned at MU
None………………………………. O O Associate degree………………….. O O Bachelor’s degree………………… O O Master’s degree…………………… O O Ph.D. or E.D………………………. O O LL.B. or J.D. (Law)………………. O O
15. While enrolled at Marshall, did you: (Mark all that apply) Yes No
Participate in student organizations……………………….. O O Participate in intramural sports…………………………… O O Participate in the marching band…………………………. O O Attend sporting events……………………………………. O O Commute to campus……………………………………… O O Attend concerts sponsored by the University…………….. O O Communicate with your professor outside of class………. O O Take advantage of the tutoring services on campus……… O O Attend events sponsored by the artist series……………… O O Not applicable…………………………………………….. O
16. While enrolled at Marshall, was your experience enjoyable?… O Yes O No
17. Did your college experience at Marshall meet your expectations? (Mark one) Much worse than I expected……………………… O Quite a bit worse than I expected………………… O Worse than I expected……………………………. O About what I expected……………………………. O Better than I expected…………………………….. O Quite a bit better than I expected…………………. O Much better than I expected………………………. O
18. Rate your overall satisfaction with your experience at Marshall. (Mark one) Not satisfied at all……………………………….. O Somewhat dissatisfied…………………………… O Neutral…………………………………………… O Satisfied………………………………………….. O Very Satisfied……………………………………. O

52
19. Do you believe that your academic advisor was committed to your academic success? (Mark one)……………….. O Yes O No 20. All in all, if you had to do it over again, would you enroll at Marshall? (Mark one) Definitely not…………………………… O Probably not……………………………. O Maybe not…………………………….… O Probably………………………………… O Definitely……………………………..… O
21. If you lived on campus, how often did you go home? (Mark one)
Every weekend……………………………….. O Every other weekend…………………………. O Twice a month………………………………… O Once a month…………………………………. O Not Applicable………………………………… O
22. Was financial aid a deciding factor regarding your decision to leave Marshall? (Mark one)
Yes…………………………………………….. O No……………………………………………… O Not Applicable…………………………………. O
23. While attending Marshall, did you have your own means of transportation? (Mark one)
Yes…………………………………………….. O No……………………………………………... O
24. What was the most important factor that contributed to your decision to not re-enroll at Marshall? (Mark one) Didn’t feel prepared for college………………………………. O Decided to attend another University…………………………. O Wanted to join the workforce…………………………………. O Did not do well academically…………………………………. O Classes were too big/small…………………………………….. O Parents wanted me to go to school closer to home……………. O Other ___________________________________________________
25. Please provide any additional information that may have affected your decision to not re-enroll at Marshall University.
________________________________________________________________
________________________________________________________________
________________________________________________________________