A Study Of Association Of Profits And Corporate Governance ...
24
Turkish Journal of Computer and Mathematics Education Vol.12 No.13 (2021), 1086-1109 Research Article 1086 A Study Of Association Of Profits And Corporate Governance With Shareholders’ Value Of Nifty Companies In India – 2009-10 To 2019-20 Dr. V. Y. John Asst. Professor, CMS Business School, Jain (Deemed-to-be University), Bangalore, INDIA. Prathibha Menon, MBA – II Semester, CMS Business School, Jain (Deemed-to-be University), Bangalore, INDIA Saunak Pal BBA Fin Tech 1st Year CHRIST (Deemed to be University) Delhi NCR, INDIA. Article History: Received: 11 January 2021; Revised: 12 February 2021; Accepted: 27 March 2021; Published online: 4 June 2021 Abstract The study undertakes to delve into the profit variants and proxies of corporate governance chosen, i.e., the composition of the Board of Directors and the shareholders to assess if there is a significant association of the above with the shareholders value of NIFTY Index, one of the prominent Stock Indices in India. The study also looks into the trends in the growth and contribution of various Industries comprising the NIFTY companies during the period of the study, 2009-10 to 2019-20 with the objective to identify industries which are contributing maximum value to shareholders. Results amazingly reveal that there is a significant association of the following profit variants, viz., Av. EAT(Earnings After Taxes), Av. CFO(Cash from Operations), Av. D/P(Dividend Pay-out) Ratio and Av. FCF(Free Cash Flows) with shareholder Value as measured by the metric, MVA (Market Value Added) of the NIFTY companies during the years 2009-10 to 2019-20. Results also reveal that there is no significant association between the composition of the Board of Directors and the shareholders to the MVA. Regression, Correlation, Bar and Line graphs were the tools used in analysing data. It is observed that the MV (Market Value/Capitalization) and more importantly MVA (Market Value Added) are relatively quite high and consistently increasing in case of companies under Banking and Financial Services, Software, FMCG(Fast Moving Consumer Goods) and Pharmaceutical Industry in India. These are followed by companies in the Infrastructure and Automobile Sectors. Key words: Market Value Added Corporate Governance Earnings after Taxes Cash from Operations FreeCash Flows INRODUCTION With enhanced importance to Corporate Governance after Satyam Scam hit India in 2009, and the scams of equally serious magnitude which hit the US market from the year 2001 and onwards, such as the Enron and the WorldCom, the imperative importance of corporate governance on the shareholder value cannot be gainsaid.
Transcript of A Study Of Association Of Profits And Corporate Governance ...

Turkish Journal of Computer and Mathematics Education Vol.12 No.13 (2021), 1086-1109
Research Article
1086
A Study Of Association Of Profits And Corporate Governance With Shareholders’
Value Of Nifty Companies In India – 2009-10 To 2019-20
Dr. V. Y. John
Asst. Professor, CMS Business School,
Jain (Deemed-to-be University),
Bangalore, INDIA.
Prathibha Menon,
MBA – II Semester, CMS Business School,
Jain (Deemed-to-be University),
Bangalore, INDIA
Saunak Pal
BBA Fin Tech 1st Year
CHRIST (Deemed to be University)
Delhi NCR, INDIA.
Article History: Received: 11 January 2021; Revised: 12 February 2021; Accepted: 27 March 2021; Published
online: 4 June 2021
Abstract
The study undertakes to delve into the profit variants and proxies of corporate governance chosen, i.e., the
composition of the Board of Directors and the shareholders to assess if there is a significant association of the
above with the shareholders value of NIFTY Index, one of the prominent Stock Indices in India. The study also
looks into the trends in the growth and contribution of various Industries comprising the NIFTY companies
during the period of the study, 2009-10 to 2019-20 with the objective to identify industries which are
contributing maximum value to shareholders.
Results amazingly reveal that there is a significant association of the following profit variants, viz., Av.
EAT(Earnings After Taxes), Av. CFO(Cash from Operations), Av. D/P(Dividend Pay-out) Ratio and Av.
FCF(Free Cash Flows) with shareholder Value as measured by the metric, MVA (Market Value Added) of the
NIFTY companies during the years 2009-10 to 2019-20. Results also reveal that there is no significant
association between the composition of the Board of Directors and the shareholders to the MVA. Regression,
Correlation, Bar and Line graphs were the tools used in analysing data. It is observed that the MV (Market
Value/Capitalization) and more importantly MVA (Market Value Added) are relatively quite high and
consistently increasing in case of companies under Banking and Financial Services, Software, FMCG(Fast
Moving Consumer Goods) and Pharmaceutical Industry in India. These are followed by companies in the
Infrastructure and Automobile Sectors.
Key words: Market Value Added Corporate Governance Earnings after Taxes Cash from Operations FreeCash
Flows
INRODUCTION
With enhanced importance to Corporate Governance after Satyam Scam hit India in 2009, and the scams of
equally serious magnitude which hit the US market from the year 2001 and onwards, such as the Enron and the
WorldCom, the imperative importance of corporate governance on the shareholder value cannot be gainsaid.
A STUDY OF ASSOCIATION OF PROFITS AND CORPORATE GOVERNANCE WITH
SHAREHOLDERS’ VALUE OF NIFTY COMPANIES IN INDIA – 2009-10 TO 2019-20
1087
The effectiveness or otherwise of Corporate Governance has a game changing impact on the value of the
shareholders.
In the Indian context, with the merger of Lakshmi Vilas Bankiwith DBS Bank last year, near collapse and
revival of Yes Bankduring 2020, sporadic instances of corporate and banking frauds, it is quite important and
imperative for the management of every company and banks alike to focus on effective corporate governance in
protecting and enhancing shareholder value. There is increasing evidence that public shareholders have become
sceptical about corporates in enhancing shareholder value. There is always the perception that the promoters are
attempting to amass wealth, corporate managers trying to get maximum packages often at the cost of ignoring
the concerns of the minority shareholders. Such developments and corporate frauds enhanced the importance of
corporate governance in enhancing shareholder value.
The focus on corporate governance emphasized by the regulatory bodies is not without falling short when it
comes to implementation. Indian Investors have discovered it the hard way when big companies like DHFL, IL
& FS, Jet Airways and Yes Bank have collapsed in the few years’ past.
It is also very well known that there is a direct correlation between consistent profits and shareholder value.
However, there is a mute question which has remained unanswered, i.e., which variant of profits has a close
bearing on the shareholder value, particularly in respect of the large listed companies in India. This question is
addressed in this research.
Ideally, the management of any company should have the robustness, freedom, responsibility, agility and
dignity to protect the interests of the public and other investors who parked their money. Faith in the
management is the raison d’etre for investing in the business. It is therefore an obvious expectation that the
management delivers value to the shareholders.
REVIEW OF LITERATURE:
There are mixed and somewhat paradoxical views on the association between Corporate Governance and
Shareholders Value. Grossman and Hart (1982), and Kaplan and Minton (1994) find that majority shareholders
improve firm’s performance by solving the free rider problem. On the contrary, Nenova (2003), Ahunwan
(2003), Pinkowitz et al (2003), Klapper and Love (2004), and Bebchuck et al (2004) find that concentrated
shareholding in a firm deteriorates shareholders’ value by expropriating the rights of minority shareholders.We
notice of late that there are serious corporate governance allegations against promoters on issues like insider
trading, not empowering women in patriarchal family-owned businesses, not empowering Independent Directors
to freely express their views on the performance which causes them to innocuously resign at times and the like.
SEBI Chairman Ajay Tyagi(2020) recently made a comment that Independent Directors need to raise corporate
governance concerns, before resigning from companyii. Fayad Altawalbeh(2020) deduced that board meetings
frequency had a significantly positive association with firm’s performance, while the board independence, i.e.,
independent directors had no significant impact on the performance of Jordanian Companies.
In one of the conclaves of CEOs of USA during 2019, it was contended that shareholders’ value is no longer a
viable objective for corporate management. It was contended that in the final analysis,while each individual
company serves its own corporate purpose, it shares a fundamental commitment to all of their stakeholders, not
only shareholders, prominently customers, employees, communities and the countryiii. However, it has not been
a confirmed idea as was refutediv (Raghuram Rajanet al, 2020)stating that efforts by managements to please all
stakeholders rather than just their own shareholders could end up pleasing no one. By the above logic, his
contention was that if all stakeholders are assumed to have equal importance, then, it follows that no group of
stakeholders are finally more important the other. If all stakeholders are essential, then none are. In an attempt to
please everyone, the Business Roundtable will probably end up pleasing no one. Thus, time and again, it has
been empirically proven that those companies which have tried to focus on long-term growth and sustenance
and thus enhance shareholder value have been on the forefront of maximizing the wealth of the all-other
stakeholders. Companies like Infosys, Hindustan Unilever Ltd, Bajaj Auto Limited, Lupin Laboratories Ltd,
Pidilite Industries and Asian Paints (Motilal Oswal, Thematic Study, 2020) are some of the classic examples of
companies which have been able to live up to this credo for decades together.

Dr. V. Y. John, Prathibha Menon,Saunak Pal
1088
Suresh V. N. (2012) in his article on “Corporate Governance Practices of Listed Companies in India” delineated
that there is a need for a serious change in the mindset of the “management” of companies. One of the greatest
challenges noticeable was to build and restore trust among stakeholders and improve the credibility in the
independence of the board.
Alfred Rappaport(2006) in his incisive analysis on ten ways to creating shareholder value deduces that
executives have developed short-term outlook towards maximizing the wealth of shareholders. This, he says
comes at the expense of investing in long-term growth. He offers ten basic principles to help executives create
lasting shareholder value. Prominent among them being companies should not manage earnings, should make
strategic decisions and carry assets that maximize expected value, even if near-term earnings are negatively
affected, return cash to shareholders if no viable investments exist, require senior executives to own shares and
resort to full disclosure. He enunciates that most companies with a sound, well-executed business model, could
better realize their potential for creating shareholder value by adopting these ten principles.
Jessica Comitto(2011) deduces that one of the most difficult tasks to an investor is to find value in
investment,concluding that one of the best ways to find if a company is generating adequate cash and finding
opportunities to enhance shareholders’ value is by examining the Free Cash Flows.
Michael J. Mauboussin(2011) deduces that a CEO’s job should be to earn a return in excess of the cost of
Capital. Research in the area of pricing in stock market points to three salient features. First, the worth of a
business is the present value of its future cash flows. Second, the stock market is a reflection of long-term cash
flows in future and third, value creation is paid by the market.
We notice there while literature in the area of finance is replete with many studies related to shareholder value
analysis over a number of years, there is no precise research that is conducted on which profit variants are
closely associated with shareholders’ value on a long-term, particularly on the leading and listed companies in
India. There is also very little literature on the proxies of corporate governance which enhance shareholder
value. This Research attempts to fill this gap.
METHODOLOGY:
A sample of, 49 among 50 companies comprising NIFTY Index have been included. Regression Analysis is
primarily conducted in order to find out if there is a fair degree of association between one of the
importantmetrics of shareholder value, MVA (Market Value Added), the Dependent Variable and the variants of
profits, viz., EBITDA(Earnings Before Interest, Taxes, Depreciation and Amortization), EAT(Earnings After
Taxes), CFOs(Cash from Operations), FCFs(Free Cash Flows), ROI(Return on Investment), ROE(Return on
Equity) and D/P(Dividend Pay-out) Ratio are taken as Independent Variables. The annual average figures of
each of the above figures for the period 2009-10 to 2019-20 is taken so as to minimize the influence of short-
term factors on the shareholder value.The proxies of Corporate Governance are taken as proportion of chief
categories of directors, prominent categories of shareholders in the ownership of the companies. The Correlation
between the proportion of the above categories of directors and shareholders and shareholders’ value is studied
separately. Thus, the association between these proxies and the Market Value Added of the companies has been
considered taking MVA as the Dependent Variable and considering the proxies as Independent Variables.
OBJECTIVES OF THE STUDY:
1) To study the Association between EBITDA and the Market Value Added
2) To Study the Association between EAT and the Market Value Added
3) To Study the Association between CFOs and the Market Value Added
4) To Study the Association between FCFs and the Market Value Added
5) To Study the Association between ROI and the Market Value Added.
6) To Study the Association between ROE and the Market Value Added.
7) To Study the Association between D/P (Dividend Pay-out) Ratio and the Market Value Added.
8) To study the Association between the proportion of important categories of Directors and the Market
Value Added.
A STUDY OF ASSOCIATION OF PROFITS AND CORPORATE GOVERNANCE WITH
SHAREHOLDERS’ VALUE OF NIFTY COMPANIES IN INDIA – 2009-10 TO 2019-20
1089
9) To study the Association between the proportion of important categories of Shareholders and the
Market Value Added.
10) To study the contribution to the MV and MVA by different industries representing the NIFTY Index.
RESEARCH QUESTIONS:
1) What is the degree of Association between the various profit variants delineated in the study and the
Market Value Added during the period of the study?
2) What is the degree of Association between the proxies of Corporate Governance and the Market Value
Added during the period of the study?
HYPOTHESES OF THE STUDY:
H1:There is a positive association between EBITDA and the Market Value Added.
H2:There is apositive association between EAT and the Market Value Added.
H3:There is apositive association between CFOs and the Market Value Added.
H4:There is apositive association between FCFs and the Market Value Added.
H5:There is apositive association between ROI and the Market Value Added.
H6:There is apositive association between ROE and the Market Value Added.
H7:There is apositive association between D/P Ratio and the Market Value Added.
H8:There is apositive association between the proportion of prominent categories of Directors and the Market
Value Added.
H9:There is apositive association between the proportion of important categories of Shareholders and the
Market Value Added.
SCOPE OF THE STUDY:
The study is focussed on the association of profit indicators and the shareholder value Metric employed, i.e., the
Market Value Added of the listed companies in India comprising the Nifty Index. The study also looks at the
association of the components of corporate governance basically from the point of view of the proportion of
directors comprising executive, non-executive, independent and women directors, the composition of ownership
patterns, viz., promoters, FIIs (Foreign Institutional Investors), DIIs (Domestic Institutional Investors) and see if
their proportional representation has any association with shareholder value.
LIMITATIONS OF THE STUDY:
1) Since the data of profits and corporate governance indicators is taken from the secondary sources
comprising annual reports and reliable disclosures, any limitation of these sources shall affect the study.
2) The study is about the companies listed in the NIFTY Index. While it is evident that the conclusions
are purported to apply to the companies comprising the index, it has to be applied carefully in a proper context
to other medium and large-scale companies which are not part of the Index.
3) Since data related to corporate governance is not directly quantifiable and to some extent not publicly
disclosable, gauging corporate governancethrough secondary sources has its own limitations.
SCOPE FOR FURTHER RESEARCH:
The association of Corporate Governance with Shareholder Value has good number of other dimensions such as
the frequency of meetings of the Board of Directors, deliberation process during the board of directors’
meetings, processes comprising internal and external audit, compliance effectiveness, efficiency of operations,
management philosophy and other subjective factors which have further scope of research so as to assess their
association with shareholder value. The association of Profits to Shareholders Value too has other dimensions
which have not been explored in this study. These can be further explored.
Dr. V. Y. John, Prathibha Menon,Saunak Pal
1090
DATA ANALYSIS AND INTERPRETATION:
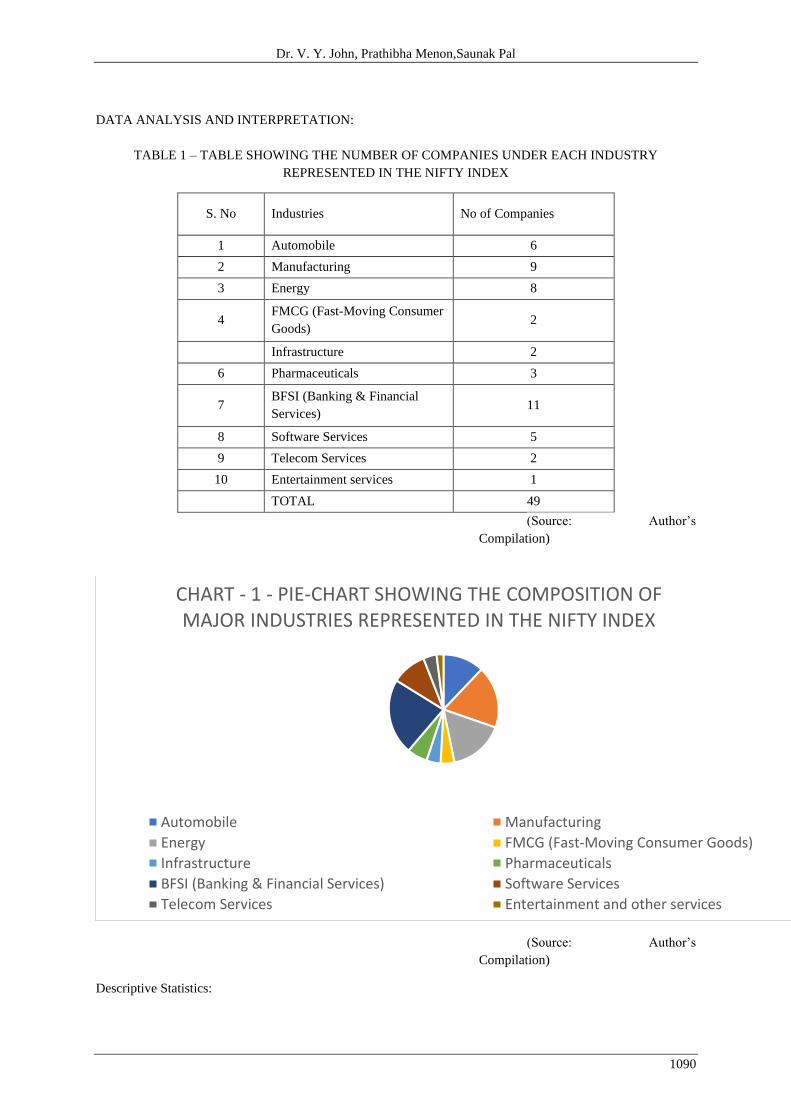
TABLE 1 – TABLE SHOWING THE NUMBER OF COMPANIES UNDER EACH INDUSTRY
REPRESENTED IN THE NIFTY INDEX
S. No Industries No of Companies
1 Automobile 6
2 Manufacturing 9
3 Energy 8
4 FMCG (Fast-Moving Consumer
Goods) 2
Infrastructure 2
6 Pharmaceuticals 3
7 BFSI (Banking & Financial
Services) 11
8 Software Services 5
9 Telecom Services 2
10 Entertainment services 1
TOTAL 49
(Source: Author’s
Compilation)
(Source: Author’s
Compilation)
Descriptive Statistics:
CHART - 1 - PIE-CHART SHOWING THE COMPOSITION OF MAJOR INDUSTRIES REPRESENTED IN THE NIFTY INDEX
Automobile Manufacturing
Energy FMCG (Fast-Moving Consumer Goods)
Infrastructure Pharmaceuticals
BFSI (Banking & Financial Services) Software Services
Telecom Services Entertainment and other services

A STUDY OF ASSOCIATION OF PROFITS AND CORPORATE GOVERNANCE WITH
SHAREHOLDERS’ VALUE OF NIFTY COMPANIES IN INDIA – 2009-10 TO 2019-20
1091
Descriptives
Av. MVA
(Rs. Cr)
Av.
E
B
I
T
D
A
(Rs.Cr)
Av.
E
A
T
(Rs.Cr)
Av.ROI
( % )
Av.ROE
( % )
Av.CFO
(Rs.Cr)
Av.FCF
(Rs.Cr)
Av.
D
/
P
Ratio
(
%
)
N 49 49 49 49 49 49 49 49
Missing 0 0 0 0 0 0 0 0
Mean 39033 15678 5784 12.1 22.1 7490 1070 29.2
Median 31892 9168 3775 8.03 19.3 5332 1167 24.7
Standard
devi
atio
n
45902 22295 5648 12.3 15.5 12063 6820 20.1
Range 214574 145445 27754 68.2 87.4 66017 40995 103
Minimum -27490 1181 35.9 0.342 0.223 -17903 -19982 -21.0
Maximum 187084 146627 27790 68.6 87.7 48114 21013 82.3
Shapiro-Wilk
W 0.834 0.538 0.777 0.778 0.841 0.894 0.918 0.904
Shapiro-Wilk
p < .001 < .001 < .001 < .001 < .001 < .001 0.002 < .001
(Source: Author’s Compilation: Results from Jamovi software)
Discussion about Descriptive Statistics:
The descriptive statistics comprising the Averages of Variables, viz., Av. MVA, Av. EBITDA, Av. EAT, Av.
ROI, Av.ROE, Av. CFO, Av. FCFs and Av. D/P Ratio show some interesting trends.
The Mean Value of Av. MVA is Rs.39033 crores, indicate that the companies comprising the NIFTY Index
were able to make handsome contribution to the MVA during the last 10 years, there were only 2 entities
showing a negative MVA, Hindalco Industries at -7817 crores and SBI at – Rs.27490 crores.The figures are
moderately positively skewed at 1.64.

Dr. V. Y. John, Prathibha Menon,Saunak Pal
1092
EBITDA shows a mean figure of Rs. 15,678 crores, this shows that the companies comprising the NIFTY Index
are having reasonably high operating profits. The figures are positively skewed as evidenced from the skewness
4.52.
The Mean Value of Av. EAT is Rs. 5784 crores. It is a clear indication that the Average Net Profitsgenerated
by NIFTY companies are above par. This too is fairly positively skewed at 2.09.
The ROI figures show a mean value of 12.1%. which means that Corporate India, those which are in the genre
of the NIFTY companies are generating a net profits on an average at the rate of Rs. 12 for every Rs. 100
invested in the business. The data positively skewed at 2.35.
The ROE figures have a mean of 22.1%, this indicates that the return on shareholders funds is 22.1%, this data
is having a somewhat high positive skewness at 2.02.
The Average CFO is Rs. 7490 crores. This shows that the unencumbered cash generated from operations of the
NIFTY companies is reasonably high. The S.D is Rs. 12063 crores. There is a near moderate skewness at 1.26
of the above data indicating that the cash generated is somewhat evenly spread across the mean. .
The Average FCF is found to be Rs. 1070 crores, which is found to have the least variation in terms of its spread
across the companies. This, in comparison with the CFOs, which were Rs. 7490 crores indicate that the amount
of Free Cash Flows is somewhat much lesser than the CFOs, indicating that there are lots of other expenditures,
most importantly the Capital Expenditures which consume a bulk of the Cash from Operations, which ultimately
result in a relatively lesser amount of Free Cash Flows. Interestingly, CFOs comprises the only standalone
variable which shows a symmetric trend indicated by its skewness which is near ‘0” at 0.04. displaying a
perfectly normal distribution.
The Average Dividend-Pay-out (D/P) Ratio is showing a mean of 29.2%. This shows that Corporate Indiais
depicting a trend of paying reasonably consistent, fair and regular dividends. The Standard Deviation is about
20.1%, minimum value at -21% and maximum at 82.3%. This shows that the range of dividends is reasonably
well dispersed across companies. The data is showing a moderately skewed structure at 0.88. This data too
depicts a near normal trend.
PROFIT VARIANTS AND THEIR ASSOCIATION WITH SHAREHOLDER VALUE
The Regression Analysis depicted below shows the degree of association or predictability of each of the profit
variants chosen as Independent Variables on the Dependentwhich is MVA (Market Value Added), the proxy of
Shareholder Value. The Average Annual Figures of the Independent Variables, viz., EBITDA, EAT, CFO,
FCF, ROI, ROCE, D/P Ratio are taken considering data procured for the period from FY 2009-10 to 2019-20.
Linear Regression
Model Fit Measures
Model R R² Adjusted R²
1 0.726 0.527 0.446
Model Coefficients - Av. MVA
Predictor Estimate SE T P
Intercept 250.524 11918.129 0.0210 0.983
Av. EBITDA -0.361 0.289 -1.2479 0.219
Av.EAT 4.573 1.520 3.0079 0.004
Av.CFO -2.261 0.745 -3.0344 0.004

A STUDY OF ASSOCIATION OF PROFITS AND CORPORATE GOVERNANCE WITH
SHAREHOLDERS’ VALUE OF NIFTY COMPANIES IN INDIA – 2009-10 TO 2019-20
1093
Model Fit Measures
Model R R² Adjusted R²
Av.FCF 1.856 0.976 1.9016 0.064
ROI 830.189 708.242 1.1722 0.248
ROE 280.637 576.697 0.4866 0.629
Av. D/P Ratio 570.429 273.967 2.0821 0.044
(Source: Author’s Compilation: Results from Jamovi software)
The Regression Equation taking MVA as the Dependent Variable and the various Profit Variants, viz., Av.
EBITDA, Av. EAT, Av. CFO, Av. FCF, Av.ROI, Av. ROE, Av. D/P Ratio show some very interesting trends.
The Model is found to have an “R” Value 0.726, the adjusted R2 is 0.446. The ‘p” values of the Independent
Variables, Av. EAT, Av. CFO, Av. D/P Ratio and Av. FCF are found to be 0.004, 0.044, 0.05 and 0.068
respectively. This shows that the MVA which is considered as an average of the years 2009-10 to 2019-20 is
having a fair degree of predictability through the Independent Variables prominently the Av. EAT, Av. CFO,
Av. D/P Ratio which are having a very high degree of predictability at ‘p’ values of0.004, 0.004 and 0.044
respectively followed by FCF which too is having afairly high degree of predictability at 0.064. The other
Independent Variables, i.e., Av. EBITDA, Av. ROI, Av. ROE do not have any significant “p” values which
indicate that they do not have predictability on the MVA.
The Above Regression Analysis points to the fact that the companies comprising the NIFTY Index and the like
need to focus on maximizing the Profits After Taxes, Cash from Operations, Free Cash Flows apart from
focussing on paying consistent and reasonably high dividends. This would ultimately result in the Market’s
Perception of the Company as a Profitable and Growing Entity thus attracting a good number of shareholders.
Companies like Infosys, Hindustan Unilever Ltd and Bajaj Auto Ltd are found to be having a record of
achieving the results in a consistently growing and high trend as regards the overall performance indicators
including the predictable variables, viz., Net Profits, Cash from Operations, D/P Ratio and the Free Cash Flows
during the period of the study. It is therefore an empirical reinforcement of the above deduction made out of the
Regression Analysis.
CORPORATE GOVERNANCE PARAMETERS AND THEIR INFLUENCE ON THE SHAREHOLDERS’
VALUE:
1) REPRESENTATION OF CHIEF CATEGORIES OF BOARD OF DIRECTORS AND THEIR
ASSOCIATION WITH SHAREHOLDER VALUE:
The following discussion is about the selected parameters taken as a proxy of Corporate Governance. The first
among which is the proportion of the Directors in the Company. The Total Number of Directors are Classified
into four major categories., viz., Executive, Non-Executive, Independent and Women Directors. The objective
of classifying is to find if there is any association between the proportion of each of these categories of Directors
and Shareholders Value as measured by the proxy, MVA. The following Regression Analysis clarifies the
phenomena studied.
Linear Regression

Dr. V. Y. John, Prathibha Menon,Saunak Pal
1094
Model Fit Measures
Overall Model Test
Model R R² Adjusted R² F df1 df2 p
1 0.310 0.0960 0.0139 1.17 4 44 0.338
Model Coefficients - Av. MVA
Predictor Estimate SE T p
Intercept 217843 3.34e+6 0.0652 0.948
Non-Executive -2225 33418 -0.0666 0.947
Independent -2429 33399 -0.0727 0.942
Executive -1782 33470 -0.0533 0.958
Women 2533 1206 2.1002 0.041
(Source: Author’s Compilation: Results from Jamovi software)
The above linear Regression pertains to the MVA as the Dependent Variable and the Proportion of various chief
categories of Board of Directors treated as Independent Variables, these IVs are Proportion of Executive
Directors, Non-Executive Directors, Independent and Women Directors. The Regression Model shows an R
Value of 0.310, R2 value of 0.096 and Adjusted R2 of 0.0139 which shows that the predictability of these IVs is
quite low. However, relatively speaking, there seems to be more predictability of the category of women
directors on the MVA with a “p” value of 0.041. The proportion of other categories of Directors has no
association with the MVA as can be noted.
2) REPRESENTATION OF CHIEF CATEGORIES OF SHAREHOLDERS AND THEIR
ASSOCIATION WITH SHAREHOLDER VALUE:
RESULTS OF MULTIPLE REGRESSION CONSIDERING MVA AS THE DEPENDENT VARIABLE AND
PROPORTIONS OF PROMOTERS, FII(Foreign Institutional Investors) s, AND DII(Domestic Institutional
Investors) s AS INDEPENDENT VARIABLES:
Correlation Matrix
MVA Promoters FII (in %) DII (in %) Others (in %)

A STUDY OF ASSOCIATION OF PROFITS AND CORPORATE GOVERNANCE WITH
SHAREHOLDERS’ VALUE OF NIFTY COMPANIES IN INDIA – 2009-10 TO 2019-20
1095
Correlation Matrix
MVA Promoters FII (in %) DII (in %) Others (in %)
MVA Pearson's r —
p-value —
Promoters Pearson's r 0.063 —
p-value 0.669 —
FII (in %) Pearson's r -0.027 -0.609 —
p-value 0.853 < .001 —
DII (in %) Pearson's r 0.039 -0.658 -0.049 —
p-value 0.789 < .001 0.737 —
Others (in %) Pearson's r -0.174 -0.370 -0.137 0.104 —
p-value 0.232 0.009 0.347 0.478 —
(Source: Author’s Compilation: Results from Jamovi software)
SUMMARY OUTPUT
Regression Statistics
Multiple R 0.19
R Square 0.04
Adjusted R
Square -0.03
Standard Error 2.28
Observations 49.00
ANOVA
Df SS MS F Sign F
Regression 3.00 8.75 2.92 0.56 0.64
Residual 45.00 233.68 5.19
Total 48.00 242.43
Coefficients Std Error t Stat P-
value
Lower
95%
Upper
95%
Lower
90%
Upper
90%
Intercept -2.64 3.80 -0.70 0.49 -10.29 5.00 -9.02 3.73
Promoters 0.05 0.04 1.26 0.21 -0.03 0.13 -0.02 0.12
FII (in %) 0.04 0.04 0.98 0.33 -0.05 0.13 -0.03 0.12
DII (in %) 0.06 0.05 1.22 0.23 -0.04 0.16 -0.02 0.14
(Source: Author’s Compilation: Results from MS Excel)
INTTERPRETATION: The above Regression Equation though may not fit exactly to have a fair degree of
predictability, given that the R Value is 0.19 and R2value being 0.04, however, at least peripherally, shows that

Dr. V. Y. John, Prathibha Menon,Saunak Pal
1096
there is no predictability of the proportion of shareholding of important categories of shareholders and the MVA
as the p-value of these categories, i.e., Promoters, FIIs and DIIs shows values of 0.214, 0.33 and 0.228. In other
words, irrespective of who the owners (major group of shareholders) are, the performance of the firm as
measured by MVA is exogenic to these variables. It is the effective risk management systems and the
orientation towards high degree of sustainability, efficiency and profitability that enables a business to maximize
value to the shareholders. This is further attested by the correlation matrix which shows that there is near 0 or in
other words no correlation between the share of each of these categories of shareholders and the MVA.
INDUSTRY ANALYSIS OF MARKET VALUE (MV) AND MARKET VALUE ADDED (MVA) OF
COMPANIES IN THE NIFTY INDEX DURING 2009-10 TO 2019-20
TABLE 2 - AVERAGE MV AMD MVA OF AUTOMOBILE
COMPANIES
IN THE NIFTY INDEX - 2009-10 TO 2019-20
Year Av. MV(Rs.Cr) Av. MVA (Rs.Cr)
2009-10 11717 7635
2010-11 25112 17526
2011-12 33998 21667
2012-13 40631 27005
2013-14 46979 25604.5
2014-15 70463 52624
2015-16 77321 53854
2016-17 90991 69326
2017-18 116791 85119
2018-19 94154 62620
2019-20 81081 46836
(Source: Author’s compilation)
CHART2 – AVERAGE MV AND MVA OF AUTOMIBILE COMPANIES IN THE NIFTY INDEX – 2009-10
TO 2019-20
A STUDY OF ASSOCIATION OF PROFITS AND CORPORATE GOVERNANCE WITH
SHAREHOLDERS’ VALUE OF NIFTY COMPANIES IN INDIA – 2009-10 TO 2019-20
1097
(Source: Authors compilation)
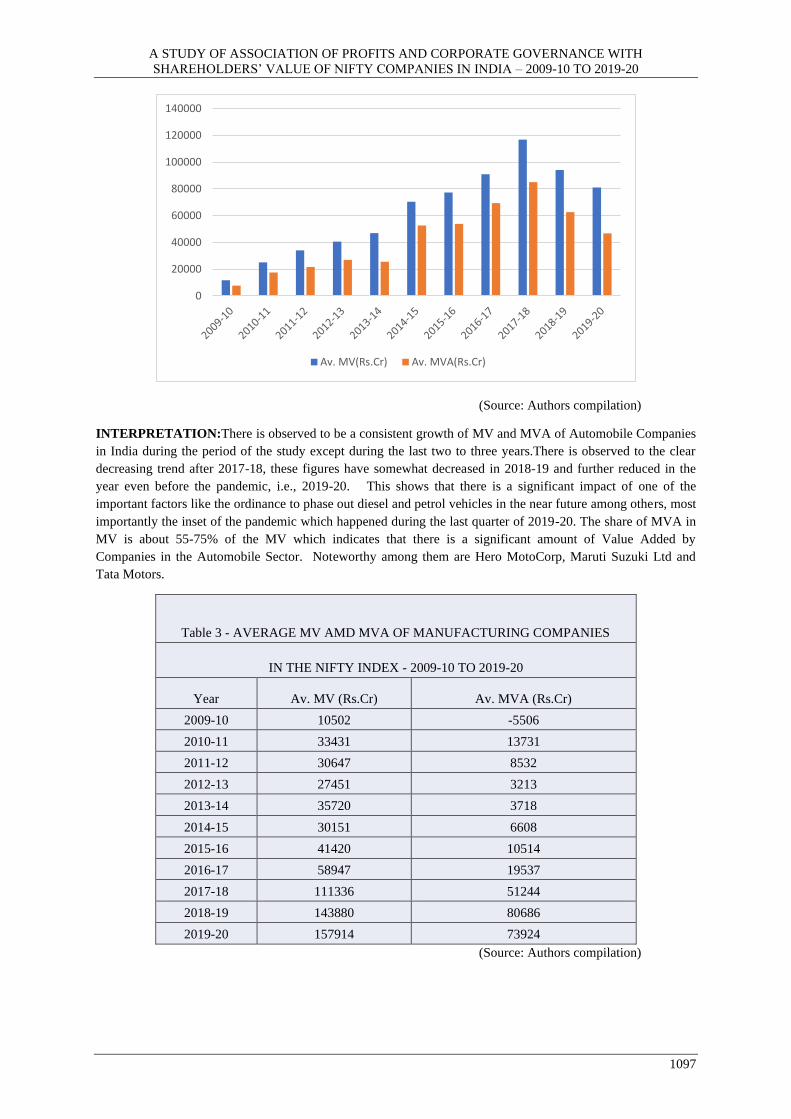
INTERPRETATION:There is observed to be a consistent growth of MV and MVA of Automobile Companies
in India during the period of the study except during the last two to three years.There is observed to the clear
decreasing trend after 2017-18, these figures have somewhat decreased in 2018-19 and further reduced in the
year even before the pandemic, i.e., 2019-20. This shows that there is a significant impact of one of the
important factors like the ordinance to phase out diesel and petrol vehicles in the near future among others, most
importantly the inset of the pandemic which happened during the last quarter of 2019-20. The share of MVA in
MV is about 55-75% of the MV which indicates that there is a significant amount of Value Added by
Companies in the Automobile Sector. Noteworthy among them are Hero MotoCorp, Maruti Suzuki Ltd and
Tata Motors.
Table 3 - AVERAGE MV AMD MVA OF MANUFACTURING COMPANIES
IN THE NIFTY INDEX - 2009-10 TO 2019-20
Year Av. MV (Rs.Cr) Av. MVA (Rs.Cr)
2009-10 10502 -5506
2010-11 33431 13731
2011-12 30647 8532
2012-13 27451 3213
2013-14 35720 3718
2014-15 30151 6608
2015-16 41420 10514
2016-17 58947 19537
2017-18 111336 51244
2018-19 143880 80686
2019-20 157914 73924
(Source: Authors compilation)
0
20000
40000
60000
80000
100000
120000
140000
Av. MV(Rs.Cr) Av. MVA(Rs.Cr)

Dr. V. Y. John, Prathibha Menon,Saunak Pal
1098
CHART – 3 – AVERAGE MV AND MVA OF MANUFACTURING COMPANIES IN THE NIFTY INDEX -
2009-10 TO 2019-20
(Source: Authors compilation)
INTERPRETATION: The overall trend in the Manufacturing Sector in general and the companies in the Nifty
index presents a grim picture, i.e., the share of the MVA in the MV is relatively much low throughout the period
of the study, ranging between 0 to 50%, indicating that the Market Value Added of the manufacturing sector
companies is very low. While the Market Value of the companies is found to show a very low or nil growth
during the first six years of the study, the figures steadily and consistently increased during the years 2016-17 to
2019-20. The situation must have surely dampened after 2019-20 with the onset of the pandemic. It is pertinent
to note that the companies in Nifty Index comprise the privately owned entities like Asian Paints, Grasim
Industries, JSW Steel, Reliance Industries Ltd and Tata Steel. While the share of MVA in MV in companies
like UPL Ltd, Titan Industries Ltd and Asian Paints Ltd, is about 55-85% of the MV, the share of the remaining
companies ranges from negative to 0 to about 35%.
TABLE 4 - AVERAGE MV AMD MVA OF ENERGY COMPANIES
IN THE NIFTY INDEX - 2009-10 TO 2019-20
Year Av. MV(Rs.Cr) Av. MVA(Rs.Cr)
2009-10 43784 28891
2010-11 68293 49640
2011-12 80530 52374
2012-13 83051 51245
2013-14 81730 35227
2014-15 101954 67054
2015-16 98570 57762
2016-17 115347 61867
2017-18 124535 57655
2018-19 116205 34949
2019-20 103447 22457
-20000
0
20000
40000
60000
80000
100000
120000
140000
160000
180000
Av. MV(Rs.Cr) Av. MVA(Rs.Cr)

A STUDY OF ASSOCIATION OF PROFITS AND CORPORATE GOVERNANCE WITH
SHAREHOLDERS’ VALUE OF NIFTY COMPANIES IN INDIA – 2009-10 TO 2019-20
1099
(Source: Authors compilation)
CHART – 4 – AVERAGE MV AND MVA OF ENERGY COMPANIES IN THE NIFTY INDEX - 2009-10
TO 2019-20
(Source: Authors compilation)
INTERPRETATION: The picture of MV and MVA of energy companies viz., NTPC Ltd, Coal India Ltd,
BPCL, ONGC, GAIL, IOC, PowerGrid and HPCL is very interesting. From the table underlying the above
figures, it is observed that the share of Coal India Ltd and Power Grid Corporation of MVA in MV ranges
between 40-85%. However, the share of the remaining companies ranges between 0-40% to the maximum
extent. By the way, all are public sector units. Energy sector is beset with its own evils like the fluctuating
crude oil prices, flexible pricing initiated by the government since a few years, phased and gradual removal of
subsidies while increasing the rate of GST in the retail sector and the like. There is observed to be a decline
further during the year 2019-20 in MVA and MV which must have gone down further after March 2020 due to
the pandemic.
TABLE 5 - AVERAGE MV AMD MVA OF FMCG COMPANIES
IN THE NIFTY INDEX - 2009-10 TO 2019-20
Year Av. MV(Rs.Cr) Av. MVA(Rs.Cr)
2009-10 39838 36170
2010-11 68475 61821
2011-12 87186 79117
2012-13 119857 111031
2013-14 143406 132922
2014-15 177691 165471
0
20000
40000
60000
80000
100000
120000
140000
Av. MV(Rs.Cr) Av. MVA(Rs.Cr)

Dr. V. Y. John, Prathibha Menon,Saunak Pal
1100
2015-16 178802 162049
2016-17 241631 216395
2017-18 297257 268861
2018-19 328991 295313
2019-20 313124 282087
CHART – 5 – AVERAGE MV AND MVA OF FMCG COMPANIES IN THE NIFTY INDEX - 2009-10 TO
2019-20
(Source: Authors compilation)
INTERPRETATION: We observe that there is high market value addition in the FMCG companies comprising
the Nifty index. It is also observed that the proportion of MVA to MV is ranging between 75 to 90 %. The
companies as noted in the underlying table are HUL and ITC Ltd. It can be said that due to their strong,
established and agile management, the companies have aggressively grown and also contributed a lot to
shareholders’ value. The growth of both MV and MVA has somewhat muted during the year 2015-16 in this
industry. One of the main reasons being that less demand prevailed in the FMCG sector during the years 2014-
15 and 2015-16. The values of MV and MVA have slightly tapered down during the year 2019-20 which must
have further gone down later after the pandemic and presently the FMCG Industry is gaining a lot of momentum
as stores have been allowed to operate apart from digital sales which has picked up much after the pandemic.
TABLE - 6 - AVERAGE MV AND MVA OF INFRASTRUCTURE COMPANIES IN THE
NIFTY INDEX
2009-10 TO 2019-20
Year Av. MV (Rs. Cr) Av. MVA(Rs.Cr)
2009-10 22125 16399
2010-11 26347 19486
2011-12 32538 24697
2012-13 32408 22826
2013-14 47380 31900
0
50000
100000
150000
200000
250000
300000
350000
Av. MV(Rs.Cr) Av. MVA(Rs.Cr)

A STUDY OF ASSOCIATION OF PROFITS AND CORPORATE GOVERNANCE WITH
SHAREHOLDERS’ VALUE OF NIFTY COMPANIES IN INDIA – 2009-10 TO 2019-20
1101
2014-15 74674 57015
2015-16 76000 56106
2016-17 71291 48038
2017-18 121181 86819
2018-19 134581 87752
2019-20 127881 87286
CHART – 6– AVERAGE MV AND MVA OF INFRASTRUCTURE COMPANIES IN THE NIFTY INDEX -
2009-10 TO 2019-20
(Source: Author’s compilation)
INTERPRETATION: The infrastructure companies are Adani Ports and SEZ Ltd and L & T Ltd. The share of
MVA in MV of these companies is ranging between 55-70%. This shows that despite the limitation of funds
with the government to spend on infrastructure, practice of PPP in Indian Government which makes the projects
to realize their cash inflows far into the future and the fairly longer gestation period involved in the
infrastructure projects,there is a fair degree of Market Value Added. We also note that the growth of this
industry has almost muted during the years 2015-16 and 2016-17. One of the reasons could be that the change
of guard in the government starting from 2014, after which the 12thFive-year plan was discarded. The growth of
MV and MVA has slightly decreased during the year 2019-20 when compared to 2018-19 which must have
further decreased after the pandemic whichis now showing gradual pick up.
TABLE 7 - AVERAGE MV AND MVA OF PHARMACEUTICAL COMPANIES
IN THE NITFY INDEX - 2009-10 TO 2019-20
Year Av. MV(Rs.Cr) Av. MVA(Rs.Cr)
2009-10 12893 6844
2010-11 12268 7988
2011-12 12431 7293
2012-13 14612 8476
2013-14 24090 13724
2014-15 41613 28452
0
20000
40000
60000
80000
100000
120000
140000
160000
Av. MV( Rs. Cr) Av. MVA(Rs.Cr)

Dr. V. Y. John, Prathibha Menon,Saunak Pal
1102
2015-16 59422 42701
2016-17 60192 40736
2017-18 70408 49999
2018-19 68594 37806
2019-20 61274 34355
CHART – 7– AVERAGE MV AND MVA OF PHARMACEUTICAL COMPANIES IN THE NIFTY INDEX -
2009-10 TO 2019-20
(Source: Authors compilation)
INTERPRETATION: The companies in the pharma industry show a slow growth from 2009-10 to 2012-13
wherein the MV ranges from Rs.12893 to Rs. 14692 crores, while there is a phenomenal growth in MV from the
year 2013-14 to 2018-19 where the MV which was Rs.24090 crores in 2013-14 reaches to a peak of Rs.70408
crores in 2017-18 and slightly tapers off to Rs. 68594 crores during 2018-19. The growth of MV has further
reduced to Rs.61274 crores during 2019-20. We notice that there is also a sharp reduction in MVA from Rs.
49999 crores during the years 2017-18 to Rs.34355 crores during the year 2019-20, which must have further
decreased at least during the first quarter of FY 2019-20.The companies in pharma sector in NIFTY are Cipla,
Dr. Reddy’s Laboratories Ltd and Sun Pharmaceuticals Ltd. These companies are well-established and have
their own niche presence in the global markets apart from having a dominant presence in the Indian market. It is
small wonder that the benchmark pharmaceutical companies are a trend-setter for the remaining players in this
industry reaching greater heights in terms of their reach and ability to capitalize the strength of the Indian
Economy and population in pharmaceutical production, marketing and distribution. On an average, we find that
the share of MVA in MV is found to range between 55-70%.
TABLE -8 - AVERAGE MV AND MVA OF BANKING AND FINANCIAL
SERVICES(BFSI) COMPANIES
COMPANIES IN NIFTY INDEX - 2009-10 TO 2019-20
Year Av. MV(Rs.Cr) Av. MVA(Rs.Cr)
2009-10 6993 2615
2010-11 18340 11778
2011-12 22168 13893
2012-13 27501 16666
0
10000
20000
30000
40000
50000
60000
70000
80000
Av. MV(Rs.Cr) Av. MVA(Rs.Cr)

A STUDY OF ASSOCIATION OF PROFITS AND CORPORATE GOVERNANCE WITH
SHAREHOLDERS’ VALUE OF NIFTY COMPANIES IN INDIA – 2009-10 TO 2019-20
1103
2013-14 30487 18401
2014-15 63651 43832
2015-16 91784 53922
2016-17 100901 61255
2017-18 120172 84931
2018-19 174985 97271
2019-20 235690 148520
(Source:
Author’s compilation)
CHART -8- AVERAGE MV AND MVA OF BANKING AND FINANCIAL SERVICES(BFSI) COMPANIES
IN THE NIFTY INDEX - 2009-10 TO 2019-20
(Source: Authors compilation)
INTERPRETATION: It is observed that there is a marginal or low growth on an overall basis as regards both
MV and MVA during the years 2009-10 to 2013-14. However, we notice that both MV and MVA are growing
immensely during the years 2014-15 to 2019-20 so much so that the figures during the year 2018-19 is more
than double and nearly 3 times in terms of MV and MVA when compared to that of the year 2014-15. The
percentage of MVA in MV during all the years however ranges between 50-70%. It is observed that it was
much low during the years 2009-10 and 2010-11 which was between 35-55%. One of the main reasons for the
low share of MVA to MV during the years can be attributed to the growing and high levels of NPAs over the
years, the figures must have taken a deep dip after the pandemic set in March 2020.
TABLE - 9 - AVERAGE MV AND MVA OF SOFTWARE
COMPANIES IN NIFTY INDEX - 2009-10 TO 2017-18
Year Av. MV (Rs. Cr) Av. MVA (Rs. Cr)
2009-10 26786 20076
2010-11 43990 34905
2011-12 47203 36357
2012-13 51620 41419
0
50000
100000
150000
200000
250000
Av. MV(Rs.Cr) Av. MVA(Rs.Cr)

Dr. V. Y. John, Prathibha Menon,Saunak Pal
1104
2013-14 67375 55482
2014-15 107304 88865
2015-16 126495 101392
2016-17 157259 97342
2017-18 197810 107706
2018-19 233543 142283
2019-20 173023 105066
(Source: Author’s compilation)
CHART -9 - AVERAGE MV AND MVA OF SOFTWARECOMPANIES IN THE NIFTY INDEX - 2009-10
TO 2019-20
(Source: Author’s compilation)
INTERPRETATION: The share of MVA to MV during all the year ranges between 55 to 90%. The
companies in the software sector comprising the Nifty Index are Infosys, TCS, Tech Mahindra, Wipro Ltd and
HCL Ltd. We notice that while there is a significant increase both in terms of MV and MVA during the years on
the whole, however the period during 2011-12 to 2013-14 has somewhat low growth rate both in MVS and
MVAs and 2014-15 to 2018-19, we find a consistent and high growth rate. During the year 2019-20, we find
that there is a considerable decrease when compared to the previous year due to a marginal slowdown partly due
to the onset of the pandemic during the last quarter. All in all, it shows that the large, leading and listed
companies in this sector have contributed not only to their own growth and development, but have indeed
contributed to the growth and development of software industry across the globe in many countries and as a by-
product added significant value to the shareholders.
TABLE 10 - AVERAGE MV AND MVA OF TELECOM SERVICE
COMPANIES IN NIFTY INDEX - 2009-10 TO 2017-18
Year Av. MV(Rs.Cr) Av. MVA(Rs.Cr)
2009-10 123419 89868
2010-11 114685 74451
0
50000
100000
150000
200000
250000
Av. MV (Rs. Cr) Av. MVA (Rs. Cr)
A STUDY OF ASSOCIATION OF PROFITS AND CORPORATE GOVERNANCE WITH
SHAREHOLDERS’ VALUE OF NIFTY COMPANIES IN INDIA – 2009-10 TO 2019-20
1105
2011-12 126457 81354
2012-13 71249 37758
2013-14 75627 36299
2014-15 93616 48847
2015-16 104243 43670
2016-17 93696 39305
2017-18 107730 36430
2018-19 91942 52150
2019-20 99836 44290
(Source: Author’s
compilation)
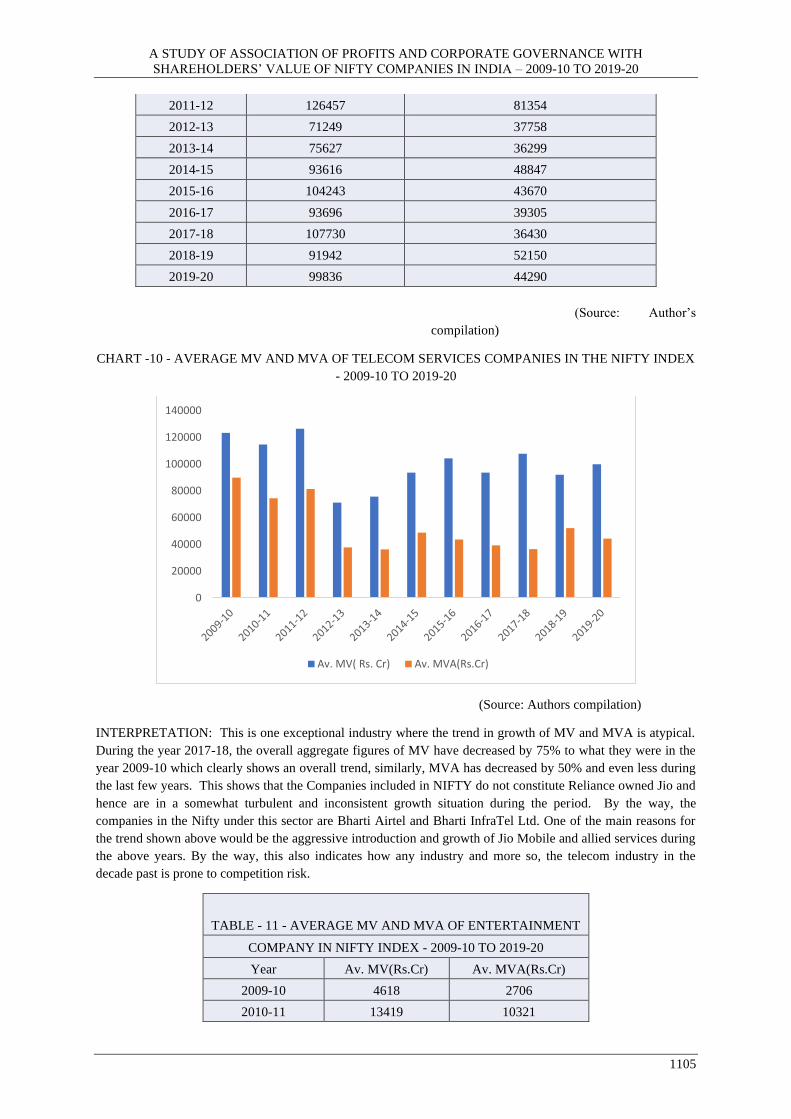
CHART -10 - AVERAGE MV AND MVA OF TELECOM SERVICES COMPANIES IN THE NIFTY INDEX
- 2009-10 TO 2019-20
(Source: Authors compilation)
INTERPRETATION: This is one exceptional industry where the trend in growth of MV and MVA is atypical.
During the year 2017-18, the overall aggregate figures of MV have decreased by 75% to what they were in the
year 2009-10 which clearly shows an overall trend, similarly, MVA has decreased by 50% and even less during
the last few years. This shows that the Companies included in NIFTY do not constitute Reliance owned Jio and
hence are in a somewhat turbulent and inconsistent growth situation during the period. By the way, the
companies in the Nifty under this sector are Bharti Airtel and Bharti InfraTel Ltd. One of the main reasons for
the trend shown above would be the aggressive introduction and growth of Jio Mobile and allied services during
the above years. By the way, this also indicates how any industry and more so, the telecom industry in the
decade past is prone to competition risk.
TABLE - 11 - AVERAGE MV AND MVA OF ENTERTAINMENT
COMPANY IN NIFTY INDEX - 2009-10 TO 2019-20
Year Av. MV(Rs.Cr) Av. MVA(Rs.Cr)
2009-10 4618 2706
2010-11 13419 10321
0
20000
40000
60000
80000
100000
120000
140000
Av. MV( Rs. Cr) Av. MVA(Rs.Cr)
Dr. V. Y. John, Prathibha Menon,Saunak Pal
1106
2011-12 12157 8727
2012-13 16350 12439
2013-14 23338 20617
2014-15 72331 58892.5
2015-16 35729 30922
2016-17 44795 38102
2017-18 51998 44433
2018-19 46774 37831
2019-20 26317 16957
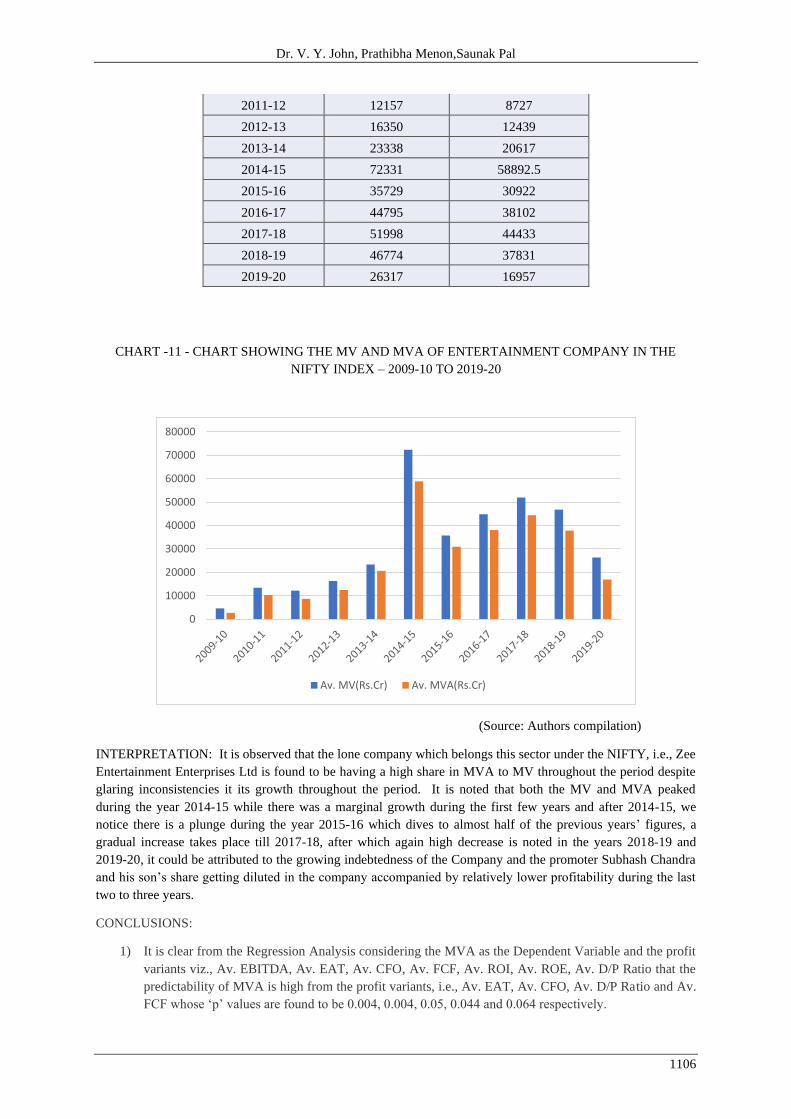
CHART -11 - CHART SHOWING THE MV AND MVA OF ENTERTAINMENT COMPANY IN THE
NIFTY INDEX – 2009-10 TO 2019-20
(Source: Authors compilation)
INTERPRETATION: It is observed that the lone company which belongs this sector under the NIFTY, i.e., Zee
Entertainment Enterprises Ltd is found to be having a high share in MVA to MV throughout the period despite
glaring inconsistencies it its growth throughout the period. It is noted that both the MV and MVA peaked
during the year 2014-15 while there was a marginal growth during the first few years and after 2014-15, we
notice there is a plunge during the year 2015-16 which dives to almost half of the previous years’ figures, a
gradual increase takes place till 2017-18, after which again high decrease is noted in the years 2018-19 and
2019-20, it could be attributed to the growing indebtedness of the Company and the promoter Subhash Chandra
and his son’s share getting diluted in the company accompanied by relatively lower profitability during the last
two to three years.
CONCLUSIONS:
1) It is clear from the Regression Analysis considering the MVA as the Dependent Variable and the profit
variants viz., Av. EBITDA, Av. EAT, Av. CFO, Av. FCF, Av. ROI, Av. ROE, Av. D/P Ratio that the
predictability of MVA is high from the profit variants, i.e., Av. EAT, Av. CFO, Av. D/P Ratio and Av.
FCF whose ‘p’ values are found to be 0.004, 0.004, 0.05, 0.044 and 0.064 respectively.
0
10000
20000
30000
40000
50000
60000
70000
80000
Av. MV(Rs.Cr) Av. MVA(Rs.Cr)

A STUDY OF ASSOCIATION OF PROFITS AND CORPORATE GOVERNANCE WITH
SHAREHOLDERS’ VALUE OF NIFTY COMPANIES IN INDIA – 2009-10 TO 2019-20
1107
2) The Regression Equation pertaining to the Composition of Directors ad the Independent Variables,
viz., the Executive, Non-Executive, Independent and Women Directors and MVA as the Dependent
Variable points to the plausible deduction that irrespective of which category of directors are at the
helm, MVA is not driven exactly by the quantity of the Directors’ composition but obviously by its
quality, as shown by the ‘p’ values, except for women directors which show a somewhat acceptable ‘p”
value of 0.041.
3) The Correlation and the Regression between the major categories of shareholders, viz., the Promoters,
FIIs(Foreign Institutional Investors) and the DIIs(Domestic Institutional Investors) indicate that the
performance of the company as measured by MVA is exogenic to these variables.
4) Conclusions made about the hypotheses made in the study are given in the table below:
TABLE 12 - CONCLUSIONS BASED
ON HYPOTHESES AND RELEVANT DATA ANALYSIS
Accepted Not Basis Degree of
Hypotheses (Alternate-1-9) Accepted Confidence
H1- MVA is positively associated with
EBITDA √ p > 0.05 90%
H2-MVA is positively associated with PAT √ p < 0.05 90%
H3-MVA is positively associated with CFOs √ p <0.05 90%
H4-MVA is positively related to FCFs √ p < 0.05 90%
H5-MVA is positively related to ROI √ p < 0.05 90%
H6-MVA is positively associated with ROE √ p > 0.05 90%
H7- MVA is positively associated with D/P
Ratio √ p < 0.05 90%
H8 – MVA is positively associated with the
proportion of prominent categories of
directors √ p > 0.05 90%
H9 – MVA is positively associated with the
important categories of Shareholders √ p > 0.05 90%
5) It is observed that the MV (Market Value/Capitalization) and more importantly MVA (Market Value
Added) are relatively quite high and consistently increasing in case of companies under Software,
FMCG and Pharmaceutical Industry prominently. These are followed by companies in the Automobile
and to some good extent in Infrastructure, Banking and Financial Services Sector.
SUGGESTIONS:
1) Company Managers, Investors and Shareholders including promoter shareholders must focus on the
Net Profits, Cash from Operations, Free Cash Flows and the Dividend Pay-out Ratios. If these are
found to consistently increase on a long-term, such shares areworthy of investment.
2) It is not the composition of different categories of Board of Directors nor the composition of various
categories of shareholders that really matter. It is rather the orientation towards high degree of
efficiency, profitability and proper risk analysis and mitigation mechanisms employed by the company
to maximize wealth to the shareholders that really matter.
3) Investors would do well to invest in shares of some of the promising companies like Infosys from
Software Sector, HUL from FMCG Sector, Dr. Reddy’s Laboratories from Pharmaceutical Sector,
Bajaj Auto from Automobile Sector and the like. Investors can rest assured with a very high degree of
probability that their wealth would be maximized in the long-term.

Dr. V. Y. John, Prathibha Menon,Saunak Pal
1108
i ET Bureau, Economic Times, “DBS Merger: LVB Shareholders Set to Contest Move to
Wipe out their Equity”, Economic Times dated 19/10/20
ii ET Bureau, Economic Times, “Independent Directors must flag governance issues before
resigning, says SEBI Chief”, Economic Times 22/10/2020.
iii Thomas Kaplan, Sheelagh McNeill (2019), The New York Times, Business RoundTable.
iv Accessible at https://www.livemint.com/opinion/online-views/shareholder-value-isn-t-past-its-sell-by-date-
as-a-corporate-goal-11602167194475.html (2020).
References:
1. Kasmin Fernandes (2020), “Biggest Corporate Governance Failures in India”, The CSR Journal, April
2020.
2. Fayad Altawalbeh (2020), “Corporate Governance Mechanisms and Firm’s Performance: Evidence
from Jordan”, Accounting and Finance Research, Vol. 9, Issue No. 2(2020), p.11-22, accessible at
https://doi.org/10.5430/afr.v9n2p11.
3. Motilal oswal, Wealth Creation Study, Thematic Study, December, 2020, accessible at MOFSL Group
(motilaloswalgroup.com).
4. Raghuram Rajan(2020), “Shareholder Value isn’t past its sell-by date as a corporate goal”, accessible
at https://www.livemint.com/opinion/online-views/shareholder-value-isn-t-past-its-sell-by-date-as-a-
corporate-goal-11602167194475.html.
5. Shanmugasundaram, S. (2019), "Internationalization and governance of Indian family-owned business
groups", Journal of Family Business Management, Vol. 10 No. 1, pp. 76-
94. https://doi.org/10.1108/JFBM-06-2019-0040
6. Dr Hari Om & Ms Sonal Goel (2017), “Analysis of Factors Affecting Stock Price
Behaviour: A Study on Listed Companies in Bombay Stock Exchange”
7. Debjiban Mukherjee (2007), “Comparative Analysis of Indian Stock Market with
International Markets”, Published in https://www.greatlakes.edu.in/pdf/DebijanMukherjee.pdf.
8. Dr Anil Soni & Dr Madhu Gaba (2015), “A Study of Dividend Patterns of Nifty
Companies”, Published in http://ijrbsm.org/pdf/v2-i6/1.pdf
9. Merugu Venugopal, Ravindar Reddy M., Bhanu Prakash Sharma G.(2019). Shareholder value creation:
A Review of the Theoretical and Empirical Literature, Asia Pacific Journal of Management Research
and Innovation, Volume: 14 issue: 3-4, page(s): 74-80.
10. Altaf, N. (2016). Economic value added or earnings: What explains market value in Indian
firms? Future Business Journal, 2(2), 152–166.
11. Kouki, Marouan & Moez, Dabboussi. (2015). Impact of Corporate Governance on Shareholder Value
Creation: Evidence from Tunisian Context. International Business Research. 8. 10.5539/ibr.v8n5p262.
12. Julija Bistrova et al (2014), “Sustainable shareholder value: analysis of value drivers”, Economics and
Management, Volume 19, Issue 2 available at www.doi.org/10.5755/j01.em.19.2.3601
13. Julia Bistrova and Natalja Lace (2012), “Defining Key Factors to Sustain Maximum Shareholder
Value”, Journal of Financial Studies & Research, IBIMA Publishing available at

A STUDY OF ASSOCIATION OF PROFITS AND CORPORATE GOVERNANCE WITH
SHAREHOLDERS’ VALUE OF NIFTY COMPANIES IN INDIA – 2009-10 TO 2019-20
1109
http://www.ibimapublishing.com/journals/JFSR/jfsr.html Vol. 2012 (2012), Article ID 391928, 14
pages DOI: 10.5171/2012.391928.
14. Dr G Shanmugasundram & Dr John Benedict (2013), “Volatility of the Indian Sectoral Indices- A
Study with reference to National Stock Exchange”, Published
in http://indianresearchjournals.com/pdf/IJMFSMR/2013/August/1.pdf
15. Suresh V.N., (2012), “Corporate Governance practices of Listed Companies in India”. IOSR Journal of
Business and Management, Volume 6, Issue 3, p.1 – 11.
16. Hall, J.H. (2016), "Industry-specific determinants of shareholder value creation", Studies in Economics
and Finance, Vol. 33 No. 2, pp. 190-208. https://doi.org/10.1108/SEF-08-2014-0155
17. Jessica Comitto (2011), “Finding enhanced shareholder value using ‘Free Cash Flow’”, Investing
Strategies.
18. Michael J. Mauboussin (2013), “What Shareholder value is really about” available on
http://blogs.hbr.org/cs/2011/10/ceos_must_understand_what_crea.html.
19. El Mir, A. and Seboui, S. (2008), "Corporate governance and the relationship between EVA and
created shareholder value", Corporate Governance, Vol. 8 No. 1, pp. 46-
58. https://doi.org/10.1108/14720700810853392
20. Rappaport, Alfred. (2006), “Ten Ways to Create Shareholder Value.” Harvard business review. Sep
2006, p. 66-77.