A STUDY OF AIRBAG DESIGN AND OPTIMIZATION METHODOLOGY...
13
Park 1 A STUDY OF AIRBAG DESIGN AND OPTIMIZATION METHODOLOGY Wonsuk Park General Motors USA Paper Number 17-0365 ABSTRACT The frontal airbag in a vehicle is considered a supplemental restraint to the safety belt restraint system and is important in lowering measured injury assessment values for Anthropomorphic Test Devices (ATD) during vehicle crash testing. Neck injuries for the right front passenger occupant are especially sensitive to the passenger airbag (PAB) shape. Therefore, multiple sled tests and Computer Aided Engineering (CAE) simulations are required for PAB development to arrive at a balanced restraint system and achieve optimal performance for occupant injury metrics. The purpose of this study is to establish a design procedure and optimization process for passenger airbags by using CAE techniques to minimize development time. In this study, a design method to create a new baseline airbag is introduced. Surrogate sled CAE models were generated to make efficient use of computing resource availability. Validation of CAE surrogate models was performed using sled tests. A direct optimization method, not meta-model based, was developed for airbag shape optimization across multiple load cases. Parameterized airbag shape and morphing techniques were used in the optimization. The objective function is US-NCAP performance, however, major injury criteria from FMVSS208 (belted and unbelted) as well as airbag volume were used as constraint conditions. All optimization processes were automated, and airbag shape is optimized per objective functions and constraint conditions. Additionally, different optimization algorithms were compared to find the most efficient method for airbag design. INTRODUCTION Since the current USNCAP rating protocol was introduced in 2007 [6], passenger side frontal airbag (PAB) design for the US market is more challenging compared to driver side airbag design. This is because the Hybrid III 5 th percentile female occupant Anthropomorphic Test Device (ATD) is used for passenger side frontal US-NCAP injury ratings, and it is more sensitive to injury, especially neck injury, than the Hybrid III 50 th percentile male ATD when considering airbag design. Traditional methods such as 5”-30 ms criterion are freqently used for airbag design without CAE analysis [7]. However, airbag design should consider many factors simultaneously, such as vehicle pulse, interior trim design, safety belt sytem, airbag inflator etc. A good starting point is critical to achieve balnced performance in airbag design for different load cases while minimizing development time. In this study, a design method for frontal passenger airbag using CAE techniques is introduced. CAE models representing sled bucks were built for use in developing belted and unbelted occupant performane, and validation work was performed using physical tests. A new baseline airbag model was incorporated into these sled models for the next optimization process. A parametric airbag shape optimization method was developed considering multiple loading conditions. Several optimization algorithms were used and compared for airbag shape optimization. MODELING AND AIRBAG DESIGN CAE models, LS-DYNA [5], were used to export ATD positions for base line airbag design with proposed target time to fire (TTF). Simplified sled models, which have rigid instrument panel (I/P) trim, were built for this purpose. When the corresponding full-vehicle CAE model became available, a detailed occupant sled model was built again, and validation work was performed considering available data from tests. Sled tests were performed with airbag hardware which were proposed by the airbag supplier. Therefore, this supplier’s airbag was replaced in CAE models by the baseline airbag in order to perform airbag shape optimization. Simplified sled models for airbag design Full vehicle CAE model with interior components such as I/P, A-Pillar, roof trim are not usually available in the early stage of vehicle development. The show surfaces (A-surface) of trim components
Transcript of A STUDY OF AIRBAG DESIGN AND OPTIMIZATION METHODOLOGY...

Park 1
A STUDY OF AIRBAG DESIGN AND OPTIMIZATION METHODOLOGY Wonsuk Park General Motors USA Paper Number 17-0365 ABSTRACT The frontal airbag in a vehicle is considered a supplemental restraint to the safety belt restraint system and is important in lowering measured injury assessment values for Anthropomorphic Test Devices (ATD) during vehicle crash testing. Neck injuries for the right front passenger occupant are especially sensitive to the passenger airbag (PAB) shape. Therefore, multiple sled tests and Computer Aided Engineering (CAE) simulations are required for PAB development to arrive at a balanced restraint system and achieve optimal performance for occupant injury metrics. The purpose of this study is to establish a design procedure and optimization process for passenger airbags by using CAE techniques to minimize development time. In this study, a design method to create a new baseline airbag is introduced. Surrogate sled CAE models were generated to make efficient use of computing resource availability. Validation of CAE surrogate models was performed using sled tests. A direct optimization method, not meta-model based, was developed for airbag shape optimization across multiple load cases. Parameterized airbag shape and morphing techniques were used in the optimization. The objective function is US-NCAP performance, however, major injury criteria from FMVSS208 (belted and unbelted) as well as airbag volume were used as constraint conditions. All optimization processes were automated, and airbag shape is optimized per objective functions and constraint conditions. Additionally, different optimization algorithms were compared to find the most efficient method for airbag design. INTRODUCTION Since the current USNCAP rating protocol was introduced in 2007 [6], passenger side frontal airbag (PAB) design for the US market is more challenging compared to driver side airbag design. This is because the Hybrid III 5th percentile female occupant Anthropomorphic Test Device (ATD) is used for passenger side frontal US-NCAP injury ratings, and it is more sensitive to injury, especially neck injury, than the Hybrid III 50th percentile male ATD when considering airbag design. Traditional methods such as 5”-30 ms criterion are freqently used for airbag design without CAE analysis [7]. However, airbag design should consider many factors simultaneously, such as vehicle pulse, interior trim design, safety belt sytem, airbag inflator etc. A good starting point is critical to achieve balnced performance in airbag design for different load cases while minimizing development time. In this study, a design method for frontal passenger airbag using CAE techniques is introduced. CAE models representing sled bucks were built for use in developing belted and unbelted occupant performane, and validation work was performed using physical tests. A new baseline airbag model was incorporated into these sled models for the next optimization process. A parametric
airbag shape optimization method was developed considering multiple loading conditions. Several optimization algorithms were used and compared for airbag shape optimization.
MODELING AND AIRBAG DESIGN
CAE models, LS-DYNA [5], were used to export ATD positions for base line airbag design with proposed target time to fire (TTF). Simplified sled models, which have rigid instrument panel (I/P) trim, were built for this purpose. When the corresponding full-vehicle CAE model became available, a detailed occupant sled model was built again, and validation work was performed considering available data from tests. Sled tests were performed with airbag hardware which were proposed by the airbag supplier. Therefore, this supplier’s airbag was replaced in CAE models by the baseline airbag in order to perform airbag shape optimization. Simplified sled models for airbag design Full vehicle CAE model with interior components such as I/P, A-Pillar, roof trim are not usually available in the early stage of vehicle development. The show surfaces (A-surface) of trim components

Park 2
were extracted from CAD and defined as rigid parts. Simplified CAE sled models were built incorporating these rigid trim components for the purpose of generating a baseline airbag design. Figure 1 shows these rigid trim parts, for example, I/P, windshield, and A-pillar trim. Rigid-to-rigid contact [5] with a force based function was defined to characterize contact between the ATD and rigid I/P trim. Figure 2 shows a simplified sled model of the belted 5th ATD which was used for airbag design. Airbag door and tear seam were not considered in this model.
Figure 1. Isometric view for rigid trim parts
Figure 2. Simplified belted 5th sled model Vehicle pulse and dummy positions The X-component of vehicle pulse was extracted from full vehicle structure models for 40kph and 56kph full frontal loading conditions. Vehicle pitching and rocker drop were not considered in order to maintain consistency to sled tests. Next, occupant analysis with simplified sled models was performed for 40kph and 56kph full
frontal loading conditions with 5th & 50th ATDs. The airbag was not deployed, but the safety belt system was present and engaged for the belted ATDs. The design H-points of occupants were set according to the design specified seat travel window, because actual measurements of occupant positions in hardware were not available at that time. Typically, actual measured occupant seating positions are preferred for airbag design. Then, ATD positions for 40kph unbelted 5th & 50th and 56kph belted 5th & 50th were extracted along with the target time-to-fire (TTF) for the airbags. For instance, assuming 35ms as passenger side airbag fully deployment time, the target TTF of airbag is 18ms for 40kph full frontal impact. When ATD travels in free-flight for a total of 53ms (= 35ms + 18ms), the airbag is supposed to be fully deployed. Subsequently, ATD positions are extracted for use in deciding the desired depth of the airbag (longitudinal direction). Figure 3 shows an example of extracted ATD positions for both 5th and 50th percentile occupants from different loading conditions.
Figure 3. Example of extracted dummy positions
Airbag design The intent is to design the PAB profile according to the vehicle environment and the extracted ATD positions. The width of the airbag (horizontal direction) can be decided by the vehicle A-Pillar. If there is too much interaction between the airbag and A-Pillar, the airbag can be skewed and/or rotated. If the airbag doesn’t cover the A-Pillar well, the possibility of hard contact between the occupant head and A-Pillar will increase for the 30° right angular loading condition. The airbag should also fit well considering the windshield and
Park 3
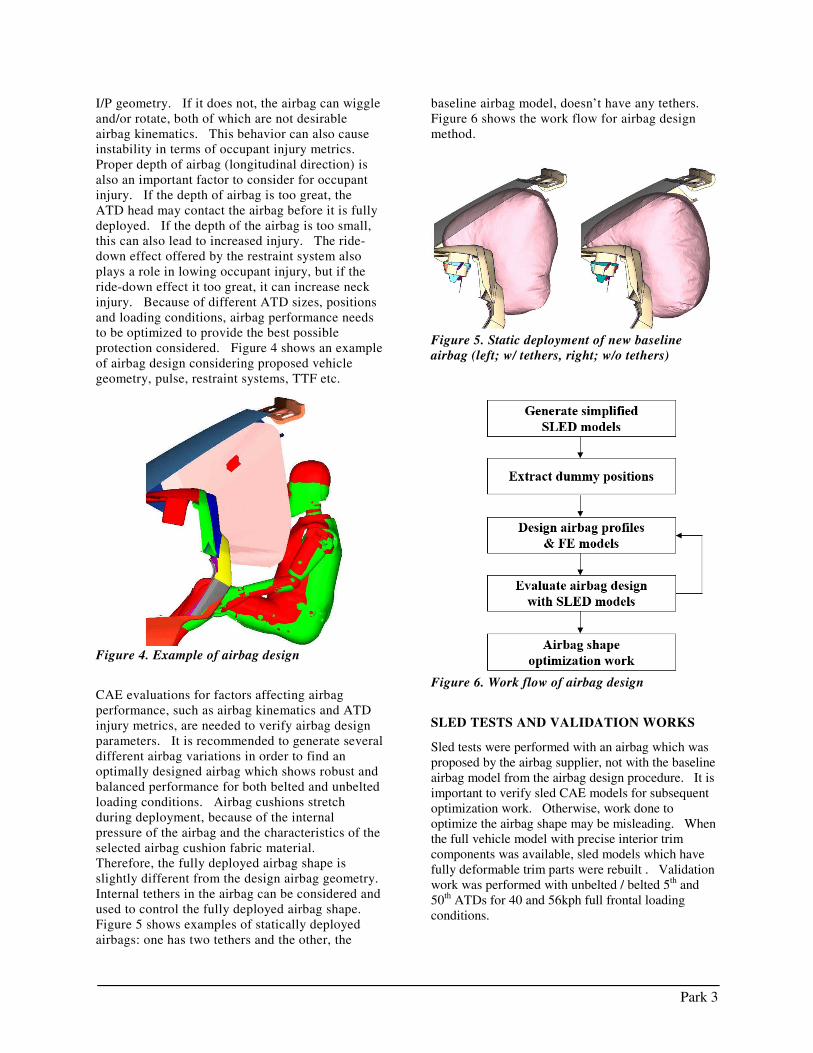
I/P geometry. If it does not, the airbag can wiggle and/or rotate, both of which are not desirable airbag kinematics. This behavior can also cause instability in terms of occupant injury metrics. Proper depth of airbag (longitudinal direction) is also an important factor to consider for occupant injury. If the depth of airbag is too great, the ATD head may contact the airbag before it is fully deployed. If the depth of the airbag is too small, this can also lead to increased injury. The ride-down effect offered by the restraint system also plays a role in lowing occupant injury, but if the ride-down effect it too great, it can increase neck injury. Because of different ATD sizes, positions and loading conditions, airbag performance needs to be optimized to provide the best possible protection considered. Figure 4 shows an example of airbag design considering proposed vehicle geometry, pulse, restraint systems, TTF etc.
Figure 4. Example of airbag design
CAE evaluations for factors affecting airbag performance, such as airbag kinematics and ATD injury metrics, are needed to verify airbag design parameters. It is recommended to generate several different airbag variations in order to find an optimally designed airbag which shows robust and balanced performance for both belted and unbelted loading conditions. Airbag cushions stretch during deployment, because of the internal pressure of the airbag and the characteristics of the selected airbag cushion fabric material. Therefore, the fully deployed airbag shape is slightly different from the design airbag geometry. Internal tethers in the airbag can be considered and used to control the fully deployed airbag shape. Figure 5 shows examples of statically deployed airbags: one has two tethers and the other, the
baseline airbag model, doesn’t have any tethers. Figure 6 shows the work flow for airbag design method.
Figure 5. Static deployment of new baseline airbag (left; w/ tethers, right; w/o tethers)
Figure 6. Work flow of airbag design
SLED TESTS AND VALIDATION WORKS
Sled tests were performed with an airbag which was proposed by the airbag supplier, not with the baseline airbag model from the airbag design procedure. It is important to verify sled CAE models for subsequent optimization work. Otherwise, work done to optimize the airbag shape may be misleading. When the full vehicle model with precise interior trim components was available, sled models which have fully deformable trim parts were rebuilt . Validation work was performed with unbelted / belted 5th and 50th ATDs for 40 and 56kph full frontal loading conditions.
Park 4
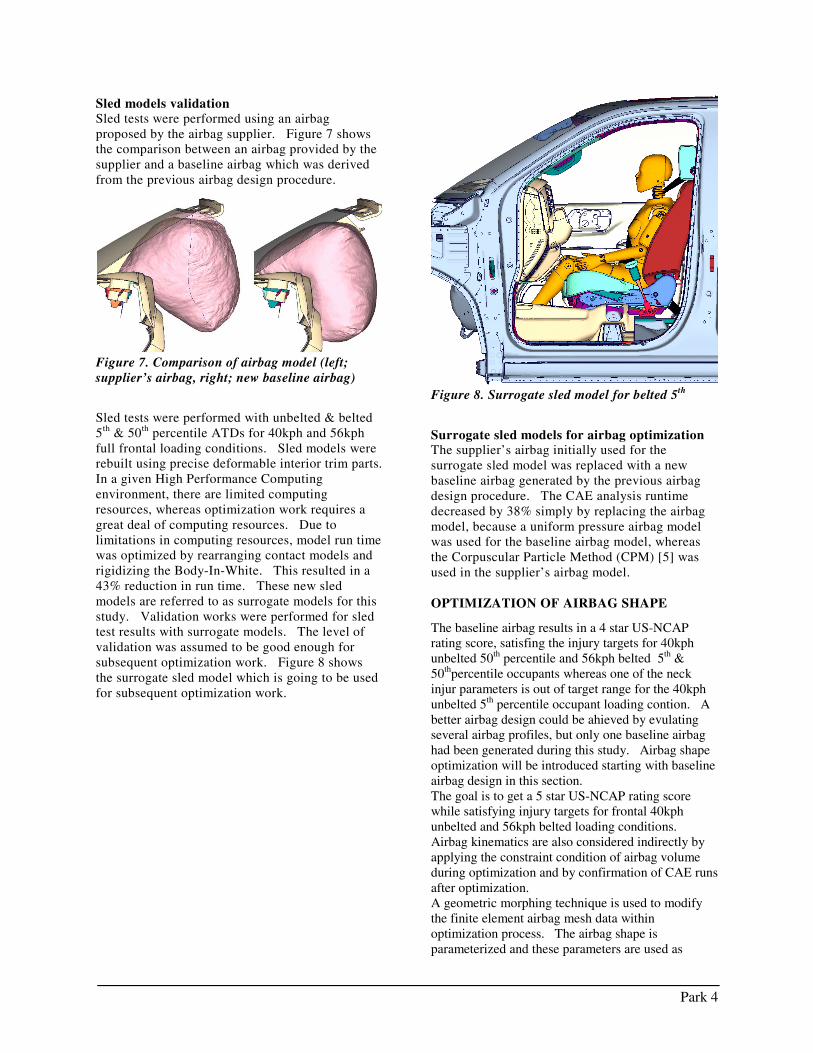
Sled models validation Sled tests were performed using an airbag proposed by the airbag supplier. Figure 7 shows the comparison between an airbag provided by the supplier and a baseline airbag which was derived from the previous airbag design procedure.
Figure 7. Comparison of airbag model (left; supplier’s airbag, right; new baseline airbag)
Sled tests were performed with unbelted & belted 5th & 50th percentile ATDs for 40kph and 56kph full frontal loading conditions. Sled models were rebuilt using precise deformable interior trim parts. In a given High Performance Computing environment, there are limited computing resources, whereas optimization work requires a great deal of computing resources. Due to limitations in computing resources, model run time was optimized by rearranging contact models and rigidizing the Body-In-White. This resulted in a 43% reduction in run time. These new sled models are referred to as surrogate models for this study. Validation works were performed for sled test results with surrogate models. The level of validation was assumed to be good enough for subsequent optimization work. Figure 8 shows the surrogate sled model which is going to be used for subsequent optimization work.
Figure 8. Surrogate sled model for belted 5th
Surrogate sled models for airbag optimization The supplier’s airbag initially used for the surrogate sled model was replaced with a new baseline airbag generated by the previous airbag design procedure. The CAE analysis runtime decreased by 38% simply by replacing the airbag model, because a uniform pressure airbag model was used for the baseline airbag model, whereas the Corpuscular Particle Method (CPM) [5] was used in the supplier’s airbag model. OPTIMIZATION OF AIRBAG SHAPE
The baseline airbag results in a 4 star US-NCAP rating score, satisfing the injury targets for 40kph unbelted 50th percentile and 56kph belted 5th & 50thpercentile occupants whereas one of the neck injur parameters is out of target range for the 40kph unbelted 5th percentile occupant loading contion. A better airbag design could be ahieved by evulating several airbag profiles, but only one baseline airbag had been generated during this study. Airbag shape optimization will be introduced starting with baseline airbag design in this section. The goal is to get a 5 star US-NCAP rating score while satisfying injury targets for frontal 40kph unbelted and 56kph belted loading conditions. Airbag kinematics are also considered indirectly by applying the constraint condition of airbag volume during optimization and by confirmation of CAE runs after optimization. A geometric morphing technique is used to modify the finite element airbag mesh data within optimization process. The airbag shape is parameterized and these parameters are used as

Park 5
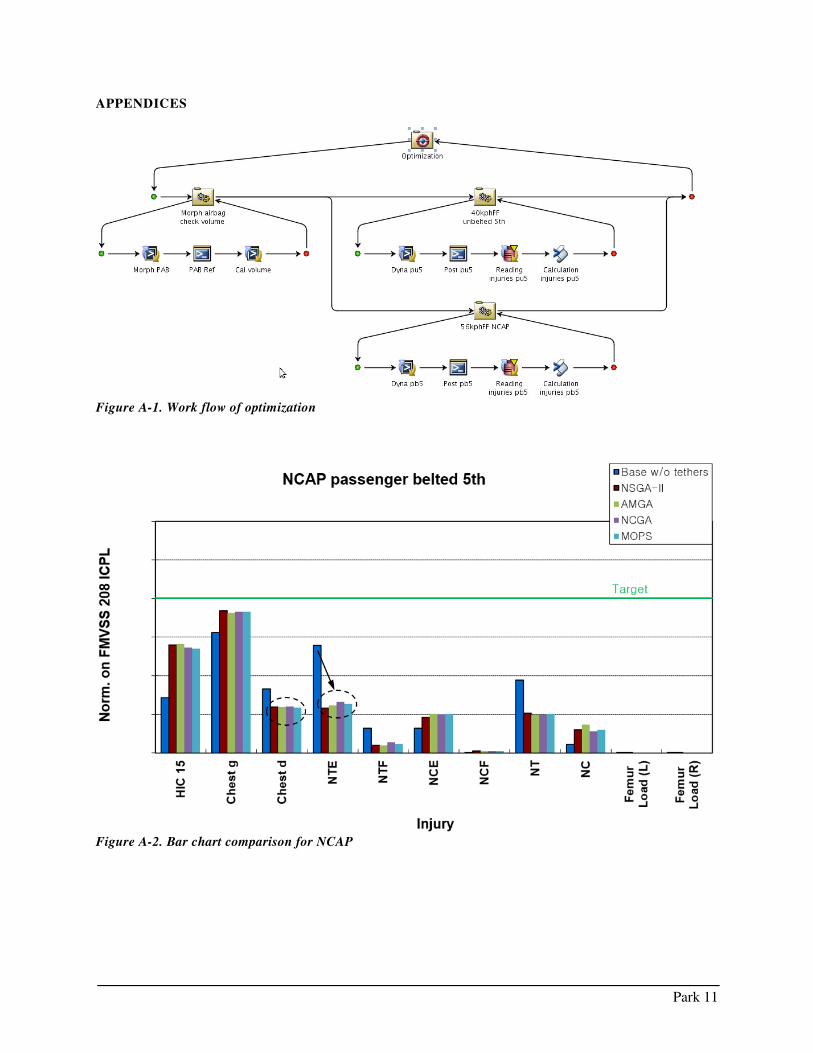
control factors for the optimization process. Noise factors are not considered because robustness is not covered in this study. The concept of airbag shape optimization is similar to topology optimization. Therefore, a direct optimization method, not a meta-model based method, is chosen. Evolution Alogorithms (EA) including Gentic Algorithms (GA) are used and compared in this optimization scheme. Figure A-1 in the appendix shows the work flow of the optimization process.
Loading conditions Sled tests and validated CAE models showed that the most vulnerable loading condition is frontal 40kph unbelted 5th percentile for this particular case. Neck injury is relatively high for 40kph unbelted 5th percentile when compared to other loading conditions. Optimization work requires significant computational resources. Therefore, the most vulnerable loading condition, i.e. 40kph unbelted 5th percentile, and US-NCAP loading condition, i.e. 56kph belted 5th percentile are chosen for optimization work with the goal of saving computational resources. Both models are concurrently evaluated during airbag shape optimization.
Control factors A geometric morphing technique is used to modify the airbag finite element mesh data. The airbag shape was parameterized by defining 5 factors which were used in morphing airbag mesh data. Width (horizontal direction) and height (vertical direction) of the airbag are not considered in this parameterizing scheme for airbag shape, because these design factors are decided by the vehicle geometry as noted in the airbag design section. Figure 9 shows parameters for morphing the airbag shape. The response of ATDs are affected not only by airbag shape, but also by airbag internal pressure. The vent size of the airbag is considered in order to compensate for the effect of changing airbag pressure.
Figure 9. Parameters for morphing airbag
Objective conditions The goal is to achieve a 5 star US-NCAP rating score, while satisfying injury targets for major frontal loading conditions per the US FMVSS 208 regulation. The US-NCAP rating score consists of head, neck, chest, and femur injuries for the frontal impact loading condition, and all of these injuries are combined as “joint probability of injury (Pjoint)” [6]. Figure 10 shows that CAE results for sled with an airbag proposed by the airbag supplier suggest the following:
• The probability of neck injuries is the most important factor on NCAP.
• The second factor is the probability of chest injury.
• The probability of head injury is much smaller than neck and chest injury.
• The probability of femur injury is much smaller than neck and chest injury.
Neck injury is also possible for the frontal 40kph unbelted 5th loading condition. These sled results suggest that one of the major areas of injury is the occupant’s neck. Therefore two objective functions are defined in this optimization process, one is “probability of neck injury (Pneck)” and the other is “joint probability of injury (Pjoint)”. A weighting factor of 0.5 (W1) was applied for probability of neck injury, whereas a weighting factor of 1.0 (W2) was applied for joint probability of injury to give more priority on NCAP performance in (Equation 1).

Park 6
Figure 10. Comparison for probability of injury on NCAP rating score (Pjoint)
21 int)()( WPjoWPObjective neck += (Equation 1)
Constraint conditions
All injury criteria from FMVSS 208 were chosen for use as constraints. A specific margin of safety was added to injury criteria and then these factors with margin were set as the constraint conditions. There were two different inflators for this vehicle program at its starting point. One of them was chosen per the airbag supplier’s recommendation. The gas molar output of the inflator is one of the characteristics used to decide desired airbag volume. If the airbag volume is too large for specific molar output, the airbag may not deploy well at its target time and may also cause bag slap on the ATD, which is characteristic of undesirable airbag kinematics. The molar output of the inflator used in this work is around 2.8 mole. Therefore, 115ℓ was assumed as the upper limit of airbag volume. Script programs were developed to calculate airbag volume. Solid elements are generated by using shell elements from the reference airbag mesh data. The volume is measured using solid elements, but this measured volume is not the same as predicted volume because the airbag cushion is stretched and its actual volume is larger than measured volume. Static airbag deployments were performed and volume was compared between CAE and physically measured volume, also the specific scaling factor was derived. Predicted airbag volume is achieved by multiplying the scaling factor with measured volume. Predicted airbag volume is compared to the upper limit of airbag volume in the optimization process as a constraint condition.
Optimization algorithms Occupant analysis have non-linearity. Gradient base methods don’t work well for global optimization and non-linearity problems [11]. The concept of airbag shape optimization is similar to topology optimization and nonlinear program techniques such as genetic algorithms can work well for shape optimization. Therefore, exploratory (heuristic search) methods such as NSGA-II, AMGA, NCGA and MOPS were considered with multi objective functions in this study. NSGA-II (Non-Dominated Sorting Genetic Algorithm) K. Deb proposed NSGA-II to improve NSGA. A non-dominance sorting method was used in ranking population, and a crowding distance parameter was added to the fitness value for better diversity. Elitism was incorporated to share the optimal parameter value. It doesn’t need user-defined parameter for maintaining diversity. This is much more efficient than NSGA [1]. Real parameter for mutation operator (polynomial) was used [3].
AMGA (Archive-based Micro Genetic Algorithm) S. Tiwari proposed a novel new genetic algorithm. This algorithm use Pareto ranking from NSGA-II for individual selection. AMGA have two fitness assignment mechanism, one is primary fitness by ranking and the other is based on the diversity of the solutions in the entire population, instead of crowding distance operator from NSGA-II. AMGA update the elite population such as archive and designed for a small population size by through archive of good solutions obtained. “It is recommended to use a large size for the archive. Because the actual time needed by the optimizer algorithm is negligible comparing to the time needed by the analysis routines for computationally expensive optimization problems” [9].
NCGA (Neighborhood Cultivation Genetic Algorithm) S. Watanabe proposed this new Genetic Algorithm in 2002. Individuals of parent are sorted according to focused objective and the objective is changed for generations. This algorithm incorporates a neighborhood cultivation crossover mechanism. When crossover operations are performed, individuals are chosen which are close to each other rather than randomly chosen. Therefore, precise exploitation is expected. It also uses an archive and updates for each generation. Binary parameters were used for crossover and mutation operator [10].

Park 7
PSO (Particle swarm) J. Kennedy introduced Particle Swarm Optimization in 1995 [4]. It simulates social behavior of animal groups, such as flocks of birds. Animals tend to follow neighbors who are closer to food. The best position (pbest - particle best) encountered by a particle and its neighbors (gbest - global best) is used for next position of particle. Each particle is given an initial velocity and it accelerates by distance to find a solution. PSO generates population for each generation like genetic algorithms, but there is no evolution operator such as crossover and mutation. A stochastic variable called craziness was introduced to avoid settling on unanimous and unchanging direction. Y. Shi proposed a modified PSO in 1998, a parameter of inertia weight was incorporated into original PSO [8]. MOPS (Multi-Objective Particle Swarm) was used in this study. “Any point in the Pareto set is a candidate as leader and the leader for particle is randomly selected from Pareto set based on the crowding distance” [3]. Parameters for each type of algorithm are used according to suggested values by application [3]. The same population size was maintained for all the algorithms. For NSGA-II, the size of the population = 12, crossover probability = 0.9, crossover distribution index = 10, mutation distribution index = 20. For AMGA, the maximum allowed size for archive = 96, crossover probability = 0.9, mutation probability = 0.5, crossover distribution index = 10, mutation distribution index = 20. For NCGA, gene size = 60, crossover rate = 1.0, mutation rate = 0.01. For MOPS, inertia = 0.9, increment for global & particle = 0.9, maximum velocity = 0.1
RESULTS Figure 11 show the comparison between baseline airbag and optimized airbag shape (reference geometry mesh data). All of the optimization algorithms successfully found solutions. Neck and chest injuries were lowered, head injury was increased slightly, but the probability of head injury was still less than 2.3% in Table-1. Joint probability of injury (Pjoint) was lowered and NCAP performance was improved. Figure 12 show the bar chart comparison. The baseline airbag indicates that the probability of neck injury is 10.6%, whereas the probability of head injury is only 0.2% in Figure 12 and Table 1.
This means that the major injury mechanism is neck injury. Therefore better performance can be achieved by lowering neck injury and/or trading off with head injury from optimized airbag.
Figure 11. Comparison of airbag geometry (blue: base, red: NSGA-II, green: AMGA, purple: NCGA, cyan: MOPS)
Figure 12. Bar chart comparison for NCAP Table 1. Comparison of results

Park 8
Optimized airbags have two concave shapes (upper and lower) on the front panel of the airbag for the head and chest contact area. It seems that the upper concave shape decreases neck injuries with slightly increased head injury, and the lower concave shape decreases chest deformation injury. Figure 13 show that the volume of optimized airbags was less than 110 liters, these airbag satisfied the constraint of volume (less than 115 liters). The volume of the new airbag is not much different from baseline airbag. All of the optimized airbags show similar performance. NSGA-II and MOPS found slightly better airbag for USNCAP. Figure 14 shows a comparison of static deployment between the baseline and optimized airbags. Figure A-2 and A-3 in appendix show a bar chart comparison of injuries for NCAP and 40kph unbelted 5th loading conditions. Confirmation CAE runs were performed to ensure airbag design works for other loading conditions which were not included in optimization process. These CAE results show that all injury measures meet the targets.
Figure 13. Comparison of airbag volume from static CAE analysis
Figure 14. Comparison of static deployed airbag (left: baseline, right: optimized airbag by MOPS)
There were several performance indicators identified to evaluate the optimization algorithm. “Generally, multi-objective problem has three primary goals. The first, fast convergence to the Pareto frontier solution. The second, close proximity to the Pareto frontier solution. The third, diversity and even dispersion of the obtained non-dominated solutions along the Pareto optimal front” [2]. The objective functions do not fight each other in this optimization work. Small number of populations and generation were used, because analysis time is too heavy. Therefore, the Pareto frontier graph is not completely clear, and absolute Pareto frontier is not known. One of purpose of this study is comparing airbag design by using different optimization algorithm, not evaluation of the algorithm itself. So, optimization algorithms are compared in practical ways in order to determine which optimization methods may fit well for airbag shape optimization. The scatter plot and the history plot between objective functions are considered as an indication of proximity and convergence to solution for each optimization algorithm in this study. The scatter and history plot for the objective functions are shown in Figure A-4 through A-7 in appendices. The red dots indicate infeasible runs, black dots indicate feasible runs, and a green dot indicates the best solution. Blue dots, which are shown only in AMGA, is for the Pareto frontier, but the Pareto optimal front is not determined clearly, as was mentioned before. Smaller windows for scatter plots were defined, and the number of feasible runs are counted in order to determine of proximity in Table 2. NCGA and NSGA-II seems to show better proximity than AMGA and MOPS based on the scatter plot and Table 2. It is difficult to determine the convergence from the history plot. MOPS and AMGA found the best solution around 50th run, whereas NSGA-II and NCGA found it around 90th run in Table 2. For AMGA, and attempt was made to increase the archive size was from 12 to 96 to find a better solution, but significant improvement was not noticed. The off-spring population is half of its parent population and indicates the actual number of CAE runs for each generation is half of the other algorithm. It would be interesting to check the results by increasing the parent population for future studies.

Park 9
NCGA shows precise exploitation as was expected [10]. The possible number for mutation rate is 0 ~ 1.0, but 0.01 was used in this study. Additional study is needed to check for better convergence by increasing this mutation rate. MOPS found the solution at the 52th run, but it does not show superior proximity. MOPS also does not have a mutation operator like the Genetic algorithms. Instead, MOPS provides velocity and inertia parameters. This algorithm provides the user with simple parameters, and can be used for both single and multi-objective optimization. MOPS seems to work well for occupant analysis, but further studies are required. Table 2. Comparison of number of feasible runs
CONCLUSIONS In this paper, a design method for passenger side frontal airbag and parametric airbag shape optimization were presented. A-Surfaces of CAD models for a specific vehicle were used for airbag design, because a full CAE model was not available at the early stage of vehicle development. When a full vehicle CAE model was available, occupant sled models were built (surrogate models) and validation work was performed to verify sled models with tests. Parametric airbag shape optimization was developed with multi-loading conditions by using a commercial tool [3]. NSGA-II, AMGA, NCGA and MOPS algorithms were used and compared in this study. All of the optimization algorithms used successfully found a solution without violating constraint conditions. Each algorithm was compared and the following observations were made:
• NSGA-II works well for occupant simulation.
• AMGA works well, even though the population of off-spring is half of its parent population.
• NCGA show precise exploitation. Each objective function is treated seperately. It
can be used for both single and multi-objective problem. However, it only provides binary parameters for evolution operators, whereas other GAs provide real parameters
• MOPS provides simple parameters, which make it easy for the user, and flexibility for single and multi-objective problem. It worked well to find a soultion for occupant simulation.
MOPS is efficient to find a solution in airbag shape optimization. The advantage of MOPS is that there are few parameters that need to be adjusted and it is easy to implement. It use the crowding distance for diversity and works well for both single and multi-objective optimization. Further study are needed to test the ability of MOPS. The Work flow of optimization is summarized in Figure 15. Actual hardware for the airbag generated can be manufactured based on optimized airbag geometry. Additionally, 2D geometry lines are extracted from optimized airbag geometry for demonstration purposes. CAD drawings for sewing and cut-sections can be generated by using these 2D geometry lines. Figure 16 shows extracted 2D geometry lines for CAD drawings. This study presents an airbag design method and airbag shape optimization using CAE techniques. These methods will work well for other regulations and/or consumer metrics used in the global automotive industry through changing loading conditions, constraint conditions and objective functions.

Park 10
Figure 15. Work flow of airbag shape optimization
Figure 16. Extracted 2D geometry lines for airbag CAD drawings (sewing lines)
REFERENCES [1] Deb, K., Agrawal, S., Pratap, A., Meyarivan, T. 2002 “A fast elitist non-dominated sorting genetic algorithm for multi-objective optimization: NSGA-II”. IEEE Transactions of evolutionary computation, Vol. 6, No. 2 [2] Eskandari, H., Geiger, C., Lamont, G., 2007 “FastPGA: A dynamic population sizing approach for solving expensive mutiobjective optimization problems” In Evolutionary multiobjective optimization conference 141-155 [3] Isight user’s manual, version 5.9 [4] Kennedy, J., Eberhart, R., 1995 “Particle Swarm Optimization” In Proceedings IEEE int’l conference on neural networks, Vol. IV, 1942-1948 [5] LS-DYNA user’s manual, version 7.1 [6] Docket no. NHTSA-2006-26555, www.regulations.gov [7] Matthew H. 2002 “Vehicle crash mechanics” CRC Press LLC [8] Shi, Y., Eberhart, R., 1998 “A Modified Particle Swarm Optimizer” In Proceedings IEEE int’l conference on evolutionary computation 69-73 [9] Tiwari, S., Koch, P., Fadel, G., Deb, K. 2008 “AMGA: An Archive-based Micro Genetic Algorithm for Multi-objective Optimization” In: Proceedings Genetic and Evolutionary Computation conference (GECCO-2008), 729-736 [10] Watanabe, S., Hiroyasu, T., Miki, M., 2002 “NCGA: Neighborhood Cultivation Genetic Algorithm for Multi-Objective Optimization Problems” In Proceedings of the genetic and evolutionary computation conference Late Breaking Papers, 458-465 [11] Weise, T. 2009. “Global Optimization Algorithms - Theory and Application“ e-book 2nd Edition
Park 11
APPENDICES
Figure A-1. Work flow of optimization
Figure A-2. Bar chart comparison for NCAP

Park 12
Figure A-3. Bar chart comparison for 40kphFF unbelted 5th
Figure A-4. Scatter & history plot for NSGA-II

Park 13
Figure A-5. Scatter & history plot for AMGA
Figure A-6. Scatter & history plot for NCGA
Figure A-7. Scatter & history plot for MOPS


![IGLAD - INTERNATIONAL HARMONIZED IN-DEPTH ACCIDENT …indexsmart.mirasmart.com/25esv/PDFfiles/25ESV-000248.pdf · crash phase in IGLAD [5]. The resulting pre-crash matrix contains](https://static.fdocuments.us/doc/165x107/5ec7dd660c03b81237121241/iglad-international-harmonized-in-depth-accident-crash-phase-in-iglad-5-the.jpg)