A STUDY OF 2-STROKE MARINE DIESEL ENGINE ...
39
A STUDY OF 2-STROKE MARINE DIESEL ENGINE CHARACTERISTIC BASED ON CONDITION BASED MAINTENANCE MOHD NAIM BIN AWANG A project report submitted in fulfilment of the requirement for the award of the Degree of Master of Mechanical Engineering Faculty of Mechanical and Manufacturing Engineering Universiti Tun Hussein Onn Malaysia JULY 2015
Transcript of A STUDY OF 2-STROKE MARINE DIESEL ENGINE ...
A STUDY OF 2-STROKE MARINE DIESEL ENGINE CHARACTERISTIC
BASED ON CONDITION BASED MAINTENANCE
MOHD NAIM BIN AWANG
A project report submitted in fulfilment of the requirement for the award of
the Degree of Master of Mechanical Engineering
Faculty of Mechanical and Manufacturing Engineering
Universiti Tun Hussein Onn Malaysia
JULY 2015
v
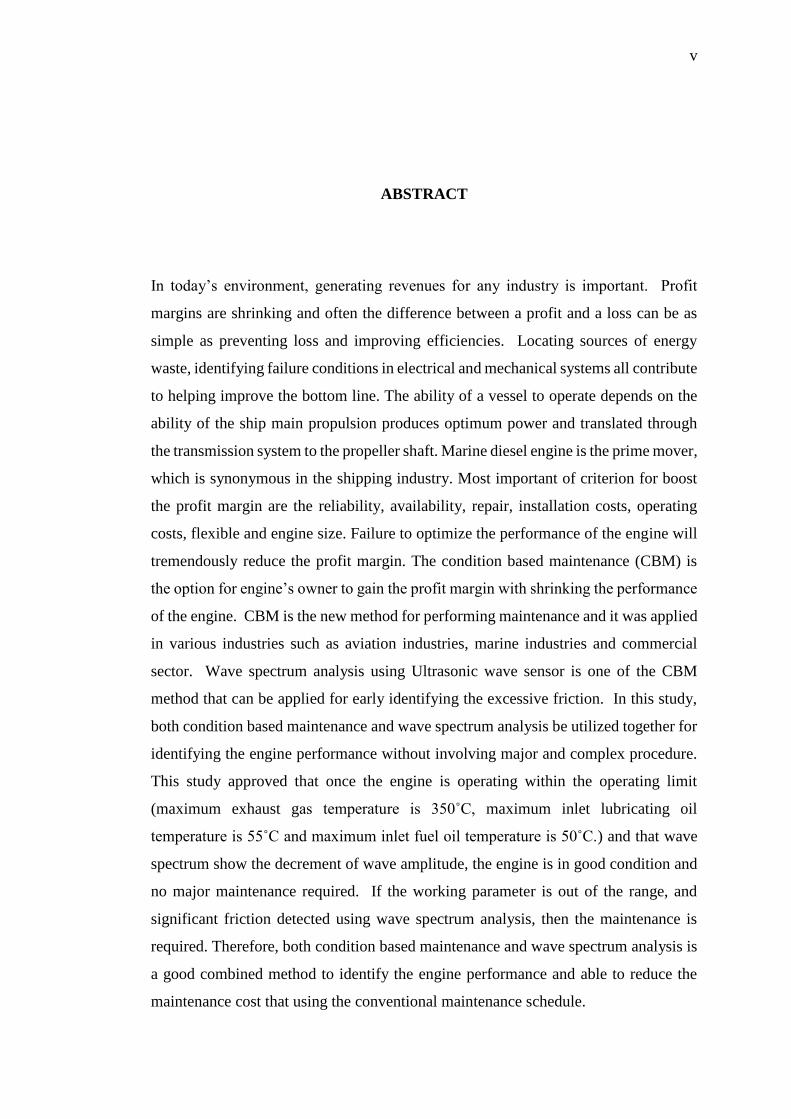
ABSTRACT
In today’s environment, generating revenues for any industry is important. Profit
margins are shrinking and often the difference between a profit and a loss can be as
simple as preventing loss and improving efficiencies. Locating sources of energy
waste, identifying failure conditions in electrical and mechanical systems all contribute
to helping improve the bottom line. The ability of a vessel to operate depends on the
ability of the ship main propulsion produces optimum power and translated through
the transmission system to the propeller shaft. Marine diesel engine is the prime mover,
which is synonymous in the shipping industry. Most important of criterion for boost
the profit margin are the reliability, availability, repair, installation costs, operating
costs, flexible and engine size. Failure to optimize the performance of the engine will
tremendously reduce the profit margin. The condition based maintenance (CBM) is
the option for engine’s owner to gain the profit margin with shrinking the performance
of the engine. CBM is the new method for performing maintenance and it was applied
in various industries such as aviation industries, marine industries and commercial
sector. Wave spectrum analysis using Ultrasonic wave sensor is one of the CBM
method that can be applied for early identifying the excessive friction. In this study,
both condition based maintenance and wave spectrum analysis be utilized together for
identifying the engine performance without involving major and complex procedure.
This study approved that once the engine is operating within the operating limit
(maximum exhaust gas temperature is 350˚C, maximum inlet lubricating oil
temperature is 55˚C and maximum inlet fuel oil temperature is 50˚C.) and that wave
spectrum show the decrement of wave amplitude, the engine is in good condition and
no major maintenance required. If the working parameter is out of the range, and
significant friction detected using wave spectrum analysis, then the maintenance is
required. Therefore, both condition based maintenance and wave spectrum analysis is
a good combined method to identify the engine performance and able to reduce the
maintenance cost that using the conventional maintenance schedule.
vi
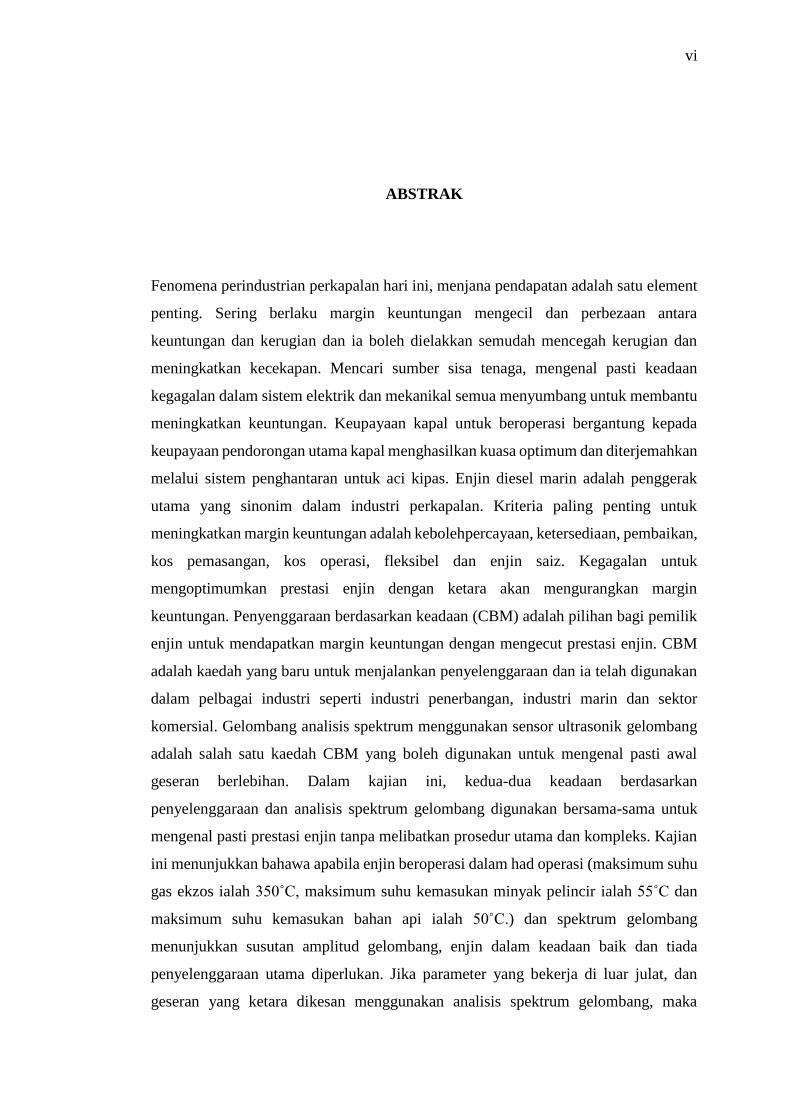
ABSTRAK
Fenomena perindustrian perkapalan hari ini, menjana pendapatan adalah satu element
penting. Sering berlaku margin keuntungan mengecil dan perbezaan antara
keuntungan dan kerugian dan ia boleh dielakkan semudah mencegah kerugian dan
meningkatkan kecekapan. Mencari sumber sisa tenaga, mengenal pasti keadaan
kegagalan dalam sistem elektrik dan mekanikal semua menyumbang untuk membantu
meningkatkan keuntungan. Keupayaan kapal untuk beroperasi bergantung kepada
keupayaan pendorongan utama kapal menghasilkan kuasa optimum dan diterjemahkan
melalui sistem penghantaran untuk aci kipas. Enjin diesel marin adalah penggerak
utama yang sinonim dalam industri perkapalan. Kriteria paling penting untuk
meningkatkan margin keuntungan adalah kebolehpercayaan, ketersediaan, pembaikan,
kos pemasangan, kos operasi, fleksibel dan enjin saiz. Kegagalan untuk
mengoptimumkan prestasi enjin dengan ketara akan mengurangkan margin
keuntungan. Penyenggaraan berdasarkan keadaan (CBM) adalah pilihan bagi pemilik
enjin untuk mendapatkan margin keuntungan dengan mengecut prestasi enjin. CBM
adalah kaedah yang baru untuk menjalankan penyelenggaraan dan ia telah digunakan
dalam pelbagai industri seperti industri penerbangan, industri marin dan sektor
komersial. Gelombang analisis spektrum menggunakan sensor ultrasonik gelombang
adalah salah satu kaedah CBM yang boleh digunakan untuk mengenal pasti awal
geseran berlebihan. Dalam kajian ini, kedua-dua keadaan berdasarkan
penyelenggaraan dan analisis spektrum gelombang digunakan bersama-sama untuk
mengenal pasti prestasi enjin tanpa melibatkan prosedur utama dan kompleks. Kajian
ini menunjukkan bahawa apabila enjin beroperasi dalam had operasi (maksimum suhu
gas ekzos ialah 350˚C, maksimum suhu kemasukan minyak pelincir ialah 55˚C dan
maksimum suhu kemasukan bahan api ialah 50˚C.) dan spektrum gelombang
menunjukkan susutan amplitud gelombang, enjin dalam keadaan baik dan tiada
penyelenggaraan utama diperlukan. Jika parameter yang bekerja di luar julat, dan
geseran yang ketara dikesan menggunakan analisis spektrum gelombang, maka

vii
penyelenggaraan yang diperlukan. Oleh itu, kedua-dua kaedah, keadaan berdasarkan
penyelenggaraan (CBM) dan spektrum gelombang analisis adalah kaedah gabungan
yang baik untuk mengenal pasti prestasi enjin dan dapat mengurangkan kos
penyelenggaraan yang menggunakan jadual penyelenggaraan konvensional.
viii
CONTENTS
TITLE
DECLARATION
DEDICATION
ACKNOWLEDGEMENT
ABSTRACT
ABSTRAK
CONTENTS
LIST OF TABLES
LIST OF FIGURES
LIST OF APPENDICES
i
ii
iii
iv
v
vi
viii
xi
xii
xiv
CHAPTER 1 INTRODUCTION
1.1 Background of Study
1.2 Problem Statement
1.3 Objective of the Study
1.4 Scope and Limitation of the Research
1.5 Organization of Thesis
1
1
3
5
5
5
CHAPTER 2 LITERATURE REVIEW
2.1 Heat Engine
2.1.1 Marine Diesel Engine
2.1.2 Marine Diesel Engine
4-Stroke and 2-Stroke
2.1.3 Air Standard Dual Cycle
2.1.4 Power Efficiency of Marine Diesel
Engine
2.2 Wave Theory
2.2.1 Introduction
2.2.2 Sound Wave
7
7
8
9
11
13
21
21
22
ix
2.2.3 Velocity of Sound
2.2.4 Sound Pressure
2.2.5 Sound Wave Propagation
2.2.6 Ultrasonic Wave
2.2.7 Ultrasonic Wave Propagation Mode
(a) Longitudinal Wave
(b) Transverse Wave (Shear)
(c) Surface Wave (Rayleigh)
(d) Plane Wave (Lamb)
2.3 Signal Processing Method
2.3.1 Time Domain Analysis
2.3.2 Frequency Domain Analysis
2.3.3 Fourier Analysis
2.3.4 Fast Fourier Transformation (FFT)
2.4 Condition Based Maintenance
23
24
25
26
27
28
29
29
30
31
31
32
32
33
34
CHAPTER 3 METHODOLOGY
3.1 Introduction
3.2 Experimental Equipment
3.2.1 2 stroke Marine Diesel Engine
3.2.2 Ultraprobe 10000
3.2.3 Ultratrend DMS – Data
Management System and UE
Spectralyzer Spectral Analysis
Software
3.3 Test Rig
3.4 Research Methodology
3.4.1 Engine Performance Testing
3.4.2 Experimental Observation
Ultrasonic Waves
37
37
39
39
40
42
44
45
45
45
x
CHAPTER 4 RESULTS AND DISCUSSION
4.1 Introduction
4.2 Experimental Results and Discussion
4.2.1 Operating Condition for Standard
Engine Parameter
4.2.1.1 Remarks on engine parameter
result
4.2.2 Experimental results
Ultrasonic Wave Observation
47
47
47
47
55
55
CHAPTER 5 CONCLUSION AND RECOMMENDATION
5.1 Conclusion
5.2 Recommendation
63
63
64
REFERENCES 65
APPENDICES 68
xi
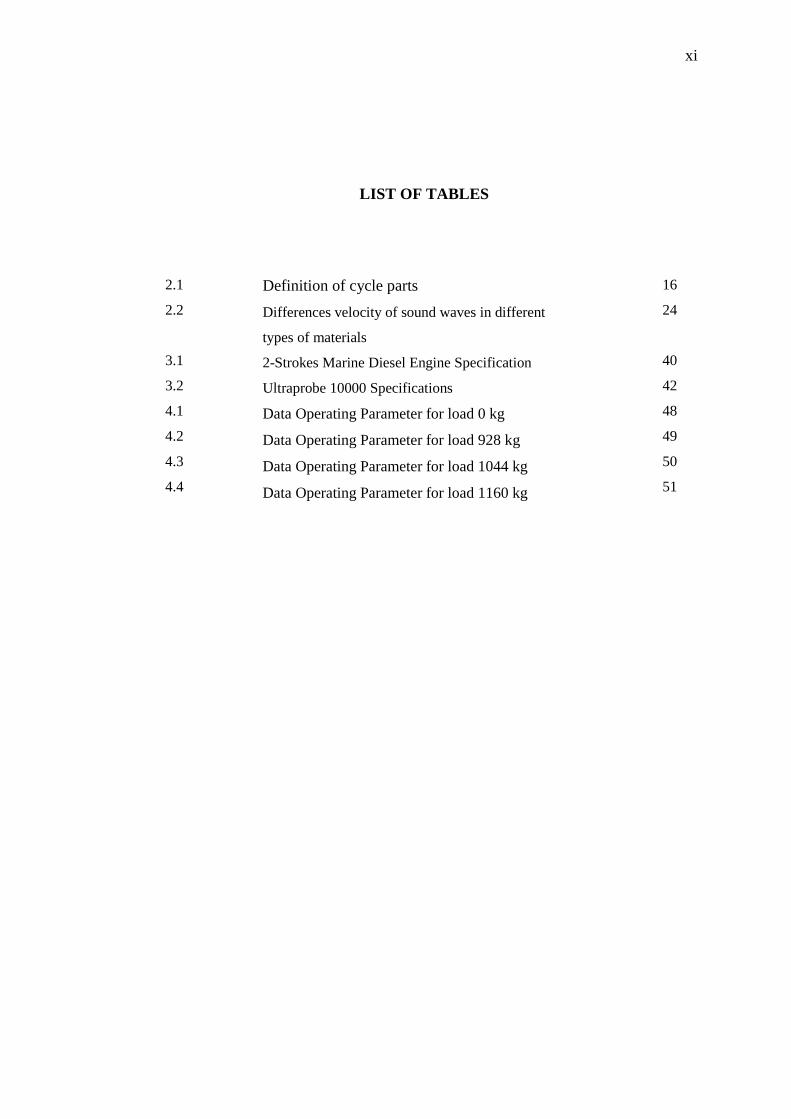
LIST OF TABLES
2.1
2.2
3.1
3.2
4.1
4.2
4.3
4.4
Definition of cycle parts
Differences velocity of sound waves in different
types of materials
2-Strokes Marine Diesel Engine Specification
Ultraprobe 10000 Specifications
Data Operating Parameter for load 0 kg
Data Operating Parameter for load 928 kg
Data Operating Parameter for load 1044 kg
Data Operating Parameter for load 1160 kg
16
24
40
42
48
49
50
51
xii
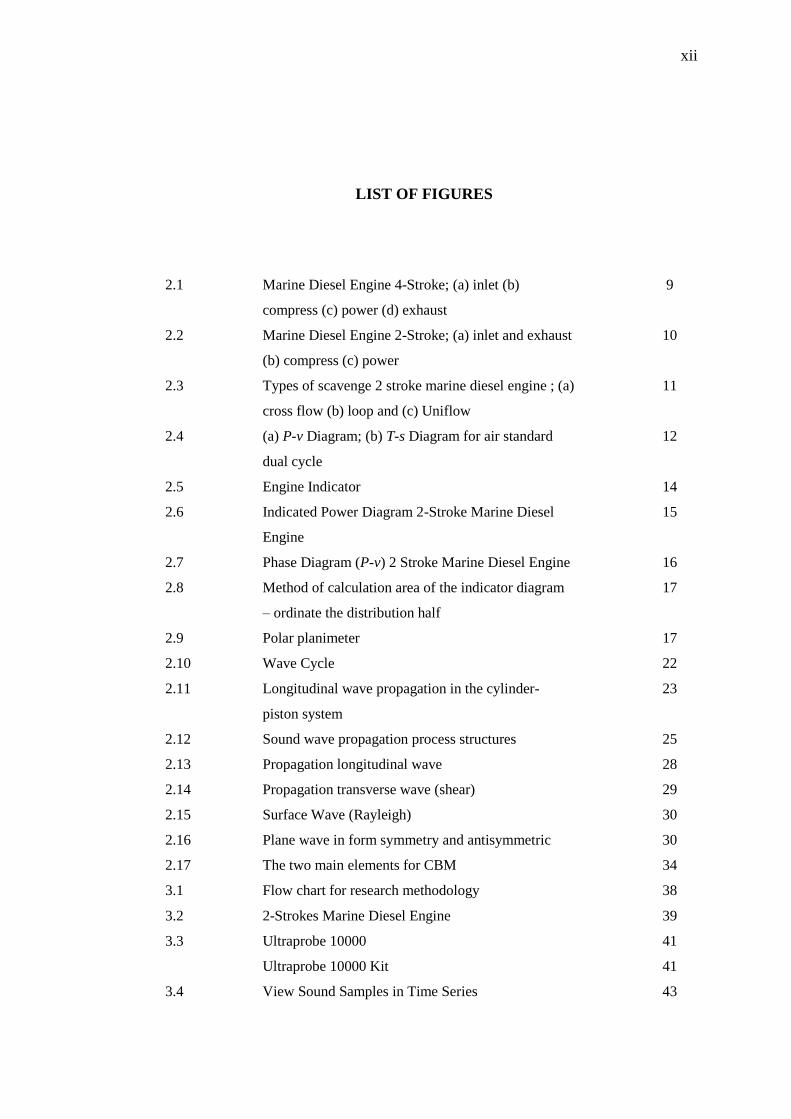
LIST OF FIGURES
2.1
2.2
2.3
2.4
2.5
2.6
2.7
2.8
2.9
2.10
2.11
2.12
2.13
2.14
2.15
2.16
2.17
Marine Diesel Engine 4-Stroke; (a) inlet (b)
compress (c) power (d) exhaust
Marine Diesel Engine 2-Stroke; (a) inlet and exhaust
(b) compress (c) power
Types of scavenge 2 stroke marine diesel engine ; (a)
cross flow (b) loop and (c) Uniflow
(a) P-v Diagram; (b) T-s Diagram for air standard
dual cycle
Engine Indicator
Indicated Power Diagram 2-Stroke Marine Diesel
Engine
Phase Diagram (P-v) 2 Stroke Marine Diesel Engine
Method of calculation area of the indicator diagram
– ordinate the distribution half
Polar planimeter
Wave Cycle
Longitudinal wave propagation in the cylinder-
piston system
Sound wave propagation process structures
Propagation longitudinal wave
Propagation transverse wave (shear)
Surface Wave (Rayleigh)
Plane wave in form symmetry and antisymmetric
The two main elements for CBM
9
10
11
12
14
15
16
17
17
22
23
25
28
29
30
30
34
3.1
3.2
3.3
3.4
Flow chart for research methodology
2-Strokes Marine Diesel Engine
Ultraprobe 10000
Ultraprobe 10000 Kit
View Sound Samples in Time Series
38
39
41
41
43
xiii
3.5
3.6
4.1
4.2
4.3
4.4
4.5
4.6
4.7
4.8
4.9
4.10
4.11
4.12
4.13
4.14
4.15
4.16
Test Rig
Graph engine speed vs temperature for engine load 0
kg
Graph engine speed vs temperature for engine load
928 kg
Graph engine speed vs temperature for engine load
1044 kg
Graph engine speed vs temperature for engine load
1160 kg
Graph time vs amplitude for engine load 0 kg at
speed 185 rpm
Graph time vs amplitude for engine load 0 kg at
speed 235 rpm
Graph time vs amplitude for engine load 0 kg at
speed 255 rpm
Graph time vs amplitude for engine load 928 kg at
speed 185 rpm
Graph time vs amplitude for engine load 928 kg at
speed 235 rpm
Graph time vs amplitude for engine load 928 kg at
speed 255 rpm
Graph time vs amplitude for engine load 1044 kg at
speed 185 rpm
Graph time vs amplitude for engine load 1044 kg at
speed 235 rpm
Graph time vs amplitude for engine load 1044 kg at
speed 255 rpm
Graph time vs amplitude for engine load 1160 kg at
speed 185 rpm
Graph time vs amplitude for engine load 1160 kg at
speed 185 rpm
Graph time vs amplitude for engine load 1160 kg at
speed 185 rpm
44
45
52
53
53
54
56
56
57
58
58
59
59
60
60
61
61
62
xiv
LIST OF APPENDICES
APPENDIX TITLE PAGE
A
B
C
D
E
F
G
H
I
Graph time vs amplitude for engine load 0 kg
for cylinder No. 1 at speed 185 rpm, 235 rpm
and 255 rpm
Graph time vs amplitude for engine load 0 kg
for cylinder No. 2 at speed 185 rpm, 235 rpm
and 255 rpm
Graph time vs amplitude for engine load 0 kg
for cylinder No. 3 at speed 185 rpm, 235 rpm
and 255 rpm
Graph time vs amplitude for engine load 928 kg
for cylinder No. 1 at speed 185 rpm, 235 rpm
and 255 rpm
Graph time vs amplitude for engine load 928 kg
for cylinder No. 2 at speed 185 rpm, 235 rpm
and 255 rpm
Graph time vs amplitude for engine load 928 kg
for cylinder No. 3 at speed 185 rpm, 235 rpm
and 255 rpm
Graph time vs amplitude for engine load 1044
kg for cylinder No. 1 at speed 185 rpm, 235
rpm and 255 rpm
Graph time vs amplitude for engine load 1044
kg for cylinder No. 2 at speed 185 rpm, 235
rpm and 255 rpm
Graph time vs amplitude for engine load 1044
kg for cylinder No. 3 at speed 185 rpm, 235
rpm and 255 rpm
68
69
70
71
72
73
74
75
76

xv
J
K
L
Graph time vs amplitude for engine load 1160
kg for cylinder No. 1 at speed 185 rpm, 235
rpm and 255 rpm
Graph time vs amplitude for engine load 1160
kg for cylinder No. 2 at speed 185 rpm, 235
rpm and 255 rpm
Graph time vs amplitude for engine load 1160
kg for cylinder No. 3 at speed 185 rpm, 235
rpm and 255 rpm
77
78
79
CHAPTER 1
INTRODUCTION
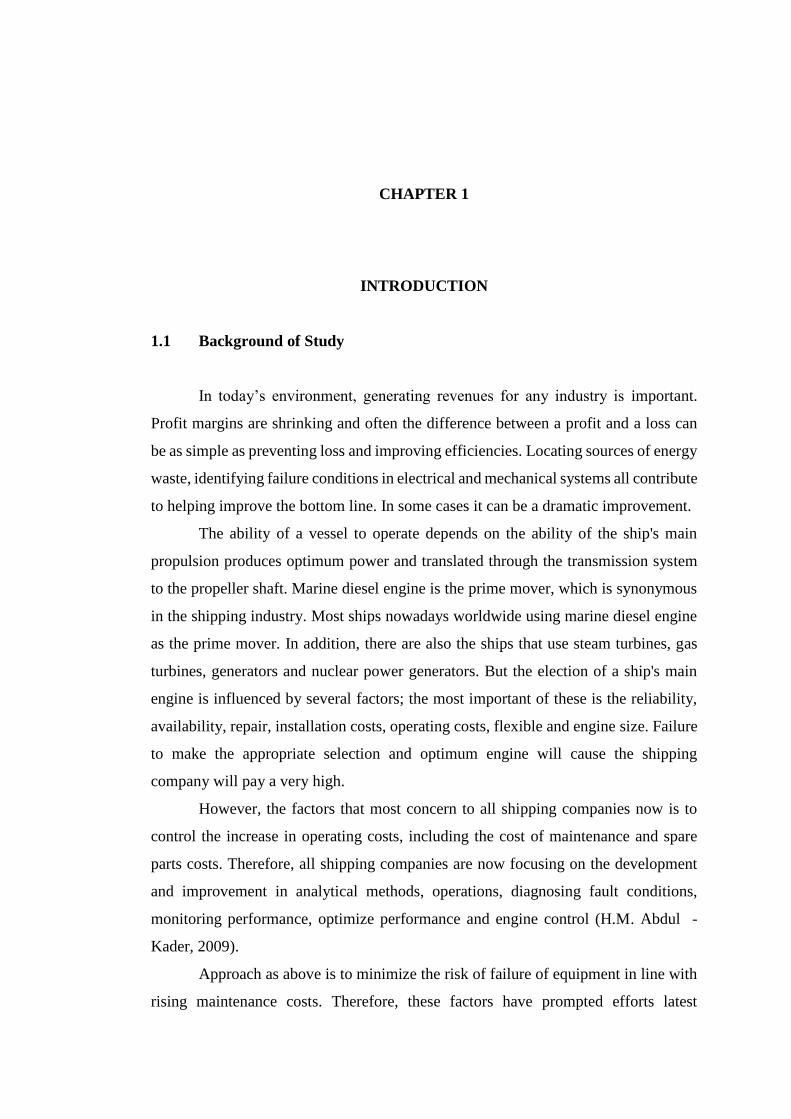
1.1 Background of Study
In today’s environment, generating revenues for any industry is important.
Profit margins are shrinking and often the difference between a profit and a loss can
be as simple as preventing loss and improving efficiencies. Locating sources of energy
waste, identifying failure conditions in electrical and mechanical systems all contribute
to helping improve the bottom line. In some cases it can be a dramatic improvement.
The ability of a vessel to operate depends on the ability of the ship's main
propulsion produces optimum power and translated through the transmission system
to the propeller shaft. Marine diesel engine is the prime mover, which is synonymous
in the shipping industry. Most ships nowadays worldwide using marine diesel engine
as the prime mover. In addition, there are also the ships that use steam turbines, gas
turbines, generators and nuclear power generators. But the election of a ship's main
engine is influenced by several factors; the most important of these is the reliability,
availability, repair, installation costs, operating costs, flexible and engine size. Failure
to make the appropriate selection and optimum engine will cause the shipping
company will pay a very high.
However, the factors that most concern to all shipping companies now is to
control the increase in operating costs, including the cost of maintenance and spare
parts costs. Therefore, all shipping companies are now focusing on the development
and improvement in analytical methods, operations, diagnosing fault conditions,
monitoring performance, optimize performance and engine control (H.M. Abdul -
Kader, 2009).
Approach as above is to minimize the risk of failure of equipment in line with
rising maintenance costs. Therefore, these factors have prompted efforts latest
2
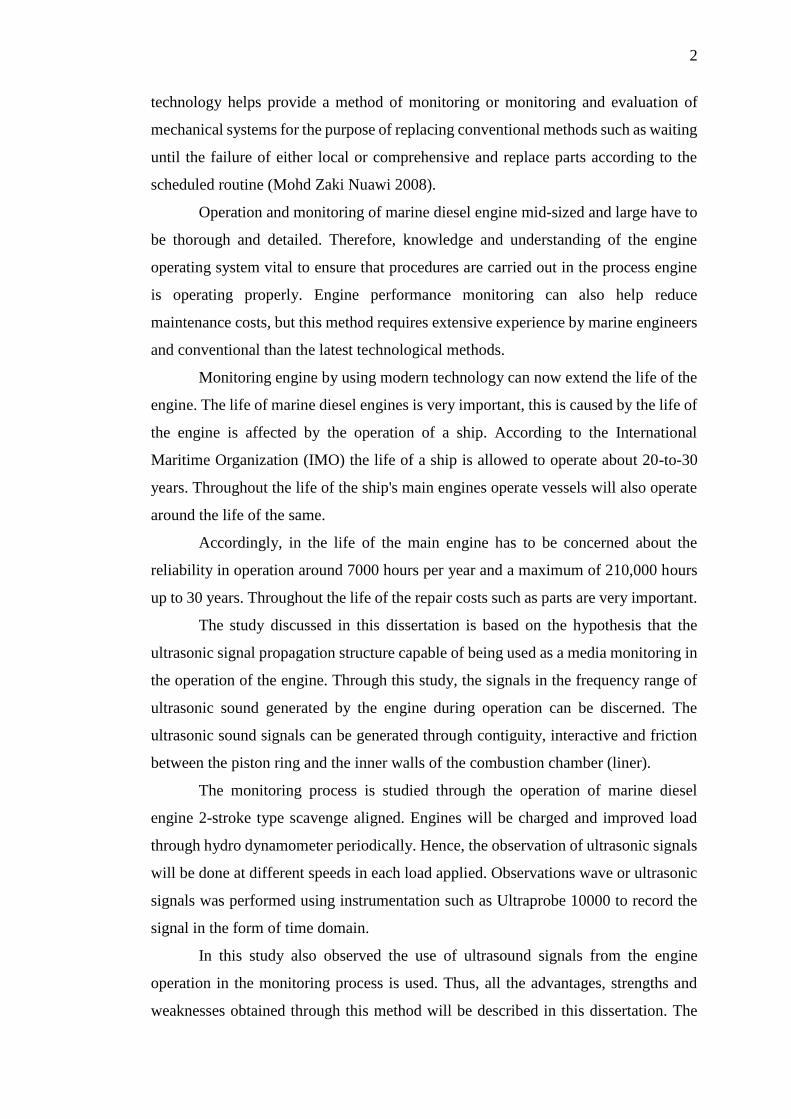
technology helps provide a method of monitoring or monitoring and evaluation of
mechanical systems for the purpose of replacing conventional methods such as waiting
until the failure of either local or comprehensive and replace parts according to the
scheduled routine (Mohd Zaki Nuawi 2008).
Operation and monitoring of marine diesel engine mid-sized and large have to
be thorough and detailed. Therefore, knowledge and understanding of the engine
operating system vital to ensure that procedures are carried out in the process engine
is operating properly. Engine performance monitoring can also help reduce
maintenance costs, but this method requires extensive experience by marine engineers
and conventional than the latest technological methods.
Monitoring engine by using modern technology can now extend the life of the
engine. The life of marine diesel engines is very important, this is caused by the life of
the engine is affected by the operation of a ship. According to the International
Maritime Organization (IMO) the life of a ship is allowed to operate about 20-to-30
years. Throughout the life of the ship's main engines operate vessels will also operate
around the life of the same.
Accordingly, in the life of the main engine has to be concerned about the
reliability in operation around 7000 hours per year and a maximum of 210,000 hours
up to 30 years. Throughout the life of the repair costs such as parts are very important.
The study discussed in this dissertation is based on the hypothesis that the
ultrasonic signal propagation structure capable of being used as a media monitoring in
the operation of the engine. Through this study, the signals in the frequency range of
ultrasonic sound generated by the engine during operation can be discerned. The
ultrasonic sound signals can be generated through contiguity, interactive and friction
between the piston ring and the inner walls of the combustion chamber (liner).
The monitoring process is studied through the operation of marine diesel
engine 2-stroke type scavenge aligned. Engines will be charged and improved load
through hydro dynamometer periodically. Hence, the observation of ultrasonic signals
will be done at different speeds in each load applied. Observations wave or ultrasonic
signals was performed using instrumentation such as Ultraprobe 10000 to record the
signal in the form of time domain.
In this study also observed the use of ultrasound signals from the engine
operation in the monitoring process is used. Thus, all the advantages, strengths and
weaknesses obtained through this method will be described in this dissertation. The
3
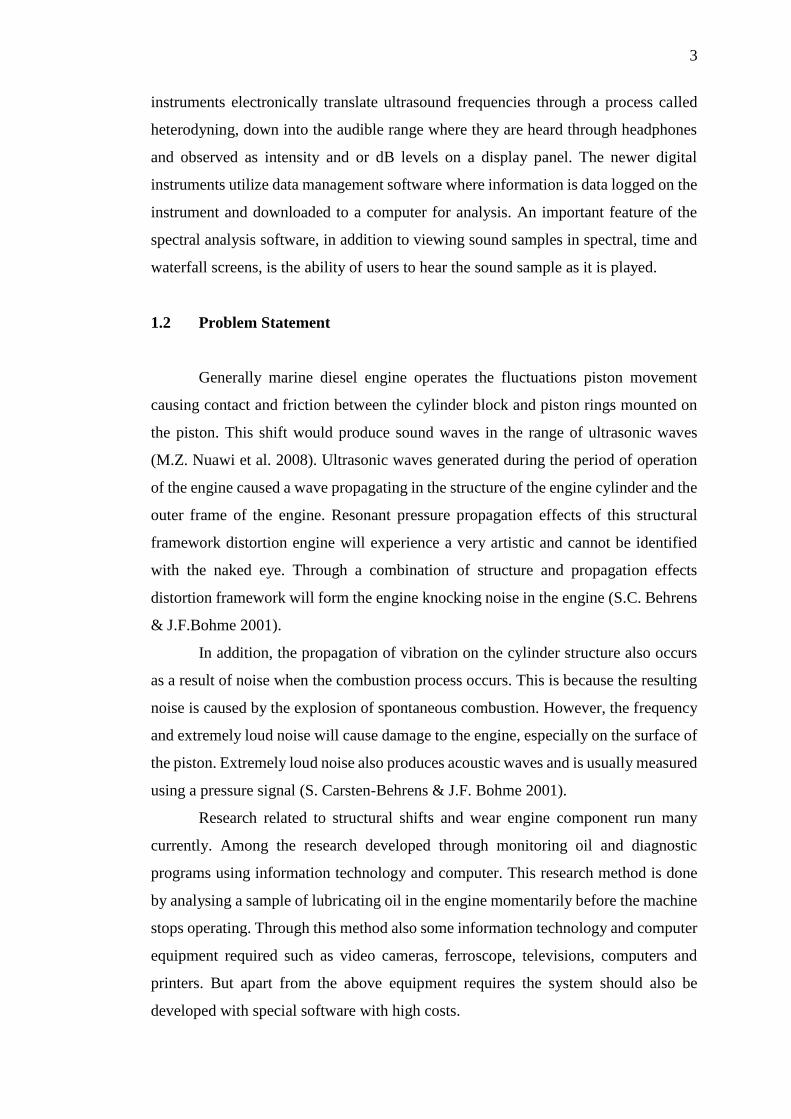
instruments electronically translate ultrasound frequencies through a process called
heterodyning, down into the audible range where they are heard through headphones
and observed as intensity and or dB levels on a display panel. The newer digital
instruments utilize data management software where information is data logged on the
instrument and downloaded to a computer for analysis. An important feature of the
spectral analysis software, in addition to viewing sound samples in spectral, time and
waterfall screens, is the ability of users to hear the sound sample as it is played.
1.2 Problem Statement
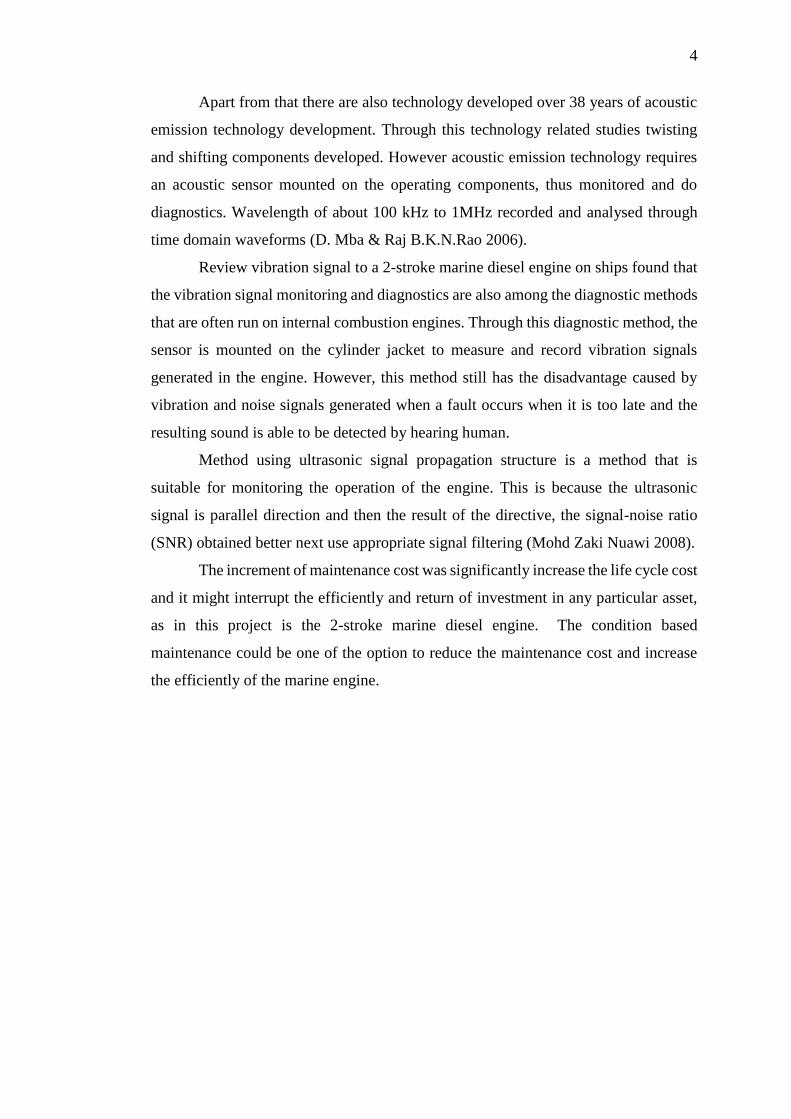
Generally marine diesel engine operates the fluctuations piston movement
causing contact and friction between the cylinder block and piston rings mounted on
the piston. This shift would produce sound waves in the range of ultrasonic waves
(M.Z. Nuawi et al. 2008). Ultrasonic waves generated during the period of operation
of the engine caused a wave propagating in the structure of the engine cylinder and the
outer frame of the engine. Resonant pressure propagation effects of this structural
framework distortion engine will experience a very artistic and cannot be identified
with the naked eye. Through a combination of structure and propagation effects
distortion framework will form the engine knocking noise in the engine (S.C. Behrens
& J.F.Bohme 2001).
In addition, the propagation of vibration on the cylinder structure also occurs
as a result of noise when the combustion process occurs. This is because the resulting
noise is caused by the explosion of spontaneous combustion. However, the frequency
and extremely loud noise will cause damage to the engine, especially on the surface of
the piston. Extremely loud noise also produces acoustic waves and is usually measured
using a pressure signal (S. Carsten-Behrens & J.F. Bohme 2001).
Research related to structural shifts and wear engine component run many
currently. Among the research developed through monitoring oil and diagnostic
programs using information technology and computer. This research method is done
by analysing a sample of lubricating oil in the engine momentarily before the machine
stops operating. Through this method also some information technology and computer
equipment required such as video cameras, ferroscope, televisions, computers and
printers. But apart from the above equipment requires the system should also be
developed with special software with high costs.
4
Apart from that there are also technology developed over 38 years of acoustic
emission technology development. Through this technology related studies twisting
and shifting components developed. However acoustic emission technology requires
an acoustic sensor mounted on the operating components, thus monitored and do
diagnostics. Wavelength of about 100 kHz to 1MHz recorded and analysed through
time domain waveforms (D. Mba & Raj B.K.N.Rao 2006).
Review vibration signal to a 2-stroke marine diesel engine on ships found that
the vibration signal monitoring and diagnostics are also among the diagnostic methods
that are often run on internal combustion engines. Through this diagnostic method, the
sensor is mounted on the cylinder jacket to measure and record vibration signals
generated in the engine. However, this method still has the disadvantage caused by
vibration and noise signals generated when a fault occurs when it is too late and the
resulting sound is able to be detected by hearing human.
Method using ultrasonic signal propagation structure is a method that is
suitable for monitoring the operation of the engine. This is because the ultrasonic
signal is parallel direction and then the result of the directive, the signal-noise ratio
(SNR) obtained better next use appropriate signal filtering (Mohd Zaki Nuawi 2008).
The increment of maintenance cost was significantly increase the life cycle cost
and it might interrupt the efficiently and return of investment in any particular asset,
as in this project is the 2-stroke marine diesel engine. The condition based
maintenance could be one of the option to reduce the maintenance cost and increase
the efficiently of the marine engine.
5
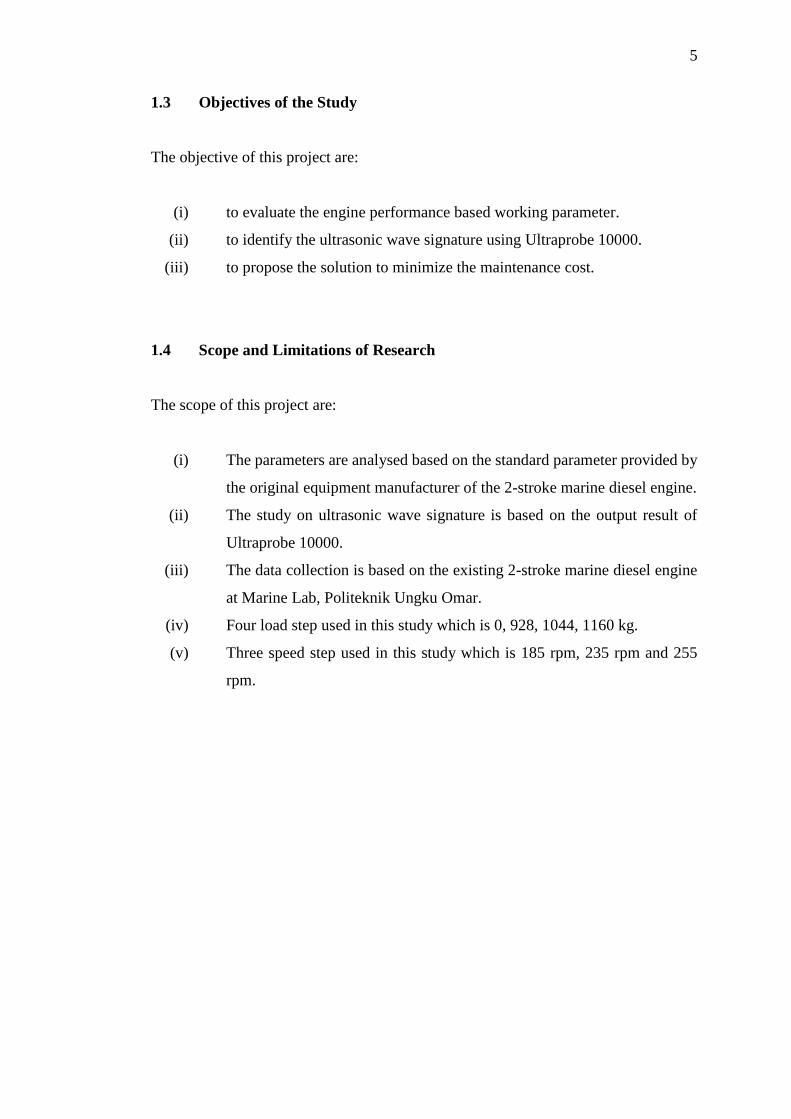
1.3 Objectives of the Study
The objective of this project are:
(i) to evaluate the engine performance based working parameter.
(ii) to identify the ultrasonic wave signature using Ultraprobe 10000.
(iii) to propose the solution to minimize the maintenance cost.
1.4 Scope and Limitations of Research
The scope of this project are:
(i) The parameters are analysed based on the standard parameter provided by
the original equipment manufacturer of the 2-stroke marine diesel engine.
(ii) The study on ultrasonic wave signature is based on the output result of
Ultraprobe 10000.
(iii) The data collection is based on the existing 2-stroke marine diesel engine
at Marine Lab, Politeknik Ungku Omar.
(iv) Four load step used in this study which is 0, 928, 1044, 1160 kg.
(v) Three speed step used in this study which is 185 rpm, 235 rpm and 255
rpm.
6
1.5 Organization of Thesis
This section is intended to brief a summary of the thesis layout. Its five chapters were
organized in this thesis with following the scopes. This thesis first gives a brief
overview of the background of study, problem statements, objectives and scopes and
limitations of research.
Chapter 2 begins with a literature review related to the internal combustion
engine, type diesel engine, marine diesel engine, the basic theory of acoustic waves,
and ultrasound technology in surveillance and monitoring of the engine, the ultrasonic
signal processing method as written in Chapter 2: Literature Review.
After that a test rig developed by utilizing marine diesel engine 2-stroke engine
used in the teaching and learning process in the Marine Engineering Department,
Ungku Omar Polytechnic, Ipoh. The research methodology set out in Chapter 3:
Methodology.
Chapter 4 discusses on the experimental results and discussions of the study.
All the results obtained from observation of the ultrasonic signal during engine
operation will be displayed. The study goes on to make an analysis and discussion of
the results of the observation process the signal. A comparison of the signals obtained
from monitoring the engine is processed in the time domain and frequency domain
results discussed.
Finally, Chapter 5 pointed out and summarizes the results of the research and
some recommendation are also provided in this chapter.
CHAPTER 2
LITERATURE REVIEW
2.1 Heat Engine
Heat engine can be divided into two main categories: internal combustion engines and
internal combustion engines outside. The internal combustion engine is an engine that
produces work through the process of combustion of the fuel in the combustion
chamber. Fuels used by internal combustion engines now include petrol, diesel,
gasoline and gas engines. Fuel reacts with air in the combustion process to generate
energy and power.
While outside combustion engine is an engine combustion chamber process
undergo separate and combustion products will be sent to the generator or turbine.
Among the types of engines in this category is the steam turbine and gas turbine. Both
of types engine using steam and hot gas as a medium to drive a turbine to produce
work.
However, both the heat engine above categories must meet the following
requirements for producing good engine and is capable of high current operation:
(i) Fuel and air to be supplied to the engine with the appropriate proportion and
correct.
(ii) Fuel and air must be compressed before or after the mixing process occurs.
(iii) Mixture of fuel and air needs to be burned and the resulting combustion engine
components will move through the development process.
(iv) The exhaust gas must be removed from the engine during the development
process to provide input combustion chamber receives air.
8
2.1.1 Marine Diesel Engine
The internal combustion engine or heat engine has been tested in early 1888. The
marine diesel engine was invented by Dr. Rudolf Diesel in a decade. Thereafter, the
first 4-stroke engine marine diesel engine was invented by Sulzer which is capable of
producing 20 horsepower at 60 revolutions per minute. Diesel engines are known by
the name of compression ignition engines due to technical reasons. Generally, the
marine diesel engines can be categorized into three main categories: low speed (< 200
rpm), medium speed (200-1000 rpm) and high speed (> 1000 rpm).
However, the competition in designing marine diesel engines, 2-stroke and 4-
stroke which each tries to produce engines with high output, lightweight engines and
small and low rates fuel consumption. Some physical constraints that need to be
prioritized in the selection of marine engines, namely:
(i) Engine capacity to operate in a state where the position of the vessel hull of
uncertain when ship in rolling position.
(ii) Marine engine systems should be designed to allow the engine to withstand the
water temperatures of at least 35ºC and 40 º C ambient temperatures around -
45°C.
(iii) Marine engine is also able to withstand corrosion caused by sodium namely
through the inlet air moisture and vanadium contained in the fuel.
(iv) The marine engine noise to comply with the maximum noise level allowed by
the International Standards Organization (ISO) of 75 dBA in the engine control
room, while 90 dBA in the engine room.
(v) Marine engines must also withstand vibration resulting from the rotation of the
propeller shaft, transmission and component damage.
Diesel engine or fuel compression engines operating under higher compression
ratio than the fuel ignition engines. Most marine diesel engine 2-stroke and 4-stroke
engine is currently working on modern Diesel Cycle or Dual Combustion Cycle. Dual-
combustion cycle is the cycle that combines Diesel Cycle and Otto cycle. Hence, Dual-
Combustion Cycle start burning fuel injection and earlier, ie around 20º before top
dead center (TDC) (S.S. Hou 2004). Diesel engine which initially operated using
9
diesel-cycle has been developed to operate in a dual combustion cycle. Efficiency of
Dual-cycle diesel engine is higher than compared with Diesel Cycle and Otto cycle.
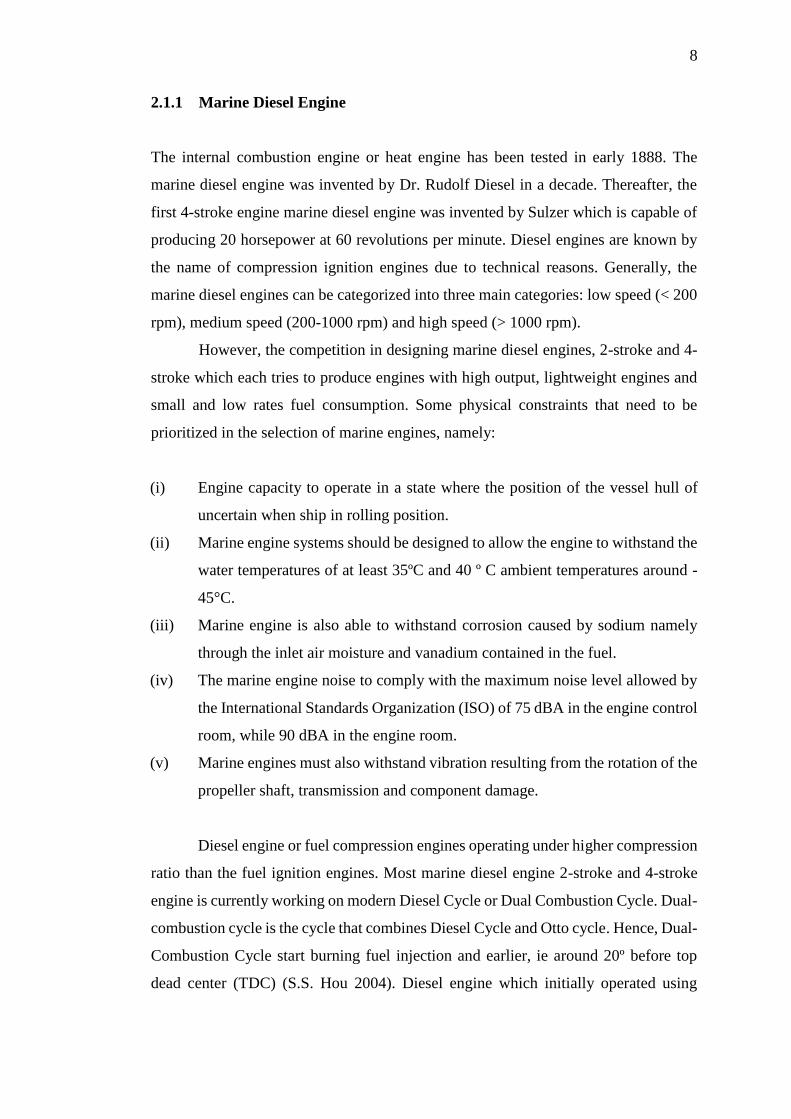
2.1.2 Marine Diesel Engine 4-Stroke and 2-Stroke
Marine diesel engine 4-stroke operation by completing two rounds of the crankshaft
or piston moves up and down four times to complete a four-stroke cycle. Air is sucked
through the inlet valve to assist the combustion in the combustion chamber and
discharged through the exhaust valve during the exhaust stroke as shown in Figure 2.1.
Figure 2.1: Marine Diesel Engine 4-Stroke; (a) intake (b) compression (c) power
(d) exhaust
(http://www.dieselduck.info/machine/01%20prime%20movers/diesel_engine/diesel_
engine.02.htm)
When the piston is at top dead center (TDC) inlet valve opens and air is sucked
into the combustion chamber and piston then down to the bottom dead center (BDC).
The BDC inlet valve is closed and the air in the combustion chamber is compressed
by the piston moves up to TDC. During the process of compressed air, temperature
and air pressure in the combustion chamber increases. Fuels (diesel) injected in the
combustion chamber and combustion occurs by generating a high-pressure gas. At this
point the piston is pushed down to the BDC. On the exhaust stroke valve opens and
the piston moves up to TDC again to push exhaust gases out. While marine diesel
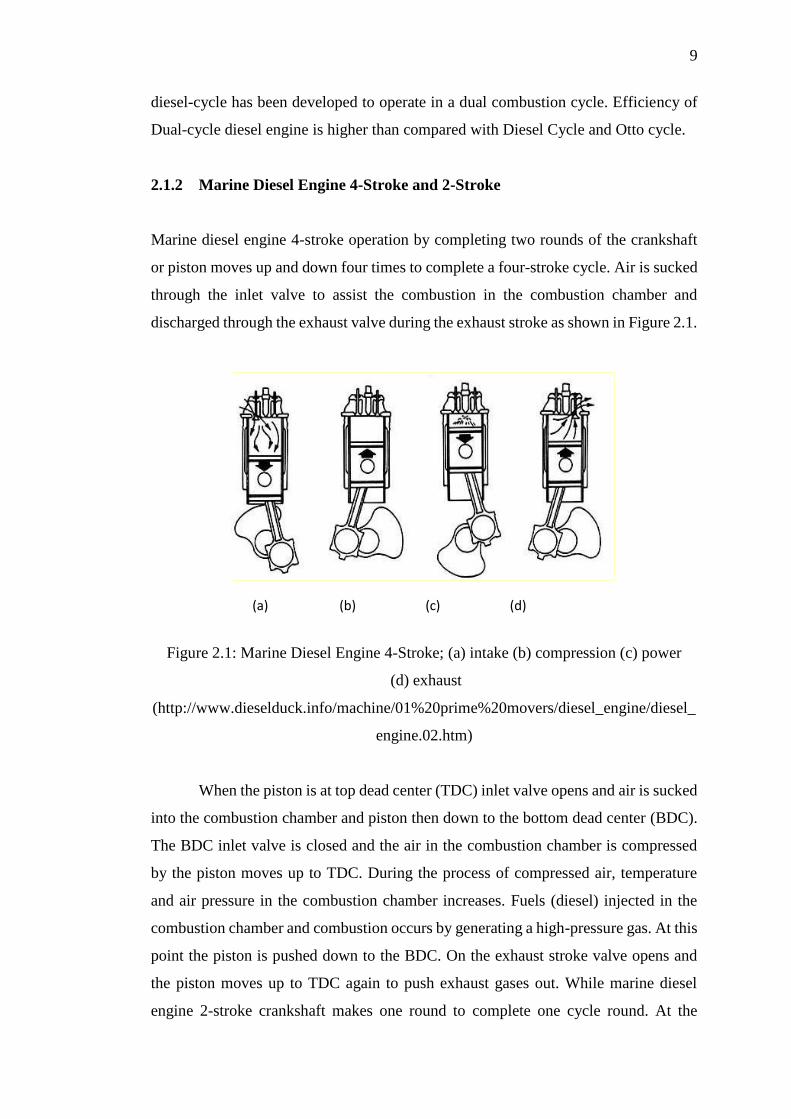
engine 2-stroke crankshaft makes one round to complete one cycle round. At the
(a) (b) (c) (d)
10
beginning of the process air is at low pressure. Air will entering the combustion
chamber through a hole scavenges will push out the exhaust gas through the exhaust
vent or exhaust valve. When the piston is at TDC and the exhaust hole scavenge will
be closed as shown in Figure 2.2.
Figure 2.2: Marine Diesel Engine 2-Stroke; (a) exhaust and intake (b) compression
(c) power
(http://www.dieselduck.info/machine/01%20prime%20movers/diesel_engine/diesel_
engine.01.htm)
Piston at BDC and then down to the exhaust vent will open first, followed by
scavenge hole. When the hole is open scavenge air will enter the combustion chamber
by pushing the exhaust gas out through the exhaust vent. At the end of the piston stroke
will rise to TDC and compressing air at high pressure and temperature suitable for
combustion.
There are differences among marine diesel engine 4-stroke and 2-stroke air
input during the process. 4-stroke diesel engines are using the inlet valve to allow air
to enter the combustion chamber. While the 2-stroke diesel engines using scavenge
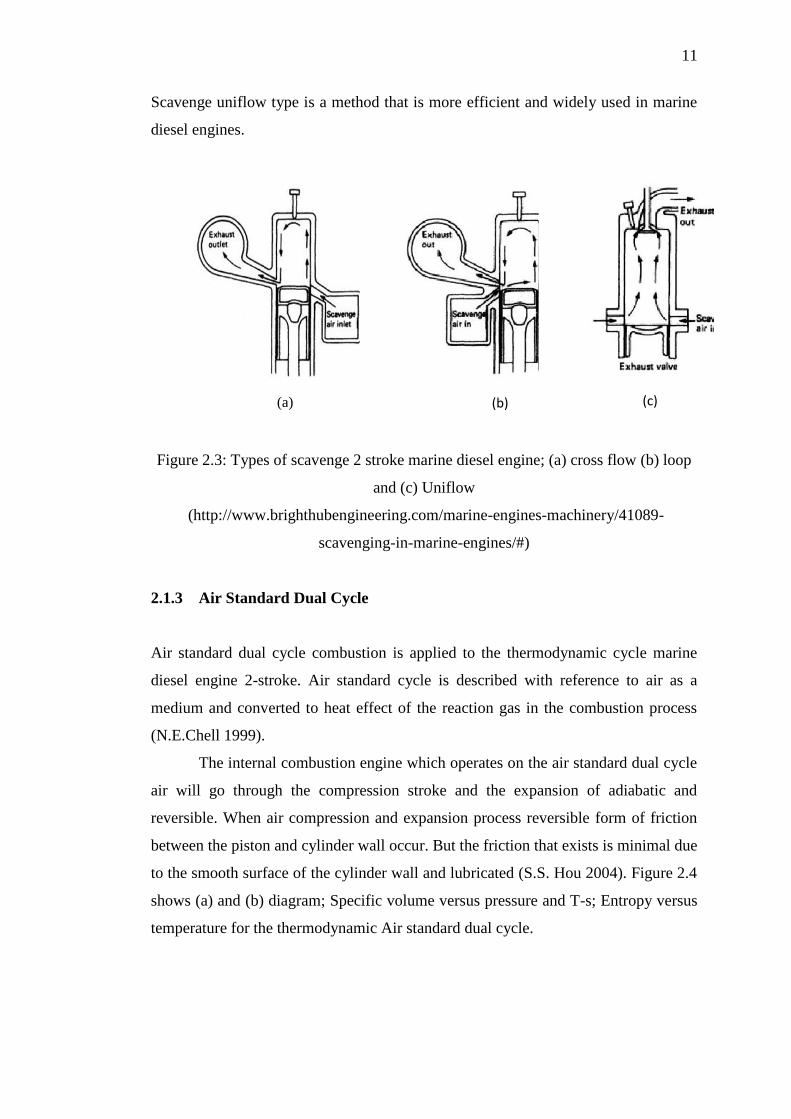
hole for supplying air into the combustion chamber. Scavenge methods on marine
diesel engine 2-stroke is divided into three types, namely the type of cross flow, loops
and uniflow as illustrated in Figure 2.3. These three types of scavenge method each
have advantages and disadvantages. Cross flow type method requires piston skirt to
prevent air and exhaust gases out when the piston is at TDC. While the loop is designed
for low air temperatures and high temperature exhaust gas through holes adjacent to
each other. This is necessary to avoid differences in temperatures far wall liner.
(a) (b) (c)
11
Scavenge uniflow type is a method that is more efficient and widely used in marine
diesel engines.
Figure 2.3: Types of scavenge 2 stroke marine diesel engine; (a) cross flow (b) loop
and (c) Uniflow
(http://www.brighthubengineering.com/marine-engines-machinery/41089-
scavenging-in-marine-engines/#)
2.1.3 Air Standard Dual Cycle
Air standard dual cycle combustion is applied to the thermodynamic cycle marine
diesel engine 2-stroke. Air standard cycle is described with reference to air as a
medium and converted to heat effect of the reaction gas in the combustion process
(N.E.Chell 1999).
The internal combustion engine which operates on the air standard dual cycle
air will go through the compression stroke and the expansion of adiabatic and
reversible. When air compression and expansion process reversible form of friction
between the piston and cylinder wall occur. But the friction that exists is minimal due
to the smooth surface of the cylinder wall and lubricated (S.S. Hou 2004). Figure 2.4
shows (a) and (b) diagram; Specific volume versus pressure and T-s; Entropy versus
temperature for the thermodynamic Air standard dual cycle.
(a)
(b)
(c)
12
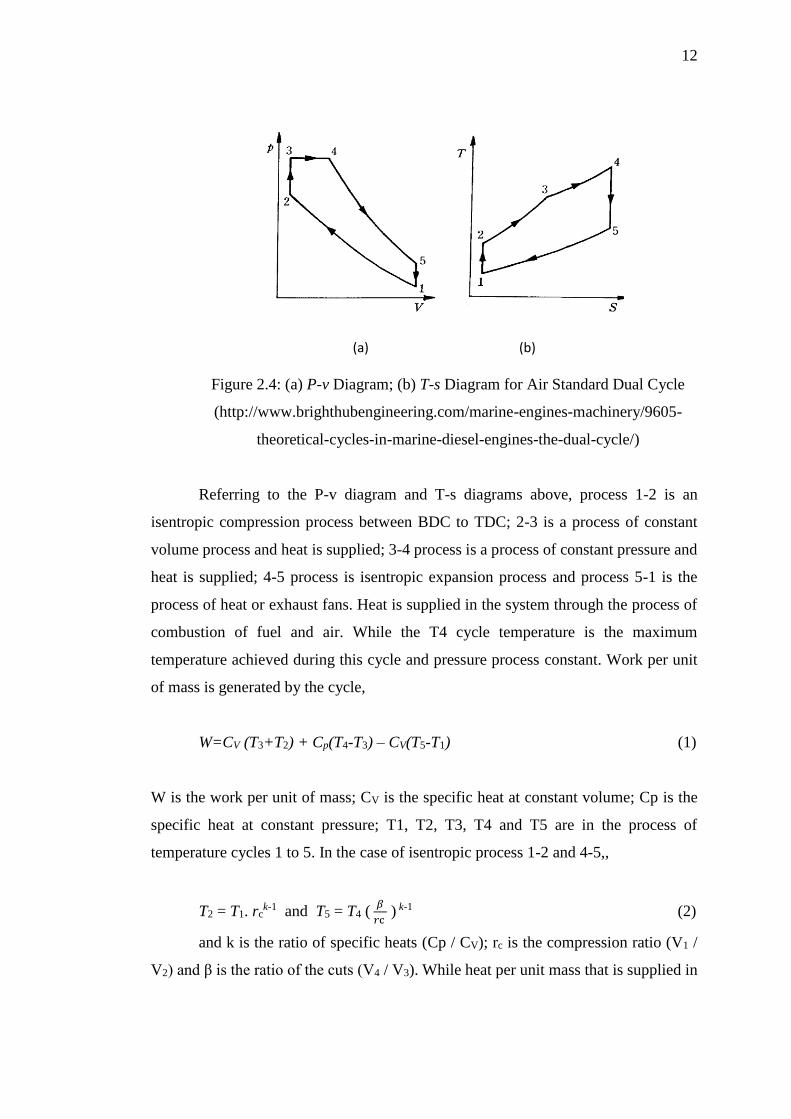
Figure 2.4: (a) P-v Diagram; (b) T-s Diagram for Air Standard Dual Cycle
(http://www.brighthubengineering.com/marine-engines-machinery/9605-
theoretical-cycles-in-marine-diesel-engines-the-dual-cycle/)
Referring to the P-v diagram and T-s diagrams above, process 1-2 is an
isentropic compression process between BDC to TDC; 2-3 is a process of constant
volume process and heat is supplied; 3-4 process is a process of constant pressure and
heat is supplied; 4-5 process is isentropic expansion process and process 5-1 is the
process of heat or exhaust fans. Heat is supplied in the system through the process of
combustion of fuel and air. While the T4 cycle temperature is the maximum
temperature achieved during this cycle and pressure process constant. Work per unit
of mass is generated by the cycle,
W=CV (T3+T2) + Cp(T4-T3) – CV(T5-T1) (1)
W is the work per unit of mass; CV is the specific heat at constant volume; Cp is the
specific heat at constant pressure; T1, T2, T3, T4 and T5 are in the process of
temperature cycles 1 to 5. In the case of isentropic process 1-2 and 4-5,,
T2 = T1. rck-1 and T5 = T4 (
𝛽
𝑟c ) k-1 (2)
and k is the ratio of specific heats (Cp / CV); rc is the compression ratio (V1 /
V2) and β is the ratio of the cuts (V4 / V3). While heat per unit mass that is supplied in
(a) (b)
13
the cycle is in a state of constant volume - 2-3 process, Q1 and the constant pressure
situation - the process 3-4, Q2 as follows,
Q1 = CV (T3-T2) and Q2 = Cp (T4-T3) (3)
Therefore the amount of heat supplied to the cycle, Qin is,
Qin = CV (T3-T2) + Cp (T4-T3) (4)
2.1.4 Power Efficiency of Marine Diesel Engine.
Selection of an internal combustion engine, not only through the physical aspects of
the external or even covering aspects of the engine's ability to produce output translates
to the ability level of the operation of the vehicle. Similarly often when to determine
in the selection of the engine for a ship. Factor is the engine's ability to produce
optimum power and is compatible with the size of the vessel and type of vessel
operations are concern.
Term of power is used in the identification of marine diesel engines and
internal combustion engines in which the word "power" is referring to indicated power
and brake power generated by the engine (J. Lambs, 1986). Generally, the power
generated by the combustion process in the engine cylinder and translated by the
mechanical movement of the crankshaft to move the ship propeller.
Indicated power generated for each cylinder of the engine. While the engine
brake power is the ability to resist engine shaft rotation to test the ability of the engine
to work in the loaded condition. The method used in making the measurements
indicated a power marine diesel engine is to use pressure indicator equipment or engine
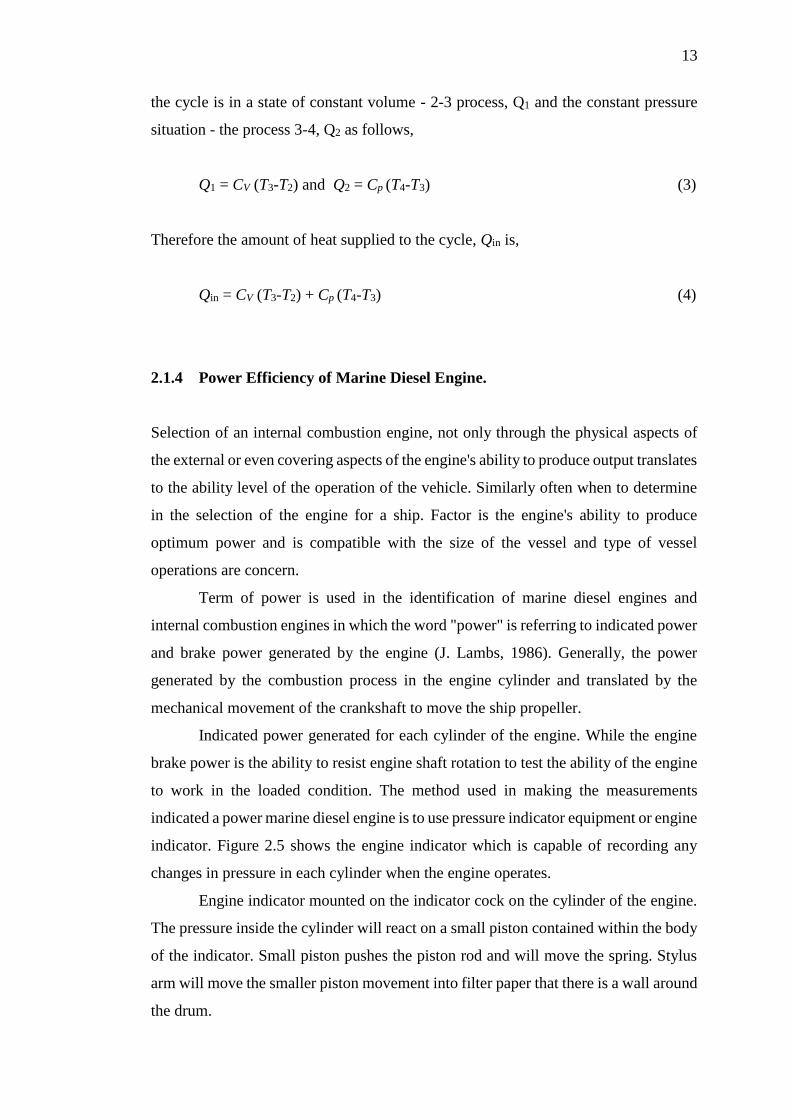
indicator. Figure 2.5 shows the engine indicator which is capable of recording any
changes in pressure in each cylinder when the engine operates.
Engine indicator mounted on the indicator cock on the cylinder of the engine.
The pressure inside the cylinder will react on a small piston contained within the body
of the indicator. Small piston pushes the piston rod and will move the spring. Stylus
arm will move the smaller piston movement into filter paper that there is a wall around
the drum.
14
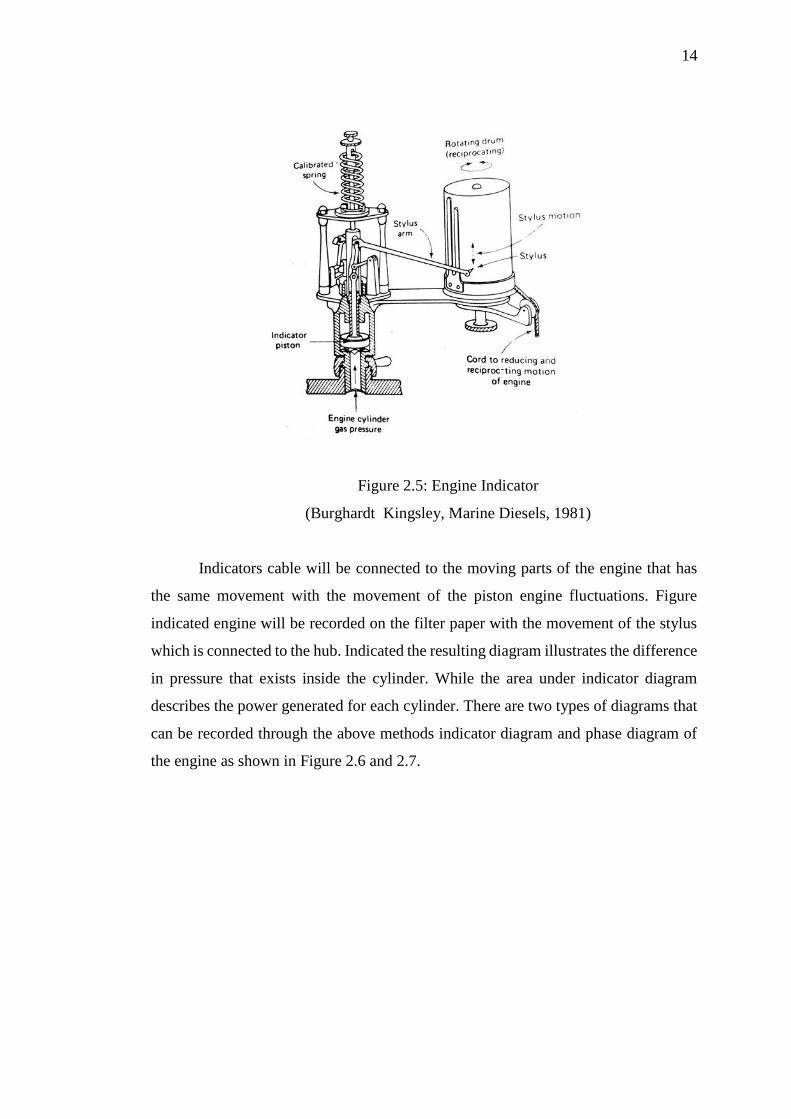
Figure 2.5: Engine Indicator
(Burghardt Kingsley, Marine Diesels, 1981)
Indicators cable will be connected to the moving parts of the engine that has
the same movement with the movement of the piston engine fluctuations. Figure
indicated engine will be recorded on the filter paper with the movement of the stylus
which is connected to the hub. Indicated the resulting diagram illustrates the difference
in pressure that exists inside the cylinder. While the area under indicator diagram
describes the power generated for each cylinder. There are two types of diagrams that
can be recorded through the above methods indicator diagram and phase diagram of
the engine as shown in Figure 2.6 and 2.7.
15
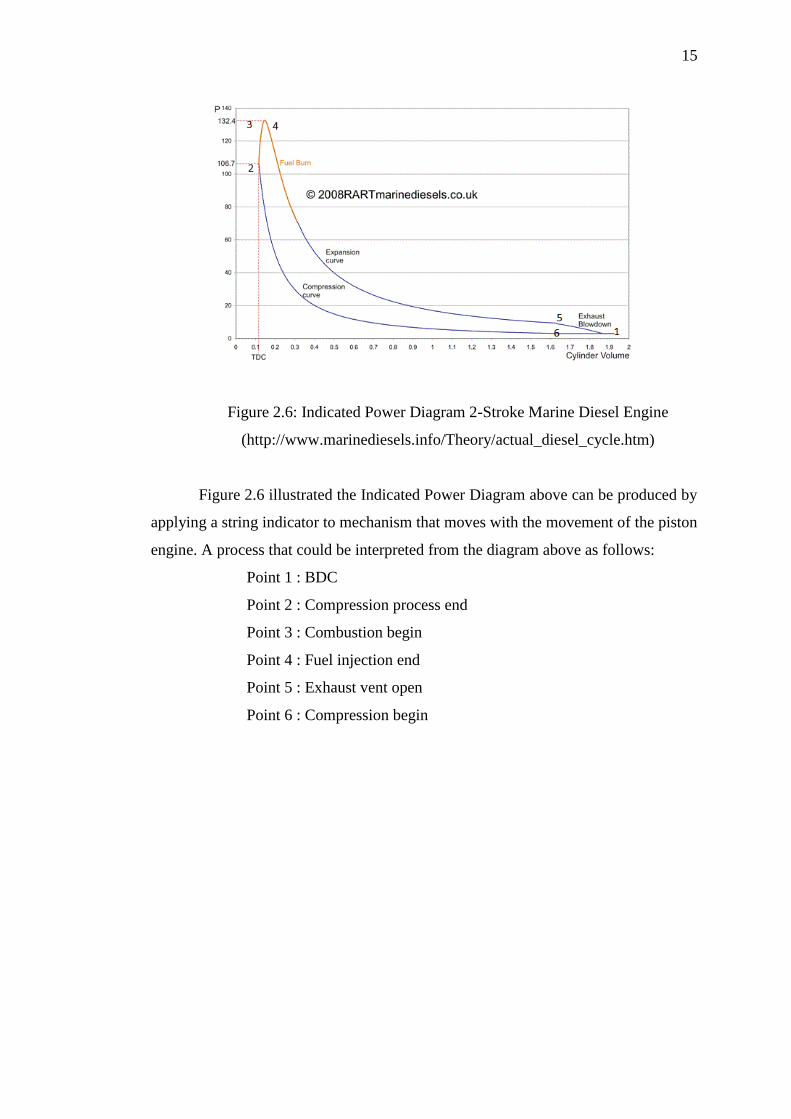
Figure 2.6: Indicated Power Diagram 2-Stroke Marine Diesel Engine
(http://www.marinediesels.info/Theory/actual_diesel_cycle.htm)
Figure 2.6 illustrated the Indicated Power Diagram above can be produced by
applying a string indicator to mechanism that moves with the movement of the piston
engine. A process that could be interpreted from the diagram above as follows:
Point 1 : BDC
Point 2 : Compression process end
Point 3 : Combustion begin
Point 4 : Fuel injection end
Point 5 : Exhaust vent open
Point 6 : Compression begin
16
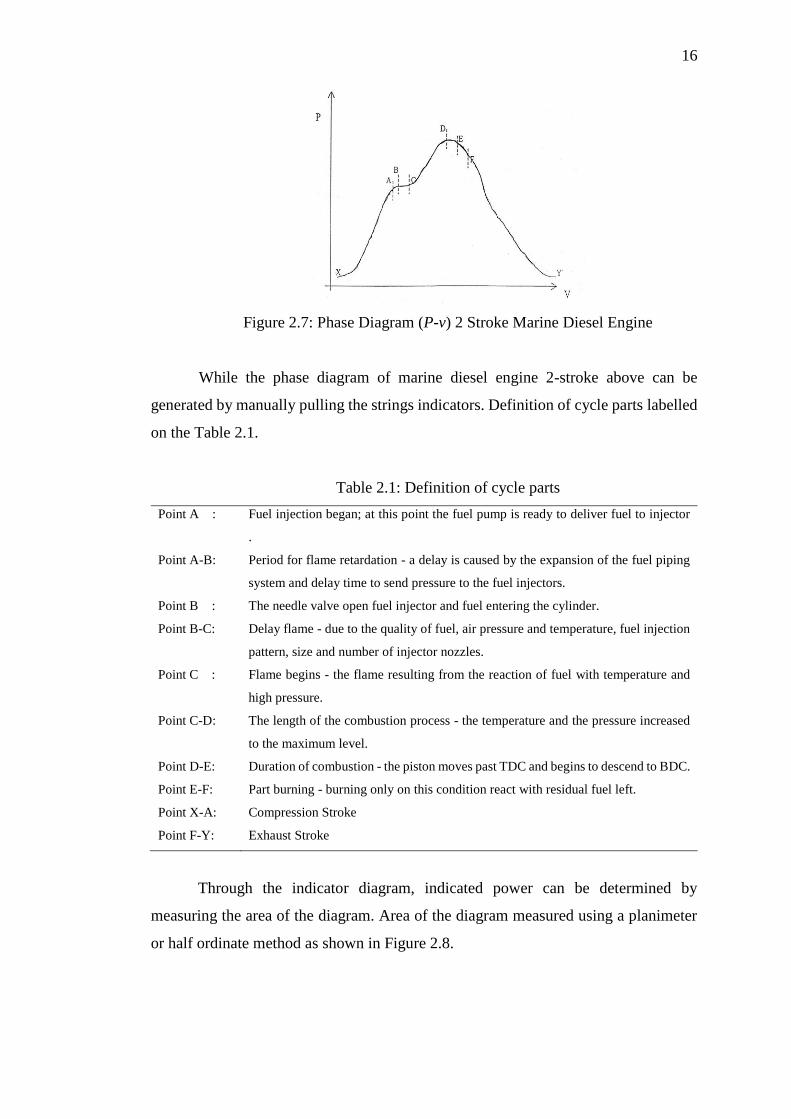
Figure 2.7: Phase Diagram (P-v) 2 Stroke Marine Diesel Engine
While the phase diagram of marine diesel engine 2-stroke above can be
generated by manually pulling the strings indicators. Definition of cycle parts labelled
on the Table 2.1.
Table 2.1: Definition of cycle parts
Point A : Fuel injection began; at this point the fuel pump is ready to deliver fuel to injector
.
Point A-B: Period for flame retardation - a delay is caused by the expansion of the fuel piping
system and delay time to send pressure to the fuel injectors.
Point B : The needle valve open fuel injector and fuel entering the cylinder.
Point B-C: Delay flame - due to the quality of fuel, air pressure and temperature, fuel injection
pattern, size and number of injector nozzles.
Point C : Flame begins - the flame resulting from the reaction of fuel with temperature and
high pressure.
Point C-D: The length of the combustion process - the temperature and the pressure increased
to the maximum level.
Point D-E: Duration of combustion - the piston moves past TDC and begins to descend to BDC.
Point E-F: Part burning - burning only on this condition react with residual fuel left.
Point X-A: Compression Stroke
Point F-Y: Exhaust Stroke
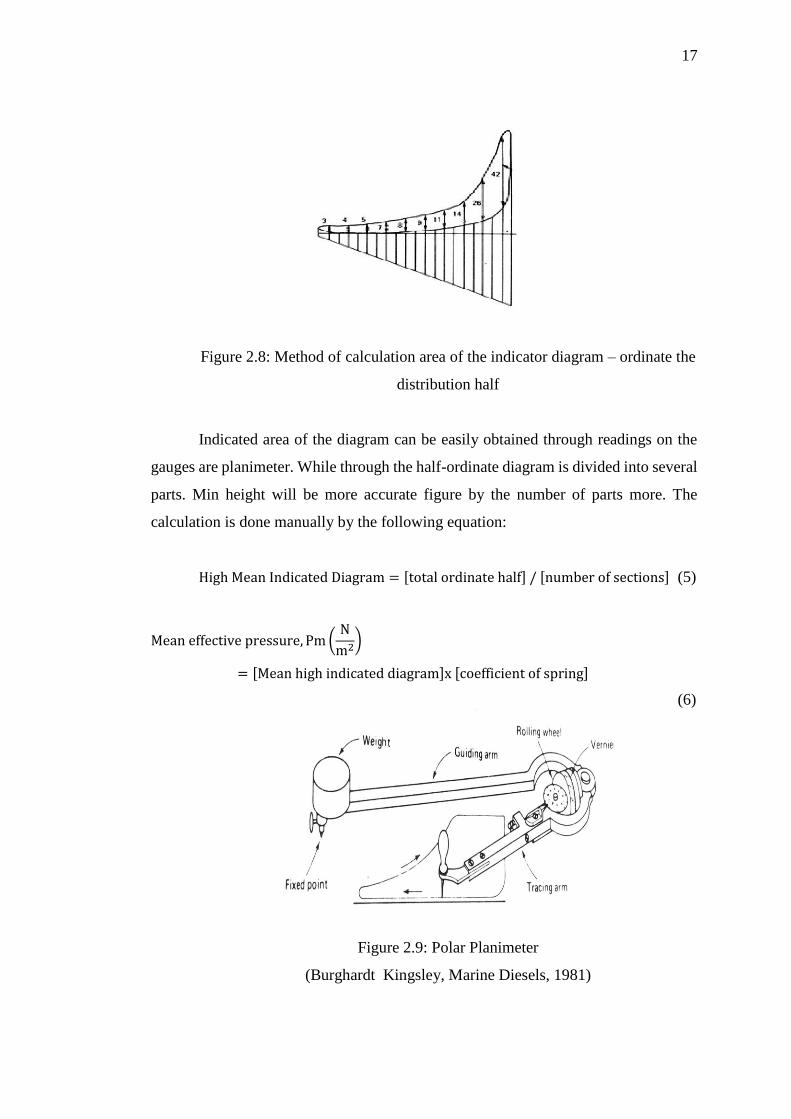
Through the indicator diagram, indicated power can be determined by
measuring the area of the diagram. Area of the diagram measured using a planimeter
or half ordinate method as shown in Figure 2.8.
17
Figure 2.8: Method of calculation area of the indicator diagram – ordinate the
distribution half
Indicated area of the diagram can be easily obtained through readings on the
gauges are planimeter. While through the half-ordinate diagram is divided into several
parts. Min height will be more accurate figure by the number of parts more. The
calculation is done manually by the following equation:
High Mean Indicated Diagram = [total ordinate half] / [number of sections] (5)
Mean effective pressure, Pm (N
m2)
= [Mean high indicated diagram]x [coefficient of spring]
(6)
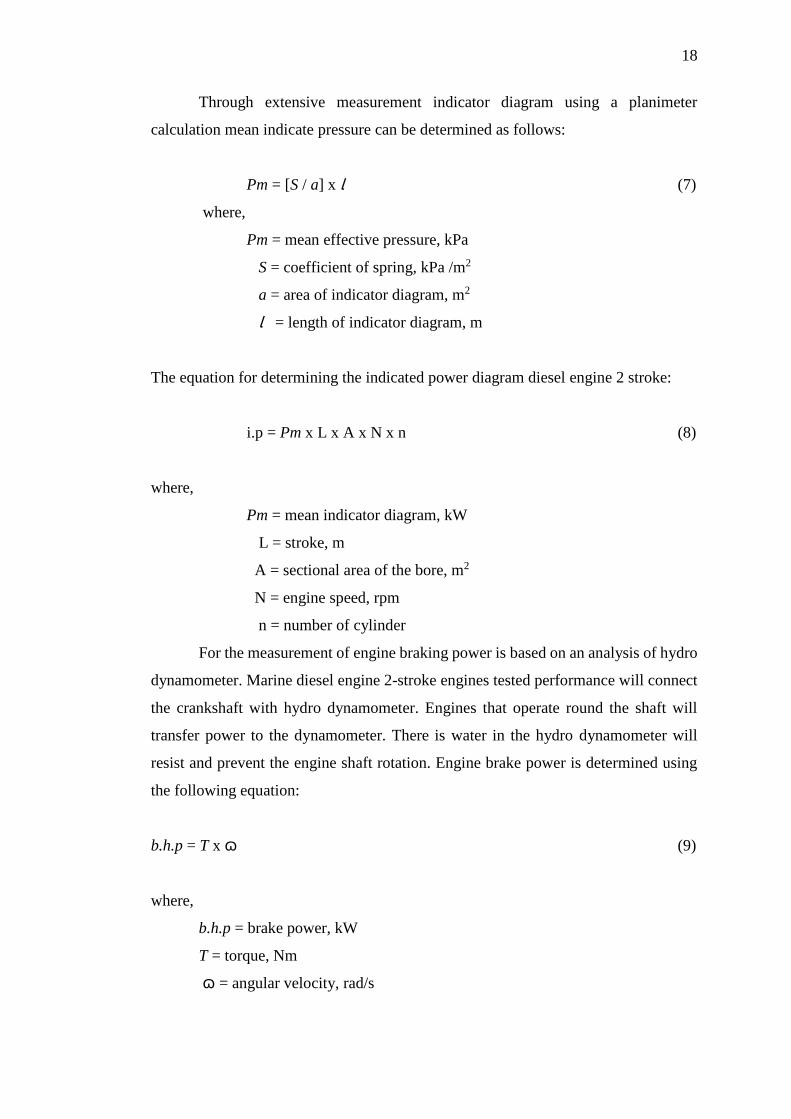
Figure 2.9: Polar Planimeter
(Burghardt Kingsley, Marine Diesels, 1981)
18
Through extensive measurement indicator diagram using a planimeter
calculation mean indicate pressure can be determined as follows:
Pm = [S / a] x Ɩ (7)
where,
Pm = mean effective pressure, kPa
S = coefficient of spring, kPa /m2
a = area of indicator diagram, m2
Ɩ = length of indicator diagram, m
The equation for determining the indicated power diagram diesel engine 2 stroke:
i.p = Pm x L x A x N x n (8)
where,
Pm = mean indicator diagram, kW
L = stroke, m
A = sectional area of the bore, m2
N = engine speed, rpm
n = number of cylinder
For the measurement of engine braking power is based on an analysis of hydro
dynamometer. Marine diesel engine 2-stroke engines tested performance will connect
the crankshaft with hydro dynamometer. Engines that operate round the shaft will
transfer power to the dynamometer. There is water in the hydro dynamometer will
resist and prevent the engine shaft rotation. Engine brake power is determined using
the following equation:
b.h.p = T x ɷ (9)
where,
b.h.p = brake power, kW
T = torque, Nm
ɷ = angular velocity, rad/s
19
Potential engine is determined by an analysis of some parameters such as
mechanical efficiency, thermal efficiency, volumetric efficiency, air and fuel ratio, the
mean piston speed, fuel consumption rate, and the rate of air consumption and use of
specific fuel consumption.
Mechanical efficiency of the engine is measured efficiency of friction between
moving components in the engine. Mechanical efficiency is determined by the ratio
between the brake power and indicated power as follows (D.A. Taylor 1999):
η m = brake power / indicated power (10)
While the mean piston speed is the ability of the piston moves from TDC or BDC and
to the maximum half-stroke. Min is determined as follows:
Mean piston speed = [2 x stroke] / [time for around crankshaft] (11)
The ratio of air and fuel consumption is determined by measuring the amount
of air and fuel that is used when the engine is operating at a specific period of time.
However, the rate of air consumption is very difficult to determine and analyse in
detail. Practically in engine combustion process, air containing oxygen 21% and 79%
Nitrogen in volume. Equation of air and fuel ratio as follows:
[F/A]actual / [F/A]s (12)
where,
[F/A]actual = actual fuel air ratio
[F/A]s = stoichiometric fuel air ratio
The rate of fuel consumption in the engine when the engine is operating in a certain
period . The equation used is:
ṁf = V x ρf
𝑡 (13)
where,
ṁf = rate of fuel consumption, kg/s
v = volume of fuel, m3
ρf = density of fuel, kg/m3
t = period of engine operation, s
20
But there are other methods that can be used are to take readings of the flow
rate of fuel consumption directly on the flow meter. The specific fuel consumption is
also a fuel consumption rate required to produce a unit of engine power. The engine
has a fuel consumption of the low is more economical. Specific fuel consumption
equation is:
𝑠. 𝑓. 𝑐 =�̇�
𝑏.ℎ.𝑝 (14)
where,
s.f.c = specific fuel consumption
ṁ = rate of fuel consumption, kg/s
b.h.p = brake power, kW
Engine capacity to determine the effective thermal energy supply for use with optimum
thermal energy is determined by the following equation:
η th = work done per second
heat supplied from the fuel per second (15)
Heat supplied to the engine depending on the fuel calorific value (C.V.) is used, i.e.
the amount of heat energy obtained per unit mass of fuel when the burned at constant
pressure conditions. Thermal energy is supplied, ṁf x C.V.
21
2.2 Wave Theory
2.2.1 Introduction
Waves can be classified into two types of mechanical waves and electromagnetic
waves, this division is referring to the wave propagation medium. Mechanical wave is
the wave propagation in the medium requires. Examples of mechanical waves are
sound waves, surface waves and water waves on a string. While the electromagnetic
wave is a wave that does not require a medium in its propagation. Examples of
electromagnetic waves are light, radio waves, TV waves, X-rays and gamma rays.
Acoustics is the science of sound also covers the generation, transmission and
sound effects. Sound is not only a natural phenomenon that occurs in the air and the
sound can only be heard but can also be generated through physical analogue
principles. Acoustic wave is a mechanical wave that propagates through the medium
of liquid, gas or solid (propagation structure).
Elastic waves can be generated at a range of 0.1 to 1 MHz in surface materials
change shape as a result of the reaction friction and wear of materials (R.M.Douglas
et al. 2006). Acoustic waves can also be generated by a vibrating or oscillating source.
Oscillation or vibration at some point will generate waves that can propagate to the
whole medium (M.Z.Nuawi 2008).
The machines operate fluctuations such as the internal combustion engine will
cause the acoustic waves can be generated by processes that occur in such combustion
engines, piston movement, sound of valve, the flow of gas and liquid reaction and
mechanical movement of the engine components (M.H.E.l- Ghamry et al. 2002). The
cause of generating acoustic waves in an internal combustion engine will also produce
waves of noise and vibration in the engine. Wave noise and low frequency vibration it
will also spread through sources that are hard to detect even using signal sensors.
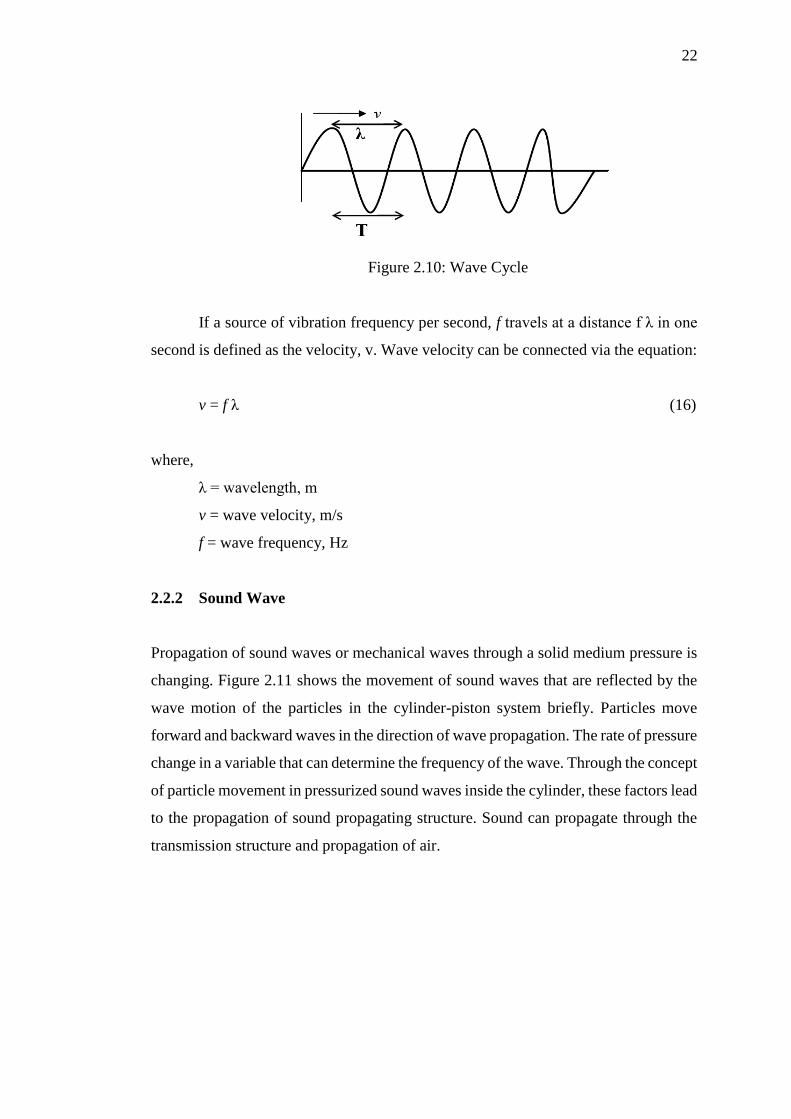
Figure 2.10 shows the wave cycle that has characteristics such as wavelength,
frequency and velocity. The time required to complete one cycle is normal, T. While
the total time for the cycle in one second is the frequency, f, and is measured in units
of hertz (Hz). The distance between the peak to peak or valley to valley distance
between the waves is called the wavelength, λ (R.C.Stanley 1968).
22
Figure 2.10: Wave Cycle
If a source of vibration frequency per second, f travels at a distance f λ in one
second is defined as the velocity, v. Wave velocity can be connected via the equation:
v = f λ (16)
where,
λ = wavelength, m
v = wave velocity, m/s
f = wave frequency, Hz
2.2.2 Sound Wave
Propagation of sound waves or mechanical waves through a solid medium pressure is
changing. Figure 2.11 shows the movement of sound waves that are reflected by the
wave motion of the particles in the cylinder-piston system briefly. Particles move
forward and backward waves in the direction of wave propagation. The rate of pressure
change in a variable that can determine the frequency of the wave. Through the concept
of particle movement in pressurized sound waves inside the cylinder, these factors lead
to the propagation of sound propagating structure. Sound can propagate through the
transmission structure and propagation of air.
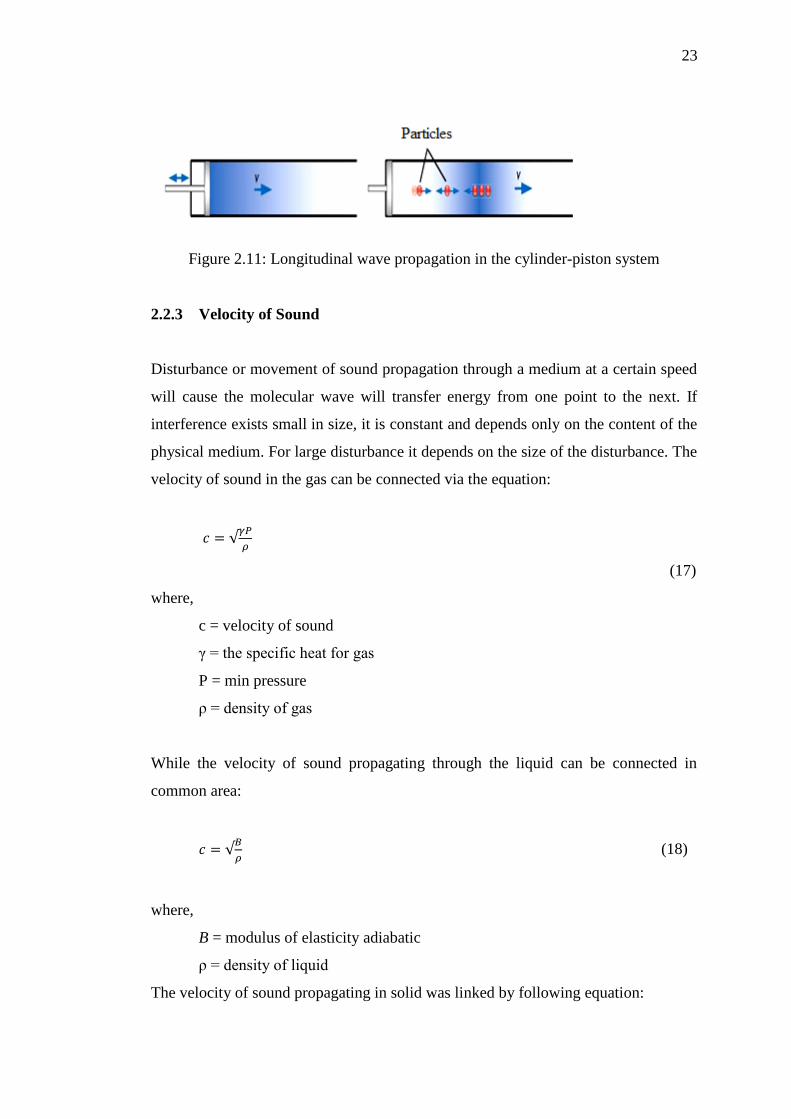
23
Figure 2.11: Longitudinal wave propagation in the cylinder-piston system
2.2.3 Velocity of Sound
Disturbance or movement of sound propagation through a medium at a certain speed
will cause the molecular wave will transfer energy from one point to the next. If
interference exists small in size, it is constant and depends only on the content of the
physical medium. For large disturbance it depends on the size of the disturbance. The
velocity of sound in the gas can be connected via the equation:
𝑐 = √𝛾𝑃
𝜌
(17)
where,
c = velocity of sound
γ = the specific heat for gas
P = min pressure
ρ = density of gas
While the velocity of sound propagating through the liquid can be connected in
common area:
𝑐 = √𝐵
𝜌 (18)
where,
B = modulus of elasticity adiabatic
ρ = density of liquid
The velocity of sound propagating in solid was linked by following equation:
24
𝑐 = √𝐸
𝜌
(19)
where,
E = modulus Young’s elasticity
ρ = density of solid
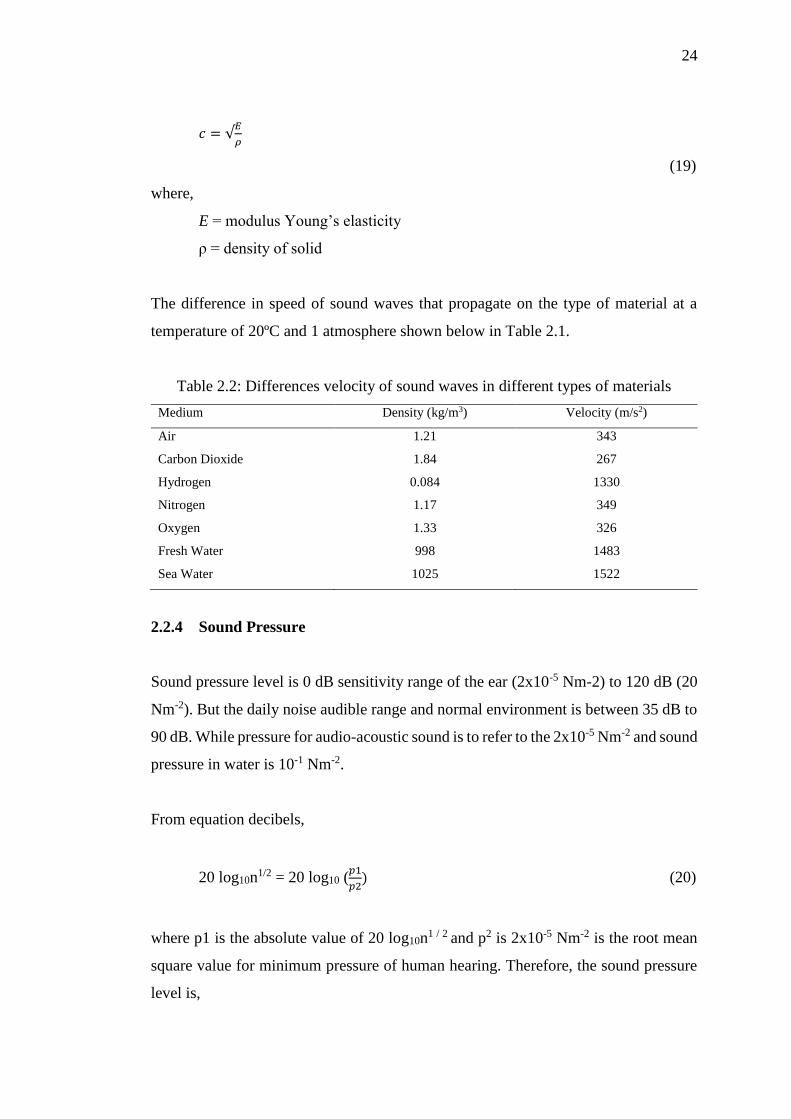
The difference in speed of sound waves that propagate on the type of material at a
temperature of 20ºC and 1 atmosphere shown below in Table 2.1.
Table 2.2: Differences velocity of sound waves in different types of materials
Medium Density (kg/m3) Velocity (m/s2)
Air 1.21 343
Carbon Dioxide 1.84 267
Hydrogen 0.084 1330
Nitrogen 1.17 349
Oxygen 1.33 326
Fresh Water 998 1483
Sea Water 1025 1522
2.2.4 Sound Pressure
Sound pressure level is 0 dB sensitivity range of the ear (2x10⁻⁵ Nm-2) to 120 dB (20
Nm-2). But the daily noise audible range and normal environment is between 35 dB to
90 dB. While pressure for audio-acoustic sound is to refer to the 2x10⁻⁵ Nm-2 and sound
pressure in water is 10-1 Nm-2.
From equation decibels,
20 log10n1/2 = 20 log10 (
𝑝1
𝑝2) (20)
where p1 is the absolute value of 20 log10n1 / 2 and p2 is 2x10⁻⁵ Nm-2 is the root mean
square value for minimum pressure of human hearing. Therefore, the sound pressure
level is,
REFERENCES
Albert H.C. Tsang, (1995), Condition-based maintenance: tools and decision making,
Journal of Quality in Maintenance Engineering, 1, (3),3 - 17
B.A.T Petersson & B.M.Gibbs. Towards a Structure-Borne Sound Source
Characterization. Journal of Applied Acoustic 61 (2000) 325-343.
Bloch, Heinz P., and Fred K. Geitner. Practical machinery management for process
plants. Volume 2: Machinery failure analysis and troubleshooting. Exxon
Chemical Co., Baytown, TX, 1983.
Chishlim S.D. (2014), http://ecmweb.com/blog/running-without-load
D. Mba1 and Raj B.K.N. Rao. 2006. Development of Acoustic Emission Technology
for Condition Monitoring and Diagnosis of Rotating Machines; Bearings,
Pumps,Gearboxes, Engines and Rotating Structures. The Shock and
Vibration Digest, 2006, Vol 38(1), pp3-16.
D.A. Taylor. 1999. Introduction to Marine Engineering. 2nd Edition. Oxford.
Butterwoth-Heinemann.
Grall, A., Berenguer, C, Dieulle, L. (2001) A condition-based maintenance policy for
stochastically deterioratin systems. Reliability Engineering and System
Safety, 76, 167-180
H.M. Abdul-Kader. 2009. Fuzzy Knowledge Base System for Fault Tracing of
Marine Diesel Engine. Communication of the IBIMA, Vol. 11, 2009 ISSN:
1943-7765.
International Maritime Organisation. 2009. New Ship Recycling Convention Set for
at Hong Kong Conference. International Conference on the Safe and
Environmentally Sound Recycling of Ships, Hong Kong, China, 11-15 May
2009. http:www.imo.org/newsroom/mainframe.asp
J. Lambs. 1986. The Running and Maintenance of the Marine Diesel Engine. 6th
Edition. Charles Griffin & Company Limited.
66
Jardine, A.K.S, Lin, D., Banjevic, D., A review on machinery diagnostics and
prognostics implementing condition-based maintenance, Mechanical Systems
and Signal Processing, 20, 1483-1510.
Knapp, G.M. and Wang, H.P. (1992), ``Machine fault classification: a neural
network approach,'' International Journal of Production Research, Vol. 30 No.
4, pp. 811-23.
Li, Y.G., Nilkitsaranont, P. (2009) Gas turbine performance prognostic for condition
based maintenance. Applied Energ, 86, 21525-2161
Mohd. Zaki Nuawi. 2008. Pembangunan Sistem Pemantauan Keadaan Perkakas
Mesin Menggunakan Kaedah Isyarat Ultrasonik Bawaan-Udara. Phd.
Universiti Kebangsaan Malaysia, hlm. 1-2.
M.Z.Nuawi, S.Abdullah, A.R. Ismail, R.Zulkifli, M.K. Zakaria and M.F.H. Hussin.
2008. A Study on Ultrasonic Signals Processing Generated From Automobile
Engine Block Using Statistical Analysis. Issue 5, Volume 4. ISSN: 1790-
5052.
N.E. Chell. 1999. Operation and Maintenance of Machinery in Motorships. Marine
Engineering Series, Vol. 1, Part 18. Institute of Marine Engineers. London.
M.H.El-Ghamry, R.L.Reuben and J.A.Steel. 2002. The Development of Automated
Pattern Recognition and Statistical Feature Isolation Techniques for the
Diagnosis of Reciprocating Machinery Faults Using Acoustic Emission.
Journal of Mechanical System and Signal Processing (2003) 17(4), 805-823.
Mann, Lawrence, Anuj Saxena, and Gerald M. Knapp. "Statistical-based or
condition-based preventive maintenance?." Journal of Quality in Maintenance
Engineering 1.1 (1995): 46-59.
Moubray, J (2001). Reliability-Centered Maintenance. NY: NY Industrial Press Inc.
P.Hynna. 2002. Vibrational Power Methods in Control of Sound and Vibration.
Research Report No. BVAL37-021229.
R.M.Douglas, J.A.Steel and R.L.Reuben. 2006. A Study of the Tribological
Behaviour of Piston Ring/Cylinder Liner Interaction in Diesel Engine Using
Acoustic Emission. Journal of Tribology International 39 (2006) 1634-1642.
R.C.Stanley. 1968. Light and Sound for Engineers. Thomas Nelson and Sons Ltd.
London. United Kingdom.
67
S.C. Behrens and J.F. Bohme. 2001. Applying Time-Frequency Methods to Pressure
and Structure –Borne Sound for Combustion Diagnosis. Signal Processing
and its Application, Sixth International, Symposium on 2001. Vol. 1, on
page(s): 256-259.
S.S. Hou. 2004. Heat Transfer Effects on the Performance of an Air Standard Dual
Cycle. Journal of Energy Conversion and Management 45 (2004) 3003–
3015.
S.A.Rosyidi, M.R.Taha, A. Ismail and Z.Chik. 2009. Penilaian Kualiti Subgred
Turapan Menggunakan Kaedah Analisis Spektrum Gelombang Permukaan.
Journal of Sains Malaysiana 38(1) 2009: 21-30.
Tsang, A. C. (1995). Condition based maintenance: Tools and decision making.
Journal of Quality in Maintenance Engineering, 1(3), 1-17.
Wood, Brian (1999). Intelligent building care, Facilities, Volume 17 · Number 5/6 ,
pp. 189–194