A Study for Understanding the Drainage Performance … · foot of the stack; and a house drain with...
13
A Study for Understanding the Drainage Performance of a Drainage Stack System Having an Offset, and on a Method for Predicting the Same R. SUGIMOTO(1), M. OTSUKA(2), 1. [email protected] 2. [email protected] 1. Graduate Student, Graduate School of Engineering, Kanto Gakuin Univ. Japan 2. Prof. Dr. Eng, Department of Architecture and Environmental Design College of Architecture and Environmental Design, Kanto Gakuin University, Japan Abstract In the case of providing a parking space on a lower floor of a building, piloties are constructed to secure outside space, and a horizontal offset is therefore provided as part of the drainage stack system for the building. In Japan, the drainage performance of drainage stack systems having an offset pipe is yet to be clarified, and at present, SHASE-S 206, a standard provided by the Society of Heating, Air Conditioning and Sanitary Engineers of Japan, cites the National Plumbing Code (NPC) in the USA. This study aims to understand, through experiments, the vent characteristics and the drainage performance of a loop-vent stack system having an offset for high-rise buildings, and to gather new design data by proposing a method for predicting the vent characteristics and the drainage performance of the drainage system. Keywords loop vent drainage system, drainage performance prediction method, offset, pipe network model, pipe pressure fluctuation CIBW062 Symposium 2013 37
Transcript of A Study for Understanding the Drainage Performance … · foot of the stack; and a house drain with...

A Study for Understanding the Drainage Performance
of a Drainage Stack System Having an Offset, and on a
Method for Predicting the Same R. SUGIMOTO(1), M. OTSUKA(2), 1. [email protected] 2. [email protected] 1. Graduate Student, Graduate School of Engineering, Kanto Gakuin Univ. Japan 2. Prof. Dr. Eng, Department of Architecture and Environmental Design College of
Architecture and Environmental Design, Kanto Gakuin University, Japan Abstract In the case of providing a parking space on a lower floor of a building, piloties are constructed to secure outside space, and a horizontal offset is therefore provided as part of the drainage stack system for the building. In Japan, the drainage performance of drainage stack systems having an offset pipe is yet to be clarified, and at present, SHASE-S 206, a standard provided by the Society of Heating, Air Conditioning and Sanitary Engineers of Japan, cites the National Plumbing Code (NPC) in the USA. This study aims to understand, through experiments, the vent characteristics and the drainage performance of a loop-vent stack system having an offset for high-rise buildings, and to gather new design data by proposing a method for predicting the vent characteristics and the drainage performance of the drainage system.
Keywords loop vent drainage system, drainage performance prediction method, offset, pipe network model, pipe pressure fluctuation
CIBW062 Symposium 2013
37

1 Background When a lower floor of a building is used as a parking space or the like that comprises pilotis, which are supporting columns, such a structure employs a plumbing method by which the drainage stack installed to the structure is very often offset horizontally to change the drainage flow and then oriented downwards. The offsetting of the stack is subject to rather complicated drainage and vent piping methods which SHASE-S 2061), a standard provided by the Society of Heating, Air Conditioning and Sanitary Engineers of Japan, cites from the National Plumbing Code (NPC) of the USA. The influence of the offset stack on the drainage system having special fittings, a type of stack vent system, was already discussed in the previous report3). Nonetheless, not enough study has been carried out on the influence of the offset stack on common types of drainage stack systems, which needs to be understood quantitatively. Therefore, this report examines the offset stack in the following four aspects. (1) The influence of the offset stack on the drainage performance and vent
characteristics of an experimental drainage stack system (2) Changing the drainage vent system from the stack vent type to the loop vent type (3) Changing the fittings of the offset stack (4) Proposing a drainage performance prediction method using a pipe network, and
validating the method by examining prediction results
2 Experiment overview 2.1 Experimental drainage stack systems The experimental drainage stack systems are as shown in Fig. 1 (1)-(3). (1) shows a stack vent type system (hereinafter referred to as the stack vent/standard system), (2) also shows a stack vent type system but where the stack is offset on the second floor (hereinafter referred to as the stack vent/offset system), and (3) shows a loop-vent type system where the stack is also offset in the same way as (2) (hereinafter referred to the loop vent/offset system). These three types of drainage stack systems shown in Fig. 1 are each 25m tall, comprise nine floors, and employ JIS-DT fittings. The diameters and pitches of the pipes used the systems are: the stack 100A; the horizontal fixture branch 75A (pitch 1/50); and the house drain and the offset 125A (pitch 1/150). The offset was positioned 700mm underneath the horizontal fixture branch on the second floor, drawn horizontally 4750mm, and then oriented downwards by one storey (4450mm) to be connected to the house drain. The loop vent/offset system in Fig. 1 (3) comprises a stack vent type drainage system, to which a vent stack and a loop vent pipe are connected, and each pipe has a diameter of 75A. As for the house drain, three types were used for the experiments: a straight house drain; a house drain with a bend positioned 1m from the
CIBW062 Symposium 2013
38
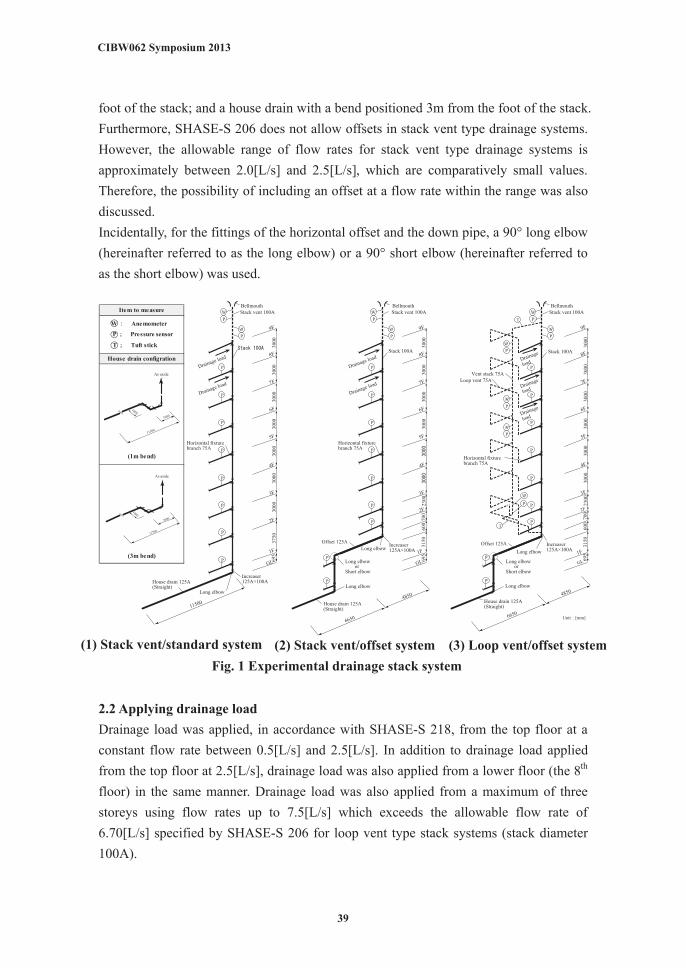
foot of the stack; and a house drain with a bend positioned 3m from the foot of the stack. Furthermore, SHASE-S 206 does not allow offsets in stack vent type drainage systems. However, the allowable range of flow rates for stack vent type drainage systems is approximately between 2.0[L/s] and 2.5[L/s], which are comparatively small values. Therefore, the possibility of including an offset at a flow rate within the range was also discussed. Incidentally, for the fittings of the horizontal offset and the down pipe, a 90° long elbow (hereinafter referred to as the long elbow) or a 90° short elbow (hereinafter referred to as the short elbow) was used.
2.2 Applying drainage load Drainage load was applied, in accordance with SHASE-S 218, from the top floor at a constant flow rate between 0.5[L/s] and 2.5[L/s]. In addition to drainage load applied from the top floor at 2.5[L/s], drainage load was also applied from a lower floor (the 8th floor) in the same manner. Drainage load was also applied from a maximum of three storeys using flow rates up to 7.5[L/s] which exceeds the allowable flow rate of 6.70[L/s] specified by SHASE-S 206 for loop vent type stack systems (stack diameter 100A).
(1) Stack vent/standard system (2) Stack vent/offset system (3) Loop vent/offset system Fig. 1 Experimental drainage stack system
695
Stack vent 100ABellmouth
Stack vent 100ABellmouth
Stack vent 100ABellmouth
Stack 100A Stack 100A Stack 100A
House drain 125A(Straight)
House drain 125A(Straight)
House drain 125A(Straight)
Horizontal fixturebranch 75A
Horizontal fixturebranch 75A
Horizontal fixturebranch 75A
P
P
P
P
P
P
P
WP
WP
Drainage load
9F
8F
7F
6F
5F
4F
3F
2F
1F
GL
3000
3000
3000
3000
3000
3000
3000
3750
P
Long elbowLong elbow Long elbow
Long elbow
Short elbow
Long elbow
Short elbow
Long elbow Long elbow
Increaser125A×100A
Increaser125A×100A
Increaser125A×100A
11500
Offset 125A Offset 125A
P
P
P
P
P
P
P
P
WP
WP
T
WP
WP
WP
W
P
T
9F
8F
7F
6F
5F
4F
3F
2F
GL
3000
3000
3000
3000
3000
3000
2300
700
600
695
3150
600
695
3150
P
P
P
P
P
P
P
P
P P
WP
WP
9F
8F
7F
6F
5F
4F
3F
2F
GL
3000
3000
3000
3000
3000
3000
2300
700
4850
6650
4850
6650Unit:[mm]
Vent stack 75ALoop vent 75A
1F 1F
or or
Drainage load
Drainage load
Drainage load
Drainage
load
Drainage
load
Drainage
load
(3m bend)
Item to measure
House drain configration
(1m bend)
W : AnemometerP : Pressure sensor
T : Tuft stick
11500
1000
1000
As aside
As aside
11500
3000
1000
CIBW062 Symposium 2013
39

2.3 Items to measure In the stack systems shown in Fig. 1 (1)-(3), variations of in-pipe wind velocity ○W were measured with a hot wire anemometer at predetermined points in the vent pipe. As for the loop vent/offset system (3), the direction of air flow ○T was measured, using a tuft stick method, at a predetermined point in the vent pipe and at a predetermined point around where the vent pipe is drawn from the foot of the stack. The air flow rate Qa was calculated by multiplying the average in-pipe wind velocity (wind velocity at the pipe centre × 0.82) by the pipe cross-sectional area. On each system, variations of in-pipe pressure ○P were also measured with a small semiconductor pressure sensor at predetermined points in the vent pipe and in the horizontal fixture branch on each floor.
3 Experiments results and considerations 3.1 Consideration of including an offset to the stack vent system Fig. 2 shows the comparison between the distribution of the in-pipe pressure measured in the stack vent/standard system in Fig. 1 (1) and the distribution of the in-pipe pressure measured in the stack vent/offset system in Fig. 1 (2). Furthermore, Fig. 2 (1) shows in-pipe pressure values which were measured when the total drainage load flow rate Qw was 2.5[L/s], which is close to the allowable flow rate for the stack vent system, and Fig. 2 (2) shows in-pipe pressure values measured when Qw was 5.0[L/s], which is close to the allowable flow rate for the house drain having a diameter of 125A. As illustrated in Fig. 2 (1), when the stack vent system comprised an offset stack (the stack vent/offset system), the minimum system pressure Psmin decreased by approximately 78-45[Pa] compared to the stack vent/standard system. Moreover, when the short elbow was used, the maximum system pressure Psmax generated in the horizontal fixture branch on the 2nd floor was measured to be 280[Pa], which was greater than when the long elbow was used. As in Fig. 2 (2) where Qw was 5.0[L/s], the positive pressure increased significantly in the stack vent/offset system, and Psmax was approximately 450[Pa] when the long elbow was used and a rather high positive pressure value of approximately 1200[Pa] was recorded when the short elbow was used.
CIBW062 Symposium 2013
40

Fig. 3 shows the comparison between Psmin and Psmax, which were measured in each of the stack vent type drainage systems (the stack vent/standard system and the stack vent/offset system), relative to the total drainage load flow rate Qw. As shown in Fig. 3, using the same house drain configurations, the same fitting conditions and the same Qw value of 2.0[L/s], Psmin values were measured to fall below the reference range in both the stack vent/standard system and the stack vent/offset system. This suggests that providing a stack vent type drainage system with an offset on a lower floor (the 2nd floor) would not affect the drainage performance of the system too much. In addition, although exceeding the allowable drainage performance value, positive pressure values were also measured to exceed the reference range, in the stack vent/offset system, when the short elbow was used and Qw exceeded 3.0[L/s], and when the long elbow was used and Qw exceeded 4.5[L/s].
(1)Qw = 2.5[L/s] (2)Qw = 5.0[L/s] Fig. 2 Comparison of in-pipe pressure distributions (straight)
Pmin Pave Pmax Pmin Pave Pmax Pmin Pave Pmax
Standard Long elbowOffset
Short elbow
Fig. 3 Comparison of Psmin and Psmax relative to Qw
Straight 1m bend 3m bend Straight 1m bend 3m bend Straight 1m bend 3m bend
StandardOffset
Long elbow Short elbow
CIBW062 Symposium 2013
41

Fig. 4 shows the relationship between the total drainage load flow rate Qw and the flow rate of the air flowing from the stack vent. As illustrated in Fig. 4, in both the stack vent/standard system and the stack vent/offset system, the difference in the air flow rates of the different pipe configurations became more significant as the drainage load flow rate increased, but was smaller in the stack vent/offset system. As the drainage load flow rate increased at 5.0[L/s], which is a value near the allowable flow rate stipulated by SHASE-S206 for house drains having a diameter of 125A (pitch 1/150), a difference of approximately 2-7[L/s] occurred in the air flow rates between the pipe configurations with and without the offset. Photo 1 shows a fitting of the offset, which was taken when drainage load was applied at 5.0[L/s] Qw. It is clear in the photo that the fitting part is blocked by the increased drainage water. This suggests that in the stack vent/offset system, the blockage was caused by the drainage water interrupting the air flow, thus, reducing the air flow rate.
3.2 Consideration of including an offset in the loop vent system Fig. 5 shows the comparison between the distribution of the in-pipe pressure measured in the stack vent/offset system and the distribution of the in-pipe pressure measured in the loop vent/offset system when Qw was 5.0[L/s] and a straight house drain was used. Fig. 5 (1) shows in-pipe pressure measurements in the case of using the long elbow, and Fig. 5 (2) shows in-pipe pressure measurements in the case of using the short elbow. As is clear from the graphs, with the long elbow, Psmin and Psmax were relaxed by approximately 78% and approximately 53%, respectively, and with the short elbow, Psmin and Psmax were both relaxed by approximately 63%. These results confirm that the in-pipe pressure can be relaxed in the loop vent system even when the stack is offset and regardless of the fitting condition.
125A×90°LL×125A
Photo 1 Fitting section blocked by drainage water (Qw=5.0[L/s])
90° long elbow (125A)
Horizontal offset (125A)
Offset down pipe (125A)
Fig. 4 Comparison of air flow rates relative to Qw
10
15
20
25
30
35
0.0 0.5 1.0 1.5 2.0 2.5 3.0 3.5 4.0 4.5 5.0 5.5
Air
flow
rat
e [L
/s]
Total drainage load flow rate Qw[L/s]
Decrease by 2-7[L/s]
Straight 1m bend 3m bend Straight 1m bend 3m bend Straight 1m bend 3m bend
OffsetLong elbow Short elbow
Standard
CIBW062 Symposium 2013
42

Fig. 6 shows the comparison between Psmin and Psmax in the loop vent/offset system relative to Qw. When the long elbow was applied to all the house drain configurations, the negative pressure fell below the reference range, but when the short elbow was applied to the straight house drain configuration, the positive pressure exceeded the reference range, and both the positive and negative pressures fell out of the reference range in the house drain configuration with a bend.
4 Analysis and analysis results 4.1Proposal of a pipe network model Fig. 8 shows the distribution of the average in-pipe pressure Pave in the drainage vent system. As illustrated, the distribution is divided into regions according to the distribution characteristics. The equations of the air flow rates measured at the branch points B-S shown in Fig. 7 and the balance equations f(Qai)~o(Qai) of the 10 closed circuits also indicated in Fig. 7, using air flow resistance ζ and suction force ⊿P/⊿L, were solved by a successive approximation method on the basis of the concept shown
(1) Long elbow (2) Short elbow Fig. 5 Comparison of in-pipe pressure distributions (straight)
Pmin Pave Pmax Pmin Pave PmaxStack vent system Loop vent system
Fig.6 Comparison of Psmin and Psmax relative to Qw
Straight 1m bend 3m bend Straight 1m bend 3m bendLong elbow Short elbow
CIBW062 Symposium 2013
43

in Fig. 10 using one of the closed circuits g(Qai) as an example. In the same manner, the air flow rates measured at the branch points B-S shown in Fig. 2 were calculated by simultaneous equations using the successive approximation method to calculate each of the air flow rates Qai=1~28. Incidentally, Fig. 8 shows two different distributions of pressure measured below the horizontal offset. This is because a mixed region of the air flow resistance and the suction force was created by the drainage load flow rate below the horizontal offset. When the drainage load flow rate was 0.5-3.0[L/s] and the load was applied from one location, the pressure measurements were within the suction force region of ⊿P/⊿L4, and as the drainage load flow rate was increased to 3.5-7.5[L/s] at which the drainage water blocked the air flow in the fitting section of the horizontal offset, the pressure measurements were within the airflow resistance region of P②4.
①V resion
①S2 resion
①S1 resion
②1 resion
⑤1 resion
②2 resion
②3 resion
②4 resion
④1 resion
④2 resion
④3 resion
⑤2 resion
1F
2F
3F
4F
5F
6F
7F
8F
9F3,
000
3,00
03,
000
3,00
03,
000
2,30
01,
300
3,00
03,
150
[mm]
1F
2F
3F
4F
5F
6F
7F
8F
9F
3,00
03,
000
3,00
03,
000
3,00
02,
300
1,30
03,
000
3,15
0[mm]
L1
L2
L3
P①V
P①S2 P①S1
P②1P②2
P②3
P⑤2
P⑤1
+
⊿P⊿L 2
⊿P⊿L 1
①V
①S2
①S1
②1
⑤1
②2
ζ
SV(i)ζ
LOV(k)ζ
ζ
②3ζ
ζ
ζ
ζ
ζ
+
+
+
+
+
+
+
+
+
+
④1
④2
P
P
④3
P②4
P④3P④4P
⊿P⊿L 3
⑤2ζ
②4ζ⊿P⊿L 4( )
f(Qai)
g(Qai)
h(Qai)
i(Qai)
j(Qai)
k(Qai)
l(Qai)
m(Qai)
n(Qai)
L3
L4
P⑤2
P⑤1
Drainage load Drainage load
Pmax(k)
Psmax
Psmin
Pmin(k)
Pave(k)
①
②
⑤
⑧
⑪
④
⑥
⑨
③
⑦
⑩
12
15
18
21
24
13
16
19
22
25
27
14
17
20
23
26
28
*
Fig. 7 Pipe network model of the loop vent/ offset system
Fig. 8 Distributions of avg. pressure
Fig. 9 Drawing explaining in-pipe pressure distributions using Psmin and Psmax *In the case of Qw being 0.5~2.5L/s (straight) and 0.5~3.0L/s
(1m bend), use the graph on the left for pressure measurements below the offset.
**The symbols refer to reference4).
Details shown in Fig. 10
Fig. 10 Pipe network model with the details of g(Qai) (circuit in Fig. 7)
g(x)=P②1-PLOV4-PSV7-PLOV6=0
Qa(C)=Qa4+Qa5-Qa2=0
Qa(D)=Qa3+Qa4-Qa7=0
Qa(E)=Qa5+Qa6-Qa8=0
Qa(F)=Qa7‐Qa6-Qa10=0
Closed circuit balance equation of g
Equation of Qa at each branching point
E
D
F
C
++Loop vent
Stack Vent stack
Loop vent
Qa 2Qa 3
Qa 10
PLOV6
P 2 1 PSV7
PLOV4
Qa 7
Qa 4
Qa 5
Qa 8
CIBW062 Symposium 2013
44

4.2 Prediction of the air flow rate In Fig. 11, the flow rates Qai=28 of the air flowing through the respective measurement points, which were predicted by analysing the pipe network model proposed in 3.1, are compared with the actual measured values. Fig. 11 (1) shows comparison results in the case of the drainage stack, and Fig. 11 (2) shows comparison results in the case of the loop vent pipe. As illustrated in the graphs, in the case of the straight house drain, the predicted values are close to the actual measured values in both the drainage stack and the loop vent pipe, resulting in errors within the range of ±10%. With the 1m bend, some errors are observed to exceed the range of ±10%, but the predicted values are close to the actual measured values in general.
4.3 Prediction of the in-pipe pressure Using the air flow rates Qai=1~28 which were calculated in 3.2, the average pressure Pave(k) per floor was calculated by the equation (1) and the equation (2). Furthermore, the maximum value Pmax(k) and the minimum value Pmin(k) of the pressure per floor were calculated by the equation (3) and the equation (4) using the average pressure per floor Pave(k) and the standard deviations σ1 and σ2 with reference to Fig. 12. As for N1
Qa 1 Qa 2 Qa5
Qa 8 Qa 11 Qa 14
Qa 17 Qa 20 Qa 23
Qa 26 Qa 28
Qa 4 Qa 6
Qa 9 Qa 12
Qa 15 Qa 18
Qa 21 Qa 24
Fig. 11 Comparison of predicted and actual measured air flow rates
1) Straight 2) 1m bend (1) Stack
(2) Loop vent pipe 1) Straight 2) 1m bend
CIBW062 Symposium 2013
45

used for calculating Pmax(k) per floor, it is approx. 2.46 to 3.75 (straight) and approx. 2.76 to 4.30 (1m bend), and N2 used for calculating Pmin(k) per floor is approx. -3.29 to -4.63 (straight) and approx. -3.13 to -3.66 (1m bend).
Using the calculated Pmax(k) and Pmin(k) values per floor, in-pipe pressure distributions were obtained as shown in Fig. 13. In the straight house drain (Fig. 13 (1)), the predicted values more or less correspond to the actual measured values, while in the house drain with the 1m bend (Fig. 13 (2)), the difference between the predicted and actual measured values becomes greater below the offset. This suggests that the formula for calculating the pressure gradient ⊿P/⊿L3 needs to be reviewed, as this is the key factor of the difference.
Fig. 14 shows the relationship of Qw with Psmin and Psmax, the predicted and actual measured values of which are compared with each other. The graph shows the results
AQai
2P
ρ=
①~②
iLLP
P ⊿
⊿=
④ LP
⊿
⊿
・・・(1)
・・・(2)
Psmin = Pave(min)+σ×N1
Psmax = Pave(max)+σ×N2
・・・(3)
・・・(4)
P①~④ : regional pressure loss [Pa]
ρ: air density [kg/m3]
Qai: air flow rate [L/s]
A: stack or offset cross-sectional area [m2]
: suction force per 1m stack [Pa/m]
Li: height [m] from the offset or the house drain [Pa] to the region ② floor
Fig. 12 Comparison of Pmax and Pmin relative to σ
N 1(k) N 2(k)
Straight 2.46~3.75 -3.29~-4.631m bend 2.76~4.30 -3.13~-3.66
(1) Straight (2) 1mbend Fig. 13 Comparison of in-pipe pressure distributionsQw=5.0[L/s])
Pmin Pave PmaxActual measured value
Predected value
CIBW062 Symposium 2013
46
obtained in the case of the straight house drain and in the case of the house drain with the 1m bend. The drainage performance of the straight house drain was predicted to be 6.5[L/s], and the actual measurement thereof was also 6.5[L/s]. The drainage performance of the house drain with the 1m bend was measured to be 6.0[L/s], whereas the predicted value thereof was 6.5[L/s], which created a 0.5[L/s] error. This is considered to have been caused by the value disparity asociated with the increased drainage load flow rate in the relationship between the standard deviation and the average pressure when calculating the N value which was used for obtaining Psmin and Psmax.
5 Comparison of drainage performance Fig. 15 shows the drainage performance values Qsc of the systems which are compared with each other. As indicated in the graph, the drainage performance of the stack vent systems is 2.0[L/s] regardless of being with or without the offset, the house drain configuration and the fitting condition. The drainage performance of the loop vent/offset system is affected noticeably by the fitting condition. The drainage performance of the straight house drain with the long elbow is 6.5[L/s], and it is 6.0 [L/s] with either the 1m bend or the 3m bend. The drainage performance of the straight house drain with the short elbow is 3.5[L/s], and it is 4.0[L/s] with the 1m bend and 4.5 [L/s] with the 3m bend. These results indicate that the drainage performance with the short elbow is inferior to the drainage performance with the long elbow by approximately 25-46%. In addition, with either fitting condition, the drainage performance is below the allowable flow rate of 6.7[L/s] specified by SHASE-S206 for loop vent systems.
Fig. 14 Drainage performance comparison between predicted and actual measured values
Actual measured value Predected value Actual measured value Predected valuePsminPsmax
Straight 1m bend
CIBW062 Symposium 2013
47

6 Conclusion Through experiments, the drainage performance and air flow characteristics of drainage stack systems having an offset were identified and the prediction of drainage performance was carried out using a pipe network model. Subsequently, the following knowledge was acquired. (1) The drainage performance of the stack vent type drainage system was not affected
by the offset installed thereto. Therefore, as long as the drainage performance value remains within the allowable range, it is possible to provide stack vent type drainage systems with an offset plumbed on a lower floor.
(2) The drainage performance of the loop vent type drainage system varies depending on the fitting condition; in the experiment, the difference was 6.0-6.5 [L/s] with the long elbow and 3.5-4.5[L/s] with the short elbow, which means that the drainage performance with the short elbow is inferior to the drainage performance with the long elbow by approximately 25-46%.
(3) The drainage performance prediction method was verified to be highly accurate, indicating, in the experiment, that the predicted drainage performance values corresponded to the actual measured drainage performance values in the case of the straight house drain, and the error was approximately 0.5[L/s] in the case of providing the house drain with the 1m bend.
Acknowledgements The study is supported in part by “Study on a Drainage System that Enables Free Planning of Water Circulation” (researcher representative: OTSUKA Masayuki), 2011, Grant-in-Aid for Scientific Research (c) No. 2156060621 by The Ministry of Education, Culture, Sports, Science and Technology
Fig. 15 Comparison of the drainage performance of the drainage vent systems
CIBW062 Symposium 2013
48

7 References 1) The Society of Heating, Air-conditioning and Sanitary Engineering of Japan:
SHASE-S 206-2009 Plumbing Code and the reference manual thereof , 2009 2) The Society of Heating, Air-conditioning and Sanitary Engineering of Japan:
SHASE-S 218-2008 Testing Methods of Flow Capacity for Drainage Systems in Apartment Houses, 2008
3) NAKAISHI Masao et al.: Research on variation plumbing of drainage system with special drainage fittings. Influence by offsets, level bends and junctions in a horizontal main pipe over the air pressure in the pipe, Transactions of SHASE Japan , 2003. 9
4) TSUKAKOSHI Mikihiro et al.: A Consideration on a Drainage Vent System for Super High-rise Buildings, Transactions of SHASE Japan , 1984. 10
5) OTSUKA Masayuki, KOUNO Shin : A Study of a Method for Predicting the Drainage Performance of Loop Vent Drainage Systems, CIB W062, 2012.8, Edinburgh
8 Presentation of Autors Ryota Sugimoto is a master of the Otsuka laboratory, Kanto Gakuin University. He is a member of AIJ (Architectural Institute of Japan) and SHASE (Society of Heating, Air-Conditioning and Sanitary Engineers of Japan). His current study interests are Grasp the drainage performance of loop vent system having an offset.
Masayuki Otsuka is the Professor at Department of Architecture and Environmental Design, Kanto Gakuin University. He is a member of AIJ (Architectural Institute of Japan) and SHASE (Society of Heating, Air-Conditioning and Sanitary Engineers of Japan). His current research interests are the performance of plumbing systems, drainage systems design with drainage piping systems for SI (Support and Infill) housing ,development of building energy simulation tool ( BEST ) and the performance evaluation of water saving plumbing systems.
CIBW062 Symposium 2013
49


![Notice of Decision – Approval - Indianapermits.air.idem.in.gov/23097f.pdf · than 0.001 grain per dry standard cubic foot, and exhausting at stack MV. [326 IAC 2-7-1(21)(G)(xxix)]](https://static.fdocuments.us/doc/165x107/5b9215dd09d3f26a278d28d4/notice-of-decision-approval-than-0001-grain-per-dry-standard-cubic-foot.jpg)