(A STUDY CASE OF PANTENE SHAMPOO AT CAREFOUR HYPERMARKET ...
114
THE EFFECT OF MARKETING MIX TOWARD BRAND AWARENESS OF PANTENE SHAMPOO (A STUDY CASE OF PANTENE SHAMPOO AT CAREFOUR HYPERMARKET, KOTA KASABLANKA) By Swietenia Harapan Triana 014201200113 A Skripsi presented to the Faculty of Business President University in partial fulfillment of the requirements for Bachelor Degree in Economics Major in Management February 2016
Transcript of (A STUDY CASE OF PANTENE SHAMPOO AT CAREFOUR HYPERMARKET ...
!!!!!!!!!!!
THE EFFECT OF MARKETING MIX TOWARD BRAND
AWARENESS OF PANTENE SHAMPOO
(A STUDY CASE OF PANTENE SHAMPOO AT CAREFOUR
HYPERMARKET, KOTA KASABLANKA)
By
Swietenia Harapan Triana
014201200113
A Skripsi presented to the
Faculty of Business President University in partial fulfillment of the requirements for
Bachelor Degree in Economics Major in Management
February 2016 !!!
PANEL OF EXAMINERS
APPROVAL SHEET The Panel of Examiners declare that the skripsi entitled “The Effect of Marketing Mix toward Brand Awareness of Pantene Shampoo (A Study Case of Pantene Shampoo at Carefour Hypermart, Kota Kasablanka)” that was submitted by Swietenia Harapan Triana majoring in Management from the Faculty of Business was assessed and approved to have passed Oral Examinations on February 15th, 2016.
Vinsensius Jajat K., S.E, M.M, MBA Chair-Panel of Examiners
Filda Rahmiati MBA Examiner I
Jhanghiz Syahrivar, B.Sc., MM Examiner II
SKRIPSI ADVISOR
RECOMMENDATION LETTER
This skripsi entitled “The Effect of Marketing Mix toward Brand Awareness
of Pantene Shampoo A Study Case of Pantene Shampoo at Carefour
Hypermart, Kota Kasablanka” prepared and submitted by Swietenia Harapan
Triana in partial fulfillment of the requirements of the degree of Bachelor in the
Faculty of Business has been reviewed and found to have satisfied the
requirements for a skripsi fit to be examined. I therefore, recommend this skripsi
for Oral Defense.
Cikarang, Indonesia, January 27th 2016
Acknowledged by, Recommended by,
Vinsensius Jajat K., S.E, M.M, MBA Jhanghiz Syahrivar, B.Sc., MM Head of Management Study Program Skripsi Adviser
DECLARATION OF ORIGINALITY
I declare that this skripsi, entitled “THE EFFECT OF
MARKETING MIX TOWARD BRAND AWARENESS OF
PANTENE SHAMPOO (A STUDY CASE OF PANTENE
SHAMPOO AT CAREFOUR HYPERMART, KOTA
KASABLANKA)” is, to the best of my knowledge and belief, an
original piece of work that has not been submitted, either in whole or
in part, to another university to obtain a degree.
Cikarang, Indonesia, January 27th 2016
Swietenia Harapan Triana
!
!
ABSTRACT
Marketing Mix is very important for a company to make their product survive in the market. There are 4 elements in marketing mix which will effect brand awareness of the customers, which are : product, price, place, and promotion. This research proposed to analyze the importance of marketing mix towards brand awareness of Pantene shampoo (A Study Case of Pantene shampoo in Carefour Hypermart, Kota Kasablanka). The purpose of this research is to determine the effect of marketing mix element (Product, Price, Place, and Promotion) simultaneously and partially towards brand awareness. This research use quantitative research method with binomial logistic regression analysis to analyze the data collected from questionnaire spreaded to the consumers who have purchased Pantene shampoo at Carefour Hypermart. The result of this research shows that there is significant effect of Product, Price, and Promotion toward Brand Awareness. In this research, the most significant variable that effect Brand Awareness is Price. Keywords: Product, Price, Place, Promotion, Brand Awareness.
ACKNOWLEDGEMENT
Praise to the Allah SWT that within his blessings so I can finish this skripsi on
time. Without the help of Allah SWT, I might not be able to to finish this skripsi
to fulfill my study requirement. In finishing this skripsi, I would like to say thank
to :
1. My family, especially my lovely father in the heaven Suhartono, my
lovely mother Sapta Rita, my sisters Cassuarina and Errytrina. Thanks for
your countless support and prayer for me until I came to this stage.
2. Big thanks to Mr. Jhanghiz Syahrivar for you advice, willingness, and
attention to share your knowledge in arranging my skripsi.
3. Thanks to my special friend Achmad Milzam for always giving me many
support and motivation to make me finish this skripsi.
4. Thanks to Andi Muhammad Ichlas, Inggrid Widya, Silvia Fendila and
Amania who shared the knowledge to help me in doing this skripsi.
5. Thanks to Randy Ardianto and Ekke Hanjari, Yoga Oktavinanda, and
Sandra Febriani to give me many support in doing my skripsi.
6. Thanks to Khaliluna Ravanala who always makes me happy and cheerful
while doing my skripsi.
7. Thanks to all Marketing 2012 students for sharing this unforgettable 3.5
years together im my university life.
! i!
TABLE OF CONTENTS LIST OF FIGURES ............................................................................................. iv LIST OF TABLE .................................................................................................. v
CHAPTER I ........................................................................................................... 1 1.1 Research Background ................................................................................. 1 1.2 Problem Identification ................................................................................ 4 1.3 Statement of Problem ................................................................................. 4 1.4 Research Objective ...................................................................................... 5 1.5 Definition of Term ....................................................................................... 5 1.6 Scope and Limitation .................................................................................. 6
1.6.1 Scope of the Study ................................................................................. 6 1.6.2 Limitation of Study ................................................................................ 6
1.7 Research Benefit .......................................................................................... 7 1.7.1 Benefit for Researcher ............................................................................ 7 1.7.1 Benefit for President University ............................................................. 7 1.7.2 Benefit for the Procter & Gamble Indonesia .......................................... 7 1.7.3 For Future Research ............................................................................... 8
CHAPTER II ......................................................................................................... 9 LITERATURE REVIEW ................................................................................. 9 2.1 Theoretical Review ...................................................................................... 9
2.1.1 Marketing ............................................................................................... 9 2.1.2 Marketing Mix ..................................................................................... 9 2.1.3 Brand .................................................................................................... 10 2.1.3 Brand Awareness ................................................................................. 11 2.1.4 Four variables of Marketing Mix ......................................................... 12
2.2 Previous Research ..................................................................................... 18 2.3 Operational Definition of Variables ....................................................... 20 2.4 Theoretical Framework ............................................................................ 25 2.5 Hypothesis .................................................................................................. 26
CHAPTER III ..................................................................................................... 27 RESEARCH METHODOLOGY .................................................................. 27 3.1 Research Methodology .............................................................................. 27
3.1.1 Quantitative Method ............................................................................. 27 3.1.2 Deductive Approach ............................................................................. 27 3.1.3 Research Design ................................................................................... 28
3.2 Research Instrument ................................................................................. 29 3.2.1 Primary Data ........................................................................................ 29 3.2.2 Secondary Data .................................................................................... 29 3.2.1 Data Analysis ....................................................................................... 32 3.2.2 Sampling Design .................................................................................. 32
! ii!
3.2.3 Population ............................................................................................ 33 3.2.4 Sample .................................................................................................. 33
3.4 Validity, Reliability, Correlation, and Multicollinearity ....................... 34 3.4.1 Validity ................................................................................................. 34 3.4.2 Correlation ............................................................................................ 35 3.4.3 Multicollinearity ................................................................................... 36
3.5 Data Collection .......................................................................................... 37 3.6 Testing the hypothesis ............................................................................... 38
3.6.1 Binomial Logistic Regression .............................................................. 38
CHAPTER IV ...................................................................................................... 40 DATA RESULT AND ANALYSIS ................................................................ 40 4.1 Company Profile ........................................................................................ 40
4.1.1 Procter & Gamble International ........................................................... 40 4.1.2 Procter & Gamble Indonesia ................................................................ 41 4.1.3 Pantene shampoo .................................................................................. 42
4.2 Data Result and Analysis .......................................................................... 43 4.2.1 Pilot Test .............................................................................................. 43
4.3 Descriptive Analysis .................................................................................. 45 4.3.1 Screening .............................................................................................. 45 4.3.3 Result Likert Scale Question ................................................................ 51
4.4 Corretion Test and Multicolinearity Analysis ........................................ 68 4.4.1 Correlation ............................................................................................ 68 4.4.2 Multicollinearity ................................................................................... 69
4.5 Binomial Logistic Regression ................................................................... 69 4.5.1 Output Overall Percentage ................................................................... 69 4.5.2 Pseudo R Square .................................................................................. 71 4.5.3 Omnibus Test ....................................................................................... 71 4.5.4 Output (Product, Price, Place, Promotion) ........................................... 72
4.6 Interpretation Result ............................................................................... 73 4.6.1 Product towards Brand Awareness of Pantene Shampoo in Carefour Hypermart, Kota Kasablanka ........................................................................ 73 4.6.2 Price towards Brand Awareness of Pantene Shampoo in Carefour Hypermart, Kota Kasablanka ........................................................................ 73 4.6.3 Place towards Brand Awareness of Pantene Shampoo in Carefour Hypermart, Kota Kasablanka ........................................................................ 74 4.6.4 Promotion towards Brand Awareness of Pantene Shampoo in Carefour Hypermart, Kota Kasablanka ........................................................................ 74
CHAPTER V ....................................................................................................... 75 THE CONCLUSION AND RECOMMENDATION ................................... 75 5.1 Conclusion .................................................................................................. 75 5.2 Recommendation ....................................................................................... 76
5.2.1 For Company ........................................................................................ 76 5.2.2 For Future Research ............................................................................. 77
REFERENCES .................................................................................................... 78

! iii!
APPENDIX 1 ....................................................................................................... 91
APPENDIX 2 ...................................................................................................... 95 APPENDIX 3 ....................................................................................................... 98
APPENDIX 4 ..................................................................................................... 100
!!!!!!!!!!!!!!!!

! iv!
LIST OF FIGURES FIGURE 1.1: TOP BRAND AWARD CATEGORY OF SHAMPOO .................. 2 FIGURE 2.2: THEORETICAL FRAMEWORK .................................................. 25 FIGURE 3.1: DEDUCTIVE RESEARCH ........................................................... 28 FIGURE 3.3: RESEARCH FRAMEWORK ........................................................ 37 FIGURE 4.1: HAVE YOU PURCHASED PANTENE SHAMPOO ................... 46 FIGURE 4.4: DEMOGRAPHIC VIEWS (GENDER) ......................................... 47 FIGURE 4.5: DEMOGRAPHIC VIEWS (AGE) ................................................. 47 FIGURE 4.7: DEMOGRAPHIC VIEWS (LATEST EDUCATION) .................. 48 FIGURE 4.6: DEMOGPRAHIC VIEWS (OCCUPATION) ................................ 49 FIGURE 4.8: DEMOGRAPHIC VIEWS (MARITAL STATUS) ....................... 50 FIGURE 4.2: THE BUDGET FOR PURCHASING SHAMPOO IN A MONTH ................................................................................................................ 50 FIGURE 4.3: FREQUENCY OF PURCHASING SHAMPOO IN A MONTH .. 51 FIGURE 4.9: PRODUCT STATEMENT 1 .......................................................... 52 FIGURE 4.10: PRODUCT STATEMENT 2 ........................................................ 52 FIGURE 4.11: PRODUCT STATEMENT 3 ........................................................ 53 FIGURE 4.12: PRODUCT STATEMENT 4 ........................................................ 53 FIGURE 4.13: PRODUCT STATEMENT 5 ........................................................ 54 FIGURE 4.14: PRICE STATEMENT 1 ............................................................... 54 FIGURE 4.15: PRICE STATEMENT 2 ............................................................... 55 FIGURE 4.16: PRICE STATEMENT 3 ............................................................... 56 FIGURE 4.17: PRICE STATEMENT 4 ............................................................... 56 FIGURE 4.18: PRICE STATEMENT 5 ............................................................... 57 FIGURE 4.19: PLACE STATEMENT 1 .............................................................. 57 FIGURE 4.20: PLACE STATEMENT 2 .............................................................. 58 FIGURE 4.21: PLACE STATEMENT 3 .............................................................. 59 FIGURE 4.22: PLACE STATEMENT 4 .............................................................. 59 FIGURE 4.23: PLACE STATEMENT 5 .............................................................. 60 FIGURE 4.24: PLACE STATEMENT 6 .............................................................. 60 FIGURE 4.25: PROMOTION STATEMENT 1 ................................................... 61 FIGURE 4.26: PROMOTION STATEMENT 2 ................................................... 62 FIGURE 4.27: PROMOTION STATEMENT 3 ................................................... 62 FIGURE 4.28: PROMOTION STATEMENT 4 ................................................... 63 FIGURE 4.29: PROMOTION STATEMENT 5 ................................................... 64 FIGURE 4.30: BRAND AWARENESS STATEMENT 1 ................................... 64 FIGURE 4.31: BRAND AWARENESS STATEMENT 2 ................................... 65 FIGURE 4.32: BRAND AWARENESS STATEMENT 3 ................................... 66 FIGURE 4.33: BRAND AWARENESS STATEMENT 4 ................................... 66 FIGURE 4.34: BRAND AWARENESS STATEMENT 5 ................................... 67
! v!
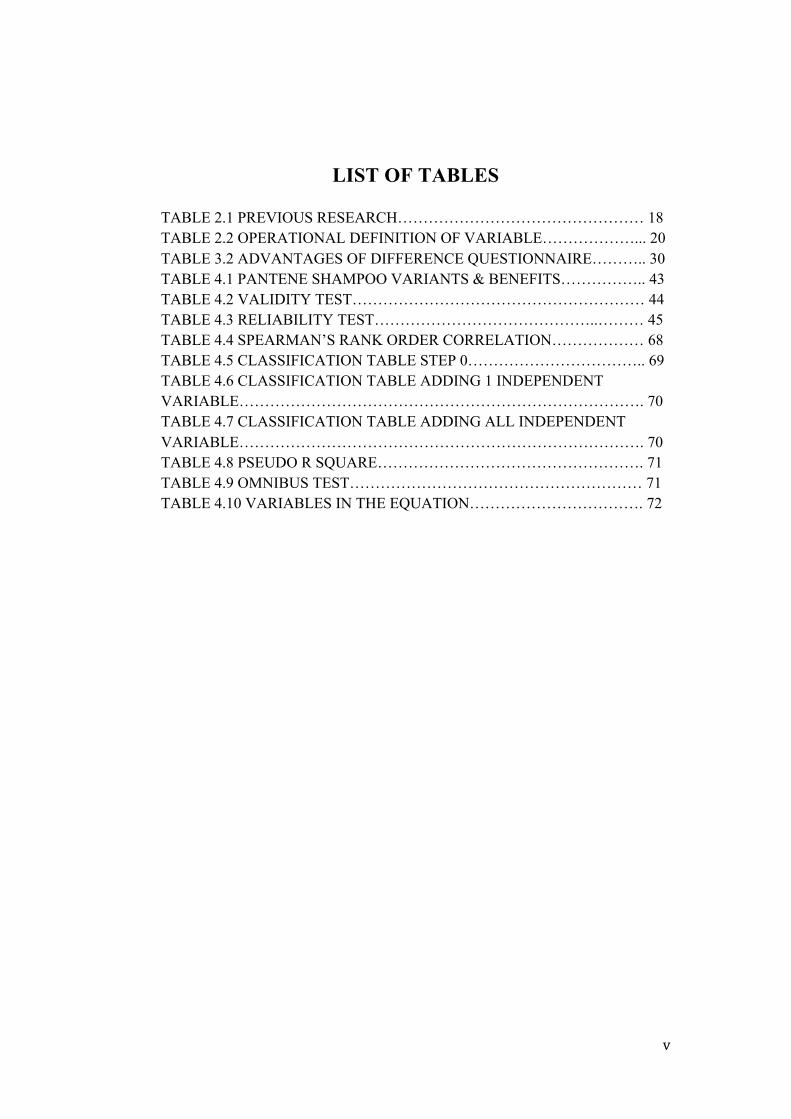
LIST OF TABLES TABLE 2.1 PREVIOUS RESEARCH………………………………………… 18 TABLE 2.2 OPERATIONAL DEFINITION OF VARIABLE………………... 20 TABLE 3.2 ADVANTAGES OF DIFFERENCE QUESTIONNAIRE……….. 30 TABLE 4.1 PANTENE SHAMPOO VARIANTS & BENEFITS…………….. 43 TABLE 4.2 VALIDITY TEST………………………………………………… 44 TABLE 4.3 RELIABILITY TEST……………………………………..……… 45 TABLE 4.4 SPEARMAN’S RANK ORDER CORRELATION……………… 68 TABLE 4.5 CLASSIFICATION TABLE STEP 0…………………………….. 69 TABLE 4.6 CLASSIFICATION TABLE ADDING 1 INDEPENDENT VARIABLE……………………………………………………………………. 70 TABLE 4.7 CLASSIFICATION TABLE ADDING ALL INDEPENDENT VARIABLE……………………………………………………………………. 70 TABLE 4.8 PSEUDO R SQUARE……………………………………………. 71 TABLE 4.9 OMNIBUS TEST………………………………………………… 71 TABLE 4.10 VARIABLES IN THE EQUATION……………………………. 72
! 1!
CHAPTER I
INTRODUCTION
1.1 Research Background In the capital city of Jakarta which has a tropical climate and high temperature,
sweating is become a common thing that the residents faced in Jakarta. The hot
climate, scorching sun and pollution on the streets can be a problem that supports
hair damage suffered by residents in Jakarta. To prevent dirty hair problem,
washing the hair with shampoo to clean the hair become the daily activity. Hair
care cleaning shampoo that are commonly used by people to clean the hair. The
main base material for producing shampoo is cleaning hair detergent, soap derived
from vegetable oil, alkyl benzene sulfonates, triethanolamine alkyl sulfates,
sulfated monoglycerides, sulfated oils and nonionics are typical (Boehm, et al.,
2002).
People want shampoo to more than just for washing the hair. Various adjustments
conducted by the manufacturers to fulfill the needs and desires of consumers. This
led to the appearance of various shampoos that can be found now (Astikariandini,
2009). The need for shampoo by people make the producers look for a business
opportunity to create shampoo products with a wide different types and different
benefits.
There are many shampoo brands in the market such as Sunsilk, Dove, Clear,
Rejoice and Pantene shampoo which compete each other to get the attention from
the target customers. The dynamics of the brands in the market suggests that
competition between brands on the market is increasing1.
!!!!!!!!!!!!!!!!!!!!!!!!!!!!!!!!!!!!!!!!!!!!!!!!!!!!!!!!1!Admin, “Top Brand: Barometer Kekuatan Merek”, www.topbrand-award.com, Oct 21st 2011.!
! 2!
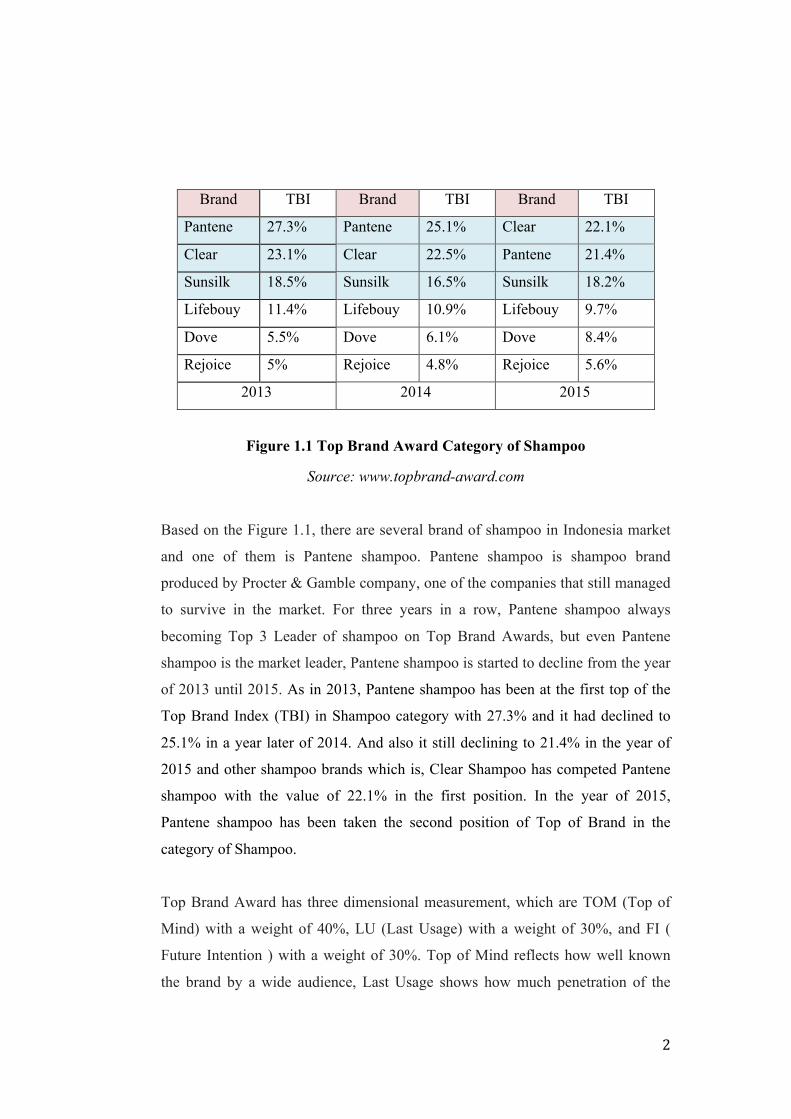
Brand TBI Brand TBI Brand TBI
Pantene 27.3% Pantene 25.1% Clear 22.1%
Clear 23.1% Clear 22.5% Pantene 21.4%
Sunsilk 18.5% Sunsilk 16.5% Sunsilk 18.2%
Lifebouy 11.4% Lifebouy 10.9% Lifebouy 9.7%
Dove 5.5% Dove 6.1% Dove 8.4%
Rejoice 5% Rejoice 4.8% Rejoice 5.6%
2013 2014 2015
Figure 1.1 Top Brand Award Category of Shampoo
Source: www.topbrand-award.com
Based on the Figure 1.1, there are several brand of shampoo in Indonesia market
and one of them is Pantene shampoo. Pantene shampoo is shampoo brand
produced by Procter & Gamble company, one of the companies that still managed
to survive in the market. For three years in a row, Pantene shampoo always
becoming Top 3 Leader of shampoo on Top Brand Awards, but even Pantene
shampoo is the market leader, Pantene shampoo is started to decline from the year
of 2013 until 2015. As in 2013, Pantene shampoo has been at the first top of the
Top Brand Index (TBI) in Shampoo category with 27.3% and it had declined to
25.1% in a year later of 2014. And also it still declining to 21.4% in the year of
2015 and other shampoo brands which is, Clear Shampoo has competed Pantene
shampoo with the value of 22.1% in the first position. In the year of 2015,
Pantene shampoo has been taken the second position of Top of Brand in the
category of Shampoo.
Top Brand Award has three dimensional measurement, which are TOM (Top of
Mind) with a weight of 40%, LU (Last Usage) with a weight of 30%, and FI (
Future Intention ) with a weight of 30%. Top of Mind reflects how well known
the brand by a wide audience, Last Usage shows how much penetration of the

! 3!
brand in a broad audience, then Future Intention show how attractive a brand to a
wide audience in the future.
Raeros and Nugrahani (2012) stated that each brand must have a competitive
advantage in order to differentiate them to another brands. So that a product brand
can be differentiated by product brand from another company, the product must
have a unique or distinct advantages compared to other brands from other
companies. It is also namely as competitive advantage that can make these
products can compete with other products. Some of the consumers are only
willing to buy those brands which famous in the market (Malik, et al., 2013).
Brand awareness is the first and fundamental attribute of customer brand equity
and sometimes it is underestimated component of brand equity (Tong & Hawley,
2009). There are four levels of brand awareness revealed by (Rangkuti, 2008:40),
which are Unaware of Brand, Brand Recognition, Brand Recall, and Top of Mind.
One of stage that can create brand awareness is Top of Mind which if someone
asked directly without the clue given and the person can recall and mentioning the
name of the brand, the brand most mentioned in first is Top of Mind.
In order to get the attention of the target customer, the company must build brand
awareness so they can easily sell their products to customer because the customer
know that their product has existed in the market. Before the customer can decide
to buy a product, of course, the customer should be aware of the brand of its
product. A brand consists of a name, term, sign, or symbol, or any combination of
them, that attempts to represent the unique benefits a company can provide to
consumers through a particular product or service, in terms of attributes, value,
and culture (Wang & Yang, 2010).
Competitive advantages that are usually used by a company is marketing mix,
which consists of 4 variables or so-called 4P which is the core of the marketing
system, namely : product, price, place and promotion, which is expected to build
brand awareness if pursued maximally (Raeros &Nugrahani, 2012). The fourth
! 4!
component of the marketing mix above should be considered as possible by a
company to be able to compete with other companies in a market.
The researcher use Brand Awareness to be analyzed in this research since the
previous researcher about marketing mix towards barand awareness conducted by
Raeros & Nugrahani (2012) that analyze Samsung Smartphone Android in
Bandung. So that in this research, the researcher is interested to analyze The
Effect of Marketing Mix toward Brand Awareness of Pantene shampoo (A
Study Case of Pantene Shampoo at Carefour Hypermarket, Kota
Kasablanka).
1.2 Problem Identification Based on Figure 1.1, the problem identify in this study is Top Brand Index (TBI)
of Pantene shampoo decreasing in Top Brand Awards of Shampoo Category from
the year of 2013 which is 27.3%, 2014 which is 25.1% and until 2015 which is
21.4%. Also, the position of Pantene which ranked the first position in 2014, it
became decrease to the second position of Top Brand Award in shampoo
category. The reason why the researcher choose this issue is to find out if there is
any effect between the marketing mix toward customer’s brand awareness for
Pantene shampoo.
1.3 Statement of Problem The problem statement of this research will be shown in form of question as
stated below :
1. Is there any partial significant effect of Product towards Brand Awareness of
Pantene shampoo at Carefour Hypermart, Kota Kasablanka ?
2. Is there any partial significant effect of Price towards Brand Awareness of
Pantene shampoo at Carefour Hypermart, Kota Kasablanka ?
3. Is there any partial significant effect of Place towards Brand Awareness of
Pantene shampoo at Carefour Hypermart, Kota Kasablanka ?
! 5!
4. Is there any partial significant effect of Promotion towards Brand Awareness of
Pantene shampoo at Carefour Hypermart, Kota Kasablanka ?
5. Is there any simultaneous significant effect of Marketing Mix (Product, Price,
Place, and Promotion) towards Brand Awareness of Pantene shampoo at
Carefour Hypermart, Kota Kasablanka ?
1.4 Research Objective Based on the topic “The Effect of Marketing Mix toward Brand Awareness of
Pantene shampoo”, the researcher made several objectives which stated below :
1. To know partial significant effect of Product towards Brand Awareness of
Pantene shampoo at Carefour Hypermart, Kota Kasablanka.
2. To know partial significant effect of Price towards Brand Awareness of
Pantene shampoo at Carefour Hypermart, Kota Kasablanka.
3. To know partial significant effect of Place towards Brand Awareness of
Pantene shampoo at Carefour Hypermart, Kota Kasablanka.
4. To know partial significant effect of Promotion towards Brand Awareness of
Pantene shampoo at Carefour Hypermart, Kota Kasablanka.
5. To know simultaneous significant effect of Product towards Brand Awareness
of Pantene shampoo at Carefour Hypermart, Kota Kasablanka.
1.5 Definition of Term • Product
Product means anything that can be offered to a market for attention,
acquisition, use, or consumption that might satisfy a want or need. It includes
physical objects, services, persons, places, organizations and ideas.
(Kotler & Bowen, Makens 2013)
! 6!
• Price
Price is the amount of money charged for a product or service, or the total
values that consumers exchange for the benefits of having or using the product
or service (Kotler, Armstrong, Wong & Saunders, 2008).
• Place
Place or distribution strategy concerns with making the products or service
available anytime and anywhere the customers want them (Lamb, et al., 2010).
• Promotion
Promotion is promotion is marketing and communication activities which later
can change the price-value relationship of product or service that perceived by
target (Shah, 2009).
• Brand Awareness
Brand awareness is related to the strength of the brand node or trace in
memory, which we can measure as the customer’s ability to identify the brand
under different condition (Keller, 2013).
1.6 Scope and Limitation
1.6.1 Scope of the Study
The researcher will do the research about The Effect of Marketing Mix toward
Brand Awareness of Pantene shampoo at Carefour Hypermart, Kota Kasablanka.
The scope of this research is the buyer of Pantene shampoo at Carefour
Hypermart, Kota Kasablanka.
1.6.2 Limitation of Study
The limitation that the researcher faces in this study is time limitation, budget
limitation, questionnaire distribution and unfamiliar method for the researcher.
! 7!
Since the researcher has a limited time to complete the research, researcher needs
to have an undivided attention to make sure the research finished on time. This
makes the researcher to only be able to deliver the questionnaire in one wholesaler
market. When distributing the questionnaire, researcher have some problem when
not all people want to cooperate to help researcher to fill in the questionnaire, thus
the researcher took a quite a while time to collect the primary data. In this
research, researcher also learns a new method to process the data. Because it is
still new for researcher, researcher took some time to understand the method.
1.7 Research Benefit
1.7.1 Benefit for Researcher
This research will help the researcher to solve the problem whether it is still
necessary for marketers to still improving their marketing mix and how does it
effect the consumer brand awareness. It will also help the researcher to know
better about the product’s marketing mix and also marketing aspects that effect
brand awareness.
1.7.2 Benefit for President University
The researcher would like to contribute in education needs of student that are
looking for theory about Product, Price, Place, Promotion, and Brand Awareness.
1.7.3 Benefit for the Procter & Gamble Indonesia
This research will help Procter & Gamble Indonesia Company to know better
about the brand awareness and determine the marketing mix element. It will also
help the company to decide the best strategy suited with the consumer of Carefour
Hypermart, Kota Kasablanka.

! 8!
1.7.4 For Future Research
This research will help future researcher to gain information about the current
market condition. The research will provide additional knowledge and some
factors between marketing mix elements and brand awareness can effect the
customer to aware about the brand awareness.
! 9!
CHAPTER II
LITERATURE REVIEW
2.1 Theoretical Review
2.1.1 Marketing According to Ahmed & Rahman (2015), “Marketing as a social and managerial
process whereby individuals and groups obtain what they need and want through
creating and exchanging products and value with others”. “Marketing is an
organization function and a set processes for creating communicating, and
delivering value to customers and for managing customer relationship in ways
that benefit the organization and it stakeholders” (Kotler & Keller, 2009). The
need to make the sale will always be available. However, the purpose of
marketing is to increase maximum sales. Also, the purpose of marketing is to
understand, to maintain and know the customers well so as to create a customer to
buy a product. Thus, it needs to be ensured is the availability of products and
services (Raeros & Nugrahani, 2012).
2.1.2 Marketing Mix “Marketing mix is defined as the set of tactical marketing tools (4Ps) that a
business blends to produce the response it wants in the target market” (Kotler &
Armstrong, 2014).
According to Kotler, Armstong & Cunningham, (2005) “The marketing mix is the
set of controllable, tactical marketing tools that a company uses to produce a
desired response from its target market. It consists of everything that a company
can do to influence demand for its product. It is also a tool to help marketing
planning and execution”. Kotler & Armstrong (2010) “Marketing mix is the set of
marketing tools the form uses to implement its marketing strategy”. The tools that
! 10!
make up the marketing mix can be categorised into 4 major groups, also known as
the “4 P’s of Marketing”, these are :
1. Product: This is the service/product/item that the firm is marketing to
fulfill a specific need.
2. Price: The value that the firm will be charging for the product.
3. Place: How will the firm make the Product available to it’s target
consumers.
4. Promotion: The method in which the firm will convince the target
consumers to purchase the product.
2.1.3 Brand “A brand is a name, term, sign, symbol or design, or a combination of them,
intended to identify the goods or services of one seller or group of sellers and to
differentiate them from those of competitors” (Kotler & Keller, 2009). A brand
consists of a name, term, symbol or sign that may be characteristic, or a
combination of them, who may represent the uniqueness of the company to the
consumers through the products or services they result in terms of attributes,
values and culture (Wang & Yang, 2010).
Doostar, Abadi & Abadi (2012) defined good brand is a set of what to a particular
product is related, such as name, brand, symbol and sensory quality of a product
or service. Rapid globalization of markets and intense competition activities has
prompted market leaders that for their design and marketing programs find new
perceptual principles; because traditional marketing approaches are no able to
compete with the complexities of the modern age (Doostar, Abadi, & Abadi,
2012)
According to Kotler view ultimate goal of to perform tests is highlighting the
company's share in the share of competitors. In discussion of brands sometimes
will be given in only one aspect of it, for example, name or logo. However, brand
management purpose is total of system as cited in (Doostar, Abadi, & Abadi,
! 11!
2012). To conclude, a brand is nothing but simply can be defined as an entity
(product, service, place, person, technology, organization) that is offered by a
marketer. Companies build a brand through their products, packaging, logos, and
advertisements. It also consists of other sets of expectation related to a product or
service which normally arise in people’s mind
2.1.3 Brand Awareness Brand awareness is reflects that customer can identify one brand among several.
Brand awareness is kind of value for brand, because customer remembers it.
Customer are related to brand knowledge and finally lead to advantage. Brand
awareness impact on customer decisions (Huang & Sarigollu, 2012).
Brand awareness can be called a consumer 's ability to recognize and remember
the brand in a product category . reminder can be through the name, symbol,
slogan advertising and brand attributes and brand recognition (Doostar, Abadi, &
Abadi, 2012). According to Keller view, brand awareness is a fundamental
condition for creation of the brand image. When a brand is well established in the
memory, relating association to brand and their right settling in memory, it is
easier.
Brand awareness is the probability that, consumers are familiar about the
availability and accessibility of a company’s product and service. If an
organization has a high level of brand awareness of the products and services of
the organization has a good reputation and easily accepted (Malik, et al., 2013).
The awareness of the brand plays a significant role while purchasing a product or
service and may have control on perceived risk evaluation of consumers and their
level of assurance about the buying decision due to awareness with the brand and
its uniqueness (Malik, et al., 2013). Brand awareness is very important because if
there will be no brand awareness no communication and no transaction will be
! 12!
occur (Wang, 2010). Some of the consumers can make rule to purchase only those
brand which are famous in the market (Malik, et al., 2013).
There are four levels of brand awareness revealed by (Rangkuti, 2008:40):
1. Unaware of the brand
Represents the lowest level in the pyramid brand awareness, where
consumers are not aware of the existence of a brand (never seen, heard,
read, or even know of) a particular brand.
2. Brand Recognition
This is important when a buyer selects a brand in the making of decisions
or make purchases.
3. Brand recall.
Recollection of the brand is based on a person's request to mention a
specific brand in a class of products. This is termed recollection without
help, because it is different from the recognition task, the respondent does
not need to be assisted to bring the brand.
4. Top of Mind
If someone asked directly without the aid given and the person can recall
mentioning the name of the brand, the brand most mentioned first is top of
mind.
2.1.4 Four variables of Marketing Mix
2.1.4.1 Product
Kotler and Keller (2009) defined product as “Anything that can be offered to a
market to satisfy a want or need”. Jilbril & Odua (2013) see product as “Anything
or item that can be considered as a separate product entity and that may be
distinguished in some way from other products that the company produces,
irrespective its relationship to those other products”. From above we conclude that
meet human needs and desires is marketing purposes. However, due to the needs
and desires of a changing market, manufacturers must always be thinking of new
innovations to meet the new needs and the new desires of their customers (Jilbril
! 13!
& Odua, 2013). They are willing to purchase the product because they see that the
attribute of the product has good quality.
Kotler and Armstrong (2008) stated that "The quality of the product is the ability
of a product to perform its functions are include durability, reliability, accuracy,
ease of operation and repair as well as other attributes". When a product has been
able to carry out its functions can be said to be a product that has a good quality.
2.1.4.2 Product and Brand Awareness Relationship
According to Tong & Hawley (2009), brand awareness is the first and
fundamental attribute of customer brand equity and sometimes it is
underestimated component of brand equity. Build a good strategy to increase
brand awareness is the first way a company to be able to introduce their products
to the target consumer. Building brand awareness is a strategy applied by
consumers in order to save time and effort when dealing with an unknown brand,
they would devote to comparing the products in relation to other attributes, such
as quality, packaging and price.
Brand awareness may be therefore interpreted as cognitive simplification.
Purchasing choices are made by reference to such simplification, especially when
the product is cheap and easily disposable (food, hygienic and everyday-use
products). Brand awareness has a great influence on selections and can be a prior
consideration base in a product category (Koniewski, 2012).
Brand awareness can be distinguished from depth and widht (Hoeffler & Keller,
2002). Depth means how the consumer recognize the brand easily and widht
means the brand comes to the consumer’s mind when they purchased the product
at once. If a product owns brand depth and brand width at the same time,
consumers will think of a specific brand when they want to buy a product. That is,
the product has higher brand awareness (Koniewski, 2012).
! 14!
A product with a high level of brand awareness will receive higher consumer
preferences because it has higher market share and quality evaluation (Chi, Yeh &
Yang 2009). (Fitriani 2015) stated an experience of using the product increase
brand awareness. In other words, the more often a consumer purchase and use of a
product, it will make the brand awareness for its product higher. Once a brand has
the brand awareness, then the consumer will choose the brand as a preference.
2.1.4.3 Price
According to Kotler, Armstrong, Wong & Saunders (2008), price is the amount of
money charged for a product or service, or the total values that consumers
exchange for the benefits of having or using the product or service. Price is the
amount of money charged for goods or services, or is the sum of the values
consumers exchange for the benefits of having or using the product or service
(Kotler, Bowen & Makens, 2013).
According to Tjiptono (2007) that stated price is the monetary unit or other
measures (including goods and services) that are exchanged in order to acquire the
right of ownership or use of the goods or services. Price is the only element of the
marketing mix that provide income or revenue for the company, while the other
three elements (products, place and promotion) provide costs. In addition, the
price is an element of the marketing mix is flexible, meaning it can be changed
quickly (Ardhana, 2010).
2.1.4.4. Price and Brand Awareness Relationship
Price seen from a consumer’s point, it is often used as an indicator of the value
when the price is linked to benefits perceived goods or services. Value can be
defined as the ratio between the perceived benefits of the price. It can be
concluded that at a certain price level, if the perceived benefits increases, the
value will increase as well (Ardhana, 2010).

! 15!
In a study conducted by Raeros & Nugrahani (2012) regarding the analysis factors
that affect the brand awareness of Samsung smartphones in the city of Bandung,
the research results stated that price has significant partially effect on brand
awareness. The price of a product is a decisive factor in the success of the brand
to dominate the market (Fitriani, 2015). Thus, the price difference between brand
of shampoo in the market do not have much difference, because each brand set
competitive prices each other.
2.1.4.5 Place
Kotler (2010) states that “Distribution channel consists of a set of institutions that
perform all activities (functions) that are used to distribute products and status of
the owner of the producer to the consumer". Place identical with the distribution
(Pereault & Mc Charty, 2004). From the definition above means that the channel
of distribution of goods is the overall activity or function to move the product
along with its owner the right of producers to consumers. Distribution related to
the ease of obtaining the product in the market and available when consumers
look for.
Distribution system to put a product on the market with time and the right location
is one of the success strategy that can be done by a company to facilitate
customers get products that the the producers sell. Basically the place issues
related to the problem of the distribution of the products that it offers to those who
request it. Meaning the distribution, can be defined as marketing activities are
trying to expedite and facilitate the delivery of goods and services from producers
to consumers, so its use as required (Tjiptono, 2008).
2.1.4.6 Place and Brand Awareness Relationship
According to Kashmir and Jakfar (2003) stated that place or distribution is a
network of organizations and functions that connect producers to final consumers.
Determination of the number of distributor is also an important issue for
considered, in certain cases be adapted to the product offered. According to
! 16!
(Tjiptono, 2008) distribution can be defined as activities in marketing which
trying to facilitate and simplify the delivery of goods and services from producer
to consumer. So they can use in accordance with the necessary. So, the marketing
manager needs to be cautious in selecting and determining the number of
distributor to distribute their product effectively, the distribution of the product in
the market that allows consumers to get such products affect brand awareness
towards that product. Consumers will be more familiar with those products, if the
products are distributed in many places .
2.1.4.7 Promotion
Promotion is an activity that plays an active role in introducing inform and
remind of a product in order to encourage consumers to buy the product being
promoted. A company must be able to determine what the appropriate
promotional tools in order to achieve success in sales. Promotion includes all of
the activities marketers undertake to inform consumers about their products and to
encourage potential customers to buy these products (Solomon, et al,. 2013). Also
Kotler dan Armstrong (2010) Promotion means activities that communicate the
merits of product and persuade target customers to buy it. From both of the
opinion above can be concluded that the promotion is one of the marketing mix
variables essential implemented by the company to deliver the benefits of the
product and persuade customers to buy it.
Promotional activities are generally carried out through programs of integrated
marketing communications, otherwise known as the promotional mix. According
to Kotler & Armstrong (2010) there are five promotional mix, which are :
a. Advertising
All forms of paid non-personal presentation and promotion of ideas, goods, or
services with a particular sponsor.
b. Sales promotion
Intensive short term to encourage the purchase or sale of products or services.

! 17!
c. Personal selling
Personal presentation by the salesperson's company for the purpose of generating
sales and build customer relationships.
d. Direct marketing
Direct relationships with individual consumers targeted carefully to obtain
immediate response and build customer relationships lasting for example such as
the use of direct mail, telephone, television direct response, e-mail, internet and
other means to communicate directly with specific consumers.
e. Public Relations
Involves building good relations with the company’s various publics by obtaining
favorable publicity, building up a good corporate image, and handling or heading
off unfavorable rumors, stories, and events.
2.1.4.8 Promotion and Brand Awareness Relationship
Marketing communications activities contribute to brand equity and drive sales in
many ways (Kotler & Keller, 2009) by creating awareness of the brand, linking
the right associations to the brand image in consumers’ memory, eliciting positive
brand judgments or feelings, and/or facilitating a stronger consumer–brand equity.
Brand awareness can be reached in the following ways (Yudiartika & Haryanto,
2012):
1. The message conveyed should be easy to remember and look different.
Wearing a slogan or interesting jingle song make consumers can more
easily remember.
2. Repetition to remember the brand.
3. The expansion of the brand name can be used in order to make brand more
memorable in customer’s mind.
4. Increase the promotion from both print and electronic media .
5. Sponsoring an event that brings many spectators.
! 18!
One of the point above that shows the influence of promotion from both in printed
and electronis media can increase the brand awareness of the product.
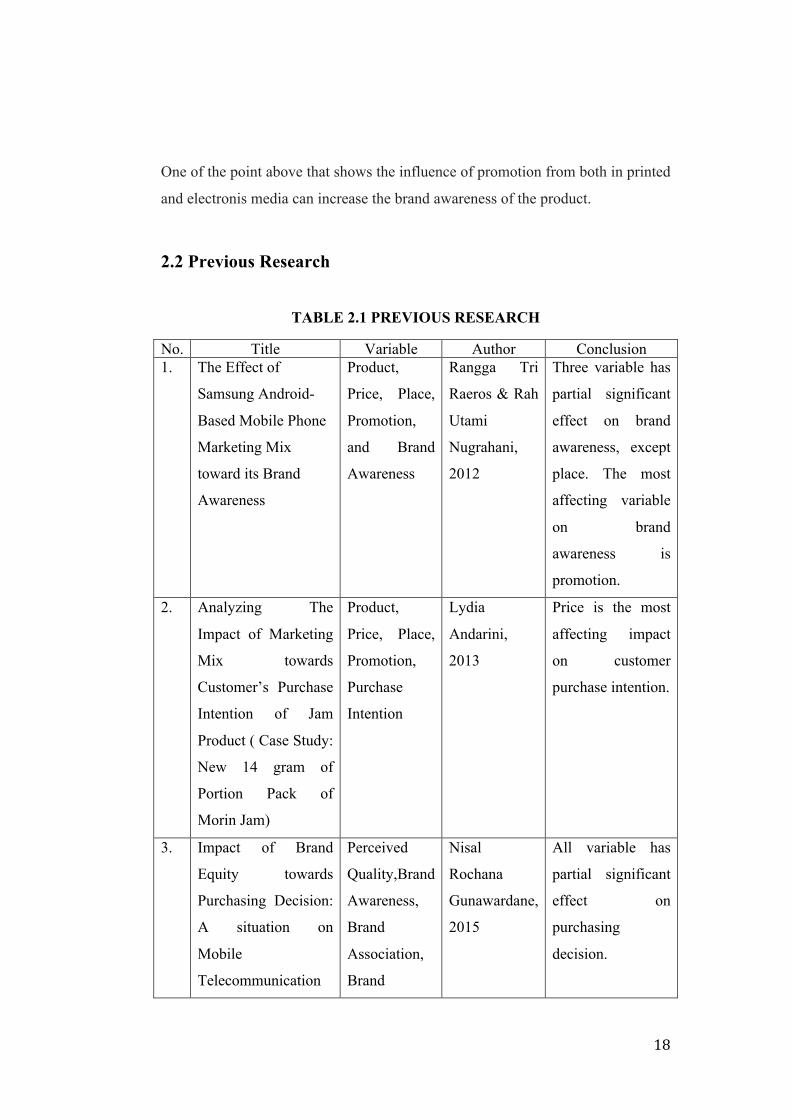
2.2 Previous Research
TABLE 2.1 PREVIOUS RESEARCH
No. Title Variable Author Conclusion 1. The Effect of
Samsung Android-
Based Mobile Phone
Marketing Mix
toward its Brand
Awareness
Product,
Price, Place,
Promotion,
and Brand
Awareness
Rangga Tri
Raeros & Rah
Utami
Nugrahani,
2012
Three variable has
partial significant
effect on brand
awareness, except
place. The most
affecting variable
on brand
awareness is
promotion.
2. Analyzing The
Impact of Marketing
Mix towards
Customer’s Purchase
Intention of Jam
Product ( Case Study:
New 14 gram of
Portion Pack of
Morin Jam)
Product,
Price, Place,
Promotion,
Purchase
Intention
Lydia
Andarini,
2013
Price is the most
affecting impact
on customer
purchase intention.
3. Impact of Brand
Equity towards
Purchasing Decision:
A situation on
Mobile
Telecommunication
Perceived
Quality,Brand
Awareness,
Brand
Association,
Brand
Nisal
Rochana
Gunawardane,
2015
All variable has
partial significant
effect on
purchasing
decision.
! 19!
No. Title Variable Author Conclusion Service of Sri Lanka Loyalty,
Purchasing
Decision
4. Impact of
Advertising on Brand
Awareness and
Consumer Preference
(With Special
Reference to Men’s
Wear)
Branding,
Advertising,
Consumer
Preference,
Brand
Awareness
Roshni P
Sawant, 2012
Male mostly
preferred to see
and pay attention
to the advertising
of the brands of
garments they
prefer to was seen
as an attempt to
find out what
latest brand has to
offer in design,
style and fashion.
5. How Brand
Awareness Relates to
Market Outcome,
Brand Equity and the
Marketing Mix
Brand
Awareness,
Marketing
Mix
elements,
Brand Equity,
Market
Outcome
Huang &
Sarigollu,
2012
The association
between marketing
mix elements and
brand awareness
and finds that the
impact of price
promotions on
brand awareness is
positive. Price
promotions
increases brand
awareness through
creating
brand exposure

! 20!
No. Title Variable Author Conclusion
and usage
experience for
consumers. The
current research
confirms past
literature that
distribution
intensity has the
largest impact on
brand awareness.
2.3 Operational Definition of Variables
TABLE 2.2 OPERATIONAL DEFINITION OF VARIABLES
Variable Definition Indicator Question Product
Product as
anything tangible
or intangible
offered to a market
for attention, use
and consumption
with aim of
satisfying needs
and wants of
customers
(Kotler &
Armstrong, 2013)
1) Product Variant
2) Brand Name
3) Product Quality
4) Product Packaging
Source: (Andarini,
2013)
1. Variation offered
by Pantene
shampoo give me
a lot of choices
2. The brand name
of Pantene
shampoo are
familiar
3. Pantene has good
quality of
shampoo
4. The packaging
looks interesting
5. The packaging
represents the
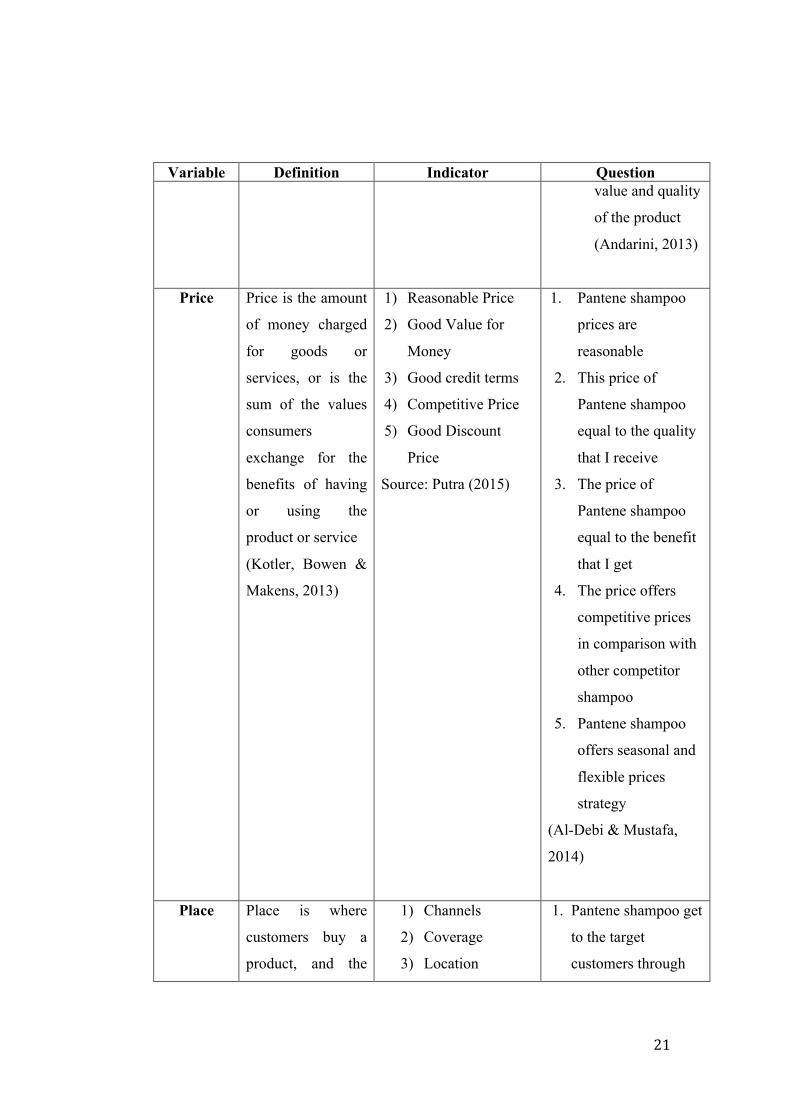
! 21!
Variable Definition Indicator Question value and quality
of the product
(Andarini, 2013)
Price Price is the amount
of money charged
for goods or
services, or is the
sum of the values
consumers
exchange for the
benefits of having
or using the
product or service
(Kotler, Bowen &
Makens, 2013)
1) Reasonable Price
2) Good Value for
Money
3) Good credit terms
4) Competitive Price
5) Good Discount
Price
Source: Putra (2015)
1. Pantene shampoo
prices are
reasonable
2. This price of
Pantene shampoo
equal to the quality
that I receive
3. The price of
Pantene shampoo
equal to the benefit
that I get
4. The price offers
competitive prices
in comparison with
other competitor
shampoo
5. Pantene shampoo
offers seasonal and
flexible prices
strategy
(Al-Debi & Mustafa,
2014)
Place Place is where
customers buy a
product, and the
1) Channels
2) Coverage
3) Location
1. Pantene shampoo get
to the target
customers through
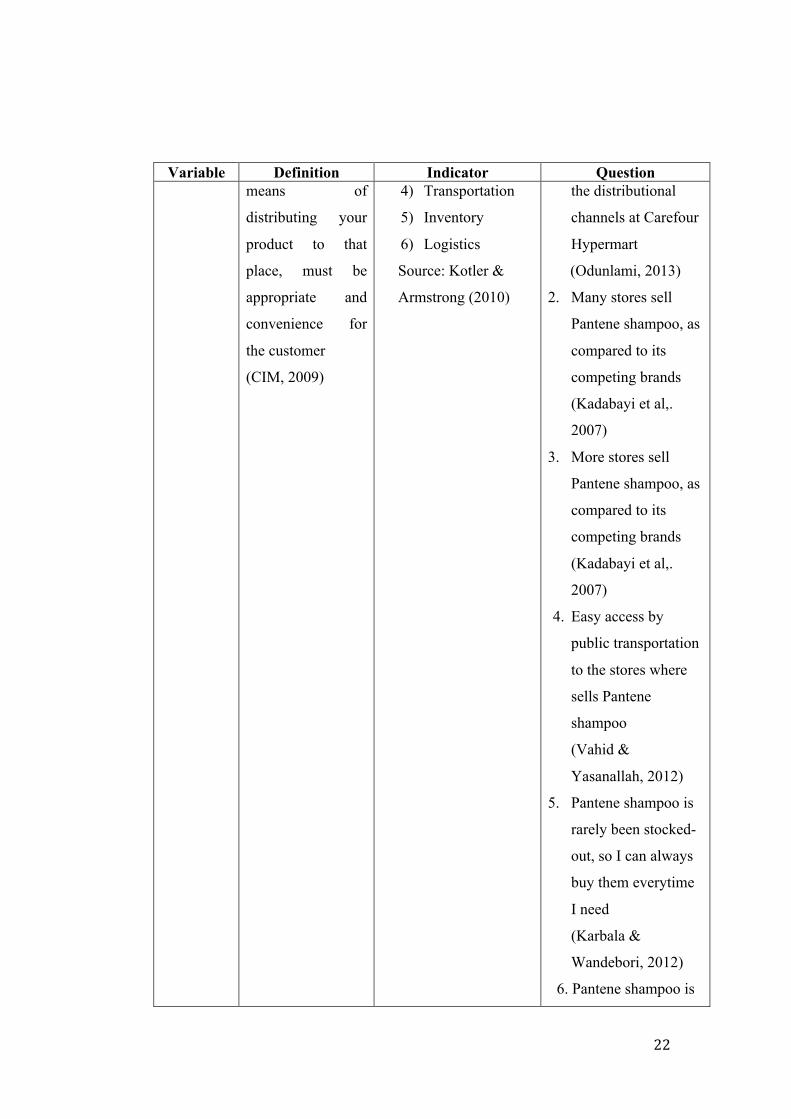
! 22!
Variable Definition Indicator Question means of
distributing your
product to that
place, must be
appropriate and
convenience for
the customer
(CIM, 2009)
4) Transportation
5) Inventory
6) Logistics
Source: Kotler &
Armstrong (2010)
the distributional
channels at Carefour
Hypermart
(Odunlami, 2013)
2. Many stores sell
Pantene shampoo, as
compared to its
competing brands
(Kadabayi et al,.
2007)
3. More stores sell
Pantene shampoo, as
compared to its
competing brands
(Kadabayi et al,.
2007)
4. Easy access by
public transportation
to the stores where
sells Pantene
shampoo
(Vahid &
Yasanallah, 2012)
5. Pantene shampoo is
rarely been stocked-
out, so I can always
buy them everytime
I need
(Karbala &
Wandebori, 2012)
6. Pantene shampoo is

! 23!
Variable Definition Indicator Question distributed through
as many stores as
possible
(Kadabayi et al,. 2007)
Promotion Promotion is a
marketing activity
that retailers use to
bring traffic into
stores and generate
sales by
communicating
current offerings to
targeted consumers
(Dunne et al.,
2010)
1) The attractiveness
of the
advertisement
2) The regular time
of advertisement
3) The creativity of
the advertisement
4) Promotion Sale
Source: Putra (2015)
1. There are various
methods of
promotions done by
Pantene shampoo
(event, brochure,
discount, etc)
(Satit, et al,. 2012)
2. Pantene shampoo
has good or
interesting
advertisement to
attract me to buy
(Lovelock, 2010)
3. Pantene shampoo
has good or
interesting
advertisement to
attract me to buy
(Lovelock, 2010)
4. The advertisement of
Pantene shampoo are
frequently seen
through media, such
as TV, radio,
billboards.
(Yoo et al., 2000)
5. Discount and other
! 24!
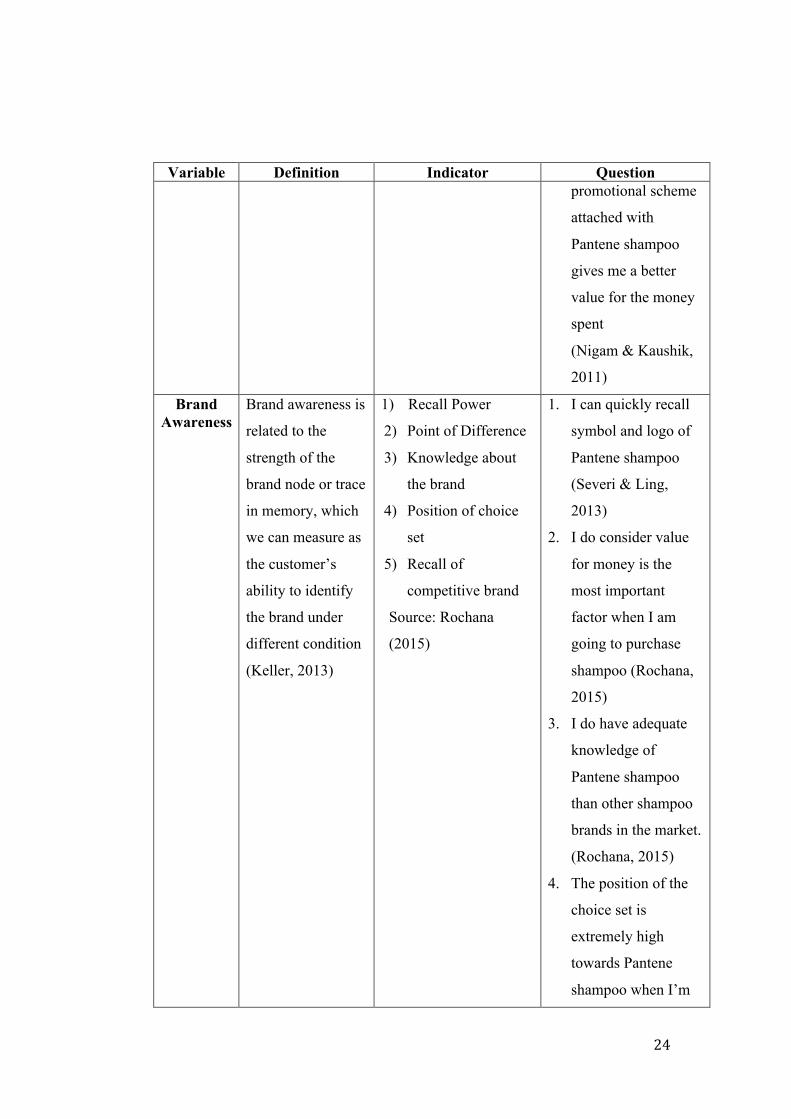
Variable Definition Indicator Question promotional scheme
attached with
Pantene shampoo
gives me a better
value for the money
spent
(Nigam & Kaushik,
2011)
Brand Awareness
Brand awareness is
related to the
strength of the
brand node or trace
in memory, which
we can measure as
the customer’s
ability to identify
the brand under
different condition
(Keller, 2013)
1) Recall Power
2) Point of Difference
3) Knowledge about
the brand
4) Position of choice
set
5) Recall of
competitive brand
Source: Rochana
(2015)
1. I can quickly recall
symbol and logo of
Pantene shampoo
(Severi & Ling,
2013)
2. I do consider value
for money is the
most important
factor when I am
going to purchase
shampoo (Rochana,
2015)
3. I do have adequate
knowledge of
Pantene shampoo
than other shampoo
brands in the market.
(Rochana, 2015)
4. The position of the
choice set is
extremely high
towards Pantene
shampoo when I’m
! 25!
Variable Definition Indicator Question going to make a
purchase decision.
(Rochana, 2015)
5. I can recall
competitive brands
easily when I’m
going to purchase
Pantene shampoo
(Nigam & Kaushik,
2011)
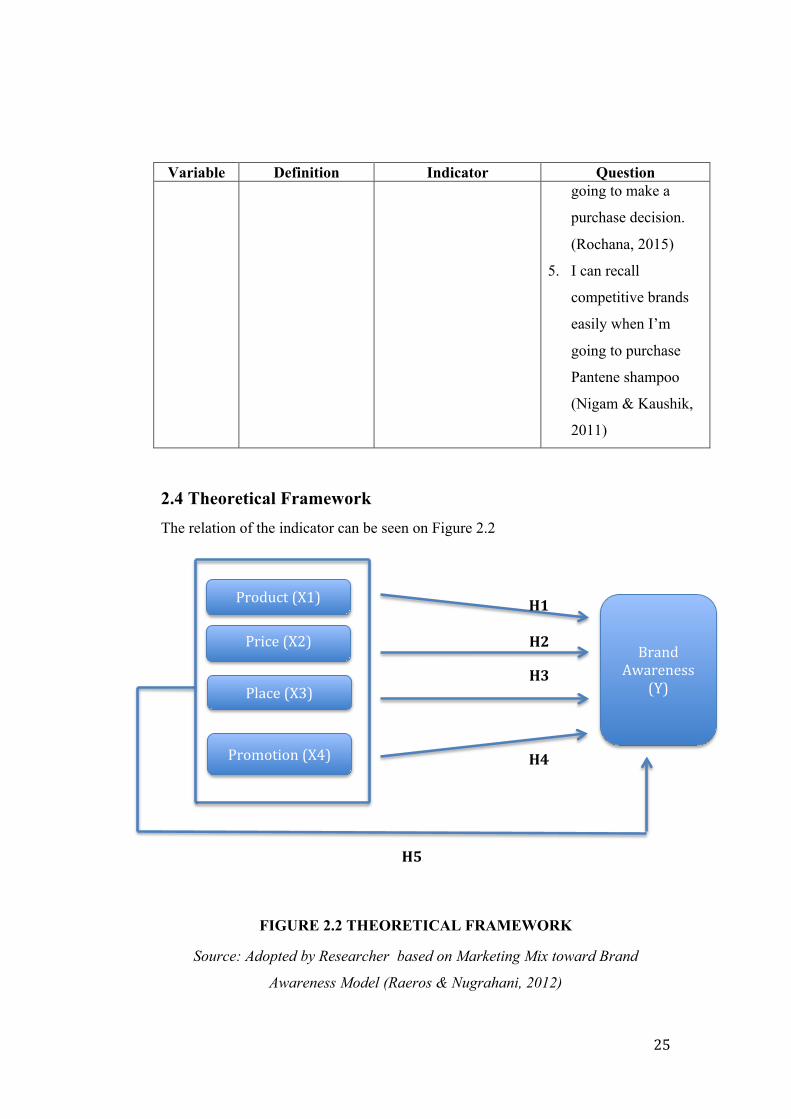
2.4 Theoretical Framework The relation of the indicator can be seen on Figure 2.2
FIGURE 2.2 THEORETICAL FRAMEWORK
Source: Adopted by Researcher based on Marketing Mix toward Brand
Awareness Model (Raeros & Nugrahani, 2012)
Product!(X1)!
Place!(X3)!
Price!(X2)!!
Promotion!(X4)!
Brand!Awareness!
(Y)!!
H1#
H2#
H3#
H4#
H5#
! 26!
2.5 Hypothesis There are some hypotheses on this research as follow:
1. HA1: There is partial significant effect of Product on Brand Awareness
H01: There is no partial significant effect of Product on Brand Awareness
2. HA2: There is partial significant effect of Price on Brand Awareness
H02: There is no partial significant effect of Price on Brand Awareness
3. HA3: There is partial significant effect of Place on Brand Awareness
H03: There is no partial significant effect of Place on Brand Awareness
4. HA4: There is partial significant effect of Promotion on Brand Awareness
H04: There is no partial significant effect of Promotion on Brand
Awareness
5. HA5: There is simultaneous significant effect of Product, Price, Place,
Promotion on Brand Awareness
H05: There is no simultaneous significant effect of Product, Price, Place,
Promotion on Brand Awareness
! 27!
CHAPTER III
RESEARCH METHODOLOGY
3.1 Research Methodology
3.1.1 Quantitative Method
Quantitative research approaches have several important strengths that make them
ideal for addressing the types of research questions that are posed in social science
research. Specifically, quantitative methods provide us with an objective
framework for testing and validating theories and hypothesis about world around
us. Predicted on having interesting and creative research question, we can use
quantitative research methodologies to objectively describe and predict behaviors
and, in the case of experimental research, to look at cause and effect relationship.
(Dwyer & Bernaeur 2013, p.63)
Based on the results of quantitative research the necessary production,
profitability price, product parameters, and more can be found. The main merit of
quantitative research is that, it reduces the risk of making wrong decisions and
choices (Jhonson, B., & Christensen, L.,2008,p.34)
Quantitative method is used for this research with using questionnaire as the
research instrument. By using quantitative method for this research, the researcher
can collect all information needed through questionnaires from large number of
respondents selected judgingly in Jakarta area especially in Kota Kasablanka and
the result of the data will be analyzed and measured using statistical method.
Independent variable is presumed cause of any change in dependent variable (Hair
et al, 2010, p.3)
3.1.2 Deductive Approach
In this research, the researcher uses deductive as the research approach, deductive
reasoning works from the more general to the more specific. Deduction is the
process of research from the general facts of phenomena to knowledge of the
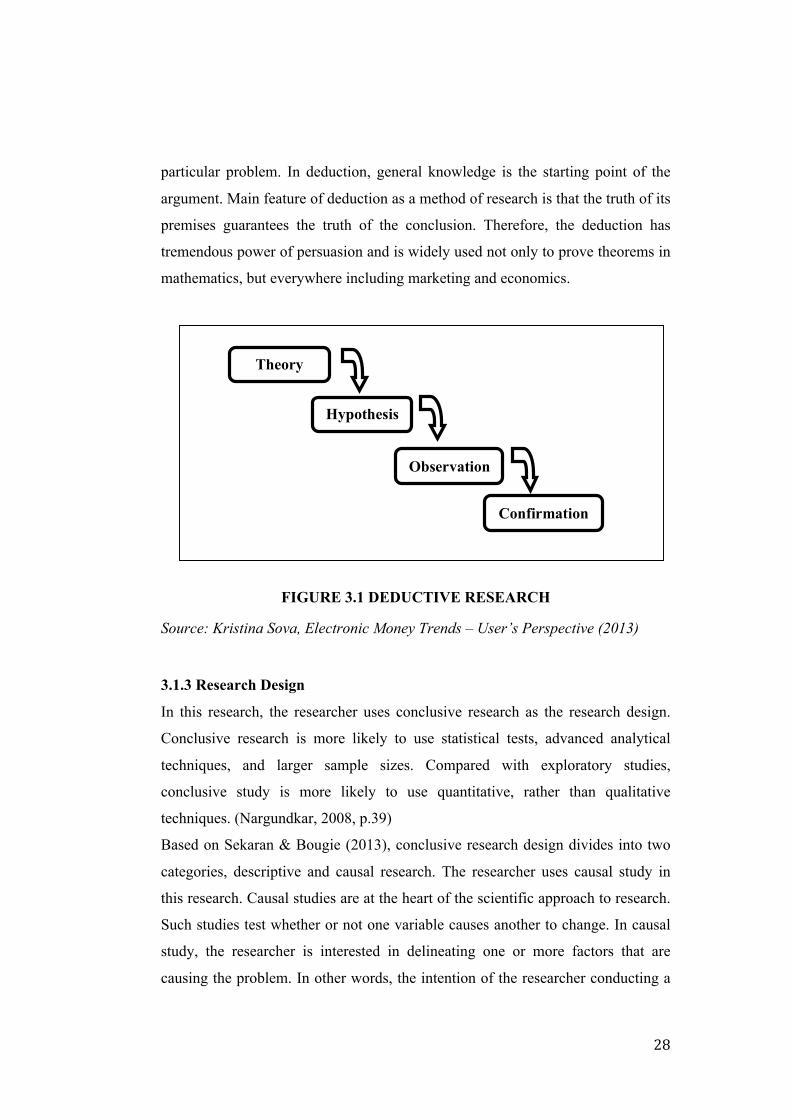
! 28!
particular problem. In deduction, general knowledge is the starting point of the
argument. Main feature of deduction as a method of research is that the truth of its
premises guarantees the truth of the conclusion. Therefore, the deduction has
tremendous power of persuasion and is widely used not only to prove theorems in
mathematics, but everywhere including marketing and economics.
FIGURE 3.1 DEDUCTIVE RESEARCH
Source: Kristina Sova, Electronic Money Trends – User’s Perspective (2013)!
3.1.3 Research Design
In this research, the researcher uses conclusive research as the research design.
Conclusive research is more likely to use statistical tests, advanced analytical
techniques, and larger sample sizes. Compared with exploratory studies,
conclusive study is more likely to use quantitative, rather than qualitative
techniques. (Nargundkar, 2008, p.39)
Based on Sekaran & Bougie (2013), conclusive research design divides into two
categories, descriptive and causal research. The researcher uses causal study in
this research. Causal studies are at the heart of the scientific approach to research.
Such studies test whether or not one variable causes another to change. In causal
study, the researcher is interested in delineating one or more factors that are
causing the problem. In other words, the intention of the researcher conducting a
Theory
Hypothesis
Observation
Confirmation
! 29!
causal study is to be able to state that variable X causes variable Y. So, when
variable X is removed or altered in some way, problem Y is solved (note that
quite often, however it is not just one variable that causes a problem in
organizations).
3.2 Research Instrument
3.2.1 Primary Data
Primary sources of data have been described as those items that are original to the
problem under study and may be thought of as being in two categories. First are
the remains of a given period. Second is had direct physical relationship with the
events (Cohen et al, 2007, p.212). The researcher uses primary data for this
research of the study from the questionnaire distribution in the survey.
3.2.2 Secondary Data
Boslaugh, cited in Koziol, et al., (2015) define secondary data as analysis of data
collected by someone else. Supporting Boslaugh (2007) stated that secondary data
is data collected from a source that has already been published in any form such
as books, journals, articles, and periodicals. Other researcher, Vartanian (2011)
also stated that secondary data can be including any data that are investigated to
answer a research question for which the data were collected. In other words,
secondary data are those which have already been collected by someone else and
have gone through the statistical machines. Thus, secondary data is used in order
to complete the data that the primary data did not provide from existed
information. The researcher uses secondary data for this research of the study
directly from the internet, which are websites, e-journals, etc.
Research Instrument is the tool that used to answer the research questions that
stated in the previous chapter. The Researcher intention is to gather the
information from as much various sources. Data can be obtained from primary or
secondary data, Primary data refers to information obtained first-hand by the
researcher on the variables of interest for specific purpose of the study and
! 30!
secondary data refer to information gathered from sources that already exist
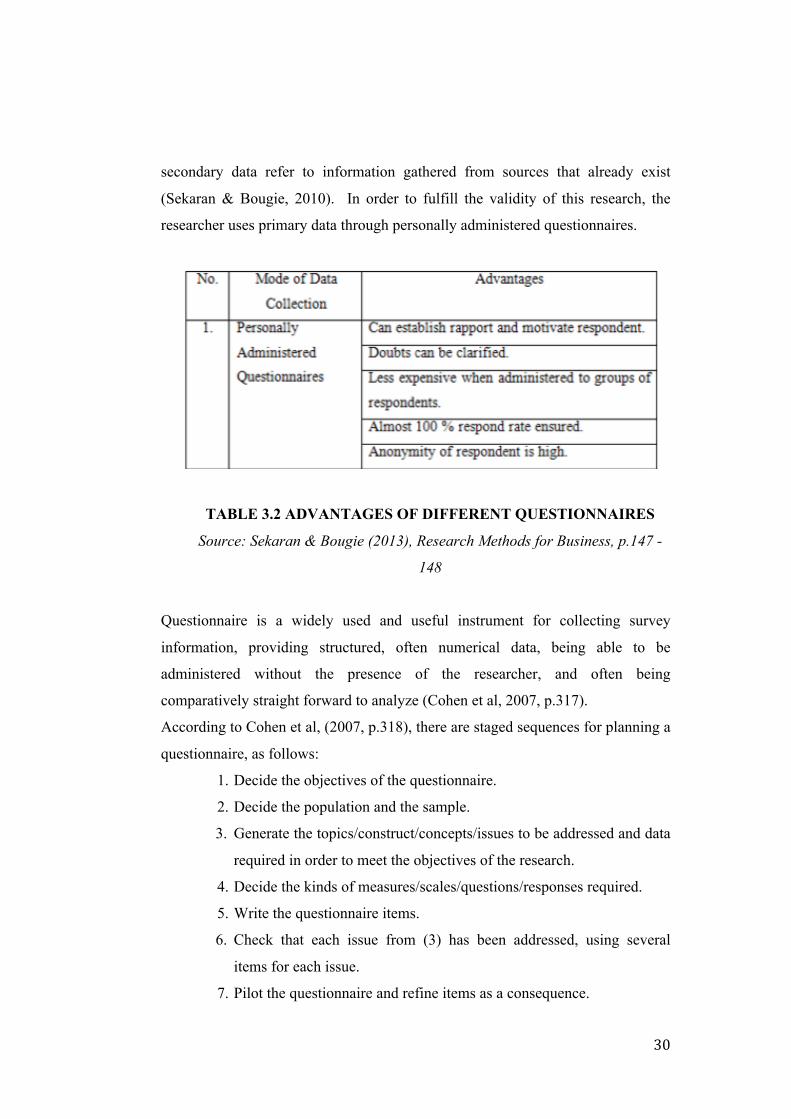
(Sekaran & Bougie, 2010). In order to fulfill the validity of this research, the
researcher uses primary data through personally administered questionnaires.
TABLE 3.2 ADVANTAGES OF DIFFERENT QUESTIONNAIRES
Source: Sekaran & Bougie (2013), Research Methods for Business, p.147 -
148
Questionnaire is a widely used and useful instrument for collecting survey
information, providing structured, often numerical data, being able to be
administered without the presence of the researcher, and often being
comparatively straight forward to analyze (Cohen et al, 2007, p.317).
According to Cohen et al, (2007, p.318), there are staged sequences for planning a
questionnaire, as follows:
1. Decide the objectives of the questionnaire.
2. Decide the population and the sample.
3. Generate the topics/construct/concepts/issues to be addressed and data
required in order to meet the objectives of the research.
4. Decide the kinds of measures/scales/questions/responses required.
5. Write the questionnaire items.
6. Check that each issue from (3) has been addressed, using several
items for each issue.
7. Pilot the questionnaire and refine items as a consequence.
! 31!
8. Administer the final questionnaire.
Using questionnaire as the tool to collect and analyze data can choose several
types of questionnaire items. According to Cohen et al, (2007, p.321), there are
several types of questionnaire items, as follows:
1. Closed-ended questions
A closed-ended question limits respondents with a list of answer
choices from which they must choose to answer the question. Closed-
ended questions can be in the form of multiple choice, scale format,
rank ordering, and rating scales.
2. Open-ended questions
Open-ended question is very attractive device for smaller scale
research or for those sections of a questionnaire that invite an honor,
personal comment from respondents in addition to ticking numbers
and boxes.
According to Cohen at al, (2007, p.321), if a closed and structured questionnaire
is used, enabling patterns to be observed and comparisons to be made, then the
questionnaire will need to be piloted and refined so that the final version contains
as full a range of possible responses as can be reasonably foreseen. The researcher
is using Closed-ended questions in this research which conducted through Likert
scale.
Likert scale is designed to examine how strongly subjects agree or disagree with
statements on a five-point scale. The researcher chooses Likert-type scale for this
research since the data is ordered categorical response (Elosua, 2011). The
purpose of this questionnaire is to analyze the level of agreement of each
respondent with each item of statement. The measurement is based on these five-
point scales ranging from strongly disagree to strongly agree (Rensis Likert) :
5. Strongly Agree
4. Agree
3. Neutral
2. Disagree
! 32!
1. Strongly Disagree
3.2.1 Data Analysis
In analyzing and observing the data obtained, the researcher uses two major
programs that are have statistic relation. The first program that the researcher uses
is Microsoft Excel. The function of Microsoft Excel program is intended to
tabulate the data obtained from questionnaire distributions. It simplifies the
researcher to analyze and observe the data.
The second program is Statistical Package for Social Science (SPSS) 21 version.
SPSS is used by the researcher to quantitatively examine the data obtained from
questionnaires distribution. SPSS has been recognized to be helpful and support
the statistical data investigation. In this research, SPSS was used to analyze
reliability, validity, correlation, and binary logistic regression analysis.
3.2.2 Sampling Design
Sampling Design is part of statistical methodology that related in taking a portion
of the population. If a sampling is done correctly, statistical analyze can be used
to generalize a whole population. There are two major types of sampling design:
probability and non-probability sampling. In non-probability sampling, the
elements do not have a known or predetermined chance of being selected as
subjects (Sekaran & Bougie, et al, 2013, p.245).
To determine the sample size, the researcher refers to theory of (Malhotra, 2010)
stated that for unknown population the sample size at least 4 times or 5 times of
total questions of variables or item to be used in research. Thus, the researcher
decides to choose 200 respondents are chosen as the sample of this research. In
this research, the researcher are using unknown population and using 26 statement
in the questionnaire, 26 statement x 4 times = 104 sample sizes. Then, at least the
researcher has to spread the questionnaire to 104 respondents. Thus, the
! 33!
researcher decides to choose 148 respondents are chosen as the sample of this
research.
According to Roscoe (cited in Sekaran & Bougie, 2010), convenience sampling is
one of elements of non-probablity where the respondent can be obtained quickly
and efficiently. It involves collecting questionnaires from respondents who are
conveniently available to provide it. In the convenience sampling, the selection of
the respondents happens because they are in the right place at the right time. Thus,
the convenience sampling is used on this research, the respondent of this research
is only those who ever bought Pantene shampoo in Kota Kasablanka.
3.2.3 Population
Population refers to the entire group of people, events, or things of interest that
the researcher wishes to investigate. It is the group of people, events, or things of
interest for which the researcher wants to make inferences or based on sample
statistics (Sekaran & Bougie, et al, 2013, p.240). In this research of study, the
research population is focused on Pantene shampoo buyer at Carefour Hypermart,
Kota Kasablanka.
The target population for this research is adolescent consumers who ever
purchased Pantene shampoo in Kota Kasablanka. The respondents are both male
and female classified age range by Healthy Department. The range of age
classified into 4 groups. Early teenager is 12 – 16 years old, last teenager is 17 –
25 years old, early adult is 26 – 35 years old and adult up to elder is above 35
years old. Since the consumer of Pantene shoes therefore the researcher take the
12 – 16 as the first range because at this year’s male and female have already
purchased Pantene shampoo which provided by Pantene shampoo.
3.2.4 Sample
Sample is a subset of the population. It comprises some members selected from it
( Sekaran & Bougie, et al, 2013, p.241). In determining the sample size, the
! 34!
researcher refers to the theory of (Maholtra, 2011) which says, for unknown
population the sample size must be at least 4 or 5 times of the total questions used
in the research. Whereas, Sekaran & Bougie (2010) suggest that sample size
which are larger than 30 and less than 500 normally applicable for most research.
Sampling design is part of statistical methodology that related in taking a portion
of the population. If a sampling is done correctly, statistical analysis can be used
to generalize the whole population. There are two major type of sampling design:
probability and non-probability sampling. In this research, the researcher has
chosen 148 respondents as the sample.
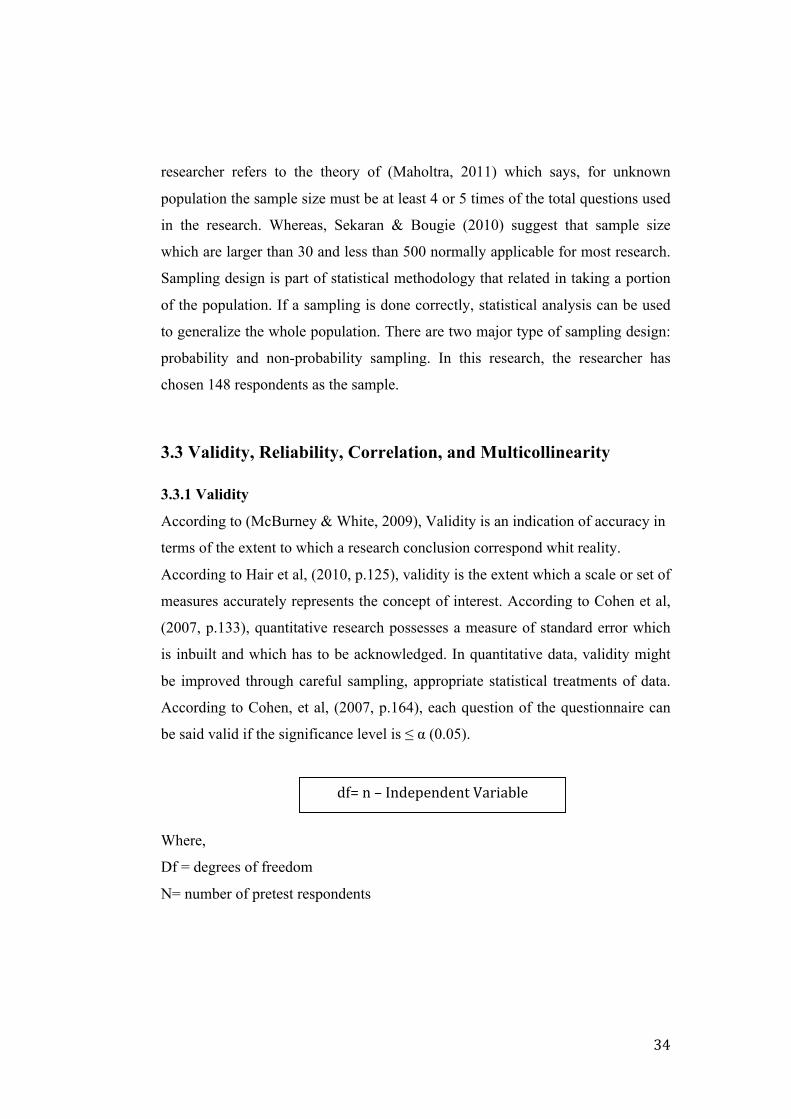
3.3 Validity, Reliability, Correlation, and Multicollinearity
3.3.1 Validity
According to (McBurney & White, 2009), Validity is an indication of accuracy in
terms of the extent to which a research conclusion correspond whit reality.
According to Hair et al, (2010, p.125), validity is the extent which a scale or set of
measures accurately represents the concept of interest. According to Cohen et al,
(2007, p.133), quantitative research possesses a measure of standard error which
is inbuilt and which has to be acknowledged. In quantitative data, validity might
be improved through careful sampling, appropriate statistical treatments of data.
According to Cohen, et al, (2007, p.164), each question of the questionnaire can
be said valid if the significance level is ≤ α (0.05).
Where,
Df = degrees of freedom
N= number of pretest respondents
df=!n!–!Independent!Variable!
! 35!
3.3.2 Reliability
According to Hair et al, (2010, p.124), reliability is an assessment of the degree of
consistency between multiple measurements of a variable. The item-to-total
correlations should exceed 0.50 and that the inter item correlation exceed 0.30.
The lower limit for Cronbach’s alpha is 0.70, although it may decreases to 0.60 in
exploratory research. Cronbach’s alpha has positive relationship to the number of
item in the scale because increasing the number of items.
3.3.3 Descriptive Analysis
According to Sekaran & Bougie (2010), a descriptive analysis is appropriate when
the research goal consists of describing a phenomenon in a certain situation
through provision of a profile of factors and variables and depiction of significant
aspects. It displays information in a meaningful way and helps us to think
systematically about the phenomenon of interest (Sekaran & Bougie, 2010).
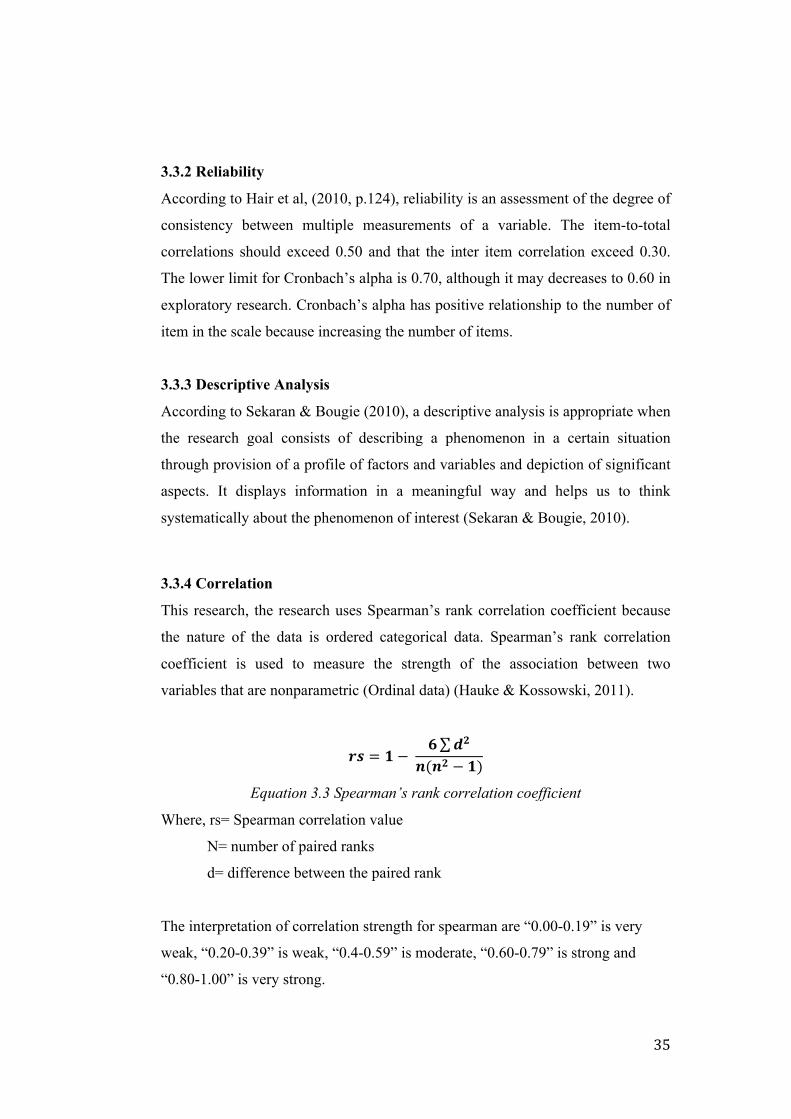
3.3.4 Correlation
This research, the research uses Spearman’s rank correlation coefficient because
the nature of the data is ordered categorical data. Spearman’s rank correlation
coefficient is used to measure the strength of the association between two
variables that are nonparametric (Ordinal data) (Hauke & Kossowski, 2011).
!" = !− ! ! !!!(!! − !)
Equation 3.3 Spearman’s rank correlation coefficient
Where, rs= Spearman correlation value
N= number of paired ranks
d= difference between the paired rank
The interpretation of correlation strength for spearman are “0.00-0.19” is very
weak, “0.20-0.39” is weak, “0.4-0.59” is moderate, “0.60-0.79” is strong and
“0.80-1.00” is very strong.
! 36!
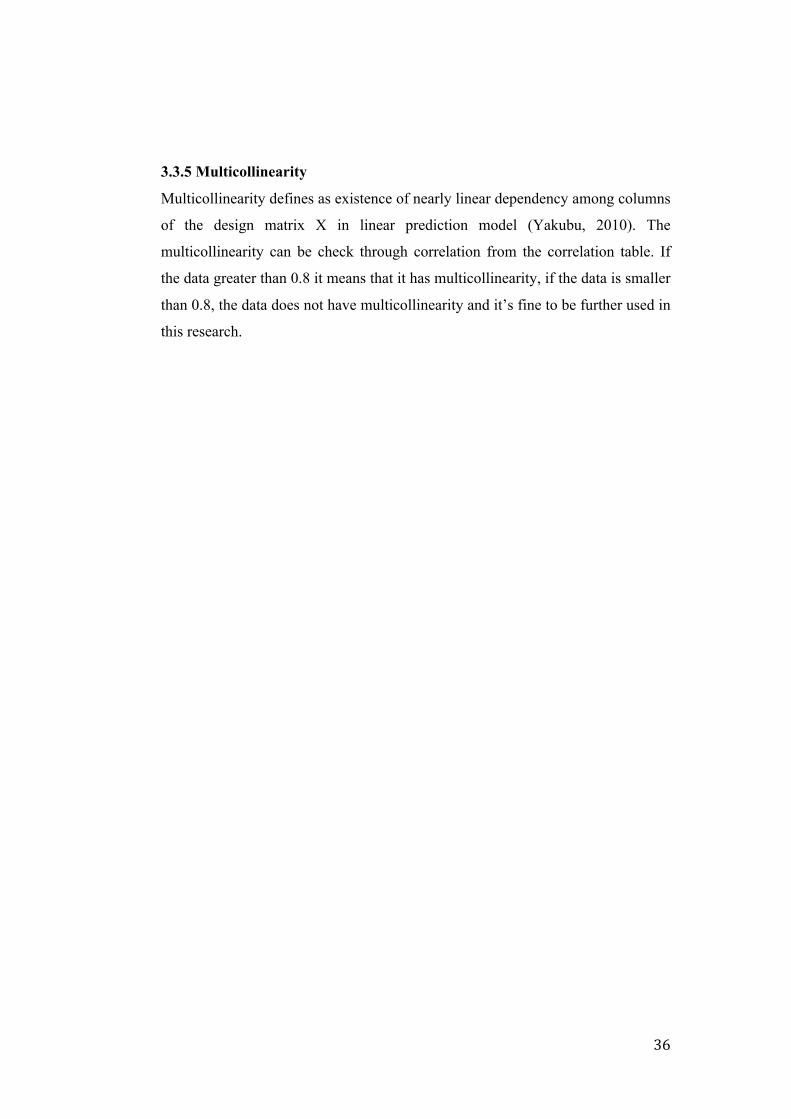
3.3.5 Multicollinearity
Multicollinearity defines as existence of nearly linear dependency among columns
of the design matrix X in linear prediction model (Yakubu, 2010). The
multicollinearity can be check through correlation from the correlation table. If
the data greater than 0.8 it means that it has multicollinearity, if the data is smaller
than 0.8, the data does not have multicollinearity and it’s fine to be further used in
this research.

! 37!
3.4 Data Collection The researcher collected the primary data from distributing questionnaires to 200
respondents. For the secondary data, the researcher collected it from journals,
books, websites, and other sources. The researcher use two methods which are
data that the researcher collected (Primary data) or data that is gathered and
maintained by others (secondary data).
FIGURE 3.3 RESEARCH FRAMEWORK
Source: Adapted by Researcher (2015), based on Uma Sekaran, Roger
Bougie, Research Methods for Business (2013)
Problem Identification and Problem Statement
Literature Review
Construct Questionnaire
Pre-test Questionnaire: Validity and Reliability Test and Dry Run
!
Data Collection !
Data Analysis and Interpretation
Conclusion and Recommendation
! 38!
Figure 3.3 shows a research framework that will be used by the researcher. Each
level of activity in this framework will be done by the researcher carefully and
correctly.
3.6 Testing the hypothesis
3.6.1 Binomial Logistic Regression
Stombergson (2009) described binary logistic regression is the method of choice
used when the dependent variable is binary and the researcher would like to
explore the relative influence of continues and/or categorical independent
variables on the dependent variable and to determine effects between the
independent variables. According to Wuensch (2011), binary logistic regression
usually used when the data with liker-type scale response with “strongly disagree”
to “strongly agree”.
3.6.1.1 Classification Table
The predictive success of the logistic regression can be assessed by looking at the
classification table, showing correct and incorrect classification of the
dichotomous, ordinal, or polytomous dependent. The overall percentage describes
the precision of the model (David Garson, 2011).
3.6.1.2 Model Summary
Model Summary in logistic regression is indicating the ability of independent
variable in explaining the dependent variable or measuring the strength of
association. Cox & Snell R Square show the minimum value of strength whereas
Nagelkerke R Square shows the maximum value of overall strength association.
(David Garson, 2011)

! 39!
3.6.1.3 Omnibus Test
The omnibus test may be interpreted as a test of the capability of all predictors in
the model jointly to predict the response (dependent) variable. A finding of
significance when the value is below than 0.05, meaning all independent variable
has simultaneous significant to the dependent variable. (David Garson, 2011)
3.5.1.4 Partial Test
This test aims to find out if there is partial significant impact of each independent
variable on dependent variable. A finding of significance if the value of sig. below
than 0.05, and Exp(B) shows the nature of impact whether positive or negative.
(David Garson, 2011).
! 40!
CHAPTER IV
DATA RESULT AND ANALYSIS
In this chapter, the researcher report about company profile, the questionnaire,
validity and reliability, and then descriptive analysis which included about
respondent profile. Also the researcher report likert scale question, correlation
analysis, hypothesis testing and finally, the interpretation of the result will also be
discussed on this chapter.
4.1 Company Profile
4.1.1 Procter & Gamble International
Established in Cincinnati, Ohio, United States and founded by a candlemaker
Wiliam Procter and soapmaker James Gamble on October 31, 1837. Known as
P&G Company as an American Multinational Consumer Goods which produced
personal care and sells approximately 250 brands to nearly 5 billion consumers
around the world. Having a headquarter in Ohio, United States, P&G has
operations in more than 70 countries and employs more than 106,000 people
worldwide.
In 1890, P&G has sold more than 30 different types of soap, including Ivory.
They used innovative advertising marketing to sell their product to the market and
it made more demand for P&G soaps continue to increase. The laboratory
research continue to produce innovative new products, such as Ivory flakes,
Chipso, and Dreft. All these products promoted through innovative techniques,
such as “soap opera” radio, product sampling and premium promotional.
In 1924, P&G formed market research division to learn what is wants and needs
of the customer and also the customer buying behavior. In 1945, P&G become a
company who have value of $350 million and began to expand its business across
! 41!
the world with the acquisition of Thomas Hedley & Co., Ltd., in England. P&G
also introduced their new product, Tide, as the successful product after Ivory
soap.
In 1955, P&G produced the first toothpaste with fluoride, Crest. Then P&G
entered the paper product business line with Charmin Paper Mills, the toilet tissue
and napkin maker in 1957. P&G created and introduced revolutionary diaper
product, Pampers and come out with Head & Shoulders shampoo in 1961. P&G
acquired a number of other companies that diversified its products line and
significantly increased profits. These acquisition included Folgers Coffee,
Norwich Eaton Pharmaceutical, Richardson-Vicks, Max Factor, Noxell and
Pantene shampoo.
4.1.2 Procter & Gamble Indonesia
Procter & Gamble Indonesia established in 1989 as the consumer goods company.
This large companies were already very experienced in the various countries is
not hasty to sell 300 superior product brands to the Indonesian market. but By
choosing which of the products best suited to the characteristics of Indonesian
society which consider many factors of Indonesia culture, habits and climate that
occurred in Indonesia.
The company slowly started to show good progress with the launch of its flagship
product, such as Pantene shampoo, Rejoice and Head & Shoulders that received
by Indonesian market. This shampoo product variants holds a 30% Indonesia
shampoo market. Several years later, the company was able to compete with other
US companies, Unilever company. Procter & Gamble Indonesia produces other
products such as skin care products Oil of Olay, Whisper sanitary napkins,
Pampers baby diapers, Gillete man shaver and medicines such as Vicks Formula
44 and Vicks Inhaler.
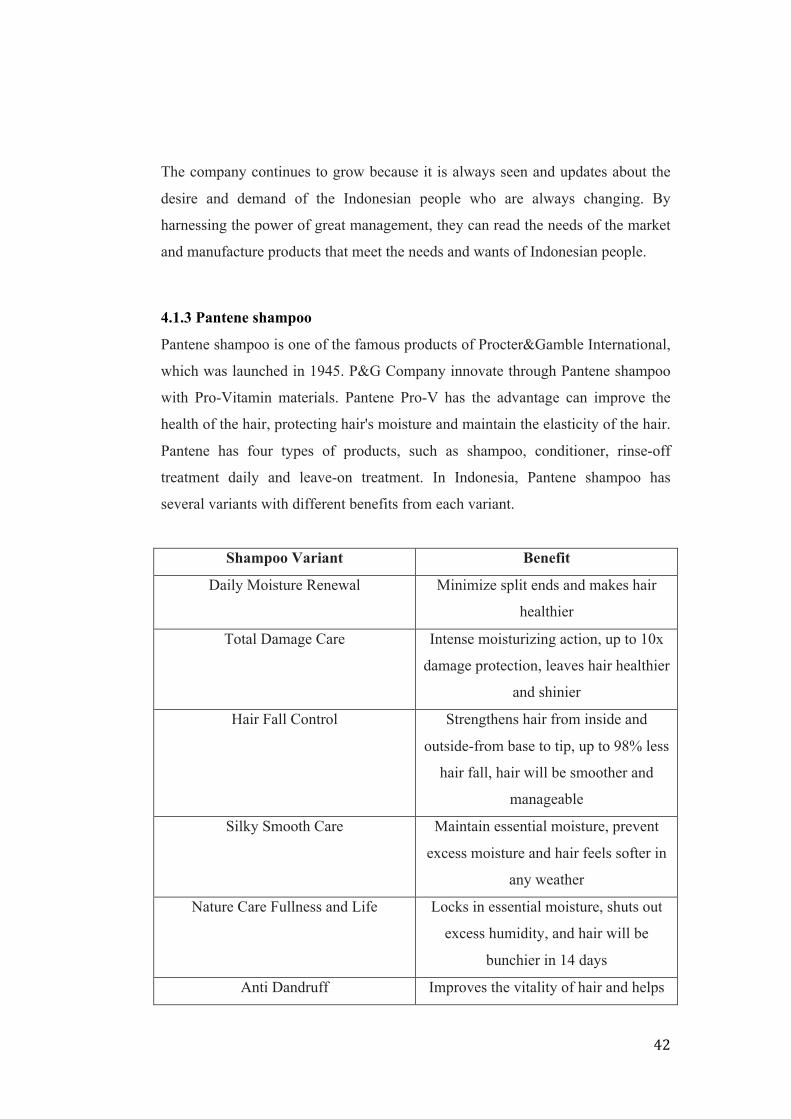
! 42!
The company continues to grow because it is always seen and updates about the
desire and demand of the Indonesian people who are always changing. By
harnessing the power of great management, they can read the needs of the market
and manufacture products that meet the needs and wants of Indonesian people.
4.1.3 Pantene shampoo
Pantene shampoo is one of the famous products of Procter&Gamble International,
which was launched in 1945. P&G Company innovate through Pantene shampoo
with Pro-Vitamin materials. Pantene Pro-V has the advantage can improve the
health of the hair, protecting hair's moisture and maintain the elasticity of the hair.
Pantene has four types of products, such as shampoo, conditioner, rinse-off
treatment daily and leave-on treatment. In Indonesia, Pantene shampoo has
several variants with different benefits from each variant.
Shampoo Variant Benefit
Daily Moisture Renewal Minimize split ends and makes hair
healthier
Total Damage Care Intense moisturizing action, up to 10x
damage protection, leaves hair healthier
and shinier
Hair Fall Control Strengthens hair from inside and
outside-from base to tip, up to 98% less
hair fall, hair will be smoother and
manageable
Silky Smooth Care Maintain essential moisture, prevent
excess moisture and hair feels softer in
any weather
Nature Care Fullness and Life Locks in essential moisture, shuts out
excess humidity, and hair will be
bunchier in 14 days
Anti Dandruff Improves the vitality of hair and helps
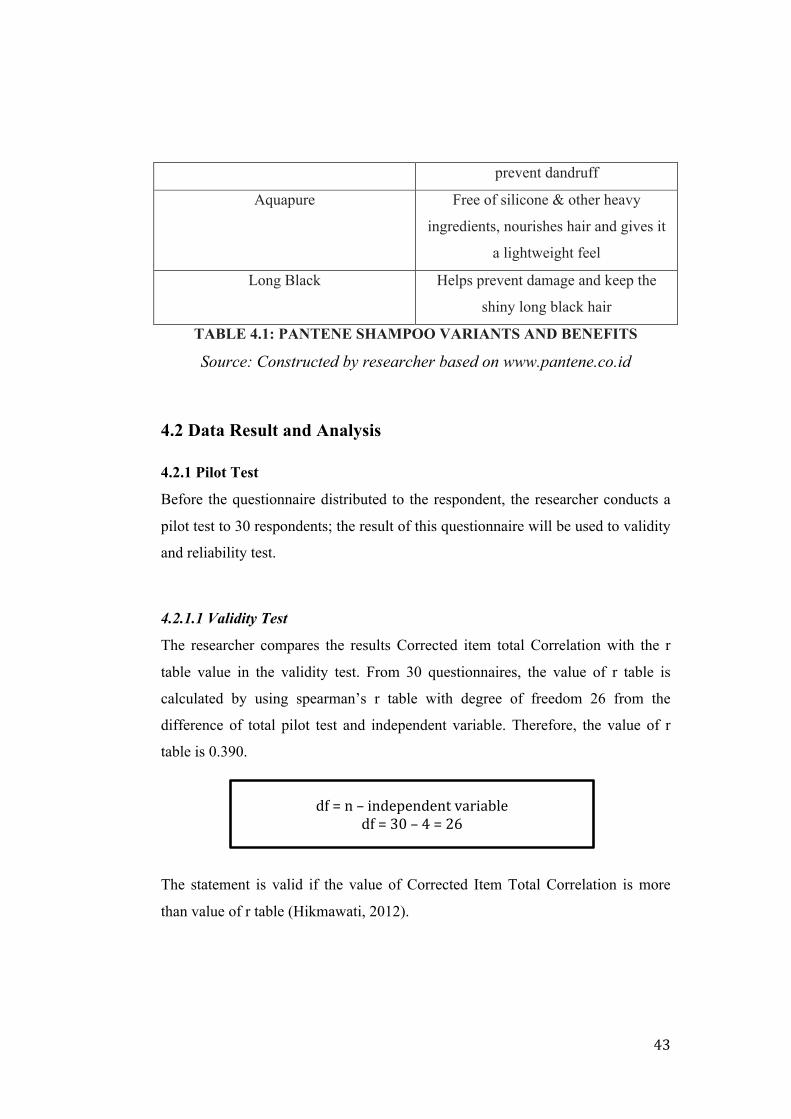
! 43!
prevent dandruff
Aquapure Free of silicone & other heavy
ingredients, nourishes hair and gives it
a lightweight feel
Long Black Helps prevent damage and keep the
shiny long black hair
TABLE 4.1: PANTENE SHAMPOO VARIANTS AND BENEFITS
Source: Constructed by researcher based on www.pantene.co.id
4.2 Data Result and Analysis
4.2.1 Pilot Test
Before the questionnaire distributed to the respondent, the researcher conducts a
pilot test to 30 respondents; the result of this questionnaire will be used to validity
and reliability test.
4.2.1.1 Validity Test
The researcher compares the results Corrected item total Correlation with the r
table value in the validity test. From 30 questionnaires, the value of r table is
calculated by using spearman’s r table with degree of freedom 26 from the
difference of total pilot test and independent variable. Therefore, the value of r
table is 0.390.
The statement is valid if the value of Corrected Item Total Correlation is more
than value of r table (Hikmawati, 2012).
df!=!n!–!independent!variable!df!=!30!–!4!=!26!
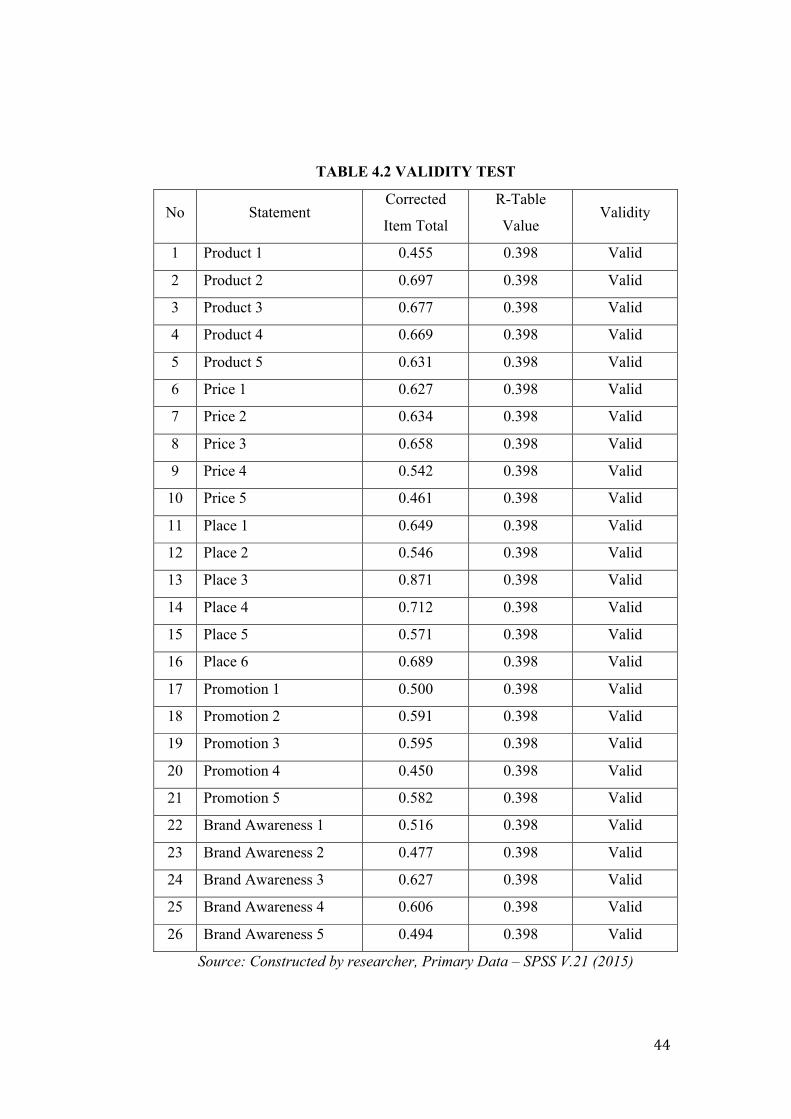
! 44!
TABLE 4.2 VALIDITY TEST
No Statement Corrected
Item Total
R-Table
Value Validity
1 Product 1 0.455 0.398 Valid
2 Product 2 0.697 0.398 Valid
3 Product 3 0.677 0.398 Valid
4 Product 4 0.669 0.398 Valid
5 Product 5 0.631 0.398 Valid
6 Price 1 0.627 0.398 Valid
7 Price 2 0.634 0.398 Valid
8 Price 3 0.658 0.398 Valid
9 Price 4 0.542 0.398 Valid
10 Price 5 0.461 0.398 Valid
11 Place 1 0.649 0.398 Valid
12 Place 2 0.546 0.398 Valid
13 Place 3 0.871 0.398 Valid
14 Place 4 0.712 0.398 Valid
15 Place 5 0.571 0.398 Valid
16 Place 6 0.689 0.398 Valid
17 Promotion 1 0.500 0.398 Valid
18 Promotion 2 0.591 0.398 Valid
19 Promotion 3 0.595 0.398 Valid
20 Promotion 4 0.450 0.398 Valid
21 Promotion 5 0.582 0.398 Valid
22 Brand Awareness 1 0.516 0.398 Valid
23 Brand Awareness 2 0.477 0.398 Valid
24 Brand Awareness 3 0.627 0.398 Valid
25 Brand Awareness 4 0.606 0.398 Valid
26 Brand Awareness 5 0.494 0.398 Valid
Source: Constructed by researcher, Primary Data – SPSS V.21 (2015)
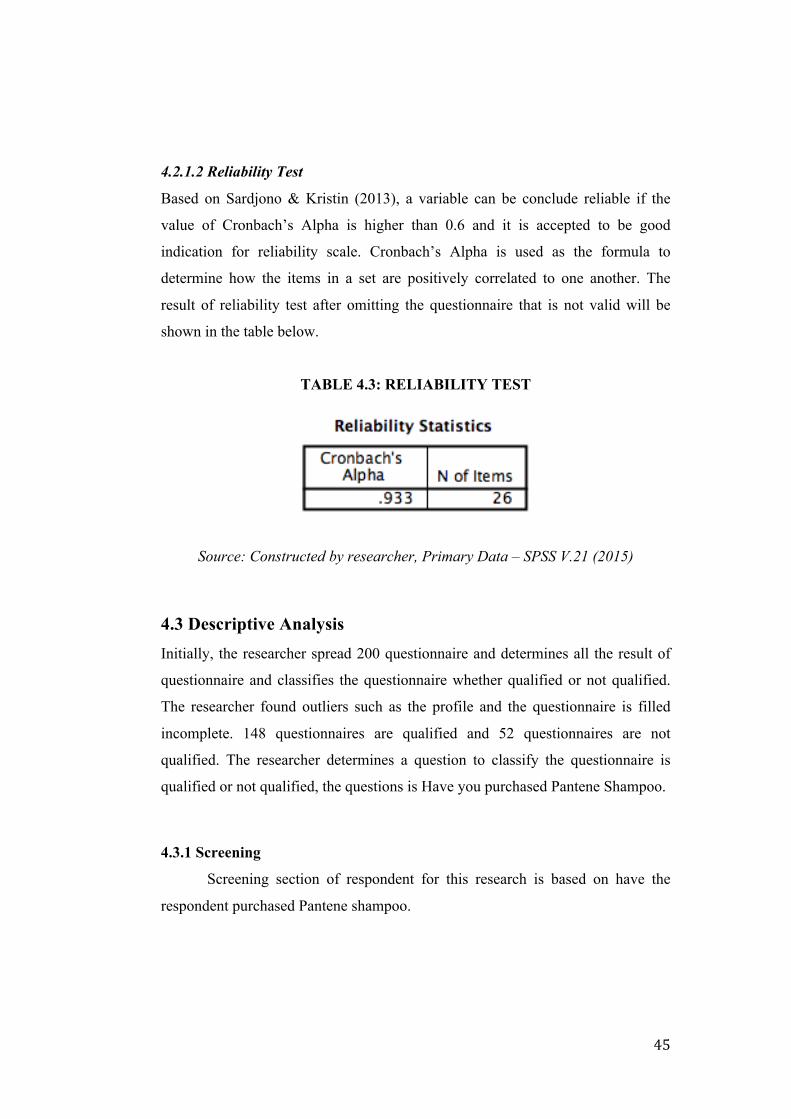
! 45!
4.2.1.2 Reliability Test
Based on Sardjono & Kristin (2013), a variable can be conclude reliable if the
value of Cronbach’s Alpha is higher than 0.6 and it is accepted to be good
indication for reliability scale. Cronbach’s Alpha is used as the formula to
determine how the items in a set are positively correlated to one another. The
result of reliability test after omitting the questionnaire that is not valid will be
shown in the table below.
TABLE 4.3: RELIABILITY TEST
Source: Constructed by researcher, Primary Data – SPSS V.21 (2015)
4.3 Descriptive Analysis Initially, the researcher spread 200 questionnaire and determines all the result of
questionnaire and classifies the questionnaire whether qualified or not qualified.
The researcher found outliers such as the profile and the questionnaire is filled
incomplete. 148 questionnaires are qualified and 52 questionnaires are not
qualified. The researcher determines a question to classify the questionnaire is
qualified or not qualified, the questions is Have you purchased Pantene Shampoo.
4.3.1 Screening
Screening section of respondent for this research is based on have the
respondent purchased Pantene shampoo.
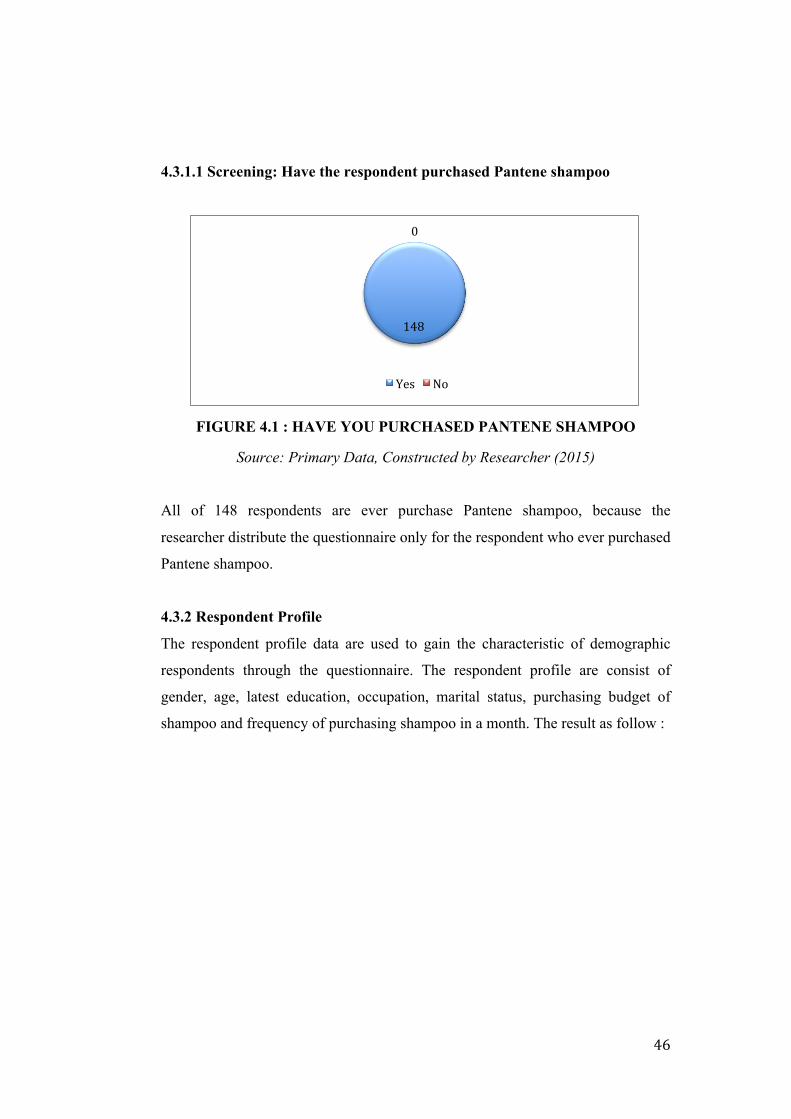
! 46!
4.3.1.1 Screening: Have the respondent purchased Pantene shampoo
FIGURE 4.1 : HAVE YOU PURCHASED PANTENE SHAMPOO
Source: Primary Data, Constructed by Researcher (2015)
All of 148 respondents are ever purchase Pantene shampoo, because the
researcher distribute the questionnaire only for the respondent who ever purchased
Pantene shampoo.
4.3.2 Respondent Profile
The respondent profile data are used to gain the characteristic of demographic
respondents through the questionnaire. The respondent profile are consist of
gender, age, latest education, occupation, marital status, purchasing budget of
shampoo and frequency of purchasing shampoo in a month. The result as follow :
148!
0!
Yes! No!
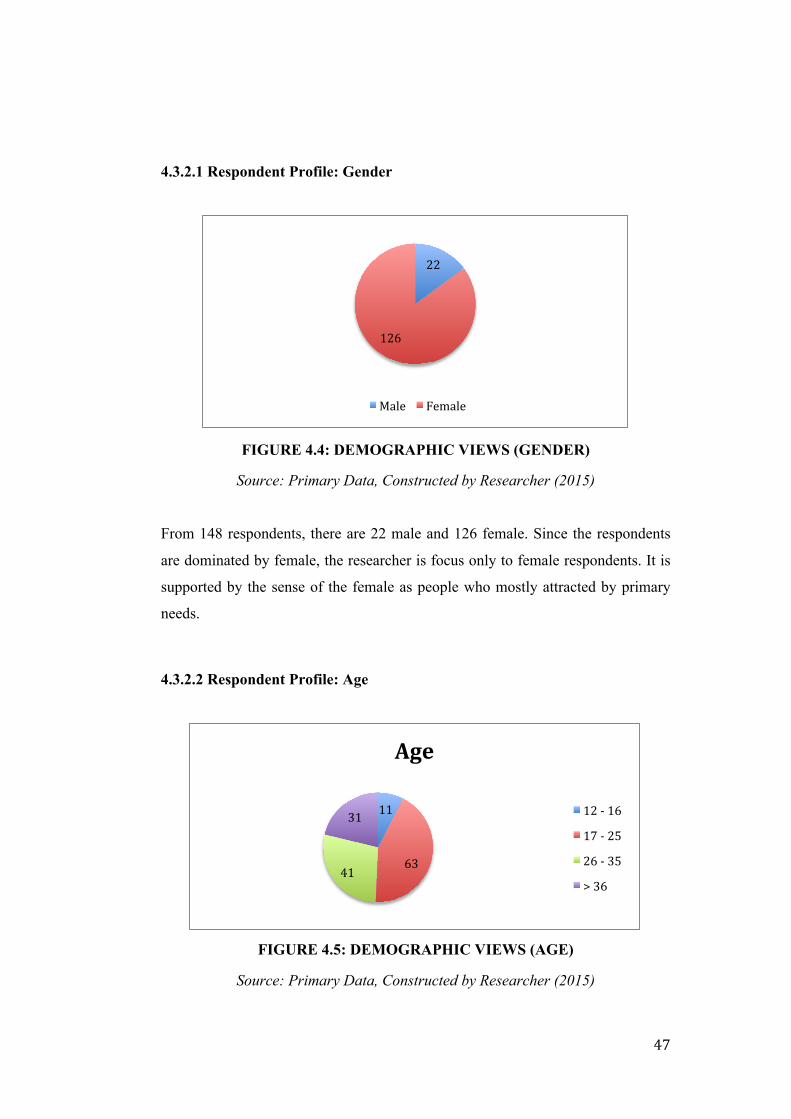
! 47!
4.3.2.1 Respondent Profile: Gender
FIGURE 4.4: DEMOGRAPHIC VIEWS (GENDER)
Source: Primary Data, Constructed by Researcher (2015)
From 148 respondents, there are 22 male and 126 female. Since the respondents
are dominated by female, the researcher is focus only to female respondents. It is
supported by the sense of the female as people who mostly attracted by primary
needs.
4.3.2.2 Respondent Profile: Age
FIGURE 4.5: DEMOGRAPHIC VIEWS (AGE)
Source: Primary Data, Constructed by Researcher (2015)
22!
126!
Male! Female!
11!
63!41!
31!
Age#
12!L!16!
17!L!25!
26!L!35!
>!36!
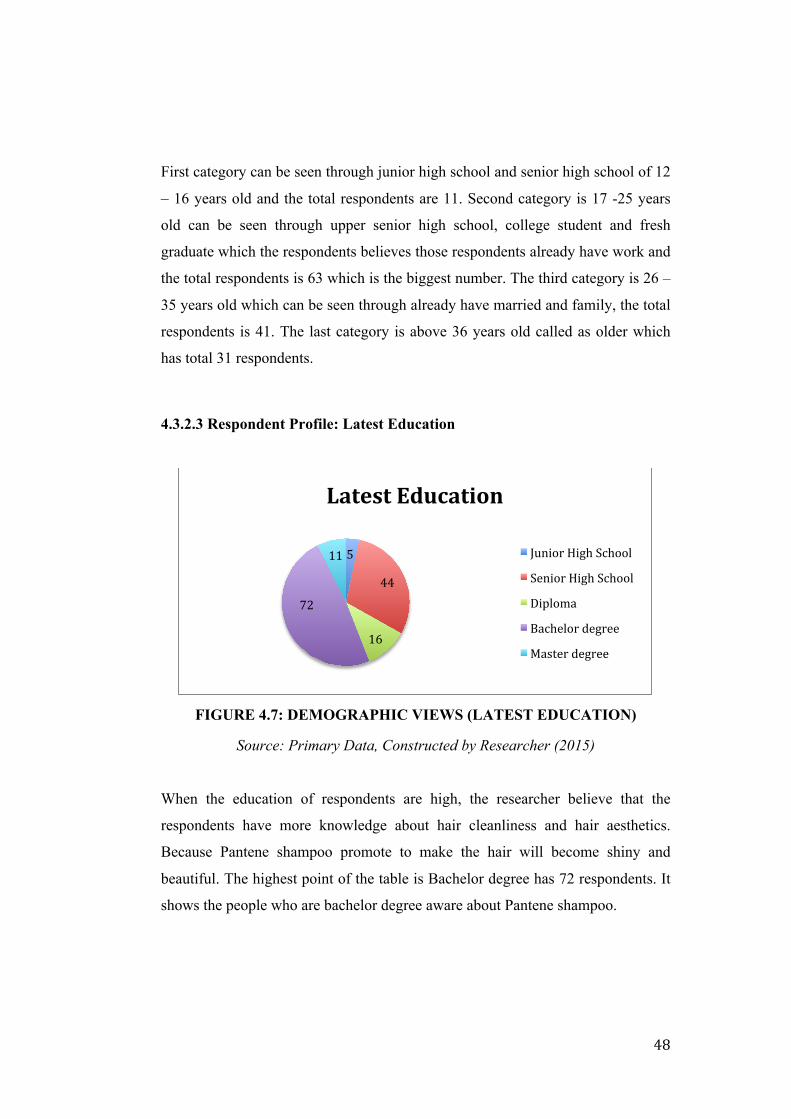
! 48!
First category can be seen through junior high school and senior high school of 12
– 16 years old and the total respondents are 11. Second category is 17 -25 years
old can be seen through upper senior high school, college student and fresh
graduate which the respondents believes those respondents already have work and
the total respondents is 63 which is the biggest number. The third category is 26 –
35 years old which can be seen through already have married and family, the total
respondents is 41. The last category is above 36 years old called as older which
has total 31 respondents.
4.3.2.3 Respondent Profile: Latest Education
FIGURE 4.7: DEMOGRAPHIC VIEWS (LATEST EDUCATION)
Source: Primary Data, Constructed by Researcher (2015)
When the education of respondents are high, the researcher believe that the
respondents have more knowledge about hair cleanliness and hair aesthetics.
Because Pantene shampoo promote to make the hair will become shiny and
beautiful. The highest point of the table is Bachelor degree has 72 respondents. It
shows the people who are bachelor degree aware about Pantene shampoo.
5!
44!
16!
72!
11!
Latest#Education#
Junior!High!School!
Senior!High!School!
Diploma!
Bachelor!degree!
Master!degree!
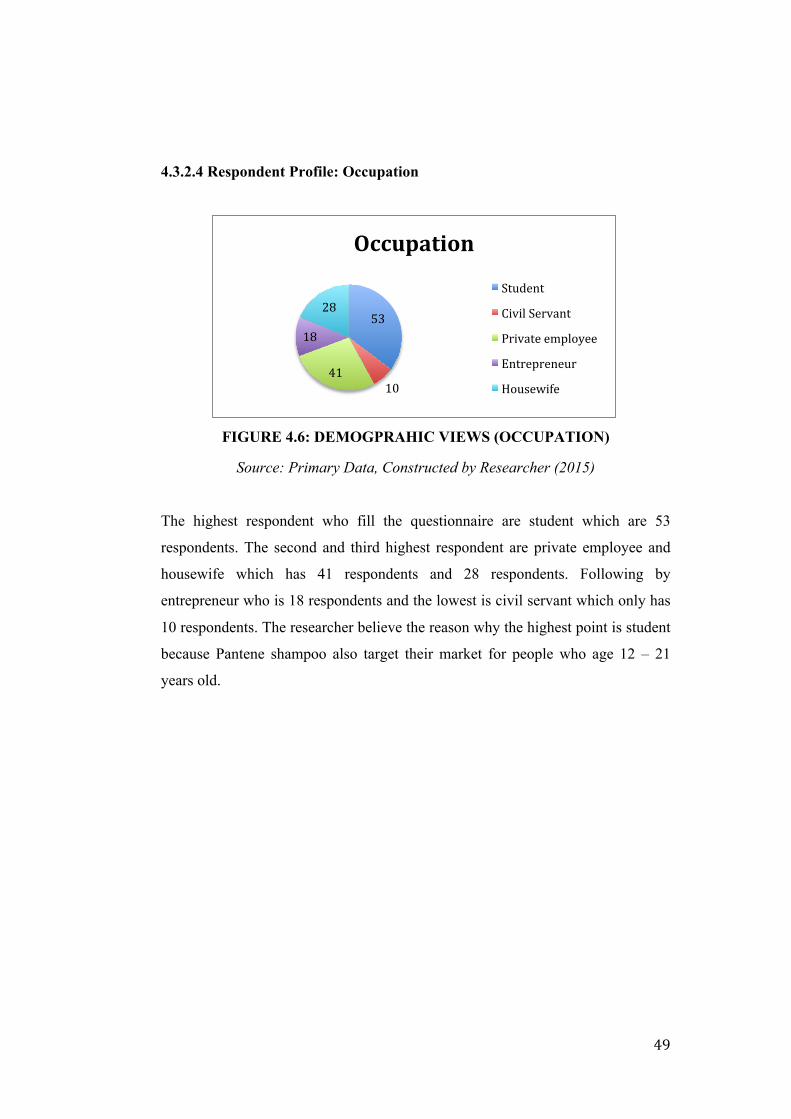
! 49!
4.3.2.4 Respondent Profile: Occupation
FIGURE 4.6: DEMOGPRAHIC VIEWS (OCCUPATION)
Source: Primary Data, Constructed by Researcher (2015)
The highest respondent who fill the questionnaire are student which are 53
respondents. The second and third highest respondent are private employee and
housewife which has 41 respondents and 28 respondents. Following by
entrepreneur who is 18 respondents and the lowest is civil servant which only has
10 respondents. The researcher believe the reason why the highest point is student
because Pantene shampoo also target their market for people who age 12 – 21
years old.
53!
10!41!
18!
28!
Occupation#
Student!
Civil!Servant!
Private!employee!
Entrepreneur!
Housewife!
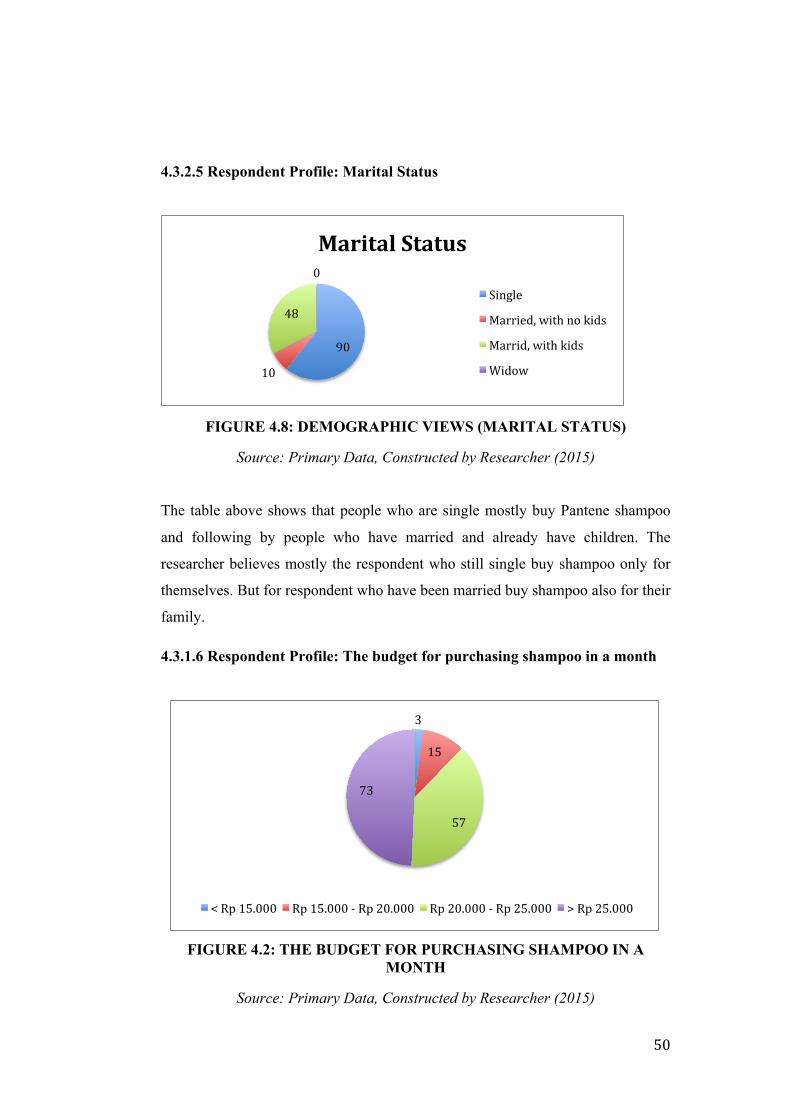
! 50!
4.3.2.5 Respondent Profile: Marital Status
FIGURE 4.8: DEMOGRAPHIC VIEWS (MARITAL STATUS)
Source: Primary Data, Constructed by Researcher (2015)
The table above shows that people who are single mostly buy Pantene shampoo
and following by people who have married and already have children. The
researcher believes mostly the respondent who still single buy shampoo only for
themselves. But for respondent who have been married buy shampoo also for their
family.
4.3.1.6 Respondent Profile: The budget for purchasing shampoo in a month
FIGURE 4.2: THE BUDGET FOR PURCHASING SHAMPOO IN A
MONTH
Source: Primary Data, Constructed by Researcher (2015)
90!
10!
48!
0!
Marital#Status#
Single!
Married,!with!no!kids!
Marrid,!with!kids!
Widow!
3!
15!
57!
73!
<!Rp!15.000! Rp!15.000!L!Rp!20.000! Rp!20.000!L!Rp!25.000! >!Rp!25.000!
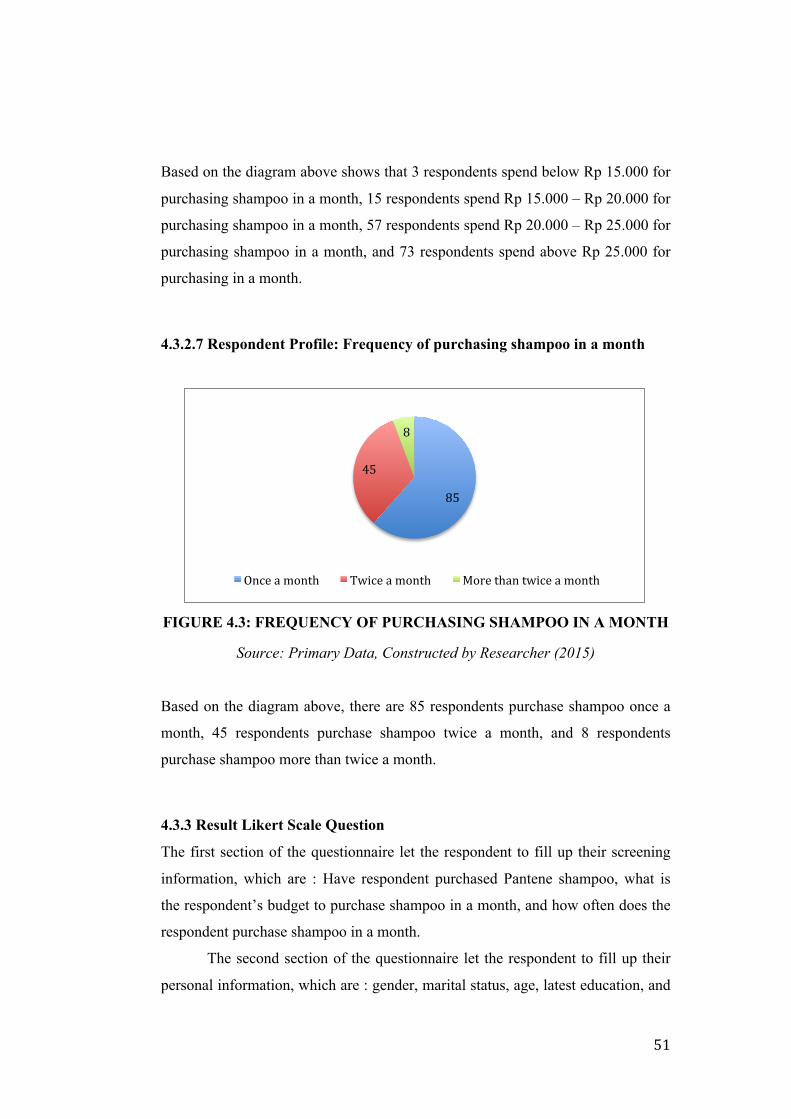
! 51!
Based on the diagram above shows that 3 respondents spend below Rp 15.000 for
purchasing shampoo in a month, 15 respondents spend Rp 15.000 – Rp 20.000 for
purchasing shampoo in a month, 57 respondents spend Rp 20.000 – Rp 25.000 for
purchasing shampoo in a month, and 73 respondents spend above Rp 25.000 for
purchasing in a month.
4.3.2.7 Respondent Profile: Frequency of purchasing shampoo in a month
FIGURE 4.3: FREQUENCY OF PURCHASING SHAMPOO IN A MONTH
Source: Primary Data, Constructed by Researcher (2015)
Based on the diagram above, there are 85 respondents purchase shampoo once a
month, 45 respondents purchase shampoo twice a month, and 8 respondents
purchase shampoo more than twice a month.
4.3.3 Result Likert Scale Question
The first section of the questionnaire let the respondent to fill up their screening
information, which are : Have respondent purchased Pantene shampoo, what is
the respondent’s budget to purchase shampoo in a month, and how often does the
respondent purchase shampoo in a month.
The second section of the questionnaire let the respondent to fill up their
personal information, which are : gender, marital status, age, latest education, and
85!
45!
8!
Once!a!month! Twice!a!month! More!than!twice!a!month!
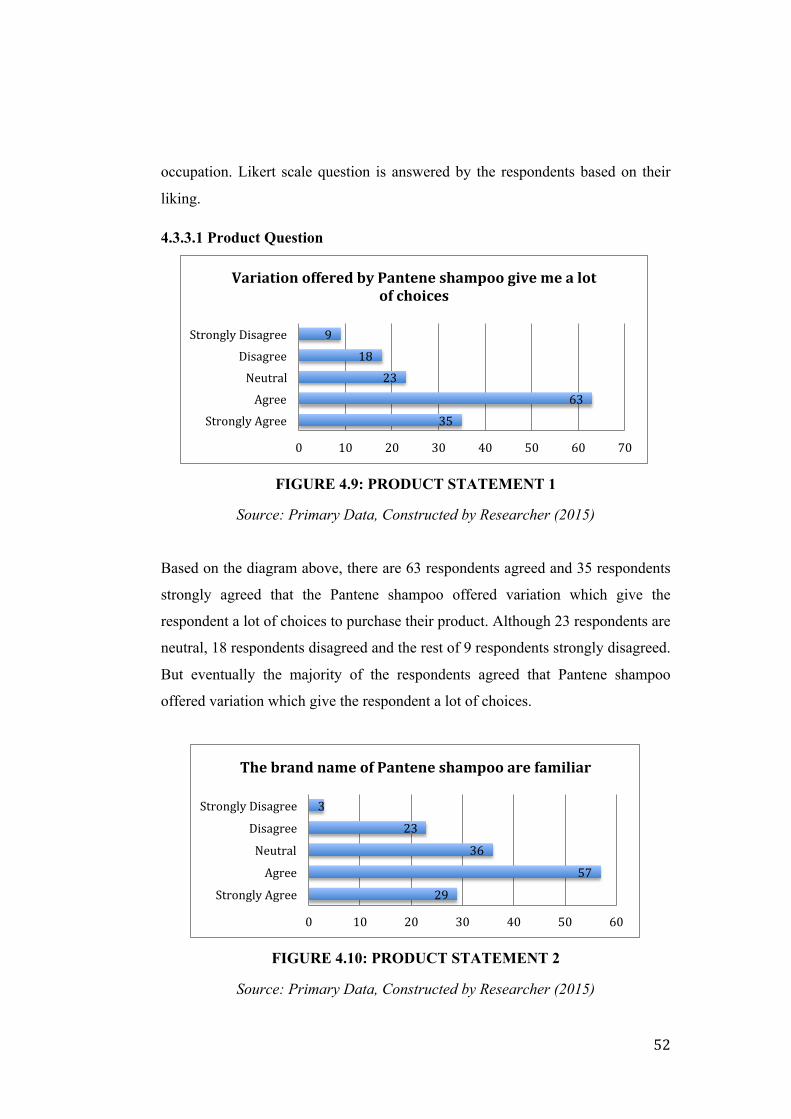
! 52!
occupation. Likert scale question is answered by the respondents based on their
liking.
4.3.3.1 Product Question
FIGURE 4.9: PRODUCT STATEMENT 1
Source: Primary Data, Constructed by Researcher (2015)
Based on the diagram above, there are 63 respondents agreed and 35 respondents
strongly agreed that the Pantene shampoo offered variation which give the
respondent a lot of choices to purchase their product. Although 23 respondents are
neutral, 18 respondents disagreed and the rest of 9 respondents strongly disagreed.
But eventually the majority of the respondents agreed that Pantene shampoo
offered variation which give the respondent a lot of choices.
FIGURE 4.10: PRODUCT STATEMENT 2
Source: Primary Data, Constructed by Researcher (2015)
35!63!
23!18!
9!
0! 10! 20! 30! 40! 50! 60! 70!
Strongly!Agree!Agree!
Neutral!Disagree!
Strongly!Disagree!
Variation#offered#by#Pantene#shampoo#give#me#a#lot#of#choices#
29!
57!
36!
23!
3!
0! 10! 20! 30! 40! 50! 60!
Strongly!Agree!
Agree!
Neutral!
Disagree!
Strongly!Disagree!
The#brand#name#of#Pantene#shampoo#are#familiar#
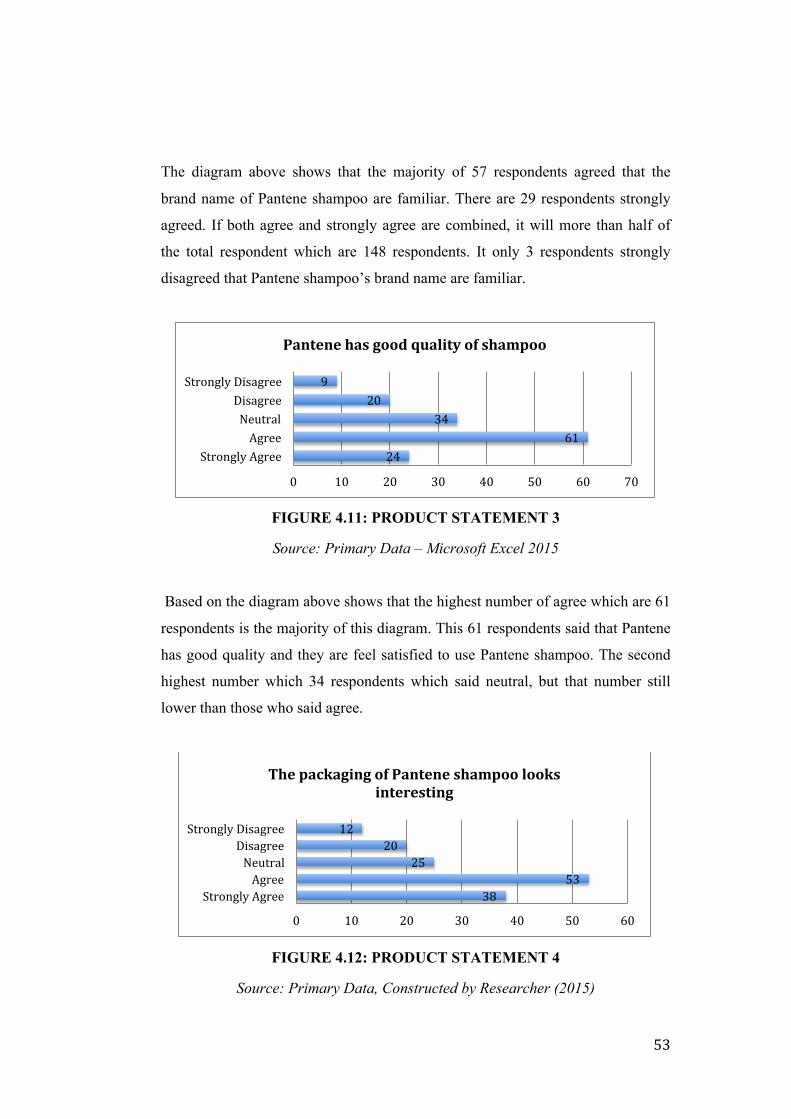
! 53!
The diagram above shows that the majority of 57 respondents agreed that the
brand name of Pantene shampoo are familiar. There are 29 respondents strongly
agreed. If both agree and strongly agree are combined, it will more than half of
the total respondent which are 148 respondents. It only 3 respondents strongly
disagreed that Pantene shampoo’s brand name are familiar.
FIGURE 4.11: PRODUCT STATEMENT 3
Source: Primary Data – Microsoft Excel 2015
Based on the diagram above shows that the highest number of agree which are 61
respondents is the majority of this diagram. This 61 respondents said that Pantene
has good quality and they are feel satisfied to use Pantene shampoo. The second
highest number which 34 respondents which said neutral, but that number still
lower than those who said agree.
FIGURE 4.12: PRODUCT STATEMENT 4
Source: Primary Data, Constructed by Researcher (2015)
24!61!
34!20!
9!
0! 10! 20! 30! 40! 50! 60! 70!
Strongly!Agree!Agree!
Neutral!Disagree!
Strongly!Disagree!
Pantene#has#good#quality#of#shampoo#
38!53!
25!20!
12!
0! 10! 20! 30! 40! 50! 60!
Strongly!Agree!Agree!
Neutral!Disagree!
Strongly!Disagree!
The#packaging#of#Pantene#shampoo#looks#interesting#

! 54!
According to the diagram above, there are 53 respondents agreed that the
packaging of Pantene shampoo looks interesting, 38 respondents strongly agreed
and 25 respondents put themselves to being neutral. Only 32 respondents said that
they didn’t agree with the statement.
FIGURE 4.13: PRODUCT STATEMENT 5
Source: Primary Data, Constructed by Researcher (2015)
Based on the diagram above shows there are 55 respondents agree and 30
respondents strongly agree that the packaging of Pantene shampoo represents the
value and quality of the product itself. Another 24 respondents stands to be
neutral, 31 disagreed and the rest of 8 respondents strongly disagreed.
4.3.3.2 Price Question
FIGURE 4.14: PRICE STATEMENT 1
Source: Primary Data, Constructed by Researcher (2015)
30!55!
24!31!
8!
0! 10! 20! 30! 40! 50! 60!
Strongly!Agree!Agree!
Neutral!Disagree!
Strongly!Disagree!
The#packaging#represents#the#value#and#quality#of#the#product#
23!67!
31!19!
8!
0! 10! 20! 30! 40! 50! 60! 70! 80!
Strongly!Agree!Agree!
Neutral!Disagree!
Strongly!Disagree!
Pantene#shampoo#prices#are#reasonable#
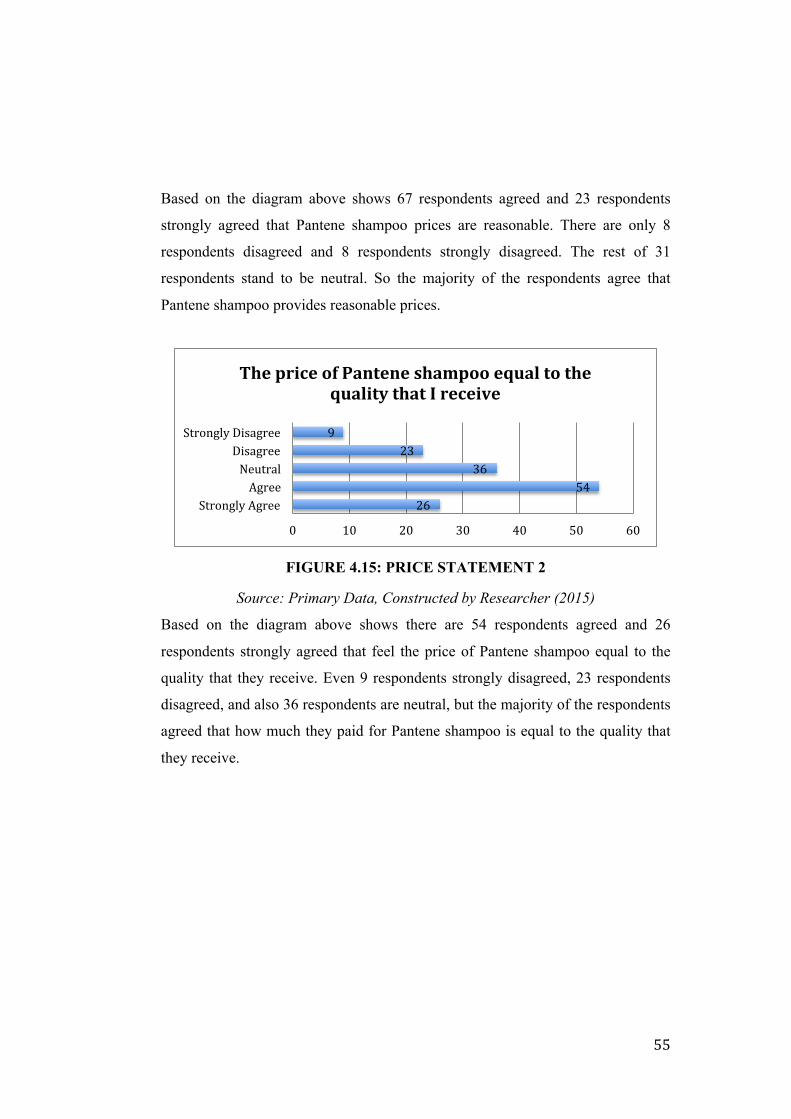
! 55!
Based on the diagram above shows 67 respondents agreed and 23 respondents
strongly agreed that Pantene shampoo prices are reasonable. There are only 8
respondents disagreed and 8 respondents strongly disagreed. The rest of 31
respondents stand to be neutral. So the majority of the respondents agree that
Pantene shampoo provides reasonable prices.
FIGURE 4.15: PRICE STATEMENT 2
Source: Primary Data, Constructed by Researcher (2015)
Based on the diagram above shows there are 54 respondents agreed and 26
respondents strongly agreed that feel the price of Pantene shampoo equal to the
quality that they receive. Even 9 respondents strongly disagreed, 23 respondents
disagreed, and also 36 respondents are neutral, but the majority of the respondents
agreed that how much they paid for Pantene shampoo is equal to the quality that
they receive.
26!54!
36!23!
9!
0! 10! 20! 30! 40! 50! 60!
Strongly!Agree!Agree!
Neutral!Disagree!
Strongly!Disagree!
The#price#of#Pantene#shampoo#equal#to#the#quality#that#I#receive#
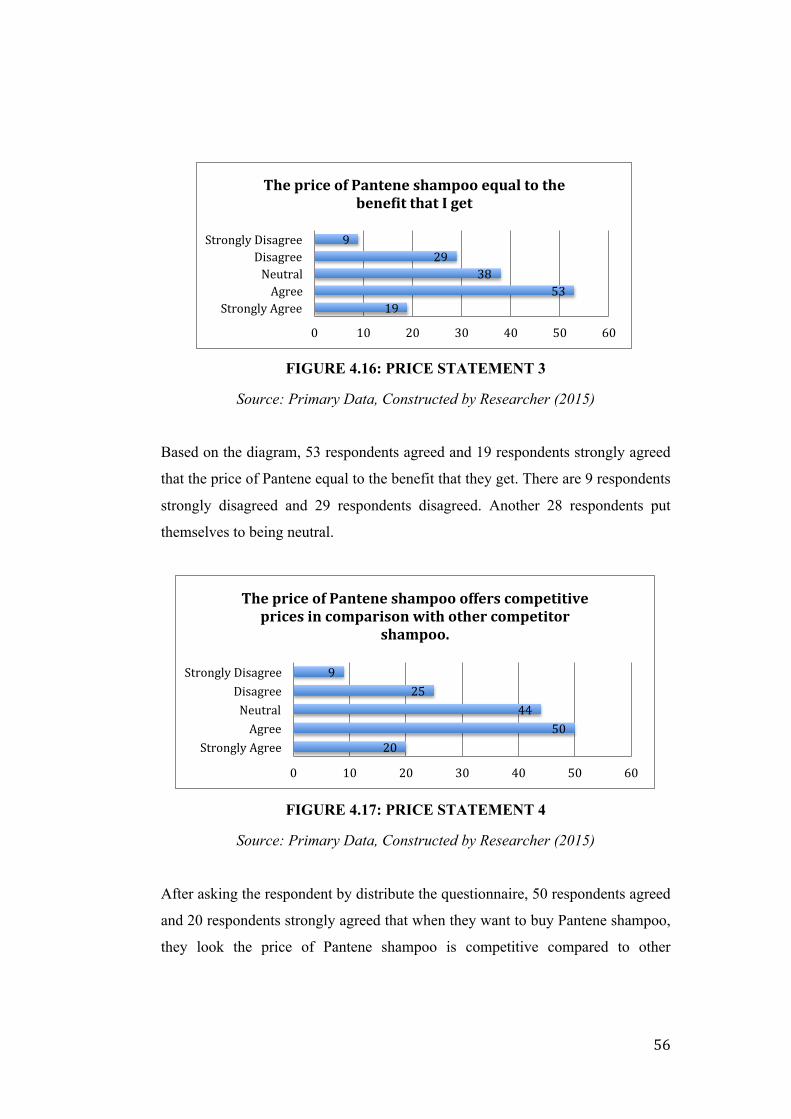
! 56!
FIGURE 4.16: PRICE STATEMENT 3
Source: Primary Data, Constructed by Researcher (2015)
Based on the diagram, 53 respondents agreed and 19 respondents strongly agreed
that the price of Pantene equal to the benefit that they get. There are 9 respondents
strongly disagreed and 29 respondents disagreed. Another 28 respondents put
themselves to being neutral.
FIGURE 4.17: PRICE STATEMENT 4
Source: Primary Data, Constructed by Researcher (2015)
After asking the respondent by distribute the questionnaire, 50 respondents agreed
and 20 respondents strongly agreed that when they want to buy Pantene shampoo,
they look the price of Pantene shampoo is competitive compared to other
19!53!
38!29!
9!
0! 10! 20! 30! 40! 50! 60!
Strongly!Agree!Agree!
Neutral!Disagree!
Strongly!Disagree!
The#price#of#Pantene#shampoo#equal#to#the#beneHit#that#I#get#
20!50!
44!25!
9!
0! 10! 20! 30! 40! 50! 60!
Strongly!Agree!Agree!
Neutral!Disagree!
Strongly!Disagree!
The#price#of#Pantene#shampoo#offers#competitive#prices#in#comparison#with#other#competitor#
shampoo.#
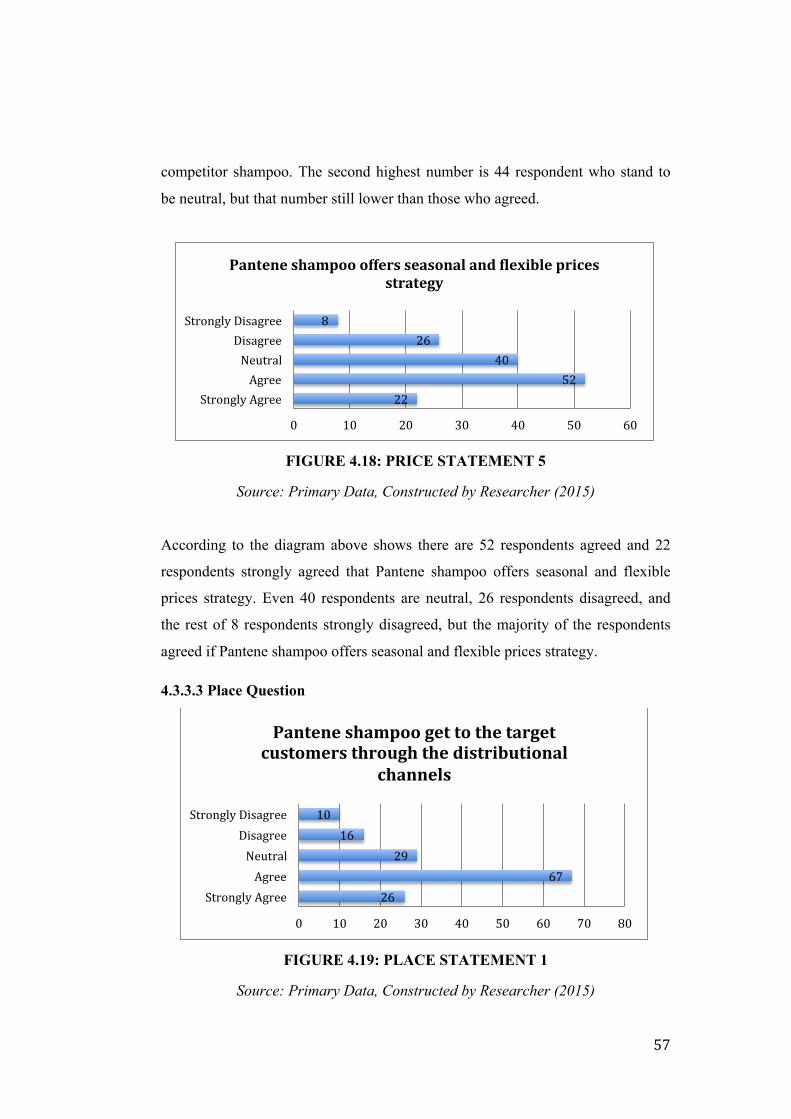
! 57!
competitor shampoo. The second highest number is 44 respondent who stand to
be neutral, but that number still lower than those who agreed.
FIGURE 4.18: PRICE STATEMENT 5
Source: Primary Data, Constructed by Researcher (2015)
According to the diagram above shows there are 52 respondents agreed and 22
respondents strongly agreed that Pantene shampoo offers seasonal and flexible
prices strategy. Even 40 respondents are neutral, 26 respondents disagreed, and
the rest of 8 respondents strongly disagreed, but the majority of the respondents
agreed if Pantene shampoo offers seasonal and flexible prices strategy.
4.3.3.3 Place Question
FIGURE 4.19: PLACE STATEMENT 1
Source: Primary Data, Constructed by Researcher (2015)
22!52!
40!26!
8!
0! 10! 20! 30! 40! 50! 60!
Strongly!Agree!Agree!
Neutral!Disagree!
Strongly!Disagree!
Pantene#shampoo#offers#seasonal#and#Hlexible#prices#strategy#
26!67!
29!16!
10!
0! 10! 20! 30! 40! 50! 60! 70! 80!
Strongly!Agree!Agree!
Neutral!Disagree!
Strongly!Disagree!
Pantene#shampoo#get#to#the#target#customers#through#the#distributional#
channels#
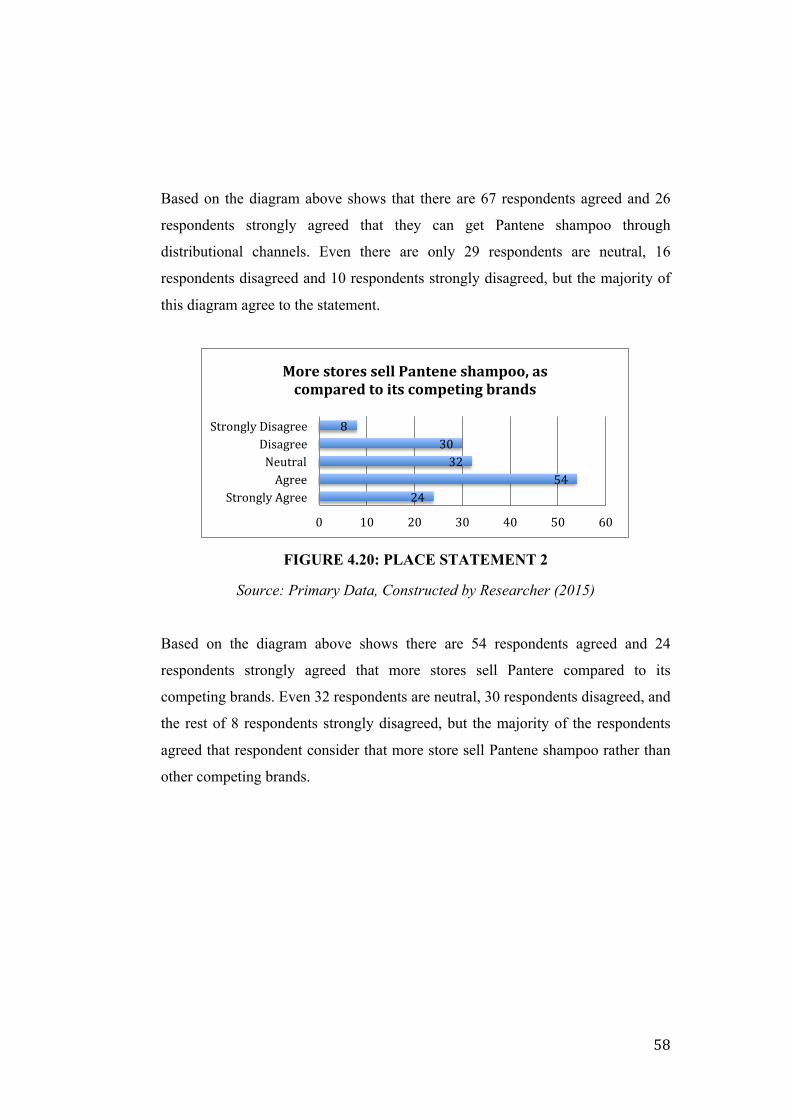
! 58!
Based on the diagram above shows that there are 67 respondents agreed and 26
respondents strongly agreed that they can get Pantene shampoo through
distributional channels. Even there are only 29 respondents are neutral, 16
respondents disagreed and 10 respondents strongly disagreed, but the majority of
this diagram agree to the statement.
FIGURE 4.20: PLACE STATEMENT 2
Source: Primary Data, Constructed by Researcher (2015)
Based on the diagram above shows there are 54 respondents agreed and 24
respondents strongly agreed that more stores sell Pantere compared to its
competing brands. Even 32 respondents are neutral, 30 respondents disagreed, and
the rest of 8 respondents strongly disagreed, but the majority of the respondents
agreed that respondent consider that more store sell Pantene shampoo rather than
other competing brands.
24!54!
32!30!
8!
0! 10! 20! 30! 40! 50! 60!
Strongly!Agree!Agree!
Neutral!Disagree!
Strongly!Disagree!
More#stores#sell#Pantene#shampoo,#as#compared#to#its#competing#brands#
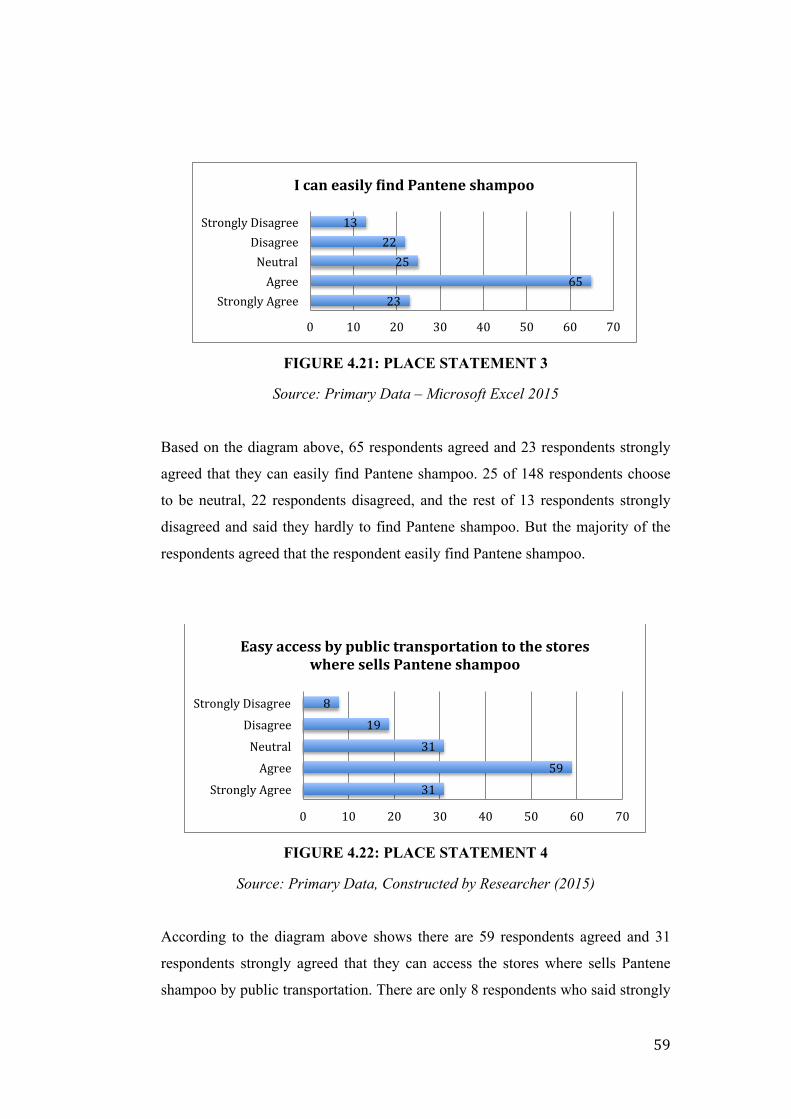
! 59!
FIGURE 4.21: PLACE STATEMENT 3
Source: Primary Data – Microsoft Excel 2015
Based on the diagram above, 65 respondents agreed and 23 respondents strongly
agreed that they can easily find Pantene shampoo. 25 of 148 respondents choose
to be neutral, 22 respondents disagreed, and the rest of 13 respondents strongly
disagreed and said they hardly to find Pantene shampoo. But the majority of the
respondents agreed that the respondent easily find Pantene shampoo.
FIGURE 4.22: PLACE STATEMENT 4
Source: Primary Data, Constructed by Researcher (2015)
According to the diagram above shows there are 59 respondents agreed and 31
respondents strongly agreed that they can access the stores where sells Pantene
shampoo by public transportation. There are only 8 respondents who said strongly
23!65!
25!22!
13!
0! 10! 20! 30! 40! 50! 60! 70!
Strongly!Agree!Agree!
Neutral!Disagree!
Strongly!Disagree!
I#can#easily#Hind#Pantene#shampoo#
31!59!
31!19!
8!
0! 10! 20! 30! 40! 50! 60! 70!
Strongly!Agree!Agree!
Neutral!Disagree!
Strongly!Disagree!
Easy#access#by#public#transportation#to#the#stores#where#sells#Pantene#shampoo#

! 60!
disagree, 19 respondents agreed, and 31 respondents are neutral. But the majority
of this statement are agreed to the statement.
FIGURE 4.23: PLACE STATEMENT 5
Source: Primary Data, Constructed by Researcher (2015)
Based on the diagram above shows there are 49 respondents agreed and 33
respondents strongly agreed that they can buy Pantene shampoo every time they
need because Pantene shampoo always stocked-in the stores. 36 respondents
choose to be neutral, 20 respondents disagreed and the rest of 10 respondents
strongly disagreed with the statement, but the majority agreed to the statement.
FIGURE 4.24: PLACE STATEMENT 6
Source: Primary Data, Constructed by Researcher (2015)
33!49!
36!20!
10!
0! 10! 20! 30! 40! 50! 60!
Strongly!Agree!Agree!
Neutral!Disagree!
Strongly!Disagree!
Pantene#shampoo#is#rarely#been#stockedMout,#so#I#can#always#buy#them#every#time#I#need.#
39!54!
38!13!
4!
0! 10! 20! 30! 40! 50! 60!
Strongly!Agree!Agree!
Neutral!Disagree!
Strongly!Disagree!
Pantene#shampoo#is#distributed#through#as#many#stores#as#possible.#
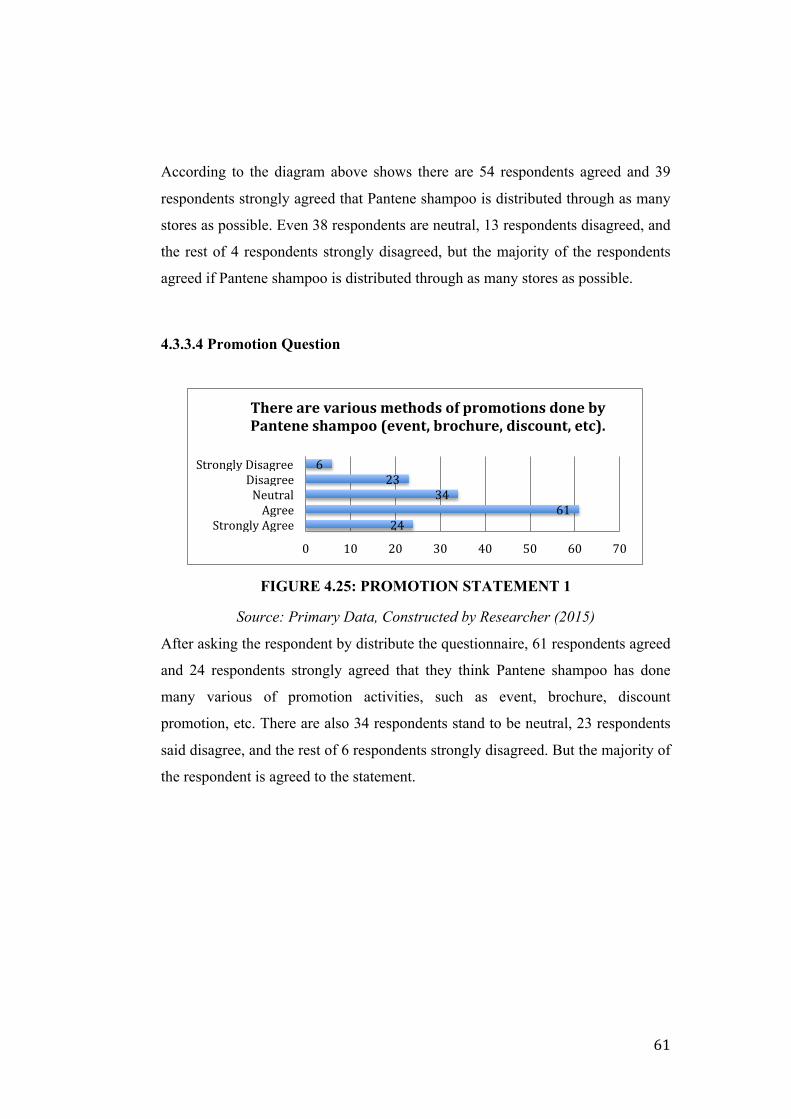
! 61!
According to the diagram above shows there are 54 respondents agreed and 39
respondents strongly agreed that Pantene shampoo is distributed through as many
stores as possible. Even 38 respondents are neutral, 13 respondents disagreed, and
the rest of 4 respondents strongly disagreed, but the majority of the respondents
agreed if Pantene shampoo is distributed through as many stores as possible.
4.3.3.4 Promotion Question
FIGURE 4.25: PROMOTION STATEMENT 1
Source: Primary Data, Constructed by Researcher (2015)
After asking the respondent by distribute the questionnaire, 61 respondents agreed
and 24 respondents strongly agreed that they think Pantene shampoo has done
many various of promotion activities, such as event, brochure, discount
promotion, etc. There are also 34 respondents stand to be neutral, 23 respondents
said disagree, and the rest of 6 respondents strongly disagreed. But the majority of
the respondent is agreed to the statement.
24!61!
34!23!
6!
0! 10! 20! 30! 40! 50! 60! 70!
Strongly!Agree!Agree!
Neutral!Disagree!
Strongly!Disagree!
There#are#various#methods#of#promotions#done#by#Pantene#shampoo#(event,#brochure,#discount,#etc).#
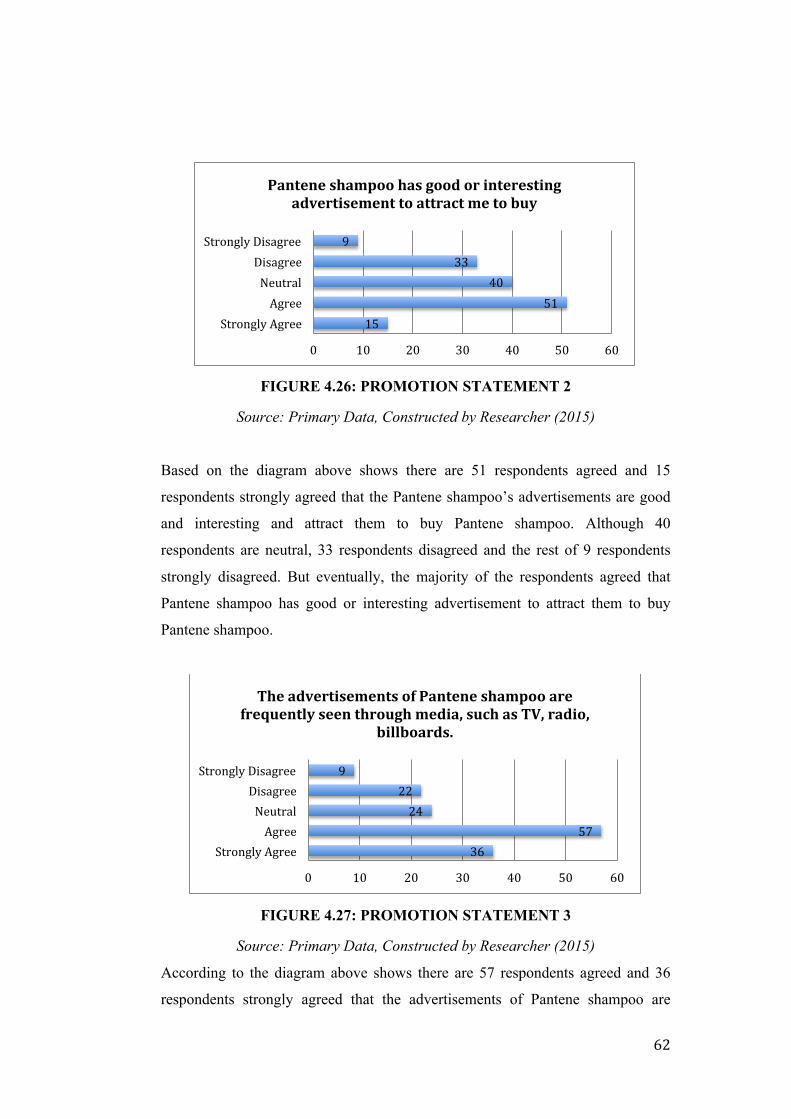
! 62!
FIGURE 4.26: PROMOTION STATEMENT 2
Source: Primary Data, Constructed by Researcher (2015)
Based on the diagram above shows there are 51 respondents agreed and 15
respondents strongly agreed that the Pantene shampoo’s advertisements are good
and interesting and attract them to buy Pantene shampoo. Although 40
respondents are neutral, 33 respondents disagreed and the rest of 9 respondents
strongly disagreed. But eventually, the majority of the respondents agreed that
Pantene shampoo has good or interesting advertisement to attract them to buy
Pantene shampoo.
FIGURE 4.27: PROMOTION STATEMENT 3
Source: Primary Data, Constructed by Researcher (2015)
According to the diagram above shows there are 57 respondents agreed and 36
respondents strongly agreed that the advertisements of Pantene shampoo are
15!51!
40!33!
9!
0! 10! 20! 30! 40! 50! 60!
Strongly!Agree!Agree!
Neutral!Disagree!
Strongly!Disagree!
Pantene#shampoo#has#good#or#interesting#advertisement#to#attract#me#to#buy#
36!57!
24!22!
9!
0! 10! 20! 30! 40! 50! 60!
Strongly!Agree!Agree!
Neutral!Disagree!
Strongly!Disagree!
The#advertisements#of#Pantene#shampoo#are#frequently#seen#through#media,#such#as#TV,#radio,#
billboards.#
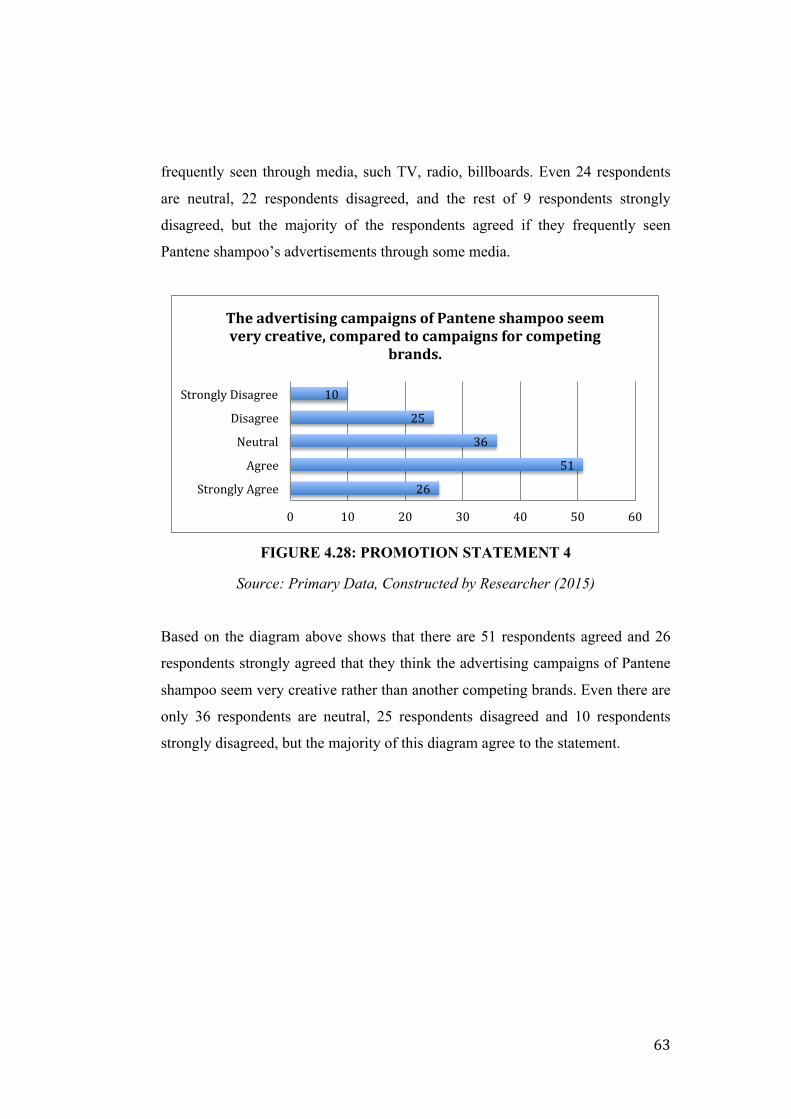
! 63!
frequently seen through media, such TV, radio, billboards. Even 24 respondents
are neutral, 22 respondents disagreed, and the rest of 9 respondents strongly
disagreed, but the majority of the respondents agreed if they frequently seen
Pantene shampoo’s advertisements through some media.
FIGURE 4.28: PROMOTION STATEMENT 4
Source: Primary Data, Constructed by Researcher (2015)
Based on the diagram above shows that there are 51 respondents agreed and 26
respondents strongly agreed that they think the advertising campaigns of Pantene
shampoo seem very creative rather than another competing brands. Even there are
only 36 respondents are neutral, 25 respondents disagreed and 10 respondents
strongly disagreed, but the majority of this diagram agree to the statement.
26!
51!
36!
25!
10!
0! 10! 20! 30! 40! 50! 60!
Strongly!Agree!
Agree!
Neutral!
Disagree!
Strongly!Disagree!
The#advertising#campaigns#of#Pantene#shampoo#seem#very#creative,#compared#to#campaigns#for#competing#
brands.##
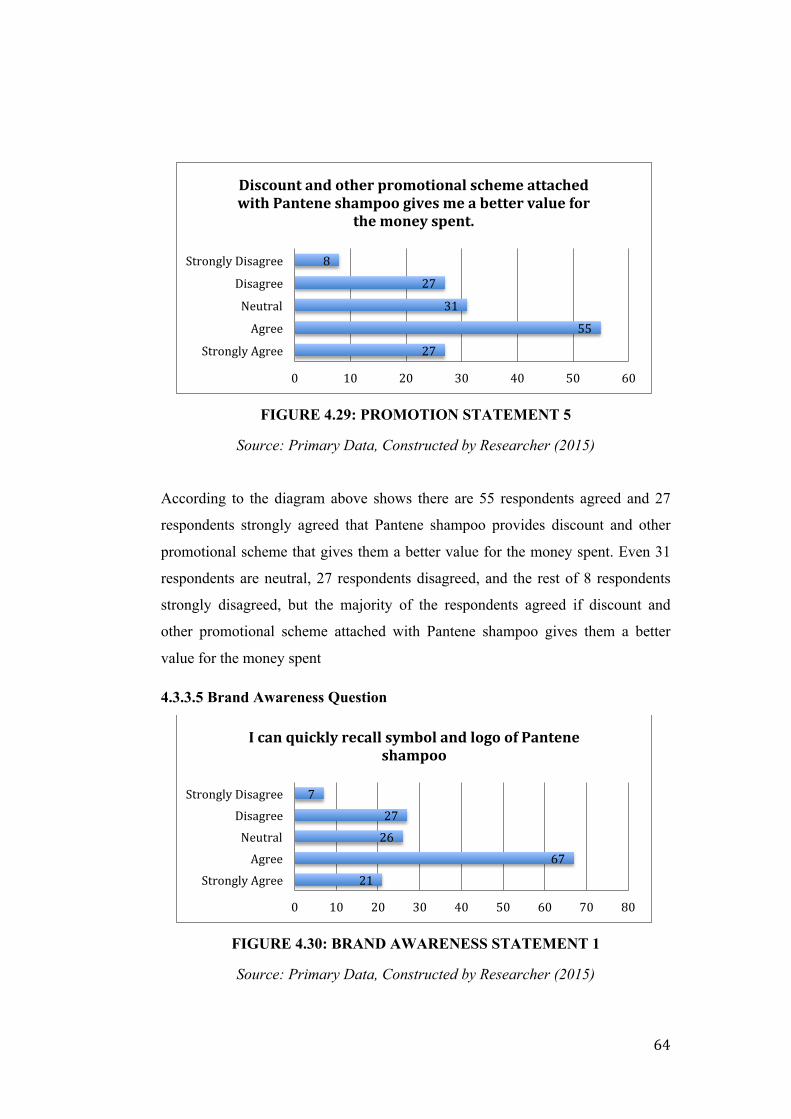
! 64!
FIGURE 4.29: PROMOTION STATEMENT 5
Source: Primary Data, Constructed by Researcher (2015)
According to the diagram above shows there are 55 respondents agreed and 27
respondents strongly agreed that Pantene shampoo provides discount and other
promotional scheme that gives them a better value for the money spent. Even 31
respondents are neutral, 27 respondents disagreed, and the rest of 8 respondents
strongly disagreed, but the majority of the respondents agreed if discount and
other promotional scheme attached with Pantene shampoo gives them a better
value for the money spent
4.3.3.5 Brand Awareness Question
FIGURE 4.30: BRAND AWARENESS STATEMENT 1
Source: Primary Data, Constructed by Researcher (2015)
27!
55!
31!
27!
8!
0! 10! 20! 30! 40! 50! 60!
Strongly!Agree!
Agree!
Neutral!
Disagree!
Strongly!Disagree!
Discount#and#other#promotional#scheme#attached#with#Pantene#shampoo#gives#me#a#better#value#for#
the#money#spent.#
21!67!
26!27!
7!
0! 10! 20! 30! 40! 50! 60! 70! 80!
Strongly!Agree!Agree!
Neutral!Disagree!
Strongly!Disagree!
I#can#quickly#recall#symbol#and#logo#of#Pantene#shampoo#

! 65!
Based on the diagram above shows that there are 67 respondents agreed and 21
respondents strongly agreed that they can recall symbol and logo of Pantene
shampoo quickly. Even there are only 26 respondents are neutral, 27 respondents
disagreed and the rest of 7 respondents strongly disagreed, but the majority of this
respondent agreed to the statement.
FIGURE 4.31: BRAND AWARENESS STATEMENT 2
Source: Primary Data, Constructed by Researcher (2015)
According to the diagram above shows there are 67 respondents agreed and 13
respondents strongly agreed that they consider value of money is the most
important factor when they are willing to purchase Pantene shampoo. Even 40
respondents are neutral, 20 respondents disagreed, and the rest of 8 respondents
strongly disagreed, but the majority of the respondents agreed to the statement.
13!67!
40!20!
8!
0! 10! 20! 30! 40! 50! 60! 70! 80!
Strongly!Agree!Agree!
Neutral!Disagree!
Strongly!Disagree!
I#do#consider#value#for#money#is#the#most#important#factor#when#I#am#going#to#purchase#
Pantene#shampoo#
19!47!
40!32!
10!
0! 10! 20! 30! 40! 50!
Strongly!Agree!Agree!
Neutral!Disagree!
Strongly!Disagree!
I#do#have#adequate#knowledge#of#Pantene#shampoo#than#other#shampoo#brands#in#the#
market#
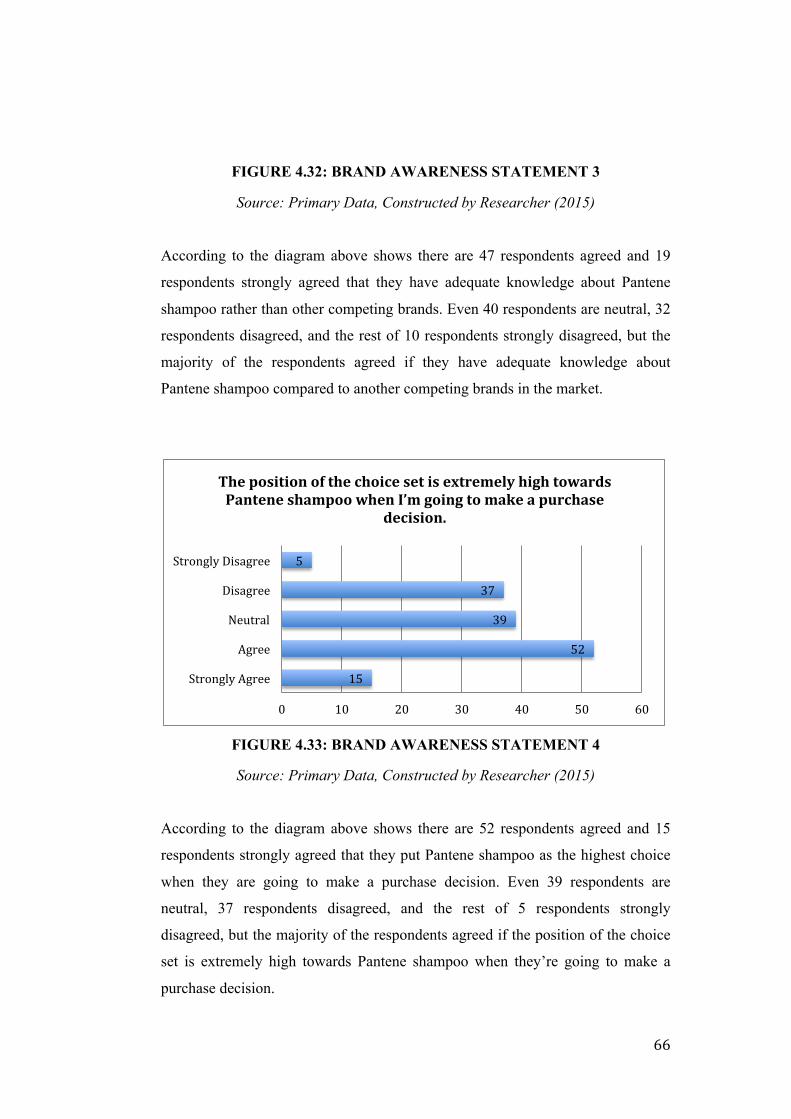
! 66!
FIGURE 4.32: BRAND AWARENESS STATEMENT 3
Source: Primary Data, Constructed by Researcher (2015)
According to the diagram above shows there are 47 respondents agreed and 19
respondents strongly agreed that they have adequate knowledge about Pantene
shampoo rather than other competing brands. Even 40 respondents are neutral, 32
respondents disagreed, and the rest of 10 respondents strongly disagreed, but the
majority of the respondents agreed if they have adequate knowledge about
Pantene shampoo compared to another competing brands in the market.
FIGURE 4.33: BRAND AWARENESS STATEMENT 4
Source: Primary Data, Constructed by Researcher (2015)
According to the diagram above shows there are 52 respondents agreed and 15
respondents strongly agreed that they put Pantene shampoo as the highest choice
when they are going to make a purchase decision. Even 39 respondents are
neutral, 37 respondents disagreed, and the rest of 5 respondents strongly
disagreed, but the majority of the respondents agreed if the position of the choice
set is extremely high towards Pantene shampoo when they’re going to make a
purchase decision.
15!
52!
39!
37!
5!
0! 10! 20! 30! 40! 50! 60!
Strongly!Agree!
Agree!
Neutral!
Disagree!
Strongly!Disagree!
The#position#of#the#choice#set#is#extremely#high#towards#Pantene#shampoo#when#I’m#going#to#make#a#purchase#
decision.#

! 67!
FIGURE 4.34: BRAND AWARENESS STATEMENT 5
Source: Primary Data, Constructed by Researcher (2015)
Based on diagram in the figure 4.34, 9 respondents are strongly disagree, 20
respondents are disagree, 34 respondents are neutral, 61 respondents are agree and
24 of 148 respondents are strongly agree with the statement. Therefore the
majority respondents are agree with the statement.
24!61!
34!20!
9!
0! 10! 20! 30! 40! 50! 60! 70!
Strongly!Agree!Agree!
Neutral!Disagree!
Strongly!Disagree!
I#can#recall#competitive#brands#easily#when#I'm#going#to#purchase#Pantene#shampoo#
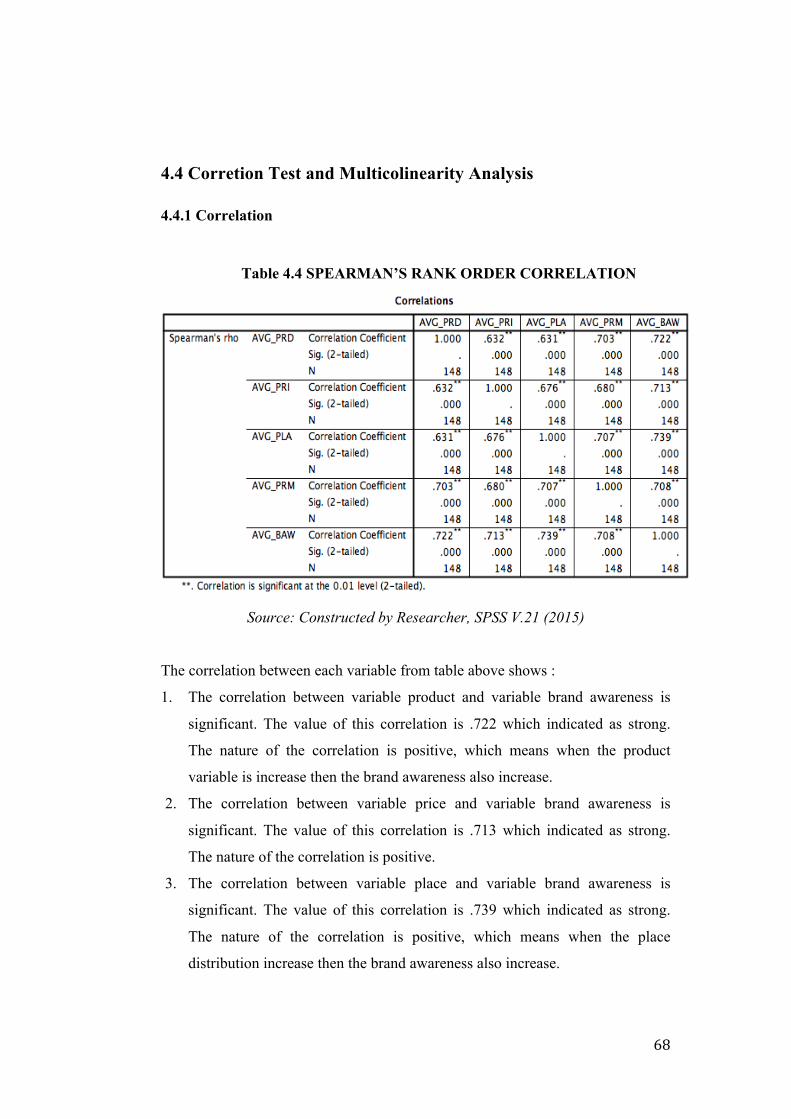
! 68!
4.4 Corretion Test and Multicolinearity Analysis
4.4.1 Correlation
Table 4.4 SPEARMAN’S RANK ORDER CORRELATION
Source: Constructed by Researcher, SPSS V.21 (2015)
The correlation between each variable from table above shows :
1. The correlation between variable product and variable brand awareness is
significant. The value of this correlation is .722 which indicated as strong.
The nature of the correlation is positive, which means when the product
variable is increase then the brand awareness also increase.
2. The correlation between variable price and variable brand awareness is
significant. The value of this correlation is .713 which indicated as strong.
The nature of the correlation is positive.
3. The correlation between variable place and variable brand awareness is
significant. The value of this correlation is .739 which indicated as strong.
The nature of the correlation is positive, which means when the place
distribution increase then the brand awareness also increase.
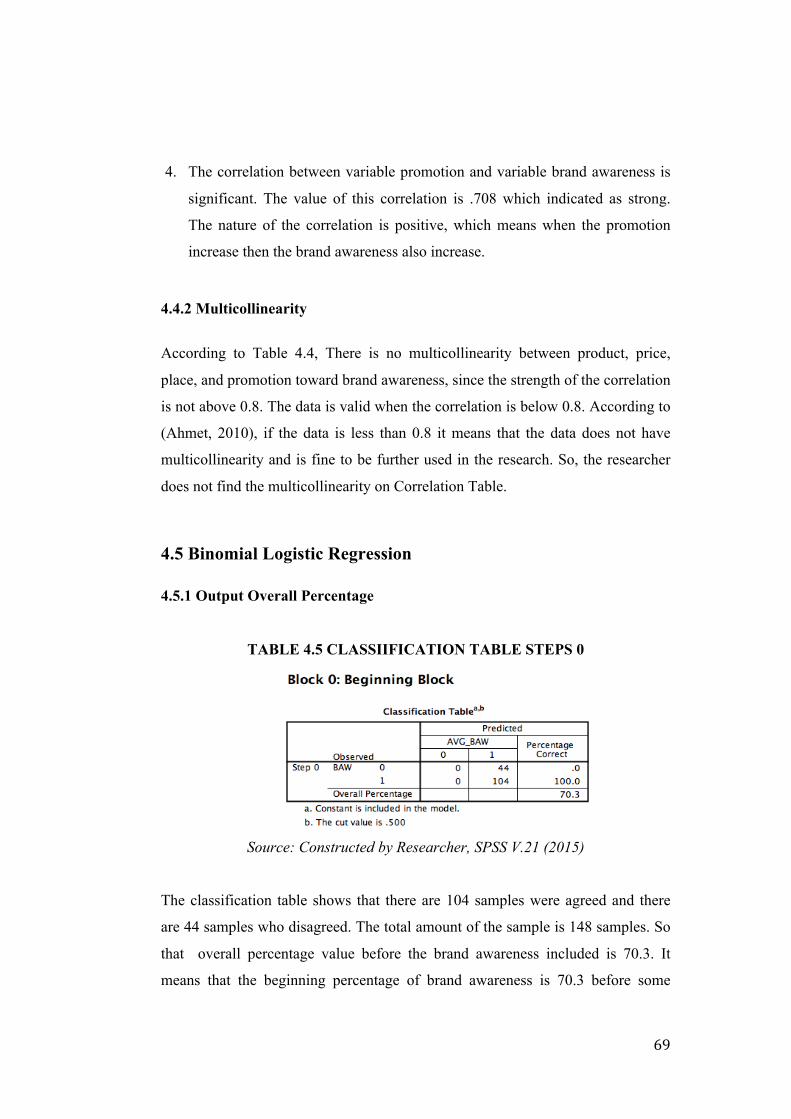
! 69!
4. The correlation between variable promotion and variable brand awareness is
significant. The value of this correlation is .708 which indicated as strong.
The nature of the correlation is positive, which means when the promotion
increase then the brand awareness also increase.
4.4.2 Multicollinearity According to Table 4.4, There is no multicollinearity between product, price,
place, and promotion toward brand awareness, since the strength of the correlation
is not above 0.8. The data is valid when the correlation is below 0.8. According to
(Ahmet, 2010), if the data is less than 0.8 it means that the data does not have
multicollinearity and is fine to be further used in the research. So, the researcher
does not find the multicollinearity on Correlation Table.
4.5 Binomial Logistic Regression
4.5.1 Output Overall Percentage
TABLE 4.5 CLASSIIFICATION TABLE STEPS 0
Source: Constructed by Researcher, SPSS V.21 (2015)
The classification table shows that there are 104 samples were agreed and there
are 44 samples who disagreed. The total amount of the sample is 148 samples. So
that overall percentage value before the brand awareness included is 70.3. It
means that the beginning percentage of brand awareness is 70.3 before some

! 70!
independent variable input to the research. Therefore the overall percentage of the
model is 104/148 = 70.3% meaning the precision of model before adding
independent variable is 70.3%.
TABLE 4.6 CLASSIFICATION TABLE ADDING 1 INDEPENDENT
VARIABLE
Source: Constructed by Researcher, SPSS V.21 (2015)
The table 4.5 shows the empirical dependent variable after adding 1 independent
variable which is product. The amount of sample is 148, therefore the overall
percentage after adding 1 variable brand association into the model 26+96/148 =
82.4%, it means the model improve 12.1%.
TABLE 4.7 CLASSIFICATION TABLE ADDING ALL INDEPENDENT
VARIABLE
Source: Constructed by Researcher, SPSS V.21 (2015)
The table 4.7 shows the overall percentage after adding all independent variable
(32+101)/148 = 89.9%. It increased 7.5% from before adding independent
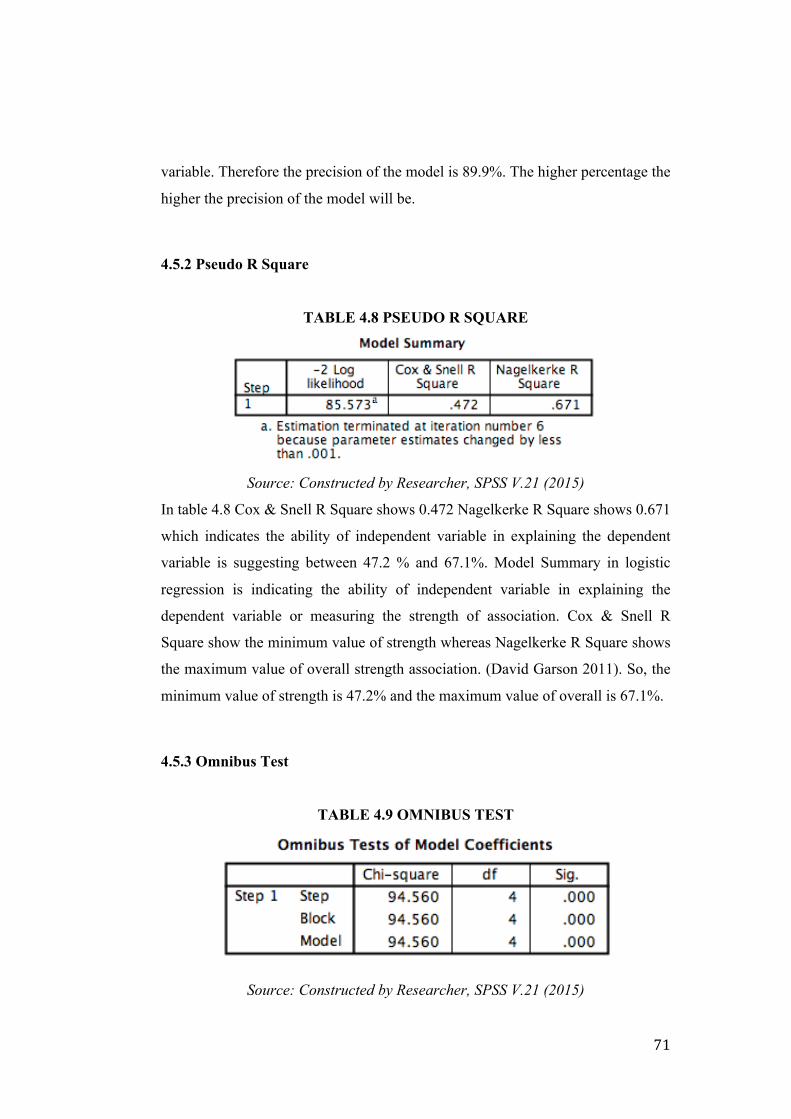
! 71!
variable. Therefore the precision of the model is 89.9%. The higher percentage the
higher the precision of the model will be.
4.5.2 Pseudo R Square
TABLE 4.8 PSEUDO R SQUARE
Source: Constructed by Researcher, SPSS V.21 (2015)
In table 4.8 Cox & Snell R Square shows 0.472 Nagelkerke R Square shows 0.671
which indicates the ability of independent variable in explaining the dependent
variable is suggesting between 47.2 % and 67.1%. Model Summary in logistic
regression is indicating the ability of independent variable in explaining the
dependent variable or measuring the strength of association. Cox & Snell R
Square show the minimum value of strength whereas Nagelkerke R Square shows
the maximum value of overall strength association. (David Garson 2011). So, the
minimum value of strength is 47.2% and the maximum value of overall is 67.1%.
4.5.3 Omnibus Test
TABLE 4.9 OMNIBUS TEST
Source: Constructed by Researcher, SPSS V.21 (2015)
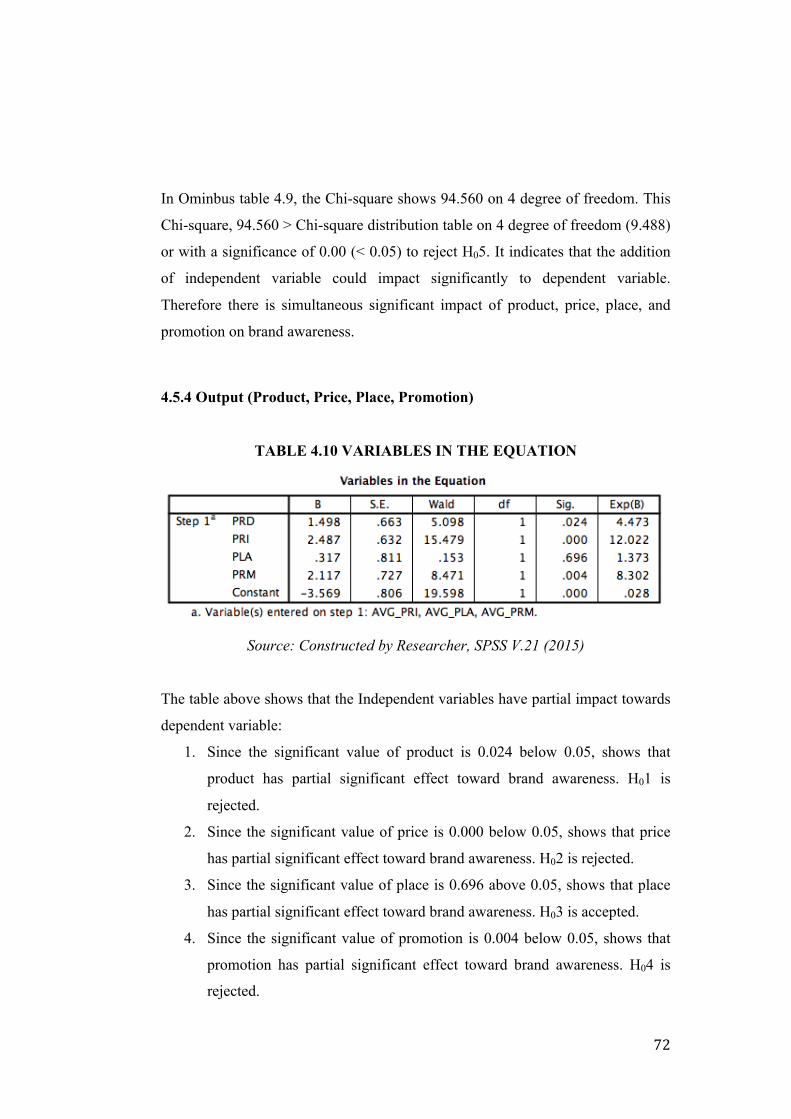
! 72!
In Ominbus table 4.9, the Chi-square shows 94.560 on 4 degree of freedom. This
Chi-square, 94.560 > Chi-square distribution table on 4 degree of freedom (9.488)
or with a significance of 0.00 (< 0.05) to reject H05. It indicates that the addition
of independent variable could impact significantly to dependent variable.
Therefore there is simultaneous significant impact of product, price, place, and
promotion on brand awareness.
4.5.4 Output (Product, Price, Place, Promotion)
TABLE 4.10 VARIABLES IN THE EQUATION
Source: Constructed by Researcher, SPSS V.21 (2015)
The table above shows that the Independent variables have partial impact towards
dependent variable:
1. Since the significant value of product is 0.024 below 0.05, shows that
product has partial significant effect toward brand awareness. H01 is
rejected.
2. Since the significant value of price is 0.000 below 0.05, shows that price
has partial significant effect toward brand awareness. H02 is rejected.
3. Since the significant value of place is 0.696 above 0.05, shows that place
has partial significant effect toward brand awareness. H03 is accepted.
4. Since the significant value of promotion is 0.004 below 0.05, shows that
promotion has partial significant effect toward brand awareness. H04 is
rejected.
! 73!
From table above result analysis can be conclude that:
1. The Exp(B) of product is 4.473 which is >1. It means product has positive
effect toward dependent variable, brand awareness. Therefore in every
agreement from respondent in product will increase the probability of the
respondent to aware by approximately 4 times .
2. The Exp(B) of brand awareness is 12.022 which is >1. It means price has
positive effect toward dependent variable, brand awareness. Therefore in
every agreement from respondent in price will increase the probability of
the respondent to aware by approximately 12 times.
3. The Exp(B) of place is 1.373 which is >1, therefore the independent
variable of place does not have positive effect toward dependent variable,
brand awareness.
4. The Exp(B) of promotion is 8.302 which is >1. It means promotion has
positive effect toward dependent variable, brand awareness. Therefore in
every agreement from respondent in promotion will increase the
probability of the respondent to aware by approximately 8 times.
4.6 Interpretation Result
4.6.1 Product towards Brand Awareness of Pantene Shampoo in Carefour
Hypermart, Kota Kasablanka
Based on findings in the table 4.10, product has a significant effect toward brand
awareness which is 0.024. Every agreement of respondent in product will increase
the probability of the respondent to aware Pantene shampoo by approximately 4.
times. This is in harmony with research of Raeros & Nugrahani 2012 which found
that product did effect brand awareness.
4.6.2 Price towards Brand Awareness of Pantene Shampoo in Carefour
Hypermart, Kota Kasablanka
Based on findings in the table 4.10, price has a significant effect toward brand
awareness which is 0.000. Every agreement of respondent in price will increase
! 74!
the probability of the respondent to aware Pantene shampoo by approximately 12
times. This is in harmony with research of Raeros & Nugrahani 2012 which found
that price did effect brand awareness.
4.6.3 Place towards Brand Awareness of Pantene Shampoo in Carefour
Hypermart, Kota Kasablanka
Based on findings in the table 4.10, place does not have significant effect toward
brand awareness which is 0.696. This is in harmony with research of Raeros &
Nugrahani 2012 which found that place did not effect brand awareness.
4.6.4 Promotion towards Brand Awareness of Pantene Shampoo in Carefour
Hypermart, Kota Kasablanka
Based on findings in the table 4.10, promotion has a significant effect toward
brand awareness which is 0.004. Every agreement of respondent in promotion will
increase the probability of the respondent to aware Pantene shoes by
approximately 8 times. This is in harmony with research of Raeros & Nugrahani
2012 which found that promotion did effect brand awareness.
! 75!
CHAPTER V
THE CONCLUSION AND RECOMMENDATION
In this chapter, researcher would like to convey the conclusion and the
recommendation based on analysis about The Effect of Marketing Mix toward
Brand Awareness (A Study Case of Pantene Shampoo at Carefour Hypermart,
Kota Kasablanka). The research conduct to know whether those independent
variables, which are Product, Price, Place, Promotion have significant effect
towards dependent variable which is Brand Awareness. In addition, researcher
also wants to know which factor from the independent variables that have biggest
effect towards Brand Awareness.
5.1 Conclusion Based on result analysis, researcher concludes that:
1. H01 rejected, means the independent variable of Product has partial
significant effect towards Brand Awareness of Pantene shampoo at
Carefour Hypermart, Kota Kasablanka.
2. H02 rejected, means the independent variable of Price has partial
significant effect towards Brand Awareness of Pantene shampoo at
Carefour Hypermart, Kota Kasablanka.
3. H03 accepted, means the independent variable of Place does not have
partial significant effect towards Brand Awareness of Pantene shampoo at
Carefour Hypermart, Kota Kasablanka.
4. H04 rejected, means the independent variable of Promotion has partial
significant effect towards Brand Awareness of Pantene shampoo at
Carefour Hypermart, Kota Kasablanka.
5. H05 rejected, means the independent variable of Product, Price, Place, and
Promotion have simultaneous significant effect towards Brand Awareness
of Pantene shampoo at Carefour Hypermart, Kota Kasablanka.
! 76!
5.2 Recommendation Based on those conclusions wrote above and some finding in this study, there are
some possible course of action may be identified. The following
recommendations are offered as guidelines or suggestion for consideration and
possible application by President University, Procter & Gamble Company, and
Future researcher. The following recommendations are made.
5.2.1 For Company
Based on the research, Pantene shampoo has positive result in term of Product,
Price, and Promotion toward Brand Awareness. Researcher conclude that the
company should concern about these things, such as:
1. For Product, when the statement “The brand name of Pantene shampoo are
familiar” being asked to the respondent, the researcher got the unsatisfied
result. 36 of 148 respondents choose to be neutral, other 23 respondents
choose to be disagreed and 3 respondents choose to be strongly disagreed.
Procter & Gamble should concern to those respondent in order to stimulate
them to be familiar about the brand. For the respondents who choose agree
to that statement, Procter & Gamble should keep maintaining to recall that
brand in the public so those respondents will not choose to other brand and
keep remind about Pantene shampoo.
2. For Price of Pantene shampoo based on result is already good, the
recommendation from the researcher is Pantene shampoo should keep
their price stable and maintain the benefit of the consumer get has to be
equal to what they paid. If Pantene shampoo wants to increase their price,
the researcher suggest Pantene shampoo do not increase the price too high,
because the consumer already remember about their current price in the
market. The consumer feel Pantene shampoo is reasonable. Because based
on the data, the statement “Pantene shampoo prices are reasonable”, 62 of
148 respondents choose to be agree and it conclude that the respondent
feel the Pantene shampoo is affordable.
! 77!
3. For Promotion of Pantene shampoo based on the result is also already
good. Because the statement “There are various methods of promotions
done by Pantene shampoo (event, brochure, discount, etc)” get 61 of 148
respondent choose to be agree and it proved that the respondent have ever
seen some of promotions from Pantene shampoo. The recommendation
from the researcher is keep promote Pantene shampoo to make customer
remind about that brand.
4. For last recommendation is company should increase the level of
Promotion and the value of the Price because the greater level of
Promotion and the value of Price will boost Brand Awareness.
5.2.2 For Future Research The researcher recommends that the future research can be conducted as below :
1. For future researcher, the researcher suggests the future researcher to
provide bigger sample size, therefore the future researcher can provide a
more specific research on the Effect of Product, Price, and Promotion.
2. The future research are suggested to able to focus on different categories
such as cosmetic, food & beverage product, sanitary napkins, and other to
produce better findings on the Brand Awareness on the different
categories.
! 78!
REFERENCES !TEXTBOOK :
Aaker, D.A., (2010), Building strong brands, New York: The Free Press.
Boehm, et al,.(2002). Colloid and Surface Phenomena Aspects of Shampoo. State
University of New York at Buffalo.
Boslaugh, S. (2007). Secondary analysis for public health: A practical guide.
New York, NY: Cambridge. doi: 10.1017/CBO9780511618802
CIM (2009). The Chartered Institute of Marketing. How to achieve an effective
promotional mix. United Kingdom.
Christensen, L. & Johnson, B., (2008). Educational research: Quantitative,
qualitative, and mixed approaches (p. 34). Thousand Oaks, CA: Sage
Publications.
Cohen, et al., (2007). Research Methods in Education. 6th Edition, London:
Routledge Falmer.
Ferrel, et al., (2013). Marketing Concepts & Strategies. Cengange Learning.
British Library. ISBN: 978-1-4080-3214-5.
! 79!
Hair et al (2010). Multivariate Data Analysis. 7th Edition, London: Prentice Hall
Kashmir & Jakfar (2003). Studi Kelayakan Bisnis. Kencana Prenada Media
Group, Jakarta
Keller, K. L. (2008). Strategic Brand Management. Third Edition. New Jersey:
Pearson Prentice Hall, Inc.
Keller, K.L. (2013), Strategic Brand Management, 4th ed., Upper Saddle River,
NJ: Pearson Prentice-Hall.
Kotler, P. (2010). Marketing management. (millenniun ed.). Upper Saddle River:
Prentice Hall International.
Kotler, P., Armstrong, G., Cunningham, P.H. (2005). Principles of
Marketing. Toronto: Pearson Education Canada. pp. 67-70.
Kotler, P. and Armstrong, G. (2008). Principle of Marketing. 12th edition,
Prentice Hall, New Jersey.
Kotler P, Armstrong G, Wong V, Saunders J. (2008). Principles of Marketing.
London: Prentice Hall.
Kotler, P. & Armstrong, G. (2010) Principles of Marketing. 13th (Global) ed.
Boston: Pearson Education, Inc.
! 80!
Kotler, P., & Armstrong, G. (2014). Principles of Marketing (15th ed., pp. 50-55).
Upper Saddle, N.J: Pearson.
Kotler, P., Bowen, J. and Makens, J. (2013). Marketing for Hospitality and
Tourism (6th edn). Upper Saddle River: Pearson Higher Ed. USA.
Kumar, B, (2010), Marketing of Hospitality and Tourism Services, Tat McGraw-
Hill Education
Lamb CW, Jr JF, McDaniel CD (2010). Essentials of Marketing. United States: Cengage Learning.
Lovelock, et al., (2010). Services Marketing in Asia. 2nd edition. Prentice Hall
Maholtra, N. K. (2010). Marketing Research: An applied orientation 6th edition.
Pearson.
McBurney, D. H. & White, T. L. (2009). Research Method. Eight Edition.
Cengange Learning. USA.
Nargundkar, R. (2008), Marketing Research: Text and Cases, Tata McGraw-Hill
Educational

! 81!
O’Dwyer, L. M., & Bernauer, J. A. (2014). Quantitative research for the
qualitative researcher. Thousand Oaks, CA: SAGE Publications.
Pereault, W.D. et al,. (2004). Learning aid for use with Basic Marketing. USA:
McGraw-Hill Ryerson Higher Education.
Rangkuti, F., (2008). The Power of Brands: Teknik Mengelola Brand Equity dan
Strategi Pengembangan Merek Plus Analisis Kasus Dengan SPSS. Jakarta:
Gramedia.
Sekaran, U., & Bougie, R., (2010). Research Method for Business, 5 th Edition.
John Wiley & Sons Ltd.
Sekaran, U., & Bougie, R., (2013). Research Methods for Business, 6th Edition.
West Sussex: John Wiley & Sons Ltd.
Shah, K. (2009). Advertising and Promotion: An IMC Perspective. New Delhi:
Tata McGraw-Hill Education.
Solomon et al, (2013). Consumer Behavior: A European Perspective, 5/E.
Pearson Publishing.
Tjiptono, (2008), Strategi Bisnis Pemasaran. Andi. Yogyakarta.
! 82!
Vartanian, T. P. (2011). Secondary data analysis. New York: Oxford.
Widiana. (2010). Dasar-Dasar Pemasaran, Bandung: KPD.

! 83!
JOURNALS :
Ahmed, S., & Rahman, H. Md (2015). The Effects of Marketing Mix on Consumer
Satisfaction: A Literature Review From Islamic Perspectives. Turkish
Journal of Islamic Economics, Vol. 2, No. 1, February 2015, pp. 17-30.
Al-Debi & Mustafa (2014). The Impact Of Services Marketing Mix 7P's In
Competitive Advantage To Five Stars Hotel - Case Study Amman, Jordan.
The Clute Institute International Academic Conference. USA.
Al-Dmour, Al-Zu’bi & Kakeesh, (2013). The Effect of Services Marketing Mix
Elements on Customer-Based Brand Equity: An Empirical Study on Mobile
Telecom Service Recipients in Jordan. International Journal of Business and
Management. ISSN 1833-3850
Andreti, Zhafira, Kamal, & Kumar, (2013). The Analysis of Product, Price, Place,
Promotion and Service Quality on Customers’ Buying Decision of
Convenience Store: A Survey of Young Adult in Bekasi, West Java,
Indonesia. International Journal of Advances in Management and
Economics. ISSN: 2278-3369
Chi, H.K., Yeh, H.R., & Yang, Y.T. (2009). The Impact of Brand Awareness on
Consumer Purchase Intention: The Mediating Effect of Perceived Quality
and Brand Loyalty. The Journal of International Management Studies,
Volume 4, Number 1, February
! 84!
Doostar, M., Abadi, M. K., & Abadi, R. K. (2012). Impact of Brand Equity on
Purchase Decision of Final Consumer: Focusing on Products with Low
Mental Conflict . Journal of Basic and Applied Scientific Research
Dunne, A., Lawlor, M., Rowley, J. (2010). Young People's Use of Online Social
Networking Sites Uses and Gratifications Perspective. Journal of Research
in Interactive Marketing, Vol. 4, pp.46-58.
Elosua, P. (2011). Assessing measurement equivalence in ordered categorical
data. Psicológica, 32, 403-421.
Hauke, J. & Kossowski, T. (2011). Comparison of values of Pearson’s and
Spearman’s correlation coefficient on the same sets of data. Quaestioner
Geographicae 30(2). Poland.
Hoeffler, S. & Keller, K. L. (2002) Building Brand Equity Through Corporate
Societal Marketing. Journal of Public Policy & Marketing: Spring 2002,
Vol. 21, No. 1, pp. 78-89.
Huang, R., Sarigollu, E. (2012) How brand awareness relates to market outcome,
brand equity, and the marketing mix. Journal of Business Research, 65, 92-
99.
Jilbril & Odua (2013). New Product Development and Marketing Strategies
towards Customer Satisfaction (A Study of Dangote Nigeria Plc, NorthEast
Zonal Office, Maiduguri Borno State Nigeria). Journal of Business and
! 85!
Management. Volume 13, Issue 6
Kabadayi, S., Eyuboglu, N. and Thomas, G.P. (2007). The performance
implications of designing multiple channels to fit with strategy and
environment. Journal of Marketing, 71(4): 195-211.
Karbala, A., & Wandebori, H. (2012). Analyzing the Factors That Affecting
Consumer’s Purchase Intention in Toimoi Store, Indonesia. 2nd
International Conference on Business, Economics, Management and
Behavioral Sciences , 80-83.
Keller, K. L. (2009). Building strong brands in a modern marketing
communications environment. Journal of Marketing Communication, 15 (2-
3), 139-155.
Koziol, N. A., Arthur, A. M., Hawley, L. R., Bovaird, J. A., Bash, K. L.,
McCormick, C., & Welch, G. W. (2015). Identifying, analyzing, and
communicating rural: A quantitative perspective. Journal of Research in
Rural Education, 30(4), 1-14.
Malik, et al., (2013). Importance of Brand Awareness and Brand Loyalty in
assessing Purchase Intentions of Consumer. International Journal of
Business and Social Science. Vol. 4 No. 5
! 86!
Mohammad et al., (2012). 7Ps Marketing Mix and Retail Bank Customer
Satisfaction in Northeast Nigeria. British Journal of Marketing Studies
Vol.3, No.3, pp.71-88, June 2015
Muala, A., & Qurneh, A., (2012). Assessing the Relationship between Marketing
Mix and Loyalty through Tourists Satisfaction in Jordan Curative Tourism.
American Academic & Scholarly Research Journal, Vol.4, No.2 : ISSN
2162-321X E-ISSN 2162-3228
Nasrabadi & Zandi, (2015). Investigating the Impact of Marketing Mix on Brand
Equity (The Case Study: Consumers of Samsung’s Appliances in Tehran-
Iran). Visi Jurnal Akademik. 2015 (2): 20-26
Nigam & Khausik (2011). Impact of Brand Equity on Customer Purchase
Decisions: An Empirical Investigation with Special Reference to Hatchback
Car Owners in Central Haryana. JCEM International Journal of
Computational Engineering & Management. SSN (Online): 2230-7893
Odunlami (2013), Effects of Factor Analysis on the Questionnaire of Strategic
Marketing Mix on Organisational Objectives of Food and Beverage
Industry. European Journal of Business and Management. ISSN 2222-1905
(Paper) ISSN 2222-2839 (Online) Vol.5, No.18
Rochana, N. (2015). Impact of Brand Equity towards Purchasing Desition: A
Situation on Mobile Telecommunication Services of Sri Lanka. Journal of
Marketing Management. ISSN: 2333-6080
! 87!
Raeros & Nugrahani (2011). The Effect of Samsung Android-Based Mobile Phone
Marketing Mix toward its Brand Awareness (A case study at Telkom
Institute of Management in 2011). International Conference on Economics
Marketing and Management. IPEDR Vol.28.
Sardjono & Kristin (2013). Evaluation of Knowledge Management System of
Kompas Gramedia in using Factor Analysis. Comtech Vol.4. June 1, 2013L
151-161.
Satit RP, Tat HH, Rasli A, Chin TA, Sukati I (2012) The Relationship Between
Marketing Mix And Customer Decision-Making Over Travel Agents: An
Empirical Study. International Journal of Academic Research in Business
and Social Scienes.
Sawant. (2012), Impact of Advertising on Brand Awareness and Consumer
Preference (With Special Reference to Men`S Wear). IOSR Journal of
Business and Management (IOSR-JBM) ISSN: 2278-487X.Volume 5, Issue
6
Severi & Ling (2013). The Mediating Effects of Brand Association, Brand
Loyalty, Brand Image and Perceived Quality on Brand Equity. Canadian
Center of Science and Education. ISSN 1911-2017
Stombergson, S. (2009). Binary Logistic Regression and its application to data
from a study of children's recognition of their own recorded voices. Term
paper in Statistical Methods, Spring 2009.
! 88!
Tong, X. and Hawley, J.M. (2009). Measuring customer-based brand equity:
Empirical evidence from the sportswear market in China. Journal of
Product & Brand Management. 18(4), 262-271.
Wang, X., & Yang, Z. (2010). The Effect of Brand Credibility on Consumers'
Brand Purchase Intention in Emerging Economies: The Moderating Role of
Brand Awareness and Brand Image. Journal of Global Marketing.
Yakubu, A. (2010). Fixing Multicollinearity Instability In the Prediction of Body
Weight From Morphometric Traits of White Fulani Cows. Journal of
Central European Agriculture. Volume 11 (2010) No. 4 (487-492).
Yasanallah, P. & Vahid, B. (2012). Studying the Status of Marketing Mix (7Ps) in
Consumer Cooperatives at Ilam Province from Members’ Perspectives.
American Journal of Industrial and Business Management, 2,194-199.
Yoo, et al., (2000). An examination of selected marketing mix elements and brand
equity. Journal of the academy of marketing science, 28 (2000), pp. 195–
211
Yudiartika & Haryanto (2012). Pengaruh Personal Selling, Display, Promosi
Penjualan Terhadap Kesadaran Merek dan Intensi Membeli Pada Produk
Kecantikan Pond’s. Buletin Studio Ekonomi, Volume 17, No. 2
! 89!
SKRIPSI :
Andarini, (2013). Analyzing the impact of Marketing mix towards Customer’s
purchase Intention of Jam Product ( A Case Study: New 14gram portion
pack of Morin Jam & Spread). Jakarta
Ardhana (2010). Analisis Pengaruh Kualitas Pelayanan, Harga dan lOKASI
Terhadap Kepuasan Pelanggan (Studi Pada Bengkel Caesar Semarang).
Semarang
Fitriani (2015). Analisis Pengaruh Harga, Persepsi Kualitas, Kesadaran Merek
dan Asosiasi Merek Terhadap Keputusan Pembelian The Botol Sosro.
Semarang
Hikmawati (2012). Evaluasi Efektifitas Program Pelatihan Service Excellence di
Rumah Sakit Jantung dan Pembuluh Darah Harapan Kita Jakarta. Depok
Putra, B. (2015). The Influence of Marketing Mix toward Purchasing decision of
Victoria Make-Up Atelier. Bekasi
! 90!
WEBSITE :
David Garson, (2011). Logistic Regression. Logistic Regression:
http://faculty.chass.ncsu.edu/garson/PA765/logistics.htm#sigtests
Koniewski (2012). Brand awareness and customer loyalty. www.research-
pmr.com. February 2012.
Wuensch, K. L., (2014) Binary Logistic Regression with SPSS.
http://core.ecu.edu/psyc/wuenschk/MV/MultReg/Logistic-SPSS.pdf
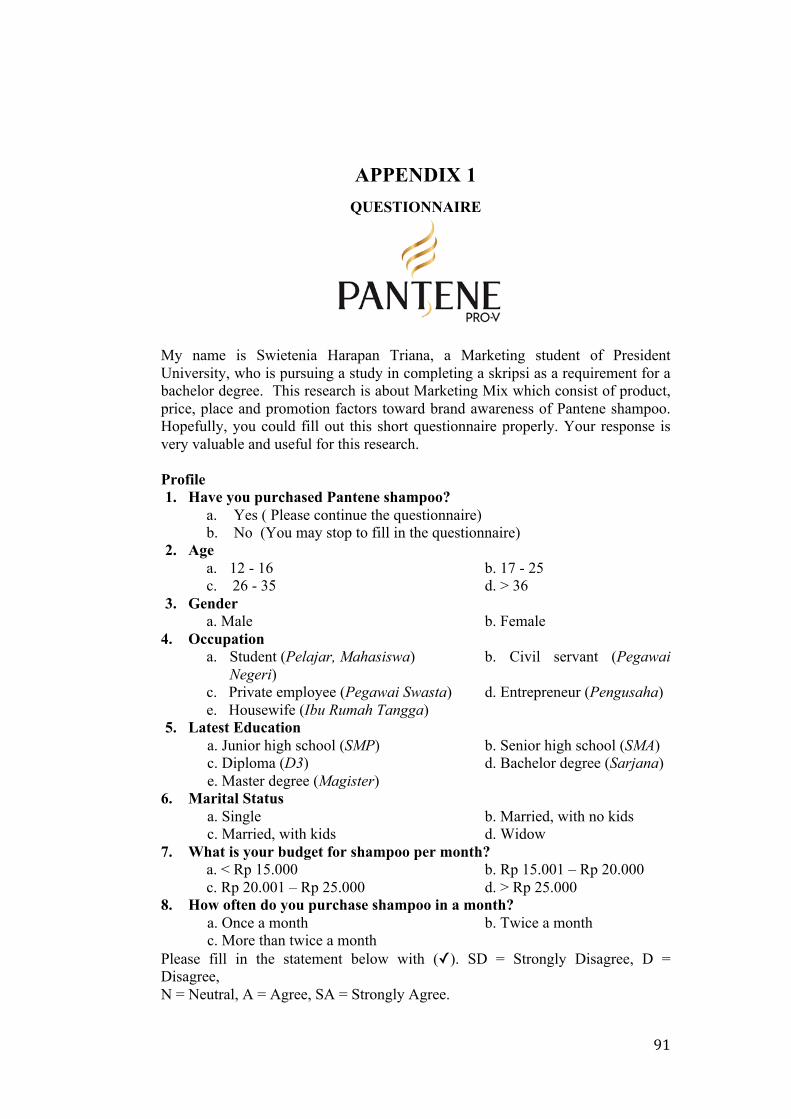
! 91!
APPENDIX 1 QUESTIONNAIRE
My name is Swietenia Harapan Triana, a Marketing student of President University, who is pursuing a study in completing a skripsi as a requirement for a bachelor degree. This research is about Marketing Mix which consist of product, price, place and promotion factors toward brand awareness of Pantene shampoo. Hopefully, you could fill out this short questionnaire properly. Your response is very valuable and useful for this research. Profile 1. Have you purchased Pantene shampoo?
a. Yes ( Please continue the questionnaire) b. No (You may stop to fill in the questionnaire)
2. Age a. 12 - 16 b. 17 - 25 c. 26 - 35 d. > 36
3. Gender a. Male b. Female
4. Occupation a. Student (Pelajar, Mahasiswa) b. Civil servant (Pegawai
Negeri) c. Private employee (Pegawai Swasta) d. Entrepreneur (Pengusaha) e. Housewife (Ibu Rumah Tangga)
5. Latest Education a. Junior high school (SMP) b. Senior high school (SMA) c. Diploma (D3) d. Bachelor degree (Sarjana) e. Master degree (Magister)
6. Marital Status a. Single b. Married, with no kids c. Married, with kids d. Widow 7. What is your budget for shampoo per month?
a. < Rp 15.000 b. Rp 15.001 – Rp 20.000 c. Rp 20.001 – Rp 25.000 d. > Rp 25.000
8. How often do you purchase shampoo in a month? a. Once a month b. Twice a month c. More than twice a month Please fill in the statement below with (✓). SD = Strongly Disagree, D = Disagree, N = Neutral, A = Agree, SA = Strongly Agree.

! 92!
Product No Question SD D N A SA
1 Variation offered by Pantene shampoo give me a lot of
choices ( Shampoo Pantene mempunyai banyak varian yang dapat
saya pilih )
2 The brand name of Pantene shampoo are familiar ( Saya familiar dengan merek shampoo Pantene )
3 Pantene has good quality of shampoo ( Shampoo Pantene memiliki kualitas yang baik )
4 The packaging of Pantene shampoo looks interesting ( Kemasan shampoo Pantene tampak menarik )
5 The packaging represents the value and quality of Pantene
shampoo ( Kemasan shampoo Pantene menggambarkan nilai dan
kualitasnya )
Price
No Question SD D N A SA
6 Pantene shampoo prices are reasonable ( Harga shampoo Pantene terjangkau )
7 The price of Pantene shampoo equal to the quality that I
receive ( Harga shampoo Pantene sebanding dengan kualitas yang
saya terima )
8 The price of Pantene shampoo equal to the benefit that I get ( Harga shampoo Pantene sebanding dengan manfaat yang
saya dapatkan )
9 The price of Pantene shampoo offers competitive prices in
comparison with other competitor shampoo. ( Shampoo Pantene menawarkan harga yang kompetitif jika
dibandingkan merek shampoo lain )
10 Pantene shampoo offers seasonal and flexible prices strategy. ( Shampoo Pantene menawarkan strategi harga yang
fleksibel dan musiman )
Place
No Question SD D N A SA
11 Pantene shampoo get to the target customers through the
distributional channels ( Shampoo Pantene menjangkau para target pelanggan
melalui saluran distribusi )
12 More stores sell Pantene shampoo, as compared to its

! 93!
competing brands. ( Lebih banyak toko yang menjual shampoo Pantene jika
dibandingkan dengan merek shampoo lain )
13 I can easily find Pantene shampoo. ( Shampoo Pantene gampang dibeli dimana saja )
14 Easy access by public transportation to the stores where sells
Pantene shampoo. ( Toko yang menjual shampoo Pantene mudah dijangkau
dengan transportasi umum )
15 Pantene shampoo is rarely been stocked-out, so I can always
buy them everytime I need. ( Saya selalu bisa membeli shampoo Pantene saat
dibutuhkan karena jarang kehabisan di toko-toko )
16 Pantene shampoo is distributed through as many stores as
possible. ( Shampoo Pantene di distribusikan melalui banyak toko)
Promotion
No Question SD D N A SA
17 There are various methods of promotions done by Pantene
shampoo (event, brochure, discount, etc). ( Shampoo Pantene melakukan banyak metode promosi
seperti menggelar acara, brosur dan menawarkan diskon )
18 Pantene shampoo has good or interesting advertisement to
attract me to buy. ( Saya ingin membeli shampoo Pantene karena melihat
iklannya yang menarik )
19 The advertisement of Pantene shampoo are frequently seen
through media, such as TV, radio, billboards ( Saya sering melihat iklan shampoo Pantene melalui media
televisi, radio dan billboard )
20 The advertising campaigns of Pantene shampoo seem very
creative, compared to campaigns for competing brands ( Kampanye iklan shampoo Pantene sangat kreatif
dibandingkan dengan kampanye oleh merek shampoo lain )
21
Discount and other promotional scheme attached with Pantene shampoo gives me a better value for the money spent
( Diskon dan promosi yang ditawarkan shampoo Pantene memberikan nilai yang lebih baik untuk uang yang saya habiskan )
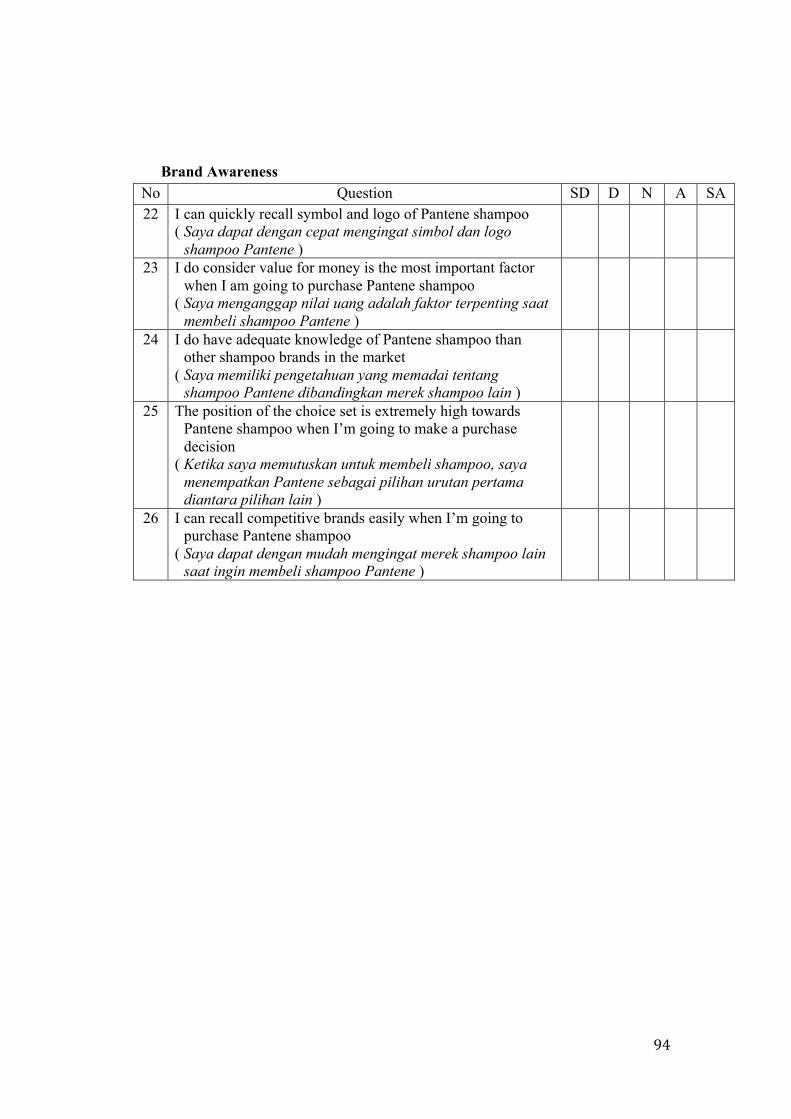
! 94!
Brand Awareness No Question SD D N A SA 22 I can quickly recall symbol and logo of Pantene shampoo
( Saya dapat dengan cepat mengingat simbol dan logo shampoo Pantene )
23 I do consider value for money is the most important factor when I am going to purchase Pantene shampoo
( Saya menganggap nilai uang adalah faktor terpenting saat membeli shampoo Pantene )
24 I do have adequate knowledge of Pantene shampoo than other shampoo brands in the market
( Saya memiliki pengetahuan yang memadai tentang shampoo Pantene dibandingkan merek shampoo lain )
25 The position of the choice set is extremely high towards Pantene shampoo when I’m going to make a purchase decision
( Ketika saya memutuskan untuk membeli shampoo, saya menempatkan Pantene sebagai pilihan urutan pertama diantara pilihan lain )
26 I can recall competitive brands easily when I’m going to purchase Pantene shampoo
( Saya dapat dengan mudah mengingat merek shampoo lain saat ingin membeli shampoo Pantene )
! 95!
APPENDIX 2
RAW DATA MATERIALS
! 96!
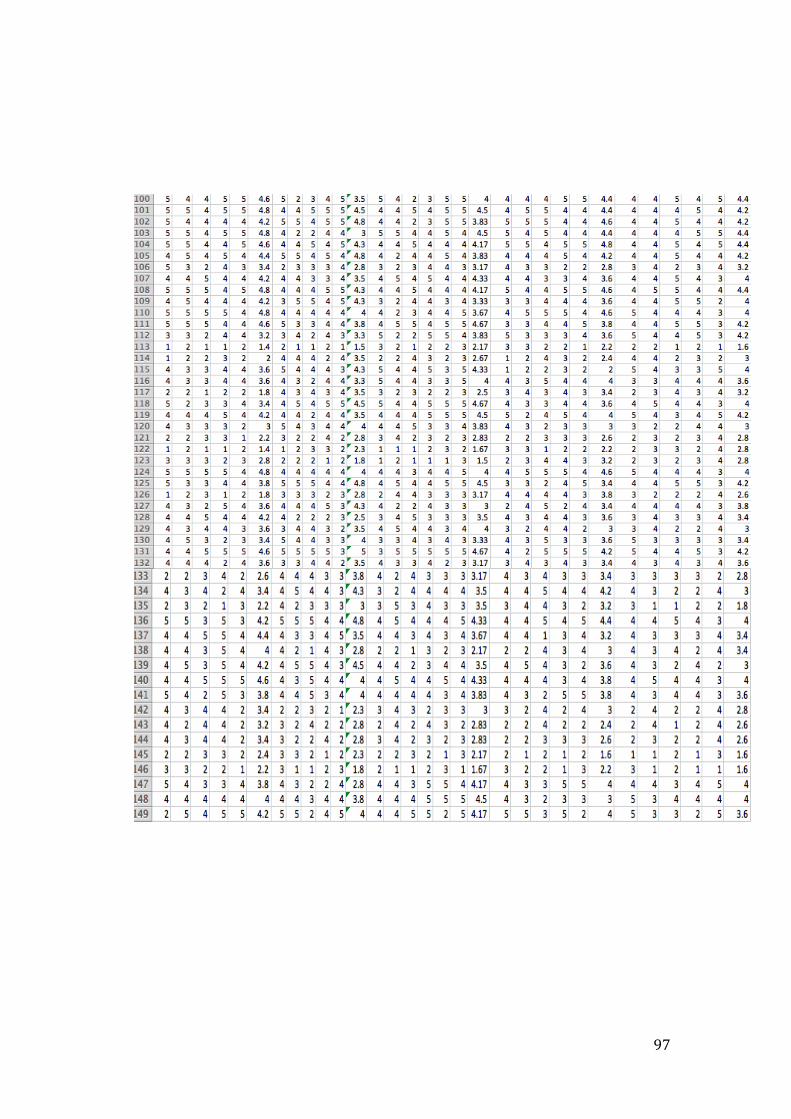
! 97!
! 98!
APPENDIX 3
RESPONDENT PROFILE
22!
126!
Male! Female!
11!
63!41!
31!
Age#
12!L!16!
17!L!25!
26!L!35!
>!36!
53!
10!41!
18!
28!
Occupation#
Student!
Civil!Servant!
Private!employee!
Entrepreneur!
Housewife!

! 99!
5!
44!
16!
72!
11!
Latest#Education#
Junior!High!School!
Senior!High!School!
Diploma!
Bachelor!degree!
Master!degree!
90!10!
48!
0!
Marital#Status#
Single!
Married,!with!no!kids!
Marrid,!with!kids!
Widow!
! 100!
APPENDIX 4
SPSS OUTPUT Pre-Test Questionnaire
Item-Total Statistics Scale Mean if
Item Deleted Scale
Variance if Item Deleted
Corrected Item-Total Correlation
Squared Multiple
Correlation
Cronbach's Alpha if Item
Deleted PRD1 14.83 7.247 .455 .356 .837 PRD2 14.80 5.959 .697 .549 .771 PRD3 14.87 6.464 .677 .579 .780 PRD4 14.93 6.064 .669 .612 .780 PRD5 14.97 6.171 .631 .453 .792
Item-Total Statistics Scale Mean if
Item Deleted Scale
Variance if Item Deleted
Corrected Item-Total Correlation
Squared Multiple
Correlation
Cronbach's Alpha if Item
Deleted PLA1 19.40 8.731 .649 .500 .848 PLA2 19.80 9.062 .546 .439 .867 PLA3 19.20 8.166 .871 .808 .810 PLA4 19.27 8.685 .712 .738 .838 PLA5 19.40 8.662 .571 .359 .865 PLA6 19.43 8.944 .689 .560 .842
Item-Total Statistics Scale Mean if
Item Deleted Scale
Variance if Item Deleted
Corrected Item-Total Correlation
Squared Multiple
Correlation
Cronbach's Alpha if Item
Deleted PRI1 14.13 4.395 .627 .495 .744 PRI2 14.03 5.068 .634 .494 .743 PRI3 14.10 4.783 .658 .511 .733 PRI4 14.20 5.407 .542 .424 .770 PRI5 14.33 5.195 .461 .251 .796
! 101!
Reliability
Reliability Statistics
Cronbach's Alpha
N of Items
.933 26
Item-Total Statistics Scale Mean if
Item Deleted Scale
Variance if Item Deleted
Corrected Item-Total Correlation
Squared Multiple
Correlation
Cronbach's Alpha if Item
Deleted PRM1 15.20 6.993 .500 .411 .742 PRM2 15.63 6.861 .591 .506 .711 PRM3 14.90 6.990 .595 .520 .711 PRM4 15.33 7.057 .450 .316 .761 PRM5 15.07 6.754 .582 .518 .713
Item-Total Statistics Scale Mean if
Item Deleted Scale
Variance if Item Deleted
Corrected Item-Total Correlation
Squared Multiple
Correlation
Cronbach's Alpha if Item
Deleted BAW1 13.47 5.775 .516 .314 .733 BAW2 13.33 6.230 .477 .392 .745 BAW3 13.70 5.941 .627 .491 .703 BAW4 13.57 5.082 .606 .513 .701 BAW5 13.67 5.678 .494 .377 .742
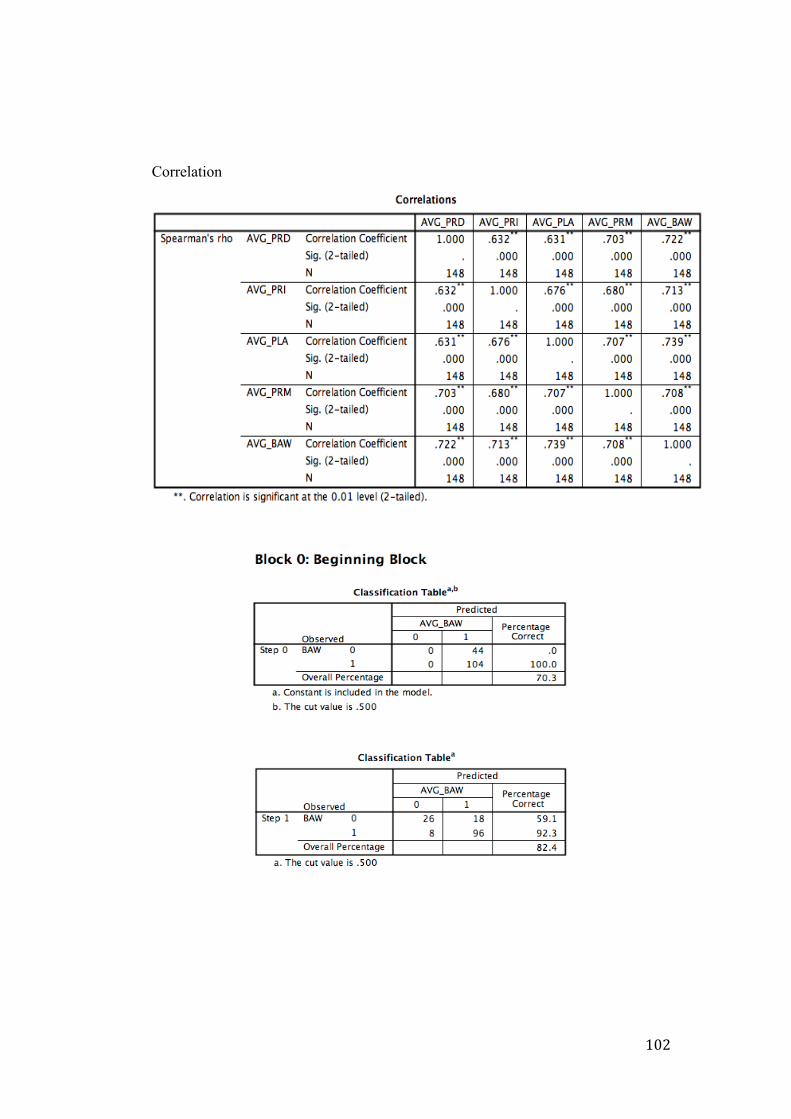
! 102!
Correlation
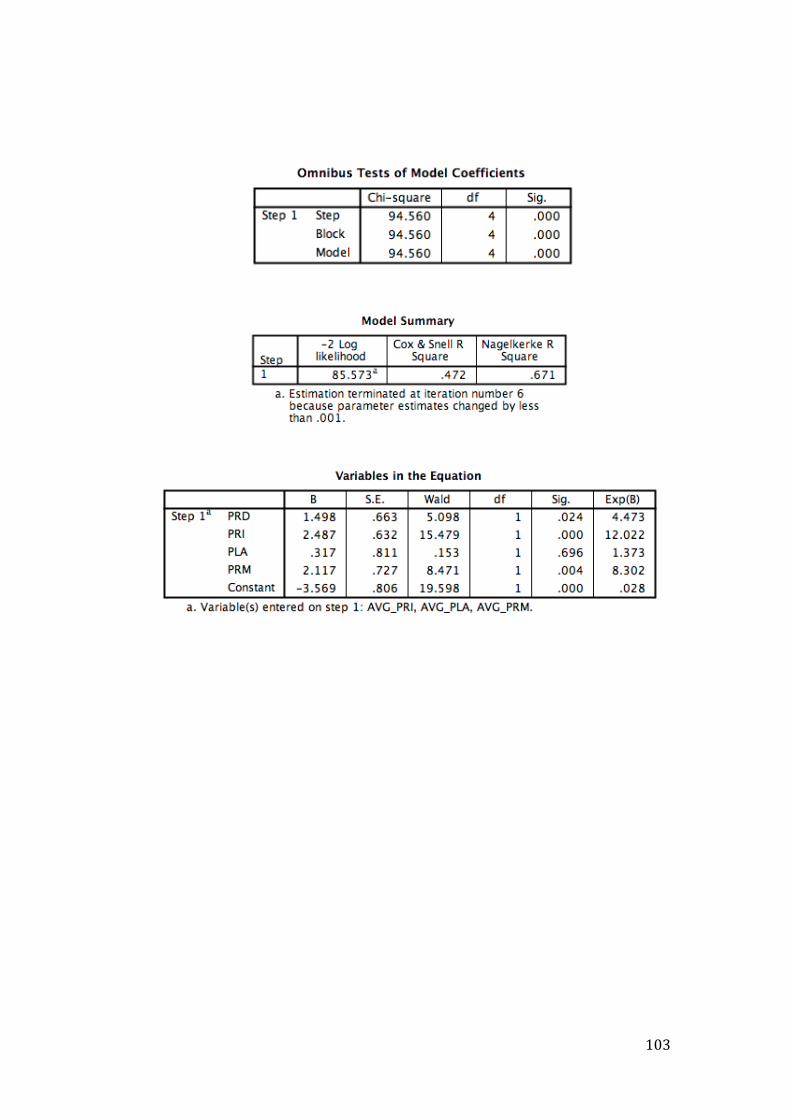
! 103!