
Boutique Clothing Sioux Falls - AMaVo Boutique (605) 274-8674

A STRATEGIC ANALYSIS OF
A BOUTIQUE INVESTMENT FIRM
By
Pawel Siarkiewicz
Bachelor of Science, York University 1999
PROJECT SUBMITTED IN PARTIAL FULFILLMENT OF
THE REQUIREMENTS FOR THE DEGREE OF
MASTER OF BUSINESS ADMINISTRATION
In the Executive Program
Of the
Faculty
Of
Business Administration
© Pawel Siarkiewicz 2013
SIMON FRASER UNIVERSITY
Term Spring 2013
All rights reserved. However, in accordance with the Copyright Act of Canada, this work may be
reproduced, without authorization, under the conditions for Fair Dealing. Therefore, limited
reproduction of this work for the purposes of private study, research, criticism, review and news
reporting is likely to be in accordance with the law, particularly if cited appropriately.

i
Approval
Name: Pawel Siarkiewicz
Degree: Master of Business Administration
Title of Project: A Strategic Analysis of a Boutique Investment Firm
Supervisory Committee:
________________________________________
Dr. Andrew von Nordenflycht
Senior Supervisor
Associate Professor
________________________________________
Dr. Aidan Vining
Second Reader
CNABS Professor of Business and Government Relations
Date Approved: ________________________________________

ii
Abstract
This paper is a strategic analysis of a boutique investment company operating in Vancouver,
British Columbia. The paper examines the company and the investment management industry
both in Canada and internationally. The analysis shows how profits have been eroded by
stagnated growth of the industry and increased regulatory requirements. In order to grow,
successful firms must look for new clients in the developing economies where the investment
industry is still growing, take existing clients away from other firms through direct competition
or change their business model. The developed market itself is shown to be undergoing a
significant change in its demographic makeup with a shift towards a higher percentage of
retirement aged population looking for different products than they did when they were middle
aged.
The paper concludes with a strategic option for the firm which sees it focus on retirement based
products built around increased returns and lower risk. This option will allow the firm to take
advantage of the demographic shifts and sets it up to be a strong competitor in the market.
Keywords: investment management industry Canada, strategy

iii
Dedication
I would like to dedicate this project to my wife Caroline whose unwavering support has made my
journey through the program possible. All those late evening editing sessions have finally paid
off.

iv
Acknowledgment
I would like to thank Professor Andrew von Nordenflycht whose comments and insights were
invaluable in allowing me to pull my thoughts together. I would also like to thank the SFU
business school faculty for sharing their experience and wisdom making the program a great
experience and a big thank you to the SFU staff that organized everything and allowed the
program to be so much more than pure academia.
I would like to thank my company and its owners for making it possible for me to enroll in the
program and for encouraging me along the way.
Finally, I would like to thank my amazing wife for putting up with the ups and downs of this
journey.

v
TABLE OF CONTENTS
Approval .......................................................................................................................................... i
Abstract ........................................................................................................................................... ii
Dedication ...................................................................................................................................... iii
Acknowledgment ........................................................................................................................... iv
TABLE OF CONTENTS ................................................................................................................ v
LIST OF FIGURES ..................................................................................................................... viii
LIST OF TABLES ......................................................................................................................... ix
1 Introduction ............................................................................................................................. 1
2 Organization’s Current Position ............................................................................................. 2
2.1 Company Overview.......................................................................................................... 2
2.1.1 History....................................................................................................................... 2
2.1.2 Organizational Structure of the Company ................................................................ 3
2.2 Overview of Dovos Customers ........................................................................................ 6
2.2.1 Private Investment Clients ........................................................................................ 6
2.2.2 Institutional Investor Customers ............................................................................... 6
2.3 Overview of Dovos Products ........................................................................................... 7
2.3.1 Products Manufactured at Dovos .............................................................................. 8
2.3.2 Products Outsourced to Dovos Partners ................................................................. 10
2.3.3 Product Categories by Investment Strategy ............................................................ 11
2.3.4 Product Distribution Channels ................................................................................ 12
2.4 Financial Overview of the Company ............................................................................. 16
2.4.1 Revenue Analysis.................................................................................................... 16
2.4.2 Costs Analysis ......................................................................................................... 17
2.5 Strategic Position of the Company ................................................................................. 20
2.5.1 Dovos’ Strategic Scope ........................................................................................... 20
2.5.2 Dovos’ Strategic Value Proposition........................................................................ 21
2.5.3 Dovos’ Strategic Investment ................................................................................... 23
2.6 Current Issues Facing the Company............................................................................... 26
2.7 Summary ........................................................................................................................ 27
3 Analysis of Factors External to the Company ...................................................................... 28
3.1 Industry Overview .......................................................................................................... 28
3.1.1 Industry Structure.................................................................................................... 29

vi
3.1.2 Industry Supply Chain ............................................................................................ 30
3.2 Analysis of Competitors ................................................................................................. 31
3.2.1 Competitor Composition ......................................................................................... 31
3.2.2 Competitor Strategic Grouping ............................................................................... 32
3.2.3 Competitor Grouping Details .................................................................................. 34
3.3 Analysis of Customers ................................................................................................... 37
3.3.1 Customer Characteristics ........................................................................................ 37
3.3.2 Customer Preferences Which Drive Purchasing Decisions .................................... 41
3.3.3 Customer Segment Size and Growth Trends .......................................................... 46
3.4 Analysis of Suppliers ..................................................................................................... 47
3.5 Analysis of Forces Driving the Industry ........................................................................ 49
3.6 Sources of Competitive Advantage ................................................................................ 58
3.6.1 Customer Utility and Willingness to Pay Advantages ............................................ 60
3.6.2 Cost Advantages ..................................................................................................... 66
3.7 Dominant Industry Trends ............................................................................................. 67
3.7.1 Trend of Declining Profitability.............................................................................. 68
3.7.2 Trend of Stagnant Developed Markets and Growing Emerging Markets .............. 69
3.8 Summary and Implications of the External Environment .............................................. 70
3.8.1 Strengths, Weaknesses, Opportunities, Threats ...................................................... 70
3.8.2 Summary ................................................................................................................. 72
4 Strategic Alternatives ............................................................................................................ 73
4.1 Strategic Option 1: Focus on Retirement Based Product ............................................... 73
4.1.1 Product .................................................................................................................... 73
4.1.2 Product Distribution and Acquisition of New Assets ............................................. 74
4.1.3 Operations and Efficiency....................................................................................... 74
4.1.4 Financial Summary ................................................................................................. 75
4.2 Strategic Option 2: Distribute to Emerging Markets ..................................................... 76
4.2.1 Product .................................................................................................................... 76
4.2.2 Product Distribution and Acquisition of New Assets ............................................. 77
4.2.3 Operations and Efficiency....................................................................................... 77
4.2.4 Financial Summary ................................................................................................. 78
4.3 Strategic Option 3: Become a Service Provider to Portfolio Managers ......................... 79
4.3.1 Product .................................................................................................................... 79
4.3.2 Product Distribution and Acquisition of New Assets ............................................. 80

vii
4.3.3 Operations and Efficiency....................................................................................... 81
4.3.4 Financial Summary ................................................................................................. 82
4.4 Options Evaluation and Recommendation ..................................................................... 83
4.4.1 Evaluation Criteria .................................................................................................. 83
4.4.2 Combined Option Evaluation and Summary .......................................................... 86
5 Feasibility Analysis of the Strategic Options........................................................................ 88
5.1 Strategic Option 1: Focus on Retirement Based Product ............................................... 88
5.1.1 Managerial Requirements and Gaps ....................................................................... 88
5.1.2 Organizational Requirements and Gaps.................................................................. 89
5.1.3 Resource Requirements and Gaps .......................................................................... 91
5.2 Strategic Option 2: Distribute to Emerging Markets ..................................................... 92
5.2.1 Managerial Requirements and Gaps ....................................................................... 92
5.2.2 Organizational Requirements and Gaps.................................................................. 93
5.2.3 Resource Requirements and Gaps .......................................................................... 95
5.3 Strategic Option 3: Become a Service Provider to PMs ................................................ 98
5.3.1 Managerial Requirements and Gaps ....................................................................... 98
5.3.2 Organizational Requirements and Gaps................................................................ 100
5.3.3 Resource Requirements and Gaps ........................................................................ 102
5.4 Feasibility Summary .................................................................................................... 104
6 Final Recommendation ....................................................................................................... 106
6.1 Options Choice ............................................................................................................. 106
6.2 Timeline ....................................................................................................................... 107
Bibliography ............................................................................................................................... 108
Appendix A ................................................................................................................................. 109
Option 1 – Retirement Product ............................................................................................... 109
Option 2 – Emerging Markets ................................................................................................. 110
Option 3 – Become a Service Provider to Portfolio Managers ............................................... 111

viii
LIST OF FIGURES
Figure 2-1 Organizational chart. Source: Author ........................................................................... 3
Figure 2-2 Assets under management by client segment in 2011 and 2012. Source: Author. ....... 7
Figure 2-3: Product types as percent of total AUM. Source: Author. ............................................ 8
Figure 2-4: Revenue share across distribution channels. Source: Author. ................................... 13
Figure 2-5: Revenue by client segment in 2011 and 2012. Source: Author. ................................ 17
Figure 2-6: Dovos costs breakdown in 2012. Source: Author. ..................................................... 18
Figure 2-7: Costs breakdown in 2012. Source: Author. ............................................................... 19
Figure 2-8: Dovos EBITDA margins for 2011 and 2012. Source: Author. .................................. 19
Figure 2-9: Dovos strategic position. Source: Author. ................................................................. 20
Figure 3-1: Canadian mix of AUM for institutional and private Clients. (Investor Economics,
Fall 2012) ...................................................................................................................................... 28
Figure 3-2: Industry supply chain. Source: Author. ..................................................................... 30
Figure 3-3: Number of investment managers by AUM in 2009 and 2012. (Investor Economics,
Fall 2012) ...................................................................................................................................... 31
Figure 3-4: Total AUM share by manager size. (Investor Economics, Fall 2012) ...................... 32
Figure 3-5: Total Canadian AUM share by manager category. (Investor Economics, Fall 2012)
....................................................................................................................................................... 33
Figure 3-6: Canadian population age demographic over time. (Statistics Canada, May 2010) .. 46
Figure 3-7: Global assets under management over time. (McKinsey & Company, June 2012) . 54
Figure 3-8: Total global financial assets over time. (McKinsey & Company, June 2012) ......... 54
Figure 3-9: Investment manager share of global financial assets. (McKinsey & Company, June
2012) ............................................................................................................................................. 55
Figure 3-10: North American investment management profit pools over time. (McKinsey &
Company, October 2012) .............................................................................................................. 68
Figure 3-11: Net flows as percent for geographic regions. (McKinsey & Company, June 2012)
....................................................................................................................................................... 69

ix
LIST OF TABLES
Table 2-1: Manufactured Dovos pooled funds breakdown by AUM in 2012. Source: Author...... 9
Table 2-2: Outsourced Dovos pooled funds. Source: Author ....................................................... 11
Table 3-1: Industry overview. Source: Author. ............................................................................ 29
Table 3-2: Forces driving the industry. Source: Adapted by Author. ........................................... 50
Table 3-3: Sources of competitive advantage. Source: Author. ................................................... 60
Table 3-4: SWOT analysis. Source: Author. ................................................................................ 71
Table 4-1: Option 1 financial summary. Source: Author. ............................................................ 76
Table 4-2: Option 2 financial summary. Source: Author. ............................................................ 79
Table 4-3: Option 3 financial summary. Source: Author. ............................................................ 83
Table 4-4: Strategic option preference analysis. Source: Author. ................................................ 87
Table 5-1: Strategic options feasibility summary. Source: Author............................................. 105
Table 6-1: Strategic option implementation timeline. Source: Author. ...................................... 107
1
1 Introduction
This paper is a strategic analysis of Dovos Capital Management1, a boutique investment
company operating in Vancouver, British Columbia. Dovos has been operating for over 20 years
and it is now experiencing increased pressures driven by market forces. The company must adapt
and grow or face an uncertain future. The investment industry in Canada is experiencing rapid
change, driven by economic, demographic, regulatory and technological changes. Business
models from past decades are no longer competitive and market forces have created new
opportunities which companies can take advantage of.
The paper strives to answer the question of how Dovos can reverse some recent setbacks and
grow its revenue while faced with the challenges of a stagnant market and increased competition.
The analysis is divided into six major sections. The first introduces and provides an overview of
the company. The second section discusses the company’s own position, current strategy and
strengths. The third section examines the external environment, how the company compares
against its competitors and what trends are shaping the competitive landscape. It also includes an
analysis of Porter’s Five Forces in the industry. The fourth section constructs and ranks strategic
options which address the company’s needs and fit with the internal and external realities. The
fifth section analyzes the options for their feasibility. The sixth section selects one of these
options as the final recommendation and provides an implementation roadmap.
1 Dovos Capital Management Inc. and several other company names are fictional. Some identifying details have also
been changed in order to hide the company’s true identities.

2
2 Organization’s Current Position
2.1 Company Overview
Dovos Capital Management Inc. is a small, privately owned investment company managing over
$1.2 billion in assets. The company’s own products consist of financial planning services and
equity investments in Canada, the United States and Developed Markets. The company
outsources, through sub-advisors, fixed income and Emerging Markets investments.
Additionally, Dovos offers pure research services to institutional clients who have their own
trade execution capabilities.
Dovos’ main office is located in downtown Vancouver, British Columbia with a virtual office
located in Calgary, Alberta for better servicing of its clients in central Canada.
2.1.1 History
Dovos Capital Management Inc. was founded in 1986 by three partners. The founding vision for
the company was to provide institutional level investment service to private individuals, who
typically only have access to consumer retail investment products.
During the 2008 financial crisis, Dovos was severely impacted by the collapse of asset backed
securities and the company weathered the storm by taking on significant liability. Over the past
five years, Dovos has reduced this liability to near zero, which has freed up resources that can
now be invested in the company or returned to shareholders.

3
2.1.2 Organizational Structure of the Company
There are 27 full-time and part-time employees working at Dovos, divided into 5 departments:
Investment, Sales and Client Service, Marketing, Administration and IT. Figure 2-1 lays out the
organizational and reporting structure of the company.
Figure 2-1 Organizational chart. Source: Author
Dovos has a 3 person Board of Directors with an Advisor to the Board. The CEO reports to the
Chairperson of the Board. The Chief Investment Officer (CIO), who is also the CEO, manages
the Investment Department. The President manages the Sales and Client Service Department and
the Marketing Department. The VP Operations and Technology manages the Administration
Department and the IT Department.

4
2.1.2.1 Investment Department
The investment department is tasked with conducting research and constructing portfolios as
well as with implementing the portfolios by executing trades through a 3rd
party professional
trade system. Additionally, the investment department is responsible for providing content for
some marketing brochures, market updates and client presentations.
2.1.2.2 Sales and Client Service
This is the largest department and it is responsible for retaining existing clients and for finding
new clients. The Sales side is composed of Portfolio Managers who, in addition to finding new
clients, are responsible for the overall portfolio strategy of each client. It is up to the Portfolio
Managers to work with the clients, understand their individual situations and to create complete
investment portfolios which fit with their goals.
The Client Service side is responsible for the execution of client requests such as deposits,
redemptions and transfers. They also provide assistance to the Portfolio Managers by preparing
reports, presentations and other client communications. The Client Service department is part of
what is referred to as the Back Office.
2.1.2.3 Marketing
The marketing department is very small and consists of one full-time writer and one part-time
graphic designer. It is their responsibility to create content which goes into brochures,
presentations, product pitches as well as to maintain the Dovos website, blog and other social
media presence.

5
2.1.2.4 Administration
The Administration department consists of 4 full-time and 1 part time employees. They are the
core of the Back Office and it is their responsibility to provide Fund Accounting services,
Compliance, Corporate Accounting and Trade processing and settlement. The Administrative
department is also the primary body whose output is audited annually by Ernst & Young, a 3rd
party auditor, to ensure that Dovos satisfies provincial and federal legislative requirements.
2.1.2.5 IT
The IT department consists of 3 full-time employees. The department is divided into two
functional areas: Network Administration and Application Development. The Network
Administrator is responsible for maintaining, upgrading and improving the company’s core
technical infrastructure. Dovos’ quantitative research methodology requires a significant
investment in technology, including professional grade databases, servers and connections to
market data vendors.
The Application Development team consists of 2 people who are responsible for implementing
and improving Dovos tools. These tools automate Back Office tasks and connect Dovos to 3rd
party service providers such as custodians and data vendors. Additionally, the application
developers are constantly enhancing the client portfolio management and accounting software so
that the Client Service team can be flexible in fulfilling client needs.
2.1.2.6 Independent IT Contractors
Dovos employs IT contractors as needed for specific projects which require skills and expertise
not possessed by the IT staff. The most significant of these relationships is the extended contract
for development of proprietary Investment Research and Modeling technology. It is through this
technology that Dovos competes with other investment managers which makes it critical.

6
2.2 Overview of Dovos Customers
Dovos customers can be divided into two major market segments (Silk, 2006) based on their
characteristics: Private Investors and Institutional Investors.
2.2.1 Private Investment Clients
These are families or individuals with over $500,000 in investable assets. They are primarily
concerned with retirement savings and providing for their own and their family’s future. Most of
them value service, predictable investment returns and trusted relationships.
2.2.2 Institutional Investor Customers
These are pension funds, foundations, insurance companies or large investment companies which
are outsourcing all or segments of their portfolios. The pension funds and foundations are
typically interested in the protection of their capital from market losses, transparency and
planning for their forecasted liabilities.
These customers can be further segmented based on whether they require the investment
products to only hold companies which are Socially Responsible or whether they can hold any
company. The customers who do require Socially Responsible Investments (SRI) also require
specialized commentary and guarantees that all of their holdings meet ethical criteria. The SRI
customers account for about 11% of the total revenue.
Insurance companies and large investment companies who outsource parts of their strategy to
Dovos are primarily interested in returns against their policy benchmark. These customers are

7
least interested in relationship building and are most likely to leave if the investment results fall
below set expectations.
The customer “assets under management” relative breakdown is shown in Figure 2-2.
Figure 2-2 Assets under management by client segment in 2011 and 2012. Source: Author.
The chart shows a reduction of $445,000,000 in AUM from the Insurance and Investment and
the Pension or Union clients. This loss represents 28% of the total AUM and was caused by 3
large clients leaving Dovos. This is discussed further in the section outlining the revenue model
and the current challenges.
2.3 Overview of Dovos Products
Dovos manufactures the majority of its product as measured by percent of total AUM, with a
portion of the product being outsourced to sub-advising partners. The Dovos manufactured
products are composed of Pooled Funds and individual custom portfolios referred to as
Segregated Assets. Figure 2-3 shows the proportional share of total AUM by Dovos product
types.
0
200,000,000
400,000,000
600,000,000
2011 2012
Assets Under Management
Wealth Management
Aboriginal
Foundation
Insruance and Investment
Pension or Union

8
Figure 2-3: Product types as percent of total AUM. Source: Author.
2.3.1 Products Manufactured at Dovos
Dovos is an equity specialist and therefore its entire manufactured investment product lineup is
composed of equities in Canada, United States and Developed Markets. The investment
mandates of the individual pools are designed to provide basic building blocks for Portfolio
Managers to meet individual client asset mix needs. In addition to Pooled Funds which hold
equities, Dovos also provides the Balanced Fund which is a mix of specific individual Pooled
Funds or a “Fund of Funds”. The Balanced Fund is designed to fit most common private
customer needs and provides a great foundation for most private portfolios. Table 2-1 shows
pooled funds manufactured at Dovos.
46%
30%
24%
Total AUM by Product Type
Genus Pooled Funds
Outsourced Pooled Funds
Segregated Assets

9
Pooled Fund
(Component) Name
Pooled Fund Mandate or Strategy Percent of Total
AUM
Core Products
Dovos Canadian Equity Pure Canadian equity fund. Uses core Alpha
strategy 2%
Dovos Canadian T-Bill Cash equivalents fund. Used to provide
immediate liquidity 2%
Dovos GlobeCan Equity Canadian, US and Developed Markets Equity
strategy 14%
Dovos Dividend Equity Canadian, US and Developed Markets
Dividend income focused strategy 20%
Dovos Global Equity US and Developed Markets Equity strategy 4%
Specialty Products
Dovos Balanced Fund Fund of Funds. Mix of Core Products
designed for typical private investor. 4%
Dovos Biosphere Plus
Canadian Equity
Socially Responsible Canadian Equity core
Alpha strategy.
Required by some Foundations.
2%
Dovos Biosphere Plus
Global Equity
Socially Responsible Developed Markets
core Alpha strategy.
Required by some Foundations
2%
Table 2-1: Manufactured Dovos pooled funds breakdown by AUM in 2012. Source: Author.
In addition to Pooled Funds, Dovos creates customized individual portfolios called Segregated
Portfolios for larger clients who require a unique strategy or who simply have sufficient assets to
afford direct stock ownership. These Segregated Portfolios typically follow one of Dovos’ Core
strategies with some small specialized changes around exposure to Risk, Market Volatility or
other factors.

10
Dovos also provides the majority of its customers with the asset mix designed to fit with their
individual needs. The asset mix is optimized for asset geographic exposure and asset class.
Additionally, Dovos makes the funds available for purchase on an individual basis in order to
accommodate some institutional customers, who wish to retain the asset mix responsibility.
In addition to directly investing customer’s money through funds or segregated portfolios, Dovos
also provides some institutional customers with Guided Portfolios or Separately Managed
Accounts (SMA). These clients receive only the stock choices, and it is up to the clients
themselves to trade the securities. This is most commonly used as an outsourcing mechanism by
large investment institutions such as Scotia Bank. These SMA portfolios allow the institution to
purchase specialized investment mandates and to diversify their own investment product lineup.
2.3.2 Products Outsourced to Dovos Partners
Dovos outsources the investment of Fixed Income and Emerging Markets products to sub-
advising partners in order to compensate for its specialization in equity and geographic products.
Table 2-2 shows the pooled funds outsourced to Dovos sub-advisors. The fees collected on these
products are split between Dovos and the sub-advising partner.

11
Pooled Fund
(Component) Name
Pooled Fund Mandate or Strategy
Percent of Total
AUM
Fixed Income Products Provided by Sunmont Capital
Dovos Biosphere Plus
Bond
Socially Responsible Fixed Income Strategy.
Required by some Foundations. 3%
Dovos Canadian Bond Canadian Fixed Income strategy. 3%
Dovos Short-Term
Corporate Bond
Global Corporate bond strategy designed for
higher yields at higher risk. 4%
Dovos Strategic Bond Global Fixed Income strategy designed for
minimal risk. 13%
Dovos Commercial
Mortgage
Canadian Commercial Mortgage Fixed
Income diversification strategy. 5%
Other Products Provided by Bernstein Capital
Dovos Emerging Markets Emerging Markets aggressive growth
strategy. 2%
Table 2-2: Outsourced Dovos pooled funds. Source: Author
2.3.3 Product Categories by Investment Strategy
The general strategy used to manage the money and the outcomes expected by the clients are an
important horizontal differentiation (Silk, 2006) of the products.
2.3.3.1 Absolute Growth Focused
These products are typically aimed at private investors. They are based around the Balanced
Fund and are focused on growing assets over the long term for eventual withdrawal at retirement.
The Balanced Fund is composed of the other funds and so its performance is heavily influenced
by the performance of the other strategies such as the Income Focused and Benchmark Focused
strategies.

12
2.3.3.2 Income Focused
These products are typically aimed at Foundations and Pension Funds. They are based around
the Dividend Fund and Fixed Income Funds and are focused on providing the investor with a
steady and reliable income from the assets without depleting them. They are also a good match
for retired individuals living off their savings.
2.3.3.3 Benchmark Focused
Benchmark focused products are also referred to as Core Alpha. These products are typically
aimed at Institutions and some Pension Funds. They are based around closely following and
outperforming market indexes. The performance is always reported relative to whatever
benchmark was selected. These benchmarks are typically mixes of Equity Indexes such as the
S&P TSX. In order to control the investment’s risk, the investing client typically places hard
constraints on how much the product can vary from the benchmark in its holdings. While this
does tie the risk to the market, it also limits the ability for the investment manager to
significantly beat the benchmark.
2.3.4 Product Distribution Channels
Dovos distributes its products through a number of channels. Figure 2-4 illustrates the revenue
share across distribution channels.

13
Figure 2-4: Revenue share across distribution channels. Source: Author.
2.3.4.1 Direct Sales by Portfolio Managers
This distribution channel has been used by Dovos exclusively for the first 15 years of the
company’s existence and it accounts for 93% of the revenue. It is a form of personal selling
(Silk, 2006) and it consists of the Portfolio Managers making direct connections with clients. The
advantage of this channel is that Dovos realizes maximum profit per AUM. The disadvantage of
this channel is that revenue growth is limited by the number of Portfolio Managers, their
personal contacts and the time they have to personally sell Dovos products. Additionally, each
Portfolio Manger’s personal selling time is diminished by each client they acquire and have to
service going forward.
2.3.4.2 Referral Partner Program
This distribution channel has been launched by Dovos over 2 years ago with little effort put into
growing the channel until late 2011. The Partner Program accounts for only 4% of current
revenue, however, it accounted for approximately 33% of new clients in 2012. This figure is
0.0%
25.0%
50.0%
75.0%
100.0%
Distribution Channel Share of Revenue
Direct PM Sales
Partner Program
SMA
Offering Memorandum

14
expected to grow to over 50% in 2013. The referral program is a form of indirect promotion
(Silk, 2006) and it works by signing formal referral agreements with individuals and companies
who have a trusted relationship with institutions and private investors. As compensation for the
referral, each partner receives a portion of fee revenue in perpetuity. The majority of this referral
fee comes from the Portfolio Manager’s revenue portion. This is an excellent opportunity for
accountants, lawyers and insurance brokers to make additional money from their existing client
relationships.
The advantage of this channel is that Dovos Portfolio Managers get exposed to many new
prospects without having to spend personal time sourcing them.
The trade-off for the Partner Program is a reduced profitability from referred clients, as a portion
of the revenue is passed on to the referring partner in perpetuity.
2.3.4.3 Separately Managed Assets (SMA)
This distribution channel has been launched by Dovos over 3 years ago; however, its biggest
growth was in 2012. It accounts for around 3% of total revenue. The SMA clients are typically
institutions which resell the investment product to their own retail clients. The SMA product is
different from traditional investment management in that Dovos is not actually making the trades
and managing the invested assets. Instead, Dovos sends monthly or quarterly updates of the
portfolios to its SMA clients, who then implement their own trading. The SMA model greatly
reduces Dovos’ costs and risks associated with the portfolios as there are no trades which have to
be executed.
The trade-offs of this distribution channel are that Dovos does not have any direct relationships
with the final purchasing clients and it does not fully control the final implemented performance

15
of the portfolio. Without the relationships, the demand for the SMA product is driven primarily
by performance which is partially out of Dovos’ control.
2.3.4.4 Funds Distributed Under Offering Memorandum.
This distribution channel has been launched at the very end of 2012 and does not yet have any
revenue. The Offering Memorandum (OM) funds distribution channel makes specific Dovos
pooled funds available to other investment managers or independent portfolio managers at
whole-sale prices, so that they can re-sell them to their own retail clients. It allows Portfolio
Managers across Canada to invest their client’s money in Dovos pooled funds and it gives Dovos
the widest exposure to the investable assets of potential new retail clients. At the same time,
unlike with the SMA distribution channel, Dovos maintains full control over the product’s
performance.
The trade-off of this distribution channel is similar to the one for the SMA. Dovos does not own
any of the retail client relationships and so the money invested with any Dovos OM fund will be
controlled by Portfolio Managers who are not motivated to keep the assets invested with Dovos.
The second major trade-off is that the Dovos OM pooled funds will be competing against
thousands of other mutual funds available to the independent Portfolio Managers, which means
that their value proposition must clearly set them apart.
The third trade-off is similar to the one for the Partner Program in that Dovos will have to charge
lower, wholesale management fees so that the independent Portfolio Managers can add their own
fee markup.

16
2.4 Financial Overview of the Company
2.4.1 Revenue Analysis
Dovos generates revenue by collecting quarterly fees as a percentage of the AUM. The fee
percentage per client decreases as the assets increase which is effectively a bulk purchase
discount. Additionally, different customer segments are charged at different rates based on their
typical account sizes and willingness to pay. Compared head to head, a single private individual
account requires slightly less support work than a single institutional account. While private
clients do require personal attention, institutional clients have stricter reporting requirements and
demanding multi-person boards. Private individuals have much smaller average accounts than
institutions. The average private account size is around $500,000 while the average institutional
account is around $10,000,000. Therefore the amount of support work required by the same
amount of private AUM is roughly 20 times greater than the amount of support work required by
institutional AUM.
In addition to investment performance, private individuals are motivated by the personal
relationship with the Portfolio Manager. This is a form of differentiation and it allows Dovos to
charge higher fees. Since institutional clients are primarily motivated by performance and not the
relationship, they are more likely to look for the best product at the lowest fee.
When combined, these two factors allow the private client fee schedule to be higher than the
institutional fee schedule and they make the Private Wealth Management accounts higher
revenue generators per AUM than Institutional accounts.

17
Figure 2-5: Revenue by client segment in 2011 and 2012. Source: Author.
Figure 2-5 shows the revenue breakdown by customer segment and the revenue decline caused
by the reduction of Institutional customer AUM. Due to the different rates between Private and
Institutional customers, the revenue decline of 12% is not as dramatic as the AUM decline of
28%. Revenue from the other segments has increased, but not quickly enough to offset the
losses. Typical annual budgets set the revenue growth target to 3% per year, which has not
happened in the past year.
2.4.2 Costs Analysis
Staff compensation is the dominant portion of costs with a total 64% in 2012. Staff compensation
is a combination of fixed salary, commission for Portfolio Managers, bonuses and benefits. Sub-
Advisor fees are a percentage of revenue generated by outsourced products and referred clients.
Fees and Licenses include all professional fees, legal fees, audit costs and software licenses.
Office Operations covers all costs associated with running the office including rent, insurance,
phones and internet. Client Service and Marketing includes all direct marketing costs, travel,
-
2,500,000
5,000,000
2011 2012
Revenue
Wealth Management
Aboriginal
Foundation
Insurance and Investment
Pension or Union

18
marketing materials print costs, client statement print costs and company website. It is important
to note that in the past year, Dovos spent only 4% of total costs on marketing and sourcing new
clients excluding staff compensation. Dovos’ costs and expenses break-down for the most recent
year is illustrated by Figure 2-6.
Figure 2-6: Dovos costs breakdown in 2012. Source: Author.
In order to deal with the decrease in total revenue in 2012, Dovos implemented cost cutting
measures. Figure 2-7 illustrates the changes in costs from 2011 to 2012.
64%
11% 10% 11% 4%
0%
25%
50%
75%
2012
Cost Breakdown in 2012
Staff Compensation
Sub-Advisor Fees
Fees and Licenses
Office Operations
Client Service and Marketing

19
Figure 2-7: Costs breakdown in 2012. Source: Author.
All costs have been decreased with the exception of Sub-Advisor Fees which increased in 2012.
The increase is due to a greater number of referral clients and thanks to a new Sub-Advising
agreement with Bernstein Capital for an Emerging Markets fund. These changes have protected
the margins from 2011 to 2012 as illustrated in Figure 2-8; however they have also reduced the
company’s ability to find new clients.
Figure 2-8: Dovos EBITDA margins for 2011 and 2012. Source: Author.
$-
$2,500,000
$5,000,000
Cost Change from 2011 to 2012
2011
2012
0%
5%
10%
15%
20%
25%
2011 2012
EBITDA Margins for 2011 and 2012

20
2.5 Strategic Position of the Company
2.5.1 Dovos’ Strategic Scope
Figure 2-9: Dovos strategic position. Source: Author.
The scope of where Dovos competes is illustrated in Figure 2-9. Dovos is vertically integrated
from product manufacturing to distribution. Outsourcing is used for services which require
complex regulatory facilities such as being the custodian of assets as well as some commodity
services such as daily fund valuation.
The company is highly specialized with investment management being the only service it
provides. It is diversified over its client demographics through servicing both private and
institutional clients. The company is highly localized with a single physical office in Vancouver
and a virtual satellite office in Calgary, both of which target Canadian clients.

21
2.5.2 Dovos’ Strategic Value Proposition
Dovos competes for its customers by trying to focus in on a small number of specific product
quality factors.
2.5.2.1 Investment Risk Reduction
Dovos investments are designed to avoid and mitigate market risk. This comes at the price of
dampened performance when the market is bullish; however, it has the benefit of significantly
reducing losses when the market is bearish. This strategy is based on research which shows that
over longer periods of time, strategies which have medium performance on the upside but
consistently avoid large draw downs, outperform strategies which alternate between great returns
and big losses. The marketing tag line is “make money in the long run by not losing money in the
short run.”
2.5.2.2 Advanced Portfolio Customization with Back-Testing
Dovos has the ability to highly customize portfolios according to client needs. This is very
difficult or impossible for independent or small investment managers. The customization can be
quite complex and involves placing thresholds on risk exposure, sectors, trades, yield and how
closely the benchmark index is followed. Furthermore, these customized strategies can be back-
tested to show how they would have performed over many years. This allows the client and
Dovos to collaborate on an optimal custom strategy which meets the client’s needs.
2.5.2.3 True Segregated Portfolios for Large Clients
Larger private clients and medium to large institutional clients have the option of investing their
money in segregated holdings instead of pooled funds. The advantage of a segregated portfolio is
that the client is the actual holder of the underlying assets, which is not the case with Pooled

22
Funds. Any client invested in a Pooled Fund holds units of the fund, and the fund holds the
underlying securities. If for some reason the Pooled Fund goes bankrupt or is incorrectly
accounted, the client may end up holding worthless units. This is never the case with segregated
holdings where the client is always the holder of the actual securities. For those clients, even if
Dovos disappears overnight, their holdings are completely secure with 3rd
party custodians such
as Royal Bank of Canada Investment Services.
2.5.2.4 Deep Relationship Building and Added Value Service for Private Clients
Dovos encourages its private clients to build deep relationships with the Portfolio Managers.
Given that trust is a very important aspect of the relationship, a Dovos client can get to know the
Portfolio Manager and the company well. This includes clients having the option to meet key
staff, visit the back-office and have the Portfolio Managers visit them at home. This commitment
to personal relationships makes the private clients feel more appreciated and attached to the
company. It also allows the Portfolio Managers to have a better understanding of the client’s true
needs.
The Client Service team provides some extra services which are not available at normal retail
investment managers. For example, Dovos produces a detailed tax report every quarter which
allows the client’s accountant to plan their annual tax strategy as the year progresses instead of
having to wait for the very end of the year.
The Client Service team at Dovos is committed to meeting the client needs even when they fall
outside of the standard operations. For example, if a customer needs to redeem funds on an
accelerated schedule, the Client Service team will accommodate if possible.

23
2.5.3 Dovos’ Strategic Investment
Dovos has made a number of choices and investments which are meant to support its value
proposition.
2.5.3.1 Controlling the Costs
Dovos has been consciously keeping its costs suppressed so that it has a cost advantage when
pricing its product. The cost strategy is implemented through the following processes.
Dovos is always trying to build its annual budget to achieve a margin target of 30%. This
naturally curbs any spending which is not truly necessary.
Dovos office space has a no-frills feel and finish. While it is professional and clean, Dovos has
avoided expensive furniture and decorations which are common at many other investment
managers. In addition to keeping the costs down, it signals to our clients that we are serious
about keeping our fees low and not wasting their money.
Additionally, Dovos is heavily investing in improvements of automation and efficiency. The
constant overarching goal is to do more work with fewer people. For example, in 2010, the
monthly portfolio complete rebalance process required an IT professional for 2 weeks every
month to load and prepare the market data and to run the models. By 2012 this has been reduced
to 2 days per month.
The IT department has a number of cost controlling policies including recycling of workstations
from the investment staff that need high-end machines, through the Back Office staff that can use
mid-tier machines all the way to the Portfolio Managers and receptionist who can use low-end
machines.

24
2.5.3.2 Extensive Quantitative Research Capability
Dovos has built an advanced quantitative research lab which is capable of conducting complex
portfolio and strategy simulations over decades of past market data. The lab consists of 3
researchers, 3rd
party industry software, 3rd
party global market data and Dovos custom
technology. The lab allows Dovos to research its own investment product and it allows Dovos to
design and test custom client strategies which can have a variety of complex restrictions and
requirements.
2.5.3.3 Extensive Research of Low-Volatility-High-Yield Strategies
Over the past couple of years, the Dovos investment team has spent considerable time
researching and modeling Low Volatility High Yield strategies. This approach has been gaining
momentum in the investment industry and Dovos has been at the forefront of the thinking since
the beginning. By focusing on these steady returns strategies which avoid sharp downturns,
Dovos can play into the long-term thinking of safety conscious clients.
2.5.3.4 Opening up New Distribution Channels
Over the past year, Dovos has made an effort to open new distribution channels and to invigorate
existing ones. By investing time into the Partner Program, the SMA portfolios and registering the
Offering Memorandum funds, Dovos is mitigating the risk of having all of its revenue growth
tied to the three Portfolio Managers on staff.
2.5.3.5 Reusing of Research
Through its use of investment technology, the Investment Team can easily repurpose its research
efforts. One of the core products is a ranking of stocks on several characteristics, referred to as
Alpha, which can be applied to different portfolios. For example, for portfolios which need lower

25
risk, the researcher will start with the complete Alpha stock list and then apply a specialized Low
Volatility Screen which removes volatile stocks. Through multiple screens and other more
advanced techniques, the initial complete stock ranking list can be quickly transformed into
many different, specialized portfolios.
2.5.3.6 Flexible Custody Arrangements
Dovos has cultivated relationships with multiple custodians such as Royal Bank of Canada
Investor Services, Scotia Bank and TD Waterhouse which gives it the flexibility to hold client
assets in pooled funds, lower-cost semi-segregated portfolios or premium cost, true segregated
portfolios.
2.5.3.7 Client Service Oriented Culture
The entire organization is geared towards serving the client’s needs and requests. Dovos has
cultivated a culture where staff will do their best to fulfill a client request if at all possible.
The entire investment team, including the CIO, as well as the Back Office operations team is
available to clients to interact with. This allows investment savvy private clients and professional
institutional investors to get a deeper understanding of the Dovos investment strategy and how it
fits their needs. While institutional clients are used to this service, private clients rarely get this
level of exposure unless they are truly wealthy.
Dovos retains experts to conduct client seminars on finance related topics. In the past, this
included topics around estate planning, insurance and major economic trends. These seminars are
complimentary and the summary notes are available to anyone who was not able to attend.

26
2.6 Current Issues Facing the Company
There are a number of issues Dovos is facing at this time.
2.6.1.1 Declining Revenue and Profits
Dovos has experienced a decline in profit over the past 3 years. Customers have left at a higher
rate than new customers were acquired. As a result, Dovos is managing fewer assets now than it
has in the past. This is most apparent with the departure of large Institutional clients who
represented a significant portion of the AUM.
Although the company is still profitable and will continue to be so in the near future, it is clear
that the current trend is not sustainable. If it is not reversed, the company will not be able to meet
its obligation to shareholders and it will have to be sold or face bankruptcy. The company
owners have set a target of 30% margins.
2.6.1.2 Benchmark Focused Core Alpha Canadian Product Underperforming
The Benchmark Focused Core Alpha product, which has been one of the main pillars of the
Dovos product lineup, has underperformed for the past 3 years. As a result, key Core Alpha
customers have left and they account for over 94% of the AUM lost from 2011 to 2012.
Additionally, the sales team has a very difficult time attracting new clients looking for Core
Alpha. These models are shared between the different product lines, which means that portions
of the Wealth Management product performance has also been weaker than many competitors.
The balanced mandate and the global mandates have both performed on par with average
investment managers. This makes these mandates neither specifically attractive nor unattractive;
however, it opens Dovos up to strong competition from top performers.

27
2.6.1.3 Demographic Risk from its Portfolio Managers Retiring
All of the current Portfolio Managers are nearing retirement age. Given that the Private
Investment business is relationship driven, Dovos faces a massive risk of clients departing when
the Portfolio Managers begin to retire.
2.6.1.4 Reinvestment into the Company
At this time, the shareholder directive is to pay out maximum possible dividend leaving little net
income for re-investment into the company. This cash-cow approach has worked in the past. The
question which has to be answered is whether this minimal re-investment policy is sustainable as
the environment changes.
2.7 Summary
As demonstrated in this section, the current Dovos business strategy has experienced setbacks
over the past two years and more importantly, it is open to further setbacks if no adjustments are
made. When mapped onto a Crisis Curve (Crossan, Rouse, Fry, & Killing, 2013), the urgency
can be described as Reactive, given that the company is currently profitable. If the company
strategy is not addressed, it will slide into Crisis.
The following section will examine the external environment in which Dovos operates and it will
analyze how external forces are impacting the business future at Dovos.
28
3 Analysis of Factors External to the Company
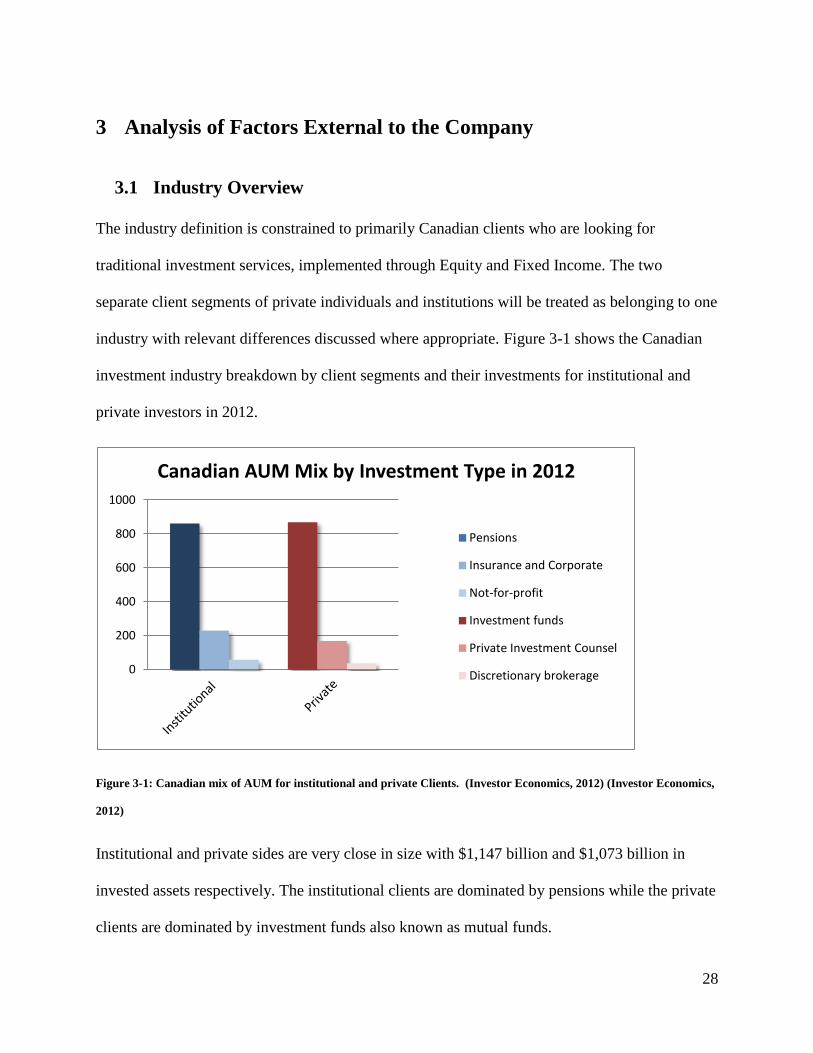
3.1 Industry Overview
The industry definition is constrained to primarily Canadian clients who are looking for
traditional investment services, implemented through Equity and Fixed Income. The two
separate client segments of private individuals and institutions will be treated as belonging to one
industry with relevant differences discussed where appropriate. Figure 3-1 shows the Canadian
investment industry breakdown by client segments and their investments for institutional and
private investors in 2012.
Figure 3-1: Canadian mix of AUM for institutional and private Clients. (Investor Economics, 2012) (Investor Economics,
2012)
Institutional and private sides are very close in size with $1,147 billion and $1,073 billion in
invested assets respectively. The institutional clients are dominated by pensions while the private
clients are dominated by investment funds also known as mutual funds.
0
200
400
600
800
1000
Canadian AUM Mix by Investment Type in 2012
Pensions
Insurance and Corporate
Not-for-profit
Investment funds
Private Investment Counsel
Discretionary brokerage

29
3.1.1 Industry Structure
Suppliers Competitors Customers
Stock and Bond issuing
organizations:
Ex. IBM, Gov of Canada
Dovos Capital Management Medium and High net worth
individuals
Stock exchanges:
Ex. TSX, NYSE
Banks and Credit Unions
Ex. RBC Wealth Management,
ING eSavings Account
Pension Funds and Foundations
Financial data vendors:
Ex. S&P, Thomson Reuters,
Bloomberg
Private Investment Counsel
Firms
Ex. Leith Wheeler
Large institutions looking for
Specialist Investment Managers
Financial Research vendors:
Ex. Axioma, Macquarie
Hedge Fund Investment Firms
Ex. Front Street Capital
Brokers:
Ex. Goldman Sachs
Self directed investing
Ex. iTrade, RBC Online
Software and Service Vendors:
Ex. ITG, Omgeo
Custodians:
Ex. Royal Bank Investment
Services, Scotia Trust
Banks:
Ex. Royal Bank, TD
Portfolio Manager:
Ex. RBC Wealth Management
Auditors and Lawyers:
Ex. Ernst & Young, Borden
Ladner Gervais
Table 3-1: Industry overview. Source: Author.

30
Table 3-1 summarizes the industry structure by listing the suppliers, competitors and customer
types. Each type is accompanied by some representative companies.
3.1.2 Industry Supply Chain
Figure 3-2: Industry supply chain. Source: Author.
Figure 3-2 illustrates the industry supply chain by showing how the different types of suppliers
interact. The value chain starts on the left side with the industry’s raw products and finishes on
the right side with the customer. There are five major groupings. Primary investment vehicle
manufacturers are in purple. Core trade service providers are in blue. Investment support services
are in gray. Investment managers are in green. Customers are in orange. Each one of these
categories is discussed in detail in the following sections.

31
3.2 Analysis of Competitors
The investment industry is highly competitive with a large number of competitors and product
alternatives.
3.2.1 Competitor Composition
Investment managers in Canada can be segmented according to the size of their AUM. This
division is illustrated by Figure 3-3.
Figure 3-3: Number of investment managers by AUM in 2009 and 2012. (Investor Economics, 2012) (Investor Economics,
2012)
In 2012 there were 179 managers registered in total with 86 of them managing under $1 billion.
Dovos fits in the second bucket with AUM between $1 billion and $5 billion and is one of 49
managers at that size. The relative market share of the managers by AUM size is illustrated by
Figure 3-4.
0
20
40
60
80
100
< 1 billion 1 - 5 billion 5 - 10 billion > 10 billion
Number of Managers by Manger Size
2009
2012

32
Figure 3-4: Total AUM share by manager size. (Investor Economics, 2012) (Investor Economics, 2012)
Overall the market share split has remained largely constant from 2009 to 2012, with the biggest
managers taking some market share away from the 1-5 billion AUM companies. The increase in
the total number of investment managers combined with the stagnant or decreasing market share
for the Dovos sized firms indicates both an increase in competitive pressure and a difficulty in
growing.
3.2.2 Competitor Strategic Grouping
The investment industry competitors can be grouped by category and compared against their
AUM. Figure 3-5 shows the categories over time.
0%
10%
20%
30%
40%
50%
60%
70%
80%
< 1 billion 1 - 5 billion 5 - 10 billion > 10 billion
Total AUM Share by Manager Size
2009
2012

33
Figure 3-5: Total Canadian AUM share by manager category. (Investor Economics, 2012) (Investor Economics, 2012)
The largest category is “Other money managers” which includes companies like Dovos. This
category has seen some growth in market share since 2009. The second largest category is
composed of the six big Canadian banks: The National Bank of Canada, The Royal Bank of
Canada, The Bank of Montreal, The Bank of Nova Scotia, The Canadian Imperial Bank of
Commerce and TD Canada Trust. The big six banks category has seen the biggest growth of its
market share since 2009.
0%
10%
20%
30%
40%
50%
2009 2011 2012
Total AUM Share by Manager Category
Bix six banks
Insurance Companies Major fund companies Other money managers

34
3.2.3 Competitor Grouping Details
3.2.3.1 Big Six Banks, Other Banks and Credit Unions
Product
Wide variety of manufactured investment funds some of which may be
outsourced.
Distribution of other retail investment products as needed to fill own
product gaps.
Individual stock purchases.
Basic savings accounts.
Services
Most other financial services such as financial planning, banking, loans,
insurance.
Little personalization except for the largest clients and private banking
clients
Larger banks offer self serve online investment portals
Access to Potential
Investment Clients
High through other banking services.
Target Customers Low to high net worth private investors and institutional investors.
Size Large to very large.

35
3.2.3.2 Insurance Companies
Product Typically own branded funds which are either manufactured or outsourced.
Limited selection.
Services Insurance and some Financial Planning.
Little personalization.
Access to Potential
Investment Clients
High by targeting existing insurance clients.
Target Customers Low net worth private investors
Size Medium to large
3.2.3.3 Major Fund Companies
Product
Wide variety of own branded funds which are either manufactured or
outsourced.
Typically no access to external investment product.
Product is distributed by dedicated brokers and independent brokers.
Services Financial Planning.
Little personalization.
Access to Potential
Investment Clients
Medium through dedicated and independent brokers.
Target Customers Low to medium net worth private investors
Size Medium to large

36
3.2.3.1 Independent Broker Investment Management Firms
Product Reselling of a wide variety of 3rd
party products manufactured by fund
companies and independent investment management firms.
Services Financial planning and frequently insurance, tax planning
Little personalization.
Access to Potential
Investment Clients
Low. Each new client has to be sourced or referred to the firm.
Target Customers Low to medium net worth private investors
Size Small to medium.
3.2.3.2 Independent Investment Management Firm
Product
Manufactured own investment product which is typically specialized to
some niche. For example, Canadian Equity or Real Estate Income Trusts.
Distribution of outsourced product to fill own product gaps.
Distribution of own product through 3rd
party independent brokers.
Services Financial planning. Occasionally tax planning or insurance.
High personalization often available.
Access to Potential
Investment Clients
Low. Each new client has to be sourced or referred to the firm.
Target Customers Medium to high net worth private investors
Size Small to medium.

37
3.2.3.3 Alternative Investments
This broad category covers any other investment vehicles which may be used as an alternative to
more traditional investments. It includes but is not limited to:
Purchasing real estate
Investing in private equity
Offering direct loans
Direct purchase of precious metals
While these are not competitor firms, all investment management firms compete with alternative
investments for the customer’s investable assets.
3.3 Analysis of Customers
All customers can be segmented along a set of common characteristics which can be used to
evaluate their revenue potential. Through a careful analysis of each customer along these factors,
the company can focus its resources on the customers which are most likely to generate
maximum lifetime profit.
3.3.1 Customer Characteristics
3.3.1.1 Universal Customer Characteristics
Investment Requirements: The type of investment which is required by the customer. This is a
critical determining factor in whether a given investment manager is able to satisfy a specific
customer’s requirement. If a manager does not offer the required product, there is no opportunity
for a direct sale. There may, however, still be an opportunity for a referral to another firm.

38
Amount of Investible Assets: The amount of money a customer is able and willing to invest
with the company. Given that the revenue for an investment firm is directly tied to the AUM, this
is a very important factor in determining the lifetime value of the customer. At any given time,
the account size is the primary distinguishing characteristic of all customers.
Support Needs: A broad category which captures the amount of effort that will be required to
service the customer’s requests, in addition to the actual work of investing the money. This effort
can take different forms. For private customers, for example, this can be the customer’s need to
frequently discuss the investment policy. For institutional customers, this can take the form of
the complexity of the reporting requirements or the number of meetings required annually. The
Support Needs determine the resource drain a customer poses for the company which in turn
determines the net revenue generated by the customer.
Asset Growth Potential: The predicted deposits to and withdrawals from the invested assets by
the customer. For private individuals, this often reflects the client’s earnings, potential for
increased earnings over their career and motivation to invest their savings. For institutions, this
reflects their contributions, donations or liabilities. The key aspect of this factor is its ability to
predict the customer’s asset size over time, which drives their lifetime value.
3.3.1.2 Private Individuals Customer Characteristics
This group covers private investors and families who are investing their own personal holdings.
Decision Makers: The family members themselves typically make the investment decisions;
however, many private investors rely on the advice of trusted professionals such as accountants
or lawyers.
39
Age Demographic: Private clients are often long term, or even life-time clients. The age
demographic is an important factor governing how long the invested assets will stay with the
company. Pre-retirement clients typically have their peak assets right before retirement, which
means that the assets will be large at the beginning and then diminish over time. Middle aged and
younger clients are still building their assets. The assets will typically be small at the beginning,
increase over time as the client moves towards retirement age and then start diminishing again
once they retire.
Inheritance Potential: This is a specialization of the Asset Growth Potential which covers
customers who are likely to inherit significant investible assets in the future.
3.3.1.3 Foundations and Pension Funds Customer Characteristics
This broad group covers organizations which are charged with managing money that does not
belong to the decision makers. This money is frequently assigned a specific purpose, such as the
financing of a charity or the financing of retirement of the organization’s members.
Decision Makers: The governing body of the organization, which is typically a board of
directors, is the ultimate decision maker. These boards can be composed of volunteers or paid
professionals and they frequently employ professional advisors to assist with the selection of the
investment manager. This means that the investment reporting needs of the customers are
typically complex.
Full Mandate or Specialist: This governs whether the investment manager is hired to manage a
complete, multi-investment type mandate or whether it is hired to provide a specialized service.
Full mandates are typically more valuable as the investment manager has more latitude with the
customer and is more able to weather poor performance of specific investment components. With

40
a full mandate, the manager can make adjustments to the complete portfolio to emphasize
components which are performing well and de-emphasize components which are performing
poorly. The customer is also more tied to the investment manager as they are providing the
complete service.
With Specialist mandates, the manager is hired as a sub-contractor by another investment
manager, internal or external to the client, to provide a very specific product. For example, the
manager could be hired to provide a Canadian Equity Large Capitalization mandate. This
specialized relationship is more volatile than a full mandate for two reasons. First, if that one
component underperforms, then the sub-advising firm has no way of mitigating the
underperformance. Second, the investing client has someone else in charge of the whole
portfolio so it is easier for it to fire just the underperforming sub-advisor. For this reason, these
specialist mandates are less valuable than full mandates.
3.3.1.4 Fund Companies, Insurance Companies, Banks Customer Characteristics
These companies are both competitors and customers in the investment management industry.
For the purposes of client classification, all of these institutional investors can be grouped
together. They all typically hire investment manager firms to sub-advise specific mandates and
then they re-distribute these mandates to their end clients whose money is being invested.
These companies tend to be looking for investment product for fairly large mandates of
anywhere from $50 million to $1 billion. They combine it with other products and redistribute it
under their own brand. The relationship with the end client is completely removed from the sub-
advising investment manager. Most of the time, the end client is not aware that their money has
been outsourced to a sub-advisor.

41
These types of institutional clients tend to be sophisticated in their reporting and implementation
needs and they tend to not be influenced by the relationship with the sub-advisor. If the product
is not performing as well as anticipated, these clients will fire the sub-advisor with minimal
notice.
Managed Assets or Separately Managed Assets (SMA): Managed Assets are the standard
investment product where the sub-advising manager directly manages money and executes
trades. SMA mandates, on the other hand, are portfolio recommendations to be executed by
another investment team or broker. The relevant difference between these two is that with
Managed Assets the manager is fully responsible for the portfolio performance while with the
SMA mandates, the manager is only responsible for the performance of the theoretical paper
portfolio.
The SMA mandates are popular with brokers who wish to be purchasing individual stocks for
their clients instead of pooled funds, but who still wish to outsource the stock selection.
3.3.2 Customer Preferences Which Drive Purchasing Decisions
3.3.2.1 Universal Customer Preferences
There are a number of customer preferences which are common to all traditional investment
customers
Investment Track Record: Investment performance is typically reported as annualized returns
over long and short term investment horizons. Long term investment performance can be defined
as covering more than seven years and shows a firm’s performance through the ups and downs of
the markets. Short term investment performance can be defined as covering one or two years and
demonstrates how well a firm is able to navigate the present economic situation. While

42
customers understand that past performance does not guarantee future performance, a good past
performance track record is an indication of investment management skill which often influences
future performance.
Trust: This customer preference is universal and it is difficult to quantify. Fundamentally, an
investment customer must trust their investment services provider. For private individuals, this
often comes from having the investment manager referred to them by a friend or professional
acquaintance. For the decision makers at institutional customers, the trust can come from a
referral, from the advice of a professional advisor or through a personal relationship with
someone at the investment manager.
Investment Product Suitability: All investment customers have goals for their investments and
a personal preference of how to achieve those goals. The most fundamental preferences or
characteristics are
Time Horizon: How long the money can stay invested before it has to be redeemed.
Risk Tolerance: How much in losses the customer is willing to accept in order to
attempt higher returns. This characteristic is often related to the Time Horizon.
Yield from Investment: How much income needs to be generated annually from the
investment. This is particularly important to clients with specific liabilities such as
pension funds, foundations or retirees.
Target Return and Benchmark: What return on investment is considered a success and
whether the returns are considered in absolute terms or relative to some benchmark. This
characteristic is frequently tied to Risk Tolerance.

43
There are also specialist product preferences which are driven by a customer’s individual
preferences, the composition of the entirety of their portfolio or direction from an institution’s
board.
Type of Underlying Investable Asset: Whether an investment is classic securities such
as stocks or bonds, derivative securities such as futures or tangible assets such as real-
estate.
Geography of Underlying Investable Asset: The countries or regions which are the
primary residences for the risk and returns associated with the asset.
Tax Implications: Does the investment have to have specific characteristics based on tax
requirements.
Liquidity of Investment: The time required to redeem the investment if the need arises
and retrieve the invested cash. Some customers are willing to risk being unable to
liquidate their assets for months or years, while others wish to have the ability to redeem
in days.
Customers often have a predetermined preference for a very specific product. In many cases it is
possible to break down the preference into its underlying components and to satisfy the customer
needs with slightly different products which still meet the core requirements.
Private individuals are typically most flexible on the specific product, as long as their core
requirements are met, while institutions outsourcing the investment of a part of their portfolio are
least flexible. When an institution is looking for a sub-contractor investment manager, they are
typically looking to fill a very specific gap in their own lineup.

44
Degree of Product Specialization: Once the fundamental characteristics of a product are met,
many individual investors and all institutional investors require a degree of customization of
their portfolio to meet their specific needs. For foundations and pension funds this is especially
important given their commitments and liabilities and often takes the form of a requirement for a
specific annual yield, or the requirement for the portfolio to track the market to a specified,
quantitative value.
Ease of Use and Personalized Service Quality: All customers care about service to some
degree, however, private investors care much more about service flexibility than institutions.
People often have unique and unpredictable needs such as requiring a withdrawal on short notice
in a specific currency, or requiring handholding through a difficult time such as dealing with an
inheritance. Institutions, on the other hand, tend to have more predictable needs which do not
require this level of personalized service.
The service preference also includes the fundamental requirement of accuracy and service
correctness. Mistakes made by the investment service provider can be costly and very
inconvenient. For example, if a request for a withdrawal is not processed correctly and the
money does not arrive on the requested date, a customer can face significant problems.
The other side of service is the ease of access to the service. This includes hours of operation and
availability of people to speak with in person and remotely. Hours of operation are valued by
private individuals much more than by institutions, given that institutions are typically
represented by employees who wish to operate during regular business hours.

45
The availability of people to speak with in person is valued equally by all customers. All
customers, including institutions, require update meetings and they value opportunities to
interact with the investment decision makers.
3.3.2.2 Private Investor Customer Preferences
Availability of Other Financial Services: This is an extension of the ease of use preference.
Private individuals require a multitude of financial services including tax planning, loans and
insurance. Being able to get multiple services from one provider makes the customer’s life
easier.
Added Value Service Intangibles: This is a very broad category and it captures any additional
service that an investment manager can chose to provide. These will typically not dominate a
purchase decision, however, they can add to a customer’s choice to stay or leave. This category
includes the extra items such as tea and coffee served at investment review meetings, clarity of
reports or politeness of the front desk staff.
3.3.2.3 Institutional Investor Customer Preferences
Reporting Flexibility and Robustness: While all customers care about their financial
statements and reports, institutions have very strict requirements which are much less flexible
than individual investors. Institutional investment financial statements are reviewed by many
different people, ranging from board members to accountants and auditors, with different needs
and financial literacy levels. An institution may not hire an investment manager if it cannot
deliver the right set of reports at the right times.

46
3.3.3 Customer Segment Size and Growth Trends
Figure 3-6: Canadian population age demographic over time. (Statistics Canada, 2010) (Statistics Canada, 2010)
The most significant trend for investment customers is the aging of population which impacts
both private investors and institutional investors. Figure 3-6 shows the predicted age
demographic breakdown of the Canadian population up to the year 2031. Private investors are
impacted directly as they get older and their investment needs change. Institutional investors are
impacted indirectly through the aging of their customers whose money is being invested. Pension
funds are facing an increased pressure of withdrawals while the numbers of contributing
members are declining.
The effect of this trend on both segments is very similar. There is a constantly increasing demand
for investment product which is built for safe, less volatile and consistent returns at the cost of
lower returns.
0
5,000
10,000
15,000
20,000
2011 2012 2013 2014 2015 2016 2021 2026 2031
Tho
usa
nd
s
Canadian Population Age Demographic over Time
0 to 40
40 to 65
65 and over

47
3.4 Analysis of Suppliers
Investment management industry suppliers can be divided into the groups discussed below.
3.4.1.1 Primary Investment Vehicle Manufacturers
Stock, bond and commercial mortgage issuing organizations, primarily corporations, banks and
governments, make up this category. Stocks, bonds and commercial mortgages are not available
for purchase by the investing client directly from the issuer.
3.4.1.2 Core Trade Service Providers
This category is comprised of suppliers which are necessary for the purchase and sale of
securities. All purchasers of securities must use this supply chain to trade securities and to
distribute dividends and other yield.
In very simplified terms, companies issue securities to be listed on security exchanges. A
security purchaser places an order with a broker who then executes the order on the security
exchange by matching the buyers and sellers. The security itself is placed in a custodian account
for holding and the funds necessary to execute the order are transferred to and from a bank
account.
The actual process of executing the transaction is complex and can involve trading after hours on
secondary exchanges and securities lending for short-selling stocks. The key service that a broker
provides is matching the buyers with the sellers. A single buyer and a single seller will almost
never wish to transact on the exact same amount of securities. A key service that the brokers
provide is matching a seller with a number of buyers or a buyer with a number of sellers to fill
the order.

48
The custodian acts as a record keeper and vault for the client since the client no longer gets a
physical stock or bond to hold at home and all standard trading is electronic. A custodian
provides the key service of holding securities in their client’s name. This allows trades to happen
very quickly as there is no physical object which needs to be transferred from one owner to the
next.
Banks act as a final link in the service provider chain by holding the client’s money in their
account and providing general banking services to the buyers and sellers.
3.4.1.3 Investment Support Services
The suppliers in this category provide important but ultimately optional services to both the
investment manager and to the client directly. None of these services are strictly necessary for
the execution of trading and investing, however, they are essential for operating efficiently and
making sound investment decisions.
Companies like Bloomberg, Standard and Poors and Thomson Reuters gather and report
financial and trade data on companies and securities. This data is packaged and delivered to the
researchers and investment managers. These companies also provide security identifiers which
are critical in addressing the securities. Standard and Poors, for example, administers CUSIPs
which are the standard identifier for North American stocks. It is nearly impossible to trade
securities at a professional level without some globally recognized 3rd
party identifier.
In addition to investment managers, financial analysts such as Macquarie consume financial data
and attempt to forecast the future. These forecasts are sold to both, investment managers and
individual investors.

49
Software vendors provide the tools which are necessary for modern trading. In addition to
fundamental software needed for all modern businesses, such as operating systems and word
processors, there is a number of highly specialized software systems used for investment
management. These systems cover all of the key functions: data analysis, portfolio construction,
trade submission, accounting, client relationship management and client reporting.
Finally, auditors and lawyers provide the legal and administrative framework which allows
investment managers to operate in the highly regulated investment industry.
3.5 Analysis of Forces Driving the Industry
Force Who Assessment Summary
Suppliers
Issuers
Stock Exchanges
Brokers
Custodians
Banks
Data Vendors
Research Vendors
Software Vendors
Auditors, Lawyers
HIGH
+ Impossible to trade stocks without the
stock exchanges, brokers, custodians and
banks
+ There are no real alternatives to the big
exchanges like NYSE or TSX
+ Specialized software and data has large
switching costs
- Broker services are commodity and so
tend to compete on price
Buyers
High net worth
individuals
Institutions
MEDIUM
+ easy to compare results
+ low switching costs
- long term relationships difficult to break
(trust) especially for individuals
- significant information asymmetry as it
is easy to hide true costs and make it
difficult for customer to compare price
- private clients tend to not truly
understand the product and so can be
easily confused

50
Rivalry
Independent investment
counsel firms
Bank affiliated
investment counsel
firms
MEDIUM + Most potential customers already have
an investment solution, so they have to be
taken from other investment firms.
+ Price competition from Bank based
firms with massive scale
+ A lot of choice of investment managers
+ Overall market growth is stagnant with
little new assets to manage.
- Some ability to differentiate products by
investment methodology and underlying
investment vehicle as well as by
performance track-record.
- Low barrier to exit
Threat of New Entrants
New firms MEDIUM
- Building trust with new clients a barrier
to entry
+ Relatively easy to set up a new
company
+ Some existing relationships can be
converted (ex. Insurance companies)
- Track record takes time to establish
Substitutes
Self directed investing
Government
investments (GICs)
Alternative investments
such as precious metals
or real estate
MEDIUM
+ Easy for people to self invest online
+ Many investment alternatives to stocks
and bonds.
- Many people are not comfortable
making their own investment decisions
- Investing well is time consuming
Table 3-2: Forces driving the industry. Source: Adapted by Author.
Table 3-2 shows the summary of the forces driving the industry using the “5 Forces” framework
(Porter, 2008) (Porter, 2008). Each force is discussed in detail below.
3.5.1.1 Power of Suppliers
Stock exchanges have significant power. There are few alternatives to the big exchanges such as
NYSE and NASDAQ in the US and TSX in Canada. Due to strong network effects, companies
will wish to be listed on the biggest exchange that they can qualify for, which in turn leads to

51
consolidation and the formation of few, dominant monopolistic exchanges. Investors, who wish
to buy a specific stock, have no choice as to which exchange they interact with. NYSE dominates
the exchanges with a 2011 trade value of more than 20,000 billion USD, the second largest
exchange, NASDAQ had a trade value of more than 13,500 billion USD and the third, the Tokyo
Stock Exchange had a trade value of just less than 4,000 billion USD. (World-Stock-
Exchanges.net, 2012)
Brokers do not have significant power when dealing with investment managers because the
managers have contracts with multiple brokers and can easily compare their rates. Additionally,
the broker’s primary service is hard to differentiate. Speed and quality of execution does come
into play, however, these are typically very similar amongst brokers. Furthermore, since the
advent of discount brokers who offer stripped down service at the lowest price possible, the
brokerage business has moved to competing on price.
Custodians and Banks are a commodity business, but there can be a significant switching cost for
an investment firm due to deep process integration. While custodians and banks try to compete
on service and differentiation, in reality it is very difficult for them to compete on anything other
than price. As long as they deliver basic, accurate service, the investment firms only care about
the price.
Financial Data providers have power and primarily compete on differentiated quality. High
quality, timely data can be a significant advantage to investment managers which makes them
reluctant to settle for lower quality, cheaper data. Additionally, the majority of cost for financial
data distribution is fixed as it is tied to the gathering and storing of the data. This makes the MES
quite high resulting in a small number of large, dominant financial data providers: Standard &
Poors, Thomson Reuters and Bloomberg.

52
The software service providers have moderate power depending on their particular product. The
biggest power of the software manufacturer comes from switching costs, which cover both the
costs of reconfiguring systems to interface with the new software and the costs of training staff.
The supplier of a fully integrated, complex and critical system such as the trading system has
significant power over the investment manager due to the high switching costs. A full system
switch can take one to two years to fully roll out. This effect is tapered by the relatively small
pool of possible clients. Given that this software is only usable in this industry, each specific
client lost is difficult to replace.
3.5.1.2 Power of Buyers
Buyers are a medium force in this industry. On one hand, the buyers are completely fragmented
as each individual investor makes their own choice; on the other hand, the buyers have great
access to information. With the advent of the internet, it has become very simple for buyers to
quickly compare the different investment options for the actual returns versus the industry
standards. Comparing prices remains difficult due to many hidden costs of investing. For
example, some investment managers charge a fully inclusive price, while others make the client
pay for custody and trade costs.
On average, buyers are more educated about the investment industry now than they were
previously thanks to a proliferation of investment advice websites and TV shows. At the same
time, the investment industry is quite complex and many private investors are still quite
unfamiliar with its various complexities. The net effect is that while the average private investor
is more sophisticated than they were previously, they can still be taken advantage of by
unscrupulous investment managers.

53
Individual investor buyers have little bargaining power with the investment manager until their
investable assets reach multiple millions. Institutional investors tend to command large assets
consisting of tens of millions and so have significant bargaining power.
Finally, the switching costs for buyers are low. The actual act of switching from one investment
manager to another is essentially free for the investor. All of the switching costs are incurred
before the switch and take the form of search and selection costs. The investor is constrained by
two main forces: the fear of making a costly mistake and a personal relationship with the
investment manager. Both of these are a form of switching costs and they can be significant.
Even though investment clients can switch their managers frequently and they can hunt for best
pricing, the majority of clients prefer to stick with their managers for many years.
3.5.1.3 Rivalry
The force of rivalry is medium; however, it is trending higher. There are many competitors
ranging from very small investment managers operating with one or two staff and servicing
fewer than a hundred clients all the way to very large bank based investment managers servicing
many thousands of clients.
Globally, the amount of assets available for Investment managers to manage is growing at a very
small rate when compared to the market value change. Figure 3-7 shows that over the period
from 2008 to 2011, the average net asset flow was only 0.6%.

54
Figure 3-7: Global assets under management over time. (McKinsey & Company, 2012) (McKinsey & Company, 2012)
This effect can also be seen when assets available to investment managers are compared against
global financial assets as show in Figure 3-8.
Figure 3-8: Total global financial assets over time. (McKinsey & Company, 2012) (McKinsey & Company, 2012)
-20.0%
-15.0%
-10.0%
-5.0%
0.0%
5.0%
10.0%
15.0%
2008 2009 2010 2011
% Market Change
% Net Flows
Global Assets Under Management (EUR trillions, at year end)
0
20
40
60
80
100
120
140
2007 2008 2009 2010 2011
Total Global Financial Assets (EUR trillions, year-end)
Internally or Unmanaged
Managed by Asset Managers

55
Figure 3-9: Investment manager share of global financial assets. (McKinsey & Company, 2012) (McKinsey & Company,
2012)
Figure 3-9 shows the share of global financial assets which are available to investment managers.
While global financial assets have grown, the amount of assets available for investment
managers has not kept pace. In fact, the percentage share of these assets has decreased
considerably from 2007. This means that the only way for investment managers to grow their
asset pool is by taking those assets away from other managers. Furthermore, most potential
private clients with investible assets and virtually all institutional clients, already have an
investment manager who provides them with service. In order to acquire a new client, an
investment manager must steal the client from another firm. By far and large, this industry is a
zero sum game.
Economies of scale in the industry allow banks and other large organizations to compete on price
as well as on other factors. Banks are able to push the prices down forcing the smaller managers
to either match or to work hard on differentiating themselves along the customer preferences.
This effect is mitigated by the information asymmetry discussed in the preceding section as it is
difficult for customers to objectively compare prices.
18.0%
19.0%
20.0%
21.0%
22.0%
23.0%
24.0%
25.0%
2007 2008 2009 2010 2011
Asset Manager Share of Global Financial Assets
Asset Manager Share

56
Investment managers attempt to carve out their own identities in a crowded market, however,
they typically end up sounding very similar to each other. As a result, product differentiation
does not significantly reduce rivalry. Instead, relationship driven sales reduce rivalry, making it
difficult for competing firms to steal each other’s clients.
One final consideration is that the barriers to exit are low because there is great stored value in
the private client pool. The client base can be sold to a competitor on exit. Time and money spent
on advertising, building a track record and acquiring clients can then be recovered through a sale
of the client book as if it was a tangible asset which significantly reduces sunk costs. This means
that underperforming companies can easily exit the industry instead of being forced to compete
at all costs. It is important to note, however, that the sunk costs can become recoverable only
after a company has successfully built a client book which can take considerable time.
3.5.1.4 Threat of New Entrants
The force of threat of new entrants is medium. Starting a firm as such is relatively easy and the
direct barriers to entry are low. In the simplest terms, a new investment manager needs to have
employees with the required certifications such as Chartered Financial Analyst (CFA) or
equivalent and then register with the regional Securities Commission. This process typically
takes a couple of months. A new investment manager can design and implement client portfolios
with minimal infrastructure through web-based portals which keeps the initial capital investment
very low.
Post 2008 financial crisis, the regulatory requirements are a noticeable barrier to entry. Any new
firm must invest resources in compliance staff and systems in order to meet its regulatory
obligations. Technology is a mitigating factor as there are excellent, off the shelf compliance

57
systems which a company can purchase. Overcoming the regulatory barrier is simply a matter of
making sufficient capital investments.
The real barrier to entry is attracting clients. What makes attracting clients difficult is that client
relationships are long-term in nature and it is essentially impossible for a client to try the service
like they might try a one-off consumable. Signing on with a new investment manager is a major,
long term decision. These long-term relationship based sales require a level of trust or a multi-
year performance track record which takes time to build. This reduces the strength of the force
“threat of new entrants”. It takes time for start-up firms to acquire clients, which in turn makes it
difficult for people with no client relationships to start a new firm.
3.5.1.5 Threat of Substitutions
The force of threat of substitutes is medium in this industry. The internet and the proliferation of
online discount brokers has allowed the customer to invest their assets directly thereby
circumventing the investment manager altogether. Also, the same changes have allowed the
customer to invest in other types of investments in addition to traditional stocks and bonds. In
recent years, there has been a proliferation of easily accessible alternative investments such as
specialist Exchange Traded Funds focusing on specific industries, commodity investments,
precious metals, real estate funds and personal real estate investments. Recent market instability
has given some clients the necessary incentive to change their approach and to abandon
traditional stock and bond portfolios in favor of the alternatives.
The main deterrent to moving money out from a traditional investment manager to one of these
newer alternatives is the client’s personal time. Taking care of your investments requires
significant commitment which many people want to avoid. There is also a psychological aspect

58
of the client having to possess the confidence to invest in something different or to try
unpracticed techniques with their own personal savings.
3.6 Sources of Competitive Advantage
Sources of Advantage can be examined from two perspectives: the customer’s willingness to pay
and price effects (Ghemawat, 2010). The willingness to pay is based on meeting customer’s
needs and the price effects are based on reducing the company’s costs. By mapping a company’s
sources of advantage onto customer’s needs and cost reducing strategies, a company can be
evaluated against its competitors on how well it is able to attract clients and keep its costs down.
This can then be used to assess the overall company competitiveness.
Table 3-3 scores the customer needs on their relative importance to the customer’s decision
making process and it scores the company’s advantages, including those impacting costs, on
their importance. The scoring is on a scale from 1 to 5, with 5 being most important or impactful.
The cost advantages do not have a customer importance score as the customers do not care about
a firm’s internal costs. The cost advantages are purely for the company’s ability to compete on
price or to extract superior profits.
Two representative firms were chosen to compare against Dovos: Royal Bank of Canada Wealth
Management representing very large investment companies and banks and Ladner, Thomson &
Associates, a two person company, representing very small independent investment companies.

59
Willingness to Pay and
Source of Advantage
Relative
Importance
to Customer
Dovos
Major Bank:
RBC Wealth
Management
Small Private
Counsel Firm:
Ladner, Thomson
& Associates
All Customer Types
Likelihood of superior future
investment performance 5
Long term performance
track record 4 3 3 4
Short term performance
track record 5 2 3 3
Stable investment team 3 4 2 3
Large investment team 2 3 5 1
Investment product selection 3
Wide range of product
offerings 3 3 4 1
Investment safety and risk
reduction 4
Years in business 3 4 5 3
Firm integrity record 4 4 4 4
Firm professionalism 4 4 5 3
Familiarity with firm 4 1 5 1
Firm transparency 3 4 2 5
Ability to have true
segregated portfolios 3 4 4 3
Investment customization to
specific investment needs 4
Customized portfolios 4 4 3 3
Private Investor Needs
Service 3
Strong personal
relationship 4 4 2 5
High ratio of staff to
clients 3 4 2 4
Flexibility to requests 3 4 2 5
Multiple convenient
locations 4 1 4 1
Online services 3 1 4 1
Breadth of financial services 3
Fully featured financial
office 3 3 5 2
Institutional Investor Needs
Ability to meet reporting
requirements 4

60
Flexibility to reporting
requests 4 4 3 2
Cost Advantages
Economies of scale 2 5 3
Economies of scope 2 5 1
Optimal capacity
utilization 2 3 5
Table 3-3: Sources of competitive advantage. Source: Author.
3.6.1 Customer Utility and Willingness to Pay Advantages
3.6.1.1 Likelihood of Superior Future Investment Performance
Fundamentally customers want to invest with investment managers who will generate superior
future returns or meet their income needs. The only hint at how the unknown future may be
handled by a company is by examining how it handled the past.
Good long term investment performance, defined as longer than 7 years, can be a significant
advantage to an investment company since it is a time dependent resource. There is no way to
accelerate the building of a multi-year track record. Dovos and RBCWM both have comparable
long-term track records with LTA having a slight performance advantage. This kind of
advantage is necessary for companies like LTA in order to survive over the long term.
Short term investment performance, defined as shorter than 3 years, is an even more significant
advantage to investment companies as it gives the clients the impression that the investment
company is completely in tune with what is happening now. There is an industry effect of some
investors chasing after “hot numbers” and moving assets to investment managers who have had
superior results in the past couple of years. Dovos is at a slight disadvantage in this important
category due to its inferior core Canadian Alpha product performance, which is only partially
mitigated by its slightly above average balanced and global mandate performance. Both
RBCWM and LTA are essentially on par. It is worth noting that very few investment
61
management firms retain superior short term performance for extended, multi-year periods of
time.
Regardless of how good a track record is, it will have little value to the customer if the people
responsible for making the investment decisions are no longer with the firm. The stability of the
investment team is an important part of a customer’s decision making process. Smaller firms like
Dovos have an advantage over big banks because the investment professionals making the
investment decisions are accessible to the clients and can be shown to be unchanged.
Additionally, both Dovos and LTA were founded by their current chief investment strategists
who are not only still with their respective firms, but are very unlikely to leave. With RBCWM’s
investments, on the other hand, the investment strategists for the different funds and products
rotate periodically and can leave without much notice to the client. It is important to note that
this advantage can become a disadvantage if the founders retire without grooming a trusted and
competent successor.
Great performance often requires a great research team in addition to the chief investment
strategist. When compared against other small investment managers, Dovos has the advantage of
having a dedicated investment technology and research team while LTA has no technology or
research team apart from their one Portfolio Manager. Big banks and larger investment
managers, on the other hand, have very large teams which give them an advantage over Dovos
and LTA. It is important to note that the teams are an advantage only when they yield superior
investment performance results.

62
3.6.1.2 Investment Product Selection
RBCWM and other big banks can offer a wide selection of products which can be unavailable
through smaller firms. Smaller firms do not manage sufficient assets to diversify into many
different products efficiently and so they are forced to be specialists and outsource to sub-
advisors to create selection.
Dovos is at a disadvantage to RBCWM as it specializes in equity investments with sub-advisors
for fixed income and Emerging Markets investments.
3.6.1.3 Investment Safety and Risk Reduction
This customer utility item is focused on avoiding investment losses from intended malicious
action such as fraud and from unintended mistakes such as firm bankruptcies.
Any firm that has been in business for over twenty years is more appealing to customer’s
concerns for safety and stability than a newly formed firm. Similarly to long investment track
records, this is a time dependent resource. Firm reputation is derived from its actions and
stability over time. There is no way to accelerate the building of reputation. Dovos, RBCWM
and LTA all enjoy strong, long term reputations, with the bank having a clear advantage over
other private firms given its over 100 years of history. This also ties into the perception of
professionalism of the firms. Centuries old banks, by their very nature, convey an air of stability
and professionalism which small firms cannot duplicate.
Banks also enjoy a unique advantage over firms like Dovos in that they already have a
relationship with their customers through standard banking services. Every existing bank
customer can be easily approached with investment product. Dovos and LTA, on the other hand,

63
have to first make potential customers aware of their existence and only then they can try to
make a sale.
One area where smaller firms like Dovos and LTA can enjoy an advantage over RBCWM is in
having greater transparency. Clients can see the inner workings of the operation, meet everyone
involved in the investment process and see the whole company from the inside. A big bank does
not allow typical customers to interact with their back office staff in the same way a small firm
can. Some clients feel more secure in knowing the people who actually take care of their money
in addition to knowing just the sales representatives. A small firm like LTA can chose to be even
more transparent than Dovos because its two person operation is naturally less complex and
more understandable than Dovos’.
True segregated portfolios where the customers are owners on record of all their securities give
customers protection from firm bankruptcies and other financial disruptions. All investment
firms can open segregated accounts for their clients; however, larger firms can negotiate better
rates with custodians. LTA’s customers, for example, have to either agree to pay a higher
custody fee or be forced to not have true segregated assets.
While these advantages are most relevant for private investors, institutions are not immune. All
institutional customers are represented by people who also need to know and trust the investment
managers they hire.
3.6.1.4 Investment Customization to Specialized Needs
Smaller sized firms can be more flexible for smaller customers than big banks. A customer is
more likely to select an investment manager who can match their needs exactly, which makes
flexibility important. The economies of scale for banks push their investment professionals to

64
offer standard solutions, which may not be ideal when dealing with relatively small customers.
Dovos, on the other hand, can offer specialization to these smaller investors. As long as the
product selection itself meets the customer’s needs, Dovos can offer more customization than
RBCWM. LTA, however, faces a different problem altogether. With only two staff, LTA is too
small to offer much customization to customers because it just does not have the necessary
resources. Dovos enjoys a unique size advantage by being large enough to have the necessary
staff and investment research infrastructure to provide customization while at the same time
being small enough to not require standardization in order to take advantage of scale cost
savings.
3.6.1.5 Private Investor Needs - Service
Very small and focused firms like LTA have an advantage over other companies in the strength
of relationships that they can forge. With fewer total customers and the customers being serviced
by the firm founders directly, LTA can develop even deeper bonds than a company like Dovos or
a bank like RBCWM. This is a significant advantage given that private individuals value
relationships highly.
A related aspect of this effect is the higher number of service employees for each client and the
non-bureaucratic environment that smaller companies like Dovos and LTA can offer. Unlike
RBCWM, there are no major scale efficiencies which will be lost by processing unique requests.
Additionally, Dovos and LTA both enjoy the advantage of having experienced client service
staff. Since big banks tend to have more junior staff, especially when dealing with smaller
accounts, customer experience can suffer. LTA can provide great service, however, due to its
small size it can be swamped by multiple specialized customer requests.

65
Accessibility is the other aspect of service valued by individuals. Here RBCWM is at a clear
advantage compared to Dovos and LTA as it offers many conveniently located branches while
Dovos and LTA both have limited offices. Also, RBCWM has developed a robust online
investment platform which allows their customers to self-service many requests while Dovos and
LTA can deliver only a rudimentary online experience.
3.6.1.6 Private Investor Needs - Financial Services Breadth
A big bank like RBCWM can offer all financial services under one roof making the overall
customer experience simpler and often with bundled pricing. Dovos and LTA both must use
referrals to match this, which when used well can offset the disadvantage. By offering to connect
its clients with other independent financial services, Dovos and LTA can expose their clients to
“best of breed” financial services instead of just one bank’s services. Given that most clients
value ease of use over always getting the best possible service, however, RBCWM has an overall
advantage.
3.6.1.7 Institutional Investor Needs - Ability to Meet Reporting Requirements
Similarly to service, Dovos enjoys a slight advantage over RBCWM given its higher potential
for flexibility. For the largest customers, however, RBCWM’s size can give it an advantage if the
reporting needs are very onerous. Dovos and LTA may not have the capacity to meet particularly
voluminous requirements. LTA is the most disadvantaged as it lacks the resources to produce
many complicated and customized reports.

66
3.6.2 Cost Advantages
3.6.2.1 Economies of Scale
The biggest cost advantage RBCWM has is the scale of its operation. RBCWM has much more
AUM than Dovos and can open its offices across the world in cost efficient locales. All of the
fixed costs for managing money, including registration costs and research costs are diluted over
many more customers. Dovos and especially LTA are not able to match this potential for cost
reduction.
The second aspect of RBCWM’s scale advantage is the access to best rates based on volume.
RBCWM gets better rates from financial suppliers such as brokers and data vendors and from
standard suppliers such as hardware vendors simply because they are purchasing much more
volume than Dovos or LTA.
3.6.2.2 Economies of Scope
RBCWM offers many different services which allow them to save costs. For example, all
investment managers have increased work during quarter ends and an extra large amount of work
during year end. A bank is able to shift some of its workforce to supporting other departments
between quarters in a way that Dovos or LTA cannot. Additionally, RBCWM can share
infrastructure costs such as buildings, IT and corporate administration between its different
banking and investment products.
3.6.2.3 Optimal Capacity Utilization
LTA enjoys an advantage over Dovos in its ability to fully utilize its capacity and infrastructure.
It is able to not only keep its operations very small and simple with only two employees, it has
been able to grow its business so that this infrastructure is fully utilized. LTA has no real

67
capacity to grow without adding to its operations, however, that means it currently has very low
cost to AUM ratio. Dovos, on the other hand, has 27 employees and rents a larger office with
more equipment, more complex IT systems and purchases more investment research data. It is
set up for growth and it is capable of managing more than double of its current assets.
In effect, LTA is operating at near its minimum efficient scale for the simpler investment product
that it offers, while Dovos is geared for the next level of investment complexity and scale, but it
has not reached the necessary output. Dovos’ only advantage in scale comes from the fixed costs
which have to be paid by all investment managers, including registration and legal.
3.6.2.4 Dovos’ Cost Position
In order to combat all the disadvantages above, Dovos has been very consciously keeping its
costs as low as possible through minimal staffing, no frills office and median salary levels.
3.7 Dominant Industry Trends
There are two major trends shaping the industry.

68
3.7.1 Trend of Declining Profitability
Figure 3-10: North American investment management profit pools over time. (McKinsey & Company, 2012) (McKinsey
& Company, 2012)
When investment management revenue, costs and profits are mapped in Figure 3-10 over the
period from 2007 to 2012(forecast), it is clear that while the revenue has recovered to its 2007
level, the costs have surpassed those levels. Consequently, profits have not recovered.
This can be partially attributed to additional reporting and regulatory requirements imposed on
the investment industry post the 2008 financial crisis. Before 2008, Dovos was able to meet its
regulatory requirements with one employee dedicating less than one half of her time to
compliance. In 2012, this had to be increased to one fulltime and one part time employee.
0
20
40
60
80
100
120
2007 2008 2009 2010 2011 2012F
North American Asset Management Profit Pools (2007 results indexed to 100)
Revenue Pool
Cost Pool
Profit Pool

69
3.7.2 Trend of Stagnant Developed Markets and Growing Emerging Markets
Figure 3-11: Net flows as percent for geographic regions. (McKinsey & Company, 2012) (McKinsey & Company, 2012)
Figure 3-11 shows the relationship of Net Flows to the assets available for managers from 2007
to 2011 when broken up by markets. The Developed Markets are showing little to no growth,
while the Emerging Markets are showing significant growth. Combined with the overall industry
trend, it is clear that there is little overall growth in the assets available to investment managers
and the growth which is occurring is concentrated in Emerging Markets. This trend is tied to the
shifting of demographics towards a higher percentage of retirees in the overall Developed
Markets population.
0%
5%
10%
15%
20%
25%
Net Flows as % by Market from 2007 to 2011
Net Flows as %

70
3.8 Summary and Implications of the External Environment
3.8.1 Strengths, Weaknesses, Opportunities, Threats
The Strengths, Weaknesses, Opportunities and Threats (SWOT) (Crossan, Rouse, Fry, & Killing,
2013) can be seen in Table 3-4. The individual items are arranged according to their relative
importance with the most important items at the top.

71
Strengths Weaknesses
Long performance track record and history
Good recent and long term performance of
low risk product
Customized service
Ability to perform specialized investment
research and to create highly customized
investment product.
Have excess capacity to manage more
assets with no additional overhead costs.
Weak recent performance of key products
Pre-retirement aged Portfolio Managers in
a relationship driven business.
Limited investment product types.
Limited financial services.
Brand is not recognizable outside of the
local industry insiders.
Opportunities Threats
Very small independent investment
managers are under cost pressures from
government regulatory requirements.
Increase in retirement age investors
interested in low risk product
Many independent investment firms are
owned and operated by the Boomer
generation and so are ready to sell their
businesses.
Traditional fixed income products are
generating very low yields due to low
interest rates.
Emerging Markets are showing growth of
assets.
It is difficult to start an investment
management firm.
Increase in accessibility to a wide variety
of investment products through the internet
and low-price brokers.
Increase in costly government regulatory
requirements.
Increased competitive pressure from banks
and other large financial institutions
offering easy to use, bundled, low price
packages.
Developed Markets including Canada are
showing very limited growth of assets.
Table 3-4: SWOT analysis. Source: Author.
There are three dominant themes which need to be addressed. One of Dovos’ core products has
underperformed in the past couple of years which has opened it to losing more clients.
The Canadian investment market growth has stagnated in the past 3 years and is projected to
remain stagnant. This has increased competitive pressure from other investment managers,

72
including big organizations which have far greater resources. The negative effect is compounded
by the increased regulatory requirements which have increased costs.
The current Dovos sales force is nearing retirement which means that relationship motivated
clients may leave. Additionally, even though the investment team, the client service team and the
administration team have spare capacity, a significant portion of the sales force is no longer
highly motivated to aggressively grow their client base and more of their time is spent servicing
existing clients rather than acquiring new ones.
3.8.2 Summary
This section illustrated the competitive environment in which Dovos operates and it has shown
the major demographic, regulatory and technological trends which are shaping it. The current
Dovos strategy is not optimized to compete in the new environment and its current sources of
advantage will erode over time.
The following section will propose three strategic alternatives designed to take advantage of
Dovos’ strengths, focus its resources and configure it for success.

73
4 Strategic Alternatives
This section outlines three strategic alternatives designed to take advantage of the company’s
strengths and the competitive environment as outlined in the previous chapters. Each alternative
is examined in four sections. The first section outlines the product that each option will focus on,
including new products or changes to existing products. The second section shows how the
option will distribute its product and acquire new assets to manage. The third section explains
what changes to the firm’s operations have to be made to implement the option. The fourth and
final section shows what new revenue and EBIDTA the option will generate over a 5 year
period. Combined, the content in these sections will be used to evaluate and compare the options.
The details of the financial models and some key assumptions made when constructing them are
shown in Appendix A.
4.1 Strategic Option 1: Focus on Retirement Based Product
Given that population demographics are pushing more money towards retirement products,
focusing on these products will help to attract individual investors and many institutional
investors who service retirement aged population.
4.1.1 Product
The product will leverage research already conducted on Low Volatility-High Yield portfolios
and will be focused around risk reduction and yield maximization. It will operate on two levels:
stock selection and asset allocation. The first level, stock selection, will be customized for larger
clients to provide a stock mix which hits each client’s specific needs for yield as determined by
their forecasted liabilities, deposits and redemptions. The second level, asset allocation, will look
74
at the entire portfolio and mix the investment types such as equities, bonds, mortgages and
markets such as Canada, U.S., Europe, South America and Asia. The asset allocation portion
requires further research and investment of time and resources before it can be offered to clients.
Providing that the research is successful and does create viable strategies, the value proposition
is to offer market-like returns without market-like losses. Additionally, these portfolios can
generate yields which are no longer generated by traditional fixed income products.
The strategic trade-off for Dovos is to essentially abandon or de-prioritize the classic Alpha
based core equity product which has always been a Dovos core offering. This will possibly cause
Dovos to lose some existing institutional clients.
4.1.2 Product Distribution and Acquisition of New Assets
This strategy works very well with existing asset gathering methodologies and the key to success
will lie in maximizing Dovos’ efforts on all these fronts. No new distribution methodologies are
required. The key difference will be in the marketing used to attract clients through all current
distribution channels.
Direct Portfolio Manager sales
Partner Program
Retirement focused Separately Managed Assets (SMA)
Offering Memorandum (OM) individual funds distribution
4.1.3 Operations and Efficiency
There are two operational changes required to implement this strategic option. The first is the
hiring of additional motivated Portfolio Managers. Given that Portfolio Managers are
compensated based on the total assets they manage, PMs with fewer assets are typically more

75
motivated to aggressively grow their assets than ones with large books. Dovos’ current Portfolio
Managers are busy maintaining the existing assets and not all are motivated to aggressively seek
new clients.
The second change is the outsourcing of other Dovos products, including the core Alpha
strategy. The retirement product requires a significant ongoing investment of research time,
which is a strategic resource. In order to keep the product best in its class, Dovos must focus its
research on continuously improving the product.
The trade off for this tactic is that institutional clients who hired Dovos for the Core Alpha
strategy will leave. This represents around 16% of current AUM and 5% of current revenue. In
essence, this will shift Dovos revenue completely away from these types of institutional clients
to private clients and institutional clients who are seeking retirement like products.
4.1.4 Financial Summary
Table 4-1 summarizes the financial outlook of implementing Option 1.
Option 1 Key Financial Summary (CAD)
Year 0 Year 1 Year 2 Year 3 Year 4 Year 5
Revenue 6,100,000 6,668,856 7,471,972 8,369,897 9,627,501 10,525,426
Costs 5,100,000 5,476,457 5,993,541 6,590,519 7,547,400 8,144,378
EBITDA 1,000,000 1,192,399 1,478,430 1,779,378 2,080,100 2,381,048
EBITDA YoY Growth 19.2% 24.0% 20.4% 16.9% 14.5%
EBITDA Cumulative Growth 19.2% 47.8% 77.9% 108.0% 138.1%

76
3 Year Revenue Growth 37.2%
5 Year Revenue Growth 72.5%
3 Year EBITDA growth 77.9%
5 Year EBITDA growth 138.1%
Table 4-1: Option 1 financial summary. Source: Author.
4.2 Strategic Option 2: Distribute to Emerging Markets
Given that the world economy and global demographics have pushed growth to the Emerging
Markets, Dovos can focus on distributing its classic products to China, South America or Central
and Eastern Europe.
4.2.1 Product
The assets available for investment managers in Emerging Markets are still growing in the
traditional categories, such as classic Alpha equity based products and classic balanced
mandates. Dovos has over 20 years of experience building these products and has a lineup which
is ready to be distributed. While there is no need to specifically focus on retirement products
which can be pursued on a spare capacity basis, the main effort can be concentrated on classic
Dovos products. This allows Dovos to remain focused on the product it has always been
building. The main driver for considering this option is the significant projected growth of the
market. Dovos’ balanced portfolio, which is aimed at the classic savings market, has
outperformed the Median Manager Benchmark in 2012. This, combined with its 20 year history
and the amount of growth projected for the market, should allow Dovos to capture new retail
clients, while it continues to work on improving the product.

77
4.2.2 Product Distribution and Acquisition of New Assets
Given that Dovos has no contacts or experience selling in any Emerging Market; it would have
to form a partnership with local Portfolio Managers. This would have to be more than the Partner
Program, which is just a referral service, since Dovos has no facilities to service local clients.
The best approach would be a Joint Venture with a local firm where Dovos would handle the
product creation and back-office operations and the local firm would handle customer service
and sales. The JV partner must have an effective sales force and be able to quickly grow and
retain clients. Once a JV is in place, the Partner Program would be implemented locally to
increase referrals and accelerate asset growth.
The main challenge behind this tactic is that Dovos has no control over the availability of a
suitable JV partner. The search for such partner will take time and is not guaranteed to succeed.
This option is therefore quite unpredictable. Additionally, in order for this option to be attractive
against the other options, Dovos would need to retain 60% of the revenue and leave 40% to the
JV partner. If the split is reduced to 50-50, then according to the model shown in Appendix A,
the option is less attractive than the other options. Considering the high degree of uncertainty,
this would make the option not worth considering. The 60-40 split may make finding a JV
partner more difficult.
This strategy should be rolled out one territory at a time so that the company does not become
overstretched.
4.2.3 Operations and Efficiency
The first major operational change is an increase in the regulatory burden on the company. The
BCSC has strict requirements around the monitoring of foreign investments for signs of money

78
laundering or ties to terrorism. Since Dovos would make investing foreign money a part of its
core business, it would need to invest in additional infrastructure to monitor the financial
activities of its emerging markets clients.
Additionally, the developing countries Dovos would be entering have their own regulatory
bodies which would need to be satisfied. This would require Dovos to enlist local legal services
and work through the appropriate filings. Depending on the specifics, this may be handled by the
local JV partner.
Keeping costs low is essential to competing in these markets. Dovos should outsource as much
of the back-office operations as possible. This will help to lower costs and if the right outsourcer
can be found, it may provide additional experience with operating in the new market.
The trade-off of this tactic is that the outsourcing of the back-office may negatively impact the
service for existing domestic clients who are used to a high level of customization and personal
attention.
4.2.4 Financial Summary
Table 4-2 summarizes the financial outlook of implementing Option 2.
Option 2 Key Financial Summary (CAD)
Year 0 Year 1 Year 2 Year 3 Year 4 Year 5
Revenue 6,100,000
6,109,000
6,439,000
7,099,000
8,809,000
9,889,000
Costs 5,100,000
5,103,350
5,272,850
5,611,850
6,528,350
7,070,350
EBITDA 1,000,000
1,005,650
1,166,150
1,487,150
2,280,650
2,818,650
EBITDA YoY Growth 0.6% 16.0% 27.5% 53.4% 23.6%
EBITDA Cumulative Growth 0.6% 16.6% 48.7% 128.1% 181.9%

79
3 Year Revenue growth 16.4%
5 Year Revenue growth 62.1%
3 Year EBITDA growth 48.7%
5 Year EBITDA growth 181.9% Table 4-2: Option 2 financial summary. Source: Author.
4.3 Strategic Option 3: Become a Service Provider to Portfolio Managers
Given that winning new assets from other investment managers is difficult and new assets are
not being added to the market, this option sees Dovos grow its revenue by partnering up with
highly successful Portfolio Managers who wish to become independent from their existing
companies in order to realize higher returns on the assets they manage. Due to regulatory
requirements, it is impossible to become an independent Portfolio Manager overnight without an
investment in the appropriate registrations, compliance capabilities and other back-office items.
4.3.1 Product
Dovos will offer its extended back-office services to Portfolio Managers as a service which will
allow the Portfolio Managers to focus on servicing their clients and making the investment
decisions. Dovos currently has a fairly robust reporting capability, compliance service, corporate
services such as human resources and office facilities. All of these must exist for Dovos to be
able to operate as an investment manager in British Columbia. This allows Dovos to leverage its
existing infrastructure. In return, the joining Portfolio Manager will split his or her revenue with
Dovos according to a pre-determined schedule. The complete listing of services which will be
offered is:
Registration status as an Investment Manager in all major Canadian provinces.
Annual regulatory filings to BCSC and CRA
Office facilities including a receptionist.

80
High quality quarterly client statements.
Access to Dovos client seminars.
Access to Dovos research and investment product.
Corporate services including human resources, payroll, benefits.
A highly competitive custody and trade execution rate due to bulk discounts available to
firms of Dovos’ size.
The trade-off of this option is that the Dovos brand would get diluted. In order for a Portfolio
Manager to become registered under Dovos, he or she would have to operate under the Dovos
brand, with a possibility of using their own name as a sub-brand. As a result, Dovos would still
offer its own products in addition to being a brand behind these new Portfolio Managers. If one
of them had any difficulties with his or her clients, Dovos would have limited capability to deal
with the problem but it would bear the full responsibility. A similar issue can occur with
compliance. Dovos can monitor compliance; however, it would have limited ability to enforce
compliance. As such, if one of these PMs decided to break regulatory requirements, then Dovos
would be liable to the BCSC.
The other major trade-off is that there would be competition for clients between Dovos’ own
Portfolio Managers and these new Portfolio Managers. This may create some challenging
dynamics.
4.3.2 Product Distribution and Acquisition of New Assets
The model works through offloading asset acquisition to the serviced Portfolio Managers. It is
their job to acquire and maintain their clients. The way Dovos acquires new assets is by finding
these Portfolio Managers through two strategies. A headhunter will be hired to source and find

81
suitable candidates and Dovos sales staff will spend a portion of their time sourcing leads for
Portfolio Managers who are suitable candidates and may be interested in joining the company. In
order for this model to work, a suitable Portfolio Manager must meet the following criteria.
Manage assets of at least $100,000,000.
Not be bound by strict non-solicit or non-compete clauses which would prevent him or
her from bringing clients to Dovos.
In order to attract the Portfolio Manager, Dovos will have to pay him or her revenue multiple to
“buy the book.” The industry standard is to pay 1.0 to 1.5x annual revenue. Given that the PIM
model gives the Portfolio Managers a higher share of the revenue, Dovos may be able to
purchase the books with 0.75x annual revenue.
The trade-off is that this is a significant capital investment for Dovos and it will tie up
considerable capital resources. Additionally, any Dovos sales time directed at finding these
Portfolio Managers is not directed at finding new clients.
4.3.3 Operations and Efficiency
Support costs for new assets tied to the new Portfolio Managers increase more quickly than with
Option 1. Each new Portfolio Manager will bring a new set of requirements and this can drive
the costs up. As such, this option requires Dovos to become as cost effective as possible in order
to protect the profits which can be eroded by an unforeseen increase in operational complexity.
Additionally, the existing Dovos Portfolio Managers would have to be treated as customers of
this Dovos service in order to treat everyone fairly.
Some labor intensive, commodity like back-office functions such as trade settlements or
reconciliation should be outsourced as much as possible to drive down the costs. Dovos would

82
still provide the regulation mandated compliance, registration and the overall packaged corporate
service.
The major trade-off is that this option radically changes the Dovos identity from being a
dedicated investment manager to being both, a service provider and an investment manager. This
necessary internal culture shift may have hard to foresee impact on staff morale.
The second trade-off is that while currently Dovos can set its own requirements on the back-
office department and thus fully control costs, when it becomes a service provider, Dovos will
have to meet the expectations of the new serviced Portfolio Managers. The impact of this change
is also difficult to predict given that Dovos has no experience in servicing the needs of non-
Dovos Portfolio Managers.
The current Dovos back office technology and systems infrastructure will be able to handle up to
5 new Portfolio Managers before requiring a major upgrade. Once the upgrade point is reached,
Dovos will be forced to upgrade its core accounting system, Client Relationship Management
(CRM) system and surrounding technology infrastructure. Based on current estimates, this will
cost between $500,000 and $750,000.
4.3.4 Financial Summary
Table 4-3 summarizes the financial outlook of implementing Option 3.

83
Option 3 Key Financial Summary (CAD)
Year 0 Year 1 Year 2 Year 3 Year 4 Year 5
Revenue 6,100,000
6,426,250
7,078,750
7,731,250
8,710,000
9,362,500
Costs 5,100,000
5,255,000
5,565,000
5,875,000
6,340,000
6,650,000
EBITDA 1,000,000
1,171,250
1,513,750
1,856,250
2,370,000
2,712,500
EBITDA YoY Growth 17.1% 29.2% 22.6% 27.7% 14.5%
EBITDA Cumulative Growth 17.1% 51.4% 85.6% 137.0% 171.3%
3 Year Revenue growth 26.7%
5 Year Revenue growth 53.5%
3 Year EBITDA growth 85.6%
5 Year EBITDA growth 171.3%
Table 4-3: Option 3 financial summary. Source: Author.
4.4 Options Evaluation and Recommendation
4.4.1 Evaluation Criteria
The three options can be scored and evaluated based on preferences according to the scoring
criteria below.
4.4.1.1 Potential for Revenue Growth
This criterion captures the ability of an option to generate new revenue which would have been
unavailable had the option not been implemented. It is scored on the projected revenue generated
by an optimistic outcome for the option as described above. Revenue is net of any revenue
sharing arrangements and so it evaluates only the revenue which is available to Dovos. The
revenue growth is evaluated after a 5 year period. At the current budgeted revenue growth of 3%

84
annually, a 5 year growth of 16% is the base case. This criterion is weighted at 20% of the total
score as growing the revenue is a key stated goal for the company.
Score Meaning
1 Option has the potential to generate revenue growth lower than 16% after 5 years.
Option is worse than keeping current growth plan even if it is successful.
2 Option has the potential to generate revenue growth between 16% and 32% after 5
years.
3 Option has the potential to generate revenue growth between 32% and 55% after 5
years.
4 Option has the potential to generate revenue growth between 55% and 70% after 5
years.
5 Option has the potential to generate revenue growth over 70% after 5 years.
4.4.1.2 Potential for Profit Growth
This criterion captures the additional new EBITDA that an option will be able to generate. While
the EBITDA is linked to revenue, ultimately the shareholders are interested in how much profit
an option will generate more than in how much raw revenue the option will generate. This is
based on an ongoing pro-rata EBITDA which excludes one time startup costs. This criterion is
weighted at 30% of the total as generating profit is the key requirement from the board.
Score Meaning
1 Option has the potential to grow EBITDA by less than 50% after 5 years.
2 Option has the potential to grow EBITDA by between 50% and 100% after 5 years.
3 Option has the potential to grow EBITDA by between 100% and 150% after 5 years.
4 Option has the potential to grow EBITDA by between 150% and 200% after 5 years.
5 Option has the potential to grow EBITDA by over 200% after 5 years.

85
4.4.1.3 Time to Profit
This criterion evaluates the time needed to see first signs of significant EBITDA growth. The
criterion looks at the number of years needed by the option to increase EBITDA by 50%. This
criterion is weighted at 10% of the total as getting to the revenue quickly is not as important as
the other criteria.
Score Meaning
1 Option will generate EBITDA growth of 50% after more than 4 years or never.
2 Option will generate EBITDA growth of 50% after at most 4 years.
3 Option will generate EBITDA growth of 50% after at most 3 years.
4 Option will generate EBITDA growth of 50% after at most 2 years.
5 Option will generate EBITDA growth of 50% after at most 1 year.
4.4.1.4 Risk
This criterion captures the overall inherent risk in implementing the option. This is a qualitative
assessment of whether the option requires highly optimistic events to occur for it to capture its
stated revenue potential. Risk also captures the likelihood of the option failing to generate any
new revenue and of costing the company its investment. This criterion is weighted at 25% of the
total as risk is an important consideration. Even if an option has great revenue and profit
potential, it is undesirable if it places the company at risk of losing its investment or if it requires
very optimistic results.

86
Score Meaning
1 Option requires very unlikely events or the option has a high possibility of failure.
2 Option requires unlikely events or the option has a significant possibility of failure.
3 Option requires somewhat likely events or the option has a somewhat low possibility
of failure.
4 Option requires likely events or the option has a low of failure.
5 Option requires very likely events or the option has a very low possibility of failure.
4.4.1.5 Capital Investment Required
This criterion captures the amount of capital the company must invest in executing the option in
order to have a chance of achieving the Revenue Potential. It reflects the resource drain on the
company as well as the likelihood that the company will be able to raise sufficient capital to
execute the option. This criterion is weighted at 15% of the total as it is important for the
company to not over-invest itself in a single option at the cost of its core business.
Score Meaning
1 Option requires a capital investment of more than 1x annual revenue.
2 Option requires a capital investment between .5x and 1x annual revenue.
3 Option requires a capital investment between 0.5x and 0.25x annual revenue.
4 Option requires a capital investment between 0.25x and 0.1x annual revenue.
5 Option requires a capital investment lower than 0.1x annual revenue.
4.4.2 Combined Option Evaluation and Summary
The individual rankings of the options can be seen below. For a detailed analysis of the numbers
behind the options, please see Appendix A.

87
Evaluation Criteria Weight
Option 1:
Retirement
Product Focus
Option 2:
Emerging
Markets
Option 3:
PM Service
Provider
Potential for Revenue Growth
20% 5 4 3
Potential for Profit Growth
30% 3 4 4
Time to Profit 10% 4 3 4
Risk 25% 4 1 3
Capital Investment Required
15% 4 2 1
Total 100% 3.9 2.9 3.1
Table 4-4: Strategic option preference analysis. Source: Author.
Table 4-4 shows the individual scores for each option against each criterion as well as the
combined score. Option 1 is the preferred option before considering feasibility. Option 2 and
Option 3 show the same EBITDA growth when mapped onto the 1-5 evaluation scale, however,
Option 2 has the highest EBITDA potential when examined in detail. Option 2 also comes with
the greatest risk. Option 3 provides a second best EBITDA; however, it has the highest capital
investment required. The feasibility of each option will be examined in the following section
which will then allow for the final recommendation to be made.

88
5 Feasibility Analysis of the Strategic Options
The feasibility of each of the strategic options is analyzed below using a framework based on the
“Diamond-E Framework” (Crossan, Rouse, Fry, & Killing, 2013).
5.1 Strategic Option 1: Focus on Retirement Based Product
Strategic Option 1 involves a number of separate initiatives designed to work together, however,
the Strategic Option may be a good alternative even if only some of the initiatives are feasible.
5.1.1 Managerial Requirements and Gaps
5.1.1.1 Preferences and Decision Criteria
Requirement Managers are willing to de-prioritize the Dovos Classic Alpha and Balanced
product in favor of a Retirement Focused product
Gap No major gap.
Gap Filling Solution None necessary
Cost None
5.1.1.2 Experience
Requirement
Offering Memorandum distribution requires Management to be proficient in
operating a pooled fund distributed to many independent Portfolio Managers
nationally.
Gap Currently management does not have this proficiency.
Gap Filling Solution Training and hiring of consultants such as legal and accounting advisors
Cost Low

89
5.1.1.3 Team Composition
Requirement Management team must be diversified and well versed in the running of an
investment management firm
Gap No gap exists
Gap Filling Solution None needed
Cost None
5.1.1.4 Summary
Overall the managerial gaps are small or have low gap filling costs.
5.1.2 Organizational Requirements and Gaps
5.1.2.1 Structure
Requirement Investment research team is capable of constructing customized Low Volatility
High Yield strategies including Asset Allocation.
Gap Dovos does have an investment research team; however, much of their time is
dedicated to legacy Alpha product.
Gap Filling Solution
Hire a junior team member to support legacy product or outsource the legacy
product so that the existing top team members can be dedicated to researching
the retirement based strategies.
Cost Low to Medium.

90
5.1.2.2 Systems
Requirement
Investment research technology and access to data necessary for the
construction of custom Low Volatility and High Yield retirement focused
products
Gap Dovos currently has such technology and data.
Gap Filling Solution None needed
Cost None.
Requirement Efficient SMA portfolio management system capable of potentially handling
hundreds of different SMA accounts
Gap
Dovos currently has a very simple system for managing SMA accounts which
treats them as special cases of the normal Dovos accounts. The current system
is sufficient for less than 10 accounts at which point a more robust solution
will be necessary.
Gap Filling Solution The current system will need to be extended. There is no need for a
replacement of the underlying system.
Cost Medium.
5.1.2.3 Culture
There are no significant Culture requirements needed for this option.
5.1.2.4 Summary
Overall the structural requirements for this option are low to medium.

91
5.1.3 Resource Requirements and Gaps
5.1.3.1 Operational
Requirement
If many new SMA portfolios are launched, Dovos will require staff dedicated
to managing the SMA book of business. Each account will have its own
particular requirements which will need to be monitored to ensure that nothing
is missed.
Gap Such staff does not currently exist. SMA accounts are managed as a split
responsibility amongst existing staff.
Gap Filling Solution Hire and train additional staff as required.
Cost
Low to Medium.
This cost should be fully marginal and incurred only if there is sufficient
revenue to require it.
5.1.3.2 Human
Requirement Dovos must have Portfolio Managers who are motivated to work with referral
partners to generate and capture referral leads.
Gap
Current Dovos Portfolio Managers are quite busy with their existing clients and
not motivated to take on referrals which generate less revenue for them than
their own clients.
Gap Filling
Solution
Hire a new Portfolio Manager with a small client list or promote someone
internally to the role of a Portfolio Manager who will be highly motivated.
Cost Medium.
5.1.3.3 Financial
There are no significant financial gaps required for this option.

92
5.1.3.4 Summary
Overall the costs of the resource gaps are medium.
5.2 Strategic Option 2: Distribute to Emerging Markets
5.2.1 Managerial Requirements and Gaps
5.2.1.1 Preferences and Decision Criteria
Requirement Firm founders have to be open to operating the company in Emerging Markets
which is a very different direction from what Dovos has done historically.
Gap This option has not been considered before so their openness to making this
move is unknown.
Gap Filling
Solution
The founders and the management team have to be educated on the reality of
doing business in a chosen Emerging Market. This will involve trips and
consultation with appropriate experts.
At the end of the exercise, this gap may still not be filled.
Cost Medium
5.2.1.2 Experience
Requirement Management must have experience in dealing with the regulatory and business
particulars of the specific chosen Emerging Market
Gap Currently the management team has no such experience.
Gap Filling
Solution
The team would have to be augmented by either hiring a full time manger with
the necessary experience or by engaging a consulting firm.
Cost Medium to High

93
5.2.1.3 Team Composition
Requirement Management team must have a local representative who can work with local
regulatory bodies.
Gap Currently the management team lacks this representation.
Gap Filling
Solution
The team would have to be augmented by hiring a local representative.
Cost Medium
5.2.1.4 Summary
Overall the management costs for this option are medium to high.
5.2.2 Organizational Requirements and Gaps
5.2.2.1 Structure
Requirement
With the local operations mostly handled by a Joint Venture partner, Dovos will
require a small liaison department which will coordinate operations between the
Canadian back office and the local distributor
Gap Dovos does not have this department
Gap Filling
Solution
The new department must be created
Cost Medium to High

94
5.2.2.2 Systems
Requirement Dovos will require a robust compliance system which will satisfy BCSC that our
Emerging Market clients are not a high risk for money laundering or terrorism.
Gap Dovos has a compliance system but it was designed for Canadian and US
clients.
Gap Filling
Solution
The Dovos system has to be extended or replaced with a 3rd
party solution.
Cost Medium
Requirement Dovos will require a client database and client trade system which can work in a
satellite office and connect to the Canadian headquarters.
Gap
Current Dovos system was designed to be used in a single location but it does
have the capability to be used remotely. It currently requires a fast internet
connection which may be problematic.
Gap Filling
Solution
The current system can be enhanced to fully support true remote work.
Alternatively a robust 3rd
party system can be licensed which will replace the
Dovos system.
Cost Medium to extend and test current system.
High to replace current system with a 3rd
party system.

95
5.2.2.3 Culture
Requirement Dovos staff will have to be proficient in dealing with the Joint Venture partner
requests and business culture.
Gap Currently Dovos staff is only familiar with the Canadian business culture.
Gap Filling
Solution
Dovos staff will have to be trained.
Cost Low to Medium.
5.2.2.4 Summary
Overall the organizational requirements are medium to high.
5.2.3 Resource Requirements and Gaps
5.2.3.1 Operational
Requirement Dovos must have the ability to operate an Investment Management business in a
specific Emerging Market country
Gap Currently Dovos does not have the necessary registrations or capability.
Gap Filling
Solution
Dovos will form a Joint Venture with a local partner interested in distributing
the Dovos product or find a suitable buy out target.
Cost
High and very uncertain.
It is difficult to estimate the likelihood that Dovos will find an appropriate Joint
Venture partner or buy out target.

96
Requirement Dovos will have to be able to process transactions from Emerging Market banks.
Gap Currently Dovos deals with Developed Market banks only.
Gap Filling
Solution
If the current Dovos custodian is not able to effectively deal with local
Emerging Market banks, then an alternative custodian with a global reach will
be employed. For example Citi Bank.
Cost Medium to High if Dovos has to switch custodian to Citi Bank.
5.2.3.2 Human
Requirement
Dovos will have to have access to local staff that will run the Investment
Management office, act as the Portfolio Manager and Client Service
representative.
Gap Dovos does not have such staff.
Gap Filling
Solution
Dovos will form a Joint Venture with a local partner interested in distributing
the Dovos product or find a suitable buy out target.
Cost
High and very uncertain.
It is difficult to estimate the likelihood that Dovos will find an appropriate Joint
Venture partner or buy out target.

97
5.2.3.3 Financial
Requirement
Dovos must have sufficient funding to acquire a small local Investment
Management firm or to form a Joint Venture.
Additional funding must be available to sponsor the local operations until the
new venture grows to be self sufficient.
Gap Dovos has access to pre-approved credit; however, the amount will likely not be
sufficient.
Gap Filling
Solution
Additional funding must be secured so that Dovos can improve its capabilities
and sponsor the partner
Cost
Medium and uncertain.
It is not clear whether Dovos will be able to secure sufficient funding for this
venture.
5.2.3.4 Summary
Overall the resource requirements are medium to high and carry significant uncertainty.

98
5.3 Strategic Option 3: Become a Service Provider to PMs
5.3.1 Managerial Requirements and Gaps
5.3.1.1 Preferences and Decision Criteria
Requirement
The founders and the management have to be willing to explore options which
shift the company from being a pure investment manager to also being a service
provider.
Gap Current Dovos management and founders are interested in pursuing alternatives
which redefine the business model.
Gap Filling
Solution
None required.
Cost None.
5.3.1.2 Experience
Requirement The management must have experience running a back-office with a client
service and a compliance sections.
Gap None. Currently Dovos runs such a back-office.
Gap Filling
Solution
None needed.
Cost None.

99
Requirement The management should have experience running a service organization.
Gap
The current Dovos set-up has a service mindset towards the clients whose
money is invested. This mindset would have to be shifted towards treating the
Portfolio Managers as clients.
Gap Filling
Solution
Shift in managerial mindset towards Portfolio Managers.
Cost None.
Requirement Once there are multiple Portfolio Managers occupying multiple satellite offices,
the management must be experienced in running a multi-site operation.
Gap Currently the management has no experience with a multi-site office.
Gap Filling
Solution
Additional training or consulting as needed.
Cost Low.
5.3.1.3 Team Composition
Requirement The management must have managers familiar with BCSC’s regulatory
requirements and with how Portfolio Managers like to operate.
Gap The current Dovos management does possess this knowledge through its team
members.
Gap Filling
Solution
None needed.
Cost None.

100
5.3.1.4 Summary
Overall the management requirements are low.
5.3.2 Organizational Requirements and Gaps
5.3.2.1 Structure
Requirement Dovos has to be organized so that the Portfolio Managers have their needs met
and are satisfied as clients.
Gap
The current set-up has Portfolio Managers as employees of the Sales
Department working with the Client Service section, the Administration
Department and the Investment Department. While these departments do service
the current Portfolio Managers, it is not a true client-service provider
relationship.
Gap Filling
Solution
The servicing departments would have to be reorganized so that they were
motivated to treat the new Portfolio Managers as clients. This setup would then
apply to all Portfolio Managers so that everyone received a fair service.
Cost Low to Medium. This is primarily a training and compensation structure issue.
Each additional PM adds to the cost as additional staff will be required.
5.3.2.2 Systems
Requirement Dovos would have to implement a system which would ensure a fair treatment
of all Portfolio Managers and a fair treatment of all end clients.
Gap
Dovos has no experience with working for Portfolio Managers coming from
different organizations with different habits and requirements. It is possible that
while the program is getting started, errors will be made or specific needs of the
new Portfolio Managers will not be met.
Gap Filling
Solution
Dovos must implement an iterative system of improvements and feedback in
conjunction with oversight from Compliance to ensure that all Portfolio
Managers and their clients are treated fairly.
Cost Low. This is primarily a training and procedural issue.

101
Requirement Dovos must have a flexible trading platform which can be used by Portfolio
Managers to choose their own stocks for their clients.
Gap The current system allows Portfolio Managers to choose the Dovos Pooled
Funds only. All individual stock picking is done by the investment department.
Gap Filling
Solution
The current system has to be extended or a new 3rd
party system must be
implemented which will allow the Portfolio Managers to choose stocks and
directly control their client’s investments
Cost
Medium to High.
If the current system can be extended then the costs are lower. The current
system is not robust enough to handle more than 5 Portfolio Managers.
A 3rd
party system can be relatively expensive to license. This will be necessary
once 6 or more Portfolio Managers are signed up.
5.3.2.3 Culture
Requirement
Dovos has to be open to the idea that its Investment Team is not the only
product creator at the company and that the Dovos investment brand will be
diluted.
Gap The current culture is focused on Dovos Investments being the only identity of
Dovos.
Gap Filling
Solution
This requires a shift in thinking of the staff, especially the Investment Team.
Cost None.
5.3.2.4 Summary
Overall the organizational requirements are low to medium.

102
5.3.3 Resource Requirements and Gaps
5.3.3.1 Operational
Requirement Dovos must have adequate space to provide seating for the new Portfolio
Managers and their associates.
Gap The current Dovos office space is only large enough to house one more Portfolio
Manager. Additional Portfolio Managers will require more space.
Gap Filling
Solution
A satellite office will be leased in the proximity of the main Dovos office. The
office would be able to handle two to five Portfolio Managers. If additional
space is needed, additional offices can be leased.
Cost None to Medium to High as the requirement moves from not needing any
additional office space to needing multiple additional offices.
Requirement Dovos requires an IT infrastructure which can handle multiple satellite offices.
Gap Current Dovos infrastructure is designed for a single office with a single off-site
backup.
Gap Filling
Solution
The infrastructure would need to be extended.
Cost Medium. The current infrastructure is extensible and should scale with the
addition of hardware and contract labor for the initial setup.

103
Requirement Dovos requires a bulk client on-boarding system so that a joining Portfolio
Manager can quickly open accounts for all of their clients.
Gap Current Dovos client on-boarding system is heavily manual and is designed for
single accounts being opened individually.
Gap Filling
Solution
Dovos would need to develop automation to help with the account opening
process.
Cost Medium. The problem itself is well understood which makes this an
implementation problem.
5.3.3.2 Human
Requirement Dovos must have sufficient staff to handle the additional workload new
Portfolio Managers with many clients would create.
Gap Currently Dovos staff is optimized for the Dovos clients and slow, organic
growth.
Gap Filling
Solution
New staff will have to be hired.
Cost Medium to High. Depending on the number of new Portfolio Managers and
clients that are being brought on-board.

104
5.3.3.3 Financial
Requirement
Dovos requires sufficient funds to purchase the service contract from the new
Portfolio Manager. Typically, a substantial incentive based a multiple of total
revenue from all clients is paid to the Portfolio Manager for the business. Funds
are also needed to make any of the system improvements and to hire new staff
as required by the number of new Portfolio Managers.
Gap Dovos has access to a pre-approved credit line which can be used to fund a
single new Portfolio Manager.
Gap Filling
Solution
Additional funds will need to be secured to fund additional Portfolio Managers.
Cost Medium. The availability of the additional funding is not guaranteed.
This Gap increases in cost with each additional PMs
5.3.3.4 Summary
Overall the resource requirements are Medium with the exception of funding if multiple
Portfolio Managers are to be brought on board.
5.4 Feasibility Summary
Table 5-1 illustrates the individual option feasibility for each requirement type and the final
average feasibility. Score of 5 indicates the smallest gap, or an easy to fill gap.

105
Feasibility Requirement Category
Option 1: Retirement
Product Focus
Option 2: Emerging Markets
Option 3: PM Service
Provider
Management
Preferences and Decision Criteria 5.0 3.0 5.0
Experience 5.0 2.0 5.0
Team Composition 5.0 3.0 5.0
Organization
Structure 4.0 2.0 4.0
Systems 4.0 3.0 4.0
Culture 5.0 4.0 5.0
Resources
Operational 4.0 1.0 3.0
Human 3.0 1.0 2.0
Financial 5.0 2.0 3.0
Average 4.4 2.3 4.0
Table 5-1: Strategic options feasibility summary. Source: Author.
Option 1 has the highest feasibility with Option 3 being a close second. Option 2 has low
feasibility with significant Operational and Human resource gaps which may be very difficult to
fill.
106
6 Final Recommendation
6.1 Options Choice
Option 1: Focus on Retirement Products is the recommended option. This multi-faceted
option includes a number of initiatives which can be implemented as the opportunity arises.
Given that the social demographics of investors in the Developed Markets such as Canada are
shifting towards retirement age and given that there is increased fear of market instability, the
demand for investments built around protecting wealth, generating income and avoiding risk will
keep increasing for decades.
Option 2: Emerging Markets is very attractive from the potential revenue and profit generation
side, however, the option is very risky for Dovos given the company’s lack of experience in
operating outside of Canada. This option would be worth pursuing if there were no safer
alternatives or if Dovos had sufficient resources to pursue the strategy without risking negative
impact on the core Canadian business.
Option 3: Service Other Portfolio Managers is a middle of the road option with the second
highest predicted pay off and medium risk. This option has the advantage of generating revenue
fairly quickly and the disadvantage of requiring a capital investment to bring the Portfolio
Managers on board. On the other hand, this option is perpendicular to the core investment
strategy so it is feasible for the company to pursue Option 1 and Option 3 at the same time.

107
6.2 Timeline
This action plan deals with reactive changes (Crossan, Rouse, Fry, & Killing, 2013) and as such,
it can be implemented over a 12 month period with quarterly evaluation points. There are three
major objectives:
Develop a complete retirement based product lineup based around the Low Volatility
High Yield research.
Increase the internal sales force by at least one more junior Portfolio Manager.
Add four more referral partners.
The high level timeline for the next 12 months should be implemented as listed in Table 6-1.
Activity Completed by
Hire a Junior Investment Researcher to take on Core Alpha product and
free up Research Team for new product development 1 month
Create enhanced retirement based product for the SMA channel 3 months
Hire a new Portfolio Manager to focus on growing assets through referral
partners 3 months
Find at least one more referral partner for the Partner Program 3 months
Register the Dovos (OM) funds with Advisors 6 months
Find at least one more referral partner for the Partner Program 6 months
Complete research on the Asset Selector model 9 months
Find at least one more referral partner for the Partner Program 9 months
Enhance the Low Volatility High Yield product to ensure its
competitiveness. 12 months
Table 6-1: Strategic option implementation timeline. Source: Author.

108
Bibliography
Crossan, M. M., Rouse, M. J., Fry, J. N., & Killing, P. J. (2013). Strategic Analysis and Action.
Toronto: Pearson Canada Inc.
Dyer, J. H., Kale, P., & Singh, H. (2004). When to Ally and When to Acquire. Harvard Business
Review, 82(7/8), pp. 108-115.
Ghemawat, P. (2010). Strategy and the Business Landscape. New Jersey: Pearson Education Inc.
Investor Economics. (2012). Managed Money Advisory Service. Toronto: Investor Economics.
McKinsey & Company. (2012). The Asset Management Industry: Outcomes Are the New Alpha.
McKinsey & Company.
McKinsey & Company. (2012). The Hunt for Elusive Growth: Asset Management in 2012.
McKinsey & Company.
Phillips, M. K. (2013). The Future of Asset Management. CFA Institute Magazine, 24(1), pp. 28-
32.
Porter, M. E. (2008). The Five Competitive Forces That Shape Strategy. Harvard Business
Review, 86(1), pp. 78-93.
PriceWaterhouseCoopers. (2010). Top 10 issues facing the Canadian asset management
industry. PriceWaterhouseCoopers.
Schroders Financial Group. (2009). Prices and Performance. Retrieved 02 26, 2013, from
Schroders Brazil: http://www.schroders.com.br
Silk, A. J. (2006). What is Marketing. Boston: Harvard Business School Publishing Corporation.
Statistics Canada. (2010). Population Projections for Canada, Provinces and Territories.
Government of Canada.
World-Stock-Exchanges.net. (2012). Top 10 Stock Exchanges in the world. Retrieved Feb 27,
2013, from World Stock Exchanges: http://www.world-stock-exchanges.net/top10.html

109
Appendix A
Option 1 – Retirement Product

110
Option 2 – Emerging Markets

111
Option 3 – Become a Service Provider to Portfolio Managers