A solid formula
60
A solid formula Experience + Data Quality + Efficient Structure + Disciplined Process = Consistent Returns ANNUAL REPORT 2021
Transcript of A solid formula

A
A solid formula
Experience + Data Quality + Efficient Structure + Disciplined Process = Consistent Returns
ANNUAL REPORT 2021

02 Managing Director’s Review05 Financial Statistics10 About Whitefield12 Our Personnel14 Directors’ Report20 Auditor’s Independence Declaration22 Statement of Comprehensive Income23 Statement of Financial Position24 Statement of Changes in Equity
25 Statement of Cash Flows26 Notes to the Financial Statements41 Directors’ Declaration42 Independent Auditor’s Report46 Table of Investment Holdings51 Details of Shareholders53 Other54 Directory

01
Another year of strong results.
Our solid formula continued to deliver strong outcomes in one of the toughest years in many decades.

02 WHITEFIELD ANNUAL REPORT 2021
Managing Director’s Review_ Angus Gluskie
03
Whitefield’s investment portfolio generated an outright return of 29.6% over the year.
$9.8MNet profit after tax for the year
In the company’s 98th year of operation, Whitefield has maintained its own dividend to shareholders. Over the same period approximately 2/3rds of ASX200 listed companies cut their distributions.
Operating Results
The 2021 financial year to March was heavily influenced by the COVID pandemic. With listed company dividends and distributions cut or deferred by a large number of entities, Whitefield’s net profit after tax fell by 44% to 9,817,521 which equated to earnings per ordinary share of 8.96 cents.
Pleasingly, Australia has been far less affected than many other countries, with significant benefits for the health and safety of the population and for our economy. As the year progressed, we were encouraged to see business and consumer activity rapidly recovering and business profits growing.
Within Whitefield’s investment portfolio stocks maintaining or growing their dividends across the year included JB Hi-Fi, Dominos Pizza, Wesfarmers, Woolworths, Coles, REA, Sonic Healthcare, Magellan Financial and Medibank.
Conversely 64% of companies in which we invest were compelled to cut dividends, the most notable of which were Lend Lease, Scentre Group, Tabcorp, IAG, Cochlear, Treasury Wines, CBA and Ramsay Healthcare.
Investment Outcomes
Whitefield’s investment portfolio generated an outright return of 29.6% over the year.
Some care must be taken in comparing this return against benchmark given the significant volatility in the share market at the start of the COVID pandemic. Whitefield’s portfolio return over the strict 12 months to March is lower than benchmark, however the portfolio outperformed its benchmark over 13 months once the benefits of our investment positioning in March 2020 are included.
The overall outcome for the portfolio is more clearly reflected in the 2 year return with Whitefield’s portfolio returning 8.7%pa, as compared to the ASX200 Industrials Index at 8.4%pa.
Whitefield’s portfolio return of 8.7%pa (2 year) and 8.4%pa (3 year) are not only ahead of its benchmark index over both periods but are strong in comparison to the current official cash rate of 0.1%.
Investment Exposures
Whitefield’s strategy seeks to emphasise investments offering combinations of strong, relatively better or improving quality and earnings while seeking to avoid or limit the portfolio’s exposure to stocks which are relatively more exposed to damage from challenging or declining industry or stock specific conditions.
At year end the company’s portfolio was spread across 142 stocks, containing a diversified suite of approximately 26 overweight and 45 underweight
exposures relative to the company’s benchmark index. More material overweights and underweights being carried into the new financial year include:
– Overweight Exposures to consumer discretionary, consumer staple, industrials and healthcare sectors
– Underweight Exposures to chemicals, technology, property development, infrastructure and general financial sectors.
8.7%pa2 year portfolio return

04 WHITEFIELD ANNUAL REPORT 2021
Net Asset Backing
The net asset backing (before providing for deferred capital gains tax) for each of the company’s ordinary shares amounted to $5.25 at 31 March 2021 compared to $4.25 at the same time one year ago.
Dividend
Whitefield declared and paid an interim dividend of 10.25 cents per Ordinary Share (prior year 10.25 cents) and has declared a final dividend of 10.25 cents per Ordinary share (prior year 10.25). Dividends on WHFPB (convertible resettable preference shares) were also declared in accordance with their terms (201.25 cents per share paid/payable in December 2020 and June 2021). All dividends were fully franked at 30% and were 10% attributable to LIC Discount Capital Gains, entitling eligible holders to a further tax deduction for the associated discount.
Outlook
The emergence of successful COVID vaccines in late 2020 marked a critical point in the battle to control the COVID pandemic. While this development has improved the global ability to reduce and possibly eliminate the viral spread, the course of the pandemic will remain unpredictable for some time.
The potential for the virus to mutate into more or less aggressive forms at any time creates a high degree of background uncertainty. Permanently solving the pandemic is most likely to require high levels of successful vaccination over a succession of years and the ongoing redevelopment and rollout of updated vaccines. A return to normal activity in a vaccinated environment may also require countries to accept a steady but low level
of viral transmission for an extended period – a prospect that appears to be distant from the currently accepted stance in Australasia.
The prospect of periodic lockdowns and a slow, staggered return to international travel appear to be the central expectations held by investment markets at this time.
The Australian economy has adapted rapidly to the COVID environment. Domestic travel consumption has filled the void left by international tourists. Audio-visual communications have become a convenient method for business interaction. Consumer spending has surged as unspent travel dollars are reallocated to other consumer purchases. Inbound and outbound international trade has broadly continued, albeit with some delays.
While most countries have been able to similarly adapt their economies, the healthcare implications, lockdown disruption and lack of international tourism spend have had a far more significant impact in almost all other geographies. Nevertheless, most global economic data continues to reveal both a strengthening in economic activity and growing consumer confidence.
Economically, the most material developments in the last year have been the very large lift in government debt, the lowering of interest rates to negative or negligible levels and the significant expansion of the money supply. These actions have helped countries to survive in a difficult environment.
Less favourably, these actions create a material degree of risk for future years. The abnormally high debt levels of governments, corporations and individuals creates an abnormally high potential for sovereign, corporate or consumer bankruptcies.
Not only do high debt levels reduce the ability to absorb adverse events, but more particularly, economies will be susceptible to future interest rate rises. Should rates rise, debt servicing obligations become harder to satisfy and asset prices that have been driven upwards by falling interest rates should be expected to fall.
While there is much ongoing debate as to timing – we consider it inevitable that rates will rise into a recovery. Accordingly the challenge for governments and financial markets over future years is likely to be maintaining economic stability in the face of rising interest costs and softer asset prices. The likely solutions to managing this environment would be to encourage a small level of wage and cost inflation over an extended period.
Whitefield’s investment process is structured and systematic. We seek to use a consistent process of assessment to distinguish between stocks and sectors that are most and least likely to succeed in the prevailing conditions – whatever those conditions may be - and to align our portfolio accordingly. While today’s environment is both unusual and unpredictable we remain confident that our steady approach will assist us in delivering our shareholders with a cost efficient and risk efficient exposure to Australian shares.
We look forward to reporting on our outcomes as the 2021/22 financial year progresses.
Angus GluskieMANAGING DIRECTOR AND CHAIRMAN
2021 represents the 31st consecutive year in which Whitefield has maintained or increased its ordinary share dividend.

05
EARNINGS AND DIVIDENDS PER ORDINARY SHARE
ORDINARY SHARE DIVIDEND YIELDAS % OF START OF YEAR SHARE PRICE
Dividends per Ordinary Share
Earnings per Ordinary Share
Net Yield
Gross Yield
RBA Cash Rate
0.0
2.0
4.0
6.0
8.0
10.0
12.0
14.0
16.0
18.0
20.0
22.0
1970
1972
1974
1976
1978
1980
1982
1984
1986
1988
1990
1992
1994
1996
1998
2000
2002
2004
2006
2008
2010
2012
2014
2016
2018
2020
Cen
ts
0.0%
1.0%
2.0%
3.0%
4.0%
5.0%
6.0%
7.0%
8.0%
9.0%
10.0%
2012 2013 2014 2015 2016 2017 2018 2019 2020 2021
Financial statistics

06 WHITEFIELD ANNUAL REPORT 2021
WHITEFIELD PERFORMANCE 35 YEARS
WHITEFIELD PERFORMANCE DATA
RETURNS TO 31 MARCH 2021 1 YR 3 YR PA 5 YR PA 10 YR PA 20 YR PA
BEFORE TAX RETURNS
Whitefield Portfolio1 29.64% 8.69% 8.42% 8.15% 8.06%
S&P/ASX 200 Industrials Accumulation 33.66% 8.44% 8.41% 8.31% 8.22%
Outperformance (4.02%) 0.25% 0.01% (0.17%) (0.16%)
AFTER COMPANY TAX RETURNS2
WHF Pre-Deferred Tax NTA (inc dividends) 29.15% 7.58% 7.17% 7.03% 6.77%
WHF Post-Deferred Tax NTA (inc dividends) 22.15% 6.70% 6.73% 6.59% 6.89%
WHF Share Price (inc dividends) 32.28% 14.17% 9.48% 8.78% 8.05%
1 Portfolio return before company tax and expenses.
2 Returns after expenses and company tax.
500
1,000
1,500
2,000
2,500
3,000
3,500
4,000
4,500
0
1986
1987
1988
1989
1990
1991
1992
1993
1994
1995
1996
1997
1998
1999
2000
2001
2002
2003
2004
2005
2006
2007
2008
2009
2010
2011
2012
2013
2014
2015
2016
2017
2018
2019
2020
2021
S&P/ASX 200 Accumulation
WHF Share Price & Dividends Accumulation
Benchmark Accum [S&P/ASX 200 to 2003 and S&P/ASX 200 Industrials Since]
WHF Portfolio Accumulation

07
CONTRIBUTIONYEAR TO 31 MARCH 2021
TOP CONTRIBUTORS TO PORTFOLIO PERFORMANCE 1 YEAR*
TOP PERFORMANCE ATTRIBUTION BASIS 1YR**
TOP DETRACTORS TO PORTFOLIO PERFORMANCE 1 YEAR*
BOTTOM PERFORMANCE ATTRIBUTION BASIS 1YR**
1. Commonwealth Bank of Australia 3.67%2. ANZ Banking Group 2.48%3. National Australia Bank Limited 2.34%4. Westpac Banking Corporation 2.15%5. Wesfarmers Ltd 2.12%
1. Charter Hall Group Ltd 0.24%2. Platinum Asset Management 0.19%3. Premier Investments 0.13%4. Pro Medicus Ltd 0.12%5. Stockland Group 0.12%
1. CSL Ltd (0.68%)2. A2 Milk Co Ltd (0.44%)3. AGL Energy (0.38%)4. Insurance Aust Group Ltd (0.21%)5. Service Stream Ltd (0.07%)
1. Afterpay Ltd (0.47%)2. Boral Ltd (0.22%)3. Aurizon Ltd (0.21%)4. AGL Energy (0.19%)5. Seek Ltd (0.16%)
ATTRIBUTIONYEAR TO 31 MARCH 2021
WHITEFIELD INVESTMENT RETURNS31 MARCH 2021
WHITEFIELD INVESTMENT OUTERPERFORMANCEWHF PORTFOLIO VS BENCHMARK INDEX XJIAI
-15%
-5%
5%
15%
25%
35%
45%
1 Yr 3 Yr pa 5 Yr pa 10 Yr pa 20 Yr pa
-4.5%-4.0%-3.5%-3.0%-2.5%-2.0%-1.5%-1.0%
-0.5%0.0%0.5%
1 Yr
2 Yr pa
3 Yr pa
5 Yr pa
20 Yr pa
Whitefield Portfolio S&P/ASX 200 Industrials Accumulation
* Portfolio Weight x Stock Return ** (Portfolio Weight – Benchmark Weight) x Stock Return

08 WHITEFIELD ANNUAL REPORT 2021
WHITEFIELD PORTFOLIO STATISTICSAS AT 31 MARCH 2021
WHITEFIELD PORTFOLIO EXPOSURES31 MARCH 2021
SECTORTOTAL
EXPOSURERELATIVE TO BENCHMARK
NO. OF OVERWEIGHT AND UNDERWEIGHT POSITIONS
Banks 27.91% (0.05%) 6
Health Care 12.89% 0.33% 9
Consumer Discretionary 12.06% 2.19% 12
Non Bank Financials 9.40% (0.54%) 13
Industrials 7.86% (0.67%) 9
Real Estate 7.60% (0.78%) 7
Consumer Staple 7.50% 0.42% 5
Communication Services 6.17% 1.00% 5
Information Technology 3.99% (1.02%) 12
Materials 2.60% (1.35%) 9
Utilities 2.02% 0.37% 1
100.00% 0.00% 88
Cash & Equivalents 1.07%
Convertible Resettable Preference Share (Liability) (6.13%)
0.0%
5.0%
10.0%
15.0%
20.0%
25.0%
30.0%
Ban
ks
Hea
lthC
are
Con
sum
erD
iscr
etio
nary
Non
Ban
kFi
nanc
ials
Indu
stria
ls
Real
Esta
te
Con
sum
er
Stap
le
Com
mun
icat
ion
Serv
ices
Info
rmat
ion
Tech
nolo
gy
Mat
eria
ls
Util
ities
-3.0%
-2.0%
-1.0%
0.0%
1.0%
2.0%
3.0%
Ban
ks
Hea
lthC
are
Con
sum
erD
iscr
etio
nary
Non
Ban
kFi
nanc
ials
Indu
stria
ls
Real
Esta
te
Con
sum
er
Stap
le
Com
mun
icat
ion
Serv
ices
Info
rmat
ion
Tech
nolo
gy
Mat
eria
ls
Util
ities
Total Exposure
Relative to Benchmark

09
20 YEAR HISTORY
YEAR ENDED
ORDINARY SHARES ISSUED
CAPITAL RAISED
8% PREFERENCE
SHARES ON ISSUE
CONVERTIBLE RESETTABLE
PREFERENCE SHARES
ON ISSUE
ORDINARY SHARES
ON ISSUE
OPERATING PROFIT
AFTER TAX
DIVIDENDS ON ORD & PREF
SHARES
ORDINARY & 8% PREFERENCE
SHAREHOLDERS' EQUITY
DIVIDENDS PER
ORDINARY SHARE
EARNINGS PER
ORDINARY SHARE
NTA AFTER TAX PER
ORDINARY SHARE
$ $ $ $ CPS CPS $
2021 DRP, BSP, SPP
16,105,970 23,790 321,386 96,298,506 9,817,521 19,583,701 458,214,952 20.50 8.96 4.76
2020 DRP, BSP 2,090,295 23,790 321,386 92,411,570 17,660,984 19,229,055 377,268,544 20.50 17.76 4.08
2019 DRP, BSP, SPP 18,950,484 23,790 321,386 91,841,004 19,406,158 18,046,607 419,939,228 19.75 19.26 4.57
2018 DRP, BSP, SPP 14,605,036 23,790 400,000 87,254,548 18,104,054 17,041,174 389,783,092 17.75 17.79 4.47
2017 DRP, BSP, SPP 13,230,714 23,790 400,000 83,808,193 16,828,677 15,403,600 389,450,754 17.00 16.90 4.65
2016 DRP, BSP, SPP 14,708,886 23,790 400,000 80,208,773 15,998,884 14,088,714 342,464,700 17.00 16.60 4.27
2015 DRP 1,083,190 23,790 400,000 76,467,723 15,502,722 15,763,201 359,678,893 17.00 16.69 4.70
2014 DRP 929,742 23,790 400,000 76,196,891 14,436,286 15,370,839 317,019,745 17.00 15.75 4.16
2013 DRP, CRPS Issue 29,772,389 23,790 300,000 75,938,622 12,328,821 14,968,685 289,587,611 17.00 13.49 3.81
2012 DRP, Merger 45,214,414 23,790 - 75,596,171 12,299,489 7,807,119 247,793,379 8.50 14.58 3.28
2011 DRP, SPP, Buy-Back (12,411,338) 23,790 - 61,176,470 8,518,170 15,749,249 206,452,551 25.50 13.77 3.37
2010 DRP, Buy-Back (3,758,754) 23,790 - 65,193,933 8,120,642 11,229,188 237,242,675 17.00 12.26 3.64
2009 DRP, Buy-Back (11,021,158) 23,790 - 66,323,391 11,864,370 11,410,021 196,414,691 17.00 18.37 2.96
2008 DRP, SPP, Placement 45,858,006 23,790 - 70,192,733 11,981,188 11,043,079 276,278,441 16.10 18.12 3.94
2007 DRP, SPP, Placement 38,837,006 23,790 - 60,263,443 8,518,559 7,952,691 284,597,452 15.70 16.05 4.72
2006 DRP, SPP 13,187,620 23,790 - 51,236,819 7,873,034 6,805,255 207,894,752 14.90 15.28 4.06
2005 1:8 Rights, DRP 14,318,181 23,790 - 47,496,613 6,467,049 5,499,662 167,544,179 13.80 14.51 3.53
2004 1:10 Rights, DRP,
Public Issue 13,564,135 23,790 - 42,555,648 4,984,418 4,967,050 135,419,974 12.60 12.04 3.18
2003 - - 23,790 - 37,630,226 4,524,517 2,371,655 107,228,234 12.60 11.71 2.85
2002 - - 23,790 - 37,630,226 4,296,005 4,743,311 123,252,523 12.60 11.12 3.27
Note: Shareholders’ Equity included the unrealised market value of publicly listed shares and notes in Australian companies and Trusts, less tax which would be payable on realisation of all investments and the estimated cost of such realisation. Operating Profit in this summary excludes gains or losses arising from the sale of investments. Per share calculations have been adjusted for bonus issues where appropriate.

10 WHITEFIELD ANNUAL REPORT 2021
WHITEFIELD, DELIVERING VALUE TO SHAREHOLDERS SINCE 1923 Whitefield Ltd is an ASX listed investment company holding a diversified portfolio of ASX listed Industrial (non-resource) shares. An investment in WHF Ordinary shares provides an investor with a stream of fully franked dividends as well as the potential to benefit from growth in the underlying value of the investment portfolio over time. The company was founded and listed on ASX in 1923.
OUR STRATEGYSensible investment decisions require the right information to be collected, assessed and compared. At Whitefield we seek to access, assess and compare the right information across a wide range of stocks through our quantitative investment framework.
Our assessment process identifies stocks which we consider are likely to be most and least successful over our investment time-horizon based a matrix of over 60 key characteristics.
Our structured index-enhanced approach to portfolio construction allows us to emphasise or de-emphasise stocks to provide our investors with a highly diversified portfolio that offers the potential to deliver returns in line with our key objectives without exposing our investors to undue risk.
OUR PROCESSAt the heart of our process lies the research and development undertaken over many years by our investment team in determining the systematic sources of mispricing in investment markets that align best with our investor objectives and the most reliable quantitative methods to identify this in stocks.
We highlight the following important value-additive areas within our framework:
(a) An emphasis on the influences of human behavioural bias on investment markets which assists in understanding and predicting stock returns
(b) Our cleansing, customisation and vetting of underlying data and its quality
(c) Our customisation, depth and breadth of the factors through which we assess and rate stocks
About Whitefield

WHITEFIELD LTD FACT SHEET
RETURN OBJECTIVEReliable stream of fully franked income;
Risk adjusted return higher than average of peer group1; and
Portfolio return 0-100 basis points above the Benchmark over rolling five year periods
RISK OBJECTIVEA low degree of variation against benchmark (Target 0.7% - 1.0% Tracking Error)
ASSET ALLOCATIONLong-only, fully invested other than cash held for corporate and short term investment purposes
BENCHMARKS&P/ASX200 Industrials Accumulation (XJIAI)
INVESTMENT STYLEStyle agnostic, enhanced index
1 Bell Potter diversified Large Cap Aust Equities Listed Investment Companies and Trusts.
GEARING5% at Mar 2021
DIVIDEND POLICYAim to pay ordinary dividends approximately equal to underlying earnings and average long term realised gains
TAX STATUSLIC Capital Gains Discount status applicable on a majority of the portfolio
MANAGER White Funds Management Pty Ltd
MANAGEMENT FEE0.25% per annum
OTHER OPERATING EXPENSESApproximately 0.15% per annum (based on FY 2021)
11

12 WHITEFIELD ANNUAL REPORT 2021
Our Personnel & Operating StructureWhitefield’s Board have a depth of experience in finance, markets, corporate governance and the listed investment industry. Our investment management personnel are highly qualified, and have significant experience in wholesale investment management and longevity of service working with Whitefield.
NON EXECUTIVE DIRECTORS
LANCE JENKINS
(LLB, BCA (Vic), MBA (New York))
Lance has over 20 years of financial markets experience. He has held senior roles with Goldman Sachs JBWere in New York, was CEO and Managing Director of Goldman Sachs JBWere New Zealand, Head of Cash Equities at the Commonwealth Bank of Australia and was an Executive Director of Waterman Capital. He is a past director of Partners Life, Spicers Financial (an AMP subsidiary) and the MFB Group. He is currently an Executive Director of CCA Capital and a Non-Executive Director of BePure Health Limited.
MARK BEARDOW
(B.Ec, CFA, Cert Management MGSM)
Mark has over 25 years experience in investment management and financial markets. He has worked with JPMorgan, UBS and served as Chief Investment Officer Global Equities and Fixed Income for AMP Capital. He is currently a principal of the Darling Macro Fund.
JENELLE WEBSTER
(B.Com, CA, Registered Company Auditor, IIAA, GIAA.)
Jenelle has over 20 years’ experience in audit, accounting and financial services. She has worked with Price Waterhouse Coopers, Moore Stephens Australia and Ernst & Young. She is currently the Chief Financial Officer of St. Vincents Private Hospital Sydney.
Our personnel

13
SENIOR EXECUTIVE PERSONNEL
ANGUS GLUSKIE
MANAGING DIRECTOR & CHAIRMAN
(BEc, Graduate Diploma in Applied Finance & Investment, CA, FFin)
Angus has over 30 years’ experience in the investment management and financial services fields. He has qualifications in investment management, economics and chartered accountancy. He has worked with Whitefield and associated entities since 1987.
WILL SEDDON
EXECUTIVE DIRECTOR
(BEc, CFA, CAIA, SAFin)
Will has over 17 years’ experience as a wholesale investment manager and analyst, including more than a decade working with Whitefield. He has significant experience in fundamental analysis, investment strategy and quantitative techniques.
PETER BORKOVEC
(MCom (Funds Management), BBus)
Peter has over 17 years’ experience in wholesale funds management, including more than a decade working with Whitefield. He has significant experience in fundamental analysis, investment strategy, statistics and quantitative techniques.
STUART MADELEY
COMPANY SECRETARY
(BA(hons) Pure Maths, MBA)
Stuart has over 25 years’ experience in financial services and funds management, including more than 17 years’ with Whitefield. He has significant experience in investment operations and information technology systems.

14 WHITEFIELD ANNUAL REPORT 2021
Directors
The following persons were Directors of Whitefield Limited during the financial year and up to the date of this report:
Angus J. Gluskie
William R. Seddon
Lance W. Jenkins
Mark A. Beardow
Jenelle B. Webster
Directors have been in office since the start of the financial year to the date of this report unless otherwise stated.
Principal activities
During the year, the principal activity of the Company was investing in companies and trusts listed on the Australian Securities Exchange.
There was no significant change in the nature of the activity of the Company during the year.
In addition to the above dividends, since the end of the financial year the Directors have announced:
(a) A final ordinary dividend of 10.25 cents per fully paid share (2020: 10.25 cents per fully paid share), and a final dividend on 8% preference shares of 4.0 cents per 8% preference share (2020: 4.0 cents per 8% preference share) to be paid on 11 June 2021 out of retained earnings at 31 March 2021;
(b) A six-monthly dividend on Convertible Resettable Preference Shares of 201.25 cents per convertible resettable preference share (2020: 201.25 cents per convertible resettable preference share) to be paid on 11 June 2021.
Review of operations and financial position
Information on the operations and financial position of the Company and its business strategies and prospects are set out in the Managing Director’s review.
The profit from ordinary activities after income tax amounted to $9,817,521 (2020: $17,660,984). The Company recorded a total comprehensive income amounting to $84,406,985 after taking account of a net revaluation after tax on investments (2020: total comprehensive loss of $25,525,647).
Net asset backing per ordinary share at 31 March 2021 amounted to $5.25 (2020: $4.25) before deferred tax and $4.76 (2020: $4.08) after deferred tax, while net assets amounted to $458,204,074 (2020: $377,274,821).
Dividends
Dividends paid to members since the end of the previous financial year were as follows:
2020DIVIDEND
RATETOTAL
AMOUNTDATE OF
PAYMENT%
FRANKED
8% Preference shares – interim 4.0 cps $951 11/12/2020 100
Ordinary shares – interim 10.25 cps $9,343,318 11/12/2020 100
Convertible Resettable Preference Shares – Six-Monthly 201.25 cps $646,789 11/12/2020 100
2019
8% Preference shares – final 4.0 cps $951 12/06/2020 100
Ordinary shares – final 10.25 cps $8,944,903 12/06/2020 100
Convertible Resettable Preference Shares – Six-Monthly 201.25 cps $646,789 12/06/2020 100
Your Directors present their report on the Company for the year ended 31 March 2021.
Directors’ Report

15
Significant changes in the state of affairs
The ebb and flow of the global COVID pandemic has had, and may continue to have, a significant influence on the earnings, dividends and value of listed companies in which Whitefield invests.
Within the year to March 2021, the value of the company’s investment portfolio rose materially (having fallen in the prior financial year), while dividends and distributions paid on our investment holdings were materially lower.
With the pandemic ongoing, the outlook for the earnings, dividends and value of the listed companies in which Whitefield invests may carry greater uncertainty than normal.
Apart from the fall in income and the large rise in the value of investment noted, there have been no other significant changes in the state of affairs of the Company during the period.
Matters subsequent to the end of the financial year
Apart from the dividends paid after year end, and the ongoing uncertainty of outlook arising from the COVID pandemic, no other matter or circumstance has arisen since 31 March 2021 that has significantly affected, or may significantly affect, the operations of the Company, the results of those operations or the state of affairs of the Company in subsequent financial years.
Likely developments and expected results of operationsFurther comments on the outlook for the Company are included in the Managing Director’s Review.
Environmental regulation
The Company is not affected by any significant environmental regulation in respect of its operations.
To the extent that any environmental regulations may have an incidental impact on the Company’s operations, the Directors of the Company are not aware of any breach by the Company of those regulations.

16 WHITEFIELD ANNUAL REPORT 2021
ANGUS J. GLUSKIE
MANAGING DIRECTOR & INTERIM CHAIRMAN
Experience and expertiseAngus was appointed Chief Executive Officer of Whitefield Limited in 1996 and was appointed as a Director in 2003. Angus has over 30 years experience in the fields of funds management and financial services. Angus is a member of the Institute of Chartered Accountants and a Fellow of the Financial Services Institute of Australasia, and holds a Bachelor of Economics and a Graduate Diploma in Applied Finance & Investment.
Other current directorshipsManaging Director of White Funds Management Pty Ltd and Director Listed Investment Companies & Trusts Association Ltd
Former directorships in last 3 yearsNone
Special responsibilitiesManaging Director and Chairman, Member of Nomination Committee, Investment Manager
Interests in shares and options17,678,345 Ordinary Shares 200 8% Preference Shares
WILLIAM R. SEDDON
EXECUTIVE DIRECTOR (appointed 15 May 2017)
Experience and expertise Will has 17 years experience as a wholesale investment manager and analyst, including more than a decade working with Whitefield. He has significant experience in the field of funds management. Will holds a Bachelor of Economics, is a Chartered Financial Analyst, a Senior Associate of the Financial Services Institute of Australasia and a Chartered Alternative Investment Analyst.
Other current directorshipsDirector of White Funds Management Pty Ltd
Former directorships in last 3 yearsNone
Special responsibilitiesMember of Nomination Committee, Investment Manager
Interests in shares and options85,382 Ordinary Shares
LANCE W. JENKINS
INDEPENDENT AND NON-EXECUTIVE DIRECTOR (appointed 31 May 2017)
Experience and expertiseLance has over 20 years of financial markets experience. He has held senior roles with Goldman Sachs JBWere in New York, was CEO and Managing Director of Goldman Sachs JBWere New Zealand, and Head of Cash Equities at the Commonwealth Bank of Australia in Sydney.
Other current directorshipsDirector of CCA Capital Ltd and BePure Health Ltd
Former directorships in last 3 yearsPast director of Spicers Portfolio Management (NZ) Ltd, Partners Life Ltd, My Food Bag Ltd and Waterman Capital Ltd
Special responsibilitiesMember of Audit, Nomination and Remuneration Committees
Interests in shares and options143,447 Ordinary Shares
INFORMATION ON DIRECTORS
Directors’ Report (cont.)

17
MARK A. BEARDOW
INDEPENDENT AND NON-EXECUTIVE DIRECTOR (appointed 13 December 2017)
Experience and expertiseMark has over 25 years experience in investment management and financial markets. He has worked with JP Morgan, UBS and served as Chief Investment Officer Global Equities and Fixed Income for AMP Capital. He is currently a principal of the Darling Macro Fund.
Other current directorships347 Daily Pty Ltd and Fulham Park Gardens Pty Ltd
Former directorships in last 3 yearsPast director of Quay 62 Pty Ltd, National Mutual Funds Management Ltd, AMP CMBS No.1 Pty Ltd and AMP CMBS No.2 Pty Ltd
Special responsibilitiesMember of Audit, Nomination and Remuneration Committees
Interests in shares and options31,709 Ordinary Shares
JENELLE B. WEBSTER
INDEPENDENT AND NON-EXECUTIVE DIRECTOR (appointed 16 September 2018)
Experience and expertiseJenelle has over 20 years financial accounting and reporting experience. She has previously worked with Price Waterhouse Coopers, Moore Stephens Australia and Ernst & Young. She is currently working in finance and operational efficiency at St Vincent’s Health.
Other current directorshipsDirector of Cadence Capital Ltd
Former directorships in last 3 yearsNone
Special responsibilitiesMember of Audit, Nomination and Remuneration Committees
Interests in shares and options15,000 Ordinary Shares
The Company Secretary is Stuart Madeley
The Company Secretary is Stuart Madeley. Stuart has been Company Secretary since 2014. Stuart has over 25 years experience in the financial services industry in both Australia and the United Kingdom. Stuart has been involved in the executive management of the Company since 2005.
COMPANY SECRETARY

18 WHITEFIELD ANNUAL REPORT 2021
Remuneration Report
This report details the nature and amount of remuneration for each Director and Key Management Person of Whitefield Limited in accordance with the Corporations Act 2001.
Remuneration PolicyThe Board and Remuneration Committee determine the remuneration structure of Non-Executive Directors having regard to the scope of the Company’s operations and other relevant factors including the frequency of Board meetings. The Board makes a recommendation to shareholders as to the level of Non-Executive Directors remuneration which is then put to shareholders at the Annual General Meeting for approval should the aggregate remuneration be subject to an increase.
The Company pays no direct remuneration to the Executive Directors and Company Secretary. Mr Angus J. Gluskie, Mr William R. Seddon and Mr. Stuart A. Madeley are officers and/or shareholders of White Funds Management Pty Ltd.
White Funds Management Pty Ltd is contracted by the Company as the Investment Manager and receives fees for service on normal commercial terms and conditions.
As the Company does not pay performance fees, nor provide share or option schemes to Directors and executives, remuneration of Executives and Non-executives is not explicitly linked to the Company’s performance. Notwithstanding this, Board members and Company executives are subject to ongoing performance monitoring and regular performance reviews.
Details of remunerationThe following tables show details of remuneration for Directors and key management personnel of the Company for the current and previous financial year.
Meetings of Directors
The numbers of meetings of the Company’s board of Directors and of each board committee held during the year ended 31 March 2021, and the numbers of meetings attended by each Director were:
FULL MEETING OF DIRECTORS
MEETINGS OF AUDIT COMMITTEE
MEETINGS OF NOMINATION
COMMITTEE
MEETINGS OFREMUNERATION
COMMITTEE
HELD ATTENDED HELD ATTENDED HELD ATTENDED HELD ATTENDED
Angus J. Gluskie 4 4 - - 1 1 - -
William R. Seddon 4 3 - - 1 1 - -
Lance W. Jenkins 4 4 4 4 1 1 1 1
Mark A. Beardow 4 4 4 4 1 1 1 1
Jenelle B. Webster 4 4 4 4 1 1 1 1
2021SHORT-TERM EMPLOYEE
BENEFITSPOST-EMPLOYMENT
BENEFITS
NAME
CASH SALARYAND FEES
$OTHER
$
SUPER ANNUATION
$TOTAL
$
Non-executive Directors
Lance W. Jenkins 15,525 - 1,475 17,000
Mark A. Beardow 15,525 - 1,475 17,000
Jenelle B. Webster 15,525 - 1,475 17,000
Sub-total Non-executive Directors 46,575 - 4,425 51,000
Executive Directors and Company Secretary
Angus J. Gluskie* - - - -
William R. Seddon* - - - -
Stuart A. Madeley* - - - -
Sub-total Executive Directors and Company Secretary - - - -
Total key management personnel compensation 46,575 - 4,425 51,000
Directors’ Report (cont.)

19
Shares under option
No options are on issue.
Insurance and indemnification of officers and auditors
During the financial year, the Company paid a premium in respect of a contract insuring the Directors of the Company, the Company Secretary and any related body corporate against liability incurred as such by a Director or Secretary to the extent permitted by the Corporations Act 2001. The contract of insurance prohibits disclosure of the nature of the liability and the amount of the premium.
No indemnities have been given or insurance premiums paid during or since the end of the financial year, for any person who is or has been an auditor of the Company.
Proceedings on behalf of the Company
No person has applied to the Court under section 237 of the Corporations Act 2001 for leave to bring proceedings on behalf of the Company, or to intervene in any proceedings to which the Company is a party, for the purpose of taking responsibility on behalf of the Company for all or part of those proceedings.
No proceedings have been brought or intervened in on behalf of the Company with leave of the Court under section 237 of the Corporations Act 2001.
Corporate Governance Statement
The Company’s Corporate Governance Statement for the year ended 31 March 2021 can be found at the Company’s website www.whitefield.com.au.
Non-audit services
No non-audit services were performed by the auditors during the year ended 31 March 2021.
Details of the amounts paid to the auditors and their related parties are disclosed in Note 16 to the Financial Statements.
Auditor’s independence declaration
A copy of the auditor’s independence declaration as required under section 307C of the Corporations Act 2001 is set out on page 20.
This report is made in accordance with a resolution of Directors.
Angus GluskieDIRECTOR
Sydney 19 May 2021
* Mr Angus J. Gluskie, Mr William R. Seddon and Mr Stuart A. Madeley received no fees as individuals. All three are officers and/or shareholders of White Funds Management Pty Ltd. During the year, White Funds Management Pty Ltd was entitled to fees of $1,397,188 (2020: $1,508,628) inclusive of 10% GST for the management of the Company, out of which costs of corporate and investment management are paid.
2020SHORT-TERM EMPLOYEE
BENEFITSPOST-EMPLOYMENT
BENEFITS
NAME
CASH SALARYAND FEES
$OTHER
$
SUPER ANNUATION
$TOTAL
$
Non-executive Directors
Lance W. Jenkins 15,525 - 1,475 17,000
Mark A. Beardow 15,525 - 1,475 17,000
Jenelle B. Webster 15,525 - 1,475 17,000
Sub-total Non-executive Directors 46,575 - 4,425 51,000
Executive Directors and Company Secretary
Angus J. Gluskie* - - - -
William R. Seddon* - - - -
Stuart A. Madeley* - - - -
Sub-total Executive Directors and Company Secretary - - - -
Total key management personnel compensation 46,575 - 4,425 51,000

20 WHITEFIELD ANNUAL REPORT 2021
Auditor’s Independence DeclarationWhitefield Limited ABN 50 000 012 895
I declare that, to the best of my knowledge and belief, during the year ended 31 March 2021 there have been no contraventions of:
i. the auditor independence requirements as set out in the Corporations Act 2001 in relation to the audit; and
ii. any applicable code of professional conduct in relation to the audit.
MNSA Pty Ltd
Sam Danieli DIRECTOR
Sydney Dated this 19th of May 2021

21
Financial statementsAs at 31 March 2021
22 Statement of Comprehensive Income23 Statement of Financial Position24 Statement of Changes in Equity25 Statement of Cash Flows26 Notes to the Financial Statements41 Directors’ Declaration42 Independent Auditor’s Report46 Table of Investment Holdings51 Details of Shareholders53 Other54 Directory

22 WHITEFIELD ANNUAL REPORT 2021
Statement of Comprehensive IncomeFor the year ended 31 March 2021
2021 2020NOTES $ $
INVESTMENT INCOME FROM ORDINARY ACTIVITIES 4 12,749,053 21,085,894
Expenses
Management fees (1,302,073) (1,405,767)
Directors’ fees (51,000) (51,000)
Registry fees (180,513) (155,082)
Administration fees (163,984) (171,928)
ASX fees (90,905) (87,712)
Legal fees (54,676) (1,084)
Audit fees (29,418) (27,729)
Other expenses (259,242) (260,186)
Finance costs – Convertible Resettable Preference Shares (241,212) (239,429)
Operating result before income tax 10,376,030 18,685,977
Income tax expense 5 (558,509) (1,024,993)
Profit for the year 9,817,521 17,660,984
Other comprehensive income/(loss)
Items that may not be reclassified to profit or loss
Net unrealised gains/(losses) on investments taken to equity 101,952,985 (53,824,595)
Income tax relating to net unrealised (losses)/gains on investments taken to equity (33,222,201) 18,107,335
Net realised gains/(losses) on investments taken to equity 4,828,908 (7,492,920)
Income tax relating to net realised losses on investments taken to equity 1,029,772 23,549
Other comprehensive income/(loss) for the year, net of tax 74,589,464 (43,186,631)
Total comprehensive income/(loss) for the year 84,406,985 (25,525,647)
Cents Cents
Earnings per share from continuing operations attributable to the ordinary equity holders of the Company (excluding all net realised gains/losses on investments)
Basic earnings per share 22 8.96 17.76
Diluted earnings per share 22 8.96 17.76
Earnings per share from continuing operations attributable to the ordinary equity holders of the Company (excluding all net realised gains/losses on investments and excluding gain on reset/conversion of Convertible Resettable Preference Shares)Basic earnings per share 22 8.96 17.76
Diluted earnings per share 22 8.96 17.76
The above Statement of Comprehensive Income should be read in conjunction with the accompanying notes.

23
2021 2020NOTES $ $
ASSETS
Current assets
Cash and cash equivalents 6 6,042,282 52,145,584
Trade and other receivables 7 1,470,079 1,231,417
Current tax receivables - 525,472
Other current assets 21,148 20,576
Total current assets 7,533,509 53,923,049
Non-current assets
Financial assets at fair value through other comprehensive income 3, 8 532,241,494 372,379,332
Deferred tax assets 9 7,826,025 6,700,573
Total non-current assets 540,067,519 379,079,905
Total assets 547,601,028 433,002,954
LIABILITIES
Current liabilities
Trade and other payables 495,553 325,646
Dividends payable 431,193 431,193
Current tax liabilities 202,190 -
Other financial liabilities 10 32,637,157 -
Total current liabilities 33,766,093 756,839
Non-current liabilities
Other financial liabilities 10 - 32,402,573
Deferred tax liabilities 11 55,630,861 22,568,721
Total non-current liabilities 55,630,861 54,971,294
Total liabilities 89,396,954 55,728,133
Net assets 458,204,074 377,274,821
EQUITY
Issued capital 12 257,440,453 241,334,483
Reserves 13 154,541,536 81,910,460
Retained earnings 46,222,085 54,029,878
Total equity 458,204,074 377,274,821
The above Statement of Financial Position should be read in conjunction with the accompanying notes.
Statement of Financial PositionAs at 31 March 2021

24 WHITEFIELD ANNUAL REPORT 2021
Statement of Changes in EquityFor the year ended 31 March 2021
ISSUED CAPITAL
$RESERVES
$
RETAINED EARNINGS
TOTALEQUITY
NOTES $ $
BALANCE AT 1 APRIL 2019 239,244,188 135,654,753 45,040,287 419,939,228
Profit for the year - - 17,660,984 17,660,984
Other comprehensive loss for the year
Net unrealised losses on investments taken to equity - (53,824,595) - (53,824,595)
Income tax on net unrealised losses on investments taken to equity - 18,107,335 - 18,107,335
Net realised losses on investments taken to equity - (7,492,920) - (7,492,920)
Income tax on net realised losses on investments taken to equity - 23,549 - 23,549
Total other comprehensive loss for the year, net of tax - (43,186,631) - (43,186,631)
Total comprehensive loss for the year - (43,186,631) 17,660,984 (25,525,647)Transactions with owners in their capacity as owners:
Contributions of equity, net of transaction costs and tax 2,090,295 - - 2,090,295
Dividends provided for or paid 14 - (10,557,662) (8,671,393) (19,229,055)
2,090,295 (10,557,662) (8,671,393) (17,138,760)
Balance at 31 March 2020 241,334,483 81,910,460 54,029,878 377,274,821
BALANCE AT 1 APRIL 2020 241,334,483 81,910,460 54,029,878 377,274,821
Profit for the year - - 9,817,521 9,817,521
Other comprehensive income for the year
Net unrealised gains on investments taken to equity - 101,952,985 - 101,952,985
Income tax on net unrealised losses on investments taken to equity
- (33,222,201) - (33,222,201)
Net realised gains on investments taken to equity - 4,828,908 - 4,828,908
Income tax on net realised losses on investments taken to equity - 1,029,772 - 1,029,772
Total other comprehensive income for the year, net of tax - 74,589,464 - 74,589,464
Total comprehensive income for the year - 74,589,464 9,817,521 84,406,985Transactions with owners in their capacity as owners:
Contributions of equity, net of transaction costs and tax 16,105,970 - - 16,105,970
Dividends provided for or paid 14 - (1,958,388) (17,625,314) (19,583,702)16,105,970 (1,958,388) (17,625,314) (3,477,732)
Balance at 31 March 2021 257,440,453 154,541,536 46,222,085 458,204,074
The above Statement of Changes in Equity should be read in conjunction with the accompanying notes.

25
Statement of Cash FlowsFor the year ended 31 March 2021
2021 2020NOTES $ $
Cash flows from operating activities
Dividends and trust distributions received 12,433,847 22,136,827
Interest received 43,890 127,386
Other income received 23,520 14,100
Payments for other expenses (2,226,375) (1,958,779)
Income taxes paid (53,428) 2,149,518
Net cash inflow from operating activities 20 10,221,454 22,469,052
Cash flows from investing activities
Proceeds from sale of financial assets at fair value through other comprehensive income 167,420,093 248,140,207
Payments for financial assets at fair value through other comprehensive income (220,227,329) (207,805,440)
Net cash (outflow)/inflow from investing activities (52,807,236) 40,334,767
Cash flows from financing activities
Proceeds from issues of shares under share purchase plan 14,035,000 -
Share issue transaction costs (132,627) (15,143)
Dividends paid to Company's shareholders (16,126,315) (15,834,582)
Dividends paid on convertible resettable preference shares (1,293,578) (1,293,578)
Net cash (outflow) from financing activities (3,517,520) (17,143,303)
Net (decrease)/increase in cash and cash equivalents (46,103,302) 45,660,516
Cash and cash equivalents at the beginning of the year 52,145,584 6,485,068
Cash and cash equivalents at the end of year 6 6,042,282 52,145,584
The above Statement of Cash Flows should be read in conjunction with the accompanying notes.

26 WHITEFIELD ANNUAL REPORT 2021
Notes to the Financial StatementsFor the year ended 31 March 2021
1. General informationWhitefield Limited (the “Company”) is a listed public company domiciled in Australia. The address of Whitefield Limited’s registered office is Suite 16.01 Level 16, 68 Pitt Street, Sydney, NSW, 2000. The financial statements of Whitefield Limited are for the year ended 31 March 2021. The Company is primarily involved in making investments, and deriving revenue and investment income from listed securities and unit trusts in Australia.
2. Financial risk managementThe Company’s activities expose it to a variety of financial risks: market risk (including interest rate risk and price risk), credit risk and liquidity risk. The Company uses different methods to measure different types of risk to which it is exposed. These methods include sensitivity analysis in the case of market risks, and ratings agency analysis for credit risk.
(a) Market riskAASB 7 Financial Instruments: Disclosures defines this as the risk that the fair value or future cash flows of a financial instrument will fluctuate because of changes in market prices.
(i) Price risk
The Company is exposed to equity securities price risk. This arises from investments held by the Company and classified in the Statement of Financial Position as financial assets at fair value through other comprehensive income.
The Company’s investment portfolio is spread across the following sectors:
SECTOR 2021 2020(%) (%)
Information technology 3.99 3.71
Financials 37.31 33.17
Health care 12.89 19.27
Consumer staples 7.50 10.60
Industrials 7.86 7.50
Consumer discretionary 12.06 7.32
Utilities 2.02 3.21
Materials 2.60 2.52
Communications services 6.17 5.71
Real estate 7.60 6.99
Total 100.00 100.00
Securities representing over 5 per cent of the investment portfolio at 31 March 2021 were:
2021(%)
Commonwealth Bank of Australia 10.39
CSL Ltd 7.90
Westpac Banking Corporation 5.78
National Australia Bank Ltd 5.61
Australia and New Zealand Banking Group Ltd 5.25
34.93

Notes to the Financial Statements (continued)For the year ended 31 March 2021
27
2. Financial risk management (continued)(a) Market risk (continued)Securities representing over 5 per cent of the investment portfolio at 31 March 2020 were:
2020(%)
CSL Limited 12.24
Commonwealth Bank of Australia 9.92
Westpac Banking Corporation 5.17
27.33
The following table illustrates the effect on the Company’s equity from possible changes in the value of equity investments, assuming a flat tax rate of 30 per cent:
IMPACT ON OTHER COMPONENTS OF EQUITY
2021 2020$ $
Change in value – 10% (37,256,904) (26,066,553)
Change in value – 30% (111,770,714) (78,199,660)
Other components of equity would increase/decrease as a result of gains/losses on equity securities classified as financial assets at fair value through other comprehensive income.
(ii) Cash flow and fair value interest rate risk
The Company’s CRPS are subject to fixed interest rates and are carried at amortised cost. They are therefore not subject to interest rate risk as defined in AASB 7, since neither the carrying amount nor the future cash flows will fluctuate because of a change in market interest rates.
(b) Credit riskThe standard defines this as the risk that one party to a financial instrument will cause a financial loss for the other party by failing to discharge an obligation.
The maximum exposure to credit risk, excluding the value of any collateral or other security, at balance date to recognised financial assets, is the carrying amount, net of any provisions for impairment of those assets, as disclosed in the Statement of Financial Position and Notes to the Financial Statements.
None of these assets are over-due or considered to be impaired.
(c) Liquidity riskThe standard defines this as the risk that an entity will encounter difficulty in meeting obligations associated with financial liabilities.
The Investment Manager monitors its cash-flow requirements daily in relation to the investing account taking into account upcoming dividends, tax payments and investing activity.
The Company’s inward cash flows depend upon the level of dividend and distribution revenue received and sales of investments. Because the Company’s investments are liquid and readily tradeable, the Company has the ability to manage its total cash inflows. The Company’s major cash outflows are the purchase of securities and dividends paid to shareholders. The level of both of these is managed by the Board and Investment Manager.
Maturities of financial liabilities
Except for the CRPS which will reach their next reset date in 2021, the other liabilities of the Company in the current and prior year have maturities of less than one month.
While the upcoming CRPS reset represents a commitment falling within 12 months, the Company has the ability to manage the maturity by offering a new term, converting securities to ordinary shares or redeeming some or all of the securities. Should the Company seek to redeem any securities it may do this through the application of available cash, the sale of investments (which are highly liquid) or the raising of replacement capital.
Notes to the Financial Statements (continued)For the year ended 31 March 2021
28 WHITEFIELD ANNUAL REPORT 2021
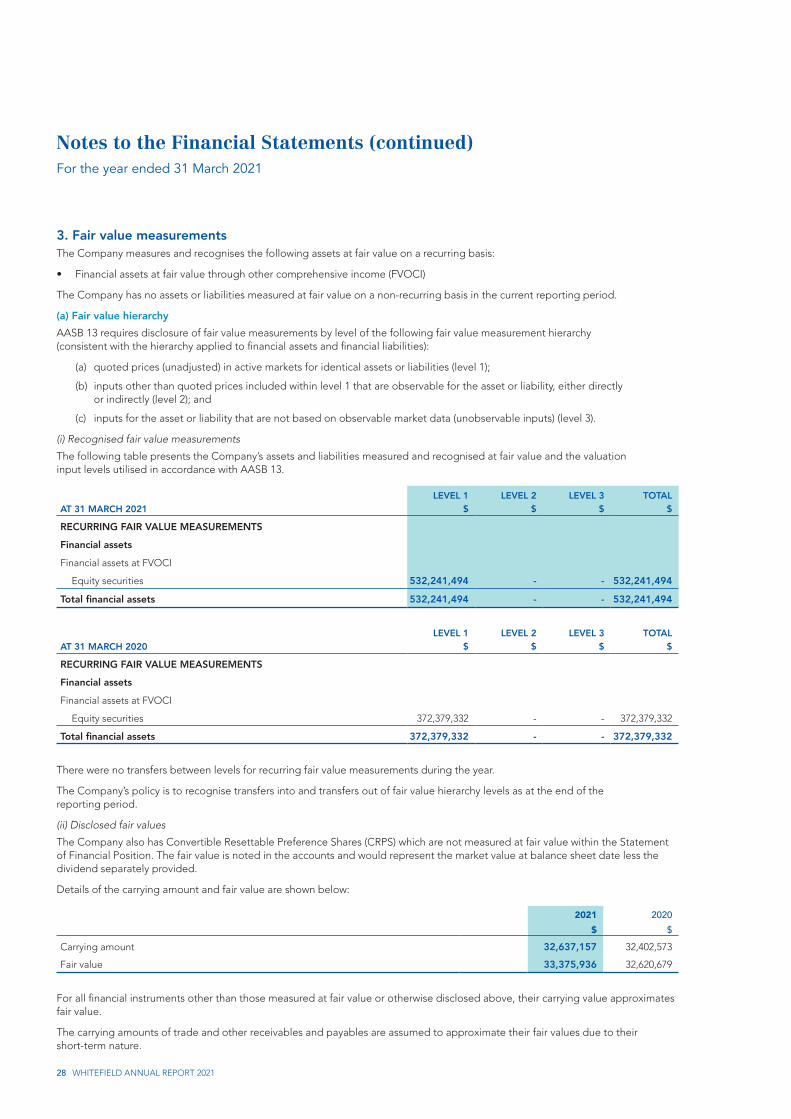
3. Fair value measurementsThe Company measures and recognises the following assets at fair value on a recurring basis:
• Financial assets at fair value through other comprehensive income (FVOCI)
The Company has no assets or liabilities measured at fair value on a non-recurring basis in the current reporting period.
(a) Fair value hierarchyAASB 13 requires disclosure of fair value measurements by level of the following fair value measurement hierarchy (consistent with the hierarchy applied to financial assets and financial liabilities):
(a) quoted prices (unadjusted) in active markets for identical assets or liabilities (level 1);
(b) inputs other than quoted prices included within level 1 that are observable for the asset or liability, either directly or indirectly (level 2); and
(c) inputs for the asset or liability that are not based on observable market data (unobservable inputs) (level 3).
(i) Recognised fair value measurements
The following table presents the Company’s assets and liabilities measured and recognised at fair value and the valuation input levels utilised in accordance with AASB 13.
AT 31 MARCH 2021LEVEL 1
$LEVEL 2
$LEVEL 3
$TOTAL
$
RECURRING FAIR VALUE MEASUREMENTS
Financial assets
Financial assets at FVOCI
Equity securities 532,241,494 - - 532,241,494
Total financial assets 532,241,494 - - 532,241,494
AT 31 MARCH 2020LEVEL 1
$LEVEL 2
$LEVEL 3
$TOTAL
$
RECURRING FAIR VALUE MEASUREMENTS
Financial assets
Financial assets at FVOCI
Equity securities 372,379,332 - - 372,379,332
Total financial assets 372,379,332 - - 372,379,332
There were no transfers between levels for recurring fair value measurements during the year.
The Company’s policy is to recognise transfers into and transfers out of fair value hierarchy levels as at the end of the reporting period.
(ii) Disclosed fair values
The Company also has Convertible Resettable Preference Shares (CRPS) which are not measured at fair value within the Statement of Financial Position. The fair value is noted in the accounts and would represent the market value at balance sheet date less the dividend separately provided.
Details of the carrying amount and fair value are shown below:
2021 2020$ $
Carrying amount 32,637,157 32,402,573
Fair value 33,375,936 32,620,679
For all financial instruments other than those measured at fair value or otherwise disclosed above, their carrying value approximates fair value.
The carrying amounts of trade and other receivables and payables are assumed to approximate their fair values due to their short-term nature.

Notes to the Financial Statements (continued)For the year ended 31 March 2021
29
4. Revenue2021 2020
$ $
FROM CONTINUING OPERATIONS
Dividends on investments held at the end of the year 9,548,487 15,842,868
Dividends on investments sold during the year 1,080,927 1,888,491
Interest 43,890 126,116
Distributions 2,052,229 3,214,319
Other income 23,520 14,100
12,749,053 21,085,894
5. Income tax expense2021 2020
$ $
(a) Income tax expense through profit or loss
Income tax expense (558,509) (1,024,993)
(b) Numerical reconciliation of income tax expense to prima facie tax payable
Profit from continuing operations before income tax expense 10,376,030 18,685,977
Tax at the Australian tax rate of 30.0% (2020 – 30.0%) 3,112,809 5,605,793
Tax effect of amounts which are not deductible/(taxable) in calculating taxable income:
Franking credits on dividends received (3,585,642) (6,271,916)
Finance expense items 65,736 65,295
Imputation gross up on dividends income 1,081,609 1,894,821
Permanent differences from adjustments to prior year income tax expense (96,282) (224,844)
Foreign tax credits on dividends received (19,721) (44,156)
Income tax expense (558,509) 1,024,993
(c) Amounts recognised directly in equity
Aggregate current tax arising in the reporting period and not recognised in net profit or loss or other comprehensive income but directly debited or credited to equity:
Share issue expenses 39,788 4,543
(d) Tax (benefit)/expense relating to items of other comprehensive income
Net unrealised (losses)/gains on investments taken to equity 33,222,201 (18,107,335)
Net realised losses on investments taken to equity (1,029,772) (23,549)
32,192,429 (18,130,884)
Notes to the Financial Statements (continued)For the year ended 31 March 2021
30 WHITEFIELD ANNUAL REPORT 2021
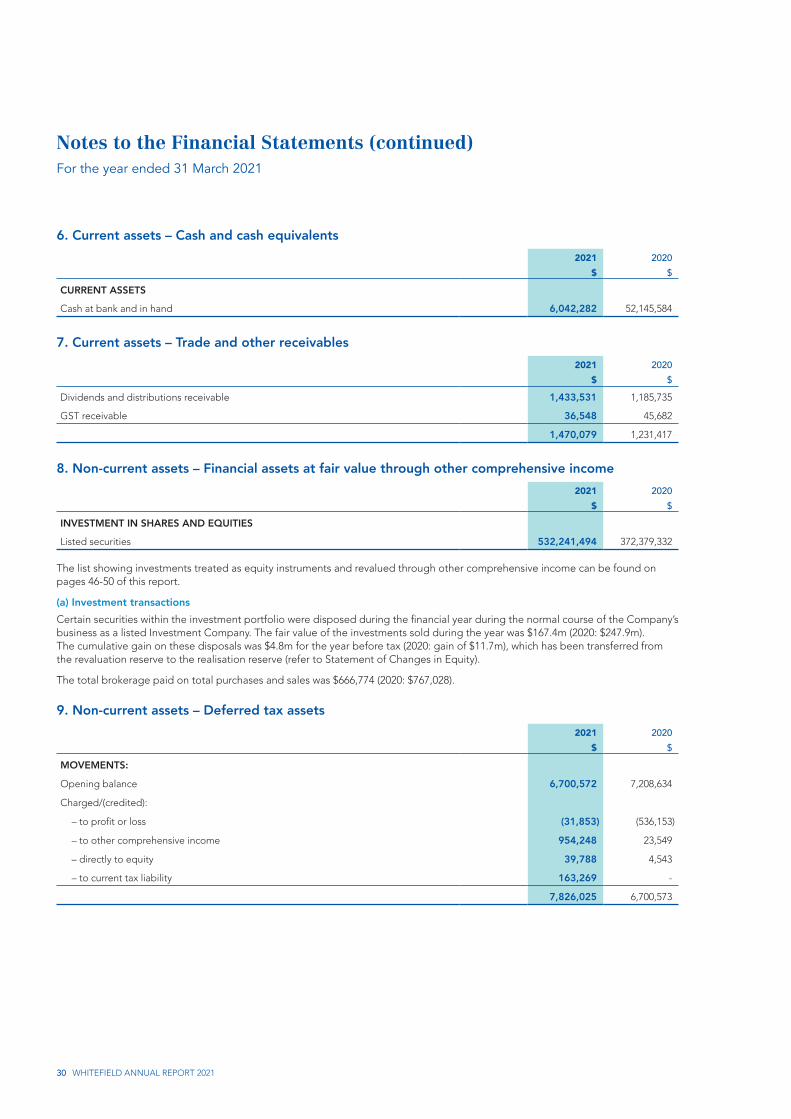
6. Current assets – Cash and cash equivalents2021 2020
$ $
CURRENT ASSETS
Cash at bank and in hand 6,042,282 52,145,584
7. Current assets – Trade and other receivables2021 2020
$ $
Dividends and distributions receivable 1,433,531 1,185,735
GST receivable 36,548 45,682
1,470,079 1,231,417
8. Non-current assets – Financial assets at fair value through other comprehensive income2021 2020
$ $
INVESTMENT IN SHARES AND EQUITIES
Listed securities 532,241,494 372,379,332
The list showing investments treated as equity instruments and revalued through other comprehensive income can be found on pages 46-50 of this report.
(a) Investment transactionsCertain securities within the investment portfolio were disposed during the financial year during the normal course of the Company’s business as a listed Investment Company. The fair value of the investments sold during the year was $167.4m (2020: $247.9m). The cumulative gain on these disposals was $4.8m for the year before tax (2020: gain of $11.7m), which has been transferred from the revaluation reserve to the realisation reserve (refer to Statement of Changes in Equity).
The total brokerage paid on total purchases and sales was $666,774 (2020: $767,028).
9. Non-current assets – Deferred tax assets2021 2020
$ $
MOVEMENTS:
Opening balance 6,700,572 7,208,634
Charged/(credited):
– to profit or loss (31,853) (536,153)
– to other comprehensive income 954,248 23,549
– directly to equity 39,788 4,543
– to current tax liability 163,269 -
7,826,025 6,700,573
Notes to the Financial Statements (continued)For the year ended 31 March 2021
31
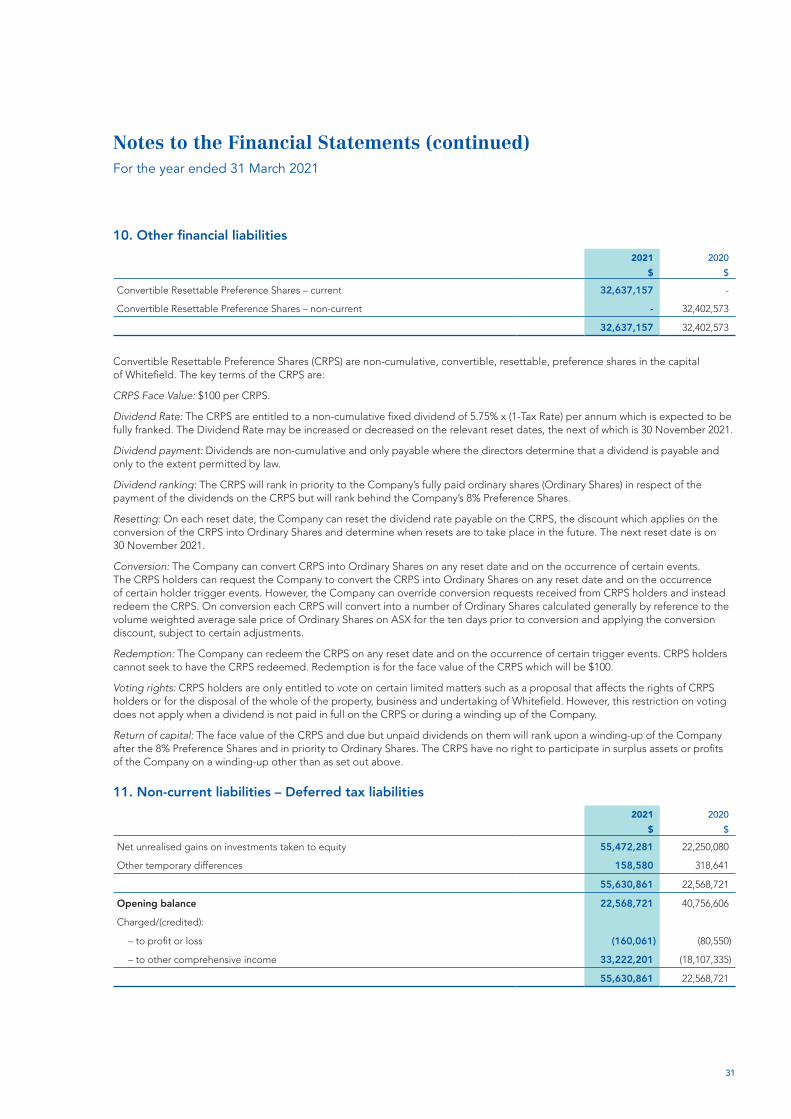
10. Other financial liabilities2021 2020
$ $
Convertible Resettable Preference Shares – current 32,637,157 -
Convertible Resettable Preference Shares – non-current - 32,402,573
32,637,157 32,402,573
Convertible Resettable Preference Shares (CRPS) are non-cumulative, convertible, resettable, preference shares in the capital of Whitefield. The key terms of the CRPS are:
CRPS Face Value: $100 per CRPS.
Dividend Rate: The CRPS are entitled to a non-cumulative fixed dividend of 5.75% x (1-Tax Rate) per annum which is expected to be fully franked. The Dividend Rate may be increased or decreased on the relevant reset dates, the next of which is 30 November 2021.
Dividend payment: Dividends are non-cumulative and only payable where the directors determine that a dividend is payable and only to the extent permitted by law.
Dividend ranking: The CRPS will rank in priority to the Company’s fully paid ordinary shares (Ordinary Shares) in respect of the payment of the dividends on the CRPS but will rank behind the Company’s 8% Preference Shares.
Resetting: On each reset date, the Company can reset the dividend rate payable on the CRPS, the discount which applies on the conversion of the CRPS into Ordinary Shares and determine when resets are to take place in the future. The next reset date is on 30 November 2021.
Conversion: The Company can convert CRPS into Ordinary Shares on any reset date and on the occurrence of certain events. The CRPS holders can request the Company to convert the CRPS into Ordinary Shares on any reset date and on the occurrence of certain holder trigger events. However, the Company can override conversion requests received from CRPS holders and instead redeem the CRPS. On conversion each CRPS will convert into a number of Ordinary Shares calculated generally by reference to the volume weighted average sale price of Ordinary Shares on ASX for the ten days prior to conversion and applying the conversion discount, subject to certain adjustments.
Redemption: The Company can redeem the CRPS on any reset date and on the occurrence of certain trigger events. CRPS holders cannot seek to have the CRPS redeemed. Redemption is for the face value of the CRPS which will be $100.
Voting rights: CRPS holders are only entitled to vote on certain limited matters such as a proposal that affects the rights of CRPS holders or for the disposal of the whole of the property, business and undertaking of Whitefield. However, this restriction on voting does not apply when a dividend is not paid in full on the CRPS or during a winding up of the Company.
Return of capital: The face value of the CRPS and due but unpaid dividends on them will rank upon a winding-up of the Company after the 8% Preference Shares and in priority to Ordinary Shares. The CRPS have no right to participate in surplus assets or profits of the Company on a winding-up other than as set out above.
11. Non-current liabilities – Deferred tax liabilities2021 2020
$ $
Net unrealised gains on investments taken to equity 55,472,281 22,250,080
Other temporary differences 158,580 318,641
55,630,861 22,568,721
Opening balance 22,568,721 40,756,606
Charged/(credited):
– to profit or loss (160,061) (80,550)
– to other comprehensive income 33,222,201 (18,107,335)
55,630,861 22,568,721

32 WHITEFIELD ANNUAL REPORT 2021
Notes to the Financial Statements (continued)For the year ended 31 March 2021
12. Issued capital(a) Share capital
2021SHARES
2020SHARES
2021$
2020$
Ordinary shares – fully paid 96,298,506 92,411,570 257,416,663 241,310,693
8% Non-redeemable preference shares – fully paid 23,790 23,790 23,790 23,790
96,322,296 92,435,360 257,440,453 241,334,483
(b) Movements in ordinary share capital
DETAILS NOTESNUMBER
OF SHARES $
Opening balance 1 April 2019 91,841,004 239,220,398
Dividend reinvestment plan issue – final dividend (f) 208,670 1,070,518
Bonus share plan – final dividend (e) 88,611 -
Dividend reinvestment plan issue – interim dividend (f) 222,064 1,030,377
Bonus share plan – interim dividend (e) 51,221 -
Less: Transaction costs arising on share issue – DRP and BSP - (10,600)
Balance 31 March 2020 92,441,570 241,310,693
Opening balance 1 April 2020 92,441,570 241,310,693
Share purchase plan 3,226,792 14,035,000
Dividend reinvestment plan issue – final dividend (f) 235,421 1,061,749
Bonus share plan – final dividend (e) 116,885 -
Dividend reinvestment plan issue – interim dividend (f) 212,343 1,102,060
Bonus share plan – interim dividend (e) 95,495 -
Less: Transaction costs arising on share issue – DRP, BSP and SPP - (92,839)
Balance 31 March 2021 96,298,506 257,416,663
(c) Ordinary sharesOrdinary shares entitle the holder to participate in dividends and the proceeds on winding up of the Company after repayment of preference capital in proportion to the number of and amounts paid on the shares held.
On a show of hands every holder of ordinary shares present at a meeting in person or by proxy, is entitled to one vote, and upon a poll each share is entitled to one vote.
(d) Non-redeemable preference sharesThe 8% preference shares carry the right to cumulative dividends of 8.0 cents per share per annum, the repayment of face value in a winding up, are not redeemable and carry no further right to participate in profits. Preference shares are entitled to vote at shareholder meetings. There were no arrears of dividend at balance date.
(e) Bonus Share PlanThe Company has established a Bonus Share Plan, under which holders of ordinary shares may elect to relinquish their right to a dividend, and instead receive bonus shares of equivalent market value. Shares may be issued under the plan at a discount to the market price as specified by the Company from time to time.
(f) Dividend reinvestment planThe Company has established a Dividend Reinvestment Plan under which holders of ordinary shares may elect to have all or part of their dividend entitlements satisfied by the issue of new ordinary shares rather than by being paid in cash. Shares may be issued under the plan at a discount to the market price as specified by the Company from time to time.
(g) Capital risk managementThe Board’s policy is to maintain an appropriate level of liquidity in the Company’s shares.
The Company is not subject to any externally imposed capital requirements.

Notes to the Financial Statements (continued)For the year ended 31 March 2021
33
13. Reserves
NOTES2021
$2020
$
MOVEMENTS:
Investment portfolio revaluation reserve
Opening balance (615,817) 53,613,076
Net unrealised (losses)/gains on investments (excluding transfer) 107,811,665 (61,293,966)
Transfer to investment portfolio realised gains/losses reserve (5,858,680) (11,042,262)
Income tax on these items 5, 11 (33,222,201) 18,107,335
Balance 31 March 68,114,967 (615,817)
Investment portfolio realised gains/losses reserve
Opening balance 82,526,277 82,041,677
Dividends paid from reserve (1,958,388) (10,557,662)
Transfer to investment portfolio revaluation reserve 5,858,680 11,042,262
Balance 31 March 86,426,569 82,526,277
Total 154,541,536 81,910,460
Nature and purpose of reservesFor a description of the nature and purpose of the reserves, refer to Note 23(f).
14. Dividends2021 2020
$ $
(a) Ordinary shares
Final dividend – prior year (10.25 cents and 10.25 cents per fully paid ordinary share, fully franked based on tax paid at 30%, paid 12/06/2020 and 12/06/2019, respectively) 8,944,903 8,946,435
Interim dividend – current year (10.25 cents and 10.25 cents per fully paid ordinary share, fully franked based on tax paid at 30%, paid 11/12/2020 and 12/12/2019, respectively) 9,343,318 8,987,140
18,288,221 17,933,575
(b) Non-redeemable participating preference shares
Final dividend – prior year (4.0 cents per fully paid preference share, fully franked based on tax paid at 30%)
951 951
Interim dividend – current year (4.0 cents per fully paid preference share, fully franked based on tax paid at 30%)
951 951
1,902 1,902
(c) Convertible Resettable Preference SharesDividends on CRPS – six-monthly (201.25 cents per fully paid preference share, fully franked based on tax paid at 30%, paid 12/06/2020 and 11/12/2020 and payable 12/06/2020) 1,293,578 1,293,578
1,293,578 1,293,578
Total dividends provided for or paid 19,583,701 19,229,055
2021$
(d) Dividends not recognised at the end of the reporting periodSince year end the Directors have approved the payment of a final dividend of 10.25 cents per fully paid ordinary share, 4.0 cents per fully paid 8% preference share and 201.25 cents per fully paid Convertible Resettable Preference Share, fully franked based on tax paid at 30%. The aggregate amount of the proposed dividend expected to be paid on 11 June 2021 out of retained earnings at 31 March 2021, but not recognised as a liability at year end, is: 9,871,548

34 WHITEFIELD ANNUAL REPORT 2021
Notes to the Financial Statements (continued)For the year ended 31 March 2021
14. Dividends (continued)2021 2020
$ $
(e) Dividend franking account
Opening balance of franking account 18,080,711 18,504,802
Franking credits on dividends received 3,486,090 6,809,681
Tax paid during the year 53,428 823,990
Franking credits on dividends paid (8,831,448) (8,025,841)
Loss of franking credits under 45 day rule (10,200) (31,921)
Closing balance of franking credits 12,778,581 18,080,711
Impact on the franking account of dividends proposed or declared before the financial report was authorised for issue 4,507,859 (4,337,112)
8,270,722 13,743,599
15. Key management personnel disclosures(a) Key management personnel compensationDetailed remuneration disclosures are provided in the remuneration report.
(b) Equity instrument disclosures relating to key management personnel(i) Share holdings
The numbers of shares in the Company held during the financial year by each Director of Whitefield Limited and other key management personnel of the Company, including their personally related parties, are set out below. There were no shares granted during the reporting period as compensation.
2021
BALANCE AT THE START OF
THE YEARNET
MOVEMENT
OTHER CHANGES
DURING THE YEAR
BALANCE AT THE END OF
THE YEAR
Name
Directors of Whitefield Limited
Ordinary shares
Angus J. Gluskie 17,657,654 20,691 - 17,678,345
William R. Seddon 85,382 - - 85,382
Lance W. Jenkins 130,800 12,647 - 143,447
Mark A. Beardow 24,060 7,649 - 31,709
Jenelle B. Webster 5,000 10,000 - 15,000
17,902,896 50,987 - 17,953,883
8% Preference shares
Angus J. Gluskie 200 - - 200
200 - - 200

Notes to the Financial Statements (continued)For the year ended 31 March 2021
35
15. Key management personnel disclosures (continued)(b) Equity instrument disclosures relating to key management personnel (continued)
2020
BALANCE AT THE START OF
THE YEARNET
MOVEMENT
OTHER CHANGES
DURING THE YEAR
BALANCE AT THE END OF
THE YEAR
Name
Directors of Whitefield Limited
Ordinary shares
Angus J. Gluskie 17,657,654 - - 17,657,654
William R. Seddon 85,382 - - 85,382
Lance W. Jenkins 91,538 39,262 - 130,800
Mark A. Beardow 23,108 952 - 24,060
Jenelle B. Webster 2,046 2,954 - 5,000
17,859,728 43,168 - 17,902,896
8% Preference shares
Angus J. Gluskie 200 - - 200
200 - - 200
16. Remuneration of auditorsDuring the year the following fees were paid or payable for services provided by the auditor of the Company, its related practices and non-related audit firms:
(a) MNSA Pty Limited
31 MARCH 2021
31 MARCH 2020
$ $
Audit and other assurance services
Audit and review of financial statements 29,418 27,729
Total remuneration for audit and other assurance services 29,418 27,729
17. ContingenciesThe Company had no contingent liabilities at 31 March 2021 (2020: nil).

36 WHITEFIELD ANNUAL REPORT 2021
Notes to the Financial Statements (continued)For the year ended 31 March 2021
18. Related party transactions(a) Key management personnelDisclosures relating to key management personnel are set out in Note 15.
(b) Transactions with other related partiesThe following transactions occurred with related parties:
31 MARCH 2021
31 MARCH 2020
$ $
Management fees paid or payable 1,397,188 1,508,628
1,397,188 1,508,628
Management fees and system reimbursement costs represent fees paid to White Funds Management Pty Ltd out of which the costs of personnel, systems, premises and other operating overheads are paid. White Funds Management employs the Executive Directors, Company Secretary and other investment personnel. The Executive Directors are also shareholders of White Funds Management Pty Ltd.
(c) Outstanding balancesThe following balances are outstanding at the end of the reporting period in relation to transactions with related parties:
2021 2020
$ $
Management fees payable (including GST) 127,488 239,537
(d) Terms and conditionsTransactions between related parties are on normal commercial terms and conditions no more favourable than those available to other parties.
White Funds Management Pty Ltd is appointed as the Investment Manager for Whitefield under an Investment Management Agreement. The Investment Manager employs all of the executives involved in managing the investments and business of Whitefield. The Investment Manager is entitled to receive a monthly investment management fee of 0.02083% and an expense reimbursement levy of 0.0012% of the average market value of the Portfolio over the month.
19. Events occurring after the reporting periodApart from the dividends declared after year end, and the ongoing uncertainty of outlook arising from the COVID pandemic, no other matter or circumstance has arisen since 31 March 2021 that has significantly affected, or may significantly affect, the operations of the Company, the results of those operations or the state of affairs of the Company in subsequent financial years.
Notes to the Financial Statements (continued)For the year ended 31 March 2021
37
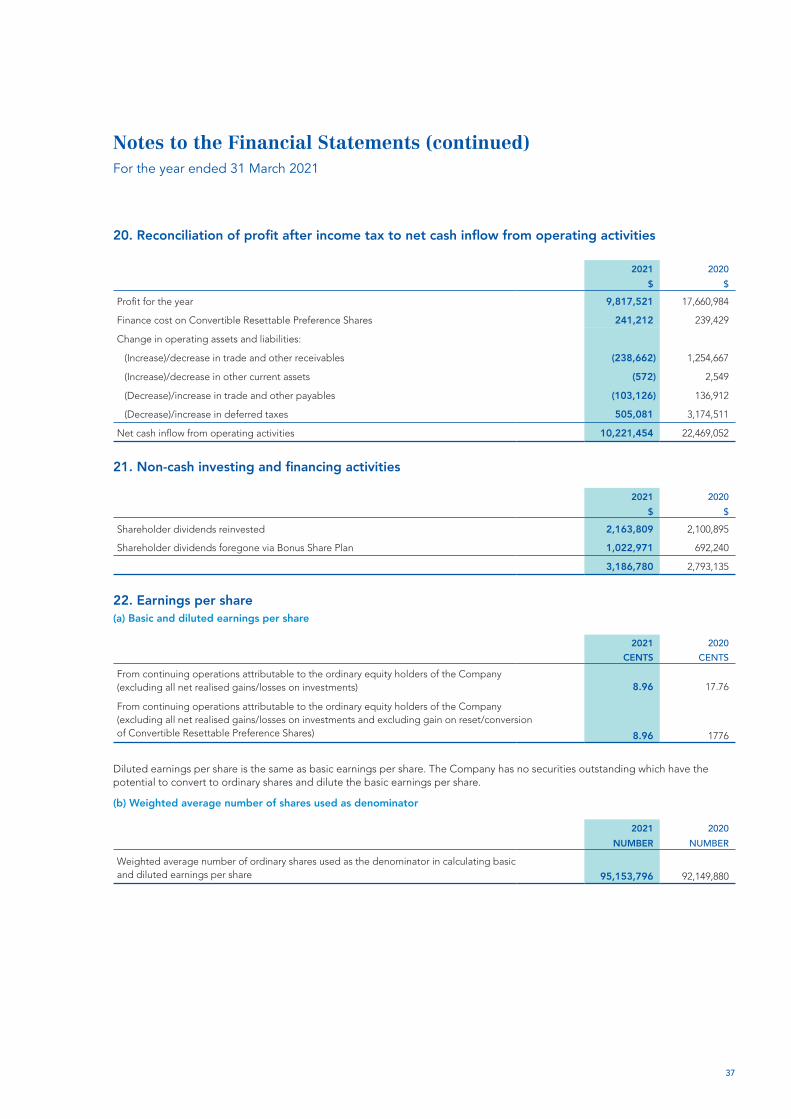
20. Reconciliation of profit after income tax to net cash inflow from operating activities
2021 2020$ $
Profit for the year 9,817,521 17,660,984
Finance cost on Convertible Resettable Preference Shares 241,212 239,429
Change in operating assets and liabilities:
(Increase)/decrease in trade and other receivables (238,662) 1,254,667
(Increase)/decrease in other current assets (572) 2,549
(Decrease)/increase in trade and other payables (103,126) 136,912
(Decrease)/increase in deferred taxes 505,081 3,174,511
Net cash inflow from operating activities 10,221,454 22,469,052
21. Non-cash investing and financing activities
2021 2020$ $
Shareholder dividends reinvested 2,163,809 2,100,895
Shareholder dividends foregone via Bonus Share Plan 1,022,971 692,240
3,186,780 2,793,135
22. Earnings per share(a) Basic and diluted earnings per share
2021 2020CENTS CENTS
From continuing operations attributable to the ordinary equity holders of the Company (excluding all net realised gains/losses on investments) 8.96 17.76
From continuing operations attributable to the ordinary equity holders of the Company (excluding all net realised gains/losses on investments and excluding gain on reset/conversion of Convertible Resettable Preference Shares) 8.96 1776
Diluted earnings per share is the same as basic earnings per share. The Company has no securities outstanding which have the potential to convert to ordinary shares and dilute the basic earnings per share.
(b) Weighted average number of shares used as denominator
2021 2020NUMBER NUMBER
Weighted average number of ordinary shares used as the denominator in calculating basic and diluted earnings per share 95,153,796 92,149,880

38 WHITEFIELD ANNUAL REPORT 2021
Notes to the Financial Statements (continued)For the year ended 31 March 2021
23. Summary of significant accounting policiesThe principal accounting policies adopted in the preparation of these financial statements are set out below. These policies have been consistently applied to all the years presented, unless otherwise stated. The financial statements are for the entity Whitefield Limited.
(a) Basis of preparationThese general purpose financial statements have been prepared in accordance with Australian Accounting Standards and Interpretations issued by the Australian Accounting Standards Board and the Corporations Act 2001. Whitefield Limited is a for-profit entity for the purpose of preparing the financial statements.
The financial statements were authorised for issue by the directors on 19 May 2021.
(i) Compliance with IFRS
The financial statements of the Company also comply with International Financial Reporting Standards (IFRS) as issued by the International Accounting Standards Board (IASB).
(ii) New and amended standards adopted by the Company
There are no standards, interpretations or amendments to existing standards that are effective for the first time for the financial year beginning 1 April 2020 that have a material impact on the amounts recognised in the prior periods or will affect the current or future periods.
(iii) Historical cost convention
These financial statements have been prepared under the accruals basis and are based on historical cost convention, as modified by the revaluation of financial assets at fair value through other comprehensive income.
(iv) New standards and interpretations not yet adopted
There are no standards that are not yet effective and that would be expected to have a material impact on the entity in the current or future reporting periods and on foreseeable future transactions.
(b) Revenue recognition(i) Dividends and trust distributions
Dividends and trust distributions are recognised as revenue when the right to receive payment is established.
(ii) Interest income
Interest income is recognised using the effective interest method.
(c) Income taxThe income tax expense or revenue for the period is the tax payable on the current period’s taxable income based on the applicable income tax rate for each jurisdiction adjusted by changes in deferred tax assets and liabilities attributable to temporary differences and to unused tax losses.
The current income tax charge is calculated on the basis of the tax laws enacted or substantially enacted at the end of the reporting period. Management periodically evaluates positions taken in tax returns with respect to situations in which applicable tax regulation is subject to interpretation. It establishes provisions where appropriate on the basis of amounts expected to be paid to the tax authorities.
Deferred income tax is provided in full, using the liability method, on temporary differences arising between the tax bases of assets and liabilities and their carrying amounts in the financial statements. Deferred income tax is also not accounted for if it arises from initial recognition of an asset or liability in a transaction other than a business combination that at the time of the transaction affects neither accounting nor taxable profit or loss.
Deferred income tax is determined using tax rates (and laws) that have been enacted or substantially enacted by the end of the reporting period and are expected to apply when the related deferred income tax asset is realised or the deferred income tax liability is settled.
Deferred tax assets are recognised for deductible temporary differences and unused tax losses only if it is probable that future taxable amounts will be available to utilise those temporary differences and losses.
Deferred tax assets and liabilities are offset when there is a legally enforceable right to offset current tax assets and liabilities and when the deferred tax balances relate to the same taxation authority. Current tax assets and tax liabilities are offset where the entity has a legally enforceable right to offset and intends either to settle on a net basis, or to realise the asset and settle the liability simultaneously.
Current and deferred tax is recognised in profit or loss in the Statement of Comprehensive Income, except to the extent that it relates to items recognised in other comprehensive income or directly in equity. In this case, the tax is also recognised in other comprehensive income or directly in equity, respectively.

Notes to the Financial Statements (continued)For the year ended 31 March 2021
39
23. Summary of significant accounting policies (continued)(d) Cash and cash equivalentsFor the purpose of presentation in the Statement of Cash Flows, cash and cash equivalents includes cash on hand, deposits held at call with financial institutions, other short-term, highly liquid investments with original maturities of three months or less that are readily convertible to known amounts of cash and which are subject to an insignificant risk of changes in value.
(e) Trade and other receivablesTrade and other receivables are recognised initially at fair value and subsequently measured at amortised cost using the effective interest method, less provision for impairment. Trade and other receivables are generally due for settlement within 30 days. They are presented as current assets unless collection is not expected for more than 12 months after the reporting date.
Collectability of trade and other receivables is reviewed on an ongoing basis. Debts which are known to be uncollectible are written off by reducing the carrying amount directly.
(f) InvestmentsClassification
(i) Financial assets at fair value through other comprehensive income
The Company has classified long-term investments as at “fair value through other comprehensive income”. All realised and unrealised gains or losses on long-term investments and tax thereon are presented in other comprehensive income as part of the Statement of Comprehensive Income.
Recognition and derecognitionPurchases and sales of financial assets are recognised on trade-date –0 the date on which the Company commits to purchase or sell the asset. Financial assets are derecognised when the rights to receive cash flows from the financial assets have expired or have been transferred and the Company has transferred substantially all the risks and rewards of ownership.
MeasurementAt initial recognition, the Company measures a financial asset at its fair value plus, in the case of a financial asset not at fair value through profit or loss, transaction costs that are directly attributable to the acquisition of the financial asset.
Subsequent changes in fair value are recognised through the investment portfolio revaluation reserve after deducting a provision for the potential deferred capital gains tax liability as these investments are long-term holding of equity investments.
When an investment is disposed of, the cumulative gain or loss, net of tax thereon, is transferred from the investment portfolio reserve/asset revaluation reserve to the realised gains/losses reserve.
Determination of fair valueAASB 13 defines fair value as the price that would be received to sell an asset or paid to transfer a liability in an orderly transaction between market participants at the measurement date in the principal, or in its absence, the most advantageous market to which the Company has access at that date. The fair value of a liability reflects its non-performance risk.
Under AASB 13, if an investment has a bid price and an ask price, the price within the bid-ask spread that is more representative of fair value in the circumstances shall be used to measure fair value. Accordingly, the Company uses the last sale price as a basis of measuring fair value.
(g) Other financial liabilitiesConvertible Resettable Preference Shares are classified as a compound financial instrument consisting of a financial liability and an equity for accounting purposes under Australian Accounting Standard AASB132 Financial Instruments: Presentation. The liability is initially recognised at fair value less transaction costs. After initial recognition, the liability is carried at amortised cost using the effective interest method.
In accordance with this Standard, a financial expense on the liability is brought to account which includes the amortisation of any difference between the original proceeds net of transaction costs and the settlement value of the obligation. Dividends on Convertible Resettable Preference Shares are recognised as an allocation of retained profit, and a provision for the dividend is brought to account in each period.
With the next reset date falling within 12 months, the Convertible Resettable Preference Share liability has been shown as a current, rather than non-current liability at the financial year end.
(h) Trade and other payablesThese amounts represent liabilities for goods and services provided to the Company prior to the end of financial year which are unpaid. The amounts are unsecured and are usually paid within 30 days of recognition. Trade and other payables are presented as current liabilities unless payment is not due within 12 months from the reporting date. They are recognised initially at their fair value and subsequently measured at amortised cost using the effective interest method.

40 WHITEFIELD ANNUAL REPORT 2021
Notes to the Financial Statements (continued)For the year ended 31 March 2021
23. Summary of significant accounting policies (continued)(i) Finance costsFinance costs are recognised as expenses in the year in which they are incurred using the effective interest rate method.
Dividends on Convertible Resettable Preference Shares are recognised as an allocation of retained profit, and a provision for the dividend is brought to account in each period.
(j) Issued capitalOrdinary and 8% Non-Redeemable Preference Shares are classified as equity.
Preference shares which are redeemable or convertible for a specified consideration are classified as liabilities.
Incremental costs directly attributable to the issue of new shares are shown in equity as a deduction, net of tax, from the proceeds.
(k) DividendsProvision is made for the amount of any ordinary dividend declared, being appropriately authorised and no longer at the discretion of the entity, on or before the end of the reporting period but not distributed at the end of the reporting period. Provision is made for CRPS dividend based on the specified dividend rate at each month end.
(l) Earnings per share(i) Basic earnings per share
Basic earnings per share is calculated by dividing:
• the profit attributable to owners of the Company, excluding any costs of servicing equity other than ordinary shares, and
• by the weighted average number of ordinary shares outstanding during the financial year, adjusted for bonus elements in ordinary shares issued during the year and excluding treasury shares.
(ii) Diluted earnings per share
Diluted earnings per share adjusts the figures used in the determination of basic earnings per share to take into account:
• the after income tax effect of interest and other financing costs associated with dilutive potential ordinary shares, and
• the weighted average number of additional ordinary shares that would have been outstanding assuming the conversion of all dilutive potential ordinary shares.
(m) Goods and Services Tax (GST)Revenues, expenses and assets are recognised net of the amount of associated GST, unless the GST incurred is not recoverable from the taxation authority. In this case it is recognised as part of the cost of acquisition of the asset or as part of the expense.
Receivables and payables are stated inclusive of the amount of GST receivable or payable. The net amount of GST recoverable from, or payable to, the taxation authority is included with other receivables or payables in the Statement of Financial Position.
Cash flows are presented on a gross basis. The GST components of cash flows arising from investing or financing activities which are recoverable from, or payable to the taxation authority, are presented as operating cash flows.
(n) Functional and presentation currencyThe functional and presentation currency of the Company is Australian dollars.
(o) ComparativesWhere necessary, comparative information has been reclassified to be consistent with current reporting period.
(p) Operating segmentsThe Company operated in Australia only and the principal activity is investment. The Company has only one reportable segment and in one industry being the securities industry, deriving revenue from dividend income, interest income and from the sale of its investment portfolio.

41
Director’s declaration
In the Directors’ opinion:
(a) the financial statements and notes set out on pages 26 to 40 are in accordance with the Corporations Act 2001, including:
(i) complying with Australian Accounting Standards, the Corporations Regulations 2001 and other mandatory professional reporting requirements, and
(ii) giving a true and fair view of the entity’s financial position as at 31 March 2021 and of its performance for the year ended on that date, and
(b) there are reasonable grounds to believe that the Company will be able to pay its debts as and when they become due and payable.
Note 23(a) confirms that the financial statements also comply with International Financial Reporting Standards as issued by the International Accounting Standards Board.
The Directors have been given the declarations by the managing director and chief financial officer required by section 295A of the Corporations Act 2001.
This declaration is made in accordance with a resolution of Directors.
Angus J. GluskieDIRECTOR
Sydney 19 May 2021

42 WHITEFIELD ANNUAL REPORT 2021
Independent auditor’s reportTo the members of Whitefield Limited
Report on the Audit of the Financial ReportOpinionWe have audited the financial report of Whitefield Limited (the Company), which comprises the statement of financial position as at 31 March 2021, the statement of comprehensive income, the statement of changes in equity and the statement of cash flows for the year then ended, and notes to the financial statements, including a summary of significant accounting policies and the directors’ declaration.
In our opinion:
(a) the accompanying financial report of the Company is in accordance with the Corporations Act 2001, including:
i. giving a true and fair view of the Company’s financial position as at 31 March 2021 and of its performance for the year then ended; and
ii. complying with Australian Accounting Standards and the Corporations Regulations 2001.
(b) the financial report also complies with the International Financial Reporting Standards as disclosed in Note 23.
Basis for OpinionWe conducted our audit in accordance with Australian Auditing Standards. Our responsibilities under those standards are further described in the Auditor’s Responsibilities for the Audit of the Financial Report section of our report. We are independent of the Company in accordance with the auditor independence requirements of the Corporations Act 2001 and the ethical requirements of the Accounting Professional and Ethical Standards Board’s APES 110 Code of Ethics for Professional Accountants (the Code) that are relevant to our audit of the financial report in Australia. We have also fulfilled our other ethical responsibilities in accordance with the Code.
We confirm that the independence declaration required by the Corporations Act 2001, which has been given to the directors of Whitefield Limited, would be in the same terms if given to the directors as at the time of this auditor’s report.
We believe that the audit evidence we have obtained is sufficient and appropriate to provide a basis for our audit opinion.

43
Independent auditor’s report (continued)To the members of Whitefield Limited
Key Audit MattersKey audit matters are those matters that, in our professional judgement, were of most significance in our audit of the financial report of the current period. These matters were addressed in the context of our audit of the financial report as a whole, and in forming our opinion thereon, and we do not provide a separate opinion on these matters.
KEY AUDIT MATTER HOW OUR AUDIT ADDRESSED THE KEY AUDIT MATTER
Valuation and Existence of Investments
The investment portfolio at 31 March 2021 comprised of listed equity investments of $532 million (2020 $372 million).
We focused on the valuation and existence of investments as investments represent the principal element of the net asset value disclosed in the statement of financial position.
We tested the valuation of listed investments by vouching the share prices to external market information to ensure they are fairly stated.
We agreed the existence of listed investments by confirming shareholdings with external sources and recalculation of dividends received.
Revenue from Investments
ASAs presume there are risks of fraud in revenue recognition unless rebutted.
We focused on the cut-off, accuracy and completeness of dividend revenue and dividend receivables.
We assessed the accounting policy for revenue recognition for compliance with the accounting standards and performed testing to ensure that revenue had been accounted for in accordance with the accounting policy.
We found that the accounting policies implemented were in accordance with the accounting standards, and that revenue has been accounted for in accordance with the accounting policy.
We tested the accuracy and completeness of dividend revenue by agreeing the dividends and distributions of investments to supporting documentation obtained from share registries and other external sources.
We tested the cut-off of dividend revenue and dividend receivables by agreeing the dividend details of investments from external market information and ensured that dividends that were declared before, but payable after, the reporting date were recorded.
There were no restrictions on our reporting of Key Audit Matters.

44 WHITEFIELD ANNUAL REPORT 2021
Independent auditor’s report (continued)To the members of Whitefield Limited
Information Other than the Financial Report and Auditor’s Report ThereonThe directors are responsible for the other information. The other information comprises the information included in the Company’s annual report for the year ended 31 March 2021, but does not include the financial report and our auditor’s report thereon.
Our opinion on the financial report does not cover the other information and accordingly we do not express any form of assurance conclusion thereon.
In connection with our audit of the financial report, our responsibility is to read the other information and, in doing so, consider whether the other information is materially inconsistent with the financial report or our knowledge obtained in the audit or otherwise appears to be materially misstated.
If, based on the work we have performed, we conclude that there is a material misstatement of this other information, we are required to report that fact. We have nothing to report in this regard.
Responsibility of the Directors for the Financial ReportThe directors of the company are responsible for the preparation of the financial report that gives a true and fair view in accordance with Australian Accounting Standards and the Corporations Act 2001 and for such internal control as the directors determine is necessary to enable the preparation of the financial report that gives a true and fair view and is free from material misstatement, whether due to fraud or error.
In Note 23, the directors also state, in accordance with Accounting Standard AASB 101: Presentation of Financial Statements, the financial statements comply with International Financial Reporting Standards.
In preparing the financial report, the directors are responsible for assessing the ability of the Company to continue as a going concern, disclosing, as applicable, matters relating to going concern and using the going concern basis of accounting unless the directors either intend to liquidate the Company or to cease operations, or have no realistic alternative but to do so.
Auditor’s Responsibilities for the Audit of the Financial ReportOur objectives are to obtain reasonable assurance about whether the financial report as a whole is free from material misstatement, whether due to fraud or error, and to issue an auditor’s report that includes our opinion. Reasonable assurance is a high level of assurance, but is not a guarantee that an audit conducted in accordance with the Australian Auditing Standards will always detect a material misstatement when it exists. Misstatements can arise from fraud or error and are considered material if, individually or in the aggregate, they could reasonably be expected to influence the economic decisions of users taken on the basis of the financial report.
As part of an audit in accordance with the Australian Auditing Standards, we exercise professional judgement and maintain professional scepticism throughout the audit. We also:
• Identify and assess the risks of material misstatement of the financial report, whether due to fraud or error, design and perform audit procedures responsive to those risks, and obtain audit evidence that is sufficient and appropriate to provide a basis for our opinion. The risk of not detecting a material misstatement resulting from fraud is higher than for one resulting from error, as fraud may involve collusion, forgery, intentional omissions, misrepresentations, or the override of internal control.
• Obtain an understanding of internal control relevant to the audit in order to design audit procedures that are appropriate in the circumstances, but not for the purpose of expressing an opinion on the effectiveness of the Company’s internal control.
• Evaluate the appropriateness of accounting policies used and the reasonableness of accounting estimates and related disclosures made by the directors.
• Conclude on the appropriateness of the directors’ use of the going concern basis of accounting and, based on the audit evidence obtained, whether a material uncertainty exists related to events or conditions that may cast significant doubt on the Company’s ability to continue as a going concern. If we conclude that a material uncertainty exists, we are required to draw attention in our auditor’s report to the related disclosures in the financial report or, if such disclosures are inadequate, to modify our opinion.
• Our conclusions are based on the audit evidence obtained up to the date of our auditor’s report. However, future events or conditions may cause the Company to cease to continue as a going concern.
• Evaluate the overall presentation, structure and content of the financial report, including the disclosures, and whether the financial report represents the underlying transactions and events in a manner that achieves fair presentation.
• Obtain sufficient appropriate audit evidence regarding the financial information of the entities or business activities within the Company to express an opinion on the financial report. We are responsible for the direction, supervision and performance of the Company audit. We remain solely responsible for our audit opinion.

45
Independent auditor’s report (continued)To the members of Whitefield Limited
We communicate with the directors regarding, among other matters, the planned scope and timing of the audit and significant audit findings, including any significant deficiencies in internal control that we identify during our audit.
We also provide the directors with a statement that we have complied with relevant ethical requirements regarding independence, and to communicate with them all relationships and other matters that may reasonably be thought to bear on our independence, and where applicable, related safeguards.
From the matters communicated with the directors, we determine those matters that were of most significance in the audit of the financial report of the current period and are therefore the key audit matters. We describe these matters in our auditor’s report unless law or regulation precludes public disclosure about the matter or when, in extremely rare circumstances, we determine that a matter should not be communicated in our report because the adverse consequences of doing so would reasonably be expected to outweigh the public interest benefits of such communication.
Report on the Remuneration ReportOpinion on the Remuneration Report
We have audited the Remuneration Report included within the Directors’ report for the year ended 31 March 2021.
In our opinion the Remuneration Report of Whitefield Limited for the year ended 31 March 2021, complies with section 300A of the Corporations Act 2001.
Responsibilities
The directors of the company are responsible for the preparation and presentation of the remuneration report in accordance with section 300A of the Corporations Act 2001. Our responsibility is to express an opinion on the remuneration report, based on our audit conducted in accordance with Australian Auditing Standards.
Name of Firm: MNSA Pty Ltd
Name of Auditor: _________________________________________________________
Sam Danieli DIRECTOR
Address: Level 1, 283 George Street, Sydney NSW 2000
Dated this: Dated this 19th of May 2021

46 WHITEFIELD ANNUAL REPORT 2021
Table of investment holdings
CODE NAME SHARESMARKET
VALUEWHITEFIELD
%
BANKSANZ Australia and New Zealand Banking Group Ltd 991,296 27,934,721 5.25%
BEN Bendigo and Adelaide Bank Ltd 185,053 1,861,633 0.35%
BOQ Bank of Queensland Ltd 206,344 1,784,876 0.34%
CBA Commonwealth Bank of Australia 642,258 55,298,414 10.39%
NAB National Australia Bank Ltd 1,148,340 29,856,840 5.61%
WBC Westpac Banking Corp 1,260,299 30,763,889 5.78%
VUK Virgin Money UK PLC 301,464 1,034,022 0.19%
148,534,404 27.91%
COMMUNICATION SERVICESCAR Carsales.Com Ltd 170,919 3,044,067 0.57%
CNU Chorus Ltd 156,124 989,826 0.19%
DHG Domain Holdings Australia Ltd 84,518 354,976 0.07%
NEC Nine Entertainment Co Holdings Ltd 511,483 1,416,808 0.27%
NWS News Corp 20,801 652,943 0.12%
REA REA Group Ltd 30,362 4,303,510 0.81%
SEK Seek Ltd 123,091 3,509,324 0.66%
SPK Spark New Zealand Ltd 589,505 2,422,866 0.46%
TLS Telstra Corporation Ltd 4,151,349 14,114,587 2.65%
TPG TPG Telecom Ltd 130,180 824,039 0.15%
VOC Vocus Group Ltd 216,863 1,181,903 0.22%
32,814,850 6.17%
CONSUMER DISCRETIONARYALL Aristocrat Leisure Ltd 153,942 5,287,908 0.99%
APE Eagers Automotive Ltd 60,160 841,037 0.16%
ARB ARB Corp Ltd 26,340 907,413 0.17%
BAP Bapcor Ltd 118,804 889,842 0.17%
BRG Breville Group Ltd 32,921 888,867 0.17%
CKF Collins Foods Ltd 321,591 3,347,762 0.63%
CTD Corporate Travel Management Ltd 38,181 748,729 0.14%
CWN Crown Resorts Ltd 124,933 1,469,212 0.28%
DMP Domino's Pizza Enterprises Ltd 22.019 2,119,329 0.40%
FLT Flight Centre Travel Group Ltd 152 2,734 0.00%
GEM G8 Education Ltd 294,390 304,694 0.06%
GUD GUD Holdings Ltd 32,015 374,255 0.07%
HVN Harvey Norman Holdings Ltd 673,611 3,859,791 0.73%
IEL IDP Education Ltd 58,205 1,389,935 0.26%
JBH JB Hi-Fi Ltd 102,058 5,284,563 0.99%
KGN Kogan.com Ltd 29,185 350,220 0.07%
PMV Premier Investments Ltd 176,854 4,603,510 0.86%
SGR Star Entertainment Group Ltd 299,728 1,135,969 0.21%
SUL Super Retail Group Ltd 269,221 3,168,731 0.60%
TAH Tabcorp Holdings Ltd 773,455 3,619,769 0.68%
WES Wesfarmers Ltd 448,388 23,616,596 4.44%
64,210,867 12.06%

47
Table of investment holdings (continued)
CODE NAME SHARESMARKET
VALUEWHITEFIELD
%
CONSUMER STAPLE
A2M A2 Milk Company Ltd 259,139 2,029,058 0.38%
BGA Bega Cheese Ltd 105,015 673,195 0.13%
CCL Coca-Cola Amatil Ltd 174,264 2,340,366 0.44%
COL2 Coles Group Ltd 600,048 9,606,768 1.80%
ELD Elders Ltd 54,746 680,493 0.13%
GNC Graincorp Ltd 79,096 415,254 0.08%
ING Inghams Group Ltd 129,351 432,032 0.08%
MTS Metcash Ltd 357,399 1,315,228 0.25%
TGR Tassal Group Ltd 255 852 0.00%
TWE Treasury Wine Estates Ltd 251,813 2,606,265 0.49%
WOW Woolworths Group Ltd 485,419 19,839,075 3.73%
39,938,586 7.50%
NON BANK FINANCIALS
AMP AMP Ltd 1,197,940 1,515,394 0.28%
ASX ASX Ltd 67,696 4,809,801 0.90%
AUB AUB Group Ltd 26,017 501,087 0.09%
CCP Credit Corp Group Ltd 23,483 767.424 0.14%
CGF Challenger Ltd 259 1,658 0.00%
IAG Insurance Australia Group Ltd 335,478 1,570,037 0.29%
JHG Janus Henderson Group PLC 13,324 546,817 0.10%
MFG Magellan Financial Group Ltd 59,255 2,676,548 0.50%
MPL Medibank Private Ltd 1,866,154 5,225,231 0.98%
MQG Macquarie Group Ltd 104,142 15,916,022 2.99%
NHF NIB Holdings Ltd 159,657 835,006 0.16%
NWL Netwealth Group Ltd 30,635 412,960 0.08%
PDL Pendal Group Ltd 100,773 655,025 0.12%
PPT Perpetual Ltd 19,639 647,891 0.12%
PTM Platinum Asset Management Ltd 686,214 3,431,070 0.04%
QBE QBE Insurance Group Ltd 513,221 4,937,186 0.93%
SDF Steadfast Group Ltd 303,003 1,154,441 0.22%
SUN Suncorp Group Ltd 446,609 4,421,429 0.83%
50,025,027 9.40%

48 WHITEFIELD ANNUAL REPORT 2021
Table of investment holdings (continued)
CODE NAME SHARESMARKET
VALUEWHITEFIELD
%
HEALTH CARE
ANN Ansell Ltd 103,861 4,075,506 0.77%
AVH AVITA Medical Inc 315 1,597 0.00%
COH Cochlear Ltd 10,873 2,293,877 0.43%
CSL CSL Ltd 158,784 42,022,186 7.90%
CUV Clinuvel Pharmaceuticals Ltd 14,774 399,932 0.08%
FPH Fisher & Paykel Healthcare Corporation Ltd 44,028 1,293,983 0.24%
HLS Healius Ltd 182,179 743,290 0.14%
NAN Nanosonics Ltd 56,030 319,371 0.06%
PME Pro Medicus Ltd 16,701 690,252 0.13%
RHC Ramsay Health Care Ltd 36,589 2,451,463 0.46%
RMD Resmed Inc 201,815 5,095,829 0.96%
SHL Sonic Healthcare Ltd 263,419 9,243,373 1.74%
68,630,958 12.89%
INDUSTRIALS
ALQ ALS Ltd 168,208 1,628,253 0.31%
ALX Atlas Arteria Group 223,703 1,331,033 0.25%
ASB Austal Ltd 113,790 254,890 0.05%
AZJ Aurizon Holdings Ltd 1,278,580 4,986,462 0.94%
BIN Bingo Industries Ltd 154,436 466,397 0.09%
BXB Brambles Ltd 764,723 8,090,769 1.52%
CIM CIMIC Group Ltd 25,003 439,803 0.08%
CWY Cleanaway Waste Management Ltd 718,127 1,579,879 0.30%
DOW Downer EDI Ltd 151 775 0.00%
GWA GWA Group Ltd 91,860 262,720 0.05%
IPH IPH Ltd 75,523 499,962 0.09%
MND Monadelphous Group Ltd 32,987 343,065 0.06%
NWH NRW Holdings Ltd 155,172 304,913 0.06%
QAN Qantas Airways Ltd 657,749 3,347,942 0.63%
RWC Reliance Worldwide Corporation Ltd 275,427 1,236,667 0.23%
SIQ Smartgroup Corporation Ltd 46,886 296,788 0.06%
SSM Service Stream Ltd 132,026 140,606 0.03%
SVW Seven Group Holdings Ltd 46,287 1,043,772 0.20%
SYD Sydney Airport Holdings Pty Ltd 941,321 5,826,777 1.09%
TCL Transurban Group 732,412 9,755,728 1.83%
41,837,203 7.86%
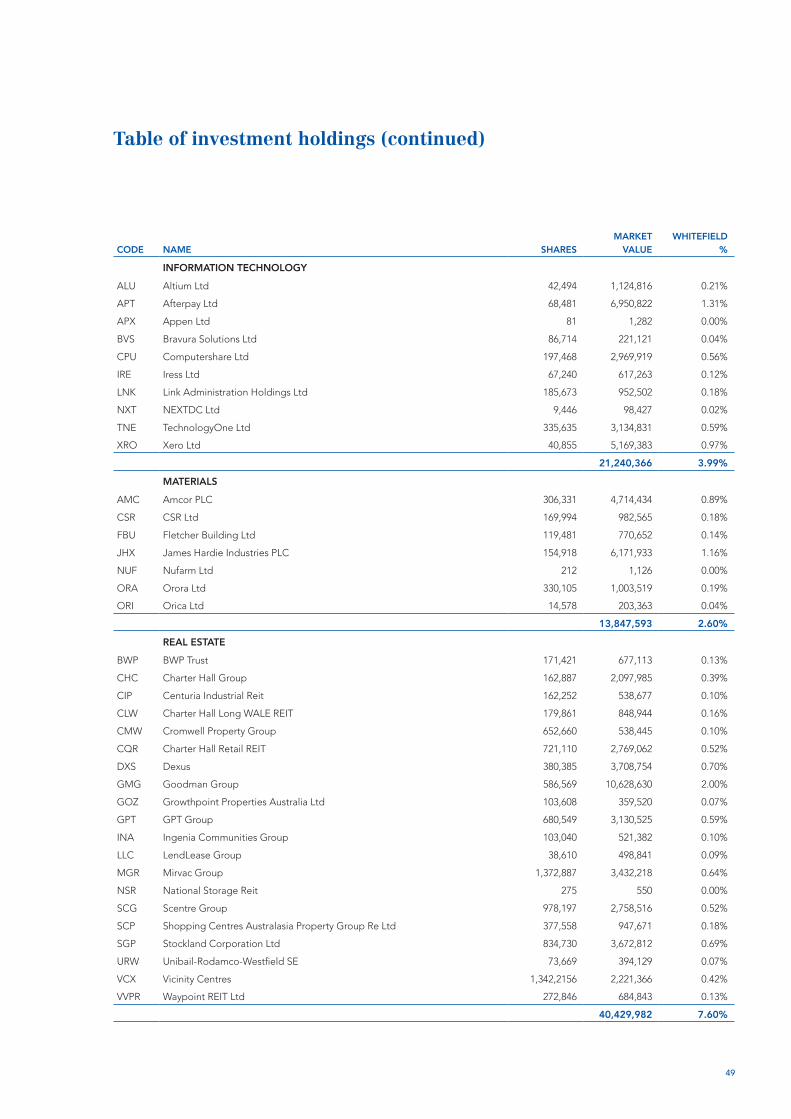
49
Table of investment holdings (continued)
CODE NAME SHARESMARKET
VALUEWHITEFIELD
%
INFORMATION TECHNOLOGY
ALU Altium Ltd 42,494 1,124,816 0.21%
APT Afterpay Ltd 68,481 6,950,822 1.31%
APX Appen Ltd 81 1,282 0.00%
BVS Bravura Solutions Ltd 86,714 221,121 0.04%
CPU Computershare Ltd 197,468 2,969,919 0.56%
IRE Iress Ltd 67,240 617,263 0.12%
LNK Link Administration Holdings Ltd 185,673 952,502 0.18%
NXT NEXTDC Ltd 9,446 98,427 0.02%
TNE TechnologyOne Ltd 335,635 3,134,831 0.59%
XRO Xero Ltd 40,855 5,169,383 0.97%
21,240,366 3.99%
MATERIALS
AMC Amcor PLC 306,331 4,714,434 0.89%
CSR CSR Ltd 169,994 982,565 0.18%
FBU Fletcher Building Ltd 119,481 770,652 0.14%
JHX James Hardie Industries PLC 154,918 6,171,933 1.16%
NUF Nufarm Ltd 212 1,126 0.00%
ORA Orora Ltd 330,105 1,003,519 0.19%
ORI Orica Ltd 14,578 203,363 0.04%
13,847,593 2.60%
REAL ESTATE
BWP BWP Trust 171,421 677,113 0.13%
CHC Charter Hall Group 162,887 2,097,985 0.39%
CIP Centuria Industrial Reit 162,252 538,677 0.10%
CLW Charter Hall Long WALE REIT 179,861 848,944 0.16%
CMW Cromwell Property Group 652,660 538,445 0.10%
CQR Charter Hall Retail REIT 721,110 2,769,062 0.52%
DXS Dexus 380,385 3,708,754 0.70%
GMG Goodman Group 586,569 10,628,630 2.00%
GOZ Growthpoint Properties Australia Ltd 103,608 359,520 0.07%
GPT GPT Group 680,549 3,130,525 0.59%
INA Ingenia Communities Group 103,040 521,382 0.10%
LLC LendLease Group 38,610 498,841 0.09%
MGR Mirvac Group 1,372,887 3,432,218 0.64%
NSR National Storage Reit 275 550 0.00%
SCG Scentre Group 978,197 2,758,516 0.52%
SCP Shopping Centres Australasia Property Group Re Ltd 377,558 947,671 0.18%
SGP Stockland Corporation Ltd 834,730 3,672,812 0.69%
URW Unibail-Rodamco-Westfield SE 73,669 394,129 0.07%
VCX Vicinity Centres 1,342,2156 2,221,366 0.42%
VVPR Waypoint REIT Ltd 272,846 684,843 0.13%
40,429,982 7.60%

50 WHITEFIELD ANNUAL REPORT 2021
Table of investment holdings (continued)
CODE NAME SHARESMARKET
VALUEWHITEFIELD
%
UTILITIES
AGL AGL Energy Ltd 217,631 2,100,139 0.39%
APA APA Group 611,723 6,129,464 1.15%
AST AusNet Services Ltd 643,857 1,181,478 0.22%
SKI Spark Infrastructure Group 608,699 1,320,877 0.25%
10,731,958 2.02%
TOTAL 532,241,495 100.00%
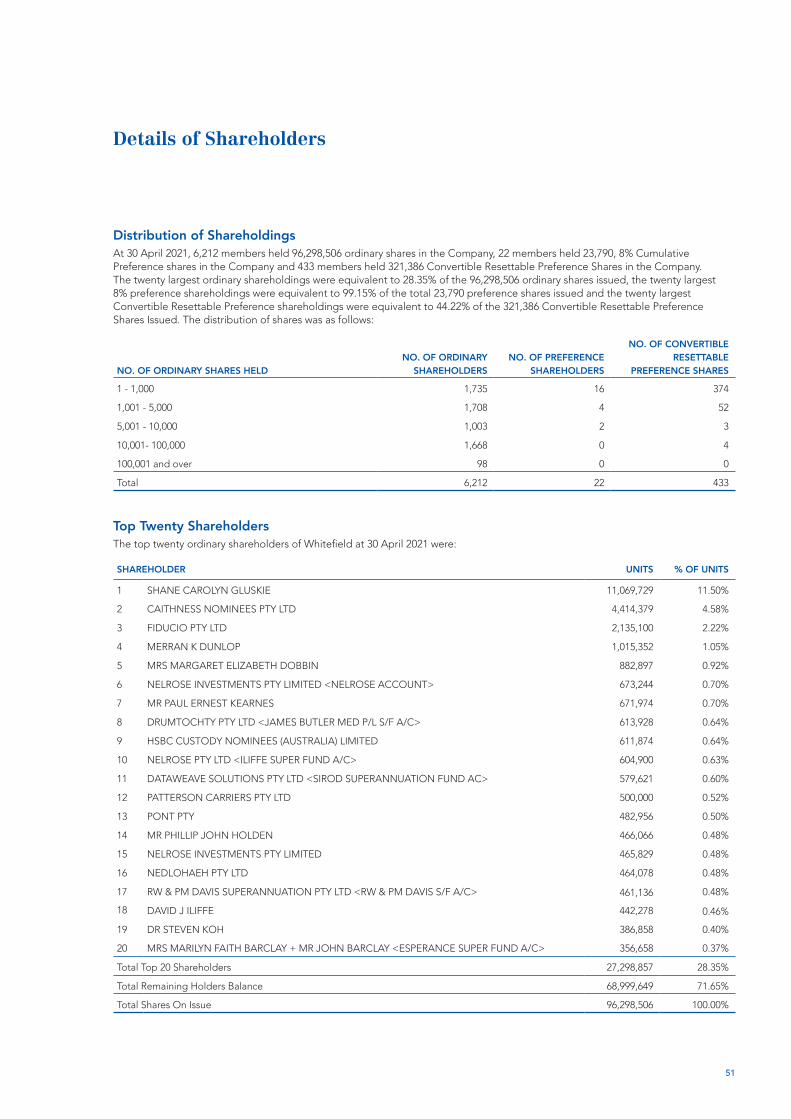
51
Details of Shareholders
Distribution of ShareholdingsAt 30 April 2021, 6,212 members held 96,298,506 ordinary shares in the Company, 22 members held 23,790, 8% Cumulative Preference shares in the Company and 433 members held 321,386 Convertible Resettable Preference Shares in the Company. The twenty largest ordinary shareholdings were equivalent to 28.35% of the 96,298,506 ordinary shares issued, the twenty largest 8% preference shareholdings were equivalent to 99.15% of the total 23,790 preference shares issued and the twenty largest Convertible Resettable Preference shareholdings were equivalent to 44.22% of the 321,386 Convertible Resettable Preference Shares Issued. The distribution of shares was as follows:
NO. OF ORDINARY SHARES HELDNO. OF ORDINARY
SHAREHOLDERSNO. OF PREFERENCE
SHAREHOLDERS
NO. OF CONVERTIBLE RESETTABLE
PREFERENCE SHARES
1 - 1,000 1,735 16 374
1,001 - 5,000 1,708 4 52
5,001 - 10,000 1,003 2 3
10,001- 100,000 1,668 0 4
100,001 and over 98 0 0
Total 6,212 22 433
Top Twenty ShareholdersThe top twenty ordinary shareholders of Whitefield at 30 April 2021 were:
SHAREHOLDER UNITS % OF UNITS
1 SHANE CAROLYN GLUSKIE 11,069,729 11.50%
2 CAITHNESS NOMINEES PTY LTD 4,414,379 4.58%
3 FIDUCIO PTY LTD 2,135,100 2.22%
4 MERRAN K DUNLOP 1,015,352 1.05%
5 MRS MARGARET ELIZABETH DOBBIN 882,897 0.92%
6 NELROSE INVESTMENTS PTY LIMITED <NELROSE ACCOUNT> 673,244 0.70%
7 MR PAUL ERNEST KEARNES 671,974 0.70%
8 DRUMTOCHTY PTY LTD <JAMES BUTLER MED P/L S/F A/C> 613,928 0.64%
9 HSBC CUSTODY NOMINEES (AUSTRALIA) LIMITED 611,874 0.64%
10 NELROSE PTY LTD <ILIFFE SUPER FUND A/C> 604,900 0.63%
11 DATAWEAVE SOLUTIONS PTY LTD <SIROD SUPERANNUATION FUND AC> 579,621 0.60%
12 PATTERSON CARRIERS PTY LTD 500,000 0.52%
13 PONT PTY 482,956 0.50%
14 MR PHILLIP JOHN HOLDEN 466,066 0.48%
15 NELROSE INVESTMENTS PTY LIMITED 465,829 0.48%
16 NEDLOHAEH PTY LTD 464,078 0.48%
17 RW & PM DAVIS SUPERANNUATION PTY LTD <RW & PM DAVIS S/F A/C> 461,136 0.48%
18 DAVID J ILIFFE 442,278 0.46%
19 DR STEVEN KOH 386,858 0.40%
20 MRS MARILYN FAITH BARCLAY + MR JOHN BARCLAY <ESPERANCE SUPER FUND A/C> 356,658 0.37%
Total Top 20 Shareholders 27,298,857 28.35%
Total Remaining Holders Balance 68,999,649 71.65%
Total Shares On Issue 96,298,506 100.00%
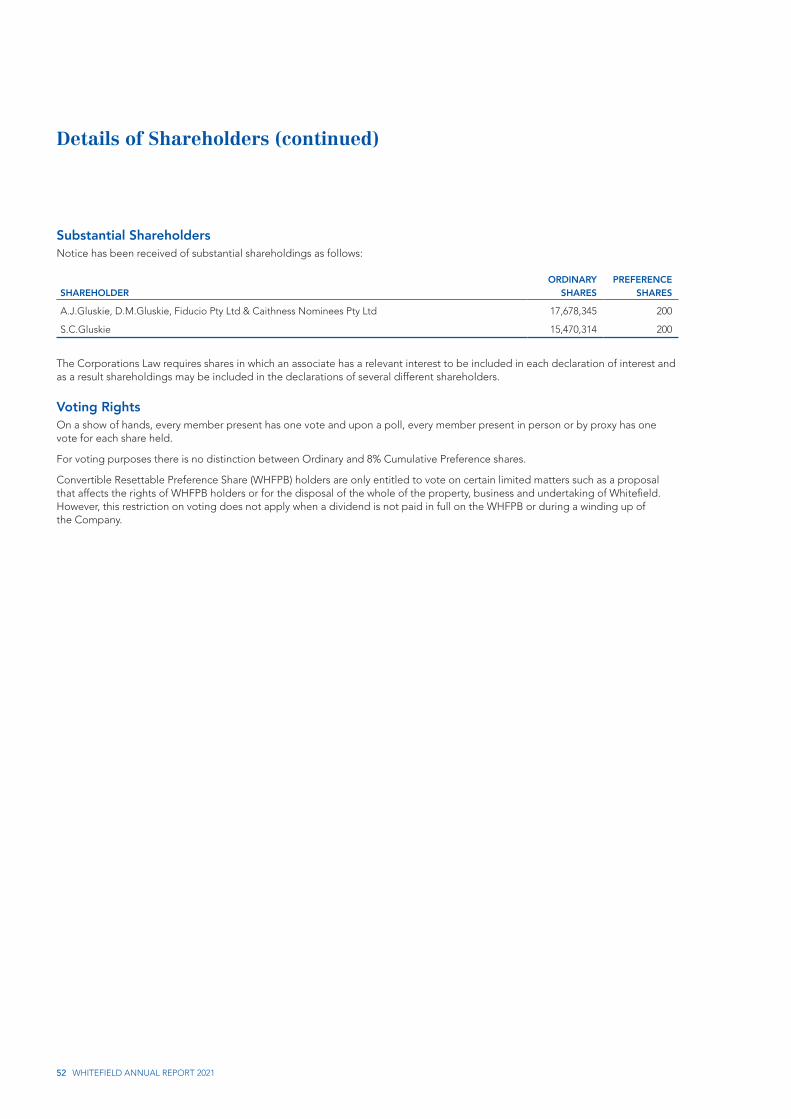
52 WHITEFIELD ANNUAL REPORT 2021
Details of Shareholders (continued)
Substantial ShareholdersNotice has been received of substantial shareholdings as follows:
SHAREHOLDERORDINARY
SHARESPREFERENCE
SHARES
A.J.Gluskie, D.M.Gluskie, Fiducio Pty Ltd & Caithness Nominees Pty Ltd 17,678,345 200
S.C.Gluskie 15,470,314 200
The Corporations Law requires shares in which an associate has a relevant interest to be included in each declaration of interest and as a result shareholdings may be included in the declarations of several different shareholders.
Voting RightsOn a show of hands, every member present has one vote and upon a poll, every member present in person or by proxy has one vote for each share held.
For voting purposes there is no distinction between Ordinary and 8% Cumulative Preference shares.
Convertible Resettable Preference Share (WHFPB) holders are only entitled to vote on certain limited matters such as a proposal that affects the rights of WHFPB holders or for the disposal of the whole of the property, business and undertaking of Whitefield. However, this restriction on voting does not apply when a dividend is not paid in full on the WHFPB or during a winding up of the Company.

53
Other
Registered OfficeThe address of the registered office and principal place of business of the Company is:
Suite 16.01, Level 16, 68 Pitt Street Sydney NSW 2000 Australia
Phone: (02) 8215 7900 Fax: (02) 8215 7901
Share Registry Share registry functions are maintained by Computershare Investor Services Pty Ltd and their contact details are as follows:
Level 4, 60 Carrington Street Sydney NSW 2000 Australia
Phone: 1300 850 505 (inside Australia) (03) 9415 4000 (outside Australia) Fax: (03) 9473 2500
Stock Exchange ListingQuotation has been granted for all the ordinary shares of the Company on all Member Exchanges of the Australian Stock Exchange Limited (ASX).
Best PracticeThe Company has followed all applicable corporate governance principles and recommendations set by ASX Corporate Governance Council during the reporting period.

54 WHITEFIELD ANNUAL REPORT 2021
Directory
Whitefield LtdABN 50 000 012 895
Registered Office:Level 16, 68 Pitt Street Sydney NSW 2000 Australia
Phone: (02) 8215 7900 Fax: (02) 8215 7901
Share Registry:Computershare Investor Services Pty Ltd Level 4, 60 Carrington Street Sydney NSW 2000 Australia
Phone: 1300 850 505 (inside Australia) (03) 9415 4000 (outside Australia) Fax: (03) 9473 2500
Directors:Angus J. Gluskie, Interim Chairman and Managing Director B.Ec, C.A., Graduate Diploma Applied Finance and Investment, F.Fin
Lance Jenkins, LLB, BCA (Vic), MBA (New York)
Mark Beardow, B.Ec, CFA, Graduate Diploma Applied Finance and Investment, Cert Management MGSM
Jenelle Webster, B.Com, CA, Registered Company Auditor, IIAA, GIAA
Will Seddon, B.Ec, CFA, CAIA, SAFin
Company Secretary:Stuart A. Madeley, BA (hons), MBA.
Auditors:MNSA Pty Limited Level 1, 283 George Street Sydney NSW 2000
Stock Exchange Listing:Australian Securities Exchange
Other Information:Whitefield Limited, incorporated and domiciled in Australia, is a publicly listed company limited by shares.

55
Notes

56 WHITEFIELD ANNUAL REPORT 2021
Notes

Notes to the Financial Statements (continued)For the year ended 31 March 2021
57

whi
tefie
ld.c
om.a
u