A Software Tool for Assessing Multi-frameworks Environment
85
A Software Tool for Assessing Multi-frameworks Environment Frederico Samuel Felisberto Thesis to obtain the Master of Science Degree in Information System and Computing Engineering Supervisor(s): Prof. Miguel Leitão Bignolas Mira da Silva Dr a Elisabete Carreira Examination Committee Chairperson: Prof a Ana Teresa Correia de Freitas Supervisor: Prof. Miguel Leitão Bignolas Mira da Silva Member of the Committee: Prof. Carlos Manuel Martins Mendes October 2017
Transcript of A Software Tool for Assessing Multi-frameworks Environment

A Software Tool for Assessing Multi-frameworksEnvironment
Frederico Samuel Felisberto
Thesis to obtain the Master of Science Degree in
Information System and Computing Engineering
Supervisor(s): Prof. Miguel Leitão Bignolas Mira da SilvaDra Elisabete Carreira
Examination Committee
Chairperson: Profa Ana Teresa Correia de FreitasSupervisor: Prof. Miguel Leitão Bignolas Mira da Silva
Member of the Committee: Prof. Carlos Manuel Martins Mendes
October 2017

In memory of my grandfathers Felisberto (1932-2009), Rafael Moiane (1947-2007) and my
grandmother Maria Zimba (1950-1983).
”Grandfathers, sure, I am now different”
ii

Acknowledgments
I would like to express my sincere gratitude to God for blessing me more than I deserve as well as for my
wonderful life and health. Likewise, I would like to thank my mother Teresa Rafael Felisberto, my Father
Samuel Felisberto and my brothers, because without their continuous support and encouragement I
would never ever been able to achieve my goals.
My most sincere thanks go to my advisor and mentor, Professor Miguel Leitao Bignolas Mira da Silva.
I thank him for introducing me to the wonders and frustrations of scientific research and also guiding and
supporting me during the development of this thesis. I also want to thank Rafael Almeida for numerous
helpful advices and inspiring discussions that were indispensable to reach my goals.
Finally, I would like to express my gratitude to Nelson Teodoro, the Country Manager of Novabase
Mozambique and other staff members of Novabase Mozambique, and Portugal who helped me during
this period at Instituto Superior Tecnico.
iii

Resumo
As organizacoes usam modelos para melhorar a sua competitividade. Atualmente, sao aproximada-
mente 315 padroes, guias, manuais e outros documentos prescritivos que sao tidos como referencias
hoje em dia foram desenvolvidos ha muitos anos. Portanto, considerando que nao existe um unico
modelo que atende a todas necessidades que as organizacoes precisam satisfazer, as organizacoes
adotando e implementar praticas se baseando em varios modelos como suporte as suas necessidades.
Para todos os efeitos, a implementacao de processos multimodelos a partir de objetivos compartilhadas
reduz o tempo e os custos excessivos associadas na aquisicao e enquadramento de modelos singu-
lares. No entanto, uma avaliacao baseada em diferentes modelos implica um esforco excessivo porque
cada modelo define seu proprio estrutura de entidades de processo, definicoes, terminologias bem
como abordagens diferentes. Como solucao, e proposto neste trabalho de tese o desenvolvimento de
uma ferramenta de avaliacao de software WEB que utilize uma plataforma de arquitetura empresarial
chamada EAMS para reduzir o esforco necessario para realizar avaliacoes neste tipo de ambientes
multimodais.
Palavras-chave: Arquitetura Empresarial, Avaliacoes em ambientes Multimodais, COBIT,
Ferramenta de Software, ISO 27001, ISO 33052 Modelos de Referencia.
iv

Abstract
Organizations implement and use frameworks to improve organizations competitiveness. Nowadays, ap-
proximately 315 standards, guides, handbooks, and other prescriptive documents which were taken as
frameworks have been developed over time, adding in that way more instability for process quality, norms
and regulations. Taking into account that there is no single framework that meets all the requirements
that organizations need to satisfy, organizations currently demand the implementation of practices of
several framework as support to their needs. However, the assessment of different frameworks implies
an unreasonable effort because each framework defines its own scope, structure of process entities,
definitions, terminology quality systems and approach. Therefore, in this thesis we propose to develop
a software assessment tool that uses an Enterprise Architecture platform called EAMS to reduce the
needed effort to perform assessments in multiframeworks environments.
Keywords: COBIT, Enterprise Architecture,ISO 22001, ISO 33052, Multiframework Environ-
ment Assessments, Frameworks, Software tool.
v

Contents
Acknowledgments . . . . . . . . . . . . . . . . . . . . . . . . . . . . . . . . . . . . . . . . . . . iii
Resumo . . . . . . . . . . . . . . . . . . . . . . . . . . . . . . . . . . . . . . . . . . . . . . . . . iv
Abstract . . . . . . . . . . . . . . . . . . . . . . . . . . . . . . . . . . . . . . . . . . . . . . . . . v
Acronyms . . . . . . . . . . . . . . . . . . . . . . . . . . . . . . . . . . . . . . . . . . . . . . . . ix
List of Tables . . . . . . . . . . . . . . . . . . . . . . . . . . . . . . . . . . . . . . . . . . . . . . ix
List of Figures . . . . . . . . . . . . . . . . . . . . . . . . . . . . . . . . . . . . . . . . . . . . . x
1 Introduction 1
1.1 Background and Motivation . . . . . . . . . . . . . . . . . . . . . . . . . . . . . . . . . . . 1
1.2 Objectives . . . . . . . . . . . . . . . . . . . . . . . . . . . . . . . . . . . . . . . . . . . . . 2
1.3 Thesis Outline . . . . . . . . . . . . . . . . . . . . . . . . . . . . . . . . . . . . . . . . . . 2
2 Research Methodology 3
3 Problem Statement 5
4 Related Work 7
4.1 Appraisal Assistant . . . . . . . . . . . . . . . . . . . . . . . . . . . . . . . . . . . . . . . . 7
4.1.1 Tool description and Features . . . . . . . . . . . . . . . . . . . . . . . . . . . . . . 7
4.1.2 Ratings and findings . . . . . . . . . . . . . . . . . . . . . . . . . . . . . . . . . . . 9
4.2 Appraisal Wizard . . . . . . . . . . . . . . . . . . . . . . . . . . . . . . . . . . . . . . . . . 11
4.2.1 Tool description and Features . . . . . . . . . . . . . . . . . . . . . . . . . . . . . . 11
4.2.2 Rating / Grading Compliance . . . . . . . . . . . . . . . . . . . . . . . . . . . . . . 12
4.2.3 Assessments . . . . . . . . . . . . . . . . . . . . . . . . . . . . . . . . . . . . . . . 13
4.3 SPiCE-Lite . . . . . . . . . . . . . . . . . . . . . . . . . . . . . . . . . . . . . . . . . . . . 14
4.3.1 Features . . . . . . . . . . . . . . . . . . . . . . . . . . . . . . . . . . . . . . . . . 14
4.3.2 Assessment Process . . . . . . . . . . . . . . . . . . . . . . . . . . . . . . . . . . . 14
4.4 CMM Quest v1.3 . . . . . . . . . . . . . . . . . . . . . . . . . . . . . . . . . . . . . . . . . 18
4.4.1 CMMI-DEV v1.3 . . . . . . . . . . . . . . . . . . . . . . . . . . . . . . . . . . . . . 18
4.4.2 Features . . . . . . . . . . . . . . . . . . . . . . . . . . . . . . . . . . . . . . . . . 19
4.4.3 Assessment Process . . . . . . . . . . . . . . . . . . . . . . . . . . . . . . . . . . . 19
4.4.4 Software Process Assessment Tools Comparison . . . . . . . . . . . . . . . . . . 20
vi

4.5 Critical Analysis . . . . . . . . . . . . . . . . . . . . . . . . . . . . . . . . . . . . . . . . . . 22
5 Research Proposal 24
5.1 Design and Implementation . . . . . . . . . . . . . . . . . . . . . . . . . . . . . . . . . . . 24
5.2 Use Case Model . . . . . . . . . . . . . . . . . . . . . . . . . . . . . . . . . . . . . . . . . 25
5.3 Domain Model . . . . . . . . . . . . . . . . . . . . . . . . . . . . . . . . . . . . . . . . . . 26
5.4 Activity Model . . . . . . . . . . . . . . . . . . . . . . . . . . . . . . . . . . . . . . . . . . . 28
5.5 Sequence Model . . . . . . . . . . . . . . . . . . . . . . . . . . . . . . . . . . . . . . . . . 30
5.6 Class Model . . . . . . . . . . . . . . . . . . . . . . . . . . . . . . . . . . . . . . . . . . . . 30
5.7 Component Model . . . . . . . . . . . . . . . . . . . . . . . . . . . . . . . . . . . . . . . . 31
5.8 Deployment Model . . . . . . . . . . . . . . . . . . . . . . . . . . . . . . . . . . . . . . . . 32
5.9 Proposed Framework, their Structure and Mapping . . . . . . . . . . . . . . . . . . . . . . 32
5.10 Support Technologies and Environments . . . . . . . . . . . . . . . . . . . . . . . . . . . . 33
5.11 Tool Description and Prototypes . . . . . . . . . . . . . . . . . . . . . . . . . . . . . . . . 34
5.12 Conclusion . . . . . . . . . . . . . . . . . . . . . . . . . . . . . . . . . . . . . . . . . . . . 35
6 Demonstration 37
6.1 Demonstration with one framework as referenced . . . . . . . . . . . . . . . . . . . . . . . 37
6.1.1 Assessment List . . . . . . . . . . . . . . . . . . . . . . . . . . . . . . . . . . . . . 37
6.1.2 Assessment Definition with one framework referenced . . . . . . . . . . . . . . . . 38
6.1.3 Instances Validation for Processes Without any Relation . . . . . . . . . . . . . . . 39
6.2 Demonstration with more than two frameworks referenced . . . . . . . . . . . . . . . . . . 40
6.2.1 Assessment definition with more than two frameworks referenced . . . . . . . . . 40
6.2.2 Instances Validation for Processes with Relations . . . . . . . . . . . . . . . . . . . 41
6.3 Assessment Details . . . . . . . . . . . . . . . . . . . . . . . . . . . . . . . . . . . . . . . 41
6.4 Conclusion . . . . . . . . . . . . . . . . . . . . . . . . . . . . . . . . . . . . . . . . . . . . 42
7 Evaluation 43
7.1 Metrics and Estimation . . . . . . . . . . . . . . . . . . . . . . . . . . . . . . . . . . . . . . 43
7.2 Data Collection and Analyses . . . . . . . . . . . . . . . . . . . . . . . . . . . . . . . . . . 45
7.2.1 Based on estimated time to perform tasks . . . . . . . . . . . . . . . . . . . . . . . 45
7.2.2 Based on number of clicks to perform tasks . . . . . . . . . . . . . . . . . . . . . . 46
7.2.3 Based on number of errors to perform tasks . . . . . . . . . . . . . . . . . . . . . . 46
7.2.4 Based on System Usability Scale questions . . . . . . . . . . . . . . . . . . . . . . 47
7.3 Conclusion . . . . . . . . . . . . . . . . . . . . . . . . . . . . . . . . . . . . . . . . . . . . 48
8 Conclusion 49
Bibliography 51
A Appraisal Wizard Products Suite Features 54
vii

B Usability test consent Form 64
C Usability Test Case 66
D System Usability Scale Questions 69
E Usability Results 71
viii

Acronyms
Acronyms DescriptionBP Base PracticesWP Work ProductsEGIT Enterprise Governance Information TechnologyITIL Information Technology Infrastructure LibraryCOBIT Control Objectives for Information and Related TechnologiesISO International Organization for StandardizationCMM Capability Maturity ModelCMMI Capability Maturity Model IntegrationIT Information TechnologyDSRM Design Science Research MethodologyUI User InterfacePAM Process Assessment ModelGRC Governance, Risk and ComplianceUML Unified Modeling LanguageUC Use CaseHTML Hypertext Markup LanguageCSS Cascading Style SheetsSUS System Usability ScaleStdev Standard DeviationEA Enterprise Architecture
Table 1: Acronyms List
ix

List of Tables
1 Acronyms List . . . . . . . . . . . . . . . . . . . . . . . . . . . . . . . . . . . . . . . . . . . ix
2.1 DSRM activities’ descriptions. . . . . . . . . . . . . . . . . . . . . . . . . . . . . . . . . . . 4
4.1 SPiCE-Lite Assessment Tool Versions . . . . . . . . . . . . . . . . . . . . . . . . . . . . . 15
4.2 CMM Quest v1.3 Assessment Tool Features . . . . . . . . . . . . . . . . . . . . . . . . . . 20
4.3 List of Software Process Assessment Tools based on different reference models, method-
ologies and standards. . . . . . . . . . . . . . . . . . . . . . . . . . . . . . . . . . . . . . . 23
5.1 List of Use Cases . . . . . . . . . . . . . . . . . . . . . . . . . . . . . . . . . . . . . . . . . 25
5.2 UC 001 Documentation . . . . . . . . . . . . . . . . . . . . . . . . . . . . . . . . . . . . . 27
5.3 List of used Technologies and Environments . . . . . . . . . . . . . . . . . . . . . . . . . . 33
7.1 Task List . . . . . . . . . . . . . . . . . . . . . . . . . . . . . . . . . . . . . . . . . . . . . . 43
7.2 Efficiency: Estimated execution time and number of clicks . . . . . . . . . . . . . . . . . . 44
7.3 Effectiveness: Estimated number of errors . . . . . . . . . . . . . . . . . . . . . . . . . . . 44
7.4 Satisfaction: Estimated SUS answers . . . . . . . . . . . . . . . . . . . . . . . . . . . . . 44
7.5 Result based on time to perform . . . . . . . . . . . . . . . . . . . . . . . . . . . . . . . . 45
7.6 Result analysis for the number of clicks . . . . . . . . . . . . . . . . . . . . . . . . . . . . 46
7.7 Result analysis for the number of errors . . . . . . . . . . . . . . . . . . . . . . . . . . . . 46
7.8 Result analysis for the SUS answers . . . . . . . . . . . . . . . . . . . . . . . . . . . . . . 47
x

List of Figures
2.1 DSRM Process Model . . . . . . . . . . . . . . . . . . . . . . . . . . . . . . . . . . . . . . 3
3.1 Overlapping amongst different frameworks. . . . . . . . . . . . . . . . . . . . . . . . . . . 6
4.1 Appraisal Assistant evidences spreadsheets management. . . . . . . . . . . . . . . . . . 8
4.2 Appraisal Assistant evidences registry management. . . . . . . . . . . . . . . . . . . . . . 9
4.3 Appraisal Assistant project creation. . . . . . . . . . . . . . . . . . . . . . . . . . . . . . . 9
4.4 Appraisal Assistant project definition. . . . . . . . . . . . . . . . . . . . . . . . . . . . . . . 10
4.5 Appraisal Assistant ratings and findings. . . . . . . . . . . . . . . . . . . . . . . . . . . . . 10
4.6 Evidences collection structure. . . . . . . . . . . . . . . . . . . . . . . . . . . . . . . . . . 12
4.7 Appraisal Wizard evidences management. . . . . . . . . . . . . . . . . . . . . . . . . . . . 12
4.8 Appraisal Wizard Rating. . . . . . . . . . . . . . . . . . . . . . . . . . . . . . . . . . . . . 13
4.9 The SPiCE-Lite Process Model. . . . . . . . . . . . . . . . . . . . . . . . . . . . . . . . . . 14
4.10 Select the processes to assess. . . . . . . . . . . . . . . . . . . . . . . . . . . . . . . . . . 15
4.11 ”Fill In” - Answer / rate the processes. . . . . . . . . . . . . . . . . . . . . . . . . . . . . . 16
4.12 ”Analyze” - Evaluatıon and charting. . . . . . . . . . . . . . . . . . . . . . . . . . . . . . . 17
4.13 ”Reporting” - Generate Word, PowerPoint and HTML reports. . . . . . . . . . . . . . . . . 17
4.14 CMMI Model Components. . . . . . . . . . . . . . . . . . . . . . . . . . . . . . . . . . . . 18
4.15 Capability Levels in CMMI. . . . . . . . . . . . . . . . . . . . . . . . . . . . . . . . . . . . 19
4.16 ”Prepare” - Select the processes to assess . . . . . . . . . . . . . . . . . . . . . . . . . . 20
4.17 ”Fill In” - Answer / rate the processes . . . . . . . . . . . . . . . . . . . . . . . . . . . . . . 21
4.18 ”Analyze” - Evaluatıon and charting . . . . . . . . . . . . . . . . . . . . . . . . . . . . . . . 21
4.19 ”Reporting” - Generate Word, PowerPoint and HTML reports . . . . . . . . . . . . . . . . 22
5.1 Use Case Model. . . . . . . . . . . . . . . . . . . . . . . . . . . . . . . . . . . . . . . . . . 25
5.2 Domain Model. . . . . . . . . . . . . . . . . . . . . . . . . . . . . . . . . . . . . . . . . . . 26
5.3 Activity Model. . . . . . . . . . . . . . . . . . . . . . . . . . . . . . . . . . . . . . . . . . . 28
5.4 Sequence Model. . . . . . . . . . . . . . . . . . . . . . . . . . . . . . . . . . . . . . . . . . 29
5.5 Class Model. . . . . . . . . . . . . . . . . . . . . . . . . . . . . . . . . . . . . . . . . . . . 30
5.6 Component Model. . . . . . . . . . . . . . . . . . . . . . . . . . . . . . . . . . . . . . . . . 31
5.7 Deployment Model. . . . . . . . . . . . . . . . . . . . . . . . . . . . . . . . . . . . . . . . . 32
5.8 Different approaches and structures for PAM. . . . . . . . . . . . . . . . . . . . . . . . . . 33
xi

5.9 UI Prototype: Proposed Home Interface . . . . . . . . . . . . . . . . . . . . . . . . . . . . 34
5.10 UI Prototype: 1-Proposed Assessment Interface . . . . . . . . . . . . . . . . . . . . . . . 34
5.11 UI Prototype: 2-Proposed Assessment Interface . . . . . . . . . . . . . . . . . . . . . . . 35
5.12 UI Prototype:Assessing interface . . . . . . . . . . . . . . . . . . . . . . . . . . . . . . . . 36
6.1 Assessment List . . . . . . . . . . . . . . . . . . . . . . . . . . . . . . . . . . . . . . . . . 38
6.2 1 Assessment definition . . . . . . . . . . . . . . . . . . . . . . . . . . . . . . . . . . . . . 38
6.3 2 Assessment definition Interface with one process selected . . . . . . . . . . . . . . . . 39
6.4 1 Carrying out assessments interfaces with one framework referenced . . . . . . . . . . . 39
6.5 2 Carrying out assessments interfaces with one framework referenced . . . . . . . . . . . 40
6.6 Assessment definition Interface with two or more processes selected . . . . . . . . . . . . 40
6.7 1 Carrying out assessments interfaces with two or more frameworks referenced . . . . . 41
6.8 Assessments details interfaces . . . . . . . . . . . . . . . . . . . . . . . . . . . . . . . . . 41
xii

Chapter 1
Introduction
The aim of this chapter is to describe the thesis motivation, research objectives and how the thesis is
structured. The general objective which is presented hereinafter is split into smaller objectives (called
partial objectives) which are easier to be achieved. Overall, were defined five partial objectives that must
be fulfilled in order to achieve the general objective.
Therefore, in order to maintain the consistence in whole document, we will use the word framework
to describe any standard, guide, handbook and any prescriptive document as well.
1.1 Background and Motivation
Taking into account that there is no single framework that meets all the requirements that organizations
need to satisfy, organizations currently demand the implementation of practices from two or more frame-
works as support to their needs [1]. This situation allows organizations to select and complement their
processes from the frameworks which better fit their contexts, e.g. if a framework like the NIST Hand-
book [2], is not suitable, then an organization can decide to implement ISO 27002. To all intents and
purposes, the implementation of multimodel processes from shared goals reduces time and excessive
expenditures associated to the adoption of multiple frameworks.
However, although the huge number of existing frameworks has countless advantages, but also has
some associated disadvantages such as the required human effort, time, costs, human failures and
overlapping amongst frameworks.
Thus, the integration of several frameworks, example: the ISO 9001 and CMM [3], CMMI and ITIL [4],
CMMI and ISO 12207 and so forth, has became the solution adopted by many organizations to address
this kind of issues.
Bearing in mind all these aspects above, we propose a solution that intends to solve these problems.
The proposed solution is divided in two phases: (i) mapping and integration of the different frameworks in
a Enterprise Architecture tool called EAMS with collaboration of [Renato Lourinho], and (ii) development
of a software tool that will allows multiframeworks assessments.
1

1.2 Objectives
To achieve the expected results it is important to identify, analyze and define the general objective.
Usually, the general objective is difficult to be achieved as a whole, so the general objective must be
refined in smaller objectives with a more constricted but more precise scope. Nevertheless, are defined
the following general objectives:
To develop a WEB tool to assess different frameworks simultaneously. In that way organizations
can reduce the resources needed (time, effort, people) to assess multi frameworks environments.
In order to achieve the general objective, there are five partial objectives which must be fulfilled:
(i) Carry out an in-depth study in the structure and composition of each framework and to each
existing software.
(ii) Define unique terminologies and structure, which outline processes, base practices and work prod-
ucts.
(iii) Mapping models such as COBIT 5 and ISO 33052 into EAMS 1, eliminating overlap through the
determining the existing similarities [Renato Lourinho Master Thesis].
(iv) Validate all frameworks and metamodel within EAMS [Renato Lourinho Master Thesis].
(v) Choose the technologies for software developing and in-depth study the EAMS REST Services
(GET, POST, PUT, DELETE).
1.3 Thesis Outline
The aim of this subsection is to describe how this document is structured. In Section 2 the authors
present the research methodology used in this thesis. Section 3 describes the research problem. In
Section 4 the authors introduce the main approaches and similar software tools that served as inspiration
for this research.
Section 5 describes this thesis’ proposal. In section 6 the authors present the demonstration of the
software tool, and the evaluation is presented in Section 7. We finish this document in Section 8 with
the conclusions, contributions, limitations and future work.
1EAMS is an innovative solution to keep architectural representations up-to-date with minimum effort. EAMS is able to generateon-the-fly organization wide architectural blueprints (models, maps or diagrams) based on information gathered from catalogs andother information sources within the organization.This allows managers, architects and technical leaders to explore and navigateover a full graphical view of the organization’s business, systems and infrastructure [5].
2

Chapter 2
Research Methodology
The Design Science Research Methodology (DSRM) was the research methodology adopted in this
research. The DSRM is appropriate for researches that seeks to extend the boundaries of human and
organizational capabilities by creating new and innovative artifacts [6].
This methodology can also be applied to information technology in order to solve organizational
problems. DSRM differentiates from others research paradigms because it attempts to develop and
reach artifacts that can be proven effective in real world scenarios [7]. Peffers et al. [7] propose a process
model consisting of six iterative activities in a nominal sequence, which can be seen in Figure 2.1. Table
2.1 describes each of these activities and show how each activity is addressed in this research.
Figure 2.1: DSRM Process Model [8].
3

Activities Addressing each phase of DSRMProblem identification and motivation: Definethe specific research problem and justify the valueof a solution
Existing tools do not allow assessors to carryout simultaneously assessments and sharing ev-idences amongst related instances as well.
Definition of the objectives of a solution: Inferthe objectives of a solution from the problem defi-nition and knowledge of what is possible and fea-sible
Development of a WEB tool to assess differentframeworks simultaneously. In that way organiza-tions can reduce the resources needed (time, ef-fort, people) to assess multi frameworks environ-ments.
Design and development : Determine the arti-facts desired functionality and its architecture andthen creating the actual artifact
A WEB Software Tool that uses an Enterprise Ar-chitecture tool called EAMS to assess multi frame-works.
Demonstration: Demonstrate the use of the arti-fact to solve one or more instances of the problem.May involve its use in experimentation, simulation,case study, proof, or other appropriate activity
The demonstration was performed in one of thelargest banks in Portugal using two processes ofCOBIT 5 and ISO 33052 as foundation.
Evaluation: Observe and measure how well theartifact supports a solution to the problem. In-volves comparing the objectives of a solution to ac-tual observed results from use of the artifact in thedemonstration.
Usability Tests , Interviews and Laboratory experi-ment [9].
Communication: Communicate the problem andits importance, the artifact, its utility and novelty,the rigor of its design, and its effectiveness to re-searchers and other relevant audiences.
DissertationSubmission to the 30th International Conferenceon Advanced Information Systems Engineering.
Table 2.1: DSRM activities’ descriptions. Adapted from [6, 7, 9]
4

Chapter 3
Problem Statement
Approximately 315 standards, guides, handbooks, and other prescriptive documents which were taken
as frameworks have been developed over time [10]. Taking into account that there is no single framework
that meets all the requirements that organizations need to satisfy, organizations currently demand the
implementation of practices of several frameworks as support to their needs.
The key reason why organizations use these frameworks is to ensure that they meet performance
and compliance requirements. It means that, organizations must continually improve IT performance
with regard to its economic efficiency.
In order to undertake continual improvement activities many organizations perform process assess-
ments. These assessments involve the systematic measurement, analysis and reporting of the perfor-
mance of core processes. The results are then used to evaluate the capabilities of these processes and
drive process improvement activities.
In that way, continual improvement requires the company’s positioning with regard to its IT capabilities
and the quality of its goods and services. As a rule, this positioning involves a comparison with the
company’s goals, external requirements (e.g. customer demands, laws or guidelines), or benchmarks.
For each aspect of the company’s IT under investigation, the questions arise what needs to be
measured, how, and what to compare it with, in order to assess the current situation of a company
and to assign it a specific quality or degree of maturity [11]. Moreover, organizations struggle with the
perceived complexity and difficulty of adopting and assessing several frameworks at the same time [10],
because each practice defines its own scope, definitions, terminologies and structure. Therefore, one
can argue that several of these Enterprise Governance of IT Frameworks overlap each other as one
which can be seen in Figure 3.1.
At a time when organizations strive to be efficient and effective, it seems counter intuitive to be wast-
ing resources by having different organizational departments handling both approaches independently
[12].
In that way, this thesis intends to facilitate the assessment of different frameworks in order to avoid
and help stakeholders to reduce the effort needed to assess several frameworks (COBIT, ITIL, ISO
27000 and so forth) simultaneously. The authors intend to achieve this goal by developing a Web based
5

Figure 3.1: Overlapping amongst different frameworks.
software tool with EAMS as foundation in order to be integrated with EA . So, with both integrated, can
be possible to transform a legacy of fragmented applications, organizational structures and processes
(both manual and automated) into an integrated environment with optimised processes that are respon-
sive to change and the delivery of the business strategy [13]. The proposal, is a WEB based software
tool, developed with REST API 2 technology, composed by REST services and developed under EAMS
WEB tool by remote invocations of services. Furthermore, the tool was developed to support multiple
assessments simultaneously as long as different structures are mapped into EAMS allowing the stake-
holders/assessors to perform desired assessments using different frameworks at same time.
6

Chapter 4
Related Work
The aim of this section is to describe and compare similar approaches that served as inspiration for the
proposed solution. Beyond to describe their similarities amongst reported tools in this research, we will
also present their limitations. In that way, we intend to prove that the reported software tools do not solve
this thesis problem. Table 4.3 shows the list of existing software tools.
Therefore, in this Section we will describe four assessment tools oriented to processes quality. The
others tools will be referenced in Table 4.3. The order in which they are described is (i) Appraisal
Assistant, (ii) Appraisal Wizard, (iii) SPiCE-Lite and (iv) CMMiPal v1.3.
4.1 Appraisal Assistant
Appraisal Assistant is an stand-alone software which supports assessment of organizational maturity
and process capability. It closely follows approaches consistent with the requirements of ISO/IEC 15504
- Information technology: Process assessment and the Assessment Requirements for CMMI.
4.1.1 Tool description and Features
Unlike other existing tools, Appraisal Assistant takes an explicitly evidence-driven approach to record-
ing the information generated in an assessment [14]. The evidences are arranged by instances and
collected using spreadsheets as illustrated in Figure 4.1. Furthermore, the evidences can be imported
from older projects using evidence registry of the tool as illustrated in Figure 4.2.
7

Figure 4.1: Appraisal Assistant evidences spreadsheets management [14].
Appraisal Assistant provide innumerable features and some of them are listed below:
• Support for multiple process models which includes ISO/IEC 15504-5, ISO/IEC 15504-6, SPICE,
and CMMI staged/continuous representation as ilustrated in Figure 4.3 [14].
• Support for user defined appraisal models as illustrated in Figure 4.4 [14].
• Support for multiple methods including SCAMPISM A (v.1.2) and B Class, and generic ISO/IEC
15504 conformant assessment methods.
• Support for user defined assessment methods [14].
• Support for conversion of results from one framework to another; i.e. expression of CMMI Ap-
praisal results as ISO 15504 standard process profiles,and definition of coverage of ISO 9001
requirements by CMMI or ISO 15504 assessments / appraisals [14].
• Facility to split and consolidate evidence capture activities within the team through the establish-
ment of mini-teams [14].
• Automatic generation of a variety of reports, including Appraisal Disclosure Statement, PIID, As-
sessment Record, Appraisal / Assessment Findings, Strength / Weakness summaries, Rating Pro-
files, and workload summaries [14].
8

Figure 4.2: Appraisal Assistant evidences registry management [14].
• Automatic reporting of model coverage by collected evidence, to meet the requirements of the
SCAMPISM A v.1.2 method [14].
Figure 4.3: Appraisal Assistant project creation [14].
4.1.2 Ratings and findings
The Appraisal Assistant provides an interface to customize rating through scheme editor as illustrated
in Figure 4.5. However, to support all rating options defined, SCAMPI v1.1 MDD provide automatic
aggregate lower level for rating and findings.
9

Figure 4.4: Appraisal Assistant project definition [14].
Additional information about Appraisal Assistant tool functionalities, ratings, methods, and findings
can be seen in [14]. The referenced bibliography provide some interfaces, it being possible to ask the
owners for demo version and more specification about the tool.
Figure 4.5: Appraisal Assistant ratings and findings [14].
10

4.2 Appraisal Wizard
Appraisal Wizard is a comprehensive solution to assist management and execution of planning, prepa-
ration, data collection, consolidation, reporting of appraisals, audits, compliance and process checks
[15].
Its functionality helps businesses organize and monitor compliance against frameworks and gover-
nance activities using any internal or external model, method or standard. Appraisal Wizard facilitates
improved audit readiness, more effective planning, and efficient preparation, on-site, and post-appraisal
activities [15, 16].
Note: This subsection includes various functionalities to be described such as (i) working with col-
lected documents (ii) working with appraisal records, (iii) methods of reviewed collected data, (iv) reports,
(v) finds etc. Being impossible to describe all of them, we suggest you to read the following reference
for more information [16]. Bearing in mind their comprehensiveness, we will focus only in documents
management, ratings and main activities to carry out assessments.
4.2.1 Tool description and Features
Appraisal Wizard is characterized by a variety of functionalities. Appendix A shows some of these
functionalities which includes other tools versions such as Appraisal Wizard Lite, Model Wizard and
Model Mapper. The detailed information regarding these, functionalities and consideration please refer
[17].
Likewise Appraisal Assistant, also Appraisal Wizard takes an explicitly evidence -driven approach,
Figure 4.7 shows how they are configured for each project, and there consist of:
Documents Recorded in the database and then connected to model elements or appraisal records and
act as supporting evidence of compliance when so connected [16].
Appraisal records Recorded in the database and usually connected to model elements to provide
information about model compliance, noncompliance, expected evidence, interview questions to
be asked, corrective actions needed and any other type of information the user would care to
associate or record [16].
Figure 4.6 shows documents logical of how they can be connected to models and standards or
appropriate part of it. There are many others available methods and operations that can be used to
created or updated documents which are referenced in [16].
With Appraisal Wizard, audits and practitioners can perform following actions [16]:
• Conduct high quality appraisals using a variety of methods.
• Work with industry standard models such as CMMI, ISO 9001, ITIL, P-CMM, eSCM, ISO 15288,
DMM, and ISD’s ISF.
• Reuse appraisal assets, evidence, or appraisal results.
11

(a) Connected to the model element via an appraisal record (b) Directly connected to the model element
Figure 4.6: Evidences collection structure.
• Use the historical database to compare results across business units or monitor progress over
time.
Figure 4.7: Appraisal Wizard evidences management [16].
4.2.2 Rating / Grading Compliance
The rating process in Appraisal Wizard is manual exception for SCAMPI methodology, where practice
characterization, goal and coverage rating values are suggested based on the information collected.
Even in this case, a manual verification of the data should be performed and overrides may be made
[16].
The rating process commonly involves either of two approaches: (i) examining the appraisal record
information and evidence collected against the model elements or its subordinate elements, as can
seen in Figure 4.8 - (a) or (ii) rating model elements based on the ratings assigned to subordinate model
elements as illustrated in Figure 4.8 - (b) [16].
12

(a) Rating using the model element (b) Ratings based on subordinate model elements
Figure 4.8: Appraisal Wizard Rating.
Please, refer the following bibliography [16] for detailed information and to see how the ratings can
be defined.
4.2.3 Assessments
The model wizard tool is based on record models i,e. standards, procedures, processes, checklists and
audit criteria within database that can be referenced by other products(e.g: Appraisal Wizard) to collect
information related to the model and tying this information to the relevant parts of the model [16].
Currently, organizations may need to implement different frameworks and Appraisal model includes
Model Mapper to deal with it by allowing organizations to define relationships between the contents of
two different models. Only recorded models within Model Wizard database are allowed to be mapped
[16].
13

4.3 SPiCE-Lite
SPiCE-Lite is the self assessment tool for software development organizations, projects management
to evaluate and analyze the software development processes, quickly and efficiently. This tool allows
to perform an assessment and also to determine strengths and weaknesses concerning the way of
software development [18]. Figure 4.9 illustrates the corresponding process model.
Additionally SPiCE-Lite is useful to rate the most important process categories for software develop-
ment and the results contains comprehensive evaluations and analysis in the form of charts. The rating
process can be done within a group of organization (Self-Assessment) or guided using the help of a
consultant (Guided Self-Assessment) [18].
Figure 4.9: The SPiCE-Lite Process Model: [18].
4.3.1 Features
SPiCE-Lite poses various features and they are enabled according the previous agreement between the
client and owner. Table 4.1 illustrates all of available versions as well as the available features for each
of version.
The Company and Corporate version they includes another integrated software called SynEval which
allows the assessors to calculate ratings for two or more evaluation based on frequency distribution [18].
The Corporate solution includes another software tool called SynEdit which is used to customize the
SPiCE-Lite assessment tool for individual needs [18].
4.3.2 Assessment Process
The assessment process comprise four steps. The first step which can be seen in Figure 4.10 allows
the assessors to select from available processes list the processes to assess. The available processes
list can be sorted by processes group or by category.
14

Solution FeaturesPersonal Open a new assessment or
Open an existing AssessmentSelect among the processesEnter ratingsRead the definitions and explanationsEvaluate assessment ratingsHave a look at the charts and evaluationsPrint the chartsCopy pictures (charts) to clipboard or save to disk to create own assessment reportCopy data to clipboard or save to disk in SPiCE format to create own charts, e.g. withExcelExport function to send all data (including definitions, explanations etc.) to text file orHTML format.
Company Merge functionality, to combine two assessment files into oneAdaptable WinWord and PowerPoint templatesAdditional software SynEval
Corporate Include software tool SynEdit. The processes can be edited and enhanced, the expla-nations can link to your company own documents and all icons and captions can beadapted.
Table 4.1: SPiCE-Lite Assessment Tool Versions [18]
Figure 4.10: Select the processes to assess: [18].
15

Once the processes are selected, in second step the assessor must answer the available questions
regarding the software production and rating them as well. So, SPiCE-Lite poses 37 questions regarding
the software production and more than 300 definitions and explanations cover software quality manage-
ment and software engineering [18].
Figure 4.11 illustrates the base practices and how their are rating. For this purposes were defined and
used some terminology which are denoted by following letters: ”N-Not achieved, P-Partially achieved,
L-Largely Achieved and F-Full Achieved”.
Figure 4.11: ”Fill In” - Answer / rate the processes: [18].
The third step corresponds to the Analyze. In this step the assessors can generate the charts. Figure
4.12 shows how graphically the analyze step is look like. The fourth step corresponds to the Reporting.
This features allows to generate reports and export to the Word, Power-Point or HTML format. Figure
4.13 show the available options and a sample of a report.
There are several available interfaces to be described for this tool, specifically for the second and
third steps. For additionally information abut this tool please refer [18].
16

Figure 4.12: ”Analyze” - Evaluatıon and charting: [18].
Figure 4.13: ”Reporting” - Generate Word, PowerPoint and HTML reports: [18].
17

4.4 CMM Quest v1.3
The approach in CMM Quest v1.3 is similar to that described in Section 4.3. The only difference between
both is that, the CMM Quest v1.3 besides to include all features is compliant to CMMI-DEV v1.3.
4.4.1 CMMI-DEV v1.3
CMMI-DEV v1.3 is the current version of CMMI (successor of the well known CMM, the American
pendant to the European ISO 15504 respectively Spice). CMM Quest v1.3 is compliant to the continuous
and staged representation of CMMI-DEV v1.3.
The continuous representation allows the assessors to select the desired order of improvement that
best meets the organizations business objectives and mitigates the organizations areas of risk. Addition-
ally to this, allows the organizations to compare the process areas by process area basis or comparing
results through the use of equivalent staging [19].
CMMI-DEV v1.3 Components
The components for continuous and the staged representations are process areas, specific goals, spe-
cific practices, generic goals, generic practices, typical work products, subpractices, generic practice
elaborations and references which can be seen in Figure 4.14. These components fall apart into three
groups namely, required, expected and informative model components [19].
Figure 4.14: CMMI Model Components [19].
Specific goals and generic goals describes the required model components which must be achieved
by an organizations planned and implemented processes [19].
Specific practices and generic practices describes the expected model components which corre-
sponds what an organization will typically implement to achieve a required component [19].
Informative components provide details that help model users get started in thinking about how to
approach goals and practices (model components that help model users understand the goals
and practices and how they can be achieved) [19].
18

Capability levels
All CMMI models with a continuous representation reflect capability levels in their design and content
and consists of related specific and generic practices for a process area. Capability levels build on each
other, providing a recommended order for approaching process improvement. There are four capability
levels, designated by the numbers 0 through 4 as illustrated in Figure 4.15.
Figure 4.15: Capability Levels in CMMI [19].
Reaching capability level 1 for a process area is equivalent to saying you perform the process area,
or more precisely, you are achieving the specific goals of the process area [19].
Reaching capability level 2 for a process area is like saying you manage your performance of the
process area. There is a policy that indicates you will perform it (that is, a process or processes
that are intended to cover it). There is a plan for performing it, there are resources provided,
responsibilities assigned, training on how to perform it, selected work products from performing
the process area are controlled, etc [19].
Reaching capability level 3 for a process area assumes that there is an organizational standard pro-
cess or processes that cover that process area that can be tailored to the specific need [19].
4.4.2 Features
CMM Quest v1.3 provides two versions, the Personal Edition and Corporate Edition. The difference
between them is related to supported features. Table 4.2 show the existent features for each version. The
Corporate Edition includes SynEval that allows an efficient evaluation when two or more assessments
are performed and SynEdit that allows to customize the appraisal tool to fit individual needs.
4.4.3 Assessment Process
Likewise 4.3, also in CMM Quest v1.3 the assessments are performed in four steps namely: (i) Prepare,
(ii) Fill in, (iii) Analyze and (iv) Reports. Figure 4.16 corresponds to the first step and shows how assess-
ments are carried out. In this step, basically the assessors are allowed to select the processes from the
available processes list.
19

Solution FeaturesPersonal Edi-tion
Open a new appraisal orOpen an existing appraisalSelect among the processesEnter ratings and contentsRead the definitions and explanationsEvaluate appraisal ratingsHave a look at the charts and evaluationsPrint the chartsCopy pictures (charts) to clipboard or save to disk to create own appraisal reportExport function to send all data (including definitions, explanations etc.) to Word, Pow-erPoint or HTML format.
CorporateEdition
Individual customization’s i.e for your department or your company and to equip yourorganization with the appropriate version of CMM Quest v1.3
Table 4.2: CMM Quest v1.3 Assessment Tool Features [19]
Figure 4.16: ”Prepare” - Select the processes to assess [19]
Once selected processes, the next step is to answer the available questions and ratting them based
on achieved results in each work product which can be seen in Figure 4.17.
Figure 4.18 corresponds the third step, the analyze or evaluation. The evaluations are based on 4
criteria, Not, Partially, Largely and Full achieved. Once evaluated, the next step is the reporting that
corresponds to the fourth step that can be seen in Figure 4.19. The supported formats are Word,
PowerPoint and HTML.
4.4.4 Software Process Assessment Tools Comparison
There are several software process assessment tools reported in this thesis, and Gazel et al. provide
a list with some of these tools [20]. For this thesis, we described only four of them providing existing
20

Figure 4.17: ”Fill In” - Answer / rate the processes [19]
Figure 4.18: ”Analyze” - Evaluatıon and charting [19]
similarities and differences.
Reviewing the latest versions of the tools, we compared their attributes in Table 4.3 with respect
to: assessment method supported, type of the application (stand-alone or web-based), and support for
self-assessment.
21

Figure 4.19: ”Reporting” - Generate Word, PowerPoint and HTML reports [19]
4.5 Critical Analysis
Four Software Process Assessment Tools were described in this section. So, the reported tools in this
section, were developed to evaluate and analyze software development processes, which means that,
there are able to measure the maturity level achieved by assessed processes withing those organiza-
tions.
Considering the CMM Quest v1.3 and SPICE-Lite. Both tools as can be seen in illustrated interfaces
or description, are quite similar (same goals, interfaces and features) and although they were designed
for different contexts they share same purposes. The only difference between both is concerning to the
standards and methods supported by each one of them.
However, it should also be said that, organizations are not looking for this kind of software, i.e,
software’s which support singular framework but, they need unique software which is capable to support
any framework. The software integrity, overlapping amongst frameworks and others issues are extended
to the rest of the tools reported in this thesis, except the Hprocess Tool which define ontology amongst
frameworks without identify existing relations, similarities or differences amongst entities.
This tool brings a new insight into this industry by defining a unique ontology for these frameworks
and terminologies as well as for different frameworks. Nevertheless, all of these tools poses static
structure and they have been developed and addressed specifically to certain frameworks which make
all of them cumbersome for integrated environment.
Our solution has advantages over all others tools reported in this section in two important aspects.
(I) Assess several frameworks simultaneously, i.e, the collected evidences can be shared amongst all
related instances within the assessment. In other words, while you are evaluating the COBIT processes,
22

Name Description Assessmentmethodsupported
Stand-aloneorWeb-based
Supportforself-assessm.
Appraisal As-sistant [14]
Developed by Software Quality Institute of Griffith Univer-sity. Supports assessment of organizational maturity andprocess capability. Models and mapping data are storedin a Microsoft Access database.
SCAMPI,SPICE
Stand-alone
No
AppraisalWizard [15]
A Windows-based product developed by Integrated Sys-tem Diagnostics Incorporated. Can co-operate with ModelWizard. Aimed to support management of planning,preparation, data collection, merging, and reporting ac-tivities as related to process assessments and processaudits. Data from assessments and audits are stored in arelational database.
SCAMPI,SCE, CPA IPI
Stand-alone
Yes
SPiCE-LiteTool [18]
Developed by HM& S IT-Consulting to assess confor-mance of organizational processes to ISO/IEC 15504 re-quirements. Assessment data are stored in a relationaldatabase.
ISO/IEC15504
Stand-alone
Yes
COBIT 5 Self-AssessmentTool [21]
This online application is designed to make the self-assessment of IT-enabled enterprise processes more ef-ficient, more effective and more inclusive. Whether youare conducting self assessments to prepare for an inde-pendent, third party assessment or determining processcapability levels within any facet of your enterprise oper-ations, the COBIT 5 Self-Assessment Tool simplifies andstreamlines the assessment process using COBIT 5, theworld’s leading framework for the governance and man-agement of enterprise IT.
COBIT - PAM Web-based
Yes
HProcess [22] Developed by [22] researchers with process harmoniza-tion purpose. Support different models, methodologiesand standards to assess and improve existing processquality as well.
Models,Methodolo-gies andStandards
Web-based
Yes
CMMiPal v1.0[23]
Developed by Chemuturi Consultancy. Enables manualmapping of an organization’s processes to CMMI prac-tices. Model and mapping data are stored in a MicrosoftAccess database.
Closer toSCAMPI
Stand-alone
No
CMM-Questv1.3 [19]
Developed by HM & S IT-Consulting to support processassessments based on CMMI-Dev v1.3. Provides func-tionalities for selecting process areas and target levels aspreparation, text-based screens for data collection, graph-ics for data analyses, and Microsoft Word and HTMLbased reporting facilities.
ISO/IEC15504
Stand-alone
Yes
SPICE 1-2-1[24]
Developed by HM & S IT-Consulting to support processassessments in accordance with ISO/IEC 15504.
ISO/IEC15504
Stand-alone
Yes
Model Wizard[25]
A Windows-based application developed by IntegratedSystem Diagnostics Incorporated. Enables users to storetheir process models in a relational database.
Not applicable Stand-alone
No
Table 4.3: List of Software Process Assessment Tools based on different reference models, methodologies andstandards. Adapted from [26].
if there are related processes within the same assessment, such as ISO or ITIL, they are also evaluated.
(II) By having EA as foundations, organizations could improve their competitiveness by (re-)defining how
they will do business and design the processes and infrastructure critical to their current and future oper-
ations [13]. Furthermore, EA as provides organizations with the ability to conduct impact assessments,
analyze alternative scenarios and implement appropriate strategies [13].
23

Chapter 5
Research Proposal
The aim of this section is to describe the proposed solution stated and detailed in Section 3. However,
to achieve our goal, we choose the Unified Modeling Languages - UML notation to describe the required
artifacts for both phases (design and implementation).
Furthermore, is included and demonstrated, the proposed low fidelity prototypes (sketches) and
the high fidelity prototypes which comprise the refined and stable interfaces of the tool. Additionally,
we present a list of the used technologies which includes the development environment, programming
languages and deployment environment.
5.1 Design and Implementation
This section presents in detail the Design and Implementation phases proposed in the DSRM. The
business processes description is done in the analysis phase which usually includes models and dia-
grams as stated in the Rational Unified Process development methodology [27]. The proposed solution
comprises eleven Use Cases (UC) which can be seen in Table 5.1.
Due to the number of existing UC and their complexity we will not describe all of them, i.e, only the
main which corresponds to the Create Assessment (UC 001). Thus, the business description is made
by using UML diagrams and will comprise the following diagrams or models: Use Case, Domain, Activity,
Sequence, Component, Class and Deployment.
• Design: The design phase begins with the business processes analysis, i.e defining the problem
in architectural view which aims to present how the system should be developed. Both in design
and implementation, the business processes descriptions can be created using UML notations to
draw all models and diagram or using textual representation in case of Use Case description.
• Implementation: This phase corresponds to the software development and comprise the following
sub-phases: define the system organization into subsystems, implement all elements from design
phase, tests and integration.
24

Initials DescriptionUC 001 Create AssessmentUC 002 Delete AssessmentUC 003 Update AssessmentUC 004 Validate AssessmentUC 005 Create AccountUC 006 Delete AccountUC 007 Check AccountUC 008 Update AccountUC 009 Recover PasswordUC 010 LoginUC 011 Logoff
Table 5.1: List of Use Cases
5.2 Use Case Model
The Use Case models are used to help identify user roles, and usually are focused on user goals. Their
representation is based on in graphs, stereotypes which present actors of system, workers, Use Cases
and relationships. The Use Case model corresponds to an external view of a system.
Additionally, Use Case models can be seen as high-level representation, i.e, can be seen as a high-
level of abstraction about the interactions amongst external elements and system features. The graphical
representation for the solution is illustrated in Figure 5.1.
Figure 5.1: Use Case Model
25

Description of Use Case UC 001
The aim of this subsection is to present the textual description or documentation of Use Case Create
Assessment.
Use Case documentation describes actions, their flow and who start and perform the actions. Fur-
thermore, the Use Case description begins with definition of common terminologies to be used while
describing the Use Case (eg: name, acronyms and so on) including the users identification, dependen-
cies with others Use Cases and pre/post conditions. Table 5.2 presents the textual representation of
Create Assessment Use Case.
5.3 Domain Model
A domain model is widely used as an inspiration source for software designer and will be an important
input artifact required for subsequent steps [28].
The domain model illustrates significant conceptual classes to modelers and it is an important artifact
to be created during business analysis and particularly to object-oriented analysis. Figure 5.2 presents
the domain model of solution which includes five main tables that define assessment architecture and
three for user definition.
Figure 5.2: Domain Model
26

UC Name Create Assessment UC 001
DescriptionThe UC 001 describes how Assessment are cre-ated and includes pre-condition, post-conditions aswell as external invocations from the EAMS system.
Actors: Assessor & Leader Assessor
Pre-condition: The user should be logged before perform this action.Post-conditions: Assessment created.
Main Flow
Actors System Response EAMS Response
1. The process begins when theuser click New Assessment but-ton.2. Fill the required fields andclick Next button.3. Select the model and desireddomain.4. Select desired processes andclick Create button.5. Select results, add commentsand upload the evidences.6. Click Assess button.7. Confirm assessment creationand click OK button.
1.1 Shown on screen aninterface with assessmentdetails.2.1 Shown on screen aninterface with process de-tails.4.2 Build an interface withall instances of selectedprocess.6.1 Pop-up confirmationdialog7.1. Redirect the user toindex page.
3.1 Retrieve a processeslist.4.1 Retrieve all instancesof selected processes.
Alternative Flow-1: Previous Button
Actors System Response EAMS Response
1.Begin when Previous button isclicked.
1.1 Redirect the user toAssessment details page.
Alternative Flow-2: Cancel Button
Actors System Response EAMS Response
1.Begin when Cancel button isclicked.
1.1 Redirect the user toIndex page.
Alternative Flow-3: Add Comment Button
Actors System Response EAMS Response
1. Begin when Add Commentbutton is clicked.2. Click OK button
1.1. Pop-up entry fieldto add comments with twobuttons, OK and Close.2.1 Close the pop-up en-try.
Alternative Flow-4: Close Button
Actors System Response EAMS Response
1. Begin when Close button is clicked.1.1. Close the pop-up en-try and cleaning the entryfield.
Table 5.2: UC 001 Documentation
27

5.4 Activity Model
Describes the required steps and users responsibilities to be considered while a task is in progress.
Activity models also belong to design phase and is used to describe business processes as they are
essential to identify which processes can be automation objects in each Use Case [28].
So, we need eleven activity diagrams to describe the propose solution, which mean, for each Use
Case is necessary the corresponding activity diagram. The implemented activity diagram corresponds
to Create Assessment Use Case and is illustrated in Figure 5.3. Some rows ”Realize” are in red which
specific the manipulated and entry objects amongst different activities.
Figure 5.3: Activity Model
28
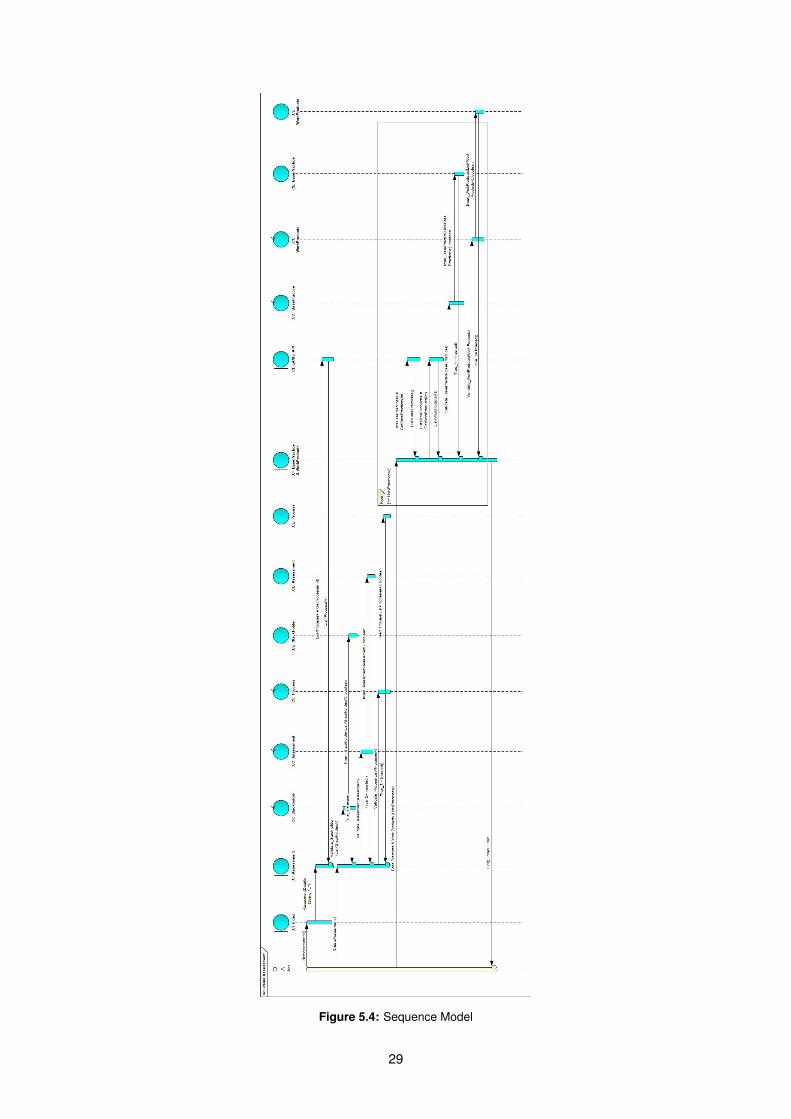
Figure 5.4: Sequence Model
29

5.5 Sequence Model
Likewise the activity model, the sequence model also belongs to the design phase and is a simple
diagram of interaction that describes the order in which way the messages are exchanged amongst
business entities. The sequence model is composed by interfaces classes (CI), controls classes (CC),
and entity classes (CE). The interface classes represents the boundary layer between users and inter-
faces, control classes represents the controllers where the objects are validated and finally the entity
classes which represents the database instances. Figure 5.4 presents the sequence model for Create
Assessment UC, and the rest ten and how to draw them please refer the author of this thesis.
5.6 Class Model
The class model belongs also to the design phase, and describes the structure of a system by showing
the system’s classes, their attributes, methods, and the relations among objects [29].
The class model is the main building block of object-oriented modeling. It is used both for gen-
eral conceptual modeling of the systematic of the application, and for detailed modeling translating the
models into programming code. The classes in a class diagram represent both the main elements, in-
teractions in the application, and the classes to be programmed. [29]. Figure 5.5 presents the class
diagram of the solution.
Figure 5.5: Class Model
30

5.7 Component Model
Component model belongs to the implementation phase and aims to illustrates the created artifacts dur-
ing the development software process. Usually, the component diagrams are associated to programming
language and it is intended to indicate the components of the software as well as their dependencies.
For this purpose, the components are presented in a small package according to their utility. Figure 5.6
presents the component model of proposed solution.
Figure 5.6: Component Model
31

5.8 Deployment Model
Deployment models are used to model the architecture of a computer system from the perspective of its
physical / hardware components (eg computers, network adapters, printers, routers, cabling), explaining
its communication dependencies, and what components are installed in each Computational node.
Overall, exist several nodes, e.g, computers, network adapters, printers, routers, sensors or any
physical device of importance to the software system. Note that the nodes are connected to each
other through connections. These connections are physical which can be optical fiber, coaxial cable or
communication protocols such as TCP / IP, HTTP, UDP, etc. Figure 5.7 presents all components created
for software deployment.
Figure 5.7: Deployment Model
5.9 Proposed Framework, their Structure and Mapping
Before we start the development, we defined the common terminologies, metamodel modeling and their
validation within the EAMS which allowed us to know how the REST Service, i.e, POST, GET, DELETE
and PUT work. Additionally, we had to validate the metamodel according the description of EAMS
Services provided by owner.
Figure 5.8 is a sample of how different models are related to others and how they are mapped. As
can be seen in Figure 5.8, each framework define own terminology, structure and so on. For instance, it
can be seen in figure below that the WP name is used in COBIT, and for ISO 33053 the same entity is
known as Related Information Items.
32

Figure 5.8: Different approaches and structures for PAM
5.10 Support Technologies and Environments
The solution was developed using Microsoft Visual Studio Community 2015 integrated development en-
vironment with .Net. The development language was C# with REST API 2. For Data Base development
was used SQL Server express 2016 with Microsoft SQL server Management studio to manager tables,
query’s and triggers, procedures, and connections (localhost and AZURE). The development process
we done locally, and deployed to AZURE cloud for tests. Table 5.3 presents a list of all used technologies
including used development environments.
Technologies & Environ-ments
Purpose
Enterprise Architect V12 Used for business modeling i.e for design and implementation phasesMicrosoft Visual Studio Integrated Development Environment used for development purpose.Azure Cloud Used environment to deploy the software tool.Microsoft SQL Server Man-agement Studio
Used environment to execute SQL statement as well as data base de-sign, procedures, triggers, local connection as well remote connectionfrom azure SQL server.
C# Used language for back-end development, concretely to design services(POST, PUT, DELETE and GET)
SQL Server Express Used technology to execute SQL statementJavaScript Development language used for front-end purpose.REST API 2 Used technology to design the services.CSS Used languange to create great looking web pages.HTML Used language to describe the structure of pages using markupJSON Data Format Used technology to format retrieved data in Get Services.
Table 5.3: List of used Technologies and Environments
33

5.11 Tool Description and Prototypes
The prototyping phase includes different activities, which should be taken in consideration such as brain-
storming, low-fidelity interfaces design also named sketches and high-fidelity interfaces design. To all of
these activities is included two type of meetings: formative and summative which was performed prior
to the tool development and for some reason during development process. However, before the devel-
opment process start, many steps was considered, e.g, task definition, meeting scheduling and a list of
requirements (functional and non-functional).
Figure 5.9: UI Prototype: Proposed Home Interface
However, were 10 formative meetings that we had, where the initial aim was to understand users
needs, ideas about how the tool should be developed and which functionalities should be included. After
three formative meetings, was possible to develop the first tool prototypes for low-fidelity. The interactive
processes took us one month. For each meeting held, new prototypes were created, some tasks refined
until the ninth meeting where was possible to shift from low-fidelity prototypes to high-fidelity prototypes
which the illustrative interfaces are presented hereinafter.
Figure 5.10: UI Prototype: 1-Proposed Assessment Interface
The first proposed UI is presented in Figure 5.9 which includes a list of assessments. Additionally are
34

included some features such as, assessment creation, deletion and events to see assessment details.
The second proposed UI corresponds to the process definition, so we tried to include in this interface
prototype the suggested assessment information such as the name of assessor and the contact point
information. The correspondent prototype is presented in Figure 5.10. Taking in account the dimension-
ality of the content, this interfaces was split in two interfaces which the third proposed UI includes a list
of frameworks, domains and a processes. The proposed interface prototype is presented in Figure 5.11.
Figure 5.11: UI Prototype: 2-Proposed Assessment Interface
Several interfaces were designed for high-fidelity prototypes, but for this purpose we will present only
two of them that correspondent the assessment creation due their importance. Figure 5.12 presents the
most important features of proposed tool. In Figure 5.12 is possible to see the relation amongst different
processes and from different frameworks, a list of BP’s and WPs. Inside each BP, there are a list of
related WPs and for each WP is possible to upload files simultaneously for related instances.
Once performed the formative meetings and before the development start, was held the summative
meeting with some stakeholders where was possible to validated some features as well as to refine
some tasks.
5.12 Conclusion
The proposed solution has been presented presenting the necessary artifacts, i.e models and diagrams.
The Create Assessment - UC 001 was the demonstrated and detailed Use Case amongst several exist-
35

Figure 5.12: UI Prototype: Assessing interface
ing to serve as reference for many others but concretely to demonstrate how the design and implemen-
tation phase must be done using the UML notation. Overall were identified and described seven models.
The database diagram or entity-relation diagram was not drowned even knowing their importance for the
business process description, because it is quite similar to the other two diagrams presented (domain
and class) , i.e, the structure is is almost the same.
However, the important artifacts were presented herein this section which includes the technological
support and the prototypes. Concerning prototypes, was not possible to present all of them. Fur-
thermore, with tho type of meeting performed was possible to validates all interfaces both for singular
assessments, assessment details, assessment editing, user registration and log in page.
36

Chapter 6
Demonstration
The tool demonstration was based on one of the largest banks in Portugal. The assessed process was
the DSS02 - Manage Service Requests and Incidents which belongs the COBIT 5 framework and that
falls in the management for enterprise IT area of COBIT 5 with the purpose of achieving increased pro-
ductivity and minimize disruptions through quick resolution of user queries and incidents. However, to
demonstrate how the software tool is addressed for environments which work with one or more frame-
works was added the following process COM-08 Operational planning from ISO 33052 framework.
Additionally, the demonstration will comprise two phases, the first phase is demonstrated how the
assessments are performed considering one framework or without relations, i.e, when the selected
processes belongs to the same framework or if there is not available relations amongst the selected
processes. In second phase is showing how those assessments are performed when two or more
frameworks are referenced, i.e, if is there some relations amongst the selected processes. Usually, this
happen when the selected processes belongs to different frameworks(e.g: COBIT, ISO, ITIL).
6.1 Demonstration with one framework as referenced
This type of assessments are part of the simple functionalities of the proposed solution and is similar
to many others tools that were reported in Section 4. Which mean, beyond to includes important fea-
tures described in Section 4, the proposed solution is more extensive because can be addressed to
organizations which work with one or more frameworks simultaneously.
However, these types of assessments are appropriate for organizations that do not need to work with
multiple frameworks at same time.
6.1.1 Assessment List
Figure 6.1 illustrates the list of performed assessments and the displayed assessments are based on
user privilege. In this page users can start new assessment by clicking New Assessment button, delete
existing assessments by clicking Delete button, filter assessments using one of available attribute within
the table by writing in search entry field as well as order by any available table attributes in table header.
37

Figure 6.1: Assessment List
6.1.2 Assessment Definition with one framework referenced
Figure 6.2 presents the assessments definition. This interface includes important attributes about as-
sessments such as, Lead assessment name, organization, department, description, purpose, dates and
a list of contact point.
Figure 6.2: 1 Assessment definition
All fields are mandatory, when the assessors clicks the Next button without fill all fields, an error
class is attached to those fields otherwise, the interface illustrated in Figure 6.3 is displayed. In this
interface the assessors are allowed to select different processes from different frameworks by selecting
the framework name, the domain and the processes.
Once validated all fields and selected the processes, the assessors must estimates the expected
achieved levels and create assessment clicking Create button.
38

Figure 6.3: 2 Assessment definition Interface with one process selected
6.1.3 Instances Validation for Processes Without any Relation
Once the interface where the instances are validated is displayed as can be seen in Figure 6.4, the table
is automatically filled with BP’s and WP’s that belong to the first selected process.
Figure 6.4: 1 Carrying out assessments interfaces with one framework referenced
So, in this step, assessors are allowed to upload files for each WP, achieved results for each BP
and the achieved level for the process. Figure 6.5 illustrates what happens when Add Comment button
is clicked. Is displayed a pop-up entry field front of the main interface where the assessors can add a
comments about the entire assessment. Once the comment is added and achieved level selected is
time to save and validate the whole process by clicking the Save button.
For this release, the achieved level are selectable, because we did not find any criteria to be used
automatically. Thus, this feature will be addressed to next work.
39

Figure 6.5: 2 Carrying out assessments interfaces with one framework referenced
6.2 Demonstration with more than two frameworks referenced
This feature is suitable for organizations that need to work with two or more frameworks simultaneously.
With this feature, assessors are allowed to see the available relations amongst selected processes.
Once the two first steps are similar with demonstration instantiating one framework, we will only
demonstrate the second interface which belong to assessment details and the instances validation.
6.2.1 Assessment definition with more than two frameworks referenced
Figure 6.6 show what happen if two or more processes are selected. Likewise in singular approach, with
this additional features, assessors are allowed to selected several processes from different frameworks
or from the same framework.
Figure 6.6: Assessment definition Interface with two or more processes selected
40

6.2.2 Instances Validation for Processes with Relations
As can be seen in Figure 6.7, the related instances, i.e, BP’s and WP’s are highlighted with the same
color. Once the evidences are uploaded, automatically there are shared amongst all related instances.
Figure 6.7: 1 Carrying out assessments interfaces with two or more frameworks referenced
6.3 Assessment Details
Once assessments are created, the assessors can see the details of each assessment clicking on
assessment in table row. Figure 6.8 contain the main assessment description such as, processes list,
BP’s for each process, WP’s for each BP and contact points list.
Figure 6.8: Assessments details interfaces
41

6.4 Conclusion
The demonstration is one of the important phases of this research because it allows us to discover if the
goals were achieved or not. Performed in two phases, where in first phase was possible to demonstrated
the tool working with a single framework. The second phase, which is also considered as the main
goal of this research, we demonstrated how the assessments can be performed when two or more
frameworks are referenced.
While assessment are created, is possible to select several processes from different frameworks
making possible to carry out assessments simultaneously within organizations that use several frame-
works and making possible to share evidences amongst the related instances. Likewise the frameworks
can be changed while assessments are defined, is also possible to add and remove processes when
necessary and how many times needed.
It should also be said that, the demonstration was performed using two frameworks and does not
mean that the software tool support only these two frameworks. Any model or framework can be instan-
tiated in this tool since it is mapped and instantiated in EAMS and defining the existing relations amongst
others.
42

Chapter 7
Evaluation
The aim of this chapter is to describe the obtained results during the tool demonstration. Offermann. [9]
proposes three methods which can be used to evaluate a software such as experty survey, Laboratory
experiments and Case Study / action research. In both cases, before the evaluation start, the hypothesis
must be refined once the solution reaches a stable state, i.e, defining the general research hypothesis
as well as the smaller hypotheses.
There are three proposed methods which are reporting in this research to be used to perform evalua-
tion. Prat at all [30] define a list of hierarchy of criteria for IS artifact evaluation. Amongst all of them, the
widely used [30] are goal/efficacy which are characterized by following criteria: effectiveness, efficiency,
validity and generality.
However,the three proposed methods, will help us to collect the necessary evidences to evaluate the
proposed criteria and also to know if the main objectives were achieved or not. Table 7.1 show the tasks
list to be evaluated and validate. Therefore, due to the confidentiality procedures required all users must
agree to participate in this process and sign a consent form illustrated in Appendix B. The list of tasks to
be performed and validated are presented in Appendix C.
Task Names DescriptionTask:1 Create AccountTask:2 LoginTask:3 Create AssessmentTask:4 Assessment detailsTask:5 Edit AssessmentTask:6 Delete Assessment
Table 7.1: Task List
7.1 Metrics and Estimation
This process is based on five metrics, the efficiency, effectiveness, validity, generality and user satisfac-
tion. The efficiency define the needed time to complete tasks as the number of clicks needed to perform
43

tasks, so in this point we will compare the obtained results after evaluation with our expectation. Table
7.2 illustrates the expected results after performing each of task.
Task Estimated execution time and number of clicksTask:1 On average, users should spend less than 80 seconds to perform this task at the first
attempt and 60 seconds next times and than less 2 clicks.Task:2 On average, users should spend less than 45 seconds to perform this task with 1 click.Task:3 On average, users should spend less than 5 minutes to perform this task at the first
attempt and 4 minutes next times than less 30 clicks.Task:4 On average, users should spend less than 2 minutes to perform this task at the first
attempt and 90 seconds next times and than less 6 clicks.Task:5 On average, users should spend less than 3 minutes to perform this task at the first
attempt and 2 minutes next times and with 15 clicks.Task:6 On average, users should spend less than 15 seconds to perform this task with 3 clicks.
Table 7.2: Efficiency: Estimated execution time and number of clicks
While the efficiency compare the needed time to complete tasks successful and number of clicks,
the effectiveness is focused on numbers of errors and task completion rate. So, likewise the efficiency,
in effectiveness we need to define the estimated number of errors for each task. Table 7.3 show these
list for each of task.
Task Estimated number of errorsTask:1 2Task:2 1Task:3 2Task:4 1Task:5 2Task:6 0
Table 7.3: Effectiveness: Estimated number of errors
The satisfaction, generality and validity metrics are based on System Usability Scale questions [31].
The SUS questions has ten question where the final users only must rank each question from 1 to 5
based on how much they agree with the statement. The number 5 means that they agree completely
and 1 means that they disagree vehemently.
This questionnaire will be provided to the final user after performing the indicated tasks. Appendix D
illustrates the SUS question list. Lets denote each SUS question by Q:n where n denote the question
number. So, Table 7.4 illustrated the expected answers which based on the final results we will compare
the achieved results with expected.
Q:1 Q:2 Q:3 Q:4 Q:5 Q:6 Q:7 Q:8 Q:9 Q:105 1 1 1 1 1 5 1 5 1
Table 7.4: Satisfaction: Estimated SUS answers
44

7.2 Data Collection and Analyses
In order to validated the obtained data has been used the inferential statistics method named Confidence
Interval, with following descriptive statistics values Mean, Median and Standard Deviation. Once calcu-
lated these values, for each task we compute the confidence interval, the minimums and maximums
intervals values. If the estimated value for each task is within these confidence intervals mean that, our
hypotheses must be checked again.
7.2.1 Based on estimated time to perform tasks
To get the confidence interval, we have to consider the values of mean, standard deviation, the probabil-
ity to exceed the estimated time ( α = 0.05) for the sample data and the level of confidence (in this case
will be 95% of confidence interval). We present a summary of results in Table 7.5, and the others can
be seen in Appendix E.
EstimatedTime(sec)
Mean Stdev α Confid. Xmin Xmax
Task:1 80 69.8 15.9 0.05 7.0 62.8 76.7Task:2 45 33.4 5.6 0.05 2.4 30.9 35.8Task:3 300 290.9 35.5 0.05 15.6 275.3 306.4Task:4 120 33.3 4.3 0.05 1.9 31.4 35.2Task:5 180 151.5 17.4 0.05 7.6 143.8 159.1Task:6 15 23.3 7.7 0.05 3.4 19.9 26.6
Table 7.5: Result based on time to perform
Interpreting Results based on time
So, for Task:1, Task:2, Task:3, Task:4 and Task:5, we conclude with 95% of confidence that the estimate
goals was achieved successful since that the medium time spent by the users is less than estimated
times. Unfortunately we can not say the same for Task:6. The estimated time is less than medium time
that users spent performing this task, and beside that, the estimated time is not within the obtained Xmin
and Xmax values which means the expected goal was not achieved as expected.
45

7.2.2 Based on number of clicks to perform tasks
EstimatedNumber ofClicks
Mean Stdev α Confid. Xmin Xmax
Task:1 2 1.8 0.7 0.05 0.3 1.4 2.1Task:2 1 1.2 0.4 0.05 0.2 1.0 1.3Task:3 30 29.8 2.4 0.05 1.1 28.7 30.9Task:4 6 5.7 0.9 0.05 0.4 5.3 6.1Task:5 15 16.0 2.9 0.05 1.3 14.7 17.2Task:6 3 4.7 1.5 0.05 0.7 4.0 5.3
Table 7.6: Result analysis for the number of clicks
Interpreting Results based on number of clicks
Likewise, in previous analyses based on time, for Task:1, Task:2, Task:3 and Task:4, we conclude with
95% of confidence that the estimate goals was achieved successful with medium number of clicks less
then than estimated number of clicks. For Task:5 the defined goal was not successful achieved but
archived as well. As can be seen in Table 7.6, the medium number of clicks obtained is sixteen and the
estimated number of clicks is fifteen, but the obtained values of Xmin and Xmax are 14,7 and 17.2. As
can been seen the value 15 is within the range of minimum means and maximum and we can say that,
the fifteen value is acceptable and the goal was achieved.
Unfortunately for Task: 6 the goal was not achieved with confidence of 95%, since the estimated
value is less than the medium number of clicks made by the users to perform the task. It means that
some users made more clicks than expected.
7.2.3 Based on number of errors to perform tasks
EstimatedNumber oferrors
Mean Stdev α Confid. Xmin Xmax
Task:1 2 1.0 1.2 0.05 0.5 0.5 1.5Task:2 1 0.6 0.7 0.05 0.3 0.3 0.9Task:3 2 0.2 0.4 0.05 0.2 0 0.4Task:4 1 0.3 0.4 0.05 0.2 0.1 0.4Task:5 2 0.3 0.5 0.05 0.2 0.1 0.5Task:6 0 0.5 0.5 0.05 0.2 0.2 0.7
Table 7.7: Result analysis for the number of errors
Interpreting Results based on number of errors
For Task:1, Task:2, Task:3, Task:4 and Task:5, with 95% of confidence we conclude that the goal was
achieved, since that the mean number of errors practiced by the users for these tasks are above than the
46

obtained values and also above the Xmax values. The Task:6 once again it is not satisfied. As can be
seen in the Table 7.7, the estimated number of errors for Task: 6 is zero, but many errors were collected,
which means that estimates fail for some reasons.
7.2.4 Based on System Usability Scale questions
Questionnumber
Expected Re-sult
Mean Stdev α Confid. Xmin Xmax
Q:1 5 4.4 0.8 0.05 0.4 4.0 4.8Q:2 1 1.3 0.6 0.05 0.3 1.0 1.6Q:3 1 1. 0.7 0.05 0.3 1.2 1.8Q:4 1 1.6 1.0 0.05 0.4 1.2 2.0Q:5 1 1.3 0.6 0.05 0.3 1.0 1.6Q:6 1 3.4 8.9 0.05 3.9 -0.5 7.2Q:7 5 4.5 0.7 0.05 0.3 4.1 4.8Q:8 1 1.4 0.6 0.05 0.3 1.1 1.6Q:9 5 4.2 0.5 0.05 0.2 4.0 4.4Q:10 1 1.4 0.7 0.05 0.3 1.1 1.7
Table 7.8: Result analysis for the SUS answers
Interpreting Results based on SUS answers
The analysis of the results of these questionnaires will be done differently from the previous one due to
some reasons. As can be seen in the Appendix D, the questions are ranked from 1 to 5, which means
that, based on the values obtained for each question, we have to determine which average values are
closer to our expected value. So, the values of the means will be rounded up in excesses as well as
defects, where afterwards we verify which values are more closer to the expected values defined.
Question 1 : user satisfaction level is lower than expected. We said with 95% of confidence that users
found the application little complex, since that the expected value is larger than the mean of user
satisfaction level.
Questions 2, 5, 7, 8 and 10 : we consider that our expectations are in agreement with the users;
Question 3 : the complexity of manipulated information has made users feel cumbersome. As can be
seen the obtained values is closer to the expected, but we can not say that we achieved our goal
successfully because is around 20% below to the expected.
Question 4 : in 95% of confidence, the user perspective is also not good, they considered that applica-
tion is complex and will require the support of a technical person.
Question 6 : the interface elements such as buttons, text fields and so on justify the obtained results
which was not as expected.
47
Question 9 : the manipulated information and the environment where the application is addressed was
the only reason which the users gave us. Fortunately for some users which know how to deal with
these frameworks the answers was different and satisfactory as well.
7.3 Conclusion
The evaluation phase, was based on three proposed methods including the following hierarchy of criteria
(goal/efficacy). The values collection was based on following variables, the spent time to perform tasks,
the number of clicks which is needed to complete a task and the number of errors encountered while
executing these tasks.
Summing up the interpreted results, we can see that most of the tasks was achieved successful with
95% of confidence. So, for some reasons some inconsistency such as the servers timeout and time
response was found while performing evaluation. The Task: 6 is the only one which was not achieved
and there are many reasons for that, as instance, there are several services which are invoked from
different servers (own application and EAMS).
However, we can say that our objectives were achieved successful except for some questions for
system usability scale. As can be seen during the SUS values interpreting, the difference between the
expected and achieved values is about tenths which mean, are closer to the expected values.
48

Chapter 8
Conclusion
A continuous process evaluation activity is a very important step that should be carried out by organiza-
tions in order to improve the quality of their processes, products and services.
Bearing in mind this importance, organizations must be prepared to choose within the existing frame-
work, about which one can be applied to fulfill certain requirements. These decisions must be also ex-
tendable to the processes since each model contain dozens of them. The huge number of frameworks
and their usability, brings new insights and challenges in this field of study. Some of these challenges
are related to (i) multiframework environments and (ii) development of a software tool which can imple-
ment these ontology. The second is the addressed issues in this thesis work and the desired/expected
solution by the assessors, because as demonstrated, can reduce the time, costs, efforts, errors and so
forth.
However, these multiframework environments enable the integration of several frameworks (e.g: ISO,
ITIL, COBIT, CMM, etc) within the same environments. Additionally, these kind of environments add
more advantages to the organization making possible the definition of relations amongst entities from
different frameworks. Integration is not an easy process to be take, since it is mandatory to define a
unique structure to be used by all frameworks, ontology and terminologies.
Bearing in mind all these issues, is proposed a Web-Based software tool with EAMS foundation,
which implements the defined ontology (COBIT, ISO’s, ITIL, etc). The solution is detailed in Section
6 with a real world problem, in that case a Banking Sector. The solution description was extended in
Section 5 where has some prototypes, diagrams and models.
The these demonstration, interviews and questionnaires performed was possible to carry out eval-
uation as proposed in the DSRM that is the chosen research methodology to guide this work. Once
performed the evaluations and based on hierarchy of criteria proposed in Prat et all, was possible to
measure the chosen criteria (goal/efficacy) which allows us to know whether our problem was solved or
not. The values collected during the testes were interpreted and computed using an inferential statis-
tics method named confidence interval with 95% of confidence. Furthermore, were included the SUS
questions to know the user satisfaction.
However, with evaluation was possible to know which task were achieved and which of them should
49

be improved. As such, we did some improvements and the other complexes tasks were addressed for
future work. Said that, below is a list of some of them:
Features optimization : Some features are still cumbersome and unstable which make optimization
still essential. The proposed optimizations consist of refining all unstable and validated tasks with
specialists (assessors, audits, etc).
Application accessibility : These improvements relate to the appearance aspects of the application
(buttons, colors, etc).
Entity Relationships : The way that we present the related entities (processes, base practices and
work products) could be improved. As instances, imagine a scenario where there are more than
five related processes, the way how there are presented in interface should be improved.
Reporting : Currently there is integrated an interface where users can explore the created assessment,
but not a section to generate reports or something similar.
Dashboard : This could be an important feature to be integrated because users can use a visual
representation to navigate to whole application using a data representation such as (Data Drive
Documentation - D3, Python, etc).
These recommendations pertain to future work, so they are part of additional features. Beyond that,
there are many other features which can be integrated as long as they are important. Summing up, can
be said that process assessments are crucial activities to maintain organizations competitiveness and
that, they must be carried out continuously.
50

Bibliography
[1] D. Tuffley. A process-driven socio-technical approach to engineering high-performance organisa-
tions. Advances in social and organizational factors, pages 551–561, 2012.
[2] M. P and G. T. The nist definition of cloud computing - recommendations of the national institute of
standards and technology. National Institute of Standards and Technology, Sept. 2011.
[3] M. Paulk. Comparing iso 9001 and the capability maturity model for software. Software Quality
Journal, (2):245–256, 1993.
[4] B. Mutafelija and H. Stromber. Iso 9001:2000 – cmmi v1.1 mappings. software engineering institute,
2013. URL http://goo.gl/16sWI.
[5] L. Consulting. Learn about eams, 2017. URL http://www.linkconsulting.com/eams/.
[6] A. R. Hevner, S. T. March, J. Park, and S. Ram. Design science in information systems research.
MIS Q., 28(1):75–105, Mar. 2004. ISSN 0276-7783. URL http://dl.acm.org/citation.cfm?id=
2017212.2017217.
[7] K. Peffers, T. Tuunanen, M. Rothenberger, and S. Chatterjee. A design science research
methodology for information systems research. J. Manage. Inf. Syst., 24(3):45–77, Dec. 2007.
ISSN 0742-1222. doi: 10.2753/MIS0742-1222240302. URL http://dx.doi.org/10.2753/
MIS0742-1222240302.
[8] G. Schuh, H. Riedel, I. Abels, and J. Desoi. Serienanlauf in branchenubergreifenden netzwerken,
wt werkstattstechnik online. (11/12):656–661, 92, 2002.
[9] P. Offermann, O. Levina, M. Schonherr, and U. Bub. Outline of a design science research pro-
cess. In Proceedings of the 4th International Conference on Design Science Research in Infor-
mation Systems and Technology, DESRIST ’09, pages 7:1–7:11, New York, NY, USA, 2009. ACM.
ISBN 978-1-60558-408-9. doi: 10.1145/1555619.1555629. URL http://doi.acm.org/10.1145/
1555619.1555629.
[10] C. Pardo, F. Pino, F. Garcıa, M. Piattini, and M. Baldassarre. From chaos to the systematic harmo-
nization of multiple reference models: A harmonization framework applied in two case studies. The
Journal of Systems and Software, (86):125–145, July 2012.
51

[11] J. Becker, R. Knackstedt, and J. Poppelbuß. Developing maturity models for it management. Busi-
ness & Information Systems Engineering, 1(3):213–222, 2009.
[12] M. Vicente, N. Gama, and M. M. da Silva. Using archimate to represent itil metamodel. In Business
Informatics (CBI), 2013 IEEE 15th Conference on, pages 270–275. IEEE, 2013.
[13] S. Macgregor. Enterprise Architecture as competitive advantage. Johannesburgl - The Open Group,
Mar. 2011.
[14] F. Liang and A. Rout, T. Tuffley. Appraisal assistant beta, 2007. URL https://www.sqi.griffith.
edu.au/AppraisalAssistant/about.html.
[15] Appraisal wizard and wizard lite, 2017. URL http://isd-inc.com/tools.appraisalWizard/.
[16] Appraisal wizard 7 user guide, 2017. URL http://members.isd-inc.com/files/awv7userguide.
pdf.
[17] V7 product suite features, 2017. URL http://members.isd-inc.com/files/V7%20Product%
20Features.pdf.
[18] Spice-lite assessment tool, 2015. URL http://www.spicelite.com/cms/en/.
[19] Cmm quest v1.3. URL http://www.cmm-quest.com/cms/en/.
[20] S. Gazel, E. A. Sezer, and A. Tarhan. An ontology based infrastructure to support cmmi-based
software process assessment. Gazi University Journal of Science, 25(1):155–164, 2012.
[21] Cobit 5 self-assessment tooll. URL https://cobitonline.isaca.org/landing-sat#.
[22] C. J. Pardo-Calvache, F. O. Garcia-Rubio, M. P. Velthuis, F. J. Pino-Correa, and M. T. Baldassarre.
A reference ontology for harmonizing processreference models. Fac. Ing. Univ. Antioquia, (73):
29–42, Dec. 2014.
[23] Cmmipal v1.0, 2001. URL http://www.chemuturi.com/cmmipaldtls.html.
[24] Spice 1-2-1 forinternational standards. URL http://www.spice121.com/cms/en/.
[25] Model wizard and model mapper. URL http://isd-inc.com/tools.modelWizard/.
[26] A. Tarhan, O. Turetken, and F. Ilisulu. Business process maturity assessment: State of the art and
key characteristics. 2015.
[27] P. Kruchten. The rational unified process: an introduction. Addison-Wesley Professional, 2004.
[28] P. Kroll and P. Kruchten. The rational unified process made easy: a practitioner’s guide to the RUP.
Addison-Wesley Professional, 2003.
[29] Wikipedia. Class diagram — wikipedia, the free encyclopedia, 2017. URL https://en.wikipedia.
org/w/index.php?title=Class_diagram&oldid=789262227. [Online; accessed 23-August-2017 ].
52

[30] P. N and A. J. Comyn-Wattiau I. Artifact evaluation in information systems designscience research
- a holistic view. PACIS 2014 Proceedings. Paper 23, 2014.
[31] J. Brooke et al. Sus-a quick and dirty usability scale. Usability evaluation in industry, 189(194):4–7,
1996.
53

Appendix A
Appraisal Wizard Products Suite
Features
54

Product Features Matrix 8/12/2010
1
Appraisal Wizard Product Suite Features
Feature Product Appraisal Wizard
Appraisal Wizard Lite
Model Wizard
Model Mapper
A. Architecture / Platform Client-Server Yes Yes Yes Multiple users may access same database concurrently Yes Yes Yes Operating System Windows11 Windows11 Windows11 Windows11 Database software provided (Firebird V1.5 or 2.1) Yes Yes Yes Yes Local Area Network usage Yes Yes Yes Wide Area Network usage Possible1 Possible1 Possible1 Floating licensing limited by maximum concurrent users on a server Yes Yes Yes B. Reference Models / Standards / Frameworks Availability14 CMMI-DEV v1.2 (staged and continuous representations provided) Yes Yes Yes Yes CMMI v1.1 SE-SW-IPPD-SS (staged and continuous representations provided)3 Yes Yes Yes Yes CMMI v1.02d (staged and continuous representations provided)3 Yes Yes Yes Yes CMMI v1.0 (staged and continuous representations provided)3 Yes Yes Yes Yes SW-CMM3 Yes Yes Yes Yes P-CMM3 Yes Yes Yes Yes P-CMM v2 Yes Yes Yes Yes SA-CMM v1.03 Yes Yes Yes Yes SA-CMM v1.023 Yes Yes Yes Yes SA-CMM v1.03 Yes Yes Yes Yes CMMI-ACQ v1.2 (staged and continuous representations provided) Yes Yes Yes Yes CMMI-SVC v1.2 (staged and continuous representations provided) Yes Yes Yes Yes CMMI-DEV v1.3 (staged and continuous representations provided) Yes Yes Yes Yes

Product Features Matrix 8/12/2010
2
Feature Product Appraisal Wizard
Appraisal Wizard Lite
Model Wizard
Model Mapper
CMMI-SVC v1.3 (staged and continuous representations provided) Yes Yes Yes Yes CMMI-ACQ v1.3 (staged and continuous representations provided) Yes Yes Yes Yes ISO 9001-2000 Optional4 Optional4 Optional4 Optional4 ISO 9001-2008 Optional4 Optional4 Optional4 Optional4 ISO 14001-2004 Optional4 Optional4 Optional4 Optional4 eSCM SP Yes Yes Yes Yes eSCM Client Yes Yes Yes Yes C. Functionality related to reference Models / Standards / Frameworks Create new models / edit model structure Yes Delete models Yes Clone models Yes Export model (to be imported by another Model Wizard user) Yes Export model to Excel Yes Import model (from another Model Wizard user) Yes Import model from Excel Yes Classify model elements13 according to user-defined types Yes Create relationships between model elements supporting data rollup Yes Create groupings of similar elements in a model Yes Import / Export of model element groupings established Yes Allow recording of Rich Text descriptions for each model element Yes Model “Lock” function to prohibit further model changes Yes Spell check model elements (name, abbreviation, full text, abbreviated text) Yes View all appraisals referencing a model in the appraisal scope Yes D. Model Mapping Functionality Create model maps documenting similar requirements in a pair of models Yes Provide many to many relationships between the two models Yes

Product Features Matrix 8/12/2010
3
Feature Product Appraisal Wizard
Appraisal Wizard Lite
Model Wizard
Model Mapper
Export Model Map to Excel Yes Export Model Map (for import by another Model Mapper user) Yes Import Model Map from Excel Yes Import Model Map (exported by another Model Mapper user) Yes Clone Model Map Yes Create inverse map of existing map Yes Create extrapolated Model Map based on other existing Model Maps Yes Auto-Map function based on model element name matching Yes Record comments on each mapping connection Yes Document confidence factor for each mapping connection Yes E. Appraisal2 Definition and Setup Create Appraisal Yes No10 Unlimited number of Appraisals in database Yes No10 Choose models and standards being referenced and scope within these Yes Simultaneous use of multiple models or standards for data collection or appraisal Yes Yes Define projects and groups for evidence collection and appraisal Yes Define appraisal schedule Yes Synchronize schedule to MS Outlook Yes Define appraisal participants and relate to schedule Yes Define appraisal team and relate to schedule Yes Document role of each appraisal team member Yes Record estimated effort by category Yes F. Appraisal Data Utilities Duplicate a complete appraisal12 Yes Export Appraisal (for import by another Appraisal Wizard user) Yes Export Appraisal records and documents to Excel Yes Yes
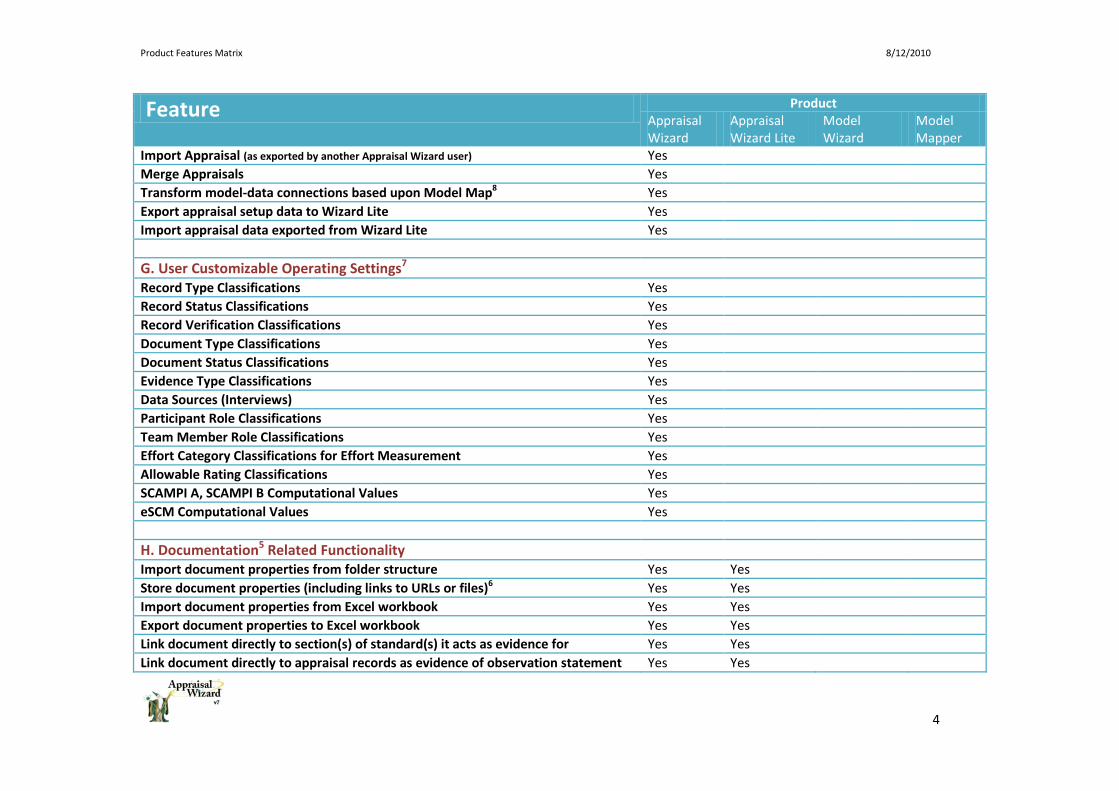
Product Features Matrix 8/12/2010
4
Feature Product Appraisal Wizard
Appraisal Wizard Lite
Model Wizard
Model Mapper
Import Appraisal (as exported by another Appraisal Wizard user) Yes Merge Appraisals Yes Transform model-data connections based upon Model Map8 Yes Export appraisal setup data to Wizard Lite Yes Import appraisal data exported from Wizard Lite Yes G. User Customizable Operating Settings7 Record Type Classifications Yes Record Status Classifications Yes Record Verification Classifications Yes Document Type Classifications Yes Document Status Classifications Yes Evidence Type Classifications Yes Data Sources (Interviews) Yes Participant Role Classifications Yes Team Member Role Classifications Yes Effort Category Classifications for Effort Measurement Yes Allowable Rating Classifications Yes SCAMPI A, SCAMPI B Computational Values Yes eSCM Computational Values Yes H. Documentation5 Related Functionality Import document properties from folder structure Yes Yes Store document properties (including links to URLs or files)6 Yes Yes Import document properties from Excel workbook Yes Yes Export document properties to Excel workbook Yes Yes Link document directly to section(s) of standard(s) it acts as evidence for Yes Yes Link document directly to appraisal records as evidence of observation statement Yes Yes

Product Features Matrix 8/12/2010
5
Feature Product Appraisal Wizard
Appraisal Wizard Lite
Model Wizard
Model Mapper
Any document artifact may be reused multiple times as evidence Yes Yes Evidence Map provides access to all evidence and relationships Yes Yes Spell check document titles Yes Yes Mass property change allowed for multiple documents Yes Yes Classify documents by owner and document type Yes Yes Document property filtering to locate documents more quickly Yes Yes Document property search / replace Yes Yes Identify / consolidate duplicate documents Yes Yes Delete multiple documents Yes Yes Substitute “document path” capability Yes Yes Filter documents Yes Yes Identify documents that have not been linked to Model as evidence Yes Yes Auto-assign document identifier Yes Yes Renumber document identifier Yes Yes Convert network drive letter path to UNC path Yes Yes Record and track appraisal team document requests Yes Yes I. Appraisal Record9 Functionality Create appraisal records Yes Yes Link appraisal records to multiple applicable model / standard sections Yes Yes Link appraisal records to projects, team members, interview sessions Yes Yes Clone appraisal record(s) Yes Yes Recover accidentally deleted appraisal records Yes Yes Provision to establish default values for new appraisal records Yes Yes Mass property change allowed for multiple appraisal records Yes Yes Import appraisal records from Excel Yes Yes Export appraisal records to Excel Yes Yes Connect document(s) to appraisal records as supporting evidence Yes Yes

Product Features Matrix 8/12/2010
6
Feature Product Appraisal Wizard
Appraisal Wizard Lite
Model Wizard
Model Mapper
Delete multiple appraisal records Yes Yes Spell check appraisal records Yes Yes Reset “Modified” state to monitor changed information Yes Immediate “Go to Record” by appraisal record number Yes Yes View linked appraisal records for each model element Yes Yes View consolidated appraisal records for all children of a parent model element Yes User may establish default values for new appraisal records Yes Yes J. Appraisal Record Filtering Record filtering may be done on most properties and relationships Yes Yes Record filters may be saved Yes Yes Multiple filters allowed per appraisal Yes Yes Private and Public filters Yes Enabled filter is global in effect across application until disabled Yes Yes Filter can regulate data reported and exported Yes Yes Special “Filter Menu Bar” available in all windows where record filtering usable Yes Yes K. Data Grid Level Options and Data Filtering Quick filtering using selectable column values Yes Yes Yes Yes Suspend / reactivate grid filter Yes Yes Yes Yes Quickly reorder, hide or show grid columns Yes Yes Yes Yes Show / hide grid footer Yes Yes Yes Yes Group grid contents by distinct values in a column Yes Yes Yes Yes Sort grid contents on one or multiple columns Yes Yes Yes Yes Export grid data to HTML, Text, Excel or XML Yes Yes Yes Yes Grid filters – Save to file, restore from file Yes Yes Yes Yes L. Coverage Statistics for each in-scope Model Element

Product Features Matrix 8/12/2010
7
Feature Product Appraisal Wizard
Appraisal Wizard Lite
Model Wizard
Model Mapper
Counts of appraisal records by Record Type Yes Yes Counts of objective evidence by Evidence Type Yes Yes Counts of objective evidence by Document Status Yes Yes M. Ratings Users may define unlimited sets of ratings and values within each set Yes Every type of model element may be rated using up to 6 rating schemes Yes Yes Ratings may be performed at project or overall appraisal level Yes Yes Ratings may be exported to MS Excel Yes Security establishes users that may perform rating Yes N. Centralized Appraisal Data Search / Replace Function Search in appraisal record text Yes Yes Search in comments recorded when linking a document to an appraisal record Yes Yes Search in comments recorded when linking a document to a model element Yes Yes Search in document fields (title, link, ID, comments, etc) Yes Yes O. Methodology Specific Features and Functions SCAMPI A 1.3 SCAMPI Planning Functions Yes Show Coverage based on Data Collection Plan Yes Compute project instance Practice Characterization Yes Yes Compute Org Level Practice Characterization Yes Yes Compute Goal Ratings SCAMPI A 1.2 Provide project-PA sampling matrix Yes Yes Compute project instance Practice Characterization Yes Yes Compute Org Level Practice Characterization Yes Yes
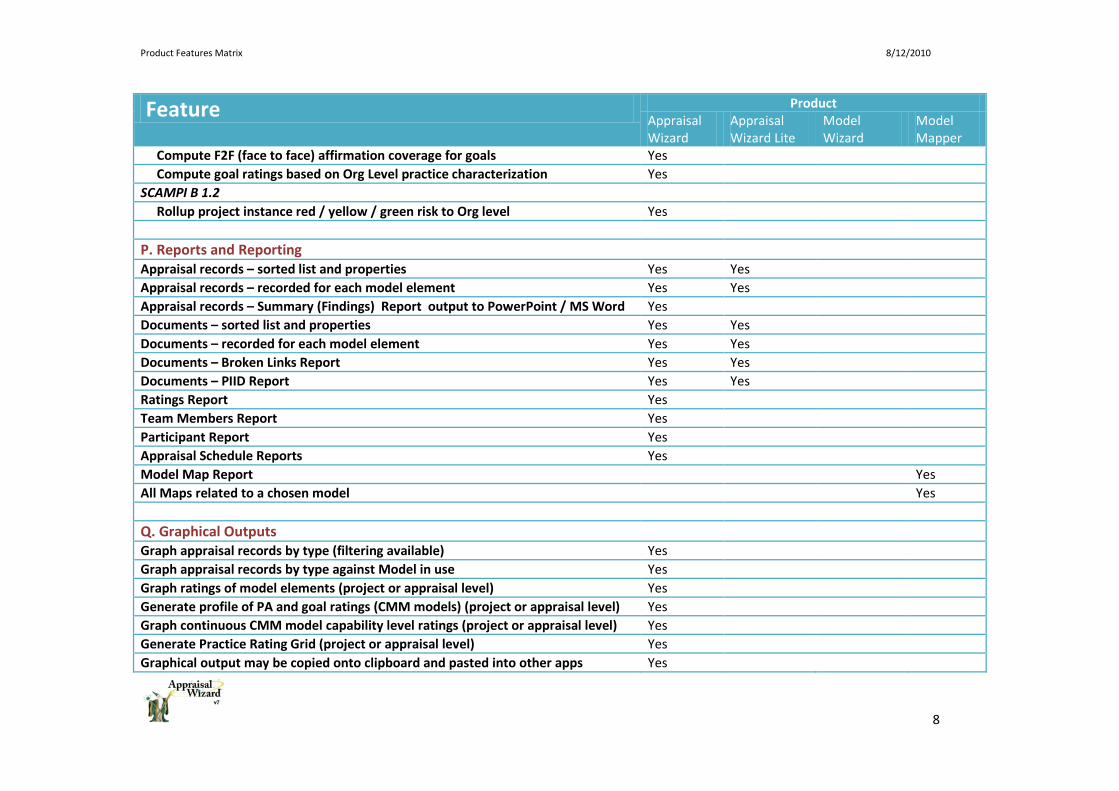
Product Features Matrix 8/12/2010
8
Feature Product Appraisal Wizard
Appraisal Wizard Lite
Model Wizard
Model Mapper
Compute F2F (face to face) affirmation coverage for goals Yes Compute goal ratings based on Org Level practice characterization Yes SCAMPI B 1.2 Rollup project instance red / yellow / green risk to Org level Yes P. Reports and Reporting Appraisal records – sorted list and properties Yes Yes Appraisal records – recorded for each model element Yes Yes Appraisal records – Summary (Findings) Report output to PowerPoint / MS Word Yes Documents – sorted list and properties Yes Yes Documents – recorded for each model element Yes Yes Documents – Broken Links Report Yes Yes Documents – PIID Report Yes Yes Ratings Report Yes Team Members Report Yes Participant Report Yes Appraisal Schedule Reports Yes Model Map Report Yes All Maps related to a chosen model Yes Q. Graphical Outputs Graph appraisal records by type (filtering available) Yes Graph appraisal records by type against Model in use Yes Graph ratings of model elements (project or appraisal level) Yes Generate profile of PA and goal ratings (CMM models) (project or appraisal level) Yes Graph continuous CMM model capability level ratings (project or appraisal level) Yes Generate Practice Rating Grid (project or appraisal level) Yes Graphical output may be copied onto clipboard and pasted into other apps Yes

Product Features Matrix 8/12/2010
9
Feature Product Appraisal Wizard
Appraisal Wizard Lite
Model Wizard
Model Mapper
Graphical comparison of project ratings in exported Excel workbook Yes R. Effort Planning and Reporting Allow user defined effort collection categories Yes Record planned effort by category for each team member by on-site day Yes Event Timer – Record actual effort by category and team member(s) Yes Review / edit captured effort information Yes Graph Planned versus Actual effort Yes S. Security User ID and password required for product access Yes Yes Yes Yes May restrict user access by appraisal Yes Yes Security may be adjusted by appraisal or by user Yes Access to specific data within an Appraisal may be regulated Yes Yes Read / Write / No Access to product by User ID Yes Yes Users can be given full product administrator access Yes Yes Yes Yes Users may change their password Yes Yes Yes Yes Force “Anonymity” feature can remove attribution of data (post appraisal situation)
Yes
T. Administrative and Utility Functions Database backup and restore may be performed (Administrator only) Yes Users logged on may be viewed Yes Administrator may force user logoff Yes
Notes

Appendix B
Usability test consent Form
64

Usability test consent Form
Thesis Title: A software tool for assessing Multi-Frameworks Environments
Please read and sign this form. In this usability test:
✓ You will be asked to perform certain tasks on a computer. ✓ We will also conduct an interview with you regarding the tasks you performed.
Participation in this usability study is voluntary. All information will remain strictly confidential. The descriptions and findings may be used to help improve the Multi-Frameworks Environments application.
However, at no time will your name or any other identification be used. You can withdraw your consent to the experiment and stop participation at any time.
If you have any questions, please contact Frederico Samuel Felisberto at [email protected].
I have read and understood the information on this form and had all of my questions answered
Your signature: ____________________________________ Date___/____/____
This consent form will be kept by the researcher for at least three years after the end of the current study.

Appendix C
Usability Test Case
66

Tasks Description
1.Create Account
1. Full name: Your Name 2. Organization: INOV 3. Email: My email
4. Password: 123@As 5. Confirm password: 123@As
2.Login 1. Email: My email
2. Password: 123@As
3.Create Assessment
1. Organization: INOV 2. Department: Human Resource 3. Description: XPTO
4. Purpose: XPTO 5. Assessment period: 20/10/2017 to 10/11/2017
Add contact points information
Add Contact
Point 1
1. Name: Personal 1 2. Email: [email protected]
3. Contact: 123456789
Add Contact Point 2
1. Name: Personal 2 2. Email: [email protected] 3. Contact: 123456789
Add Contact Point 3
1. Name: Personal 3 2. Email: [email protected] 3. Contact: 123456789
Remove Contact Point 3
Click Next button
Add Processes
Process 1
1. Framework: Cobit
2. Domain: Delivery, Service and Support 3. Process: DSS02 Manage Service Requests and
Incidents
Process 2
1. Framework: ISO 33052
2. Domain: Common Integrated Management Processes
3. Process: COM-08 Operational planning
Expected Maturity levels
1. Process 1: Any level 2. Process 2: Any level
Click Create button
Expanding and collapsing Base Practices
Base Practices 1. Find related Base practices between models:
(COBIT process and ISO 33052 process)
Work Products
1. Find related Work Products between models:
(COBIT process and ISO 33052 process). 2.1. Upload file (s) and at least for 2 Work Products
where one of them should be related with other (s).
2.2. Select achieved level
2. Add Comment if necessary

3. For each process select the achieved level (Result) 3. Click Save button 4. Click No button
4.Assessment details View details about your Assessment by clicking under Assessment table row.
5. Edit Assessment
Add one more Contact point
Add Contact Point 3
4. Name: Personal 3
5. Email: [email protected] 6. Contact: 123456789
Edit DSS02 Manage Service Requests and Incidents process
1. Select Base Practice
2. Select Work Products 3. Upload files and select the achieved level if necessary 4. Edit comment if necessary
5. Click Update button
6. Delete Assessment Click Delete button

Appendix D
System Usability Scale Questions
69

SUS - A quick and dirty usability scale
System Usability Scale © Digital Equipment Corporation, 1986. Strongly Strongly disagree agree 1. I think that I would like to use this system frequently 2. I found the system unnecessarily complex 3. I thought the system was easy to use 4. I think that I would need the support of a technical person to be able to use this system 5. I found the various functions in this system were well integrated 6. I thought there was too much inconsistency in this system 7. I would imagine that most people would learn to use this system very quickly 8. I found the system very cumbersome to use 9. I felt very confident using the system 10. I needed to learn a lot of things before I could get going with this system

Appendix E
Usability Results
71

Tasks U 1 U 2 U 3 U 4 U 5 U 6 U 7 U 8 U 9 U 10 U 11 U 12 U 13 U 14 U 15 U 16 U 17 U 18 U 19 U 20 Mean Stdev Median Confid
Task:1 55 90 56 60 55 60 80 60 100 89 80 69 67 104 55 61 55 60 59 80 69.8 15.9 60.5 7.0
Task:2 30 35 30 30 33 36 39 33 45 40 30 31 33 41 30 31 30 20 30 40 33.4 5.6 32.0 2.4
Task:3 320 280 280 300 301 290 300 280 330 310 300 280 260 390 274 240 230 302 310 240 290.9 35.5 295.0 15.6
Task:4 35 36 30 33 31 29 34 30 40 34 31 29 30 45 40 34 28 30 33 34 33.3 4.3 33.0 1.9
Task:5 150 160 170 140 144 134 135 144 180 120 170 160 155 180 180 140 140 133 144 150 151.5 17.4 147.0 7.6
Task:6 15 30 30 30 30 30 15 30 30 15 30 30 30 15 15 15 15 15 15 30 23.3 7.7 30.0 3.4
Task:1 Task:2 Task:3 Task:4 Task:5 Task:6
62.8 30.9 275.3 31.4 143.8 19.9
76.7 35.8 306.4 35.2 159.1 26.6
Tasks U 1 U 2 U 3 U 4 U 5 U 6 U 7 U 8 U 9 U 10 U 11 U 12 U 13 U 14 U 15 U 16 U 17 U 18 U 19 U 20 Mean Stdev Median Confid
Task:1 2 1 3 1 2 2 3 2 1 1 1 1 2 1 1 2 2 3 2 2 1.8 0.7 2.0 0.3
Task:2 1 1 1 1 1 1 1 1 2 1 1 1 1 1 2 1 1 2 1 1 1.2 0.4 1.0 0.2
Task:3 28 30 28 31 30 29 31 30 21 31 30 32 30 31 29 30 30 32 33 30 29.8 2.4 30.0 1.1
Task:4 6 4 5 6 5 5 6 5 6 5 6 6 7 6 6 7 6 7 6 4 5.7 0.9 6.0 0.4
Task:5 14 16 16 17 17 14 14 14 17 14 14 14 18 16 14 20 15 23 21 11 16.0 2.9 15.5 1.3
Task:6 3 6 6 6 6 6 3 6 6 3 6 6 6 3 3 3 3 3 3 6 4.7 1.5 6.0 0.7
Task:1 Task:2 Task:3 Task:4 Task:5 Task:6
1.4 1.0 28.7 5.3 14.7 4.0
2.1 1.3 30.9 6.1 17.2 5.3
Tasks U 1 U 2 U 3 U 4 U 5 U 6 U 7 U 8 U 9 U 10 U 11 U 12 U 13 U 14 U 15 U 16 U 17 U 18 U 19 U 20 Mean Stdev Median Confid
Task:1 0 1 3 3 2 0 4 0 2 0 1 1 0 0 1 0 1 0 1 0 1.0 1.2 1.0 0.5
Task:2 0 1 0 0 0 1 1 1 0 1 0 0 1 0 2 0 1 0 1 2 0.6 0.7 0.5 0.3
Task:3 1 0 0 0 0 0 0 0 1 0 0 0 1 0 0 0 1 0 0 0 0.2 0.4 0.0 0.2
Task:4 0 0 0 1 0 0 0 0 1 0 0 1 0 0 1 0 0 0 0 1 0.3 0.4 0.0 0.2
Task:5 1 0 0 0 0 1 0 0 0 0 0 1 0 0 0 1 0 1 0 1 0.3 0.5 0.0 0.2
Task:6 0 0 1 0 1 0 1 0 0 1 1 1 0 1 1 0 0 1 0 0 0.5 0.5 0.0 0.2
Based on Time in seconds
Based on number of clicks
Xmax = Mean + Cf
Xmin = Mean - Cf
Xmin = Mean - Cf
Xmax = Mean + Cf

Task:1 Task:2 Task:3 Task:4 Task:5 Task:6
0.5 0.3 0.0 0.1 0.1 0.2
1.5 0.9 0.4 0.4 0.5 0.7
Questions U1 U2 U3 U4 U5 U6 U7 U8 U9 U10 U11 U12 U13 U14 U15 U16 U17 U18 U19 U20 Mean Stdev Median Confid
Q:1 2 5 5 4 4 4 4 5 5 5 5 4 5 5 4 5 5 5 3 4 4.4 0.8 5.0 0.4
Q:2 1 1 1 3 1 2 1 1 1 1 1 2 2 2 1 1 1 1 1 1 1.3 0.6 1.0 0.3
Q:3 1 2 3 1 1 1 1 2 2 1 2 1 1 1 1 3 2 1 1 2 1.5 0.7 1.0 0.3
Q:4 3 2 1 1 1 1 1 1 2 4 4 1 1 2 1 1 2 1 1 1 1.6 1.0 1.0 0.4
Q:5 1 1 2 2 1 1 1 1 1 1 3 1 1 1 1 1 2 1 2 1 1.3 0.6 1.0 0.3
Q:6 2 1 1 1 1 1 41 2 1 1 1 2 1 1 4 1 1 1 1 2 3.4 8.9 1.0 3.9
Q:7 5 5 4 5 5 5 4 3 5 5 5 4 3 5 5 4 4 5 4 4 4.5 0.7 5.0 0.3
Q:8 3 1 1 1 1 1 1 2 2 2 2 2 1 1 1 1 1 1 1 1 1.4 0.6 1.0 0.3
Q:9 4 4 4 4 5 4 4 5 5 3 4 4 4 5 4 4 4 5 4 4 4.2 0.5 4.0 0.2
Q:10 2 3 1 1 1 2 1 1 1 1 3 1 2 1 1 1 1 1 1 2 1.4 0.7 1.0 0.3
Q 1: Q 2: Q 3: Q 4: Q 5: Q 6: Q 7: Q 8: Q 9: Q 10:
4.0 1.0 1.2 1.2 1.0 -0.5 4.1 1.1 4.0 1.1
4.8 1.6 1.8 2.0 1.6 7.2 4.8 1.6 4.4 1.7
Note: The letter U mean "User" and the user 1 is denoted as U1, the user 2 as U2 and so on
SUS Answers
Xmin = Mean - Cf
Xmax = Mean + Cf
Xmin = Mean - Cf
Xmax = Mean + Cf