Standard Form Recap – Planetary Data Sun mass 2 000 000 000 000 000 000 000 000 000 000 kg.
A study on socio-economy regarding the
water consumption in agriculture
September 2006

Socio-economy and water consumption in agriculture p 2/37
GUITTET VIRGINIE

Socio-economy and water consumption in agriculture p 3/37
THANKS
I would like to thank the NGO Auroville Water Harvest and the social team to welcome me.
In addition, I would like to thanks Seran, Camille, and Florent for the help.

Socio-economy and water consumption in agriculture p 4/37
THANKS.................................................................................................................................... 3
1 INTRODUCTION ............................................................................................................... 6 2 METHODOLOGY TO REACH THE OBJECTIVES AND RESULTS................................. 7 2.1 Agrarian system draft ................................................................................................................ 7 2.2 Biophysical environment and modes of farmland developement ........................................ 7
2.2.1 A well irrigated area ................................................................................................................. 8 2.2.2 A hard Climate and irregularity in rainfall ................................................................................. 8 2.2.3 Topography and Hydrology: tank system and lift irrigation...................................................... 9 2.2.4 An alluvial area......................................................................................................................... 9 2.2.5 The groundwater depletion .................................................................................................... 10 2.2.6 Soils influenced by human activities ...................................................................................... 10 2.2.7 One mode of farmland development...................................................................................... 10
2.2.7.1 Population and percentage of people doing agriculture................................................ 10 2.2.7.2 Model of farmland development .................................................................................... 11
2.3 Agrarian story : From the abundance to the depletion of groundwater............................. 13 2.3.1 Technical events: the green revolution .................................................................................. 14
2.3.1.1 Evolution of the crop system ......................................................................................... 14 2.3.1.2 Evolution of the water consumption .............................................................................. 15 2.3.1.3 Evolution of the livestock............................................................................................... 15
2.3.2 Social events : migration and less income in agriculture ....................................................... 15 2.3.2.1 Other activities and migration........................................................................................ 15 2.3.2.2 The property of the land ................................................................................................ 15
2.3.3 Ecological events: rainfall and water availability.................................................................... 16 2.4 Economical and technical study............................................................................................. 16
2.4.1 The crop systems (CS) ..........................................................................................................16 2.4.1.1 Agricultural equipment................................................................................................... 16 2.4.1.2 Paddy system: a high need of water but a provision crop ............................................ 17 2.4.1.3 Casuarina system : A low water consumption and a profitable crop ............................ 19 2.4.1.4 Comparison of the different crops in the area ............................................................... 21
2.4.2 The breed systems (BS) ........................................................................................................ 23 2.4.3 The farming systems, how do we build a farm typology? ...................................................... 23 2.4.4 The economics data of each farming systems....................................................................... 23
2.4.4.1 Landless people ............................................................................................................ 24 2.4.4.2 Small farmers buy water, lease land and agricultural workers and small farmers buy water but own land and outside income from the family. ............................................................... 25 2.4.4.3 Small farmers with outside income (from the members of the family) and own open-well. 26 2.4.4.4 Medium head farmers and Big head farmers capitalist................................................. 27
2.4.5 Model building ........................................................................................................................ 28 2.4.5.1 Calculation..................................................................................................................... 28 2.4.5.2 Results........................................................................................................................... 29
3 CONCLUSION : SOME PROSPECTS............................................................................ 31 3.1 Do we optimize water consumption in nanjai land?............................................................. 31 3.2 The efficiency of irrigation in punjai land .............................................................................. 31 3.3 The efficiency of application in punjai land........................................................................... 31 4 BIBLIOGRAPHY.............................................................................................................. 32 ANNEX .................................................................................................................................... 33
Socio-economy and water consumption in agriculture p 5/37
List of figures
Fig 1 - Tamil Nadu state and Villupuram ................................................................................... 8
district and taluk of Vanur .......................................................................................................... 8
Fig 2 - Villages in the tank rehabilitation project ........................................................................ 8
Fig 3 - Rainfall and temperature along the year ........................................................................ 8
Fig 4 – Geological map.............................................................................................................. 9
Fig 5 - Main type of soil in the area ......................................................................................... 10
Fig 6 - Number and proportion of people doing agriculture in the case study ......................... 11
Fig 7 - Model of the villages functioning according to the agriculture and the water management............................................................................................................................ 12
Fig 8 - Agrarian history according to the water management.................................................. 14
Fig 9 - Synthesis of the data on paddy system........................................................................ 17
Fig 10 - Crop operation and work calendar for the casuarina system ..................................... 19
Fig 11 - Synthesis of the data on casuarina system................................................................ 20
Fig 12 – Agricultural area according to the season ................................................................. 21
Fig 13 - Comparison of the graphs for the GVA, irrigation, and labor needs........................... 22
Fig 14 - The farming system of landless people...................................................................... 24
Fig 15 - The sexual division of the agricultural activities ......................................................... 24
Fig 16 - The farming system of small farmers who buy water ................................................. 25
Fig 17 Farming system of small farmers who have an open-well............................................ 26
Fig 18 Farming system of medium and big farmers who sell water ........................................ 27
Fig 19 representation of the model.......................................................................................... 28
Fig 20 Model of agricultural income per workforce for each farming system according to the maximal agricultural area .................................................................................................. 29
Fig 21 Calculation of the real agricultural income per workforce found in the area for each category of farmers.................................................................................................................. 30
Socio-economy and water consumption in agriculture p 6/37
1 INTRODUCTION The area around Auroville is covered by an interconnected network of rainwater
storage tanks (erys) and ponds (ooranis) that flow into the Kaluvelly Swamp. Many centuries ago, there were thousands of these tanks that not only recharged the groundwater table after the monsoon rains but also provided the sole source for drinking and irrigation water. They guaranteed a decent crop, and sometimes even two crops a year. It changed with the advent of the diesel engine. In fact, three phases in the India’s irrigation sector could be identified (Cohen, Janakarajan, 2001).
1. 1950-1970 large and medium irrigation projects
2. 1960-1990: introduction of High Yielding Varieties Technology
3. 1991-today: inter-state water disputes by government efforts in restructuring the department and maintenance activities for reasons of inefficiency and poor water rates recovery.
After independence around 85000 irrigation pumps sets in India. HYV is in large measure attributed to the irrigation. It is not an exaggeration to say that the massive growth of groundwater irrigation, coupled with the tremendous expansion of irrigated agriculture, has contribute to India’s food security and overall economic growth.
Agriculture sector is the single largest user of groundwater. In India, 1261 TMC of surface water annually available about 1050 TMC (Thousand Million Cubic feet) have been utilized for irrigation. In addition, in Tamil Nadu, 1, 6 millions wells extract an estimated 450 TMC of water annually (Janakarajan, 2001).
Farmers could pump unlimited amounts of water at cheap costs from the first aquifer, up to a depth of 40 meters. When submersible electric pumps appeared on the market and the Government agreed to supply free electricity to farmers, the second aquifer started to be mercilessly tapped, leading to depletion of groundwater and in some coastal villages to intrusion of seawater into the groundwater. The tanks and their connecting channels were forgotten, silted up and fell into ruins.
Now many of the tanks are being rehabilitated with help from governmental bodies and NGO's such as Harvest. By acting both as water supply for irrigation and as recharge for the aquifers they could provide at least part of the solution to the problem of massive groundwater overexploitation.
The problematic of this socio-economical study is also included in this context.
How do farmers use the water resource concerning the agricultural activities and how can they optimize it?
In this way the aim is to know what farmers are using to do according to the water consumption and to know the reasons which they practice their current farming system. This knowledge helps to analyse how they can change their behaviour compared with water management.

Socio-economy and water consumption in agriculture p 7/37
2 METHODOLOGY TO REACH THE OBJECTIVES AND RESULTS
2.1 AGRARIAN SYSTEM DRAFT This concept allows anticipating the environment’s exploitation of a rural society (Benkahla et al., 2003). The agrarian system draft of agriculture in a current place and current moment has to be analyzed and composed in two parts. The first is the cultivated ecosystem and the second the productive social ecosystem. We have to study of both them with their organization, their functioning and their interrelationships (Mazoyer et Roudart, 1997).
Three groups of elements build the agrarian system:
1. A climate, soils, special vegetation, and animals characterize a physical environment.
2. Demography, social organization, and economy characterized a human society.
3. Animals and crops techniques, tools, and special knowledge on crop system and breed system.
These entire elements can be considered in interaction.
2.2 BIOPHYSICAL ENVIRONMENT AND MODES OF FARMLAND DEVELOPEMENT To purpose innovation correspond to the farmer needs we must be able to analyse their productive environment, the potentialities and evolution of the environment characteristics. This step allows knowing the environment and to build a representation of the agrarian system. The second goal is to be able to discuss with farmers.
We have to analyse:
Geology, type of soils, climate, rainfall
Modes of farmland development like crops, breeds, soil exploitation, building, planting, water…
The first step looks for field observation to recognize relief elements and topographical description. In the same time it is possible to analyze geological map and to see emergence of bedrock.
The second step orientates for the climate data bases. Actually rainfall and temperatures influence the type of soils and the natural and cultivated vegetation.
The third step connects both of them in order to have a description of the landscape unit. After all we describe the use of each landscape unit in order to have the mode of farmland development. To do this we observe the fields.
Socio-economy and water consumption in agriculture p 8/37
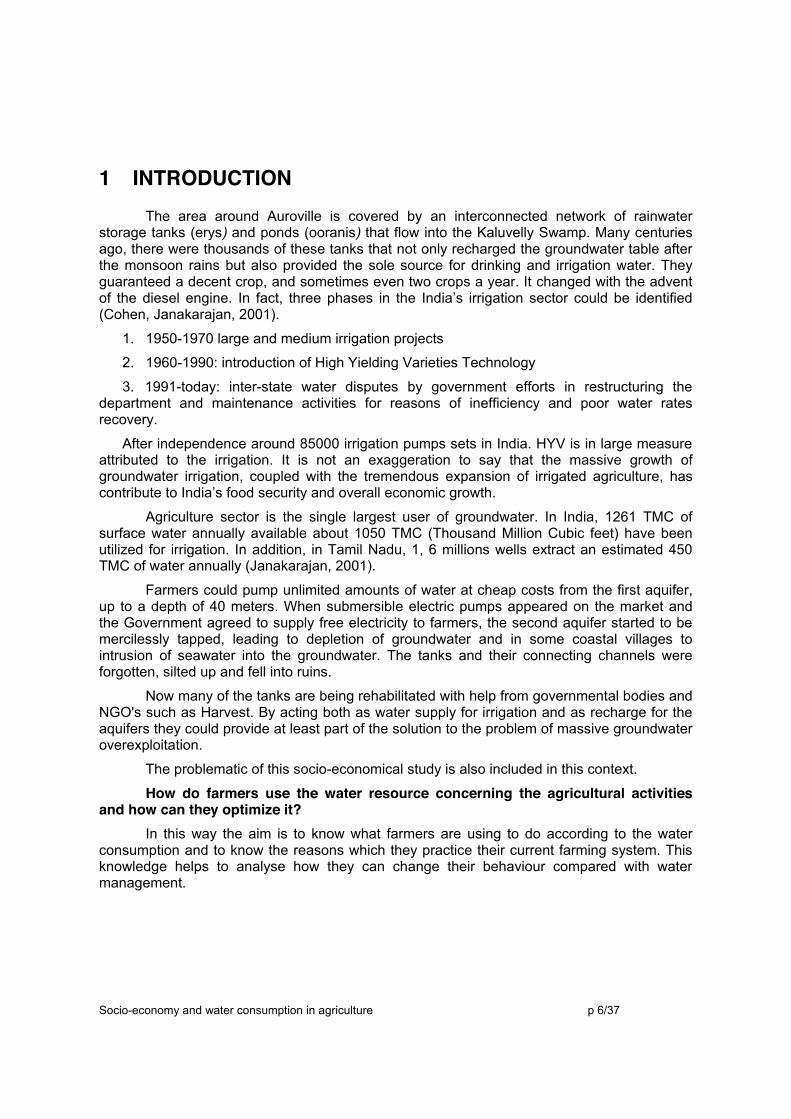
2.2.1 A well irrigated area It is needless to emphasise the significance of tank irrigation as this has been one of the most important sources of irrigation, from ancient times, in several parts of India, in particular, Tamil Nadu. It is quite impressive to note that there are reported to be about 39000 tanks in Tamil Nadu. My study place doesn’t escape the rule. We can see on the map the importance of tanks in the AWS intervention area.
Fig 1 - Tamil Nadu state and Villupuram Fig 2 - Villages in the tank rehabilitation project district and taluk of Vanur
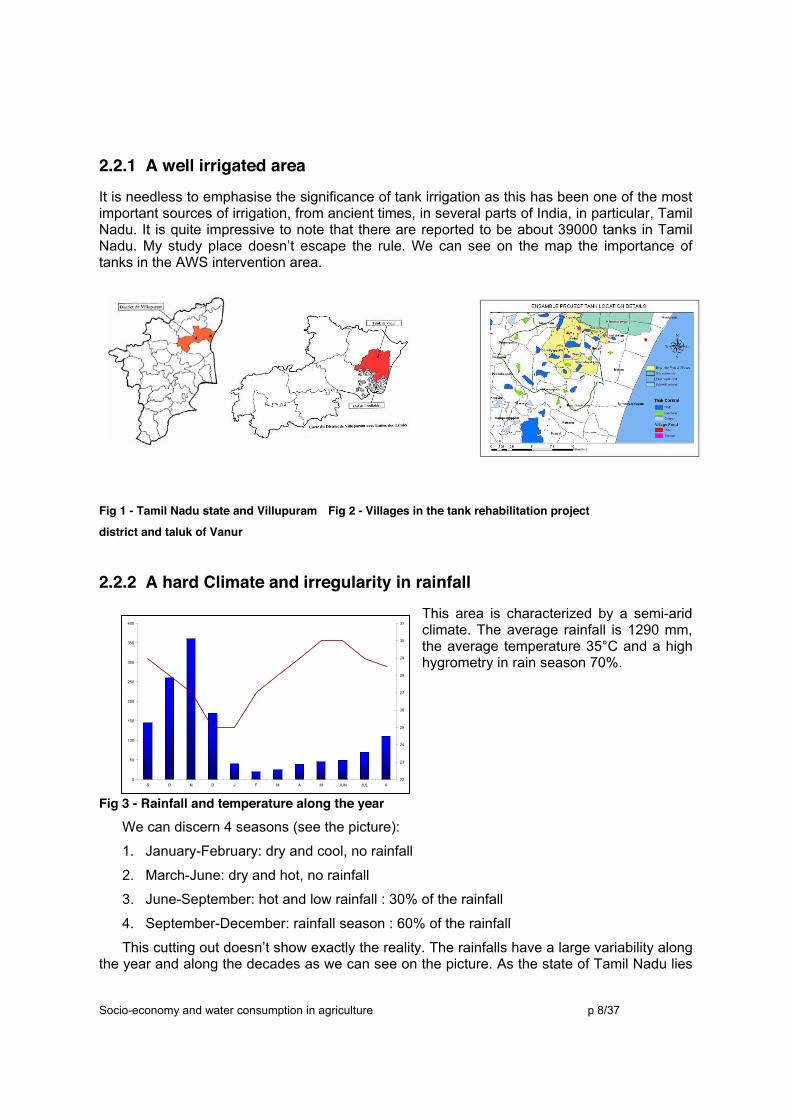
2.2.2 A hard Climate and irregularity in rainfall This area is characterized by a semi-arid climate. The average rainfall is 1290 mm, the average temperature 35°C and a high hygrometry in rain season 70%.
Fig 3 - Rainfall and temperature along the year
We can discern 4 seasons (see the picture):
1. January-February: dry and cool, no rainfall
2. March-June: dry and hot, no rainfall
3. June-September: hot and low rainfall : 30% of the rainfall
4. September-December: rainfall season : 60% of the rainfall
This cutting out doesn’t show exactly the reality. The rainfalls have a large variability along the year and along the decades as we can see on the picture. As the state of Tamil Nadu lies
0
50
100
150
200
250
300
350
400
S O N D J F M A M JUN JUL A22
23
24
25
26
27
28
29
30
31

Socio-economy and water consumption in agriculture p 9/37
on the rain shadow area of the Western Ghats the torrential rain of the south-western monsoon has little effect over Tamil Nadu (from June to September, 250 mm). On the other hand the northeast monsoon that is less dependable but is often accompanied by cyclones pours heavily in short spells over Tamil Nadu (from October to December, 750-1000 mm) (see picture). Because of these geographical conditions, irrigation played a key role in the development of agriculture in the state (Janakarajan, 2001).
2.2.3 Topography and Hydrology: tank system and lift irrigation The irrigated system is in downstream of the Kaluvelli swamp sub watershed. This area is relatively flat, the average elevation is around 15 meters above the see level. The drainage basin has no permanent river. He is made with a temporary stream network that collects rainfall and runoff water. A lot of tanks (often connected with each other) cross the network. Both at once were built many years ago with land. Now these buildings are integrated in the landscape. The topography was used to supply the monsoon rainfall. The filling up is made from upstream to downstream: when a tank is full, water flows in the waste weir and store the other tank. The water tank is drawn and directed through channels to irrigate the plots at lower level under gravity. Such irrigated lands are located on the irrigated perimeter (ayacut) and are called nanjai, in opposition to punjai which are lands in pluvial area (non-ayacut). Nanjai are traditionally reserved to paddy.
As concerned the lift irrigation, there are two types: open and bore wells. The both permit to extract the groundwater. During the green revolution bore wells were located on pluvial areas, in order to grow crops apart the monsoon season. But since 1989, the lift irrigation has been particularly attractive, when the Tamil Nadu government decided that electricity would be free for farmers. So nowadays we can find wells, even in the irrigated perimeter, which allow farmers growing rice in the ayacut even if the tank is empty.
2.2.4 An alluvial area A chain of sedimentary rocks covers the downstream part of the Kaluvelly drainage basin. It is composed of a succession of sandstone and calcareous with some clay level. The cuddalore formation lies with discordance on the other sedimentary rocks. Recent alluvia cover the northeast part of the drainage basin.
Fig 4 – Geological map
Socio-economy and water consumption in agriculture p 10/37
2.2.5 The groundwater depletion The aquifer of Vanur is the most requested in this area. It becomes captive under clays of Ottai towards the East and it is covered in its Northern part by the alluvia. A hydraulic connection is possible with the pond, sea, the intermediate base, and formations. Water has a good quality but shows signs of deterioration. In fact, salinity is increasing. This would be related to its strong exploitation having generated considerable falls of the piezometric level. The current level is at - 20 meters in the most depressed parts, that is to say a fall of approximately 35 meters since forty years.
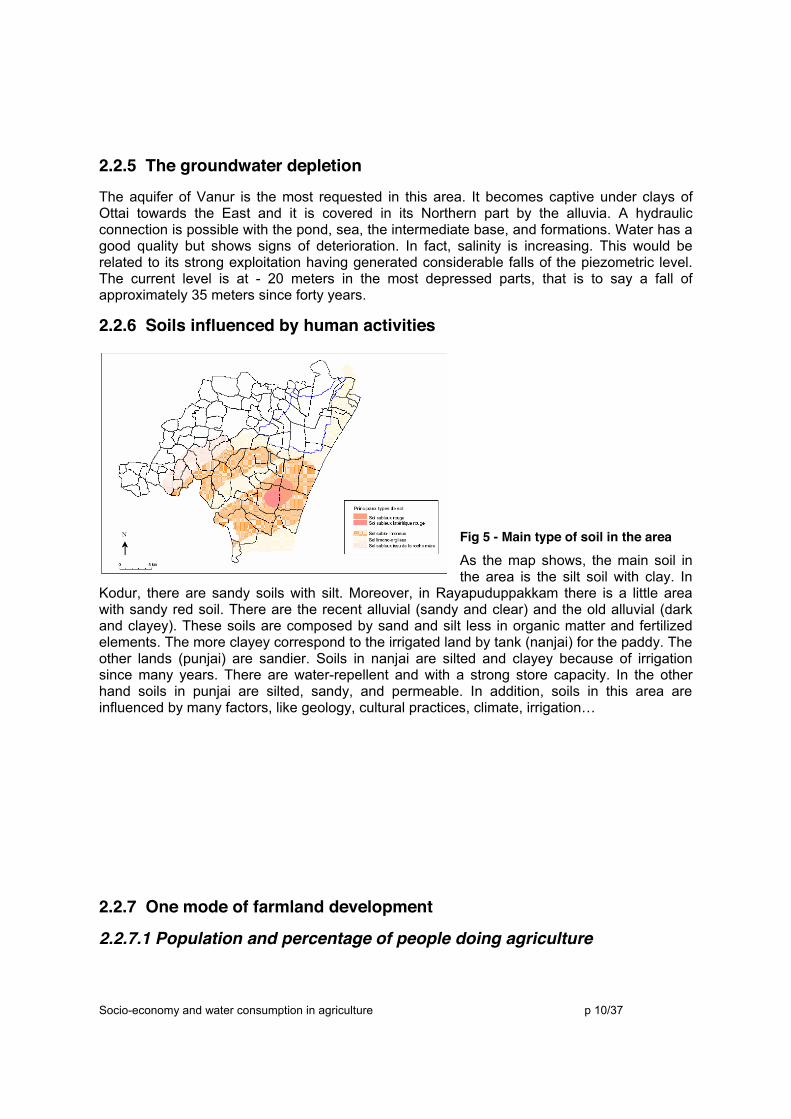
2.2.6 Soils influenced by human activities Fig 5 - Main type of soil in the area
As the map shows, the main soil in the area is the silt soil with clay. In
Kodur, there are sandy soils with silt. Moreover, in Rayapuduppakkam there is a little area with sandy red soil. There are the recent alluvial (sandy and clear) and the old alluvial (dark and clayey). These soils are composed by sand and silt less in organic matter and fertilized elements. The more clayey correspond to the irrigated land by tank (nanjai) for the paddy. The other lands (punjai) are sandier. Soils in nanjai are silted and clayey because of irrigation since many years. There are water-repellent and with a strong store capacity. In the other hand soils in punjai are silted, sandy, and permeable. In addition, soils in this area are influenced by many factors, like geology, cultural practices, climate, irrigation…
2.2.7 One mode of farmland development
2.2.7.1 Population and percentage of people doing agriculture

Socio-economy and water consumption in agriculture p 11/37
Fig 6 - Number and proportion of people doing agriculture in the case study
The first graph is showing the number of people in agriculture according to the total population in each village. The second graph is showing the proportion of people in agriculture in each village. These data come from the social team. In the total area, the proportion of farmers and agricultural workers is an average of 20%. In spite of the fact that all the villages are in a rural and agricultural area, we can note the low proportion of people who works in agriculture activities. In the paragraph of the agrarian system, I explain this fact.
2.2.7.2 Model of farmland development
number of farmers/villages
0
200
400
600
800
1000
1200
1400
1600
1800
2000
2200
2400
2600
kalup
erampa
kkam
Anpak
kam
Vilvan
atham
Rayott
ai
Kodur
Olundia
ppatt
u
Rayap
udup
akka
m
popu
latio
n
other populationfarmers
percentage of people in agriculture
0%
5%
10%
15%
20%
25%
30%
1
villages
perc
enta
ge
kaluperampakkam Anpakkam Vilvanatham Rayottai Kodur Olundiappattu Rayapudupakkam
2043
964
659
2427
18191783
65

Socio-economy and water consumption in agriculture p 12/37
We can see on the following picture the model of each village. I try to draw a representation of the reality.
Fig 7 - Model of the villages functioning according to the agriculture and the water management
The dynamic of the ayacut and tank depends on the season. Actually in wet season (from September to January), the tank supplies water; this is the first and the main function. In dry
NANJAI BLACK SOIL
Irrigation since many yearsPUNJAI SANDY and red
SOIL
NANJAI BLACK SOIL
Irrigation since many yearsPUNJAI SANDY and red
SOIL
Natural resourceson dry season : fishes, grazing, reeds, woods (neem tree, palm trees, prosopis, bushes…)
Water supply on wet season
Casuarina/groundnut
Casuarina/groundnut/sesame
Paddy (4 or 5 months) mostly
Paddy(3 m)/paddy (3m) if water available
Casuarina (36 months) sometimes
Fallow : graze land and plough land (6 months)
Banana trees : kitchen garden
Coconut trees near the road and kitchen garden
Tamarin: in government land
Pond: Common uses, drinking water for cattles, washing clothes, bath, and religious place…
IRRIGATION BY TANKIRRIGATION BY RAINFALL and WELLS
IRRIGATION BY TANKIRRIGATION BY RAINFALL and WELLS
Village : night paddock for some, permanent paddock
for others
1 to 4 milk cow and 20 goats, 30 cheep graze
fields in dry season
1 to 4 milk cow and goats graze fields in dry season
Village : night paddock for some, permanent paddock
for others
1 to 4 milk cow and 20 goats, 30 cheep graze
fields in dry season
1 to 4 milk cow and goats graze fields in dry season
Tank 119 ha Ayacut 128 haNon-Ayacut 154 ha andTank 119 ha Ayacut 128 haNon-Ayacut 154 ha andTank 119 ha Ayacut 128 haNon-Ayacut 154 ha and
Direction of flowing water
village
Alluvial/clay or silt
20m
19m
Upstream Downstream
Groundwater depth 150 feet to 600 feet
Model of each village
Direction of flowing water
village
Alluvial/clay or silt
20m
19m
Upstream Downstream
Groundwater depth 150 feet to 600 feet
Model of each village
Transect key
Building Natural species
Crop
Breed
channel and bund
pond
bore well
village
Colony
prosopis
reed
paddy
casuarina
sesame, black gram…
groundnut
palmtree
banana tree
coconut tree
milk cow
goat

Socio-economy and water consumption in agriculture p 13/37
season from February to September, their function is for natural resources. For instance people can fish or use reeds to build the roof of the houses. They can still use prosopis for firewood. At least palm trees are a useful wood for building house, roof and cooking. Neem trees are used especially for medicine.
Next, in the ayacut people cultivates paddy during the wet season with the tank irrigation. If farmers have an open-well or a bore-well they can make a second season of paddy but it is very marginal. This area is essentially making up by black soils (clayey soils and low drained). This soil moved with many times of irrigation, that’s why there is a lot of clay and silt and the water can stagnate. In the dry season there are cattle that graze the paddy fields. When the soil is sandier, people plant sometimes casuarina in the ayacut.
Regarding the non-ayacut, the main crop is casuarina with intercrop (groundnut, black gram (pulses), sesame) the first year. Farmers use the rainfall season for planting casuarina and the intercrop. After the rain season, they irrigated the crop with bore-wells or open-wells. The soils are sandy and silt with clay. Therefore, the water is well drained.
In each village, there are garden kitchen with banana trees and coconut trees around the houses. The bananas are kept for the auto consumption and the coconut are sold. It allows having a little income.
2.3 AGRARIAN STORY : FROM THE ABUNDANCE TO THE DEPLETION OF GROUNDWATER
Interviews allow understanding the main pressure for the agricultural production. The agrarian story allows understanding the historical relationships between the environment (biophysics, politic and socio-economic), the status of the cultivated ecosystem and the agricultural practices.
To do this, I am looking for points of view and opinions. Therefore, I use open questions. With regard to samples, I am looking for the diversity of point of view to describe a same object. Then I build the story with information. I finish the interview when no more new elements appear (saturation). To read the framework of the interviews go to annex.

Socio-economy and water consumption in agriculture p 14/37
Fig 8 - Agrarian history according to the water management
2.3.1 Technical events: the green revolution
2.3.1.1 Evolution of the crop system Before 1900, farmers cultivated only millets like Varagu in wetland. Then, there was a change of the food behavior. They cultivated paddy for 6 months in the ayacut with the nursery and the transplantation. In dry land, they put paddy but they saw the seeds, and it was a rainfall crop. They put also millets (raggi and cambu), and groundnut in the dry lands. For the fertilizers, they used organic manure, green manure, mulching, and for the pesticides they used neem leaves and others mixed leaves.
After the green revolution, the high yield varieties of paddy appeared, so farmers increased the paddy cultivated area and they left the millets cropping pattern. They put chemical fertilizers, pesticides, and green manure. In the ayacut, they used to cultivate paddy. One variety is the IDT 39; this is a paddy 5 months. The other variety is the IDT36 this is a paddy 3 months. So the green revolution allows increasing the yield in rice but changing the nutrition of the food. Before people used to eat more pulses so the quality of the nutrition value was more well-proportionned.
1983
Green revolution HYV
Green manure Cambu/karamani, Mulching,
Neem leaves, compost, cow pat
Rainfall millet
paddy 6 months wet land
dry land Rainfall crop: paddy- millet (raggi-cambu)- groundnut
Green manure Cambu/karamani, Mulching,
Neem leaves, compost, cow pat
Rainfall millet
paddy 6 months wet land
dry land Rainfall crop: paddy- millet (raggi-cambu)- groundnut
Rainfall millet
paddy 6 months wet land
dry land Rainfall crop: paddy- millet (raggi-cambu)- groundnut
TANKNeerkutti Control by government WUATANKTANKNeerkutti Control by government WUA
Kavalai and Ettram Bore-well/submersible pumpOpen-well with diesel pumpKavalai and EttramKavalai and Ettram Bore-well/submersible pumpOpen-well with diesel pump
independence Agrarian politics
Electricity power
independence Agrarian politics
Electricity power
Area
Paddy areaMillet area
Casuarina area
Area
Paddy areaMillet area
Casuarina area
19701900 1960 1990 2000 20061947 19701900 1960 1990 2000 20061947
Water market15
50
100
300 -600
Depth (feet)
Water levelWater market
15
50
100
300 -600
Depth (feet)
Water level
Chemical fertilizer
Pesticides, green manure (takapundo…)
Casuarina / black gram, groundnut 1year intercrop – sugarcane if bore-well
paddy 5 months or 4 months/grazing land -Casuarina – Sugar cane
Chemical fertilizer
Pesticides, green manure (takapundo…)
Casuarina / black gram, groundnut 1year intercrop – sugarcane if bore-well
paddy 5 months or 4 months/grazing land -Casuarina – Sugar cane
Socio-economy and water consumption in agriculture p 15/37
In the dry lands, they used to put groundnut because this is a rainfall crop. Casuarina appeared in the 80’, and farmers put for one year intercrop groundnut or black gram. Now casuarina is cultivated in the ayacut too in some area. This crop is cultivated because there is a lack of labors. In addition, the cultivated area for groundnut, millets, and black gram was decreasing, and the cultivated area of casuarina is increasing. The paddy yield is decreasing now because of the one cropping pattern in the field, the lack of diversity, the fertilizers, and the bad conditions of soils.
2.3.1.2 Evolution of the water consumption Indian people have built tanks since a long time, but the British government helps for modernizing the structure in around 1890, to build bunds, sluices, and channels… Traditionally there was the nerkutti, which was in charge of the maintenance of the tank. However, this tradition lost and when the government controlled tank, the maintenance of the structure began to decrease. Now in each village AWS help for creating water user association.
In addition to the tank, kavalai and ettram were using to lift water. Farmers used this form of irrigation if there was no sufficient water to cultivate the rainfall crop in the punjai. In the 60’, farmers used open well with diesel engine to store the water in punjai. After the green revolution, bore wells appeared with the submersible pump. Big farmers were the first users of this form of irrigation. It permits to do sugarcane, moreover, to cultivate dry land even if there was no water.
2.3.1.3 Evolution of the livestock In the past, all the people in the village had unless 20 cows in the household. Children were able to herd cattle. Then awareness for education and school became, and nobody maintained cattle. Therefore, the livestock decreased, and organic manure did not become available. Before there were subsidies for cows, but now there were not available. Bullocks are using for the fieldwork, cow for the milk and goat for the meat.
2.3.2 Social events : migration and less income in agriculture
2.3.2.1 Other activities and migration The number of farmers is decreasing because of the less rain, less yield, less water, less agricultural income, and young people don’t want to do hard work.
Landless people are often labors in the field and if there is no work, they go outside to find a job. Some other farmers like marginal farmer, go outside to do some business, government option, private, or agricultural labor…
Agricultural labors go outside in industries because it is more profitable. So farmers need to change the crop pattern, there are no sufficient workforce to do the hard work in the field. Therefore, farmers put casuarina. In fact, the income is very high after 3 years.
2.3.2.2 The property of the land For the ayacut: the irrigated land cannot change. It depends on the water storage of the tank. For the non-ayacut: punjai increase or decrease it depends on the availability of water.
Farmers have to pay some taxes for the cultivation area in government property. For the wetland, it is 150 Rs/acre/year, for the dry land it is 30 Rs/acres/year.

Socio-economy and water consumption in agriculture p 16/37
When there was the kingdom, all the lands belong to it. People could cultivate only. Farmers gave harvest crop or money. After, the lands were under the control of British people. After independence, the classification of farmers appeared. Because of migration, some upper cast sold their land and there was a partition of land. Now there are landowners. Inside the family, when children get married there is an equal partition of the land. Some people become landless because of the marriage or sickness so they sell the land, or they are traditionally agricultural labor. Because of the partition of the land inside the family and the big population, the acreage is decreasing.
2.3.3 Ecological events: rainfall and water availability In the past rainfall was regularly all around the year. Tanks stored a lot of water during the year. In addition, farmers put, cotton, green gram in the ayacut. Now there is only one season of rainfall: the monsoon season. The water level decrease since 20 years in average. This is because of the pumping of water in the aquifer with bore-wells.
2.4 ECONOMICAL AND TECHNICAL STUDY
2.4.1 The crop systems (CS) A crop system is definite by the nature and the order of the successions and the technical itineraries. Physical environment and historical events govern the crop diversity. However to understand why do farmers cultivate this crop, we have to analyze others aspects. The first step is to analyze the agricultural practices and the second is to evaluate economical performances for each crop system. For this we must know all the expenses (C) and all the products (gross products GP) to calculate the gross value added (GVA) per acre for the crop system. After this, it is easy to compare the crop productivity of each crop system.
To sum up
GVA cs = GP-C
GVA/acre = (GP-C)/usable agricultural area
2.4.1.1 Agricultural equipment Bore-wells and open-wells
In this area, the number of bore-wells is adding up to an average of 200. These buildings are equipped with submersible pumps that lift water and distribute it via the irrigation channels. The depth depends on the situation in the area, it varies from 150 feet to 600 feet.
The using length is limited by the depletion of groundwater and by the salinity. Therefore, farmers have to dig it every 7 years. The bigger farming systems often own this system of irrigation. It is because of the important investment (100 000 Rs for digging and 150 000 for the submersible pump). Besides, the difficulty is to get an electrical connection.
The smaller own sometimes open-wells, which were built by the father or grandfather. There buildings are equipped with oil engine. The investment is least than the submersible pump (13000 Rs) but they do not have water all around the year.

Socio-economy and water consumption in agriculture p 17/37
The others buy water next to the owners when they need in punjai land. The more often neighbors or family relations sell water. They sell only for two or three people. For that reason, the buyers are limited for the choice (casuarinas). The price is fixed according to the hours of usage (30 Rs/hours) or according to the price of the field (one-third for the owner of the bore-well).
Tractor Farmers have a tractor always with harrows and trailer. However, big farmers can only invest in this equipment. The other farmers rent the machine for ploughing. Tractors are more used for ploughing operations than bullockat. Only small farmers used bullockat when they do not have enough to rent a tractor or when the fields are inaccessible.
Manual equipment All the farmers and coolies employ the mamutti for weeding, open and close the channels and all the current works in the field.
2.4.1.2 Paddy system: a high need of water but a provision crop
Fig 9 - Synthesis of the data on paddy system
In the seven villages, paddy is cultivated in the ayacut with irrigation only by the rainfall water stored in the tank. Farmers do only one season of paddy because the problem of the water availability. Hence, they used a variety hybrid with a long cycle (4-5 months) and short straw. The name is IDT 39. These hybrids require chemical fertilizers and insecticides to express totally their genetic potential.
Thus, farmers saw 35 kg of seeds in six-sent square of nursery. It needs 2 inches (5 cm) of water daily. Subsequently they put water every 2 days during 8 hours. They put also urea and DAP (di amono phosphate) respectively 10 kg and 9 kg with insecticides (100 mg).
Following, paddy is transplanting after one month. Farmers flood the field and plough a third time. In the same time, coolies prepare and wash the bundles. In the afternoon, females’ coolies transplant. During 4 months paddy needs a height of water near 1 inch and half (5 cm). For that, farmers open the channels every 2 days during 8 hours. In totality, they put an average of 540 hours per year of water. In addition, they put urea and DAP one time per month. For insecticides, they put only one time in December. Finally, coolies make two weeding.
Crop system
Crop sequence
Crop operation Irrigation
labour day yield/acre
GVA/acre
PADDYPADDY 5
months/fallow 3 plouhings 540 hours/year DAP 109 kg insecticides 400 mg 90 30 bags 1880IDT 39 2 weedings Urea 60 kg
lease land Potasse 50 kg -2590harvest hand Compost 3000kg 1530
ammoniac 50 kgsep oct nov dec jan feb march
nurserytransplantingharvest
Fertilization chemicals

Socio-economy and water consumption in agriculture p 18/37
During the time of harvesting, 15 females make the operations of cutting, beating and drying to put paddy in bags. If the field is accessible, some farmers use harvest machine. The average yield is around 30 bags of 75 kg. Farmers sell 20 bags per acre in the sales committee of Pondicherry and they keep 10 bags for the autoconsumption.
It is notable that farmers put many fertilizers, in particular nitrogen. The first reason is that the variety needs chemicals to grow up; it is an intensive variety in chemicals. Moreover, because of the semi-arid and tropical climate, the nitrogen is evaporated. Consequently, farmers put a high dose to save it in the soil.
The productivity of the land (GVA/acre) is calculated with cash value. It takes all the payment in natural way (the payment for lease, the harvest, and the autoconsumption) into account. It shows thus the real earn for the farmers. Therefore, this productivity is from 1000 Rs to 2000 Rs per season and per year. This low benefit is due essentially to the low yield, the sale low price, and the high expenses.
It is essential to underline that the small farmers who lease land in the non-ayacut lost money with the paddy crop because they must give one-third of their harvest to the landowner. Nevertheless, they can eat for one year with the yield.
We have to emphasize the high water consumption and the non-profitability. So what is the reason to continue cultivating paddy?
The first one is that the paddy crop is a traditional crop and the ayacut is the favored place to cultivate it. The other is because paddy is adapted in clayey and heavy soils as the nanjai land. Furthermore, farmers prefer to cultivate paddy for the provision food around the year than to buy it, it is cheaper. The straw is also needful for the cattle.
Moreover, after and during the green revolution, paddy was a priority to manage to the food auto sufficiency (for the yield essentially). Accordingly, the central state supports this crop. It fixed the maximum retailed price every year. Only government shops can sell the rice with a less price. In addition, the sales committees are the structures, which buy paddy with the fixed price. Following, the state offers rural loan for the paddy season in the cooperatives societies with a low interest of 7 % per year. To get the loan, the minimal area is 1 acre. All these reasons make that farmers continue to cultivate paddy in the ayacut.
Socio-economy and water consumption in agriculture p 19/37
2.4.1.3 Casuarina system : A low water consumption and a profitable crop
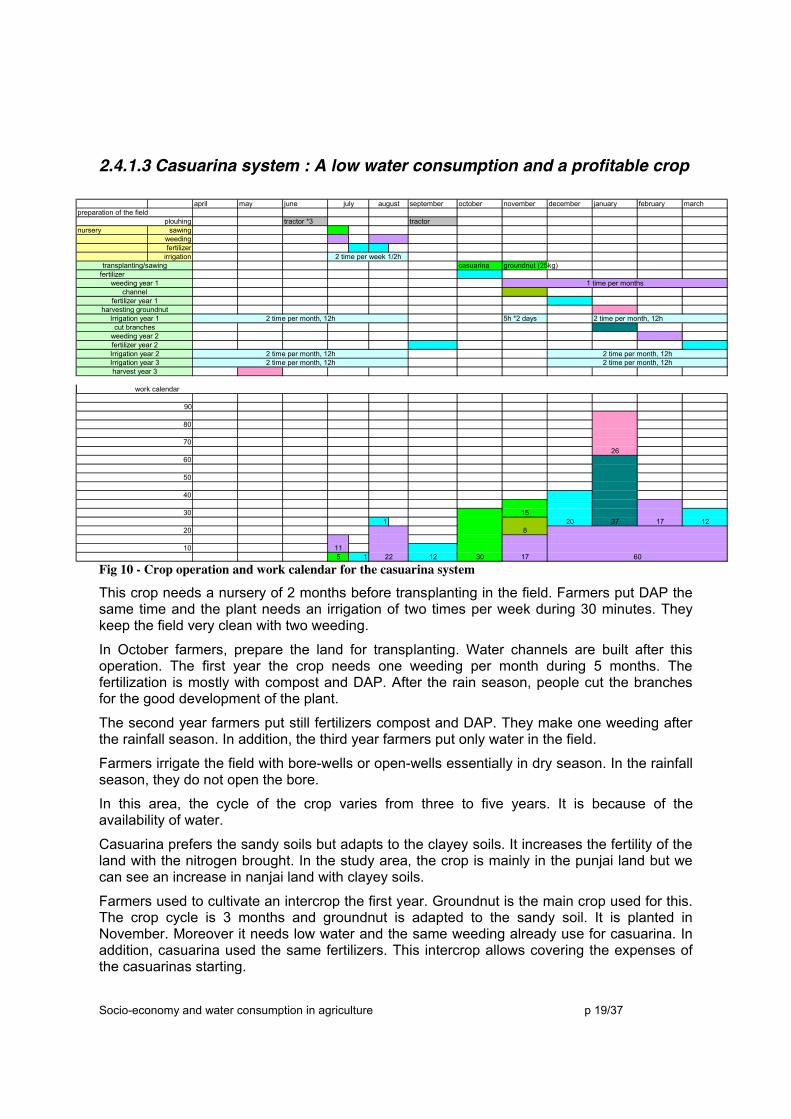
Fig 10 - Crop operation and work calendar for the casuarina system
This crop needs a nursery of 2 months before transplanting in the field. Farmers put DAP the same time and the plant needs an irrigation of two times per week during 30 minutes. They keep the field very clean with two weeding.
In October farmers, prepare the land for transplanting. Water channels are built after this operation. The first year the crop needs one weeding per month during 5 months. The fertilization is mostly with compost and DAP. After the rain season, people cut the branches for the good development of the plant.
The second year farmers put still fertilizers compost and DAP. They make one weeding after the rainfall season. In addition, the third year farmers put only water in the field.
Farmers irrigate the field with bore-wells or open-wells essentially in dry season. In the rainfall season, they do not open the bore.
In this area, the cycle of the crop varies from three to five years. It is because of the availability of water.
Casuarina prefers the sandy soils but adapts to the clayey soils. It increases the fertility of the land with the nitrogen brought. In the study area, the crop is mainly in the punjai land but we can see an increase in nanjai land with clayey soils.
Farmers used to cultivate an intercrop the first year. Groundnut is the main crop used for this. The crop cycle is 3 months and groundnut is adapted to the sandy soil. It is planted in November. Moreover it needs low water and the same weeding already use for casuarina. In addition, casuarina used the same fertilizers. This intercrop allows covering the expenses of the casuarinas starting.
april may june september october november december january february march
tractor *3 tractornursery sawing
weedingfertilizer
irrigationcasuarina groundnut (25kg)
fertilizer
5h *2 days 2 time per month, 12h
1
5 1
preparation of the field
Irrigation year 1cut branches
transplanting/sawing
channelweeding year 1
weeding year 2
2 time per month, 12h
fertilizer year 2
plouhing
july august
fertilizer year 1harvesting groundnut
2015
1 time per months
2 time per week 1/2h
60
harvest year 3Irrigation year 3Irrigation year 2
37
50
40
90
26
80
70
2 time per month, 12h
work calendar
2 time per month, 12h 2 time per month, 12h2 time per month, 12h
1730
30 1710
12
12820
22 6011

Socio-economy and water consumption in agriculture p 20/37
One usage is to put sesame after groundnut (a 3 months crop also). As well as, it can be planted in dry season because of the needless of irrigation. Nevertheless, this crop is not tolerant to clayey soil, and impoverishes the soil in minerals.
If farmers cultivate the casuarina system in nanjai, they put pulses (blackgram and greengram) as intercrop. Casuarina and blackgram could be adapted to clayey soil but they do not like to have stagnant water on the roots. Fig 11 - Synthesis of the data on casuarina system
Thus, the area of casuarina appeared since 10 years back. The lack of labors and the lack of water incited the farmers to do this crop. As we see on the work calendar, the majority of the work field is concentrated on the first six months. Thanks to the market (Paper, building, combustible wood, scaffolding…), the casuarinas system have good land productivity. Farmers sell the fields to brokers for an amount of 100 000 Rs per acre. As we see above the intercrop like groundnut allows to covering the first expenses. Then the land productivity (GVA/acre) could reach 15 000 Rs per year if the farmers has his own bore-well. Other wise if farmers have to buy water, the land productivity could reach an amount from 11 000 to 12 000 Rs per year.
The drawbacks are that the field of casuarina develops insects, attracts cattle with the weeds, and limits the growth of the neighbor crops because of the shadow. For that reason when a farmer put this crop in his field, the neighbors are obliged to do the same. Nevertheless, the main problem is that farmers get the income every 3 or 5 years. Consequently, they must have other activities, which cover the needs during this time.
We can conclude with the following graph, which is showing the percentage of the different cultivated area according to the season.
Crop system Crop sequence Crop operation Irrigation labour day GVA/acre
CS 1 wellCasuarine / groundnut 3 months the first year 3 plouhing 211 hours/year Compost 5000 kg 89 14334
6 weedings DAP 200 kg1 cutting branches
CS 1 buying water 11001
CS 2 wellCasuarine / groundnut / sesame or blackgram 3 plouhing 211 hours/year Compost 5000 kg 104 15603
6 weedings DAP 200 kg1 cutting branches
CS 2 buying water 12269
Fertilization
0%
10%
20%
30%
40%
50%
60%
70%
80%
90%
100%
S O N D J F M A M JUN JUL A
months
fallow land/graze landothers cropscasuarinapaddy
Socio-economy and water consumption in agriculture p 21/37
Fig 12 – Agricultural area according to the season
2.4.1.4 Comparison of the different crops in the area
With the aim of showing the reality, I emphasize the paddy system and the casuarinas system above, because there are the both main system in the case study. Nevertheless, some big farmers cultivate cotton and sugarcane.
Thus in this paragraph, the intend is to compare all the crop regarding to the land productivity, the water consumption and the labor need.
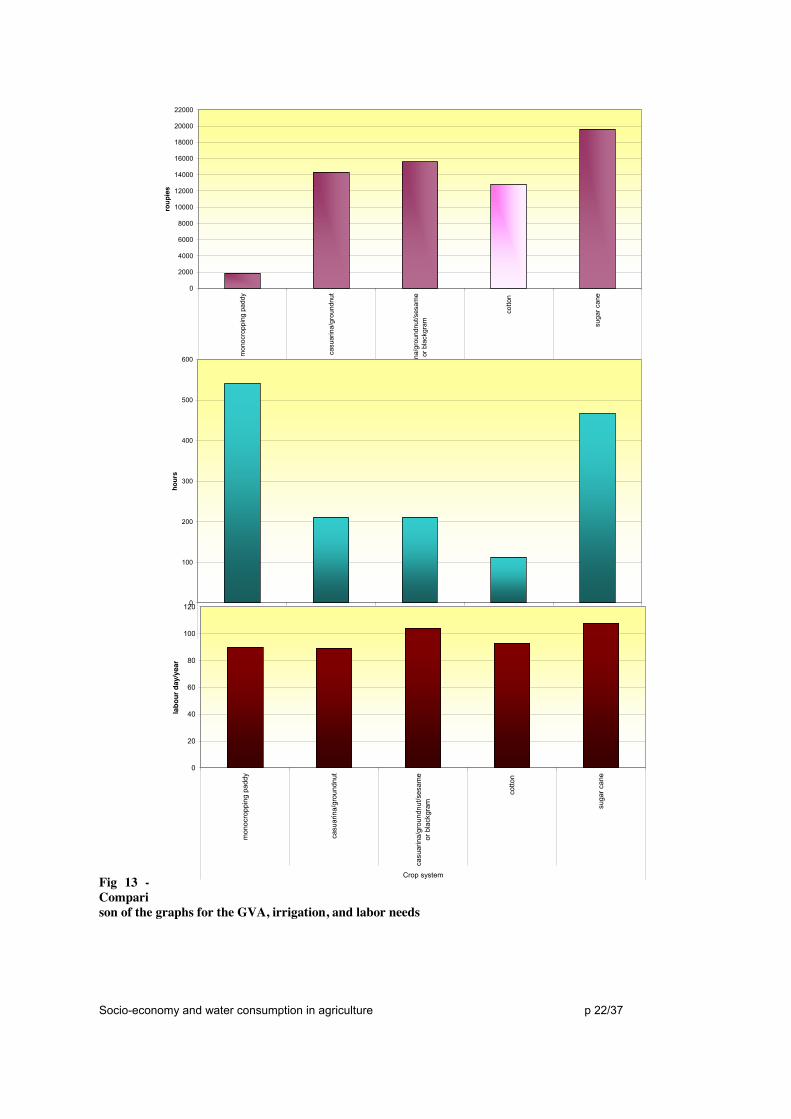
The following graphs allow understanding the little income of paddy regarding to the other crops. The more profitable in this area is the sugarcane. However, this crop needs around 450 hours per year of water and many men labors for harvesting. As I wrote before, the area is characterized by a lack of labors and a lack of water. For all these reasons, few farmers use to cultivate sugar cane. Concerning the cotton, the income reaches an average of 12 000 Rs per year more regularly than casuarina; in addition the need of water is low. But, it monopolizes many women during a long time (coolies or family workforce for harvesting and separating the leaves from the seeds). Moreover, cotton likes the silt and clayey soils as certain punjai land, and nanjai land. For my opinion, farmers do not use this crop for three reasons: the lack of workers, the big applied of insecticides, and the proximity of casuarina in punjai.
Socio-economy and water consumption in agriculture p 22/37
Fig 13 - Comparison of the graphs for the GVA, irrigation, and labor needs
0
2000
4000
6000
8000
10000
12000
14000
16000
18000
20000
22000
mon
ocro
ppin
g pa
ddy
casu
arin
a/gr
ound
nut
casu
arin
a/gr
ound
nut/s
esam
eor
bla
ckgr
am
cotto
n
suga
r can
e
Crop system
roup
ies
0
100
200
300
400
500
600
monocropping paddy casuarina/groundnut casuarina/groundnut/sesameor blackgram
cotton sugar cane
Crop system
hour
s
0
20
40
60
80
100
120
mon
ocro
ppin
g pa
ddy
casu
arin
a/gr
ound
nut
casu
arin
a/gr
ound
nut/s
esam
eor
bla
ckgr
am
cotto
n
suga
r can
e
Crop system
labo
ur d
ay/y
ear
Socio-economy and water consumption in agriculture p 23/37
2.4.2 The breed systems (BS) It is the same as the crop system for calculating the economical data. The framework of the questioner is on annex. In India, it is very difficult to understand the question of cattle. I think a special study about this topic could represent correctly the different systems. So, I do the best for understanding. As I explained before, we can see on dry season buffalos, cows, sheep, and goats, which grazed the land. But the farmers I asked, have mostly few goats and one or two cows. Indeed farmers have some animals for the milk and for the meat. In this case, I needed the price of the average GVA per cow and per goat to calculate after the total agricultural income in each farming system. I find an amount of 220 Rs per goat and 2000 Rs per cows. Even though I could write that all these animals improve the fertility of the nanjai land in the dry season and the number of animals in the area is non-negligible. But for this study and regarding to the water consumption, this agricultural activity do not consume a lot of water.
2.4.3 The farming systems, how do we build a farm typology? After the historical analysis, we are able to build a pre-typology. In fact, one of the aims of this analysis is to know the mechanism through whose the different farmers have been carried on diverse farming system. This is the farm trajectory.
Farmers of the same area do not always have the same means and do not produce in the same economical and social conditions. Build a farm typology allows describing the diversity of situation showing in types or categories. This tool simplifies the reality from relevant criterion like water consumption in this study. For all the following systems the paddy in ayacut is only irrigated by rainfall and tank. So the difference in water consumption is in the usage of water in punjai.
2.4.4 The economics data of each farming systems The farming system could be described as the combination in the space and in the time of available resources of the farm with animals and crop products. The aim is to measure the economical efficacy of the farming system. To calculate the agricultural income we need to know the agricultural equipment to subtract the depreciation from the total gross value added of the crop systems and breed systems. In this way, we have the net value added (NVA). This measurement allows knowing the wealth created in the farming system. Next, it is important to know the tax, the interest of the loans, and the salary to subtract there from the NVA and finally to know what the farmers earn in reality.
To sum up for a farming system
TOTAL GVA = GVAcs1+GVAcs2…+GVAbs1+GVAbs2…
NVA = GVAT-(depreciation of the agricultural equipment)
Agricultural income = NVA-(taxes+interests+…) + subsidies
Taxes+interests… = non-proportional costs (Cnp)

Socio-economy and water consumption in agriculture p 24/37
2.4.4.1 Landless people
Fig 14 - The farming system of landless people
According to the data of the social team, landless people represents near the half of people who are working in agriculture. However, I do not know exactly if all the landless people are agricultural workers or if they are working outside in a factory. Nevertheless, most of them have some animals for the meat and the milk. Some could lease half acre or one acre for cultivating paddy but it is rare. Mostly, landless people (women and men) use to work in the land of owner farmers and they are paid with nature (paddy bags) or cash.
The agricultural labors mostly belong to the low cast. It is because of the cast system. Now, inside all the casts, the sexual work division is notable.
Men’s works Female’s works
Drivers, fertilization and spraying of chemicals, maintenance of the irrigation channels, management of the bore…
Salary : between 80Rs and 100Rs for 7h of work per day
Transplanting, cutting, weeding, harvesting paddy.
Salary : between 40Rs and 50Rs for 7h of work per day
Fig 15 - The sexual division of the agricultural activities
As we see before, man workers migrate for doing factory jobs or punctual jobs for higher salary. That is why some farmers do alone the work of fertilization or the other works. However women workers stay in the village. They are the essential workforce for doing the everyday agricultural works. These women have not other alternatives. This is real change since 15 last years.
NO LAND ACRE=0, NO bore-well, other job : agricultural labor or in a factory
Several activities •Factory
•Agricultural (agricultural labor, timber, climber)
1 or 2 milk cows
Goats (5-6 females) autoconsomption
Sometimes 1 acre is leasing for the paddy crop
percentage of the category of farmers in the total area
0-2 acres 2-5 acres
>5 acres landless
Socio-economy and water consumption in agriculture p 25/37
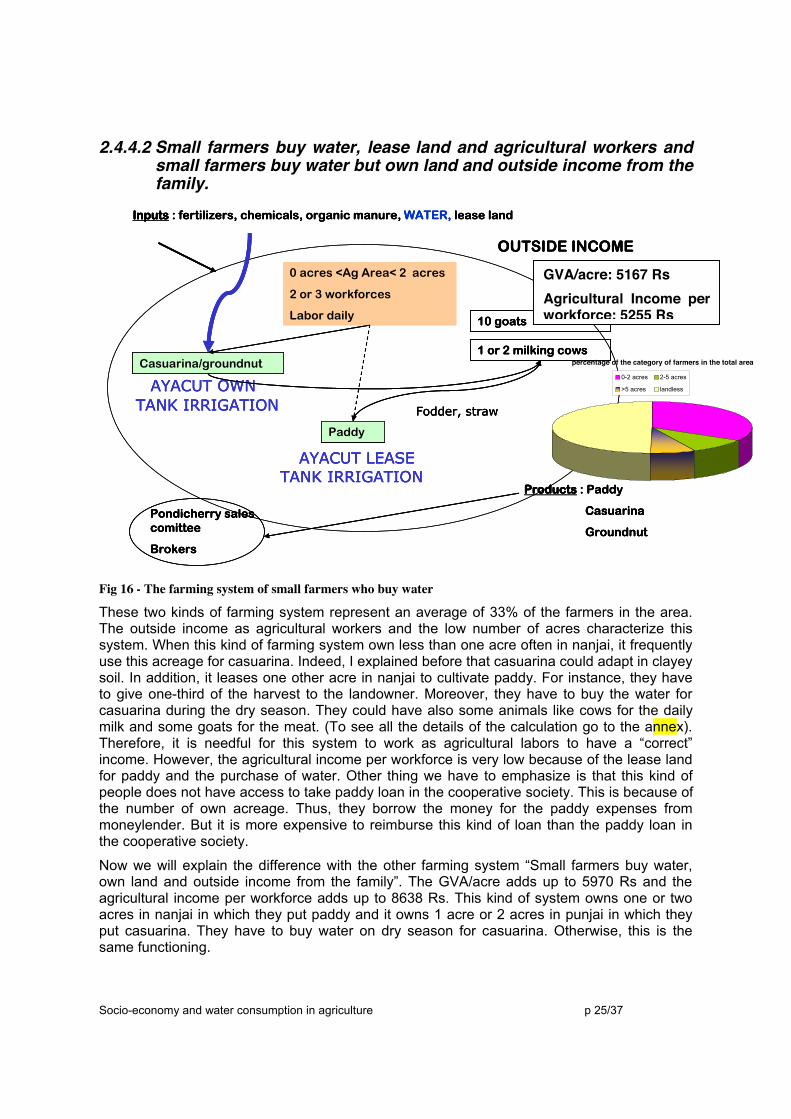
2.4.4.2 Small farmers buy water, lease land and agricultural workers and small farmers buy water but own land and outside income from the family.
Fig 16 - The farming system of small farmers who buy water
These two kinds of farming system represent an average of 33% of the farmers in the area. The outside income as agricultural workers and the low number of acres characterize this system. When this kind of farming system own less than one acre often in nanjai, it frequently use this acreage for casuarina. Indeed, I explained before that casuarina could adapt in clayey soil. In addition, it leases one other acre in nanjai to cultivate paddy. For instance, they have to give one-third of the harvest to the landowner. Moreover, they have to buy the water for casuarina during the dry season. They could have also some animals like cows for the daily milk and some goats for the meat. (To see all the details of the calculation go to the annex). Therefore, it is needful for this system to work as agricultural labors to have a “correct” income. However, the agricultural income per workforce is very low because of the lease land for paddy and the purchase of water. Other thing we have to emphasize is that this kind of people does not have access to take paddy loan in the cooperative society. This is because of the number of own acreage. Thus, they borrow the money for the paddy expenses from moneylender. But it is more expensive to reimburse this kind of loan than the paddy loan in the cooperative society.
Now we will explain the difference with the other farming system “Small farmers buy water, own land and outside income from the family”. The GVA/acre adds up to 5970 Rs and the agricultural income per workforce adds up to 8638 Rs. This kind of system owns one or two acres in nanjai in which they put paddy and it owns 1 acre or 2 acres in punjai in which they put casuarina. They have to buy water on dry season for casuarina. Otherwise, this is the same functioning.
Products : Paddy
Casuarina
Groundnut
Paddy
Casuarina/groundnut
Pondicherry sales comittee
Brokers
Inputs : fertilizers, chemicals, organic manure, WATER, lease land
0 acres <Ag Area< 2 acres
2 or 3 workforces
Labor daily
AYACUT OWN
AYACUT LEASETANK IRRIGATION
1 or 2 milking cows
Fodder, straw
OUTSIDE INCOME
TANK IRRIGATION
10 goats
percentage of the category of farmers in the total area
0-2 acres 2-5 acres
>5 acres landless
GVA/acre: 5167 Rs Agricultural Income per workforce: 5255 Rs
Socio-economy and water consumption in agriculture p 26/37
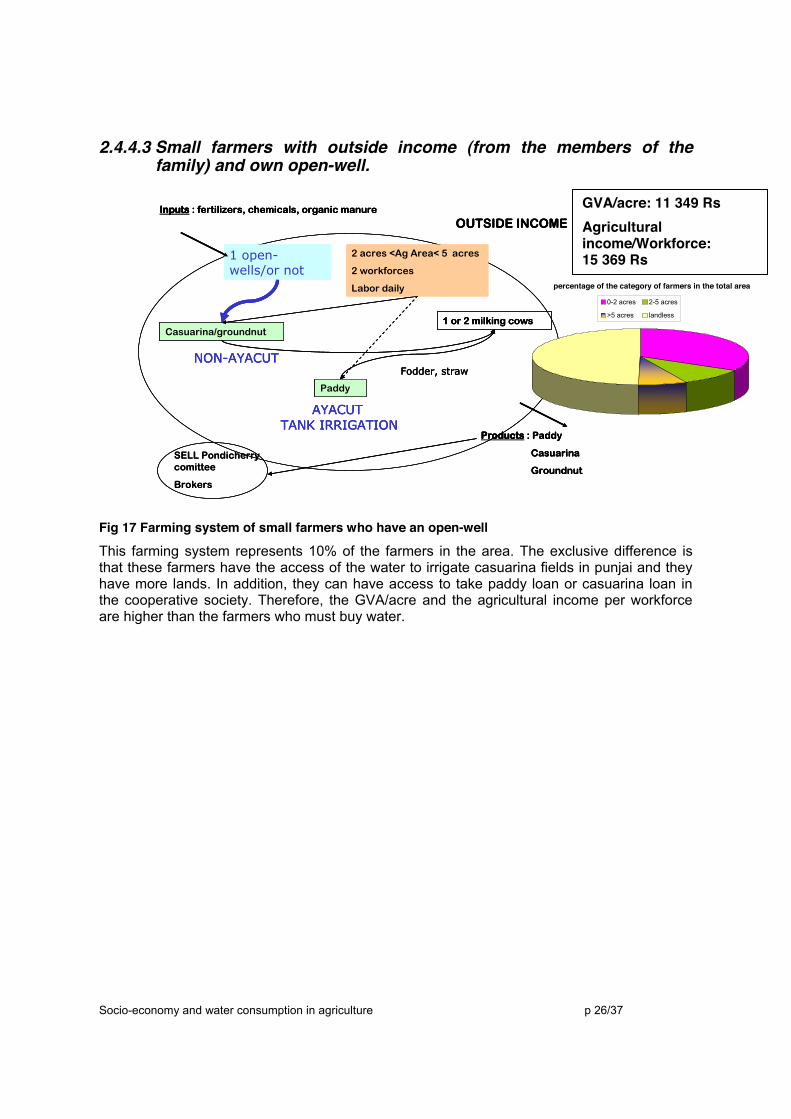
2.4.4.3 Small farmers with outside income (from the members of the family) and own open-well.
Fig 17 Farming system of small farmers who have an open-well
This farming system represents 10% of the farmers in the area. The exclusive difference is that these farmers have the access of the water to irrigate casuarina fields in punjai and they have more lands. In addition, they can have access to take paddy loan or casuarina loan in the cooperative society. Therefore, the GVA/acre and the agricultural income per workforce are higher than the farmers who must buy water.
SELL Pondicherrycomittee
Brokers
Products : Paddy
Casuarina
Groundnut
Paddy
Casuarina/groundnut
1 open-wells/or not
Inputs : fertilizers, chemicals, organic manure
2 acres <Ag Area< 5 acres
2 workforces
Labor daily
NON-AYACUT
AYACUTTANK IRRIGATION
1 or 2 milking cows
Fodder, straw
OUTSIDE INCOME
SELL Pondicherrycomittee
Brokers
Products : Paddy
Casuarina
Groundnut
Paddy
Casuarina/groundnut
1 open-wells/or not
Inputs : fertilizers, chemicals, organic manure
2 acres <Ag Area< 5 acres
2 workforces
Labor daily
NON-AYACUT
AYACUTTANK IRRIGATION
1 or 2 milking cows
Fodder, straw
OUTSIDE INCOME
Products : Paddy
Casuarina
Groundnut
Paddy
Casuarina/groundnut
1 open-wells/or not
Inputs : fertilizers, chemicals, organic manure
2 acres <Ag Area< 5 acres
2 workforces
Labor daily
NON-AYACUT
AYACUTTANK IRRIGATION
1 or 2 milking cows
Fodder, straw
OUTSIDE INCOME
percentage of the category of farmers in the total area
0-2 acres 2-5 acres
>5 acres landless
GVA/acre: 11 349 Rs Agricultural income/Workforce: 15 369 Rs

Socio-economy and water consumption in agriculture p 27/37
2.4.4.4 Medium head farmers and Big head farmers capitalist
Fig 18 Farming system of medium and big farmers who sell water
The both farming systems represent an average of 7% in the area but both of them take up most of the cultivated area. The functioning of these farming systems is not very different according the other. That is changing is the number of acres and the accessibility of water for irrigation in punjai. Thanks to this access, they can sell the water resource to two or three farmers. That is increased the agricultural income. The last system can have more agricultural equipment as tractor because of the both means of production the land and water resource. Therefore, it is easy to take loan for buying equipment.
Products : Paddy
Casuarina
Groundnut
Sesame
WATER
Paddy
Casuarina/groundnut
Casuarina/groundnut/sesame
1 bore-wells or 2
SELL Pondicherrycomittee
Brokers
Inputs : fertilizers, chemicals, organic manure
5 acres <Ag Area< 9 acres
2 workforces
Labor daily
Banana trees
Coconut trees
NON-AYACUT and AYACUT
AYACUTTANK IRRIGATION
1 or 2 milking cows
Fodder, straw
percentage of the category of farmers in the total area
0-2 acres 2-5 acres
>5 acres landless
Products : Paddy
Casuarina
Groundnut
Sesame
WATER
Family outside
Paddy
Casuarina/groundnut
Casuarina/groundnut/sesame
1 tractor
2 bore-wells or more
Pondicherry sales comittee
Brokers
Inputs : fertilizers, chemicals, organic manure
Ag Area : > 10 acres
1 or 2 workforces
Labor monthly
Banana trees
Coconut trees
NON-AYACUT and AYACUT
AYACUTTANK IRRIGATION
AUTOCONSUMPTION paddy, groudnut andsesame or blackgram
GVA/acre : 11 553 Rs Agricultural income./workforce : 21 513 Rs
GVA/acre : 8687 Rs Agricultural income./workforce : 41 902 Rs
Socio-economy and water consumption in agriculture p 28/37
2.4.5 Model building
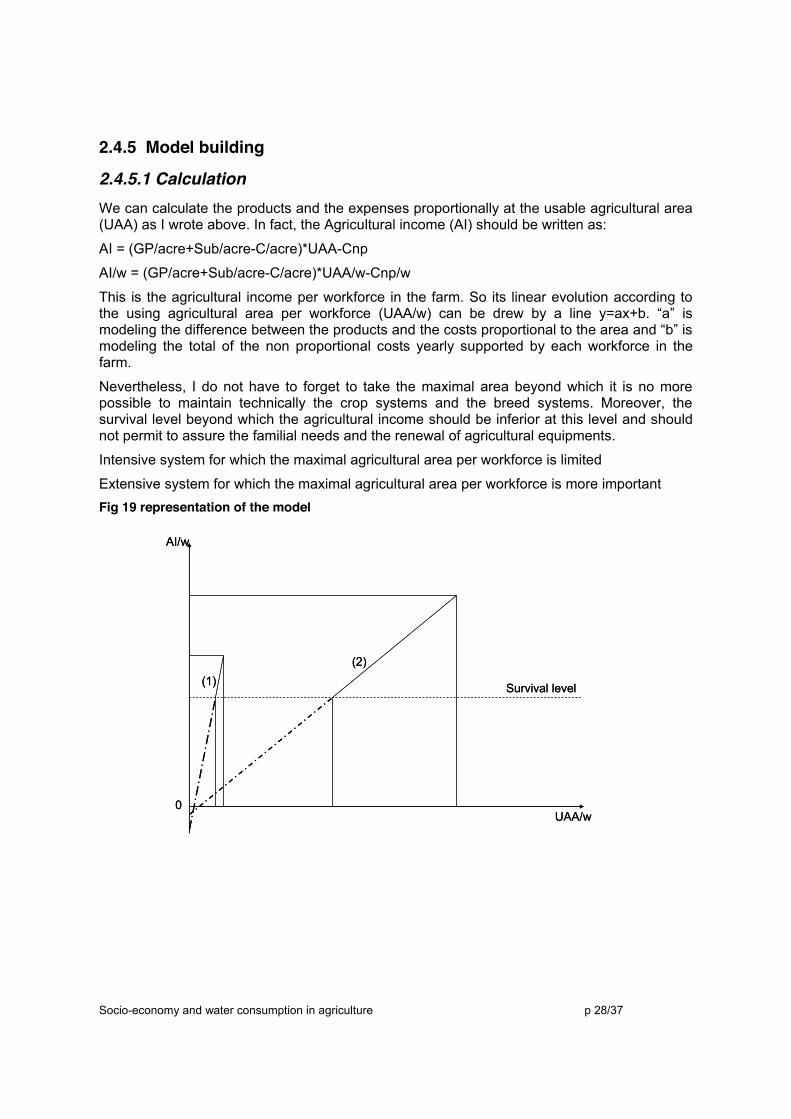
2.4.5.1 Calculation We can calculate the products and the expenses proportionally at the usable agricultural area (UAA) as I wrote above. In fact, the Agricultural income (AI) should be written as:
AI = (GP/acre+Sub/acre-C/acre)*UAA-Cnp
AI/w = (GP/acre+Sub/acre-C/acre)*UAA/w-Cnp/w
This is the agricultural income per workforce in the farm. So its linear evolution according to the using agricultural area per workforce (UAA/w) can be drew by a line y=ax+b. “a” is modeling the difference between the products and the costs proportional to the area and “b” is modeling the total of the non proportional costs yearly supported by each workforce in the farm.
Nevertheless, I do not have to forget to take the maximal area beyond which it is no more possible to maintain technically the crop systems and the breed systems. Moreover, the survival level beyond which the agricultural income should be inferior at this level and should not permit to assure the familial needs and the renewal of agricultural equipments.
Intensive system for which the maximal agricultural area per workforce is limited
Extensive system for which the maximal agricultural area per workforce is more important Fig 19 representation of the model
AI/w
UAA/w
Survival level
0
(2)(1)
AI/w
UAA/w
Survival level
0
(2)(1)
Socio-economy and water consumption in agriculture p 29/37
2.4.5.2 Results
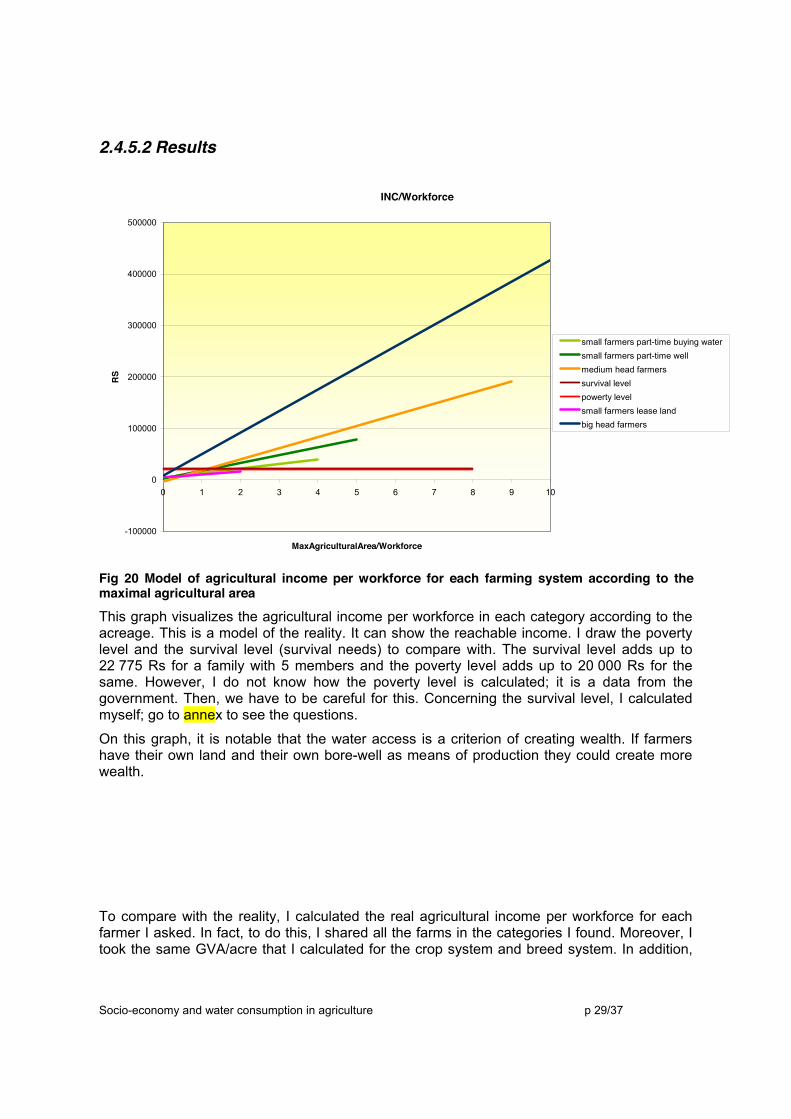
Fig 20 Model of agricultural income per workforce for each farming system according to the maximal agricultural area
This graph visualizes the agricultural income per workforce in each category according to the acreage. This is a model of the reality. It can show the reachable income. I draw the poverty level and the survival level (survival needs) to compare with. The survival level adds up to 22 775 Rs for a family with 5 members and the poverty level adds up to 20 000 Rs for the same. However, I do not know how the poverty level is calculated; it is a data from the government. Then, we have to be careful for this. Concerning the survival level, I calculated myself; go to annex to see the questions.
On this graph, it is notable that the water access is a criterion of creating wealth. If farmers have their own land and their own bore-well as means of production they could create more wealth.
To compare with the reality, I calculated the real agricultural income per workforce for each farmer I asked. In fact, to do this, I shared all the farms in the categories I found. Moreover, I took the same GVA/acre that I calculated for the crop system and breed system. In addition,
INC/Workforce
-100000
0
100000
200000
300000
400000
500000
0 1 2 3 4 5 6 7 8 9 10
MaxAgriculturalArea/Workforce
RS
small farmers part-time buying watersmall farmers part-time wellmedium head farmers survival levelpowerty levelsmall farmers lease landbig head farmers
Socio-economy and water consumption in agriculture p 30/37
after, I adapted with the number of acres and animals and with the agricultural equipment, etc to reach the agricultural income. (go to annex )
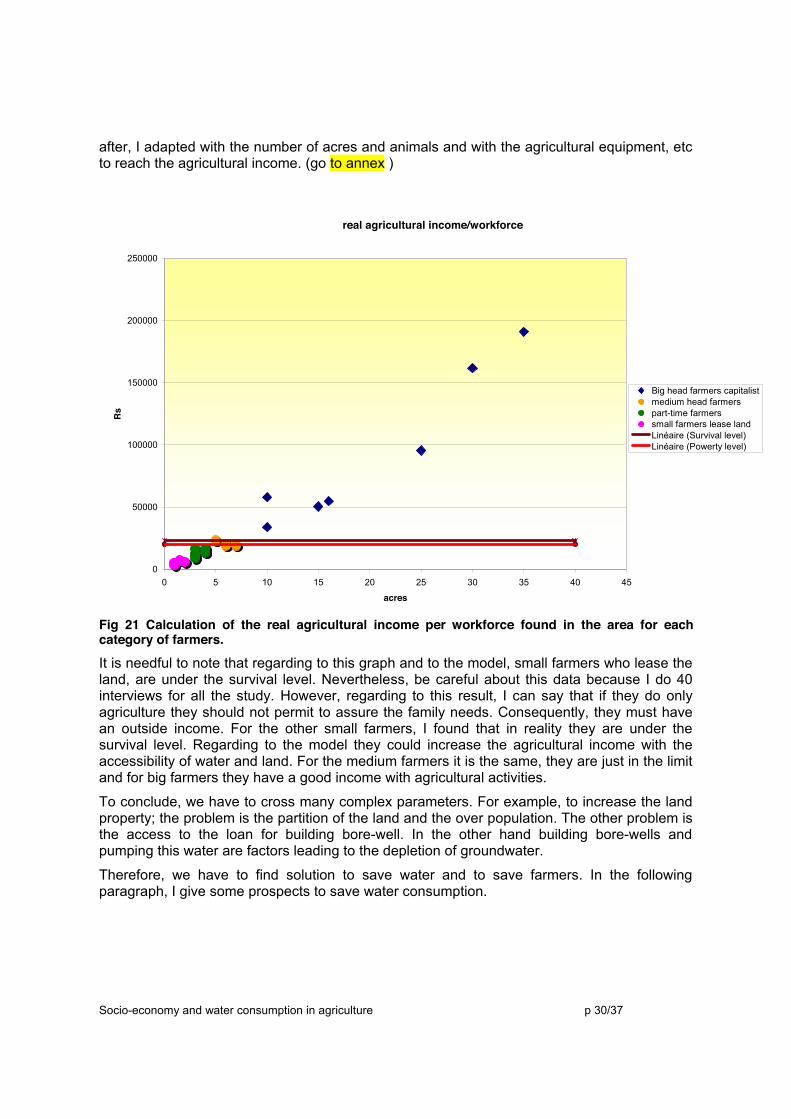
Fig 21 Calculation of the real agricultural income per workforce found in the area for each category of farmers.
It is needful to note that regarding to this graph and to the model, small farmers who lease the land, are under the survival level. Nevertheless, be careful about this data because I do 40 interviews for all the study. However, regarding to this result, I can say that if they do only agriculture they should not permit to assure the family needs. Consequently, they must have an outside income. For the other small farmers, I found that in reality they are under the survival level. Regarding to the model they could increase the agricultural income with the accessibility of water and land. For the medium farmers it is the same, they are just in the limit and for big farmers they have a good income with agricultural activities.
To conclude, we have to cross many complex parameters. For example, to increase the land property; the problem is the partition of the land and the over population. The other problem is the access to the loan for building bore-well. In the other hand building bore-wells and pumping this water are factors leading to the depletion of groundwater.
Therefore, we have to find solution to save water and to save farmers. In the following paragraph, I give some prospects to save water consumption.
real agricultural income/workforce
0
50000
100000
150000
200000
250000
0 5 10 15 20 25 30 35 40 45
acres
Rs
Big head farmers capitalistmedium head farmerspart-time farmerssmall farmers lease landLinéaire (Survival level)Linéaire (Powerty level)
Socio-economy and water consumption in agriculture p 31/37
3 CONCLUSION : SOME PROSPECTS
3.1 DO WE OPTIMIZE WATER CONSUMPTION IN NANJAI LAND? As we see before, rainfall and tank irrigate nanjai land. Moreover, farmers cultivate mostly paddy in this place, because of all the reasons I explained. Nevertheless, paddy is a high water consumer crop.
That we can purpose, is to level out the land to regulate the infiltration of water and avoid the waste. Maybe it would be possible to do an experiment in witness field. The purpose is to divide the field in order to have a homogeneous type of soil and following a homogeneous speed of infiltration. The drawback of this system is the increase of work because of many small parts of fields to cultivate.
3.2 THE EFFICIENCY OF IRRIGATION IN PUNJAI LAND In the study, I calculated only the time of irrigation for each crop system. I think we have to be more precise to optimize the water consumption. The irrigation efficiency is the link between the volume of water pumped and the volume of water effectively used by the crop. Plus the need for maintaining water in the field in the case of paddy. The purpose is to calculate the water needs of the crop for each time of growth. However, it is difficult to have this data, because it is very difficult to measure directly. The evaporation and swept of the crop must be calculated. Generally, it is measured by balance sheet but we can have only the sum of both. But, this measure depends on many factors (water availability in soils, fertility of soils, species, cultivar and crop operation). Besides, we have to calculate the rate of flow consumed by the bore-well.
3.3 THE EFFICIENCY OF APPLICATION IN PUNJAI LAND Two main factors build this:
Appropriate frequency and share of irrigation in regard to the crop needs
And regularity of application
It is better to do frequently irrigation with inferior quantity of water (than to irrigate one time per month during many hours. It is needful to take the capacity of the retention of the soil into account. This easy used reserve varies from 4% to 8% of the soil volume explored by the roots.

Socio-economy and water consumption in agriculture p 32/37
4 BIBLIOGRAPHY BENKAHLA A., FERRATON N., BAINVILLE S., 2003. Initiation à une démarche de dialogue, Etude de l’agriculture dans le village de Fégoun au nord de Bamako au mali. Coll. Agridoc : observer et comprendre un système agraire. Les Editions du GRET. 125 p.
BENTZ B, 2001. Histoire social – Histoire technique : Les tanks du basin versant de l’étang de Kaluvelli. Thèse de master of science.
CAPILLON A., CANEILL J., 1987. Du champ cultivé aux unités de production : un itinéraire obligé pour l’agronome. Cah. Sci. Hum. 23 (3-4) pp. 409-420.
CIRAD-GRET, 2002. Memento de l’agronome, la gestion de l’eau. Ed CIRAD-GRET Ministères des affaires étrangères, p1691.
DE BONNEVAL L. Systèmes agraires Système de production Vocabulaire français-anglais avec index anglais. INRA.
DE SARDAN JPO., 1995. La politique du terrain, Sur la production des données en anthropologie. Enquête n°1. Ed Les Parenthèses, Paris. pp. 71-109.
DORIN B., LANDY F., 2002. Agriculture et alimentation de l’Inde – Les vertes années (1947-2001). Ed INRA, p 248.
DRUESNE N., 1999. Révolution doublement verte Les biovillages à Pondichéry (DEA). Programme Economie, Politiques et Marchés. Documents de travail n°29.
DUFUMIER M., 1996. Les projets de développement agricoles. Manuel d’expertise. Ed CTA-karthala, p 354.
JANAKARAJAN, S., 1993. In search of tanks : some hidden facts. Economic and political weekly. Economical and political weekly.
JOUVE P., 1986. Principe de construction de typologie d’exploitations agricoles suivant différentes situations agraires. Les Cahiers de la Recherche Développement, n°11 août 1986, p 48-56.
LANDY F., 1994. Paysans de l’Inde du Sud. Le choix et la contrainte. Ed Karthala-Institut français de Pondichéry, p 491.
LARTIGUES S, SANIAL ME, 1998. Conversion des terres agricoles vers la culture de casuarina en Inde du Sud. Mémoire de fin d’études.
MARIUS-GNANOU K., 1991. L’irrigation et les mutations socio-économiques récentes dans la région de Pondichéry (Inde). Espaces tropicaux, n°3, talence, CEGET-CNRS, pp 133-160.
MAZOYER, ROUDART, 1997. Pourquoi une théorie des systèmes agraires ? In Cahiers Agricultures 1997 ; 6 : 591-5.
RACINE J. et JL., 1995. Une vie paria, le rire des asservis, pays tamoul, Inde du Sud. Ed terre humaine / poche, p613.

Socio-economy and water consumption in agriculture p 33/37
ANNEX 1. ANNEX 1 Interview’s framework for agrarian history
Green revolution When did the Green Revolution come in Kodur? How does it come? Story of cultivated land
3. What kind of crops: before the Green Revolution (food crop and cash crop) After the Green Revolution (food crop and cash crop) (Varieties,
time during a year how many crops? Why?), (Decrease, increase), yield, fertility, intercrop. Market of products. 4. Inputs: when did they start to put lot of inputs to the field? Before, how was it?
Where do they buy it, now? Before? Prices evolution 5. Big farmer practicing 6. Small farmer practicing 7. Marginal farmer practicing
Story of irrigation 8. Before the Green Revolution (tank management…) 9. During the Green Revolution 10. After the Green Revolution (bore-well owner) 11. When did the water market begin?
Land property evolution 12. Was there big land owner, little land owner and coolies before the Green Revolution? 13. Is there an evolution of landowners? 14. Big farmer-whether his status is continuing? If his status is got decline, why? Whether
unable to do agriculture? If it is, why? 15. From the ancient time, landowners wealthy, now what’s the economic status? How many acres have they stored? If not, what is the reason?
Migration 16. Was there seasonal or every time migration before the Green revolution? 17. Did the Green Revolution have an impact on migration (displacement and seasonal
migration)? Social
18. Situation about landless people: from the total population, how many of them in each caste?
19. Does the cost of coolies increase or decrease? For what type of work? 20. Is the population decreasing? If yes, why? Whether the landless people get to
migration? 21. Whether they are still doing their traditional caste oriented work? If not, why? 22. Was there labor organization before now? Was there producers’ organization before
now? Other activities
23. What kind of activities, when? Where? Before green revolution and after?
Socio-economy and water consumption in agriculture p 34/37
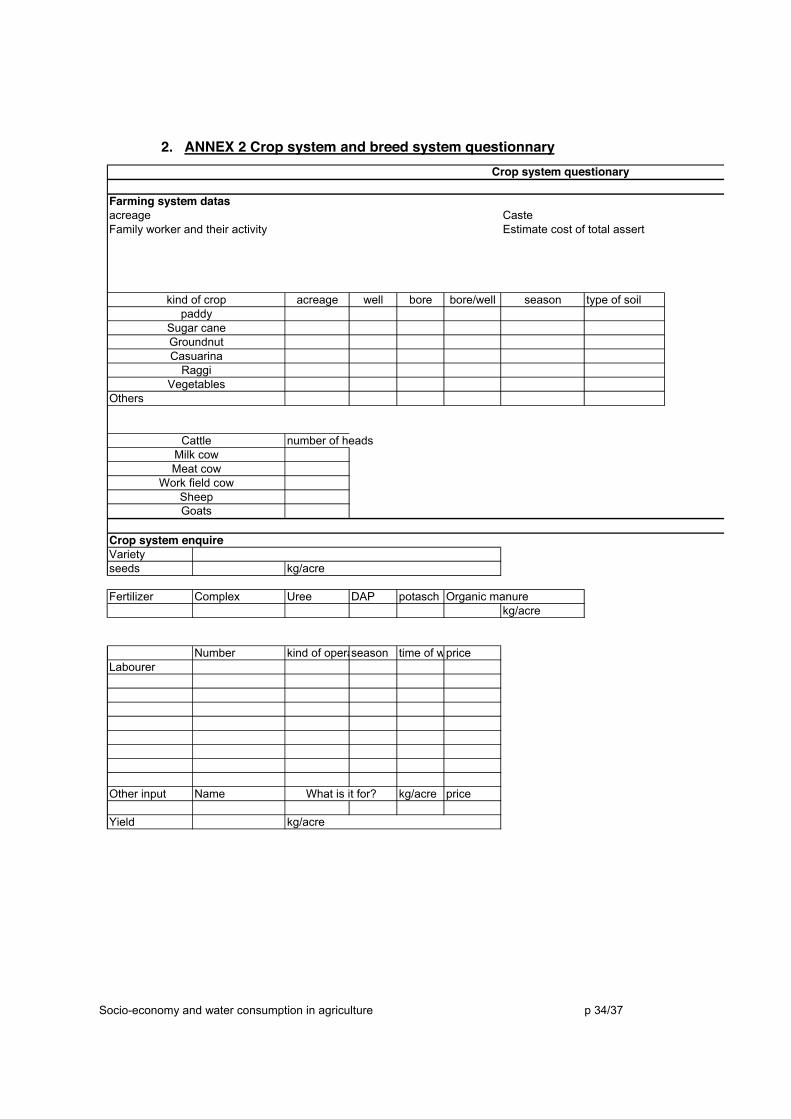
2. ANNEX 2 Crop system and breed system questionnary
CasteFamily worker and their activity Estimate cost of total assert
acreage well bore bore/well season type of soil
number of heads
Varietyseeds
Fertilizer Complex Uree DAP potasch Organic manurekg/acre
Number kind of operaseason time of wpriceLabourer
Other input Name kg/acre price
Yield kg/acre
Farming system datas
Crop system enquire
SheepGoats
acreage
kind of crop
GroundnutCasuarina
kg/acre
What is it for?
Crop system questionary
paddySugar cane
Work field cow
RaggiVegetables
Others
Milk cowMeat cow
Cattle

Socio-economy and water consumption in agriculture p 35/37
Economics data
price kg/acre TotalPlace where it is buy
how is to finance
When do they pay
seedsFertilizer Complex
UreeDAP
potaschOrganic manure
LabourerMachinaryWaterOthers
products price/kgyield (kg/acre)
Who buy the harvest?
Is there a part of the harvest for the family? How many bags?
SubsidiesWho give the subsidie What for
Which are the cirteres to touch the subsidy
What kind of information do they have
work planning
Crop operation
C itt ira i V a ig a is i A a n i A a d i A a v a n i P u ra tta s i A ip p a s i P a n g u n iM a s iT h a iM a rg a L iK a a r tt ik a i
M a y J u n e J u ly A u g u s t S e p t F e bJ a nD e cN o vO c t M a rc h A p r ilA p r il

Socio-economy and water consumption in agriculture p 36/37
3. ANNEX 3 Socio-economic survey
Household Name age, children, how many people live in the house Association, SHG How many people do the work on the field in totality? Crop Agricultural area - description, kind of crops, property of the land Trees Breed Agricultural equipment Bore-well/tractor/carriage… maintenance Age, price, inheritance Outside income other jobs? Loan, interest - time, crop credit, tax house, tax land, insurance

Socio-economy and water consumption in agriculture p 37/37
4. ANNEX 4 Survival survey
How many people in the family FOOD For one year how many kg per day, how much? Rice and vegetables SOAP/TALC How much/month FOR CLOTHES AND CHAPPALS FOR SCHOOL FOR HEALTH FESTIVAL AND MARRIAGE-BURIAL