
A SOCIO-ECONOMIC IMPACT STUDY OF - Home : … · A SOCIO-ECONOMIC IMPACT STUDY OF ... other...
56
A SOCIO-ECONOMIC IMPACT STUDY OF DEFENCE FORCE ACTIVITY IN CENTRAL QUEENSLAND AUSTRALIA REPORT PREPARED FOR THE COMMONWEALTH DEPARTMENT OF DEFENCE by PROFESSOR DANIELA STEHLIK CURTIN UNIVERSITY OF TECHNOLOGY ASSOCIATE PROFESSOR GAYLE JENNINGS CENTRAL QUEENSLAND UNIVERSITY PROFESSOR LARRY DWYER UNIVERSITY OF NEW SOUTH WALES August 2004 PROJECT MANAGED THROUGH THE CENTRE FOR SOCIAL SCIENCE RESEARCH CENTRAL QUEENSLAND UNIVERSITY ROCKHAMPTON, AUSTRALIA
-
Upload
nguyenkhuong -
Category
Documents
-
view
215 -
download
0
Transcript of A SOCIO-ECONOMIC IMPACT STUDY OF - Home : … · A SOCIO-ECONOMIC IMPACT STUDY OF ... other...

A SOCIO-ECONOMIC IMPACT STUDY OF DEFENCE FORCE ACTIVITY IN CENTRAL
QUEENSLAND AUSTRALIA
REPORT PREPARED FOR THE COMMONWEALTH DEPARTMENT OF DEFENCE
by
PROFESSOR DANIELA STEHLIK CURTIN UNIVERSITY OF TECHNOLOGY
ASSOCIATE PROFESSOR GAYLE JENNINGS
CENTRAL QUEENSLAND UNIVERSITY
PROFESSOR LARRY DWYER UNIVERSITY OF NEW SOUTH WALES
August 2004
PROJECT MANAGED THROUGH THE CENTRE FOR SOCIAL SCIENCE RESEARCH
CENTRAL QUEENSLAND UNIVERSITY ROCKHAMPTON, AUSTRALIA
Socio-Economic Impact Study of Defence Force Activity in CQ.
i
Executive Summary
This study of the socio-economic impacts of Defence activities in Central Queensland (CQ) was commissioned by the Commonwealth Department of Defence in order to determine the following research aims:
1. What is the economic impact of the Defence Force presence in the CQ region? Can an economic model be established which enables on-going analysis of this impact?
2. What is the social impact of the Defence Force presence in the CQ Region? What are the social issues which emerge from such a presence? How can the Department of Defence incorporate such issues in any future planning?
3. What are the community attitudes and perceptions to the Defence Force presence in CQ? To what extent do such attitudes and perceptions impact on the socio-economic fabric of the region?
4. To what extent do the CQ facilities (business, tourism, social, transport, accommodation etc) meet the needs of the Defence Force personnel? What gaps can be identified? What can be undertaken within the community to fill such gaps?
The project was conducted through the Centre for Social Science Research at Central Queensland University, Rockhampton. The Principal Investigators were: Professor Daniela Stehlik (Curtin University of Technology, CUT); Associate Professor Gayle Jennings (Central Queensland University, CQU) and Professor Larry Dwyer (The University of New South Wales, UNSW). The scope and complexity of this project demanded the involvement of a team of people at various stages of the study.
The study involved the conduct of:
a visiting Defence personnel expenditure questionnaire resident Defence personnel household expenditure questionnaire contractor survey an investigation of relevant Defence data sets stakeholder focus groups community focus groups resident telephone study.
The study commenced in July 2002 and concluded in May 2004.
Socio-Economic Impact Study of Defence Force Activity in CQ.
ii
Economic impact
The study found that the impact on value-added in Central Queensland is $42.24m. The direct valued added is $31.68m. with flow-on effects of $10.56m. The estimates for Singapore, the USA and Australia are derived by multiplying the estimated numbers of visitors (see Table 2.1) by average expenditure per visitor in Central Queensland and all Queensland for each origin.
Over the six year period (2003-2008) the average injection per year from visiting Defence Force personnel expenditure is:
Central Queensland: $24,789 m. per annum Queensland: $29,730 m. per annum
The study found that visiting Defence personnel expenditure total expenditure by Singapore Defence Force personnel is $3,025,975. Of the $3,025,975 total spending of Singapore Defence Personnel respondents:
$2,781,775 (92 per cent) was spent in Queensland $2,537,050 (84 per cent) was spent in Central Queensland. $244,200 (8 per cent) was spent outside Queensland.
Average spending per Singapore visitor was $1,871.
Total expenditure by USA Defence Force personnel is $7,951,425. Of the $7,951,425 total spending:
$6,990,050 (88 per cent) was spent in Queensland $5,808,600 (73 per cent) was spent in Central Queensland. $961,375 (12 per cent) was spent outside Queensland.
The sub region in which the greatest proportion is spent is Rockhampton which receives $2.59 million (32.6 per cent) of the total. The rest of Queensland is the second largest recipient (14.9 per cent of expenditure) followed by the rest of Australia. The CQ region which received the most expenditure after Rockhampton was Gladstone ($800,625 or 10.1 per cent).
Average spending per USA visitor was $3,355.
The estimated Average Annual Total Expenditure on Administration and Exercises is $27 million.
The resident Defence survey indicated that gross household income totalled $3,692,340. Average household weekly income is $1578. Average annual gross household income is $82,052.
Socio-Economic Impact Study of Defence Force Activity in CQ.
iii
Community attitudes and social impacts
Stakeholder focus groups mentioned the need for better preparedness of businesses to respond and service Defence activities, the importance of briefing sessions conducted by Defence for local businesses as well as the need for community to be better informed of expenditure patterns by Defence groups in Central Queensland. Stakeholder focus groups also noted the positive benefit of social interaction with other cultures and the extended cultural opportunities that occur during stand down time as well as scheduled community works. These groups also commented on the fact that Defence activity in the Shoalwater Bay area assisted in protecting that marine environment. Some negative commentary was made in regard to traffic congestion and airport noise when exercises were being conducted in the airport vicinity.
Community focus groups perceived that there were positive impacts in regard to Defence activities which included the potential for interaction with people from other cultures, completion of community projects, environmental protection of Shoalwater Bay Training Area (SBTA) and Australia as a result of training exercises. Negative activities focused on noise around the airport when night exercises are conducted, some traffic congestion, restriction from use of fishing areas.
Attitudes of Central Queensland residents towards the presence of military personnel in the region were characterised by beliefs about the positive economic and cultural contributions of such visits. However, some fears were also expressed about the potential for negative consequences. On the whole, attitudes tended to be somewhat positive. It may be possible in the future, to enhance community perceptions by improving common knowledge about the exercises.
People know that Defence undertakes activities in the region, however not everyone is aware of which countries are participating and when activities occur.
Defence activities in the region are seen as major economic boosters of both diversity and capacity for jobs. Defence activity is seen as a supporter of local businesses as well as a catalyst for improved infrastructure spending. Attitudes towards Defence activities on individuals identified a range of views regarding the benefits for individuals and the capacity to increase income for some. Majority of people rejected the suggestion that cost of living rises occurred because of Defence activities or that these made excessive demands on public services and facilities.
People understand where activities are conducted and that such activities are assisting in the conservation of the natural environment and the majority agreed that traffic and noise pollution were not an issue. There was a strong (85 per cent) rejection of the suggestion that further activities would disadvantage the community and they should be discouraged.
On balance, most people felt that the visits impacted neutrally or positively on their quality of life. They enjoyed the pride of showing off their region to the visitors, and felt that the exchange of cultures was a positive aspect. However, while many people appeared keen to meet or see such visitors, they then appeared reluctant to increase their families’ potential contact with the visitors.
Residents were slightly positive about the economic benefits from the exercises and were somewhat more enthusiastic about the potential for contact with other cultures.

Socio-Economic Impact Study of Defence Force Activity in CQ.
iv
While fears were expressed by some, on average fears were not particularly strong. However there can be seen a relationship between such fears, and a lack of knowledge about the exercises.
CQ facilities
Visiting Defence personnel during their shortest time off will usually stay on base and recreate in the company of military friends in groups ranging from 2-10. Rest and relaxation is a key leisure activity during stand down time. Those Defence personnel who do go off base will engage in shopping and visiting night clubs. The longest stand down time draws Defence personnel to the surrounding communities and the beach areas particularly. However, the majority of stand down time is focussed on Rockhampton. The chief leisure time activities are shopping, rest and relaxation and visiting night clubs. For all Defence personnel, stand down time is generally spent in the company of military friends in groups ranging from 2-10 people.
Currently, the majority of visiting Defence personnel is satisfied with the leisure and recreation opportunities/experiences available in the CQ region. Singaporean Defence personnel are more interested in shopping and rest and relaxation than in sporting and nightlife entertainment. This group prefers to recreate with military personnel friends. Some Singaporean personnel have experienced discriminatory acts, such as, being abused and called four letter words by passengers in passing cars, ignored when asked a local for directions, the local turned away and ignored the request. The majority of Singaporean Defence personnel would consider returning to and recommending CQ as a tourist destination. Singaporean, US and Australian Defence personnel reported experiencing racial discrimination acts
Comparison with Toowoomba By way of direct comparison, the Toowoomba study estimates that Defence Force presence injected $44.456 m. into the local economy in 1996-97, while the CQ study estimates that, excluding visitor expenditure, Defence Force Presence injects just under $30 m. on average per annum into the economy of Central Queensland.
Socio-Economic Impact Study of Defence Force Activity in CQ.
v
Recommendations
The following recommendations are presented for consideration by Commonwealth Department of Defence (Defence) in regard to any future studies into the socio-economic impact of Defence activities.
Recommendation 1.0
Defence data needs to be maintained and updated on a regular basis and also stored as aggregated and cross linked data sets for ease of examination.
Recommendation 2.0 In order to maintain the current level of economic
contribution to the CQ economy all stakeholders need to continue to be entrepreneurial and sell their
goods and services to Defence Force Personnel and maximise this activity to the extent possible by
sourcing such products locally
Recommendation 3.0
In communicating the nature of each activity Defence could identify the participating countries clearly.
Recommendation 3.1
In communicating with the local community, Defence need to consider TV and newspaper as the major sources of local knowledge.
Recommendation 3.2 More publicity regarding the community work undertaken by the visitors while in the region should be considered.
Recommendation 4.0
Businesses should consider different hours of operation during Defence force visitation in order to increase the opportunity of visiting personnel to spend within the region.
Recommendation 4.1
Promotional and development organisations might consider ways to harness return visitation from visiting Defence personnel in tourist roles.
Recommendation 4.2
Community awareness of the contributions visiting Defence personnel make should be enhanced; along with social education strategies for a more welcoming and tolerant community profile.
Socio-Economic Impact Study of Defence Force Activity in CQ.
vi
Acknowledgments
The Principal Investigators wish to thank Mr Ian Cox and Mr Cameron Hurtz from Corporate Services and Infrastructure, Rockhampton, Australian Defence Force for their continued support and encouragement throughout the life of the project. Mr Hurtz in particular provided invaluable assistance with the dissemination of questionnaires and the gathering of other data. We also acknowledge the wholehearted support of the Rockhampton and Capricorn Coast community and all the stakeholders who were involved in the giving of their time to the success of the project.
At Central Queensland University, our grateful thanks are also given to Associate Professor Robert Ho for his statistical input and commentary provided in the first half of the project; Professor Kerry Mummery and Dr Matthew Rockloff from the Population Research Laboratory in the Centre for Social Science Research who assisted with the telephone survey. Thanks to Lindsay Greer and Jo Dickson for initial assistance with the preparation of the visiting Defence personnel questionnaire and answer sheets. Thank you also to Sheree Tait and Yvonne Holbeck for their administrative management of the study within the Centre for Social Science Research.
To all our research assistants on this major analysis – we say a heartfelt ‘thank you’ to Lee-Anne Maher for her significant contributions and involvement in numerous stages and ways within the overall study. Lee-Anne coordinated various aspects of the study as well as worked as a research assistant. Thanks also to Prahba Prayaga and Farooq Haq for assistance with SPSS merges and output preparation. Special thanks to Cheryl Ryan, Nell Salem, Kerry Francis, Kaylene Douglas, Chureerat Haq and Susan Rockloff for their help and tireless labour in entering, collating and building our databases.

Socio-Economic Impact Study of Defence Force Activity in CQ.
vii
Principal Investigators
Professor Daniela Stehlik is foundation Chair in Stronger Communities and Director, Alcoa Research Centre for Stronger Communities in the Division of Humanities at Curtin University of Technology, Perth. Daniela took up this post in December 2003 and was previously at Central Queensland University.
Associate Professor Gayle Jennings is a member of the School of Marketing and Tourism at Central Queensland University, Rockhampton. She is a Board Member of the International Society for Travel and Tourism Educators.
Professor Larry Dwyer is Qantas Professor of Travel and Tourism Economics in the School of Economics at the University of New South Wales, Sydney. He is also Head, Sustainable Destinations Research Program in the Sustainable Tourism Co-operative Research Centre.

Socio-Economic Impact Study of Defence Force Activity in CQ.
viii
Table of Contents
Executive Summary i-iv
Recommendations v
Acknowledgments vi
Principle Investigators vii
Figures & Tables xi
Chapter One
Introduction & Overview
1.0 Background 1
1.1 Research context 2
1.2 Research Aims & Questions 3
1.3 Methods 3
1.4 Instruments for data collection 6
1.5 Brief comparison ‘Toowoomba’ and Central Queensland 8
Chapter Two
Economic Contribution of Defence Force Presence in CQ
2.0 Summary of Economic Contribution 9
2.1 Introduction 12
2.2 Total Expenditure of Visiting Defence Force Personnel 14
2.2.1 Estimated Numbers of Visiting Defence Force Personnel 14
2.2.2 Expenditure by Sub-region 14
2.2.3 Patterns of Expenditure 17
2.2.4 Pattern of Expenditure by Sub region 18

Socio-Economic Impact Study of Defence Force Activity in CQ.
ix
2.2.5 Expenditure by Type of Force 20
2.2.6 Expenditure by Gender 21
2.2.7 Estimating Total Visitor Expenditure 22
2.3. Defence Force Expenditure 23
2.3.1 Expenditure by CSI-RTON and 42QR 24
2.3.2 Exercise Related Expenditure 24
2.4. Expenditure by Resident Defence Force Personnel 25
2.5. Total Annual Expenditure Injection Associated with Defence Force Presence 27
2.6. Economic Impact 27
2.6.1 Enhancing the Economic Impacts 30
Chapter Three
Community Attitudes and Social Impacts
3.0 Overview 31
3.1 Demographic snapshot 31
3.2 Knowledge of Department of Defence activities 31
3.3 Attitudes towards economic benefits 32
3.4 Attitudes towards environmental impacts 33
3.5 Attitudes towards Quality of Life 34
3.6 Conclusion on social impacts 35
Socio-Economic Impact Study of Defence Force Activity in CQ.
x
Chapter Four
Leisure, Recreational Opportunities/Experiences and CQ Facilities
4.0 Background 36
4.1 Military perspective regarding CQ facilities 36
4.2 Overall experience in CQ 38
4.3 Resident perspective on leisure opportunities 39
4.4 Conclusion 39
Chapter Five
The Final Summary 41
References 43
Glossary 44
Attachments:
1. Timeline
2. Visiting Defence Personnel Questionnaire Materials
3. Resident Defence Personnel Economic Expenditure Study
4. Contractors’ Study
5. Stakeholder Focus Groups
6. Community Focus Groups
7. Resident Community Telephone Survey
Socio-Economic Impact Study of Defence Force Activity in CQ.
xi
LIST OF FIGURES & TABLES
Figures
1. Map of Central Queensland Region 2 2. Economic Multiplier Model 28
Tables 2.1 Estimated Numbers of Visiting Defence Personnel, Singapore, USA, Australia (2003-2008) 9 2.2 Expenditure by Region and Type of Purchases: Singapore 15 2.3 Expenditure by Region and Type of Purchases: USA 15 2.4 Expenditure by Region and Type of Purchases: Australia 16 2.5 Average Expenditure per Item by Visitor Origin 18 2.6 Expenditure Patterns by Force: Singapore 20 2.7 Expenditure Patterns by Force: USA 20 2.8 Expenditure Patterns by Force: Australia 21 2.9 Expenditure Patterns by Gender: Singapore 21 2.10 Expenditure Patterns by Gender: USA 22 2.11 Expenditure Patterns by Gender: Australia 22 2.12 Projected Injection of Visiting Defence Force Expenditure into Central
Queensland and Queensland (2003-2008) 23 2.13 Defence Force Expenditure on Administration and Exercises (2003) 25 2.14 Defence Household Expenditure (2003) 26 2.15 Total Annual Expenditure Injection (2003) 27 4.1 Overall Time Off-Duty by US Personnel (2003) 36 4.2 Overall Time Off-Duty by Australian Personnel (2003) 37

Socio-Economic Impact Study of Defence Force Activity in CQ.
1
Chapter 1.
Introduction & Overview
1.0 Background
In June 1998, the Department of Defence commissioned an Economic Impact of the Defence Force Organisation on Toowoomba and the Local Community. This project focussed on the nearly 8,000 Defence Force personnel in the Darling Downs area, and the economic impact on local business, community organisations and local government. This project utilised ABS data, as well a small scale household survey of Defence Force personnel. It then developed an economic model of impact. This Report was well received by the Department of Defence, and has formed the basis of ongoing analysis in that region.
No project of this kind has ever been undertaken in the Central Queensland Region. However, there has been, over the years, much anecdotal speculation about the economic impact of the high level of activity in Central Queensland, focussed around the Shoalwater Bay Training Area (SBTA). Such speculation tends to rise when there is overt activity with overseas partners. However, there was no science underpinning such speculation, and the Department of Defence sought to replicate and extend the Toowoomba Study in Central Queensland (CQ).
Discussion between the Centre for Social Science Research and Mr (then Major) Ian Cox commenced in early 2000, following a successful project undertaken by the Centre on the extent of community attitudes to Unexploded Ordinances (UXOs) in the Rockhampton/Capricorn Coast area. In November 2000, a brief proposal was outlined to Major Cox, however this proposal lapsed following his relocation outside of the region.
In March 2002, Mr Cox returned to Rockhampton, to head up the Corporate Services and Infrastructure Office. Interest in a socio-economic impact study was still high within the Department, and it was agreed that a further, more detailed proposal would be prepared for consideration. This was presented in May 2002 and accepted with a commencement date of July 2002.
A full timeline for the project can be found at Attachment One.

Socio-Economic Impact Study of Defence Force Activity in CQ.
2
1.1 Research Context
The Defence Force impact on the CQ region, (taken to include Livingstone Shire, Mount Morgan Shire, Rockhampton Shire, Emerald Shire, Fitzroy Shire, Duaringa Shire, Gladstone and Calliope Shires) focussing on the Shoalwater Bay area, can be understood as follows:
1. The contract between the Australian Government and the Singapore Government. Singapore Defence Forces visit the CQ region annually between August and December. This contact, signed in 2000, is being renegotiated at the time of writing this report.
2. The bi-lateral Defence arrangements between the Australian Government and the United States Government. Commenced in 1997 with ‘Tandem Thrust’. Defence force activities occur every two years at present, with the event in 2003 Code named ‘Crocodile’. This is planned to be reorganised in subsequent years under code name: ‘Talisman Blade’.
3. The on-going use of Shoalwater Bay by the Australian Defence forces. This occurs on a regular basis throughout the year. In 1999, for example, 155 units used the facility.
4. The small contingent of Defence Force personnel and Volunteer Reserves located in CQ. The total amount is less than 100.
For the purposes of this study, the geographic parameters of the Central Queensland region as opposed to the government statistical divisions stated above are defined within the parameters of Map One below. The geographic area includes Mackay, Rockhampton, Yeppoon, Emerald, Gladstone, and Bundaberg. These parameters were used to assess the breadth of travel by Defence visitors to CQ.
Figure 1: Map of Central Queensland Region
Source: The State of Queensland (Department of Lands), 1996, QS097392
Socio-Economic Impact Study of Defence Force Activity in CQ.
3
1.2 Research Aims & Questions
These were agreed to as follows:
1. What is the economic impact of the Defence Force presence in the CQ region? Can an economic model be established which enables on-going analysis of this impact?
2. What is the social impact of the Defence Force presence in the CQ region? What are the social issues which emerge from such a presence? How can the Department of Defence incorporate such issues in any future planning?
3. What are the community attitudes and perceptions to the Defence Force presence in CQ? To what extent do such attitudes and perceptions impact on the socio-economic fabric of the region?
4. To what extent do the CQ facilities (business, tourism, social, transport, accommodation etc) meet the needs of the Defence Force personnel? What gaps can be identified? What can be undertaken within the community to fill such gaps?
These four aims determine the outline of this Report.
1.3 Methods
Different methods were used to gather information in regard to each of the aims. These methods are detailed below.
Aim One
What is the economic impact of the Defence Force presence in the CQ region? Can an economic model be established which enables on-going analysis of this impact?
Method for determination of the Economic Contribution of Defence Force
The economic contribution of Defence Force presence in Central Queensland depends upon:
Total Expenditure associated with visiting Defence Force Personnel Total Expenditure associated with permanent Defence Force personnel in
region. Total Expenditure associated with Department of Defence purchases
A survey instrument was developed to estimate the expenditure of visiting Defence Force personnel. The questionnaires were distributed to all visiting Defence Force personnel from Singapore in 2002 and 2003, and visiting Defence Force personnel from the USA in 2003 as well as Australian and New Zealand forces in 2003. Respondents were required to estimate their expenditure in the different sub-regions of Central Queensland, elsewhere in Queensland and elsewhere in Australia both in terms of aggregate expenditure and expenditure on different types of goods and services. The responses also enabled estimates of expenditure by type of Force and by gender.

Socio-Economic Impact Study of Defence Force Activity in CQ.
4
A survey instrument was also developed to estimate the total household expenditure of Defence Force personnel in the region. A list of the names of all Defence Force personnel based in CQ was provided to the consultants and a survey instrument was distributed to all households in the region containing a member of the Defence Force. The survey instrument comprised three groups of questions: Location and composition of the household, household expenditure on different goods and services, and household income. In respect of household expenditure items, respondents were also asked to estimate the proportion that was spent with firms and organisations based in the region as opposed to those based outside of the region.
Total expenditure associated with Department of Defence purchases, and expenditure by foreign governments to support their military personnel, also represents an injection of money into the CQ region. Expenditure estimates were provided by the Department of Defence. The estimates included expenditure by the governments of Singapore and the USA as well as Australia to support the activities of Defence Force personnel in the region.
Response rates
For the visiting Defence personnel questionnaire, in 2002, of the 3200 Singaporean Defence personnel who participated in training exercises, 1617 answer sheets were returned. This reflects a response rate of approximately 50per cent. In 2003, United States personnel numbered 4,500 from which 2370 surveys were returned, a response rate of approximately 45per cent. The Singaporean personnel numbered 3,600 in 2003 and 2,600 surveys were returned; a response rate of approximately 58per cent.
Surveys were distributed by Defence CSI-Rockhampton staff in 2002 and 2003.
The resident Defence personnel expenditure questionnaire achieved a response rate of approximately 53per cent (26 returns from a population of 45).
The contractor survey achieved a low response rate of 28.7per cent. In the end, Defence expenditure data sources were used to estimate overall Defence expenditure on Defence purchases.
Recommendation 1.0 Defence data needs to be maintained and updated on a regular basis and also stored as aggregated and cross linked data sets for ease of future examination

Socio-Economic Impact Study of Defence Force Activity in CQ.
5
Limitations:
For the Singaporean study in 2002, the early morning departures (2400h and 0600h) tended to generate negative attitudes towards participation in an exit survey (a survey completed on departure from a setting).
Aim Two
What is the social impact of the Defence Force presence in the CQ Region? What are the social issues which emerge from such a presence? How can the Department of Defence incorporate such issues in any future planning?
Methods for determining the social impact of Defence Force presence.
The information regarding this aim was achieved via a number of means:
Community focus groups Stakeholder focus groups Resident telephone survey.
Response rate or participation commentary
Community focus groups Two focus groups were held; one in Rockhampton and one in Yeppoon in 2003. Five residents participated in the Rockhampton focus group and six residents in the Yeppoon focus group. Whilst Defence personnel were in attendance at both focus groups, the focus groups were facilitated by one of the chief investigators. The information from these focus groups, whilst contributing to an understanding of general community attitudes; was also used to compliment existing literature in regard to the preparation of the resident telephone questionnaire.
Stakeholder focus groups These were held in 2002. Two stakeholder focus groups were held, participants were organised into two generic stakeholder groups: (1) local government stakeholders and (2) tourism and business development organisations. Each of the focus groups was of one hour twenty minutes and one hour five minutes, respectively in duration. Seven local government stakeholder representatives or their delegates were invited. On the day, two attended along with two representatives from CSI-Rockhampton. Six stakeholder representatives were invited from the tourism and business development organisations. Two representatives attended along with the two representatives from CSI-Rockhampton. The stakeholder focus groups were facilitated by one of the chief investigators. All invited participants were circulated the full notes form the focus groups. Those attendees unable to participate were circulated the summary notes only in order to preserve anonymity agreements.
Socio-Economic Impact Study of Defence Force Activity in CQ.
6
Resident telephone survey This was conducted in September/October 2003 during the USA/Australian exercises. The telephone survey focussed on Rockhampton and Yeppoon. The overall sample size (1274) was stratified between Rockhampton (66.6per cent) and Yeppoon (33.3per cent). Of the 1274 respondents, 845 were from Rockhampton and 428 from Yeppoon. Within each of the two strata, participants were sub-sampled by gender. The overall response rate was 46.9per cent. Telephone contacts involved 5 follow-up calls before the number was no longer called. The Population Research Laboratory at CQU uses a computer assisted telephone interviewing (CATI) system in which telephone numbers maintained in an updated database were randomly assigned for the survey by a computer program.
Aim Three
What are the community attitudes and perceptions to the Defence Force presence in CQ? To what extent do such attitudes and perceptions impact on the socio-economic fabric of the region?
Methods for determining community attitudes and perceptions
The information regarding this aim was connected to Aim Two, and was simultaneously achieved using the above mentioned methods, that is:
Community focus groups Stakeholder focus groups Resident telephone survey.
Aim Four
To what extent do the CQ facilities (business, tourism, social, transport, accommodation etc) meet the needs of the Defence Force personnel? What gaps can be identified? What can be undertaken within the community to fill such gaps?
Methods for determining the extent CQU facilities meet the needs of the Defence personnel.
Information regarding this aim was achieved through the visiting Defence personnel questionnaire as well as the community and stakeholder focus groups and resident telephone survey.
1.4 Instruments for data collection
1.4.1 Visiting Defence personnel questionnaire The Defence personnel questionnaire consisted of an information and question booklet along with an accompanying answer sheet (see Attachment Two).
The questionnaire consisted of four sections. The first section focussed on socio-demographic information, the second on expenditure, the third on leisure activities and the fourth overall comments on the visiting Defence personnel’s experience in CQ.
Socio-Economic Impact Study of Defence Force Activity in CQ.
7
The answer sheet was a two page back and front sheet which consisted primarily of pre-coded response that personnel were required to circle the correct response or insertion of short responses.
1.4.2 Resident Defence personnel economic expenditure study This questionnaire consisted of three sections. The first section focussed on resident location and composition of household, the second, the household’s expenditure and thirdly, the household’s income. This questionnaire defined adults as 16 years and over (see Attachment Three).
1.4 3 Contractors study The contractors study was developed when originally Defence database sets proved to be incomplete. The questionnaire was presented on one page using both sides of the page. This survey of contractors drew on data base information of contractors and suppliers for the population. The data set contained 857 contractor names. Forty seven (47) were returned to sender. As noted before, the response rate was low, only 233 returns; a response rate of 28.77per cent. Questionnaires were posted along with a reply paid envelope to all named contractors. The questionnaire requested background information on the business and the distribution of sourcing of products/services. The returned questionnaires were incomplete or incorrectly completed; subsequent statistical analysis would have been dubious in regard to decision-making (see Attachment Four).
1.4.4 Stakeholder focus groups The stakeholder focus groups involved three components: a background information sharing segment, a focussed discussion and a concluding summation of points discussed. The key elements identified by the participants were economic impacts; social impacts, environmental impacts, public impacts and future directions. Summary points were used to check the content that was discussed and follow-up electronic summary notes were disseminated to both participants and those who were unable to attend as per the earlier commentary (see Attachment Five).
1.4.5 Community focus groups The community focus groups were comprised of three segments. The two focus groups opened with an overview of the Defence study and the role of the community focus groups in relation to the overall study; specifically to determine community perceptions regarding the socio-economic impacts of Defence activities in CQ and to inform the questions used in the resident telephone survey. The majority of the focus group involved the participants in discussing what they perceived were the impacts. A summation was provided to ensure that all comments had been recorded (see Attachment Six). 1.4.6 Resident community telephone survey The resident community telephone survey was developed based on existing social and resident impact studies as well as quality of life studies. The community and stakeholder focus groups also served to inform the construction of the resident telephone survey instrument.
Socio-Economic Impact Study of Defence Force Activity in CQ.
8
The telephone interview was comprised of three sections: an introduction to the study, specific questions focussing on demographics, awareness of Defence activities, economic impact of Defence activities, environmental impacts, quality of life, social and cultural impacts of Defence personnel visits, public funding and future development, and concluding remarks (see Attachment Seven).
In total, the study utilised six tools to gather the required information to determine the socio-economic impact of Defence activities in the Central Queensland region.
1.5 Brief comparison ‘Toowoomba’ and Central Queensland
A study of the Economic Impact of the Defence Force Organisation on Toowoomba and the Local Community, prepared for the Department of Defence by the Southern Queensland Regional Studies Centre, June 1998, had different objectives to those of the present study. The Toowoomba study focused on the amounts expended by the Defence Force administration and also by resident Defence Force personnel. It did not specifically consider any expenditure injections from visiting Defence Force personnel. Estimated Aggregate Defence Expenditure was $44.456 m. in 1996-97, comprising $35.456 m. spent by resident personnel and 9.0 million spent by the Defence Force on non wage and salary items. This $44.456 m. expenditure was estimated to generate 1026 jobs directly and indirectly, but the economic impact on Gross Regional Product is never specified. This is curious since the study title and aims indicate that estimation of 'economic impact' was the overall objective of the exercise.
By way of direct comparison, the Toowoomba study estimates that Defence Force presence injected $44.456 m. into the local economy in 1996-97, while the CQ study estimates that, excluding visitor expenditure, Defence Force Presence injects just under $30 m. on average per annum into the economy of Central Queensland. This consists of expenditure on non wage and salary items and the expenditure of Defence Force resident households. Expenditure on non wage and salary items is $27 m. per annum on average. It should be noted that much of this expenditure is allocated to support visiting Defence Force exercises. Defence Force resident household expenditure, as revealed by the resident household expenditure survey is relatively low at $1.8 m. per annum. In aggregate, Defence Force presence in CQ, excluding visitor expenditure, is approximately $30 m. per annum.
When the expenditure of visitors ($24.8 m. per annum) is added, the total injected expenditure from Defence Force presence in CQ is estimated to be $52.8 million. Based on regional multiplier estimates from Queensland Treasury the impact on value-added in Central Queensland is $42.24m. The direct value added is $31.68 m., with flow on effects of $10.56 m. The impact on employment in Central Queensland is 728 fulltime equivalent jobs. 586 jobs are created directly, while 142 jobs are created indirectly due to flow on effects in the regional economy. The employment effects are less than for the Toowoomba study but this may reflect differences in industry structure in the two regions.
Socio-Economic Impact Study of Defence Force Activity in CQ.
9
Chapter 2.
The Economic Contribution of Defence Force Personnel in Central Queensland
2.0 Summary of Economic Contribution
The economic contribution of Defence Force personnel to Central Queensland depends upon the amount of expenditure injected into the region by resident personnel, visiting personnel, plus expenditure injected into the region by the Defence Force to support the presence of both residents and visitors.
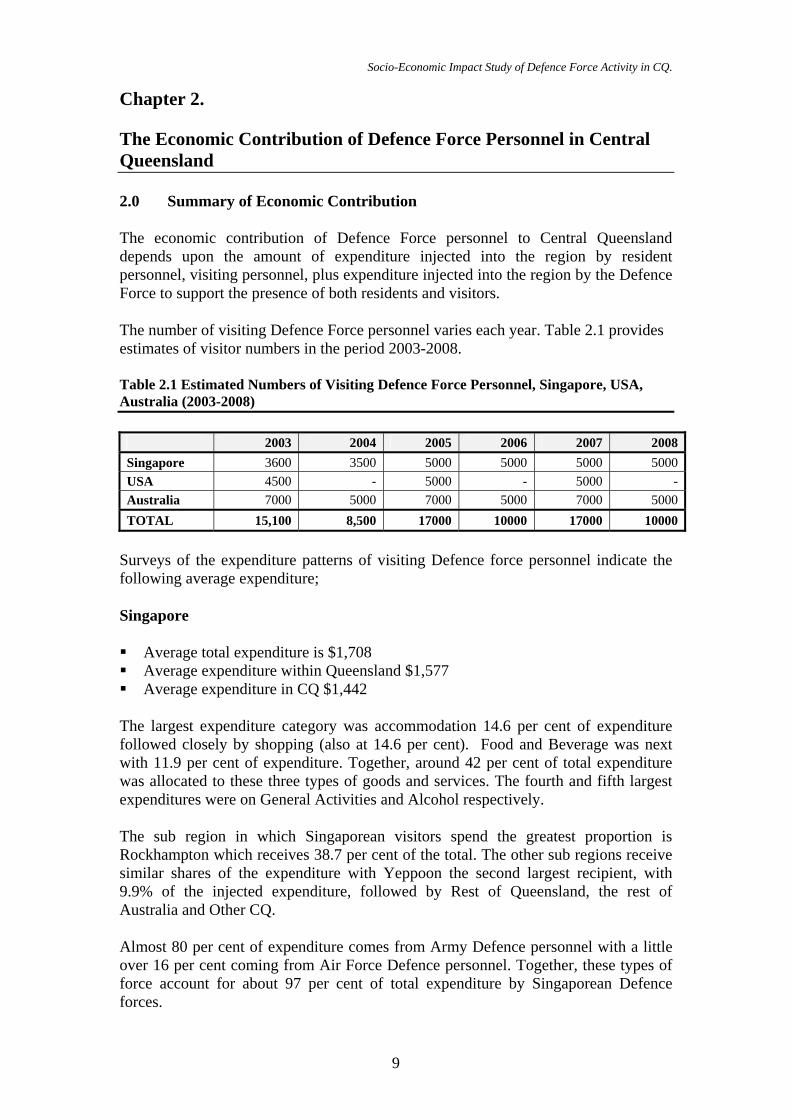
The number of visiting Defence Force personnel varies each year. Table 2.1 provides estimates of visitor numbers in the period 2003-2008.
Table 2.1 Estimated Numbers of Visiting Defence Force Personnel, Singapore, USA, Australia (2003-2008)
2003 2004 2005 2006 2007 2008Singapore 3600 3500 5000 5000 5000 5000USA 4500 - 5000 - 5000 -Australia 7000 5000 7000 5000 7000 5000TOTAL 15,100 8,500 17000 10000 17000 10000
Surveys of the expenditure patterns of visiting Defence force personnel indicate the following average expenditure;
Singapore
Average total expenditure is $1,708 Average expenditure within Queensland $1,577 Average expenditure in CQ $1,442
The largest expenditure category was accommodation 14.6 per cent of expenditure followed closely by shopping (also at 14.6 per cent). Food and Beverage was next with 11.9 per cent of expenditure. Together, around 42 per cent of total expenditure was allocated to these three types of goods and services. The fourth and fifth largest expenditures were on General Activities and Alcohol respectively.
The sub region in which Singaporean visitors spend the greatest proportion is Rockhampton which receives 38.7 per cent of the total. The other sub regions receive similar shares of the expenditure with Yeppoon the second largest recipient, with 9.9% of the injected expenditure, followed by Rest of Queensland, the rest of Australia and Other CQ.
Almost 80 per cent of expenditure comes from Army Defence personnel with a little over 16 per cent coming from Air Force Defence personnel. Together, these types of force account for about 97 per cent of total expenditure by Singaporean Defence forces.

Socio-Economic Impact Study of Defence Force Activity in CQ.
10
The bulk of expenditure of Singapore visitors (93.9 per cent) is from males. For each Gender the five largest expenditure categories were as follows:
Males: Accommodation, Shopping, F&B, Alcohol, General Activities Females: Shopping, Accommodation, Gambling, Adult Entertainment,
other Transportation
USA
Average total expenditure is $3,270 Average expenditure within Queensland $2,885 Average expenditure in CQ $2,734
The largest expenditure category was accommodation (24.5 per cent of expenditure) followed by alcohol (16.4 per cent). Food and Beverage was next with 12.3 per cent of expenditure. Together, around 43 per cent of total expenditure was allocated to these three types of goods and services. The fourth and fifth largest expenditures were on Shopping and General Activities respectively.
The sub region in which USA visitors spend the greatest proportion is Rockhampton which receives 36.6 per cent of the total. The rest of Queensland is the second largest recipient (15.1 per cent of expenditure) followed by rest of Australia. The CQ region which received the most expenditure after Rockhampton was Gladstone (10.4 per cent).
Some 81.8 per cent of expenditure comes from Marines with a further 9.2 per cent coming from Army Defence personnel. Together, these types of force account for about 91.0 per cent of total expenditure by USA visiting Defence forces.
The bulk of expenditure of USA visitors (95.7 per cent) is from males. For each Gender the five largest expenditure categories were as follows:
Males: Accommodation, Rail Travel, Air Travel, Alcohol, F&B Females: Accommodation, Shopping, Alcohol, F&B, other
Transportation
Australia
Average total expenditure is $3,274 Average expenditure within Queensland $2,720 Average expenditure in CQ $2,133
The largest expenditure category was Food and Beverage (14.6 per cent of expenditure) followed by Alcohol (14.2 per cent) and Shopping (13.0 per cent). Together, around 41 per cent of total expenditure was allocated to these three types of goods and services. The fourth and fifth largest expenditures were on Accommodation and General Activities respectively.
The sub region in which the Australian visitors spend the greatest proportion is Rockhampton which receives 30.0 per cent of the total. The rest of Queensland is the second largest recipient (17.9 per cent of expenditure) followed by rest of Australia.
Socio-Economic Impact Study of Defence Force Activity in CQ.
11
The CQ region which received the most expenditure after Rockhampton was Yeppoon (7.8 per cent).
Some 90.20 per cent of expenditure comes from Army personnel with a further 6.30 per cent coming from Marine personnel. Together, these types of force account for about 96.5.0 per cent of total expenditure by Australian visiting Defence forces.
The bulk of expenditure of Australian visitors (76.2 per cent) is from males. The proportion of females (23.8 per cent) is relatively higher for Australia than for Singapore and USA. For each Gender the five largest expenditure categories were as follows:
Males: F&B, Alcohol, Accommodation, Shopping, General Activities Females: Alcohol, F&B, Shopping, General Activities, Accommodation
Actual Expenditure Projections
The estimates for Singapore, the USA and Australia are derived by multiplying the estimated numbers of visitors (see Table 2.1) by average expenditure per visitor in Central Queensland and all Queensland for each origin.
Over the six year period (2003-2008) the average injection per year from visiting Defence Force personnel expenditure is:
Central Queensland: $24,789 m. per annum Queensland: $29,730 m. per annum
Expenditure by the Defence Force
Direct economic effects also result when the Defence Forces spend money in the region to support the visiting personnel. Such expenditure may cover food, electricity, fuel, construction equipment, repairs and maintenance and other goods and services. The Defence establishment makes significant purchases within the CQ region.
Defence Force Expenditure comprises three main components:
1. Expenditure by CSI-RTON and 42RQR on wages and salaries, contracted suppliers, general purchasing, infrastructure support, environmental support, rations support and information support.
2. Expenditure related to Exercises 3. Expenditure to support visiting Defence Force personnel
The estimates of expenditure cover a seven (7) year period. The estimated Average Annual Total Expenditure by the Defence Force on the above items is $27 million.
Expenditure by Resident Defence Force Personnel
The expenditure of resident Defence force households is also relevant to an estimation of the economic contribution of the Defence Force to Central Queensland. The reason for this is that the money injected by Defence Force households into the local economy comes initially from outside the area in the form of federally financed wages and salaries. These wages and salaries are then spent by Defence force households on
Socio-Economic Impact Study of Defence Force Activity in CQ.
12
goods and services. While the number of Defence Force households in CQ is relatively small (45), their expenditure contributes to the local economy. The survey indicated that gross household income totalled $3,692,340. Average household weekly income is $1,578. Average annual gross household income is $82,052.
The total annual expenditure injection associated with Defence Force presence in Central Queensland is the addition of the three sources of expenditure. On average, $52.8 million per annum is injected into the region.
The Queensland Government Statistician, Office of Economic and Statistical Research has recently developed preliminary I-O tables will be available for each regions of Queensland, including Fitzroy. When published these tables are available at a 35 or 107 level of industry desegregation with seven demand and six primary inputs categories. These preliminary I-0 tables enable an estimation to be made of the economic impacts of the Defence Force presence in the CQ region. (Note: estimates of economic impacts must be treated cautiously due to the assumptions underpinning the economic models).
The impact on ‘value-added’ in Central Queensland is $42.24 m. The direct value added is $31.68 million with flow on effects of $10.56 m.
The impact on employment in Central Queensland is 728 full time equivalent jobs. 586 jobs are created directly while 142 jobs are created indirectly due to flow on effects in the regional economy.
2.1 Introduction
The economic contribution of Defence Force personnel to Central Queensland depends upon the amount of expenditure injected into the region by resident personnel, visiting personnel, plus expenditure injected into the region by the Defence Force to support the presence of both residents and visitors.
The extent to which visitor expenditure can boost local primary, secondary and tertiary industry depends on the strength of business links between tourism and other sectors of economy. Thus it is important to understand the economic significance of overall visitation to Central Queensland.
The Context: The Fitzroy Region
The following is based on the most recent estimates for the Fitzroy region published by Queensland Treasury in its report “The Contribution of International and Domestic Expenditure to the Queensland Regional Economies: 1998-99” (May 2002). The Fitzroy Statistical Division includes the Local Government Areas (LGA) of Banana, Bauhinia, Calliope, Duaringa, Emerald, Fitzroy, Gladstone, Jericho, Livingstone, Mount Morgan, Peak Downs and Rockhampton City. This area is not identical with Central Queensland but includes much of the region. In the absence of better data visitation statistics for Fitzroy provide a useful indicator of visitation to Central Queensland.
Socio-Economic Impact Study of Defence Force Activity in CQ.
13
All visitor expenditure
Expenditure by all visitors to the Fitzroy region amounted to $565 million in 1998-99. By expenditure, the origin of visitors to Fitzroy was as follows:
Expenditure by Fitzroy residents travelling within their region, 33 per cent
Expenditure by visitors from other Queensland regions, 32.5 per cent. Expenditure by interstate visitors, 19.2 per cent Expenditure by international visitors 7.9 per cent. Expenditure by Fitzroy region residents’ expenditure before and after
travelling either interstate, overseas or to other Queensland regions, 7.4 per cent
Of the total visitor expenditure, holiday tourists accounted for 71.3 per cent, while business visitors and those travelling for other purposes accounted for the remaining 28.7 per cent.
By expenditure categories, Accommodation, food and drink was the main area of expenditure, accounting for 41.7 per cent of total visitor expenditure. Shopping, gifts and souvenirs accounted for a further 16.3 per cent.
Tourism Gross Regional Product
Tourism Gross Regional Product (GRP) in the Fitzroy region amounted to $246 million in 1998-99, or 3.9 per cent of Queensland tourism GSP of $6,292 million.
Fitzroy tourism GRP of $246 million represented 3.6 per cent of the estimated total Fitzroy region GRP of $6,752 million.
Main Industries Contributing to Tourism GRP
Retail and wholesale trade accounted for $54 million, or 21.7 per cent, of total Fitzroy tourism GRP. The next largest contribution was by Accommodation, cafes and restaurants with $48 million, or 19.5 per cent. Another major contributor was Transport, storage and communication services, with $36 million, or 14.4 per cent.
Industries Most Reliant on Tourism
Accommodation, cafes and restaurants was the most tourism-reliant industry with 44.7 per cent of that industry's GRP being derived from tourism. The next most tourism-reliant Industries were Retail and wholesale trade and Cultural, recreational, personal and other Services with tourism shares of 10.4 per cent and 9.7 per cent respectively.
Tourism-Related Employment
Tourism accounted for a total of 4,695 full-time equivalent positions in Fitzroy in 1998-99, which was equivalent to 6.3 per cent of total full time equivalent (FTE) positions in the region. In terms of the actual number of (full and part time) positions employed in tourism, 6,040 positions were in the Fitzroy region in 1998-99.

Socio-Economic Impact Study of Defence Force Activity in CQ.
14
Retail and wholesale trade accounted for 1,989 tourism-related positions, or 42.4 per cent of all tourism-related employment. Accommodation, cafes and restaurants contributed a further 1,273 or 27.1 per cent share.
Accommodation, cafes and restaurants had the highest dependency on tourism, with 44.2 per cent of all positions in the industry attributed to tourism activity. Tourism-related employment represented 14.5 per cent of all positions in Retail and wholesale trade, and 13.4 per cent in Cultural, recreational, personal and other services.
Expenditures Associated with Defence Force Presence
The economic contribution of Defence Force presence in Central Queensland depends upon:
Total Expenditure associated with visiting Defence Force Personnel Total Expenditure associated with Department of Defence purchases Total Expenditure associated with permanent Defence Force
personnel in region.
2.2 Expenditure Associated with Visiting Defence Force Personnel
2.2.1 Estimated Numbers of Visiting Defence Force Personnel
A survey instrument was developed to estimate the expenditure of visiting Defence Force personnel. Respondents were required to estimate their expenditure in the different sub-regions of Central Queensland, elsewhere in Queensland and elsewhere in Australia both in terms of aggregate expenditure and expenditure on different types of goods and services. The responses also enabled estimates of expenditure by type of Force. Three surveys were undertaken. In 2002, 1617 completed responses were received from 3200 Singapore Defence Force Personnel making for a response rate slightly above 50 per cent., and in 2003 2,600 surveys were returned from 3,600 personnel making for a response rate of approximately 58 per cent. In 2003, USA personnel numbered 4,500 from which 2370 surveys were returned, a response rate of approximately 45 per cent.
Survey Results: Total Expenditure of Visiting Defence Force Personnel
An assessment of the economic contribution of Visiting Defence Force Personnel requires estimation of the total expenditure associated with this visitation as well as the nature and direction of the expenditure.
2.2.2 Expenditure by Sub-region
Singapore
The results of the 4217 completed surveys by Singapore respondents are set out in Tables 2.2, 2.6 and 2.9.
Socio-Economic Impact Study of Defence Force Activity in CQ.
15
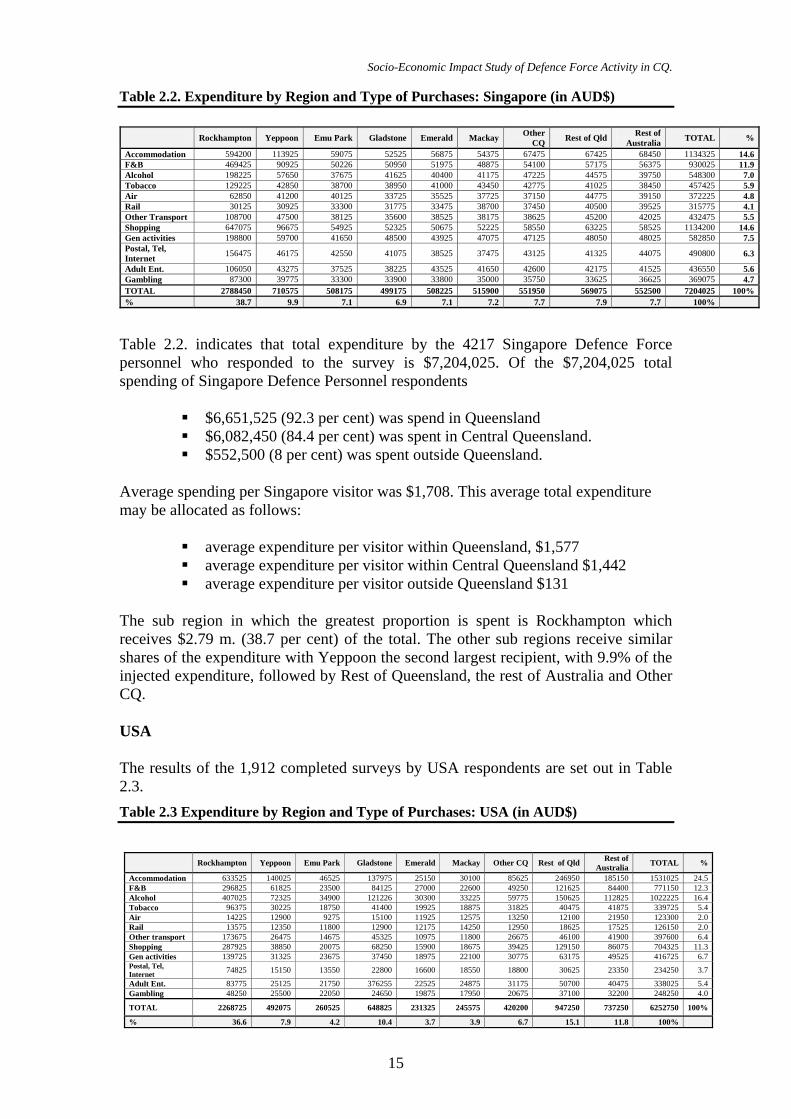
Table 2.2. Expenditure by Region and Type of Purchases: Singapore (in AUD$)
Rockhampton Yeppoon Emu Park Gladstone Emerald Mackay Other CQ Rest of Qld Rest of
Australia TOTAL %
Accommodation 594200 113925 59075 52525 56875 54375 67475 67425 68450 1134325 14.6F&B 469425 90925 50226 50950 51975 48875 54100 57175 56375 930025 11.9Alcohol 198225 57650 37675 41625 40400 41175 47225 44575 39750 548300 7.0Tobacco 129225 42850 38700 38950 41000 43450 42775 41025 38450 457425 5.9Air 62850 41200 40125 33725 35525 37725 37150 44775 39150 372225 4.8Rail 30125 30925 33300 31775 33475 38700 37450 40500 39525 315775 4.1Other Transport 108700 47500 38125 35600 38525 38175 38625 45200 42025 432475 5.5Shopping 647075 96675 54925 52325 50675 52225 58550 63225 58525 1134200 14.6Gen activities 198800 59700 41650 48500 43925 47075 47125 48050 48025 582850 7.5Postal, Tel, Internet 156475 46175 42550 41075 38525 37475 43125 41325 44075 490800 6.3
Adult Ent. 106050 43275 37525 38225 43525 41650 42600 42175 41525 436550 5.6Gambling 87300 39775 33300 33900 33800 35000 35750 33625 36625 369075 4.7TOTAL 2788450 710575 508175 499175 508225 515900 551950 569075 552500 7204025 100%% 38.7 9.9 7.1 6.9 7.1 7.2 7.7 7.9 7.7 100%
Table 2.2. indicates that total expenditure by the 4217 Singapore Defence Force personnel who responded to the survey is $7,204,025. Of the $7,204,025 total spending of Singapore Defence Personnel respondents
$6,651,525 (92.3 per cent) was spend in Queensland $6,082,450 (84.4 per cent) was spent in Central Queensland. $552,500 (8 per cent) was spent outside Queensland.
Average spending per Singapore visitor was $1,708. This average total expenditure may be allocated as follows:
average expenditure per visitor within Queensland, $1,577 average expenditure per visitor within Central Queensland $1,442 average expenditure per visitor outside Queensland $131
The sub region in which the greatest proportion is spent is Rockhampton which receives $2.79 m. (38.7 per cent) of the total. The other sub regions receive similar shares of the expenditure with Yeppoon the second largest recipient, with 9.9% of the injected expenditure, followed by Rest of Queensland, the rest of Australia and Other CQ.
USA
The results of the 1,912 completed surveys by USA respondents are set out in Table 2.3. Table 2.3 Expenditure by Region and Type of Purchases: USA (in AUD$)
Rockhampton Yeppoon Emu Park Gladstone Emerald Mackay Other CQ Rest of Qld Rest of Australia TOTAL %
Accommodation 633525 140025 46525 137975 25150 30100 85625 246950 185150 1531025 24.5F&B 296825 61825 23500 84125 27000 22600 49250 121625 84400 771150 12.3Alcohol 407025 72325 34900 121226 30300 33225 59775 150625 112825 1022225 16.4Tobacco 96375 30225 18750 41400 19925 18875 31825 40475 41875 339725 5.4Air 14225 12900 9275 15100 11925 12575 13250 12100 21950 123300 2.0Rail 13575 12350 11800 12900 12175 14250 12950 18625 17525 126150 2.0Other transport 173675 26475 14675 45325 10975 11800 26675 46100 41900 397600 6.4Shopping 287925 38850 20075 68250 15900 18675 39425 129150 86075 704325 11.3Gen activities 139725 31325 23675 37450 18975 22100 30775 63175 49525 416725 6.7Postal, Tel, Internet 74825 15150 13550 22800 16600 18550 18800 30625 23350 234250 3.7
Adult Ent. 83775 25125 21750 376255 22525 24875 31175 50700 40475 338025 5.4Gambling 48250 25500 22050 24650 19875 17950 20675 37100 32200 248250 4.0
TOTAL 2268725 492075 260525 648825 231325 245575 420200 947250 737250 6252750 100%
% 36.6 7.9 4.2 10.4 3.7 3.9 6.7 15.1 11.8 100%
Socio-Economic Impact Study of Defence Force Activity in CQ.
16
Table 2.3 indicates that total expenditure by the 1,912 of USA Defence Force personnel who responded to the survey is $6,252,750. Of this $6,252,750 total spending:
$5,515,500 (88.2 per cent) was spent in Queensland $5,228.250 (73.1 per cent) was spent in Central Queensland. $737,250 (11.8 per cent) was spent outside Queensland.
The sub region in which the greatest proportion is spent is Rockhampton which receives $2.27 m. (36.6 per cent) of the total. The rest of Queensland is the second largest recipient (15.1 per cent of expenditure) followed by rest of Australia. The CQ region which received the most expenditure after Rockhampton was Gladstone ($648,825 or 10.4 per cent).
Average spending per USA visitor was $3,270.30. This average total expenditure may be allocated as follows:
average expenditure per visitor within Queensland, $2,884.70 average expenditure per visitor within Central Queensland $2,734.40 average expenditure per visitor outside Queensland $385.60
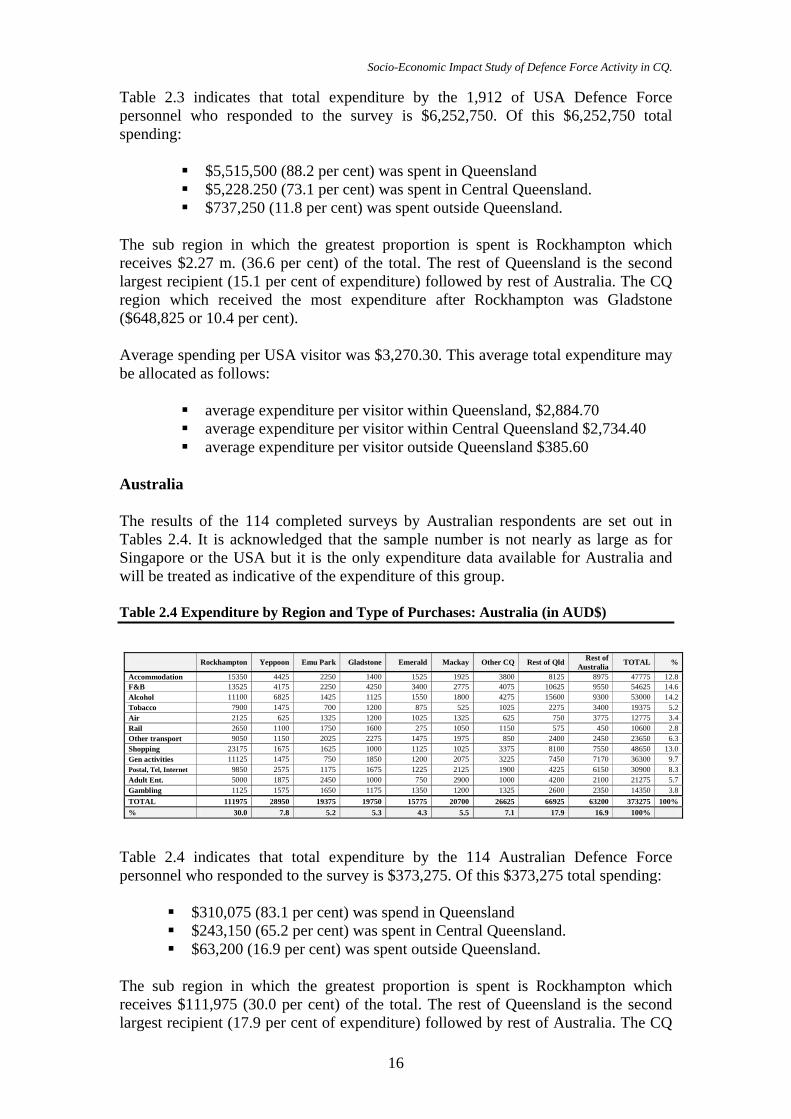
Australia
The results of the 114 completed surveys by Australian respondents are set out in Tables 2.4. It is acknowledged that the sample number is not nearly as large as for Singapore or the USA but it is the only expenditure data available for Australia and will be treated as indicative of the expenditure of this group.
Table 2.4 Expenditure by Region and Type of Purchases: Australia (in AUD$)
Rockhampton Yeppoon Emu Park Gladstone Emerald Mackay Other CQ Rest of Qld Rest of Australia TOTAL %
Accommodation 15350 4425 2250 1400 1525 1925 3800 8125 8975 47775 12.8F&B 13525 4175 2250 4250 3400 2775 4075 10625 9550 54625 14.6Alcohol 11100 6825 1425 1125 1550 1800 4275 15600 9300 53000 14.2Tobacco 7900 1475 700 1200 875 525 1025 2275 3400 19375 5.2Air 2125 625 1325 1200 1025 1325 625 750 3775 12775 3.4Rail 2650 1100 1750 1600 275 1050 1150 575 450 10600 2.8Other transport 9050 1150 2025 2275 1475 1975 850 2400 2450 23650 6.3Shopping 23175 1675 1625 1000 1125 1025 3375 8100 7550 48650 13.0Gen activities 11125 1475 750 1850 1200 2075 3225 7450 7170 36300 9.7Postal, Tel, Internet 9850 2575 1175 1675 1225 2125 1900 4225 6150 30900 8.3Adult Ent. 5000 1875 2450 1000 750 2900 1000 4200 2100 21275 5.7Gambling 1125 1575 1650 1175 1350 1200 1325 2600 2350 14350 3.8TOTAL 111975 28950 19375 19750 15775 20700 26625 66925 63200 373275 100%% 30.0 7.8 5.2 5.3 4.3 5.5 7.1 17.9 16.9 100%
Table 2.4 indicates that total expenditure by the 114 Australian Defence Force personnel who responded to the survey is $373,275. Of this $373,275 total spending:
$310,075 (83.1 per cent) was spend in Queensland $243,150 (65.2 per cent) was spent in Central Queensland. $63,200 (16.9 per cent) was spent outside Queensland.
The sub region in which the greatest proportion is spent is Rockhampton which receives $111,975 (30.0 per cent) of the total. The rest of Queensland is the second largest recipient (17.9 per cent of expenditure) followed by rest of Australia. The CQ

Socio-Economic Impact Study of Defence Force Activity in CQ.
17
region which received the most expenditure after Rockhampton was Yeppoon ($28,950 or 7.8 per cent).
Average spending per Australian visitor was $3,274.30. This average total expenditure may be allocated as follows:
average expenditure per visitor within Queensland, $2,720 average expenditure per visitor within Central Queensland $2,132.90 average expenditure per visitor outside Queensland $554.40
2.2.3 Patterns of Expenditure
Respondents were required to allocate their total expenditure to twelve (12) types of goods and services.
Singapore
The largest expenditure category was accommodation ($1,134,325 or 14.6 per cent of expenditure) followed closely by shopping ($1,134,200 also at 14.6 per cent). Food and Beverage was next with $930,025 (or 11.9 per cent of expenditure). Together, around 42 per cent of total expenditure was allocated to these three types of goods and services. The fourth and fifth largest expenditures were on General Activities and Alcohol respectively.
USA
The largest expenditure category was accommodation ($1,531,025 or 24.5 per cent of expenditure) followed by alcohol ($1,022,225 or 16.4 per cent). Food and Beverage was next with $771,150 (or 12.3 per cent of expenditure). Together, around 43 per cent of total expenditure was allocated to these three types of goods and services. The fourth and fifth largest expenditures were on Shopping and General Activities respectively.
Australia
The largest expenditure category was Food and Beverage ($54,625 or 14.6 per cent of expenditure) followed by Alcohol ($53,000 or 14.2 per cent) and Shopping ($48, 650 or 13.0 per cent). Together, around 41 per cent of total expenditure was allocated to these three types of goods and services. The fourth and fifth largest expenditures were on Accommodation and General Activities respectively.
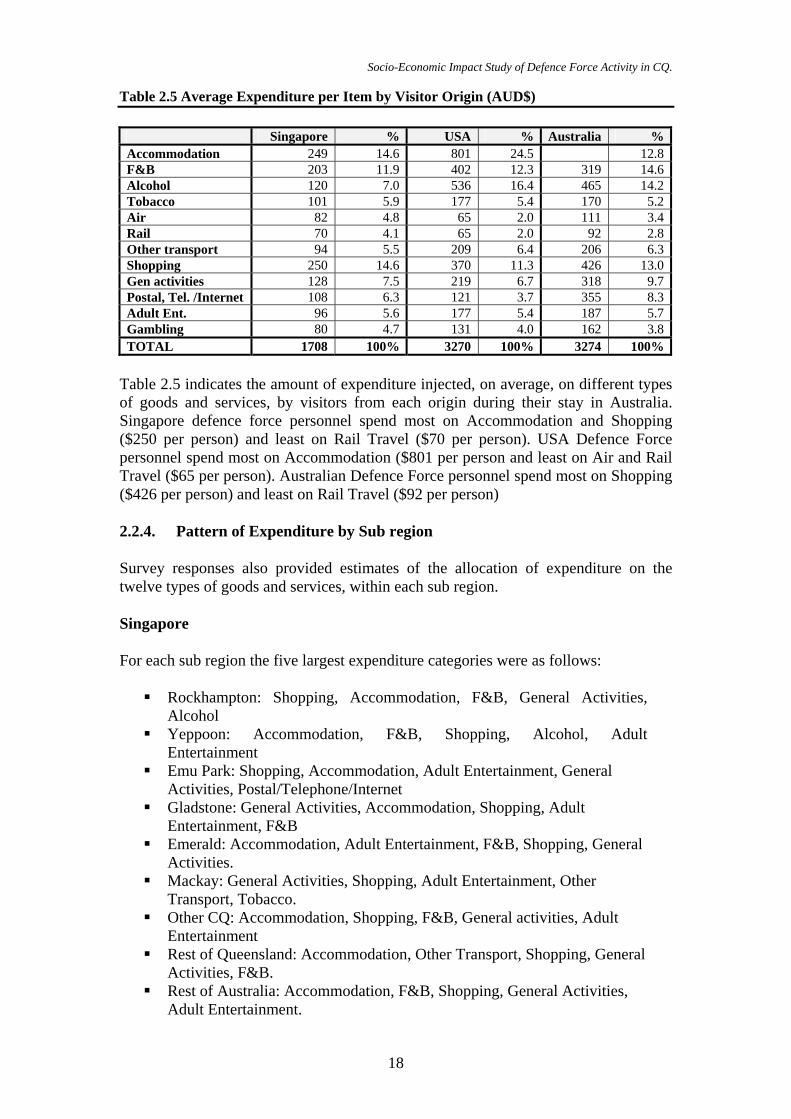
Average expenditure by visitors, according to origin, on different types of goods and services is shown in Table 2.5
Socio-Economic Impact Study of Defence Force Activity in CQ.
18
Table 2.5 Average Expenditure per Item by Visitor Origin (AUD$)
Singapore % USA % Australia %Accommodation 249 14.6 801 24.5 12.8F&B 203 11.9 402 12.3 319 14.6Alcohol 120 7.0 536 16.4 465 14.2Tobacco 101 5.9 177 5.4 170 5.2Air 82 4.8 65 2.0 111 3.4Rail 70 4.1 65 2.0 92 2.8Other transport 94 5.5 209 6.4 206 6.3Shopping 250 14.6 370 11.3 426 13.0Gen activities 128 7.5 219 6.7 318 9.7Postal, Tel. /Internet 108 6.3 121 3.7 355 8.3Adult Ent. 96 5.6 177 5.4 187 5.7Gambling 80 4.7 131 4.0 162 3.8TOTAL 1708 100% 3270 100% 3274 100%
Table 2.5 indicates the amount of expenditure injected, on average, on different types of goods and services, by visitors from each origin during their stay in Australia. Singapore defence force personnel spend most on Accommodation and Shopping ($250 per person) and least on Rail Travel ($70 per person). USA Defence Force personnel spend most on Accommodation ($801 per person and least on Air and Rail Travel ($65 per person). Australian Defence Force personnel spend most on Shopping ($426 per person) and least on Rail Travel ($92 per person)
2.2.4. Pattern of Expenditure by Sub region
Survey responses also provided estimates of the allocation of expenditure on the twelve types of goods and services, within each sub region.
Singapore
For each sub region the five largest expenditure categories were as follows:
Rockhampton: Shopping, Accommodation, F&B, General Activities, Alcohol
Yeppoon: Accommodation, F&B, Shopping, Alcohol, Adult Entertainment
Emu Park: Shopping, Accommodation, Adult Entertainment, General Activities, Postal/Telephone/Internet
Gladstone: General Activities, Accommodation, Shopping, Adult Entertainment, F&B
Emerald: Accommodation, Adult Entertainment, F&B, Shopping, General Activities.
Mackay: General Activities, Shopping, Adult Entertainment, Other Transport, Tobacco.
Other CQ: Accommodation, Shopping, F&B, General activities, Adult Entertainment
Rest of Queensland: Accommodation, Other Transport, Shopping, General Activities, F&B.
Rest of Australia: Accommodation, F&B, Shopping, General Activities, Adult Entertainment.
Socio-Economic Impact Study of Defence Force Activity in CQ.
19
USA
For each sub region the five largest expenditure categories were as follows:
Rockhampton: Shopping, Accommodation, F&B, Alcohol General Activities, Alcohol
Yeppoon: Accommodation, F&B, Shopping, Alcohol, Adult Entertainment Emu Park: Shopping, Accommodation, Adult Entertainment, General
Activities, Postal/Telephone/Internet Gladstone: General Activities, Accommodation, Shopping, Adult
Entertainment, F&B. Emerald: Accommodation, Adult Entertainment, F&B, Shopping, General
Activities. Mackay: General Activities, Shopping, Adult Entertainment, Other
Transport, Tobacco. Other CQ: Accommodation, Shopping, F&B, General Activities, Adult
Entertainment Rest of Queensland: Accommodation, Other Transport, Shopping, General
Activities, F&B. Rest of Australia: Accommodation, F&B, Shopping, General Activities,
Adult Entertainment
Australia
For each sub region the five largest expenditure categories were as follows:
Rockhampton: Shopping, Accommodation, F&B, General Activities, Alcohol
Yeppoon: Alcohol, Accommodation, F&B, Shopping, Postal/Telephone/Internet, Adult Entertainment
Emu Park: Adult Entertainment, Accommodation, F&B, Other Transport, Shopping
Gladstone: F&B, Other Transport, General Activities, Postal/Telephone/Internet.
Emerald: F&B, Other Transportation, General Activities, Postal/Telephone/Internet, Rail Travel.
Mackay: Adult entertainment, F&B, Postal/Telephone/Internet, General Activities, Alcohol.
Other CQ: Alcohol, F&B, Accommodation, Shopping, General Activities Rest of Queensland: Alcohol, F&B, Accommodation, Shopping, General
Activities. Rest of Australia: F&B, Alcohol, Accommodation, Shopping, General
Activities.
Socio-Economic Impact Study of Defence Force Activity in CQ.
20
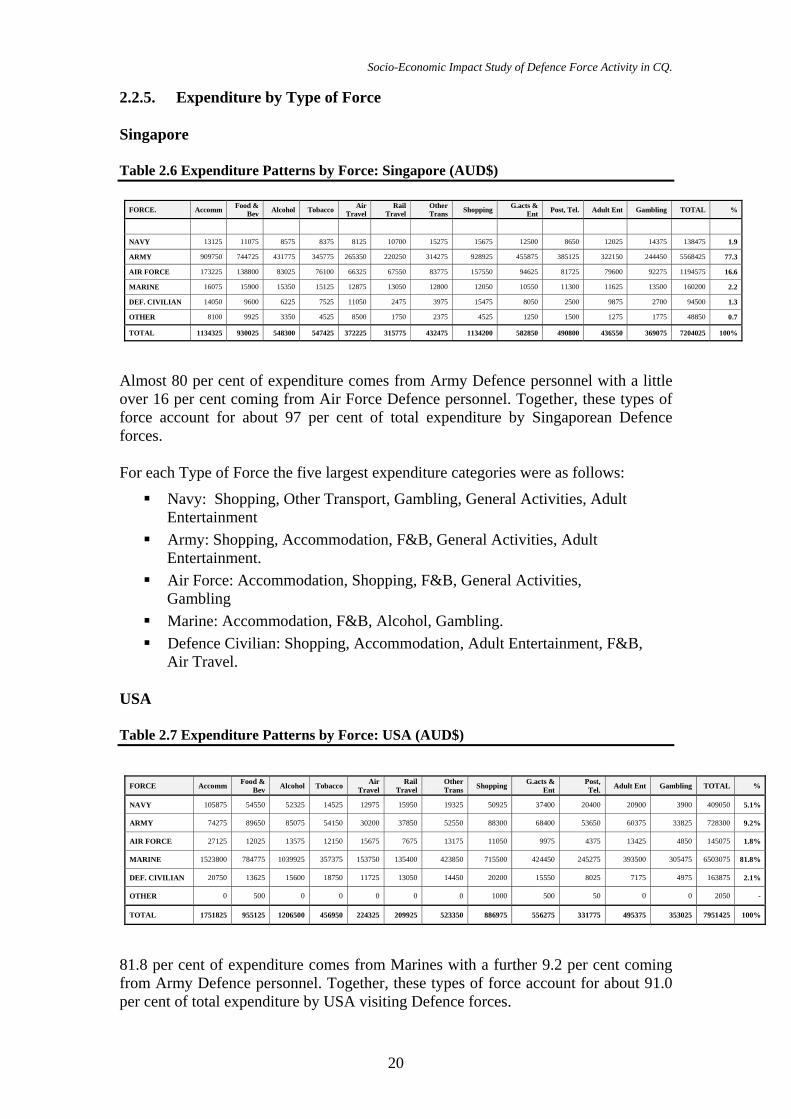
2.2.5. Expenditure by Type of Force
Singapore
Table 2.6 Expenditure Patterns by Force: Singapore (AUD$)
FORCE. Accomm Food & Bev Alcohol Tobacco Air
Travel Rail
Travel Other Trans Shopping G.acts &
Ent Post, Tel. Adult Ent Gambling TOTAL %
NAVY 13125 11075 8575 8375 8125 10700 15275 15675 12500 8650 12025 14375 138475 1.9
ARMY 909750 744725 431775 345775 265350 220250 314275 928925 455875 385125 322150 244450 5568425 77.3
AIR FORCE 173225 138800 83025 76100 66325 67550 83775 157550 94625 81725 79600 92275 1194575 16.6
MARINE 16075 15900 15350 15125 12875 13050 12800 12050 10550 11300 11625 13500 160200 2.2
DEF. CIVILIAN 14050 9600 6225 7525 11050 2475 3975 15475 8050 2500 9875 2700 94500 1.3
OTHER 8100 9925 3350 4525 8500 1750 2375 4525 1250 1500 1275 1775 48850 0.7
TOTAL 1134325 930025 548300 547425 372225 315775 432475 1134200 582850 490800 436550 369075 7204025 100%
Almost 80 per cent of expenditure comes from Army Defence personnel with a little over 16 per cent coming from Air Force Defence personnel. Together, these types of force account for about 97 per cent of total expenditure by Singaporean Defence forces.
For each Type of Force the five largest expenditure categories were as follows:
Navy: Shopping, Other Transport, Gambling, General Activities, Adult Entertainment
Army: Shopping, Accommodation, F&B, General Activities, Adult Entertainment.
Air Force: Accommodation, Shopping, F&B, General Activities, Gambling
Marine: Accommodation, F&B, Alcohol, Gambling. Defence Civilian: Shopping, Accommodation, Adult Entertainment, F&B,
Air Travel.
USA
Table 2.7 Expenditure Patterns by Force: USA (AUD$)
FORCE Accomm Food &
Bev Alcohol Tobacco Air Travel
Rail Travel
Other Trans Shopping G.acts &
Ent Post, Tel. Adult Ent Gambling TOTAL %
NAVY 105875 54550 52325 14525 12975 15950 19325 50925 37400 20400 20900 3900 409050 5.1%
ARMY 74275 89650 85075 54150 30200 37850 52550 88300 68400 53650 60375 33825 728300 9.2%
AIR FORCE 27125 12025 13575 12150 15675 7675 13175 11050 9975 4375 13425 4850 145075 1.8%
MARINE 1523800 784775 1039925 357375 153750 135400 423850 715500 424450 245275 393500 305475 6503075 81.8%
DEF. CIVILIAN 20750 13625 15600 18750 11725 13050 14450 20200 15550 8025 7175 4975 163875 2.1%
OTHER 0 500 0 0 0 0 0 1000 500 50 0 0 2050 -
TOTAL 1751825 955125 1206500 456950 224325 209925 523350 886975 556275 331775 495375 353025 7951425 100%
81.8 per cent of expenditure comes from Marines with a further 9.2 per cent coming from Army Defence personnel. Together, these types of force account for about 91.0 per cent of total expenditure by USA visiting Defence forces.
Socio-Economic Impact Study of Defence Force Activity in CQ.
21
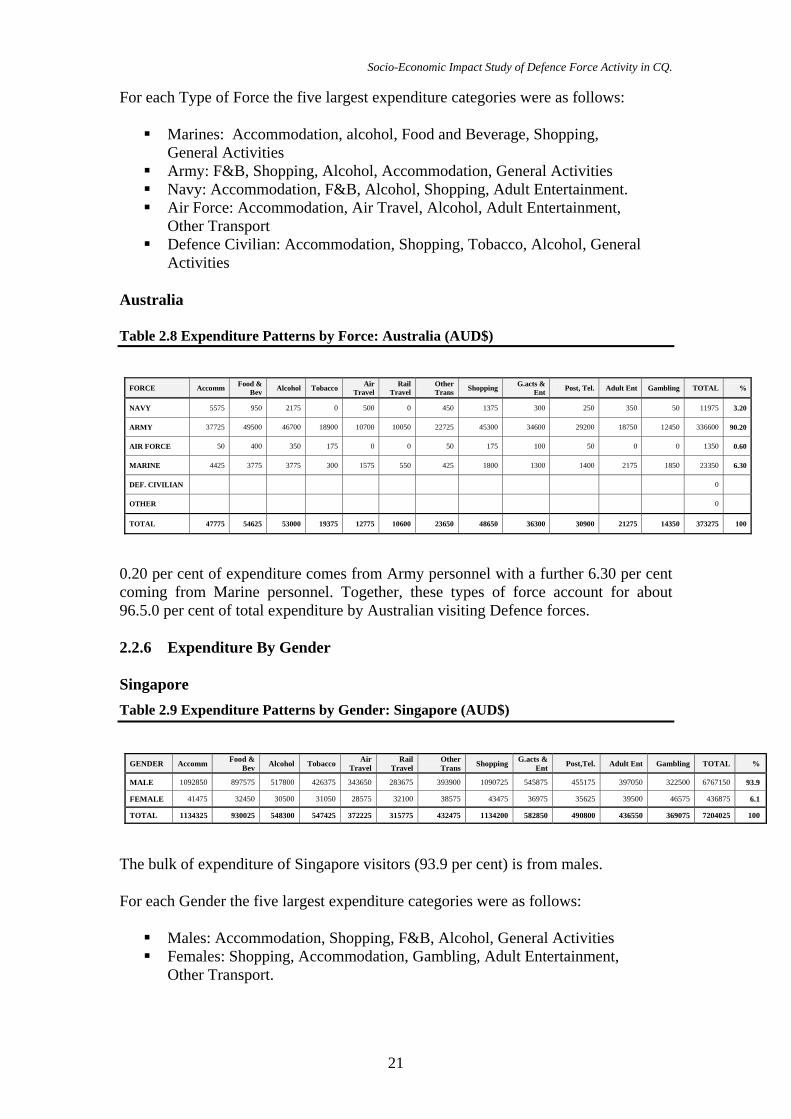
For each Type of Force the five largest expenditure categories were as follows:
Marines: Accommodation, alcohol, Food and Beverage, Shopping, General Activities
Army: F&B, Shopping, Alcohol, Accommodation, General Activities Navy: Accommodation, F&B, Alcohol, Shopping, Adult Entertainment. Air Force: Accommodation, Air Travel, Alcohol, Adult Entertainment,
Other Transport Defence Civilian: Accommodation, Shopping, Tobacco, Alcohol, General
Activities
Australia
Table 2.8 Expenditure Patterns by Force: Australia (AUD$)
FORCE Accomm Food &
Bev Alcohol Tobacco Air Travel
Rail Travel
Other Trans Shopping G.acts &
Ent Post, Tel. Adult Ent Gambling TOTAL %
NAVY 5575 950 2175 0 500 0 450 1375 300 250 350 50 11975 3.20
ARMY 37725 49500 46700 18900 10700 10050 22725 45300 34600 29200 18750 12450 336600 90.20
AIR FORCE 50 400 350 175 0 0 50 175 100 50 0 0 1350 0.60
MARINE 4425 3775 3775 300 1575 550 425 1800 1300 1400 2175 1850 23350 6.30
DEF. CIVILIAN 0
OTHER 0
TOTAL 47775 54625 53000 19375 12775 10600 23650 48650 36300 30900 21275 14350 373275 100
0.20 per cent of expenditure comes from Army personnel with a further 6.30 per cent coming from Marine personnel. Together, these types of force account for about 96.5.0 per cent of total expenditure by Australian visiting Defence forces.
2.2.6 Expenditure By Gender
Singapore Table 2.9 Expenditure Patterns by Gender: Singapore (AUD$)
GENDER Accomm Food &
Bev Alcohol Tobacco Air Travel
Rail Travel
Other Trans Shopping G.acts &
Ent Post,Tel. Adult Ent Gambling TOTAL %
MALE 1092850 897575 517800 426375 343650 283675 393900 1090725 545875 455175 397050 322500 6767150 93.9
FEMALE 41475 32450 30500 31050 28575 32100 38575 43475 36975 35625 39500 46575 436875 6.1
TOTAL 1134325 930025 548300 547425 372225 315775 432475 1134200 582850 490800 436550 369075 7204025 100
The bulk of expenditure of Singapore visitors (93.9 per cent) is from males.
For each Gender the five largest expenditure categories were as follows:
Males: Accommodation, Shopping, F&B, Alcohol, General Activities Females: Shopping, Accommodation, Gambling, Adult Entertainment,
Other Transport.

Socio-Economic Impact Study of Defence Force Activity in CQ.
22
USA
Table 2.10 Expenditure Patterns by Gender: USA (AUD$)
GENDER Accomm Food & Bev Alcohol Tobacco Air
Travel Rail
Travel Other Trans Shopping G.acts &
Ent Post,Tel. Adult Ent Gambling TOTAL %
MALE 1442950 735700 981200 332575 120500 124725 381250 649750 404675 228200 335925 247025 5984475 95.7
FEMALE 88075 35450 41025 7150 2800 1425 16350 54575 12050 6050 2100 1225 268275 4.3
TOTAL 1531025 771150 1022225 339725 123300 126150 397600 704325 416725 234250 338025 248250 6252750 100%
The bulk of expenditure of USA visitors (95.7 per cent) is from males.
For each Gender the five largest expenditure categories were as follows:
Males: Accommodation, Rail Travel, Air Travel, Alcohol, F&B Females: Accommodation, Shopping, Alcohol, F&B, Other Transport.
Australia
Table 2.11 Expenditure Patterns by Gender: Australia (AUD$)
GENDER Accomm Food &
Bev Alcohol Tobacco Air Travel
Rail Travel
Other Trans Shopping G.acts &
Ent Post, Tel. Adult Ent Gambling TOTAL %
MALE 39125 44150 40125 13900 8050 4650 15250 38325 26250 26100 15075 13300 284300 76.2
FEMALE 8650 10475 12875 5475 4725 5950 8400 10325 10050 4800 6200 1050 88975 23.8
TOTAL 47775 54625 53000 19375 12775 10600 23650 48650 36300 30900 21275 14350 373275 100%
The bulk of expenditure of Australian visitors (76.2 per cent) is from males. The proportion of females (23.8 per cent) is relatively higher for Australia than for Singapore and USA.
For each Gender the five largest expenditure categories were as follows:
Males: F&B, Alcohol, Accommodation, Shopping, General Activities Females: Alcohol, F&B, Shopping, General Activities, Accommodation
2.2.7 Estimating Total Visitor Expenditure
While Table 2.1 sets out estimates of numbers of visiting personnel, they may not all be given the same opportunities to spend money in CQ. In particular, a substantial number of Australian personnel do not have sufficient leisure time in locations providing spending opportunities.
To estimate total expenditure injected into CQ by visiting Defence Force personnel the following assumption was made:
The spending behaviour of the survey respondents is similar to the spending behaviour of those who did not respond. This assumption applies to Singaporean, USA, and Australian personnel.

Socio-Economic Impact Study of Defence Force Activity in CQ.
23
Table 2.12 provides estimates of total expenditure in Queensland and Central Queensland of all visiting Defence Force personnel over the period 2003-2008. The estimates for Singapore, the USA and Australia are derived by multiplying the estimated numbers of visitors (see Table 2.1) by average expenditure per visitor in Central Queensland and all Queensland for each origin.
Table 2.12 Projected injection of visiting Defence Force expenditure into Central Queensland and Queensland, 2003-2008 (AUD$)
2003 2004 2005 2006 2007 2008 CQ Qld CQ Qld CQ Qld CQ Qld CQ Qld CQ Qld
Singapore 5.191 5.677 5.047 5.520 7.210 7.885 7.210 7.885 7.210 7.885 7.210 7.885 USA 12.303 12.983 - - 13.670 14.425 - - 13.670 14.425 - - Australia 14.931 19.040 10.665 13.600 14.931 19.040 10.665 13.600 14.931 19.040 10.665 13.600
TOTAL 26.894 33.591 15.712 19.120 35.190 41.350 17.875 21.485 35.190 41.350 17.875 21.485
Over the six year period (2003-2008) the average injection per year from visiting Defence Force personnel expenditure is:
Central Queensland: $24, 789 million per annum Queensland: $29,730,000 per annum
Limitations of Survey 1. The survey instrument required respondents to distinguish the location of
their expenditure. Although the survey instrument contained a map to help respondents allocate their expenditure to different sub-regions, it is likely that some were confused as to regional boundaries. This is understandable but the result is that some expenditure has clearly been misallocated. For example, some respondents have allocated rail expenditure to Emu Park even though no rail system exists in that area. Rather than re-allocate this expenditure the consultants have preferred to construct the expenditure tables according to the responses received. Caution must be exercised, however, with respect to sub-regional allocation of expenditure.
2. The number of responses from visiting Defence Force personnel from Singapore and USA comprised a large proportion of overall visitor numbers. For Australian Defence Force personnel, only a very small number of survey forms (114) were completed. Less confidence can thus be reposed in the expenditure data for Australia than for visiting personnel from Singapore or the USA.
2.3 Defence Force Expenditure
Direct economic effects also result when the Defence Forces spend money in the region to support the visiting personnel. Such expenditure may cover food, electricity, fuel, construction equipment, repairs and maintenance and other goods and services. The Defence establishment makes significant purchases within the CQ region. Unfortunately there was insufficient data to determine the specific types of goods and services purchased. The strategy was then adopted to ascertain the gross expenditure that the Defence establishment makes in the area. This information was provided by the Defence Force. Consequently, the expenditure categories (eg. rations,

Socio-Economic Impact Study of Defence Force Activity in CQ.
24
environmental support etc.) are very broad and do not allow the allocation to industry sector required for the economic impacts of the expenditure to be modelled.
Defence Force Expenditure comprises three main components
1. Expenditure by CSI-RTON and 42RQR on wages and salaries, contracted suppliers, general purchasing, infrastructure support, environmental support, rations support and information support.
2. Expenditure related to Exercises
3 Expenditure to support visiting Defence Force personnel
2.3.1 Expenditure by CSI-RTON and 42QR
The following are estimates of annual average expenditure on these items (data supplied by Defence Force).
CSI-RTON
Annual Budget $2.144 million ( salaries, contracted suppliers and general purchasing)
Infrastructure support $1.75 million Environmental support $0.5 million Rations support $0.150 million Information systems support $2.0 million
42 RQR
Annual Budget $2.9 million (salaries, contracted suppliers and general purchasing)
Total expenditure CSI-RTON and 42RQR is $9.444 million per annum
2.3.2 Exercise Related Expenditure
CROC03 Expenditure CO Area
Expenditure associated with CRC03, 2003, was $3, 107, 500 comprised as follows:
AS ADFWC o Services and Utilities CSI-R $300,000 o Hire Vehicles $180,000 o Environmental Waste Disposal $400,000
HQ FSG $885,658 US
o Port Handling Costs $226,000 o Inland Transport $292,900 o Rations and Catering $592,900 o IT $58, 500 o Fuel $171,500
Currency Conversion to AUD $1 = US 0.70 cents
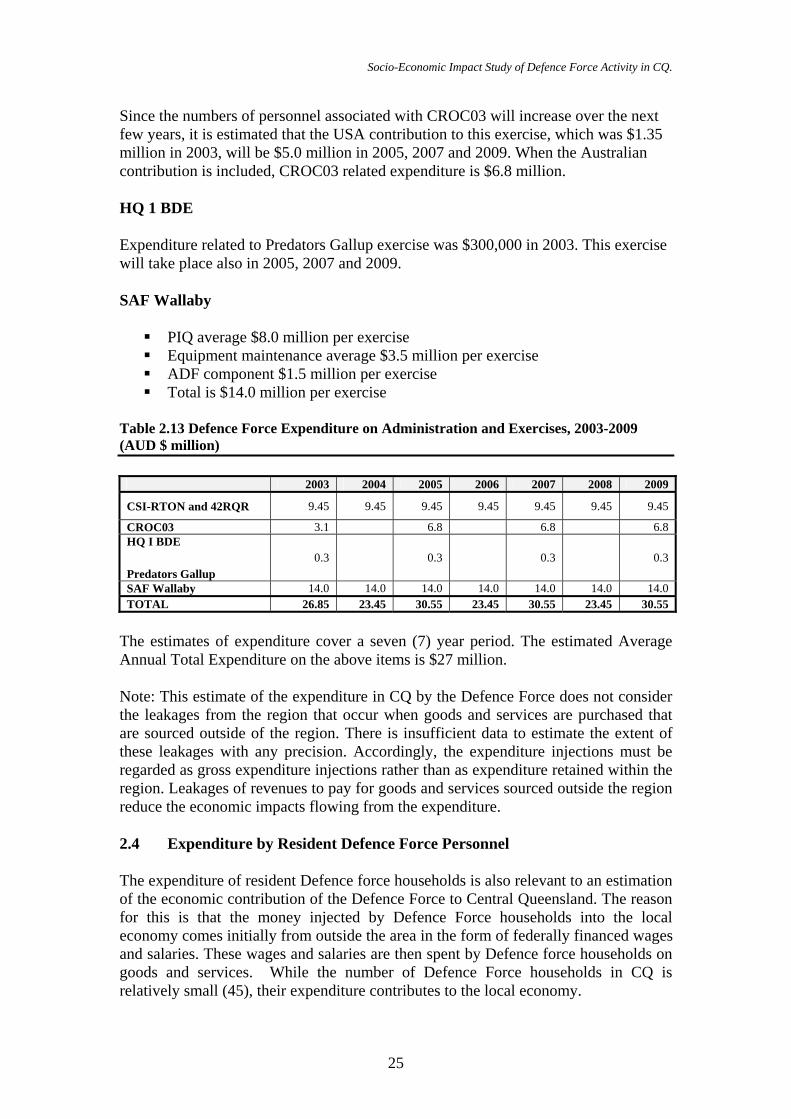
Socio-Economic Impact Study of Defence Force Activity in CQ.
25
Since the numbers of personnel associated with CROC03 will increase over the next few years, it is estimated that the USA contribution to this exercise, which was $1.35 million in 2003, will be $5.0 million in 2005, 2007 and 2009. When the Australian contribution is included, CROC03 related expenditure is $6.8 million.
HQ 1 BDE
Expenditure related to Predators Gallup exercise was $300,000 in 2003. This exercise will take place also in 2005, 2007 and 2009.
SAF Wallaby
PIQ average $8.0 million per exercise Equipment maintenance average $3.5 million per exercise ADF component $1.5 million per exercise Total is $14.0 million per exercise
Table 2.13 Defence Force Expenditure on Administration and Exercises, 2003-2009 (AUD $ million)
2003 2004 2005 2006 2007 2008 2009
CSI-RTON and 42RQR 9.45 9.45 9.45 9.45 9.45 9.45 9.45
CROC03 3.1 6.8 6.8 6.8 HQ I BDE
Predators Gallup 0.3 0.3 0.3 0.3
SAF Wallaby 14.0 14.0 14.0 14.0 14.0 14.0 14.0 TOTAL 26.85 23.45 30.55 23.45 30.55 23.45 30.55
The estimates of expenditure cover a seven (7) year period. The estimated Average Annual Total Expenditure on the above items is $27 million.
Note: This estimate of the expenditure in CQ by the Defence Force does not consider the leakages from the region that occur when goods and services are purchased that are sourced outside of the region. There is insufficient data to estimate the extent of these leakages with any precision. Accordingly, the expenditure injections must be regarded as gross expenditure injections rather than as expenditure retained within the region. Leakages of revenues to pay for goods and services sourced outside the region reduce the economic impacts flowing from the expenditure.
2.4 Expenditure by Resident Defence Force Personnel
The expenditure of resident Defence force households is also relevant to an estimation of the economic contribution of the Defence Force to Central Queensland. The reason for this is that the money injected by Defence Force households into the local economy comes initially from outside the area in the form of federally financed wages and salaries. These wages and salaries are then spent by Defence force households on goods and services. While the number of Defence Force households in CQ is relatively small (45), their expenditure contributes to the local economy.
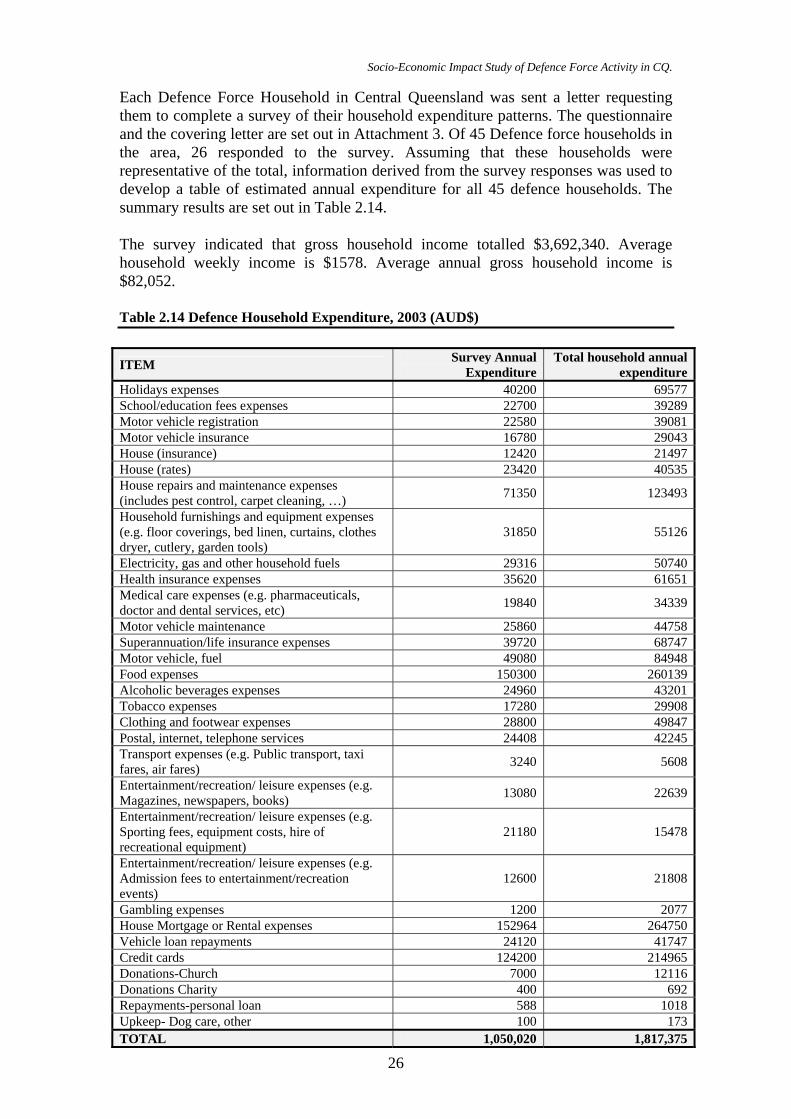
Socio-Economic Impact Study of Defence Force Activity in CQ.
26
Each Defence Force Household in Central Queensland was sent a letter requesting them to complete a survey of their household expenditure patterns. The questionnaire and the covering letter are set out in Attachment 3. Of 45 Defence force households in the area, 26 responded to the survey. Assuming that these households were representative of the total, information derived from the survey responses was used to develop a table of estimated annual expenditure for all 45 defence households. The summary results are set out in Table 2.14.
The survey indicated that gross household income totalled $3,692,340. Average household weekly income is $1578. Average annual gross household income is $82,052.
Table 2.14 Defence Household Expenditure, 2003 (AUD$)
ITEM Survey Annual Expenditure
Total household annual expenditure
Holidays expenses 40200 69577School/education fees expenses 22700 39289Motor vehicle registration 22580 39081Motor vehicle insurance 16780 29043House (insurance) 12420 21497House (rates) 23420 40535House repairs and maintenance expenses (includes pest control, carpet cleaning, …) 71350 123493
Household furnishings and equipment expenses (e.g. floor coverings, bed linen, curtains, clothes dryer, cutlery, garden tools)
31850 55126
Electricity, gas and other household fuels 29316 50740Health insurance expenses 35620 61651Medical care expenses (e.g. pharmaceuticals, doctor and dental services, etc) 19840 34339
Motor vehicle maintenance 25860 44758Superannuation/life insurance expenses 39720 68747Motor vehicle, fuel 49080 84948Food expenses 150300 260139Alcoholic beverages expenses 24960 43201Tobacco expenses 17280 29908Clothing and footwear expenses 28800 49847Postal, internet, telephone services 24408 42245Transport expenses (e.g. Public transport, taxi fares, air fares) 3240 5608
Entertainment/recreation/ leisure expenses (e.g. Magazines, newspapers, books) 13080 22639
Entertainment/recreation/ leisure expenses (e.g. Sporting fees, equipment costs, hire of recreational equipment)
21180 15478
Entertainment/recreation/ leisure expenses (e.g. Admission fees to entertainment/recreation events)
12600 21808
Gambling expenses 1200 2077House Mortgage or Rental expenses 152964 264750Vehicle loan repayments 24120 41747Credit cards 124200 214965Donations-Church 7000 12116Donations Charity 400 692Repayments-personal loan 588 1018Upkeep- Dog care, other 100 173TOTAL 1,050,020 1,817,375
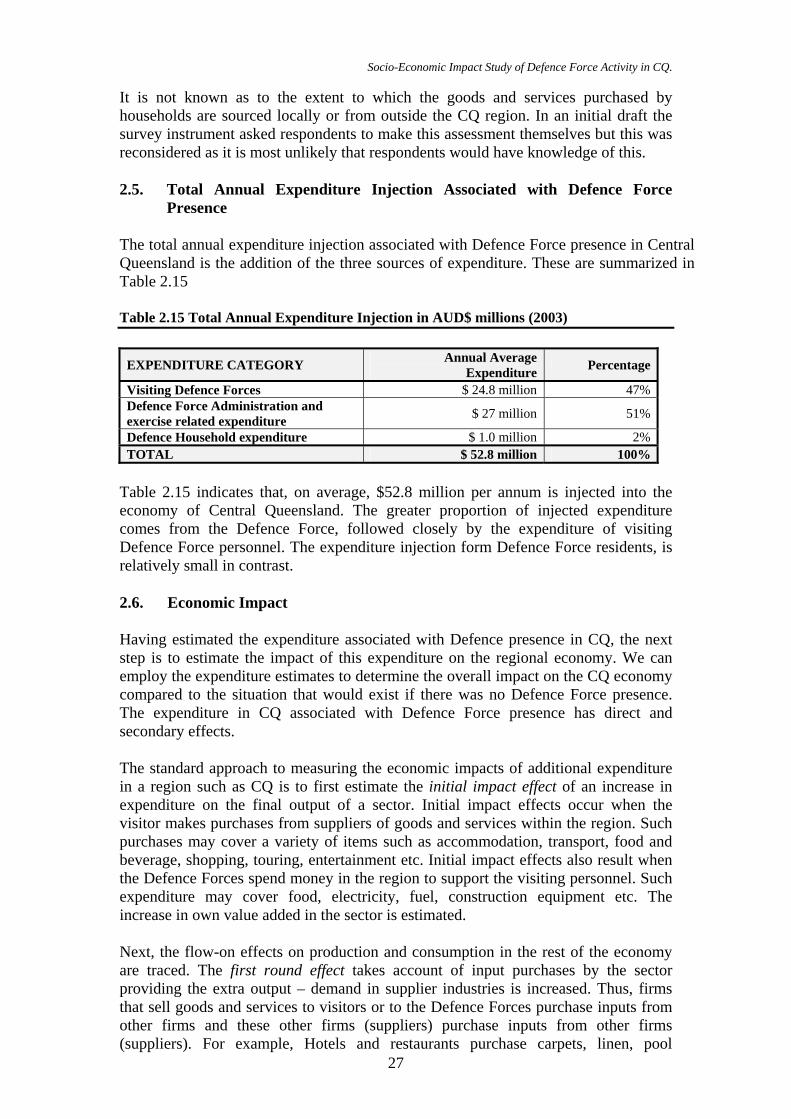
Socio-Economic Impact Study of Defence Force Activity in CQ.
27
It is not known as to the extent to which the goods and services purchased by households are sourced locally or from outside the CQ region. In an initial draft the survey instrument asked respondents to make this assessment themselves but this was reconsidered as it is most unlikely that respondents would have knowledge of this.
2.5. Total Annual Expenditure Injection Associated with Defence Force Presence
The total annual expenditure injection associated with Defence Force presence in Central Queensland is the addition of the three sources of expenditure. These are summarized in Table 2.15
Table 2.15 Total Annual Expenditure Injection in AUD$ millions (2003)
EXPENDITURE CATEGORY Annual Average Expenditure Percentage
Visiting Defence Forces $ 24.8 million 47% Defence Force Administration and exercise related expenditure $ 27 million 51%
Defence Household expenditure $ 1.0 million 2% TOTAL $ 52.8 million 100%
Table 2.15 indicates that, on average, $52.8 million per annum is injected into the economy of Central Queensland. The greater proportion of injected expenditure comes from the Defence Force, followed closely by the expenditure of visiting Defence Force personnel. The expenditure injection form Defence Force residents, is relatively small in contrast.
2.6. Economic Impact
Having estimated the expenditure associated with Defence presence in CQ, the next step is to estimate the impact of this expenditure on the regional economy. We can employ the expenditure estimates to determine the overall impact on the CQ economy compared to the situation that would exist if there was no Defence Force presence. The expenditure in CQ associated with Defence Force presence has direct and secondary effects.
The standard approach to measuring the economic impacts of additional expenditure in a region such as CQ is to first estimate the initial impact effect of an increase in expenditure on the final output of a sector. Initial impact effects occur when the visitor makes purchases from suppliers of goods and services within the region. Such purchases may cover a variety of items such as accommodation, transport, food and beverage, shopping, touring, entertainment etc. Initial impact effects also result when the Defence Forces spend money in the region to support the visiting personnel. Such expenditure may cover food, electricity, fuel, construction equipment etc. The increase in own value added in the sector is estimated.
Next, the flow-on effects on production and consumption in the rest of the economy are traced. The first round effect takes account of input purchases by the sector providing the extra output – demand in supplier industries is increased. Thus, firms that sell goods and services to visitors or to the Defence Forces purchase inputs from other firms and these other firms (suppliers) purchase inputs from other firms (suppliers). For example, Hotels and restaurants purchase carpets, linen, pool
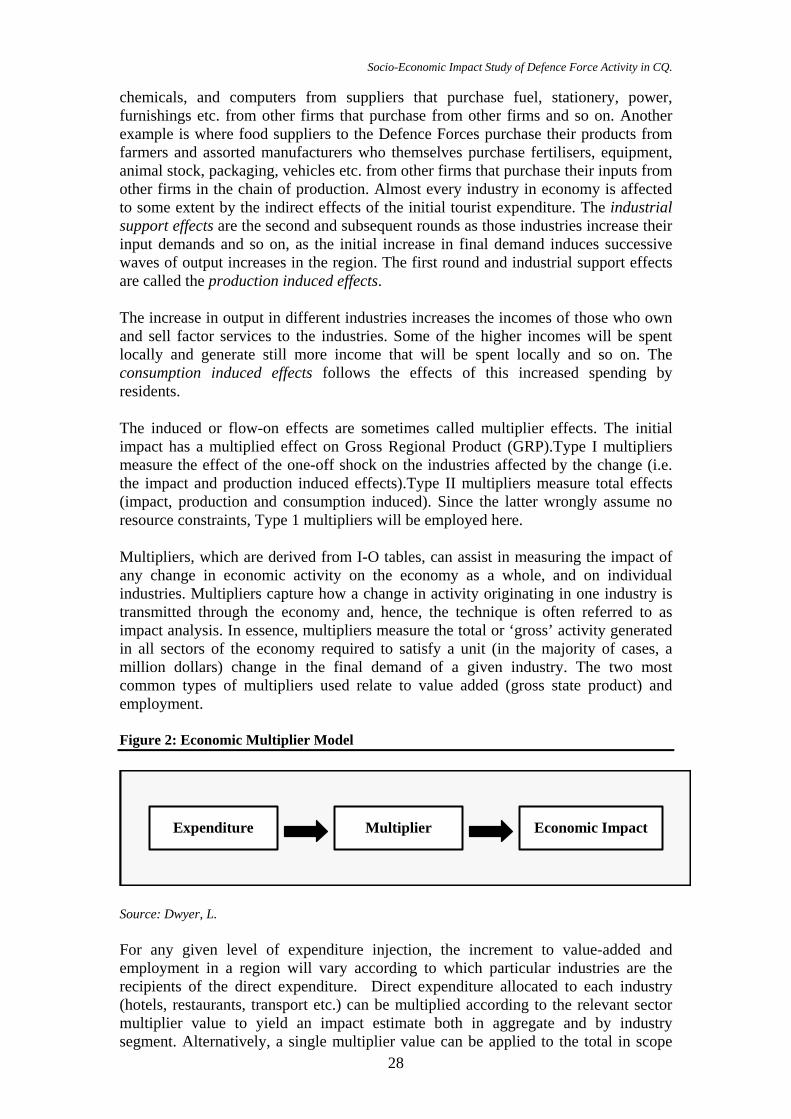
Socio-Economic Impact Study of Defence Force Activity in CQ.
28
chemicals, and computers from suppliers that purchase fuel, stationery, power, furnishings etc. from other firms that purchase from other firms and so on. Another example is where food suppliers to the Defence Forces purchase their products from farmers and assorted manufacturers who themselves purchase fertilisers, equipment, animal stock, packaging, vehicles etc. from other firms that purchase their inputs from other firms in the chain of production. Almost every industry in economy is affected to some extent by the indirect effects of the initial tourist expenditure. The industrial support effects are the second and subsequent rounds as those industries increase their input demands and so on, as the initial increase in final demand induces successive waves of output increases in the region. The first round and industrial support effects are called the production induced effects.
The increase in output in different industries increases the incomes of those who own and sell factor services to the industries. Some of the higher incomes will be spent locally and generate still more income that will be spent locally and so on. The consumption induced effects follows the effects of this increased spending by residents.
The induced or flow-on effects are sometimes called multiplier effects. The initial impact has a multiplied effect on Gross Regional Product (GRP).Type I multipliers measure the effect of the one-off shock on the industries affected by the change (i.e. the impact and production induced effects).Type II multipliers measure total effects (impact, production and consumption induced). Since the latter wrongly assume no resource constraints, Type 1 multipliers will be employed here.
Multipliers, which are derived from I-O tables, can assist in measuring the impact of any change in economic activity on the economy as a whole, and on individual industries. Multipliers capture how a change in activity originating in one industry is transmitted through the economy and, hence, the technique is often referred to as impact analysis. In essence, multipliers measure the total or ‘gross’ activity generated in all sectors of the economy required to satisfy a unit (in the majority of cases, a million dollars) change in the final demand of a given industry. The two most common types of multipliers used relate to value added (gross state product) and employment.
Figure 2: Economic Multiplier Model
Expenditure Multiplier Economic ImpactExpenditure Multiplier Economic Impact
Source: Dwyer, L.
For any given level of expenditure injection, the increment to value-added and employment in a region will vary according to which particular industries are the recipients of the direct expenditure. Direct expenditure allocated to each industry (hotels, restaurants, transport etc.) can be multiplied according to the relevant sector multiplier value to yield an impact estimate both in aggregate and by industry segment. Alternatively, a single multiplier value can be applied to the total in scope

Socio-Economic Impact Study of Defence Force Activity in CQ.
29
expenditure. The latter approach is adopted here. The reason for this is that very little detailed information is available as to the specific sectors in CQ that are the recipients of the direct expenditure, particularly as regards Defence Force Administration and exercise related expenditure. This category of expenditure represents the largest injection of Defence Force related expenditure into CQ. To arbitrarily allocate the expenditure to specific sectors would give a misleading impression of precision unwarranted by the data available.
The Queensland Government Statistician, Office of Economic and Statistical Research has recently developed preliminary I-O tables will be available for each regions of Queensland, including Fitzroy. When published these tables are available at a 35 or 107 level of industry desegregation with seven demand and six primary inputs categories. These preliminary I-0 tables enable an estimation to be made of the economic impacts of the Defence Force presence in the CQ region.
For Government Administration and Defence the value-added multiplier is 0.8 comprised as follows:
Initial Impact Effect: 0.6
Industrial Support Effect: 0.2
The employment multiplier is 13.8 comprised as follows:
Initial Impact Effect: 11.1
Industrial Support Effect: 2.7
It is important to acknowledge from the outset that multiplier or impact analysis provides indicative results only. Due to the several assumptions associated with I-O methodology, the relevance and application of impact analysis using multipliers must be treated on a case by case basis, requiring caution to be exercised when interpreting the results of such analysis. As such, a clear understanding of the assumptions underpinning I-O methodology and the limitations in the use of I-O tables and multipliers is essential for sound economic conclusions to be derived from impact analysis.
Recognising the limitations attached to using the above multipliers, the economic impacts of the estimated $52.8 m. average annual injected expenditure are as follows:
Impact on Value-added in Central Queensland-$42.24 m. The direct value added is $31.68 million with flow on effects of $10.56 m.
Impact on employment in Central Queensland- 728 full time equivalent jobs. 586 jobs are created directly while 142 jobs are created indirectly due to flow on effects in the regional economy.
As noted in the introductory section, tourism’s contribution to Gross Regional Product of the Fitzroy region was 246 million in 1999. Allowing for the different geographical boundaries an indicative estimate of the significance of the visiting Defence Force personnel is that it approximates between 10 per cent and 20 per cent of all tourism expenditure in the CQ region.
Socio-Economic Impact Study of Defence Force Activity in CQ.
30
It is likely that the economic impact of the Defence presence is greater than the estimates of increased GRP. Defence Force presence has led to flow on effects including the extension and deepening of the regions skill base, supporting industry growth, direct funding injections to the construction industry and a general expansion of business activity.
2.6.1 Enhancing the Economic Impacts
The economic impacts of the Defence Force presence can be increased if expenditure injection can be increased. The Defence Force presence annually makes a relatively large contribution to expenditure within Central Queensland, particularly with respect to injected expenditure associated with visiting Defence Force personnel and Defence Force expenditure. Since Defence Force expenditure and Defence Household expenditure are determined by factors beyond the control of either the Defence establishment or local businesses, we here focus briefly on some implications of the above for local industry.
There is potential for expenditure associated with Visiting Defence Force personnel through the provision of more spending opportunities with effective advertising and promotion of these products and services. This would require local businesses to become more proactive in developing such opportunities when visitors are present. (see Table 2.5), indicates that there is a high average expenditure per visitor on a variety of items, particularly, accommodation, shopping, and food and beverage. Other items also, such as general activities, adult entertainment and other transport (eg. coach) are in good demand. While the survey results do not reveal the scope for additional purchases on any particular items, it appears that local businesses do have a firm demand base upon which to further develop revealed purchasing patterns.
In terms of location of expenditure the survey results indicate that all sub-regions of CQ benefit from the visitor expenditure. While Rockhampton receives the bulk of the expenditure (around one third) the other regions each also receive around 7-9 per cent of the total expenditure. This indicates that no sub-region should be excluded from strategy development to access greater expenditure from visiting personnel.
The extent to which additional gains will be realised will depend upon the initiatives undertaken by local businesses. There is evidence world-wide as to the benefits of cooperation and collaboration between firms, creating a ‘win-win’ situation for participants. Local business associations can play a valuable role in coordination such activity.
Recommendation 2.0 In order to maintain the current level of economic contribution to the CQ economy all stakeholders
need to continue to be entrepreneurial and sell their goods and services to Defence Force Personnel
and maximise this activity to the extent possible by sourcing such products locally
Socio-Economic Impact Study of Defence Force Activity in CQ.
31
Chapter 3.
Community Attitudes and Social Impacts
3.0 Overview
Attitudes of Central Queensland residents towards the presence of military personnel in the region were characterised by beliefs about the positive economic and cultural contributions of such visits. However, some fears were also expressed about the potential for negative consequences. On the whole, attitudes tended to be somewhat positive. It may be possible in the future to enhance community perceptions by improving common knowledge about the exercises.
This chapter is divided into the key sections identified in the telephone survey. It begins with a brief demographic outline of those surveyed, and then proceeds to summarise the key findings from the survey. Full analysis of the survey, and all data collected can be found in either the Attachments or CD-Rom that accompanies this report.
3.1 Demographic Snapshot
The telephone survey, conducted by the Population Research Laboratory at the Centre for Social Science Research at CQU, was held between 22nd September and 5th October 2003. This was undertaken to directly coincide with the peak of the US visitors.
1,270 individuals were interviewed residing in either the Rockhampton or the Capricorn Coast district. In Rockhampton 845 individuals (422 males/423 females) and in Capricorn Coast 428 individuals (216 males/212 females) were interviewed.
The majority were Australian citizens, and over 50 per cent had lived in CQ for over 20 years. Of those interviewed, 55 per cent were married; 40 per cent were employed; and 19.5 per cent were retired. Forty percent identified as having children still living at home. The majority had at least a secondary education. There was a variety of gross income (10 per cent to $199 per week; 29.3 per cent between $200 and $499 per week; 28.6 per cent between $500 and $999 per week and the balance over $1,000. The majority (22.8 per cent) identified their current occupation as ‘Professional’.
3.2 Knowledge of Department of Defence activities
Summary: People know that Defence undertakes activities in the region, however not everyone is aware of which countries are participating and when activities occur.
The majority (92.8 per cent) stated that they were aware of Defence activities in the region prior to being telephoned and that they had known of these activities for some time (91.4 per cent). Of these, most identified TV as their major information source (35.5 per cent) with 20.2 per cent identifying newspaper (The Morning Bulletin). Asked which countries were involved in these activities 52 per cent identified the United States; 20.1 per cent identified Australia and 22.7 per cent identified

Socio-Economic Impact Study of Defence Force Activity in CQ.
32
Singapore. Only 3.7 per cent stated that they did not know. When asked if there were times they were more aware of activities than others – 61.2 per cent stated yes. When asked which month most activity was conducted, the majority 73.5 per cent stated September. (It should be noted again that the survey was conducted in September and the US was visiting). Interestingly, the times when Singapore was visiting (i.e. October – December) were not stated as high activity times.
When asked if they were aware of the current activity underway – i.e. Crocodile 2003 – the majority said yes (89.6 per cent). However when asked who was involved in this activity – only 2.1 per cent stated United States – the majority 60.1 per cent stated Australia, and some 33.5 per cent stated that they did not know. When asked how they had heard about the current activity – the majority again stated TV (41.7 per cent) and newspaper (24.7 per cent). Interestingly some 14.1 per cent identified ‘word of mouth’ as their major source. While 50 per cent agreed that community consultation had been adequate, some 17 per cent were neutral and nearly 25 per cent rejected this statement.
3.3 Attitudes towards Economic Benefits
Summary: Defence activities in the region are seen as major economic boosters of both diversity and capacity for jobs. Defence activity is seen as a supporter of local businesses as well as a catalyst for improved infrastructure spending. Attitudes towards Defence activities on individuals identified a range of views regarding the benefits for individuals and the capacity to increase income for some. Majority of people rejected the suggestion that cost of living rises occurred because of Defence activities or that these made excessive demands on public services and facilities.
Over 62 per cent agreed that the use of public funds for Defence activities in the CQ region was justified by the benefits it brought to the region. The use of such funds in infrastructure development was also seen as justified by the benefits it brought in (62 per cent).
When asked whether they agreed or disagreed that Defence activities brought economic benefits to the region, 85.2 per cent either agreed or strongly agreed. 80.3 per cent agreed that Defence activities contribute to the strength and diversity of the local economy. Nearly 80 per cent agreed that local businesses get a real boost from Defence activities, while only 13 per cent agreed that such economic benefits were overrated. The majority (53 per cent) agreed that Defence activities improved investment spending in the CQ economy and a similar percentage agreed that Defence activities help diversity business activity in the region.
Only 32 per cent agreed that Defence activities helped to expand the local economy’s base and the majority (70 per cent) rejected the suggestion that Defence activities created economic dependency on one industry.
There was little support for the suggestion that Defence activities resulted in increased prices for local residents, while the majority agreed (60 per cent) that Defence activities create employment opportunities in the region.
There was a general spread throughout the respondents about the benefit of Defence activities for individuals, with a small majority (40 per cent) agreeing that such
Socio-Economic Impact Study of Defence Force Activity in CQ.
33
benefit was broadly spread. Most people disagreed with the suggestion that Defence activities reduced the gap between rich and poor, or that such activities increased the cost of living for the broader community. Most people also rejected (over 70 per cent) the suggestion that Defence activities made excessive demands on public services and facilities.
3.4 Attitudes towards Environmental Impacts
Summary: People understand where activities are conducted and that such activities are assisting in the conservation of the natural environment and the majority agreed that traffic and noise pollution were not an issue. There was a strong (85 per cent) rejection of the suggestion that further activities would disadvantage the community and they should be discouraged.
An overwhelming majority of respondents knew that the activities occurred in the Shoalwater Bay area of the region, and some 60 per cent knew that this was a jointly managed facility. Just over 50 per cent agreed that Defence activities have ensured conservation of natural environments in training locations and just under 50 per cent rejected the suggestion that such activities resulted in damage to the natural environment, specifically the marine environment (44 per cent). A majority (67 per cent) agreed that the Shoalwater Bay training area should be restricted by Defence activities.
The majority of people rejected the suggestion that Defence activities increased noise pollution or caused traffic congestion. Respondents were relatively evenly spread on the suggestion that Defence activities increased the quality of life in the region – with around 35 per cent disagreeing; 24 per cent neutral and 35 per cent agreeing. People were evenly spread regarding the future of environmental management of the Shoalwater Bay relying on Defence activities.
Recommendation 3.1 In communicating the nature of each activity Defence could identify the participating countries clearly.
Recommendation 3.2 In communicating with the local community, Defence need to consider TV and newspaper as the major sources of local knowledge.
Recommendation 3.3 More publicity regarding the community work undertaken by the visitors while in the region should be considered.

Socio-Economic Impact Study of Defence Force Activity in CQ.
34
3.5 Attitudes towards Quality of Life impacts
Summary: On balance, most people felt that the visits impacted neutrally or positively on their quality of life. They enjoyed the pride of showing off their region to the visitors, and felt that the exchange of cultures was a positive aspect. However, while many people appeared keen to meet or see such visitors, they then appeared reluctant to increase their families’ potential contact with the visitors.
An overwhelming majority of people (nearly 90 per cent) rejected the suggestion that Defence activities were an intrusion on their way of life, or that such activities interrupted the peace and tranquillity of the region (82 per cent). Most people (84 per cent) disagreed with the suggestion that longer queues and delays in services were the result of having service personnel in the region. In regard to crime rates or levels of tension in the community, the majority rejected any suggestions of increases as a result of the visitors. However people rejected the idea that such activities actually reduced crime rates (58 per cent). Most people (55 per cent) disagreed with the suggestion that the visitors reduced the level of violence in the region, while there was some agreement that the activities have contributed to the safety of the region (47 per cent). There was a rejection that the presence of visitors increase drug and alcohol abuse (66 per cent) or that they increased social problems (68 per cent).
There was also a rejection to the suggestion that such visits undermined the Australian culture, rather the majority (83 per cent) agreed that the visits offered opportunities to learn about other people and their cultures and 76 per cent agreed that such interaction increased understanding between different cultures. Respondents were evenly spread that such visits made CQ a more interesting and exciting place in which to live.
The majority (around 57 percent) agreed that such visits enriched the cultural of the region. There was a supportive view to the suggestion that local communities should do more to interact with the visitors (82 per cent) and that there should be more opportunities for greater interaction (82 percent) as such visitors promoted better understanding of foreign cultures (73 per cent). Such visits contributed to the pride of local residents in the region agreed some 53 per cent of respondents and a majority (59 per cent) agreed with the suggestion that such interaction contributes to overall community pride. Some 77 per cent agreed that the visits enabled opportunities for cultural exchanges and increased social interaction opportunities (76 per cent).
In response to the question about local businesses and that they could cater better to the needs of the visitors, respondents were divided – around 26 per cent disagreeing; 26 per cent neutral and 38 per cent agreeing. There was a similarly even spread in responses to the suggestion that recreational and leisure opportunities were inadequate to cater to the needs of the visitors and whether such visits increases the availability of recreation facilities. About 48 per cent agreed that such visitors increase opportunities for community functions, such as festivals, fairs etc. Around 50 per cent of respondents agreed that the visits contributed to community works while they were relatively evenly spread on response to the suggestion that such community work improved the quality of life of residents. However people were evenly spread as to whether the visitors were involved in park beautification, restoration of public facilities etc. while in the region.

Socio-Economic Impact Study of Defence Force Activity in CQ.
35
Respondents saw the opportunity that such visitors offered to promoting civic involvement and local pride in the region (69 per cent) and enhance pride in local cultural traditions (63 per cent). Many saw the visitors as an opportunity to support better communications between nationalities (77 per cent) and personal interaction opportunities were also enhanced (74 per cent).
People disagreed with the suggestion that such visitors created a more hectic community lifestyle (71 per cent) or that competition for existing facilities was heightened (66 per cent).
A majority (57 per cent) of respondents said that they had had some form of contact with the visitors – however some 42 per cent had not. Of those who had contact, the majority had it either through business or through recreation, and this was either a positive or highly positive experience. Only about 9 per cent of respondents agreed that their job was directly involved with the visits, so this would imply that most contact was of a voluntary – rather than paid – nature.
The majority were positive in wanting to see or meet such visitors (57 per cent) while the majority also felt that the visits enabled the creation of a positive image of their community to others (59 per cent). People were evenly spread on the suggestion that Defence activities preserved their way of life, with a majority disagreeing that Defence activities and personnel ensure their personal quality of life (48 per cent).
There was a majority who rejected the suggestion that their family might like to get more involved with Defence personnel (44 per cent) while the majority (73 per cent) agreed that the visitors respected their way of life.
3.6 Conclusions on Community Attitudes and Social Impacts
Drawing from a factor analysis of the above data, residents were slightly positive about the economic benefits from the exercises and were somewhat more enthusiastic about the potential for contact with other cultures. While fears were expressed by some, on average fears were not particularly strong. However there can be seen a relationship between such fears, and a lack of knowledge about the exercises. For example, people did not know what countries were involved, and in addition, those who heard of the exercises through word of mouth were more fearful than those who heard of it through the radio.

Socio-Economic Impact Study of Defence Force Activity in CQ.
36
Chapter Four
Leisure, Recreational Opportunities/Experiences and CQ Facilities
4.0 Background
During stand down time or time off, visiting Defence personnel have the opportunity to participate in leisure and recreational activities. The amount of stand down time differs between visiting Defence personnel groups. The majority of Australian Defence personnel have no periods of stand down time as these personnel are transported into and out of the SWTA directly and do not have the opportunity to engage in leisure or recreational activities in the CQ region. The Singaporean Defence personnel have minimal free time, generally two days or less, whilst the American personnel have greater opportunity for recreation as the mode for stand down time was 3-5 days. Those Australian personnel who reported stand down time exhibited a modal response of 3-5 days.
In reporting the findings in this chapter, the valid percentage is reported. That is the percentage reported is the percentage determined following the removal of missing data. As this varies from question and response set, readers are referred to the volume of supplementary materials for fuller details regarding each of the findings reported herein.
4.1 Military perspective of leisure and recreation opportunities and experiences in CQ
The Singaporean Defence personnel have varying amounts of time to engage in leisure and recreational opportunities in CQ region. The majority (86.9per cent) of personnel in 2002 reported two days or less for such opportunities. The range for leisure and recreational opportunities varied between less than one day to more than 2 weeks. A similar pattern was reported for visitation in 2003 by Singaporean personnel.
American personnel on the other hand, had greater opportunity for leisure and recreational experiences, the mode for amount of stand down time was 3-5 days.
Table 4.1 Overall Time Off-Duty by US Personnel (2003)
Frequency Percent (%)
Valid Percent (%)
Cumulative Percent (%)
Valid Less than one day 78 4.1 4.1 4.1 1 day 58 3.0 3.1 7.2 2 days 107 5.6 5.7 12.9 3-5days 728 38.1 38.6 51.4 6-7days 283 14.8 15.0 66.4 8-10 days 299 15.6 15.8 82.3 2 weeks 181 9.5 9.6 91.8 more than 2 weeks 154 8.1 8.2 100.0 Total 1888 98.7 100.0 Missing System 24 1.3 TOTAL 1912 100.0
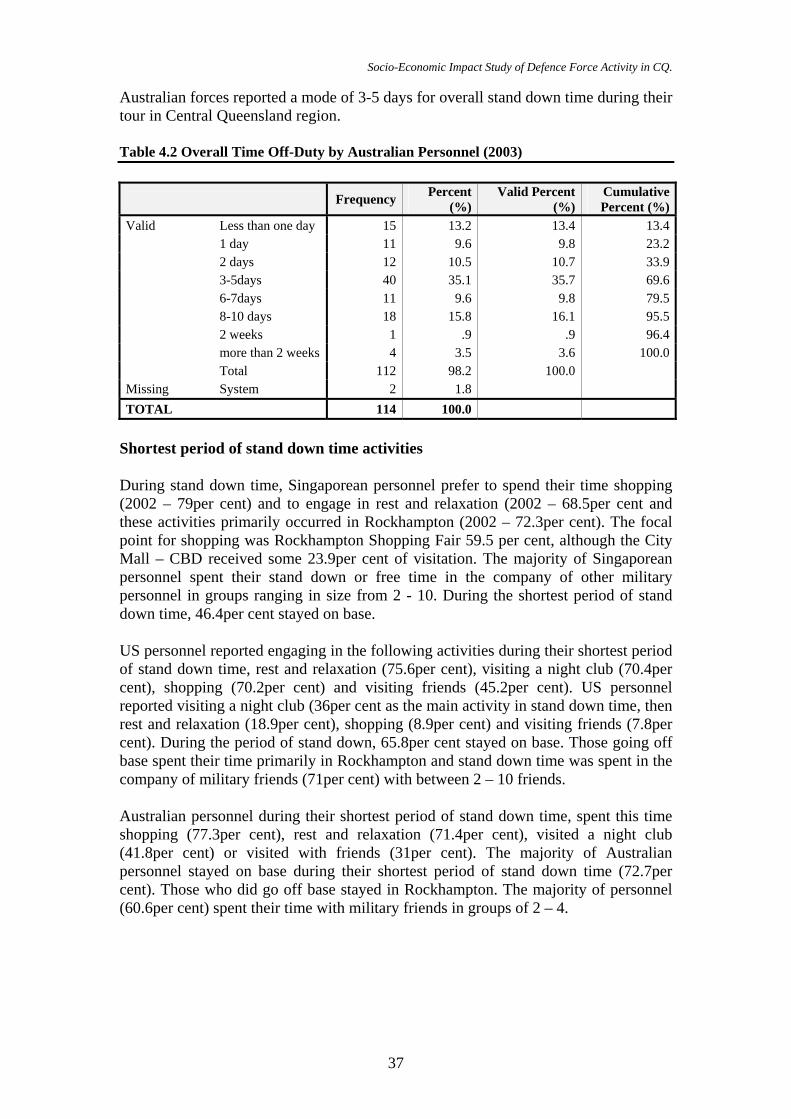
Socio-Economic Impact Study of Defence Force Activity in CQ.
37
Australian forces reported a mode of 3-5 days for overall stand down time during their tour in Central Queensland region.
Table 4.2 Overall Time Off-Duty by Australian Personnel (2003)
Frequency Percent (%)
Valid Percent (%)
Cumulative Percent (%)
Valid Less than one day 15 13.2 13.4 13.4 1 day 11 9.6 9.8 23.2 2 days 12 10.5 10.7 33.9 3-5days 40 35.1 35.7 69.6 6-7days 11 9.6 9.8 79.5 8-10 days 18 15.8 16.1 95.5 2 weeks 1 .9 .9 96.4 more than 2 weeks 4 3.5 3.6 100.0 Total 112 98.2 100.0 Missing System 2 1.8 TOTAL 114 100.0
Shortest period of stand down time activities
During stand down time, Singaporean personnel prefer to spend their time shopping (2002 – 79per cent) and to engage in rest and relaxation (2002 – 68.5per cent and these activities primarily occurred in Rockhampton (2002 – 72.3per cent). The focal point for shopping was Rockhampton Shopping Fair 59.5 per cent, although the City Mall – CBD received some 23.9per cent of visitation. The majority of Singaporean personnel spent their stand down or free time in the company of other military personnel in groups ranging in size from 2 - 10. During the shortest period of stand down time, 46.4per cent stayed on base.
US personnel reported engaging in the following activities during their shortest period of stand down time, rest and relaxation (75.6per cent), visiting a night club (70.4per cent), shopping (70.2per cent) and visiting friends (45.2per cent). US personnel reported visiting a night club (36per cent as the main activity in stand down time, then rest and relaxation (18.9per cent), shopping (8.9per cent) and visiting friends (7.8per cent). During the period of stand down, 65.8per cent stayed on base. Those going off base spent their time primarily in Rockhampton and stand down time was spent in the company of military friends (71per cent) with between 2 – 10 friends.
Australian personnel during their shortest period of stand down time, spent this time shopping (77.3per cent), rest and relaxation (71.4per cent), visited a night club (41.8per cent) or visited with friends (31per cent). The majority of Australian personnel stayed on base during their shortest period of stand down time (72.7per cent). Those who did go off base stayed in Rockhampton. The majority of personnel (60.6per cent) spent their time with military friends in groups of 2 – 4.
Socio-Economic Impact Study of Defence Force Activity in CQ.
38
Longest period of stand down time
As was the case in the shortest period of stand down time, Singaporean personnel prefer to spend their time shopping (2002 – 78per cent) and to engage in rest and relaxation (2002 – 53per cent) and these activities primarily occurred in Rockhampton (2002 – 73.3per cent). The focal point for shopping, again, was Rockhampton Shopping Fair (59.5 per cent), although the City Mall – CBD received some 23.9per cent of visitation. The majority of Singaporean personnel (86per cent) spent their stand down or free time in the company of other military personnel in groups ranging in size from 2 - 10. Limited visitation was reported to a number of Rockhampton tourist attractions, such as the Dreamtime Centre, the Heritage Village, Botanic Gardens and Zoo. Organised travel to the Capricorn Coast occurred with most visitations being centred on Rydges, the Cedars Shopping Centre, as well as downtown Yeppoon. Only 18.8per cent spent their time on base. Sporting and night life entertainment were not high priorities for the Singaporean visiting Defence personnel. The majority of Singaporean Defence personnel were satisfied with their leisure time experiences in Central Queensland (Moderately to very satisfied – 74.6per cent). The same pattern was evident in 2003 data.
During the longest period of stand down time, US personnel reported visiting a night club (72.1per cent), shopping (69.1per cent), rest and relaxation (65.3per cent), and visiting friends (49.7per cent). In this period of stand down only 8.9per cent stayed on base. Those going off base spent their time primarily in Rockhampton (35.9per cent). Stand down time was spent in the company of military friends (71.9per cent) with between 2 – 6 friends. Leisure time was spent in the Botanic Gardens/Zoo (26.8per cent), 18.2per cent went to the gym, 12.4per cent and 12.3per cent respectively visited the Yeppoon/Emu Park beaches and Great Keppel Island. Shopping in Yeppoon/Emu Park areas drew 21.4per cent of US personnel. Shopping in Rockhampton centred on the City Mall CBD (51.6per cent) and the Rockhampton Shopping Fair (24.6per cent).
Australian Defence personnel spent their longest period of stand down time shopping (68.2per cent), rest and relaxation (59.1per cent), visiting a night club (37.6per cent) or visiting friends (31.5per cent). As was the pattern for the shortest period of time, stand down time was spent in Rockhampton (39.8per cent) in the company of military friends (52.9per cent) in groups of 2-4 people. Australian Defence personnel spent their leisure time in Rockhampton in the Quay ST precinct CBD (21.6per cent) and shopping was undertaken at the Rockhampton Shopping Mall (38.9per cent) and the City Mall (33per cent). Swimming and team sports were the main leisure activities in which Australian Defence personnel engaged in the Rockhampton area. Yeppoon/Emu Park drew personnel for the beaches (13.5per cent), swimming (12.7per cent), and shopping (22.9per cent).
4.2 Overall experience in CQ
This section reports on the nature of welcomeness experienced in CQ, the presence of discriminatory practices, the impact of such discriminatory practices on memory of Central Queensland, and propensity for future visitation to CQ for holidaying purposes as well as word of mouth recommendations.
In 2002, Singaporean Defence personnel commented that they felt welcomed in the region (46.5per cent reported being either moderately or very welcomed). Of note, is the fact that 20per cent reported racial discrimination. Sixty percent indicated that
Socio-Economic Impact Study of Defence Force Activity in CQ.
39
they would return to CQ while 62.7 per cent indicated that they would like to return as a tourist to the area. Moreover, 64per cent stated that they would recommend the area to friends.
In 2003, 70.5per cent of US personnel felt either moderately or very welcome in CQ region. In regard to racial discrimination 24per cent reported experiencing some form of discrimination. 56per cent reported that this did not impact on their memories of CQ and 44per cent reported negative impacts as a result of such discrimination. Despite this experience, 79per cent indicated that they would return to the CQ region as tourists and 75per cent stated they would recommend CQ as a tourist destination. In summation, 61.9per cent of US personnel, in 2003, were satisfied or very satisfied with their leisure time experiences in Central Queensland.
In 2003, Australian Defence personnel commented that 41.3per cent felt either moderately or very welcome. Thirteen percent experienced racial discrimination. 54.8per cent indicated that this did not impact on their memories of Central Queensland. Sixty eight percent said they would return as tourists and 70per cent indicated that they would let friends know of CQ as a tourist destination. In regard to overall satisfaction with leisure experiences, 70.6per cent were moderately to very satisfied with their experiences.
4.3 Resident perspectives on leisure opportunities
Resident perspective regarding the leisure and recreational opportunities for visiting Defence personnel has already been commented on in Chapter 3. However, of need of iteration is the perspective of residents that 37.7per cent perceived that local business could cater better to the needs of visiting Defence personnel and 31per cent agreed or strongly agreed that recreational and leisure opportunities are inadequate to cater to the needs of visiting Defence personnel during their time off. As already noted, the visiting Defence personnel have not resulted in a complimentary perceived increase in the availability of recreational facilities (41.6per cent). Furthermore, visiting Defence personnel do no promote competition between residents and visitors for available services, facilities and recreational opportunities (56.1per cent).
4.4 Conclusion
The visiting Defence personnel during their shortest time off will usually stay on base and recreate in the company of military friends in groups ranging from 2- 10. Rest and relaxation is a key leisure activity during stand down time. Those Defence personnel who do go off base will engage in shopping and visiting night clubs. The longest stand down time draws Defence personnel to the surrounding communities and the beach areas particularly. However, the majority of stand down time is focussed on Rockhampton. The chief leisure time activities are shopping, rest and relaxation and visiting night clubs. For all Defence personnel, stand down time is generally spent in the company of military friends in groups ranging from 2-10 people.
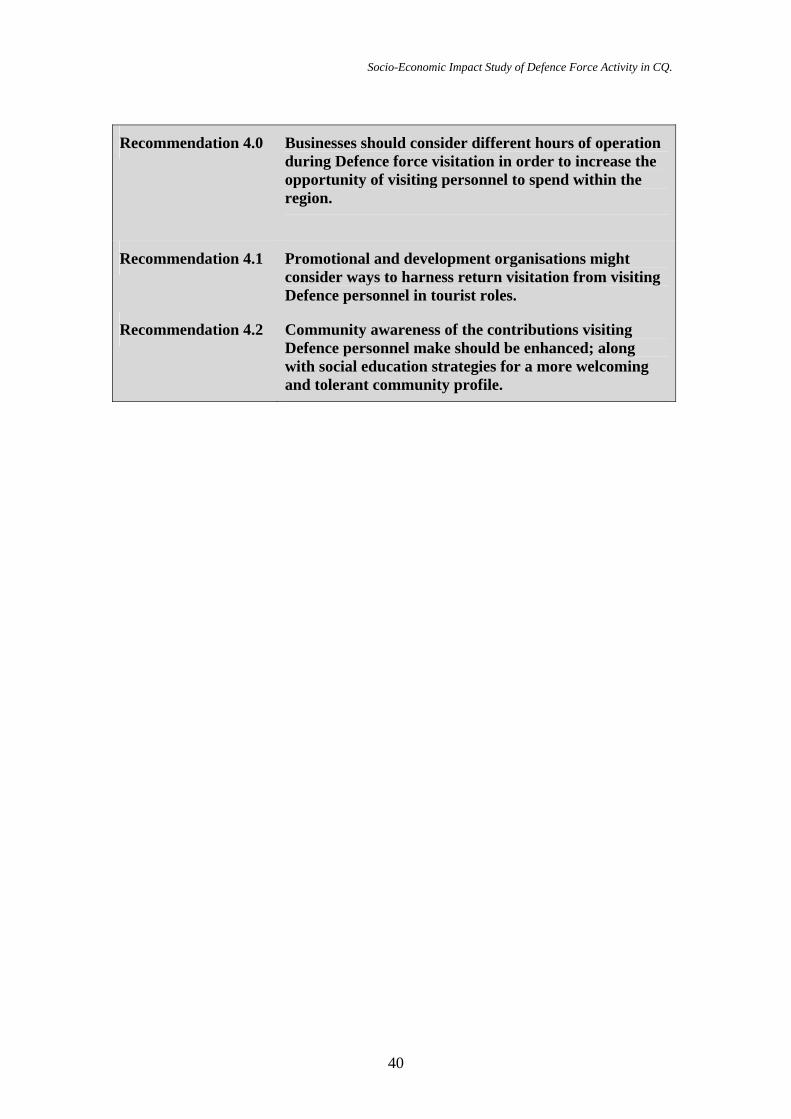
Socio-Economic Impact Study of Defence Force Activity in CQ.
40
Recommendation 4.0 Businesses should consider different hours of operation during Defence force visitation in order to increase the opportunity of visiting personnel to spend within the region.
Recommendation 4.1 Promotional and development organisations might consider ways to harness return visitation from visiting Defence personnel in tourist roles.
Recommendation 4.2 Community awareness of the contributions visiting Defence personnel make should be enhanced; along with social education strategies for a more welcoming and tolerant community profile.

Socio-Economic Impact Study of Defence Force Activity in CQ.
41
Chapter Five
The Final Summary
The socio-economic impact of Defence force activities in the Central Queensland region generates a significant positive impact from an economic perspective. The study found that visiting Defence personnel expenditure total expenditure by Singapore Defence Force personnel is $3,025,975. Of the $3,025,975 total spending of Singapore Defence Personnel respondents
$2,781,775 (92 per cent) was spend in Queensland $2,537,050 (84 per cent) was spent in Central Queensland. $244,200 (8 per cent) was spent outside Queensland.
Average spending per Singapore visitor was $1871.
Total expenditure by USA Defence Force personnel is $7,951,425. Of the $7,951,425 total spending:
$6,990,050 (88 per cent) was spend in Queensland $5,808,600 (73 per cent) was spent in Central Queensland. $961,375 (12 per cent) was spent outside Queensland.
The sub region in which the greatest proportion is spent is Rockhampton which receives $2.59 million (32.6 per cent) of the total. The rest of Queensland is the second largest recipient (14.9 per cent of expenditure) followed by rest of Australia. The CQ region which received the most expenditure after Rockhampton was Gladstone ($800,625 or 10.1 per cent).
Average spending per USA visitor was $3355.
The estimated Average Annual Total Expenditure on Administration and Exercises is $27 million.
The resident Defence survey indicated that gross household income totalled $3,692,340. Average household weekly income is $1578. Average annual gross household income is $82,052.
Further economic impact to be provided in the final report.
The social impact of the Defence force activities in the CQ region tends to generate more positive rather than negative impacts. To reiterate, attitudes of Central Queensland residents towards the presence of military personnel in the region are characterised by beliefs about the positive economic and cultural contributions of such visits. However, some fears were also expressed about the potential for negative consequences. On the whole, attitudes tended to be somewhat positive. It may be possible in the future, to enhance community perceptions by improving common knowledge about the exercises.
Socio-Economic Impact Study of Defence Force Activity in CQ.
42
Currently the leisure activities available to visiting Defence personnel are satisfactory. The majority of Defence personnel concentrate their leisure activities within the Rockhampton area. The beach and island areas exhibit drawing power for Yeppoon and Emu Park. The core activity for Singaporean, US and Australian Defence personnel is shopping.
Cultural interaction appears limited due Defence personnel choosing to recreate with military friends. A number of instances of racial discrimination were reported. In the main, this discrimination did not impact severely on the majority of Defence force personnel.
Visiting Defence forces to the CQ region have the propensity to generate a latent demand for return visitation to the area for tourist purposes. Business development and promotion needs to be conscious of such demand and consider ways to turn this latent demand into expressed demand. This is particularly the case, when from a promotional perspective, a majority of visiting Defence personnel will return home to speak of the region in a positive light and to recommend it as a tourist destination.
To summarise, the project found a positive attitude to defence from within the CQ community; a relatively positive attitude by our International visitors to their CQ experience, and a very positive economic impact of the whole of Defence activities.

Socio-Economic Impact Study of Defence Force Activity in CQ.
43
References
Queensland Treasury (1998) Queensland Input-Output Tables 1996-97, Office of Economic and Statistical Research
Queensland Treasury (2002). The Contribution of International and Domestic Expenditure to the Queensland Regional Economies: 1998-99, Office of Economic and Statistical Research, (May 2002).
Queensland Treasury (2004) Queensland Regional Profile 2003, Fitzroy Statistical Division, Office of Economic and Statistical Research www.oesr.qld.gov.au
Socio-Economic Impact Study of Defence Force Activity in CQ.
44
Glossary ABS Australian Bureau of Statistics CBD Central Business District CQ Central Queensland F&B Food & Beverage GRP Gross Regional Product SBTA Shoalwater Bay Training Area SPSS Statistical Package for the Social Sciences TGRP Tourism Gross Regional Product


