a. Social Responsibility b. Environment PASSION FOR...
123
Table of Contents 1. AmBev 2. Highlights 3. Message to shareholders 02 4. Map of Operations 04 5. Beer Brazil 07 6. Soft Drinks Brazil 11 7. Hispanic Latin America (HILA) 15 8. North America 19 9. Passion for Execution 23 10. Brands 26 11. Distribution 29 12. Cost Consciousness 33 13. Financial Discipline 36 14. Culture 38 15. AmBev People 42 16. Sustainability 47 a. Social Responsibility 48 b. Environment 52 c. Corporate Governance 56 17. Shares as an Investment 59 18. Our Team 60 19. Financial Section 62 2005 Annual Report 2005 Annual Report PASSION FOR EXECUTION
Transcript of a. Social Responsibility b. Environment PASSION FOR...

Table of Contents
1. AmBev2. Highlights3. Message to shareholders 024. Map of Operations 045. Beer Brazil 076. Soft Drinks Brazil 117. Hispanic Latin America (HILA) 158. North America 199. Passion for Execution 23
10. Brands 2611. Distribution 2912. Cost Consciousness 3313. Financial Discipline 3614. Culture 3815. AmBev People 4216. Sustainability 47
a. Social Responsibility 48b. Environment 52c. Corporate Governance 56
17. Shares as an Investment 5918. Our Team 6019. Financial Section 62
2005 Annual Report
2005A
nnual Report
PASSION FOR EXECUTION

AmBev
Present in 14 countriesof the Americas AmBev is the largest consumer goods company in Braziland Latin America’s largest brewer, with operations in 14 countries in the three Americas. Based upon a globalalliance with InBev, as of 2004 we became part of the world’s largest platform for the production andmarketing of beer. This association also made it possiblefor us to enter North America through the incorporationof the Canadian brewer Labatt and the internationalexpansion of the Brahma brand to 15 countries in Europeand North America, for a total presence in 23 countries.
Created in 1999 through the merger of the Brahma andAntarctica brewing companies, AmBev has the largestbeverage portfolio in Brazil, including the Brahma,Antarctica, Skol and Bohemia brands, as well as softdrinks, the Gatorade isotonic beverage, Lipton teas andFratelli Vita bottled water. Among our stable of softdrinks, of particular note are Guaraná Antarctica,produced from a typical Amazonian fruit, and Pepsi-Cola.
In 2005, approximately 30% of our EBTIDA derived fromour Hispanic Latin American operations and Canada.Besides Brazil, we also are the market leader inArgentina, Bolivia, Paraguay and Uruguay.
This leadership is the result of our Passion for Execution,for always doing more regarding everything that involvesour business – and always doing it better, by imposingchallenging targets upon ourselves and being able tocount on a team made up of the most talentedprofessionals in the market.
Highlights 2004 2005 Variation
R$ million R$ million %
Income statmentNet Revenues 12,007 15,959 32.9%Gross Earnings 7,226 10,216 41.4%General and Administrative Expenses 3,611 5,174 43.3%EBIT 3,615 5,043 39.5%Net Earnings 1,162 1,546 33.1%
Balance SheetTotal Assets 33,017 33,493 1.4%Cash and cash equivalents 1,505 1,096 -27.2%Total Debt 7,811 7,204 -7.8%Net Equity 16,976 19,867 17.0%
Cash Flow and Profitability EBITDA (R$ million) 4,537 6,305 39.0%EBITDA Margin 37.8% 39.5% 1.7 ppCapital Expenditures (R$ million) 1,274 1,370 7.5%Return on Equity (%) 10.8% 7.8% - 3 pp
Share information (R$/ thousand shares)Book Value (*) 258.97 304.03 17.4%Earnings per Share (*) 17.72 23.65 33.5%Dividends (ON) 20.86 23.07 10.6%Dividends (PN) 22.95 25.38 10.6%Payout of Dividends 114.0% 109.0% -5 pp
CapitalizationMarket Capitalization (R$ million) 40,424 53,646 32.7%Net Debt (R$ million) 6,305 6,107 -3.1%Minority Stakes (R$ million) 219 123 - 43.9%Shares in Circulation (thou.) (*) 65,553 65,346 -0.3%Equivalent ADRs (thou.) (*) 655.5 653.5 -0.3%
* Values adjusted for the share bonus issued on May 31. 2005
0
0.5
1.0
1.5
20
02
20
03
20
04
20
05
1,4
12
1,1
62
1,5
46
1,5
10
20
01
78
5
Net Income R$ million
0
5
10
15
20
01
20
03
20
04
20
05
8,6
84
12
,0
07 15
,9
59
6,5
26
20
02
7,3
25
Net RevenuesR$ million
20
01
37.8%37.0%
30.5%35.4%
20
02
20
03
20
04
20
05
6,3
05
4,5
37
3,0
72
1,9
90
2,7
10
EBITDA and EBITDA Margin
EBITDA (R$ million) EBITDA Margin (%)
39.5%
Beer BrazilHispanic Latin America (HILA)Soft Drinks Brazil North America
25%
52%
13%
10%
Breakdown of net revenues


The company posted exceptional results in 2005, with a rise of 33% in net revenues and 39% in cash generation,
delivering an EBITDA of R$ 6.3 billion and a 39.5% margin. The continued growth of the Brazilian economy
and a positive situation in all Latin American countries in which we are active contributed to the development
of our operations.
We are convinced that a result of this magnitude only has been possible thanks to the action of our People, a team
that is formed through an efficient policy of recruitment, our results-oriented culture and recognized ability of
retaining the best talents. Looking toward the future, we are maintaining our commitment to continue delivering
results and to be a benchmark company in the beverages industry.
We are dedicated to accomplishments. This enthusiasm encompasses all stages of our business, beginning with the
selection of the barley and other raw materials for our products; continuing with the development of new beverages,
in the bottling, marketing, distribution and point-of-sale relationship processes; and winding up in the initiatives
that we use to assure consumer preference for our brands. We continued to focus on execution of operations.
Our manufacturing facilities have reached high operating and environmental efficiency levels . Our brands’ images
are strengthened by the creativity of our marketing, making use of effective and innovative campaigns.
Our increasingly motivated sales force seeks to exploit the opportunities in the markets in which we are present.
And our logistics operations continue to be efficient, guaranteeing that our customers are satisfied with the services
they receive from AmBev.
Our focus on cost reductions is more and more present on a daily basis, independent of the results that have been
achieved. This year, efficient efforts of our purchasing department coupled with synergies with InBev made
it possible for AmBev to maintain high profit margins despite a sharp rise in the cost of some inputs, such as
aluminum and sugar.
Message to shareholders
With net revenues growth of 33% and an EBTIDA of R$ 6.3 billion, AmBev continues committed to pursuing evenbetter results
02. AmBev | Annual Report | 2005

The year was an excellent one for operations in Brazil, with a solid rise in beer volumes being particularly noteworthy.
In the soft drinks segment, we increased volumes and profitability; but we believe that opportunities exist for further
strengthening this operation.
We encountered a very tough competitive environment in North America. Nevertheless, it was possible to boost our
profitability through a strong mix of cost controls and a focus on efficiencies.
In Hispanic Latin America, Quilmes Industrial S.A. (Quinsa) brought in exceptional results for our operations in the
Southern Cone countries, which comprises the markets of Argentina, Uruguay, Paraguay, Bolivia and Chile.
We also posted a good performance in Venezuela. In the other Latin American countries, the difficulties we faced
during 2005 have served as a learning experience and a factor of motivation that will help us deliver strong
performances in the near future.
We restructured the debt of our Canadian operation in 2005 in conditions that were more favorable to us, which led
the Fitch classification agency to elevate AmBev’s rating to BBB-, investment grade, at the beginning of 2006.
As with Standard & Poors in 2004, we were the first Brazilian company to obtain this classification from Fitch.
We are a company with a Passion for Execution. Our strong culture has created a company in which each employee
acts like an owner, leading us to achieve results that at first appear to be impossible. We are proud of our People and
we credit our entire staff for the fantastic year that was 2005.
Luiz Fernando EdmondChief Executive Officer for Latin America
Carlos Alves de BritoChief Executive Officer for North America in 2005 and
currently co-chairman of the Board of Directors
Victório Carlos De MarchiCo-chairman of the Board of Directors
Luiz Fernando Edmond
Carlos Alves de Brito
Victório Carlos De Marchi
2005 | Annual Report | AmBev .03

04. AmBev | Annual Report | 2005
Map of Operations
Canada
Brazil
DominicanRepublic
Guatemala
NicaraguaEl Salvador
Venezuela
Ecuador
Peru
Bolivia
Paraguay
ArgentinaUruguay
Chile

Argentina
Beer market (m HL) 15.2Per capita consumption (liters) 40.3Installed capacity (m HL) 16.1
Bolivia
Beer market (m HL) 2.3Per capita consumption (liters) 25.4Installed capacity (m HL) 2.8
Brazil
Beer market (m HL) 93.2Per capita consumption (liters) 51.4Installed capacity (m HL) 98.3
Canada
Beer market (m HL) 22.2Per capita consumption (liters) 69.0Installed capacity (m HL) 15.0
Chile
Beer market (m HL) 4.7Per capita consumption (liters) 29.1Installed capacity (m HL) 0.8
Ecuador
Beer market (m HL) 2.6Per capita consumption (liters) 19.8Installed capacity (m HL) 1.0
El Salvador
Beer market (m HL) 0.8Per capita consumption (liters) 12.6Installed capacity (m HL) –
Guatemala
Beer market (m HL) 1.2Per capita consumption (liters) 9.5Installed capacity (m HL) 1.4
Nicaragua
Beer market (m HL) 0.6Per capita consumption (liters) 10.5Installed capacity (m HL) –
Paraguay
Beer market (m HL) 1.9Per capita consumption (liters) 31.4Installed capacity (m HL) 2.2
Peru
Beer market (m HL) 7.1Per capita consumption (liters) 25.6Installed capacity (m HL) 1.0
Dominican Republic
Beer market (m HL) 3.1Per capita consumption (liters) 34.3Installed capacity (m HL) 1.0
Uruguay
Beer market (m HL) 0.6Per capita consumption (liters) 17.5Installed capacity (m HL) 1.1
Venezuela
Beer market (m HL) 22.0Per capita consumption (liters) 83.3Installed capacity (m HL) 3.2
North AmericaNet Revenues: R$ 3,976 millionEBITDA: R$ 1,433 millionEBITDA Margin: 36.0%Beer market in Canada: 22.2 million HLTotal beer sales: 10.9 million HLExports to the USA: 1.8 million HL
BrazilNet Revenues: R$ 9,902 millionEBITDA: R$ 4,319 millionEBITDA Margin: 43.6%Beer market: 93.2 million HLTotal beer sales: 62.5 million HLTotal soft drink sales: 20.3 million HL
Hispanic Latin America (HILA) Net Revenues: R$ 2,080 millionEBITDA: R$ 553 millionEBITDA Margin: 26.6%Beer market: 62.0 million HLTotal beer sales: 19.8 million HLTotal soft drink sales: 11.9 million HL
Note: Installed capacity refers only to beer (excluding soft drinks).Source: AmBev (capacities) and Euromonitor (market estimates and per capita consumption).
2005 | Annual Report | AmBev .05


Beer Brazil
Exceptional performance,driven by brands
and execution
The world’s fifth largest beer market, Brazil also is our
main operation, responsible for 59% of consolidated
EBITDA in 2005. EBITDA growth was 28.7%, totaling
R$ 3.7 billion. We ended the year with a 69.4% market
share, with an average annual share of 68.3%.
It was an exceptional year, with an 8.2% increase in
sales volume – the highest rate in the past ten years
– that exceeded the 7% expected and the 6.5% growth
in the overall market, according to ACNielsen’s
estimate. The volumes were driven by the
performance of our main brands and the efficiency in
execution at points of sale. We knew how to capture
the benefits deriving from the recovery of the
Brazilian economy and the greater confidence of
consumers that came with it.
The management of the brands and revenues assured
for us strong performance in the premium segment:
Bohemia grew 28% and Original rose 44%. Our direct
distribution strategy and growth for the premium
segment continued to increase revenues above the
rate of inflation – 8.7% compared to 5.7% (IPCA).
69.4%
2005 | Annual Report | AmBev .07
marketshare
8.2%growth involume

One highlight was the launch of Brahma in another 15
countries outside of Latin America, with special
success in the Ukraine and Russia. Inversely, in Brazil
we launched Stella Artois draft and bottled beer
exclusively for distinctive points of sale.
We seek creative options for new consumption
occasions as part our strategy to increase per capita
consumption and we have become the first beverage
company to introduce a draft beer franchise: the
Quiosque Chopp Brahma (Brahma Draft Beer Kiosk),
developed in 2003 for shopping center corridors,
airports, bus stations and shop galleries was the
fastest-growing franchise in 2005 out of a universe of
some 110 different master franchises analyzed by the
2005 Guide published by the Brazilian Franchising
Association (ABF). At year’s end, there were
60 Quiosque Brahma Chopp franchises in operation,
with a sales volume per unit that was double the draft
beer market average.
Another successful experience was Chopp Brahma
Express, a home delivery service for draft beer and
equipment. In addition, in July 2005 we created a
Chopp Brahma Express showroom that offers
consumers total brand experience. At the end of
the year, it became the single largest draft beer
point-of-sale in the city of São Paulo.08. AmBev | Annual Report | 2005

Beer Brazil
We are very proud of our beer business and reaffirm our
commitment to be proactive and to take the measures
that are necessary to ensure its continuous growth, both
in terms of market share as well as the profitability of
our operations. We are challenged each and every day to
further expand the beer market in Brazil.
We continued our equally successful brand exposure
initiatives, such as Skol Beats – the largest electronic
musical event in Latin America – and the Brahma Box –
the most traditional viewing location for the Rio de
Janeiro Carnival parade, bringing together Brazilian and
international celebrities. We also put on another edition
of the Boteco Bohemia, with consumers electing the
best places to drink beer, and we created the Confraria
Bohemia, designed to allow the brand to be more
closely involved with the field of gastronomy.
We instituted the Society of Beer, a relationship location
with consumers offering information about the beer
production process and consumption tips. The idea is to
teach beer lovers to become true master brewers while
merging the beverage with the art of cooking.
2005 | Annual Report | AmBev .09
1
5
6
9 11
15
26 2
8
31
38
60
Growth of the Quiosque Brahma Chopp network(number of units)
2Q
- 2
00
3
3Q
- 2
00
3
4Q
- 2
00
3
1Q
- 2
00
4
2Q
- 2
00
4
3Q
- 2
00
4
4Q
- 2
00
4
1Q
- 2
00
5
2Q
- 2
00
5
3Q
- 2
00
5
4Q
- 2
00
5


Soft Drinks Brazil
Healthy growth and thepotential for major gains
We are the second largest producer of soft drinks in
Brazil, with a 17% market share. We have a complete
portfolio of non-alcoholic beverages, led by Guaraná
Antarctica – the best selling soft drink in its segment in
Brazil – and by Pepsi-Cola – the second-ranked cola in
the market. We also produce and market the Gatorade
isotonic drink as well as Lipton Ice Tea, leaders in their
categories, and the Fratelli Vita bottled water.
We operate in the soft drinks market through a
division that is responsible for developing its own
independent policies and strategies; however, it
maintains production, logistical and distribution
synergies with our beer lines.
Our soft drinks posted healthy growth during 2005.
Sales volumes increased 6%, somewhat higher than
the 5% rise we had expected for the year. We were able
to maintain our market share and further boosted the
EBITDA margin, which rose to 31.4% for the year, higher
than the 30% that had been estimated.
17%
2005 | Annual Report | AmBev .11
market share

Revenues per hectoliter were up 6.3%, driven by a
readjustment in prices over the year, management
initiatives and an increase in direct distribution.
We began to exploit new market opportunities, an
effort that will be given new emphasis in 2006.
The 2.5-liter PET bottle launch is a step in the right
direction in view of the fact that soft drinks sales in
larger bottles has grown faster than the market
average, revealing a consumer preference for this
type of packaging.
We are enthusiastic about the installation of flow
meters to monitor the output of soft drink companies,
which will become mandatory in September 2006.
Similar to what happened in the beer industry, this
equipment will encourage fairer competition in the
sector, reducing the pressure for competitors to offer
informal discounts.
We identified the major growth potential of the
Brazilian market, currently the third largest in the
world in terms of volume but one that still has a low
per capita rate of consumption (70 liters per year).
12. AmBev | Annual Report | 2005

With a young population – one-third under the age of 15
– Brazil represents an opportunity to supply innovative
products for different consumption occasions.
We have winning brands. Guaraná Antarctica is a
Brazilian symbol, with the unique taste of a fruit that
is grown in the Amazon region and that is being
reinforced with greater visibility during 2006 with
the brand sponsoring the Brazilian national soccer
team during a Soccer World Cup competition year.
Pepsi has a large product line with distinctive tastes and
notably introduced a new visual identity during 2005.
Gatorade quenches the thirst of sports practitioners
and replaces mineral salts. Those who prefer a
smoother, non-carbonated beverage will find Lipton
Ice Tea is an option that has distinctive flavors.
Soft Drinks Brazil
2005 | Annual Report | AmBev .13


Hispanic LatinAmerica (HILA)
Sustained growth inthe Southern Cone
Our operation in the region encompasses 12 countries
in South and Central America and the Caribbean,
of which in five – Argentina, Uruguay, Paraguay,
Bolivia and Chile – we operate through our strategic
partner Quinsa.
In 2005, revenues rose 8.2% to R$ 2.1 billion, although
the division had mixed results. Quinsa posted a strong
performance, with its EBITDA in dollars increasing by
32.2%. Consolidated volume grew 12.9%, with beer
increasing 7.1% while soft drinks rose 26%. Dollar
revenues per hectoliter increased 10.4% over 2004.
In the other countries, which we call HILA-ex,
revenues rose 1.5%, impacted negatively by the
tougher competitive environments in Central
America and the soft drink markets in Peru and the
Dominican Republic.
2005 | Annual Report | AmBev .15
12countries
Our operationsencompass
growth inrevenues
8.2%

Hispanic Latin America (HILA)
In Bolivia, we posted consistent growth, with actions
concentrated on adding value to the brand portfolio
and reinforcing the distribution network. In Chile,
sales grew by 66.2%, driven by the Brahma brand’s
launch in September, and our market share rose to
15.5% (a gain of four percentage points). In Paraguay,
we maintained the recovery that we began two years
previously, supported by a better mix of brands and
new distribution processes. In Uruguay, we also took
advantage of the recovery of the local market to
expand our operations, with soft drinks being the
highlight – displaying the highest growth within
AmBev in the segment in 2005.
Quilmes Industrial S.A. (Quinsa)Through a combination of product launches, brand
development, cost discipline, distribution restructuring
and point-of-sale execution, Quinsa’s results improved
in each country. Our share in the brewery, which is the
market leader in the Southern Cone countries,
contributed R$ 1,299.9 million to the company’s
consolidated revenues (up 12.7%). In December 2005,
our stake was the equivalent to 59.2% of Quinsa’s
capital (compared to 54.8% the previous year).
In Argentina, the strategy for expanding presence in
the premium segment was maintained. After the
successful Stella Artois long neck beer product launch
at the end of 2004, the brand gained a 1-liter bottle
version. In soft drinks, growth reflected the consumer
market recovery and greater market shares for the
company’s brands. Two actions were important:
the PepsiCo license to operate within the last region
of the country where Quinsa was not already present
and the introduction of H2Oh carbonated water.
We initiated the doubling of the Tres Arroyos malt
plant, a project that should be fully operational in the
first half of 2006.
16. AmBev | Annual Report | 2005

Hispanic Latin America (HILA)
The period was dedicated to reinforcing the project to
introduce the best financial discipline practices,
managing revenues and costs, distribution and
point-of-sale execution. We took advantage of
successful experiences in the Brazilian market,
striving to adopt efficient processes and practices
that are capable of adding value to the operations.
We are still in the initial stages of our activities in the
majority of the region’s countries, part of an
expansion strategy initiated in 2003. This year’s
performance reinforces our commitment to the
region, which has great potential and encouraging
prospects for the future.
Northern Latin America (HILA-ex)Revenues from our operations in Northern Latin
America, Central America and the Caribbean
increased 1.5%, totaling R$ 780.4 million. We reached
the milestone of 1 million hectoliters of beer in the
last quarter of 2005, making us proud of our
accomplishments in a short amount of time.
However, performances varied in each country in which
we operate. There was consistent growth in Venezuela,
with an increase in volume and market share; we began
to sell beer in Peru and the Dominican Republic;
celebrated the Brahma brand’s first sales year
anniversary in Ecuador. However, the stiffer competitive
environments in Central America and the soft drinks
markets in Peru and the Dominican Republic negatively
impacted our revenues.
2005 | Annual Report | AmBev .17


North America
New operating modelin a challenging
environment
Labatt’s operations in North America contributed
R$ 3,975.5 million to our consolidated revenues.
The pro forma comparison with the performance of
2004 resulted in a 1.2% decline in Canadian dollars.
However, we achieved efficiency gains: the EBITDA
rose 12%, reaching R$ 1,433.10 million.
Revenues were influenced by three factors: the
increase in the low-price brand segment; a decline in
exports to the United States due to competition from
wine and distilled spirits as well as Mexican,
European and Asian beers; and the reduction of
volumes produced on behalf of Guiness, a reflection
of our plan for rationalizing the production structure,
that included the closing of two brewing facilities
(New Westminster and Toronto).
2005 | Annual Report | AmBev .19

North America
We also introduced the Zero Base Budget (ZBB). More
than cutting and controlling costs, this is an entirely
new system of approaching the cost and expense
structure that determines a new and more
encompassing vision regarding all of our businesses.
A portfolio of more than 50 brands supports us in
Canada. Besides Labatt Blue, we produce and handle the
local distribution of Budweiser and Bud Light, licensed
from Anheuser-Busch, and InBev’s Stella Artois.
Budweiser continued to be the Canadian volume leader
and at year’s end we recorded a significant increase in
In this challenging environment, we adopted a number
of measures to ensure the prosperity of our operations
in the region. It was a year of intense inwards-looking
focus and changes to our management model. We
introduced a new organizational structure, reclassifying
job positions and variable compensation packages with
the objective being to align the interests of the
employees and the shareholders to the profitability
targets of our operations. This process was
accompanied by the difficult task of restructuring the
workforce, but it allowed us to rationalize the operating
structure and achieve cost efficiencies.
20. AmBev | Annual Report | 2005

ofCanada’s10 largestbrands
50brands in the portfolio
23%of AmBev’sEBITDA
Represents
Brahma will fill a gap in our product line – the
transparent bottle, a segment that represents
4.1% of the market.
Coupled with the complete restructuring of internal
operations and the sales team, our performance in 2005
has equipped us to be more personalized in our
approach, focusing attention on the priorities of each
market. This is the type of challenging environment
that, for us, represents an exceptional opportunity
for growth.
sales of Bud Light, Stella Artois and Alexander Keith’s,
the number one domestic specialty beer in Canada and
the main draft beer brand in Ontario, which is the
largest market in the country. This improvement
partially compensated lower sales of Labatt Blue and
the company’s other brands, which faced a more
aggressive competitive environment.
As a result, we ended the year with five of Canada’s ten
top brands. We also concluded a successful test-launch
of Brahma in the Alberta region in preparation for
selling the brand as of 2006 in selected markets.
2005 | Annual Report | AmBev .21
5

22. AmBev | Annual Report | 2005

Passion for Execution
Discipline and science fordelivering the best results
The greatest challenge and the biggest opportunity
for growth is in getting close to consumers and
winning their preference. This challenge propels us
each day and represents a true passion for execution.
It is a passion for the business that involves all stages
of our work – from the acquisition of the raw material
through to the delivery of our products to the end
consumer – and it is this that enables us to maintain
a consistent rise in earnings.
For us, execution is discipline and science. It is at the
point-of-sale, at the moment of purchase, when the
great majority of consumers decide which beverage
they are going to taste or take home. We need
to profoundly understand the point-of-sale and
consumers needs in order to most effectively deal
with the variables that interfere with our brands’
performance. This involves research, marketing,
merchandising, distribution, product exposure,
refrigeration and pricing – so that, in the view of
the consumer, our products are more competitive
than the competition’s.
2005 | Annual Report | AmBev .23

Passion for Execution
We also install coolers, specially developed
refrigerators designed to maintain beer at the ideal
temperature for consumption (-5ºC), which is a
strategic distinguishing characteristic in the
main markets.
People who Sell (“Gente que vende”)
Our passion for execution is transmitted to every
single person who works at AmBev, independent of
his or her job position. Since AmBev was created in
2000, all eemployees reach the points-of-sale to
participate in the People who Sell program, designed
to teach them to understand and learn how the
market works, how our products are sold and exposed
and what is the opinion of the point-of-sale’s owner.
Besides Brazil, in 2005, this initiative was run in five
other countries: Ecuador, Guatemala, Peru, the
Dominican Republic and Venezuela. The People who
Sell program not only strengthens the company’s
culture and practices – it also disseminates the
responsible consumption message.
Motivation and efficiencyOur sales staff visits each point-of-sale two times per
week on average. The workday begins with an
animated and motivational general meeting of the
teams when targets, strategies and tactics are
established for better point-of-sale execution.
The teams make their sales calls equipped with
palmtops, devices that connect them to a database
giving them valuable information about each client
establishment (order history, inventory, types of
packaging, average prices, etc.). Due to sale channel
diversity, this model makes the negotiation process
more effective and lets us present a sales proposal that
satisfies client requirements until a subsequent visit.
Our teams strictly follow a list of features that must
be observed in order to help the points of sale increase
their efficiency and the results of the sales of our beer,
soft drinks, teas, isotonics and water. This includes
product exposure and organization, inventory control,
posters and other publicity materials and sales
prices, among others.
24. AmBev | Annual Report | 2005

2005 | Annual Report | AmBev .25

BeersSkol – Brazil market leader (31.9% share in December 2005), where it has been produced since
1967, was the first beer in a can in the country and revolutionized the market again in 2002
through Skol Beats.
Brahma – Brazil’s most traditional brand, launched in 1888, which is the market leader in
Paraguay and present also in 23 countries of the Americas and Europe.
Antarctica – A classic Pilsen beer that has been produced since 1885, which combines
tradition and quality.
Bohemia – The first Brazilian beer, produced since 1853, which is the premium segment leader
and is also presented in the Bohemia Weiss and Bohemia Escura versions.
Original – A beverage with a memorable taste sold in the premium segment.
Serramalte and Polar – Brands whose distribution is concentrated in the south of Brazil.
Líber and Kronenbier – Non-alcoholic; they multiply the number of occasions for consuming beer.
Caracu – A dark stout-type beer.
Quilmes – Synonym for beer in Argentina, it is comes in more than 15 versions. It also is our main
brand in Chile, Bolivia and Uruguay.
Brands
A large and innovative portfolio We have one of the largest and most diversified beverage portfolios in the world, including three top selling
international beer brands: Skol, in third place ; Brahma, in sixth place; and Antarctica, in 20th place. The three
brands are market leaders in Brazil as is Quilmes in Argentina, while Labatt Blue is the top-selling Canadian beer
in the world. Moreover, the unique taste of our Guaraná Antarctica, made from an Amazonian fruit, is ranked 15th
in the world preference for soft drinks. We produce and sell products for different consumption occasions and
consumer profiles, with an extensive line of beers, soft drinks, isotonics, ready-to-drink teas and mineral water.
We have beverages to satisfy all preferences wherever people may be. We invest in the continuous development
of our brands in order to ensure that they remain in the spotlight over the long term. In order for the company to
establish the correct value of its brands, we strive to increasingly optimize the execution of price per channel,
packaging and consumption occasion as well as maintaining a competitive price for the consumer.
Our main brands, per product category, are:

Pilsen and Patrícia – Points of reference in the Uruguayan beer market.
Brahva – The brand we market in Central American countries.
Labatt Blue – The best selling brand of Canadian beer in the world, produced together with
another 50 brands in the country such as Kokanee and Alexander Keith’s.
Stella Artois – InBev’s international brand, a super premium beer with a balanced and memorable
taste that was introduced in Belgium in 1366 and now is also produced in Brazil and Argentina.
Soft DrinksGuaraná Antarctica – The second best selling soft drink in Brazil with the unique flavor of
the guaraná fruit that is grown in the Amazon region.
Pepsi-Cola – AmBev is the second largest PepsiCo bottler in the world. We produce and
distribute soft drinks in a number of companies in Latin and Central America with a product
line that includes the traditional Pepsi-Cola, Pepsi-Twist, with its innovative cola and lemon
taste, and Pepsi X, the first energetic soft drink in the world.
Among our other notable soft drink brands are Sukita, an orange-flavored beverage, Soda
Limonada and Tônica Antarctica.
Isotonics Gatorade – The best selling isotonic sports beverage in the world, also part of our alliance
with PepsiCo.
TeasLipton Iced Tea – Ready-to-drink tea segment world leader, produced under franchise
license in Brazil.
WaterFratelli Vita – Lightness is one of its main qualities, due to the low level of dissolved salts.
2005 | Annual Report | AmBev .27


Distribution
Competitive advantages incosts and services
Distribution is one of the beverage business’ most
complex aspects. We service approximately 1 million
points-of-sale in Brazil alone. To be able to do this, we
combine direct and outsourced distribution, through
exclusive resellers, comprising a multi-brand network
that ensures deep market penetration and
competitive advantages in costs and services.
We maintain an efficient and creative transportation
logistics structure for the products that are always at
hand for consumers. In order to reach little towns in
the Amazon region, for example, we make use of
boats and even small canoes in contrast to the latest
generation trailer trucks we use in large urban centers.
1
millionpoints-of-sale
2005 | Annual Report | AmBev .29

Distribution
costs through economies of scale because the sale and
delivery of different brands and products are carried
out by the same infrastructure. We also use a
computerized system for obtaining and crosschecking
data about each point-of-sale, which lets us more
effectively execute sales and delivery routes.
Our own distribution and outsourced network
represents a unique source of marketing and
distribution knowledge.
With a complete portfolio of products, we use the
strength of our brands to maximize our distribution
efficiency, enhancing our market leadership position.
The more products that are placed in point-of-sale,
the more efficient we are in achieving distribution
cost reductions.
Exclusive resellers and direct distribution in major
cities and for self-service make it possible to reduce
30. AmBev | Annual Report | 2005

The AmBev Excellence Program encourages constant
improvement through support of an operations
manual that establishes the standards of worldwide
performance quality and exchange of best practice
information. Distributors that achieve excellence
three years in a row receive the title of AmBev
Ambassadors, entering the company’s select group
of most admired and respected partners.
AmBev Ambassadors

32. AmBev | Annual Report | 2005

Cost Management
Commitment to results In order to ensure that AmBev continues to be one of
the world’s most efficient producers, cost
management is a true obsession for us. Our planning
is based on the Zero Base Budget (ZBB) system that,
each year, establishes stretched targets for controlling
expenses and cost in order to increase our margins.
Each team is responsible for the management of its
own budget and meeting targets is compensated for
through an aggressive variable compensation
program. Thus, we stimulate the commitment and we
direct all the teams to carry out strict cost control.
An example of our high level of cost control is the
management of the Distribution Center’s fleet of
vehicles. In 2005, two initiatives exemplified the series
of measures we adopted to ensure that the growth of
these costs was lower than the rise of our revenues:
vehicles were transformed to use natural gas as fuel
instead of gasoline, and we highlighted them with
colored stickers. As a result, we wound up not having
to pay more for cars that originally were painted in
the colors of our brands.2005 | Annual Report | AmBev .33
97%reutilization of solid wastes
4
liters ofwater perliter ofbeerproduced

34. AmBev | Annual Report | 2005
Cost Management
AmBev became a world benchmark in items
considered important for the composition of
production costs. Examples include the average of 4.2
liters of water per liter of beer produced – an index
that has hit an unprecedented 3.3 liters at our Curitiba
(PR) plant) – and 97% reutilization rate of solid wastes
stemming from the production process (malt bagasse,
residual ferment from beer production, pulp from
bottle labels, and similar items). These by-products are
treated as businesses and their sales contributed R$
59.5 million to 2005’s revenues, up 23% over the
previous year (R$ 46.6 million).
Another distinguishing management characteristic
was the Manufacturing Excellence Program. Made up
of a set of regulations, procedures, tools and
management methods, the program encourages each
unit to improve its results. The system rewards results
while identifying and disseminating the best
practices for meeting established targets. Using it, it is
possible to recognize and compensate the best
performances.
Within the AmBev, Labatt, Quilmes and InBev
universe, we have more than 70 manufacturing
plants, which opens up opportunities for exchanging
best practices, resulting in efficiency gains.
0
20
40
60
20
04
20
05
46
.6
59
.5
20
03
31
.8
Revenues from by-products and wastes R$ million

different items in inventory (versions of packaging
of different beverage brands) that identifies the
variables for sales forecasts, costs and regional
production and highlights the best alternatives for
satisfying client orders. For major freight shipments
and distances, we use railroad, waterway and coastal
shipping transportation modes.
This obsession for cost control was a determining
factor leading to Canadian EBTIDA growth in 2005,
a year when our volumes were impacted by
tough competition.
Within the strategy for achieving efficiency in costs
along with superior quality, we produce some raw
materials that we consume. AmBev is the owner of
five malt production facilities (one in Brazil, two in
Argentina and two in Uruguay), which supply part of
the malt consumed in the brewing of beer. We also
have a glass factory in Paraguay, a facility for making
metallic corks and another plant for PET bottle
pre-forms in Manaus (AM).
Furthermore, we have developed a proprietary system
for exchanging information between the plants, the
distribution centers and the distributors and the
2005 | Annual Report | AmBev .35

Financial Discipline
Management based oncreation of value
With a model that combines the growth of revenues,
efficient distribution, a passion for execution and
permanent attention to costs and expenses, financial
discipline is yet another one of our strong points.
Our management is based upon the Economic Value
Added (EVA®) tool that is extensively used in our
industrial and commercial facilities to support
decisions while always striving to create value.
EVA growth is related to our variable compensation
policy as a way of motivating and remunerating the
performance of AmBev’s People.
Our generation of cash comes from an EBITDA that
totaled R$ 6.3 billion in 2005, with an average
compound annual growth rate (CAGR) of 33.4% over
the past five years. The fact that we control our
investments and our cash flow the same way that we
control expenses contributed to this result.
36. AmBev | Annual Report | 2005

Financial Discipline
Net debt of R$ 6.1 billion in 2005 represented a multiple
of 0.97 of the EBITDA, which indicates an opportunity
to increase leveraging the company’s growth.
The Standard & Poors and Fitch rating agencies
recognized us as being in the Investment Grade
category, on the basis of our solid capital structure.
We were the first Brazilian company to receive this
classification, making it possible to obtain funds on
the international market at competitive costs as
investors become more aware of AmBev’s low risk.
We have assured a consistent rate of return for our
shareholders. All cash that is not invested in our
business is disbursed to shareholders in the form
of dividends or interest on own capital. In 2005,
shareholder compensation totaled R$ 1,692 million,
the equivalent to 109% of net income.
2005 | Annual Report | AmBev .37
6.3R$billion in2005
EBITDA
33.4%over the past5 years
CAGR
20
01
62%
43%
32%
71%
114%
20
02
20
03
20
04
20
05
1.3
00
99
8
33
7
20
01
29
2
50
2
Dividends and payout
Dividends (R$ million) Dividends (R$ million) * Payout (as percentage of Net Income)
(*) Value referring to the 2005 fiscal year, not provisioned in the 12/31/2005 balance sheet
109%
1.3
27
39
2

Culture
Our culturedistinguishes and
motivates talent
We have our own way of being and of doing things,
which have been determining factors in building the
AmBev Culture. Through a combination of values,
beliefs, practices and management principles that
guide our actions and our behavior, our culture makes
us different and shows who we are.
The fundamental purpose of our business – our
Mission – is to make available the best brands,
products and services to the market that make it
possible to create strong and long-lasting ties with
our consumers and our clients. Our dream – our
Vision – is to be the best beverage company in the
world in terms of quality, strength of brands and
recognition of clients as their best partner, to have the
highest profitability and the best and most
committed people. It means to dream the “impossible”
and execute boldly and courageously, to be ready to
propose, face and exceed targets that would be
impossible for others to meet.
38. AmBev | Annual Report | 2005

2005 | Annual Report | AmBev .39

Culture
We act like leaders – We lead by personal example.
We want to win, but always respecting ethical
practices. We adopt a zero tolerance policy with regard
to keeping our culture alive and we believe that our
diversity constitutes a fortress. We are present where
things happen together with our People, our clients
and our consumers. We use up shoe leather to get to
know the details of our business.
And it means to move forward and lead the changes
that are necessary to achieve the dream. It means to
be passionate about everything we do.
We have defined four values that guide our conduct:
The consumers come first – Consumers are the
reason for everything that we do and we are partners
with our clients and resellers in order to provide them
superior quality.
Our People make the difference – We attract, develop
and maintain the best people, we invest in our People,
we support their continuous training and we
reward success.
We make things happen – We dream big dreams.
We select challenging targets and pursue major
performances. We are focused on results. We work
hard and enthusiastically. We use our reserve tanks.
We act like and are recognized as owners.
40. AmBev | Annual Report | 2005

Culture
We think and act like owners – We must demonstrate
passion and responsibility, taking decisions and
acting in the company’s long-term interest as if it
were ours. We act to ensure that our investment –
our company – has growing and sustainable value.
We demonstrate leadership and we develop the best
people – We must lead our company in the midst
of changes that are occurring in order to achieve
extraordinary results and also to identify and develop
our future leaders. Having the right people in the
right places doing the right things will make a big
difference in our journey from the Largest to the Best.
Our CompetenciesWe challenge ourselves to achieve extraordinary
results – We propose challenging targets,
continuously striving to discover new ways for
growing our business and delivering exceptional
performances without compromising either
quality or integrity.
We have in-depth knowledge of our business –
We apply our knowledge about our businesses,
the industry and the company to create value for
our investors.
We build strong relationships and teams – Our capacity
for teamwork and the fact that we mutually trust and
respect each other and maximize all the resources
available to us represent the key to our success.
We meet our targets the AmBev way: simply, focused
and disciplined – We will be rewarded for simplifying
our business, for focusing our energy and our
resources on the company’s biggest priorities and
for building a culture of discipline.
2005 | Annual Report | AmBev .41

AmBev People
Competence to recruit, totrain, to motivate and to
retain the best professionals
28,214persons in 14 countries
42. AmBev | Annual Report | 2005
Our People are dynamic, creative, imbued with
entrepreneurial spirit and a thirst for success. They
identify with an informal workplace and are in search
of a brilliant professional career. At the end of 2005,
we were 28,214 persons – most of whom in Brazil
(19,042 professionals).
We encourage our people to give the best of
themselves, to work hard and defend the work that
they do. We have a variable compensation program
that, in some cases, can represent up to 70% annual
earnings. Through bonuses, prizes and a stock option
plan, all employees – from executive officers to those
on the factory floor – are compensated for meeting
targets and goals. High-potential professionals with
exceptional performances earn the right to use a
bonus as part of a Stock Option Acquisition Plan,
effectively becoming owners of the company.
AmBev People* – December 2005
Industrial 13,798Sales and distribution 9,773Administration 4,643Total 28,214* does not include Quilmes’ operations.

TraineesOne way for employees to enter AmBev is through its
Trainee Program, which we consider to be of strategic
importance for the permanent renovation of our
human talent. We already have trained more than
500 professionals since it was created in 1990 in the
former Brahma. Six individuals who were trainees
today are company directors while many others are
managers. The recruiting and selection process
involves the entire executive officer team, whose
members visit the main universities in the region’s
countries to present our program and our culture.
In 2005, we received 19,198 applications and we
selected 42 young professionals in the following
countries: Brazil (19), Peru (4), Ecuador (4), Venezuela
(3), Guatemala (6), Honduras (1), El Salvador (1),
Nicaragua (1) and the Dominican Republic (3).
2005 | Annual Report | AmBev .43
TrainingOur People are young (average age of 35, which rises
to 42 for those in executive positions) and have a good
educational background: 19% have college degrees and
92% graduated from high school.
We permanently invest in the development of our
employees through a continuous education process.
In 2005, 55% of our employees underwent training.
Some R$ 14 million was earmarked for the
development of Our People through the AmBev
University and undergraduate and post-graduate
scholarships offered by the Antonio and Helena
Zerrener Foundation (FAHZ), one of the company’s
controlling shareholders. Our corporate university
makes the training process democratic, with courses
adapted for all levels of job positions within the
company in different formats, and making extensive
use of information technology. For example, TV AmBev

process that also awakened the interest of AmBev
units outside of Brazil, such as in Ecuador and the
Dominican Republic.
We entered into partnership with a number of
companies and organizations specialized in recruiting
individuals with special needs and we adopted the
same selection and compensation criteria used for
people with no such needs. In December 2003, we had
143 professionals with special needs on the payroll. In
two years, a total of 264 persons were recruited and
our target is to reach 800 by the end of 2006.
Quality of LifeWe also kicked off the Great Life program
(“Vida Legal”) whose goal is to stimulate healthy
habits, foster preventive health actions and
encourage employees and their family members
to deal with chronic diseases. Besides improving
their quality of life, we will save 15% in the
annual cost of medical assistance – and this
money will be transformed into other benefits,
such as scholarships.
AmBev People
For example, TV AmBev by satellite is a tool for the
transmission of our knowledge as well as a
communication vehicle that is on the air during eight
different time slots. In this process, certified directors
and managers also are instructors. Since 2002, 32,000 of
our own and resellers’ employees participated in courses
and training sessions designed to boost their careers.
The AmBev MBA course already has graduated 210
professionals since 1998, the year the former Brahma
created it. The objective is to offer a systemic vision of
the company as well as provide opportunities for
comparing our processes, results and culture to the
best companies in Brazil and abroad.
DiversityIn 2005, we launched the Program for Hiring
Professionals with Special Needs. More than merely
complying with Brazilian legislation, which requires
that 5% of a company’s payroll be reserved for people
with deficiencies, the initiative was designed to
encourage diversity and social inclusion. The program
was accompanied by an awareness and mobilization
44. AmBev | Annual Report | 2005

2005 | Annual Report | AmBev .45

46. AmBev | Annual Report | 2005

Sustainability
Our work couplesdevelopment with
sustainability
The constant concern to achieve profitability and be
responsible – both legally and ethically – leads AmBev
along a path of business sustainability. We strictly
comply with our tax obligations, we encourage the
adoption of transparent standards of conduct among
our employees and we invest in consistent and
permanent social projects that are in step with our
core business.
We work in the present while looking towards the
future. Thus, we invest in social and environmental
counterpoints in the locations where we have
operations. This is a commitment that goes beyond
the creation of jobs and paying of taxes, which in
2005 totaled R$ 7.2 billion. We share knowledge and
management with the chain of production and we
invest in the training of our human talents, in
environmental preservation policies, in the fostering
of culture and cultural manifestations of the countries
in which we are present. Moreover, we are a pioneer
in the campaign for responsible consumption of
alcoholic beverages.
2005 | Annual Report | AmBev .47

Social Responsibility
Another action in this program was the sponsorship
of a booklet, “How To Speak with Your Children about
the Use of Alcohol,” prepared by the scientific advisers
to the Health and Alcohol Scientific Center (CISA),
initially distributed in schools in São Paulo.
Moreover, the AmBev People Who Sell (Gente que Vende)
initiative that introduces our employees to the points
of sale selected “Amigo da Vez” as its slogan in 2005,
with the idea being that groups of young people who
go out for a good time should select one of their group
as the designated driver who must not drink and can
take them all home. During this activity, the employees
– 14,000 participated in the event – distributed 35,000
brochures to establishments throughout the country
especially prepared for the occasion.
Responsible ConsumptionWe have been running the groundbreaking AmBev
Responsible Consumption Program since 2001,
which follows the premises of the World Health
Organization (WHO). It includes advertising materials
that warn about the risks of drinking and driving,
the distribution of billboards and banners with the
message “If You Drink, Don’t Drive” on highways and
airport access roads, and the “Ask for their ID”
campaign, which advises bar and restaurant owners
about the importance of not selling alcoholic
beverages to minors under the age of 18. This
campaign already has involved more than 250,000
establishments throughout the country.
In the events that are sponsored by our brands, such
as the Brahma Box and Skol Beats, we invest in
specific actions such as offering free transportation,
discounts for taxi service and distribution of material
(brochures, bandanas, automobile stickers) that
encourage participants not to drive after they have
been drinking. We also have already donated more
than 14,000 breath analyzers to the governments of
São Paulo, Rio de Janeiro, Rio Grande do Sul and the
Federal District, and we have placed the message
“If You Drink, Don’t Drive” on 340 outdoor digital
clocks installed in the streets of São Paulo.
48. AmBev | Annual Report | 2005

Social Responsibility
Latin America for studying and disseminating
recycling practices, created by the Rio de Janeiro-
Ecomarapendi NGO. Courses, workshops and
professional training programs are run at the center,
which also maintains the Recycling Ecospace gallery
for permanent display of the work of artists who use
recycled materials in their projects.
Recycling To encourage solutions for reducing losses and for
preserving the environment and natural resources, in
2005 we created the 1st AmBev Recycling Prize. Based
on the 4R formula – Reduce, Reuse, Recycle and
Renovate – initiatives that represent the perfect
balance between responsible use of natural resources
and innovation in the use of disposable materials
were recognized. More than 800 projects were
submitted and visual artists, designers and artisans
(Reuse), previously unpublished studies (Reduce),
cooperatives, associations and non-profit
organizations (Recycle) and journalists (Renovate)
received awards. The finalists in each category were
included in an exhibit put on at the São Paulo
Museum of Image and Sound (MIS).
We also contributed to the development and
improvement in the quality of life of a number of
communities of waste scavengers through the
Solidarity Recycling Program that assisted 27
cooperatives in five states and the Federal District in
2005. The action included the donation of hydraulic
presses – that compress packaging materials and add
value to the items that are commercialized – along
with support for the Recicloteca, the largest center in
2005 | Annual Report | AmBev .49

Social Responsibility
in the world where we develop high-productivity
seedlings that are immune to pests that we donate
to farmers. AmBev has organized Guaraná Day there
each year since 1998 during which the technological
practices adopted by the company for growing the
fruit are taught to the farmers and the development
projects for the region are introduced. In 2005,
we announced acquisition of the entire 2005/2006
harvest during the event, representing some 220 tons
of beans, at a value that was 44% higher than
the minimum stipulated by the official National
Supply Company (CONAB).
50. AmBev | Annual Report | 2005
The Maués ProjectThis initiative is part of the Green Free Zone Project –
developed by the Amazonas state government. It has
earmarked some R$ 60.9 million through 2013
designed to finance a series of actions for the
population of Maués to encourage the growing of
guaraná crops and to contribute to the local
community’s social and economic development.
Toward this end, we also operate the Santa Helena
Farm in the Maués region, which is a research center
that contains the largest guaraná plant genetic bank

Social Responsibility
Moreover, the FAHZ earmarks R$ 4 million through
undergraduate and postgraduate scholarships as an
investment in the development and continuous
learning of Ambev People.
Solidarity In 2005, we reinforced the humanitarian aid
campaign for the countries most affected by the
tsunami – Sri Lanka and Indonesia – with the
donation of 414 hectoliters of mineral water for
their populations.
In another demonstration that solidarity is embedded
in the company’s culture, our employees in Jaguariúna
(SP) ran a Solidarity Christmas campaign that
collected 3.2 tons of food and 1,200 liters of milk,
delivered to institutions in the municipality that help
needy children
Solidarity LiteracyAlso designed to contribute to social gains, we
sponsor a program to eradicate illeteracy in Brazil.
Initiated in 2001, our assistance already has made it
possible to help 9,500 students and to train 380
literacy teachers in eight municipalities in the states
of Amazonas (Anori, Maués and Manacapuru),
|Sergipe (Simão Dias), Maranhão (Belagua), Bahia
(Maragogipe), Piauí (Nossa Senhora dos Remédios)
and Mato Grosso (Nossa Senhora do Livramento).
The Fundação Antonio e HelenaZerrenner (FAHZ)One of AmBev’s controlling shareholders, the FAHZ is
a national charitable institution that, through
hospitals, schools and day care centers offers free
medical, educational and social assistance to the
company’s employees, their dependents and others,
involving a total of 50,000 lives. In São Paulo it
operates the 244-bed Santa Helena Hospital, which
offers medical treatment preferentially to the
beneficiaries, and the Walter Belian Vocational School,
which teaches grade and high school courses along
with vocational classes to over 1,000 students,
with courses in secretarial services, electronics,
graphic arts and industrial information technology.
2005 | Annual Report | AmBev .51

The Environment
Commitment to superioreco-efficiency standards
Our environmental policy establishes the
commitment to seek and apply technologies,
processes and industrial inputs that reduce the impact
of our operations on the environment. We have
created eco-efficiency indicators – such as the
consumption of water and energy and the recycling of
waste – that are systematically measured. Annual
targets per plant are established, designed to meet
internal and external benchmarks. These targets are
part of the Manufacturing Excellence that motivates
all AmBev People to continuously improve processes.
The management of water resources is one of our
priorities. We have adopted a series of measures to
rationalize water consumption, both to reduce costs as
well as to protect the environment. As a result, we
have become a national point of reference in the beer
industry, with average consumption of 4.2 liters of
water per each liter of beer we produced in 2005.
In 2001, our average was 5.62 liters.
52. AmBev | Annual Report | 2005

2005 | Annual Report | AmBev .53
5.6
2
5.3
6
4.8
8
4.3
7
4.2
1
Water consumption(liter/liter of beer)
20
01
20
02
20
03
20
04
20
05
93
.7
%
94
.9
%
95
.8
%
96
.5
%
96
.8
%
Reutilization of industrial wastes
20
01
20
02
20
03
20
04
20
05
9.5
1
9.3
5
9.1
3
8.7
6
8.7
3
Energy consumption (Kwh/HL)
20
01
20
02
20
03
20
04
20
05

The Environment
analyzed on a monthly basis both by our own
laboratories as well as a facility in São Paulo
that controls the water quality of all AmBev’s
plants in Brazil.
Through the adoption of biogas in a number of its
units, we seek to substitute sources of non-renewable
energy and reduce polluting emissions. AmBev’s
Brazilian plants already use biogas – produced from
the biological reactions in its effluent treatment
stations – for the production of steam used to
We have produced a primer, known in-house as the
Water Commandments, emphasizing practices such
as proper maintenance of equipment to avoid leaks
and constant referral to each facility’s indicators.
We ensure that our effluent treatment stations
maintain the proper conditions for allowing the
recycling of the water used for cleaning and
maintenance purposes. Furthermore, this water is
returned to the environment in a highly purified
form. Samples of water outflow from the stations are
54. AmBev | Annual Report | 2005

Furthermore, we recycled 97% of the solid industrial
wastes our facilities generated, reaching 99% at the
Nova Rio plant in Rio de Janeiro. Malt bagasse and
ferment were transformed into protein for animal
feed. Residual ferment from the beer brewing process
is used to make flavor cubes used in soups and broths
and as food supplements for people. The pulp
extracted from our packaging is sent to cardboard
manufacturers for recycling.
produce power. Through this technique, we have been
able to reduce the use of natural gas and, mainly, fuel
oil. We also have become more efficient in our
consumption of electricity: we went from 9.5 Kwh per
hectoliter in 2000 to 8.7 Kwh in 2005.
We also initiated the Biomass Project for the
reutilization of wood residues, sawdust, coconut husks
and reforestation wood to produce energy in four of
our plants. Through this program we were able to
avoid the burning of 26,000 tons a year of fuel oil.
2005 | Annual Report | AmBev .55

We have structured our corporate governance model in a manner that ensures transparency, appropriate
disclosure, efficient decision-making control processes and equal and fair treatment of all shareholders.
We have been increasingly improving our governance structure, reinforcing internal controls and fully taking into
account all features of the Sarbanes-Oxley Act. This law requires that international companies listed on U.S. stock
exchanges adapt themselves to a series of measures designed to protect investors by demanding more precision
and reliability regarding the business information they disclose.
We advanced further in the project that was initiated in 2004, surveying the risks and controls not only related to
the preparation and disclosure of financial information but also that involving operations, as well. The project has
involved all of top and middle management, who also have the help of outside consultants. The main risks were
mapped, addressed and tested in 2005. We are totally committed to concluding the work during 2006 in order
to obtain the certification required by the Act before year’s end.
At the 2005 Annual Shareholders’ Meeting, the Board of Directors elected independent members to sit on the
company’s Fiscal Committee, now a permanent body that also has assumed the Audit Committee’s duties.
With a one-year term of office, the Committee’s members include specialists in the Brazilian and U.S. financial
markets. No member of the Committee exercises a position on the Board of Directors or Executive Management.
56. AmBev | Annual Report | 2005
Enhancing the best practices on behalf of shareholders
Corporate Governance

Corporate Governance
2005 | Annual Report | AmBev .57
Our higher corporate governance standards are derived from some important principles, such as:
Transparent Communication: We understand that open and transparent communication is an excellent means
of creating value for shareholders. We offer detailed analyses to the market, including quarterly reports and
conference calls so that investors understand the fundamentals of our company and the main guidelines
of our businesses.
Decision-making processes: Our Board of Directors makes use of its members’ experience to guarantee that its
long-term objectives are met while short-term competitiveness is achieved. It works through the support of such
committees as:
• Executive Committee: the main link between the policies and decisions taken by the Board of Directors and
AmBev’s managers. Its responsibilities include analyzing, proposing and monitoring the company’s performance
goals and budgets to ensure compliance with objectives.
• Compliance Committee: it helps the Board of Directors monitor and analyze the company’s internal controls and
fiscal profile and its operations with stakeholders.
• Finance Committee: it analyzes and monitors the company’s annual investment plan and opportunities for
external growth, as well as the capital structure, cash flow and management of financial risks.
Simultaneously, the Board of Directors ensures that our values, ethics and culture are practiced and disseminated.
Our team of top executives includes very experienced professionals who have been with the company an average
of 10 years each. It is our policy to rotate job functions on a regular basis, which offers managers an extensive and
deep understanding of our businesses’ different facets.

58. AmBev | Annual Report | 2005
Alignment with objectives: In order to ensure that the objectives of the executives remain aligned with
shareholders’ expectations, the company has adopted a variable compensation system for all employees that is
linked to achieving stretched targets. Following the concept disseminated by our culture of thinking like owners,
the top 200 executives participate in a stock option plan tied in with their annual bonuses, making them
shareholders in the company and fostering a long-term relationship between the executives and the company.
Shareholders’ agreement: The controlling block is composed of two entities that in December 2005 together held
88.1% of the company’s voting capital and 64.3% of its total capital: InBev, with, directly or indirectly, 72.9% of its
voting capital and 56.1% of the total capital, and the Fundação Antonio e Helena Zerrenner (FAHZ), with 15.2% of its
voting capital and 8.2% of total capital. The Shareholders’ Agreement, which is valid until 2019, confers on FAHZ
the right to veto on questions related to a wide range of important matters, such as dividends, investments,
acquisitions and the issuance of new debt.
Shareholder composition (1)In thousands of shares Common % Preferred % Total %
Interbrew International B.V. (2) 22,280,277 64.60% 10,087,238 32.10% 32,367,515 49.10%Fundação Antonio e Helena Zerrenner INB 5,314,282 15.20% 103,203 0.30% 5,417,485 8.20%AmBrew S/A (2) 2,870,650 8.30% 1,435,611 4.60% 4,306,261 6.50%InBev Participações Societárias Ltda (2) 0 0.00% 296,900 0.90% 296,900 0.50%Total Controlling Block 30,465,209 88.10% 11,922,952 37.90% 42,388,161 64.30%Instituto AmBev de Previdência Privada 1,919 0.00% 9,595 0.00% 11,514 0.00%Others 1,888 0.00% 9,441 0.00% 11,329 0.00%Free Float 4,009,286 11.60% 18,574,615 59.20% 22,583,901 34.30%Share in Treasury 21,120 0.10% 860,048 2.70% 881,168 1.30%Total 34,499,423 100.00% 31,376,651 100.00% 65,876,074 100.00%
(1) On December 31, 2005(2) Controlled by InBev S.A. / N.V.
Corporate Governance

Our shares are traded on the São Paulo Stock
Exchange (ticker symbols AMBV3 and AMBV4) and,
as American Depositary Receipts (ADRs), on the
New York Stock Exchange (ticker symbol ABV).
On the Brazilian stock market, the company’s
preferred shares rose 42.7% in value in 2005, while the
Ibovespa increased by 27.7%, ending the year quoted
at R$ 898.00. Its shares were traded during 100% of
the exchange’s sessions, with 70,460 total
transactions involving 5.2 million shares and a
financial volume of R$ 8,983.3 million.
On the NYSE, our ADRs appreciated 55.4%, quoted
at US$ 38.05, compared to a 0.6% decline of the
Dow Jones Index. Total trading volume was
US$ 3,890.9 million.
AmBev’s market capitalization at the end of the year
was equivalent to R$ 53.6 billion, compared to a
market capitalization of R$ 40.4 billion in 2004.
Shares as an Investment
Jan-00
350%
300%
250%
200%
150%
100%
50%
0%
400%
450%
Jul-00 Jan-01 Jul-01 Jan-02 Jul-02 Jan-03 Jul-03 Jan-04 Jul-04 Jan-05 Jul-05 Dec-05
Stock performance on the Bovespa (1)
AMBV4 AMBV3 Ibovespa
(1) Historical series adjusted by the bonus occurred in May 2005. (2) Announcement of business combination with Interbrew
(2)
2005 | Annual Report | AmBev .59

Board of Directors
Co-chairmen
Victório Carlos De Marchi Carlos Alves de Brito – elected in 2006
Directors
Marcel Herrmann Telles Carlos Alberto da Veiga SicupiraJosé Heitor Attilio GraciosoRoberto Herbster GusmãoVicente Falconi CamposLuis Felipe Pedreira Dutra LeiteJohan M.J.J. Van Biesbroeck
Alternate Directors
Jorge Paulo Lemann Roberto Moses Thompson Motta
Fiscal Committee
Members
Alcides Lopes Tápias Álvaro Antônio Cardoso de SouzaAntônio Luiz Benevides Xavier
Alternate Members
Ary WaddingtonEmmanuel Sotelino SchifferleNilson José Bulgueroni
60. AmBev | Annual Report | 2005
The Team

2005 | Annual Report | AmBev .61
Executive Directors
Chief Executive Officer for Latin America
Luiz Fernando Edmond
Chief Executive Officer for North America
Carlos Alves de Brito
Executive Officer for Hispanic Latin America
Juan Manuel Vergara Galvis
Chief Financial and Investor Relations Executive Officer
João Castro Neves
Sales Executive Officer
Bernardo Pinto Paiva
Marketing Executive Officer
Carlos Eduardo Lisboa
Industrial Executive Officer
Cláudio Braz Ferro
Soft Drinks Executive Officer
Francisco de Sá Neto
Corporate Affairs Executive Officer
Milton Seligman
General Counsel
Pedro de Abreu Mariani
People and Management Executive Officer
Ricardo Wuerkert
Shared Services and IT Executive Officer
Jean-Yves Rotte-Geoffroy
Quinsa Executive Officer
Agustín García Mansilla

Financial Section
62. AmBev | Annual Report | 2005

2005 | Annual Report | AmBev .63
Contents
1. Management Report 642. Independent Auditor's Report 743. Fiscal Comittee Report 754. Balance Sheets 765. Income Statements 786. Statements of Changes in Shareholders' Equity 797. Statements of Changes in Financial Position 808. Supplementary Information 829. Note to Financial Statements 84
10. Investor Information 115

64. AmBev | Relatório Anual | 2005
Overview of Companhia de Bebidas das Américas – AmBevWith operations in 14 countries of the Americas, AmBev is the fifth world’s largest brewer and the leader in the LatinAmerica. Ambev’s operations consist of the production and trading of beer, draft beer, soft drinks, other non-alcoholicbeverages and malt and are divided into three business segments:• Brazil Operations, represented by sales of (i) beer (“Beer Brazil”); (ii) carbonated soft drinks (CSD) and non-alcoholic,
non-carbonated (Nanc) beverages; and (iii) malt and by-products;• Hispanic Latin America (HILA), represented by AmBev’s current stake of 59.2% in Quinsa (Argentina, Bolivia, Chile,
Paraguay and Uruguay), as well as the Company’s operations in Northern Latin America (El Salvador, Equator,Guatemala, Nicaragua, Peru, Dominican Republic and Venezuela); these last operations, grouped, are designatedby HILA-ex (HILA excluding Quinsa); and
• North America represented by Labatt Brewing Company Limited (“Labatt”) operations, including beer domesticsales in Canada and exports to the United States (“USA”).
Major AmBev’s brands include Skol (the third most consumed beer in the world), Brahma, Antarctica, Bohemia,Original, Quilmes, Labatt Blue, Brahva and Guaraná Antarctica. In addition, AmBev is PepsiCo’s largest bottlingcompany outside of the USA. Through a franchising agreement, the Company sells and distributes Pepsi productsin Brazil and other Latin American countries, including Pepsi, Lipton Ice Tea and Gatorade.
AmBev’s credit risk as debt issuer in domestic and foreign currency is investment grade according to Standard andPoor’s and Fitch Ratings.
Financial Highlights 2005The following financial and operational information, unless otherwise stated, is presented on a consolidated basisand in thousands of Reais, pursuant to the Brazilian Corporate Law. All comparisons, unless otherwise stated, refersto 2004.• AmBev’s consolidated EBITDA reached R$ 6,305.1 million in 2005, growing 39.0%.• According to ACNielsen, Ambev’s market share in Brazilian beer market in 2005 was 68.3% (2004: 66.2%). Beer
Brazil segment’s volume grew 8.2% and the revenue per hectoliter reached R$ 129.9.• CSD & Nanc EBITDA margin reached 31.4%, an increase of 210 basis points, which kept AmBev as an industry
benchmark. The EBITDA recorded for the segment was R$ 517.6 million, 20.6% above 2004.• HILA Division posted an EBITDA of R$ 553.0 million, reflecting Quinsa’s strong growth.• Labatt contributed with an EBITDA of R$ 1,433.1 million.
Management Report

2005 | Relatório Anual | AmBev .65
Financial Highlights – AmBev Consolidated %R$ million 2005 2004 VariationSales Volume (000 hl) 125,313 98,272 27.5%Net Revenues per Hectoliter (R$/hl) 139.4 122.2 14.1%
Net Revenues 15,958.6 12,006.8 32.9%Gross Profit 10,216.2 7,226.3 41.4%Gross Margin 64.0% 60.2% 380 bpsEBIT 5,042.6 3,615.0 39.5%EBIT Margin 31.6% 30.1% 150 bpsEBITDA 6,305.1 4,537.2 39.0%EBITDA Margin 39.5% 37.8% 170 bpsNet Income 1,545.7 1,161.5 33.1%Net Income Margin 9.7% 9.7% 0 bpsNumber of Outstanding shares* (million) 65,346.2 65,552.9 -0.3%EPS* (R$/000 shares) 23.65 17.72 33.5%EPS excl. goodwill amortization* (R$/000 shares) 44.21 29.98 47.5%
* The number of outstanding shares at the end of 2004 was adjusted for the common shares stock bonus occurred on 5/31/05, in order toassure the consistency with 2005 EPS figures.
Financial Highlights by Business SegmentThe table below shows the consolidated financial highlights per business segment. The results presented refer tothe 12 month-periods ended on December 31, 2005 and 2004.
Financial Highlights Brazil HILA North America TotalR$ million 2005 2004 % Var. 2005 2004 % Var. 2005 2004 % Var. 2005 2004 % Var.
Volume ('000 hl) 82,743 76,885 7.6% 31,679 17,765 78.3% 10,892 3,622.4 200.7% 125,313 98,272 27.5%Net Revenue 9,902.8 8,525.9 16.1% 2,080.3 1,922.1 8.2% 3,975.5 1,558.8 155.0% 15,958.6 12,006.8 32.9%COGS (3,488.9) (3,368.6) 3.6% (953.1) (909.5) 4.8% (1,300.3) (502.4) 158.8% (5,742.3) (4,780.5) 20.1%Gross Profit 6,413.9 5,157.3 24.4% 1,127.1 1,012.5 11.3% 2,675.2 1,056.4 153.2% 10,216.2 7,226.3 41.4%
Gross Margin 64.8% 60.5% 430 bps 54.2% 52.7% 150 bps 67.3% 67.8% -50 bps 64.0% 60.2% 380 bps
SG&A (2,942.2) (2,416.8) 21.7% (764.7) (638.4) 19.8% (1,466.7) (556.1) 163.7% (5,173.7) (3,611.3) 43.3%% of Net Revenue -29.7% -28.3% -140 bps -36.8% -33.2% -350 bps -36.9% -35.7% -120 bps -32.4% -30.1% -230 bps
EBIT 3,471.7 2,740.5 26.7% 362.4 374.1 -3.1% 1,208.5 500.3 141.5% 5,042.6 3,615.0 39.5%EBIT Margin 35.1% 32.1% 290 bps 17.4% 19.5% -200 bps 30.4% 32.1% -170 bps 31.6% 30.1% 150 bps
EBITDA 4,319.0 3,401.3 27.0% 553.0 551.7 0.2% 1,433.1 584.3 145.3% 6,305.1 4,537.3 39.0%EBITDA Margin 43.6% 39.9% 370 bps 26.6% 28.7% -210 bps 36.0% 37.5% -140 bps 39.5% 37.8% 170 bps
Brazil Operations
Brazil Results Beer CSD & Nanc Malt and By-products TotalR$ million 2005 2004 % Chg. 2005 2004 % Chg. 2005 2004 % Chg. 2005 2004 % Chg.
Volume ('000 hl) 62,486 57,777 8.2% 20,257 19,108 6.0% n.a n.a n.a 82,743 76,885 7.6%Net Revenue 8,119.1 6,907.4 17.5% 1,648.7 1,462.8 12.7% 135.0 155.8 -13.3% 9,902.8 8,525.9 16.1%
COGS (2,575.3) (2,467.0) 4.4% (851.7) (820.5) 3.8% (61.9) (81.1) -23.7% (3,488.9) (3,368.6) 3.6%
Gross Profit 5,543.8 4,440.3 24.9% 797.0 642.2 24.1% 73.1 74.7 -2.1% 6,413.9 5,157.3 24.4%Gross Margin 68.3% 64.3% 400 bps 48.3% 43.9% 440 bps 54.2% 48.0% 620 bps 64.8% 60.5% 430 bps
SG&A (2,469.0) (2,058.0) 20.0% (470.1) (355.8) 32.1% (3.1) (2.9) 7.5% (2,942.2) (2,416.8) 21.7%% of Net Revenue -30.4% -29.8% -60 bps -28.5% -24.3% -420 bps -2.3% -1.9% -40 bps -29.7% -28.3% -140 bps
EBIT 3,074.8 2,382.3 29.1% 326.8 286.4 14.1% 70.0 71.8 -2.5% 3,471.7 2,740.5 26.7%EBIT Margin 37.9% 34.5% 340 bps 19.8% 19.6% 20 bps 51.9% 46.1% 580 bps 35.1% 32.1% 290 bps
EBITDA 3,731.4 2,900.4 28.7% 517.6 429.1 20.6% 70.0 71.8 -2.5% 4,319.0 3,401.3 27.0%EBITDA Margin 46.0% 42.0% 400 bps 31.4% 29.3% 210 bps 51.9% 46.1% 580 bps 43.6% 39.9% 370 bps

66. AmBev | Relatório Anual | 2005
Analysis of the Financial Performance in 2005 Net RevenuesNet revenues increased 32.9% in 2005, reaching R$15,958.6 million. The table below illustrates the contribution ofeach business unit to AmBev’s consolidated net revenues.
Net Revenues 2005 2004 %R$ million % Total R$ million % Total Change
Brazil 9,902.8 62.1% 8,525.9 71.0% 16.1%Beer Brazil 8,119.1 50.9% 6,907.4 57.5% 17.5%CSD & Nanc Brazil 1,648.7 10.3% 1,462.8 12.2% 12.7%Malt and By-products 135.0 0.8% 155.8 1.3% -13.3%
HILA 2,080.3 13.0% 1,922.1 16.0% 8.2%Quinsa 1,299.9 8.1% 1,153.0 9.6% 12.7%HILA-ex 780.4 4.9% 769.1 6.4% 1.5%
North America 3,975.5 24.9% 1,558.8 13.0% 155.0%Consolidated 15,958.6 100.0% 12,006.8 100.0% 32.9%
Brazil OperationsNet revenues generated by AmBev’s main business unit, represented by Beer, CSD and Nanc beverages operationsin Brazil, grew 16.1%, reaching R$9,902.8 million. The performance of each operation is demonstrated below.
BeerNet revenues from beer sales in Brazil climbed 17.5% in 2005, accumulating R$8,119.1 million. Major elementscontributing to this growth were:• A growth of 8.2% in sales volume reflecting (i) AmBev’s higher market share (2005: 68.3%; 2004: 66.2%); and (ii)
the market growth estimated by ACNielsen at 6.5%.• A growth of 8.7% in revenues per hectoliter, which reached R$129.9. This increase was a result of (i) broad prices
repositioning carried out in December 2004 and 2005; (ii) several revenue management actions put into practiceby AmBev’s sales and marketing structure, with a goal of maximizing the Company’s contribution in the beerindustry value chain (margin pool); and (iii) sales expansion through AmBev’s direct distribution structure.
CSD & Non-Alcoholic and Non-Carbonated Beverages (Nanc)Net revenues generated by CSD & Nanc in 2005 grew 12.7%, reaching R$1,648.7 million. The main elements contributingto this growth were:• A growth of 6.0% in the sales volume, reflecting (i) higher AmBev’s share in the soft drinks market (2005: 17.0%;
2004: 16.9%); and (ii) market growth, estimated by ACNielsen at 1.7%.• A revenues per hectoliter increase of 6.3%, reaching R$81.4. This increase was mainly due to the price repositioning
implemented during 2005.
Malt and By-productsMalt and by-products sales in Brazil presented a reduction of 13.3% in revenues, accumulating R$135.0 million.
Hispanic Latin America (HILA)AmBev’s operations in the Latin America recorded in 2005 an increase in revenues of 8.2%, reaching R$2,080.3 million.A more detailed analysis of this performance is shown below.
QuinsaAmBev’s stake in Quinsa, leading brewer in the Southern Cone, contributed with R$1,299.9 million to the Company’sconsolidated revenues, yielding a growth of 12.7%. The main reasons for the increased revenues were:• Beer and soft drinks volume growth, 7.1% and 26.0%, respectively; the consolidated volume grew 12.9%• A growth in US dollars of 10.4% in revenues per hectoliter, reaching US$38.2.• Higher AmBev’s stake in Quinsa’s capital (Dec/05: 59.2%; Dec/04: 54.8%).

2005 | Relatório Anual | AmBev .67
HILA-exAmBev’s operations in Northern Latin America presented a revenues increase of 1.5% in 2005, accumulating R$780.4million. The main reasons for the increased revenues were:• Consistent growth of AmBev’s operations in Venezuela.• Brahma launch in Peru and Dominican Republic.• Brahma sales in Equator completed one full year.
HILA-ex revenues were affected negatively by a tough competitive scenario for beer in Central America and for softdrinks in both Peru and Dominican Republic.
North AmericaLabatt’s operations in North America contributed with R$3,975.5 million for AmBev’s consolidated revenues. The proforma comparison with Labatt’s full year of 2004, in local currency (Canadian dollars), yielded a decrease in revenuesof 1.2%. This result is explained by:• Labatt’s sales volume decrease in the Canadian market, due to higher competition from the low price segment.• Exports of Labatt Blue to the USA dropped, caused by intense competition in the US market from wine and liquor
market, as well as imports of Mexican, European and Asian beer brands.• A substantial reduction in volumes of custom-made production contracted by Diageo USA (Guiness production
in glass bottles for sale in the USA); this measure was taken by Labatt as part of its streamlining plan of theproductive structure, which included the shutting down of two plants in Canada (New Westminster and Toronto).
Although the Canadian market is undergoing a challenging period for the two leading companies, AmBev has keptits enthusiasm about Labatt’s results growth prospects. The Company is confident that is implementing the necessarymeasures to ensure long term prosperity in its North America operation.
Cost of Goods SoldAmbev’s cost of goods sold in 2005 grew 20.1%, accumulating R$5,742.3 million. The following table illustrates thecontribution of each business unit for AmBev’s consolidated cost of goods sold.
Cost of Goods 2005 2004 %Sold R$ million % Total R$ million % Total ChangeBrazil (3,488.9) 60.8% (3,368.6) 70.5% 3.6%
Beer Brazil (2,575.3) 44.8% (2,467.0) 51.6% 4.4%CSD & Nanc Brazil (851.7) 14.8% (820.5) 17.2% 3.8%Malt and By-products (61.9) 1.1% (81.1) 1.7% -23.7%
HILA (953.1) 16.6% (909.5) 19.0% 4.8%Quinsa (536.7) 9.3% (510.3) 10.7% 5.2%HILA-ex (416.4) 7.3% (399.3) 8.4% 4.3%
North America (1,300.3) 22.6% (502.4) 10.5% 158.8%Consolidated (5,742.3) 100.0% (4,780.5) 100.0% 20.1%
BrazilThe cost of goods sold in Brazil business unit accumulated R$3,488.9 million, increasing 3.6%.
BeerThe COGS for the beer sales operations in Brazil increased 4.4%, reaching R$2,575.3 million. The COGS per hectoliterdeclined 3.5%, amounting to R$41.2. Although the implicit exchange rate in AmBev’s hedge policy in 2005 for thepurchase of production inputs has been unfavorable compared to the previous year (2005: R$3.02/US$; 2004:R$2.94/US$), (i) a higher dilution of the fixed costs was possible due to the growth of sales volume; and (ii) theproductivity gains resulting from AmBev’s continuous program of manufacturing industry excellence yielded thedrop observed in the production unit costs.
CSD & Nanc The COGS for the CSD & Nanc segment in Brazil increased 3.8%, reaching R$851.7 million. The COGS per hectoliterdecreased 2.1%, totaling R$42.0. Similarly to beer operations, factory efficiency gains, as well as a greater dilution ofproduction fixed costs, more than offset the increase in exchange rate for the purchase of raw materials.
Malt and By-productsThe sale of malt and by-products in Brazil had a reduction in the cost of goods sold of 23.7%, accumulating R$61.9million.

68. AmBev | Relatório Anual | 2005
Hispanic Latin America (HILA)The COGS of the HILA business unit increased 4.8%, reaching R$953.1 million. A more detailed analysis of this cost isshown below.
QuinsaThe consolidation of Quinsa’s COGS into AmBev accumulated R$536.7 million in 2005, representing a 5.2% growth.The main effects explaining this increase are:• 12.9% increase in the volume sold, reaching 24,997 million hectoliters.• AmBev’s increased stake in Quinsa’s capital (Dec/05:59.2%; Dec/04: 54.8%).
HILA-exThe COGS in AmBev’s operations in Northern Latin America rose 4.3%, reaching R$416.4 million. The main effectleading to this increase is an 8.0% growth in the volume sold, reaching 6,681 million hectoliters.
North AmericaLabatt’s cost of goods sold recorded R$ 1,300.3 million in 2005. The pro forma comparison, in local currency, withLabatt results in 2004 shows a decrease in the COGS of 6.5%. The main factor contributing to such reduction was a2.9% decrease in production costs per unit.
Gross ProfitAmBev’s gross profit was R$10,216.2 million in 2005, representing a 41.4% increase. The table below illustrates thecontribution of each business unit to AmBev’s consolidated gross profit.
Gross Profit 2005 2004 %R$ million % Total R$ million % Total Change
Brazil 6,413.9 62.8% 5,157.3 71.4% 24.4%Beer Brazil 5,543.8 54.3% 4,440.3 61.4% 24.9%CSD & Nanc Brazil 797.0 7.8% 642.2 8.9% 24.1%Malt and By-products 73.1 0.7% 74.7 1.0% -2.1%
HILA 1,127.1 11.0% 1,012.5 14.0% 11.3%Quinsa 763.2 7.5% 642.7 8.9% 18.7%HILA-ex 364.0 3.6% 369.9 5.1% -1.6%
North America 2,675.2 26.2% 1,056.45 14.6% 153.2%Consolidated 10,216.2 100.0% 7,226.3 100.0% 41.4%
Sales, General and Administrative ExpensesAmBev’s sales, general and administrative expenses amounted to R$5,173.7 million in 2005, a 43.3% increase. Theanalysis of such expenses at each business unit is shown below.
BrazilSales, general and administrative expenses in Brazil amounted to R$2,942.2 million in 2005, increasing 21.7%.
BeerSales, general and administrative expenses reached R$2,469.0 million, climbing 20.0%. The main elements thatresulted in the increase in such operating expenses were:• Higher sales volume of AmBev’s direct distribution structure;• Increase in AmBev’s billing to some clients, which the Company maintains agreements providing for a proportional
contribution of funds in trading activities.• Higher deferred assets amortization expenses, mainly due to the incorporation of InBev Brazil on July 28, 2005.
The operating expenses related to depreciation and amortization increased 53.5% recording R$507.7 million

2005 | Relatório Anual | AmBev .69
CSD & NancSales, general and administrative expenses for the CSD & Nanc segment accumulated R$470.1 million, an increaseof 32.1%. The main elements that generated the increase of such operating expenses were:• Higher sales volume through AmBev’s direct distribution structure.• Planned and significant increase in sales and marketing budget for CSD & Nanc in 2005, offsetting 2004 budgetary
restrictions, a year in which the absolute priority for AmBev’s Brazilian operations was to recover its beer market share.• Higher deferred assets amortization expenses, mainly due to the incorporation of InBev Brasil on July 28, 2005.
The operating expenses related to depreciation and amortization increased 49.6%, recording R$163. 8 million.
Malt and By-productsMalt and by-products sales generated sales, general and administrative expenses of R$ 3.1 million in 2005, increasing7.5%.
Hispanic Latin America (HILA)Sales, general and administrative expenses for HILA business unit amounted to R$764.7 million, increasing 19.8%. Amore detailed analysis of the development of these expenses is shown below.
QuinsaSales, general and administrative expenses consolidated into AmBev, through its stake in Quinsa, accumulatedR$324.4 million, increasing 6.9%. This increase is mostly explained by AmBev’s higher stake in Quinsa’s capital(Dec/05: 59.2%; Dec/04: 54.8%).
HILA-exSales, general and administrative expenses for AmBev’s operations in Northern Latin America amounted to R$440.4million, increasing 31.5%. The main reason of higher expenses was expenditures related to Brahma’s launch in Peruand Dominican Republic, both in promotion and distribution.
North AmericaLabatt’s sales, general and administrative expenses amounted to R$1,466.7 million. The pro forma comparison inlocal currency with Labatt results in 2004 presented a decrease of 6.3% for such expenses, being driven by thesuccessful initiatives to reduce the expenditures implemented by AmBev throughout the year.
Operating Result before Financial Income and Expenses, Provisions andContingencies and Other Operating Income and ExpensesThe Company presented a solid operating performance in 2005, evidencing not only a significant organic growth ofits sales, but also additional efficiency gains, which resulted in margin expansion exceeding Company’s exemplarylevels.
In 2005, AmBev posted a 39.5% increase of EBIT1 to R$5,042.6 million. The EBIT margin over net revenues reached31.6%, 150 basis points higher than 2004.
The Company’s EBITDA2 reached R$6,305.1 million, a 39.0% increase. EBITDA margin over net revenues was 39.5%,170 basis points higher than 2004.
The following tables show the EBIT and EBITDA figures for each business unit.
1 Earnings Before Interest and Taxes, equivalent to the operating result before financial income and expenses, provisions and contingencies,and other operating income and expenses.
2 Earnings Before Interest, Taxes, Depreciation and Amortization, equivalent to the EBIT before depreciation and amortization expenses.

70. AmBev | Relatório Anual | 2005
EBIT 2005 2004 %R$ million % Total Margin R$ million % Total Margin Change
Brazil 3,471.7 68.8% 35.1% 2,740.5 75.8% 32.1% 26.7%Beer Brazil 3,074.8 61.0% 37.9% 2,382.3 65.9% 34.5% 29.1%CSD & Nanc Brazil 326.8 6.5% 19.8% 286.4 7.9% 19.6% 14.1%Malt and By-products 70.0 1.4% 51.9% 71.8 2.0% 46.1% -2.5%
HILA 362.4 7.2% 17.4% 374.1 10.3% 19.5% -3.1%Quinsa 438.8 8.7% 33.8% 339.1 9.4% 29.4% 29.4%HILA-ex (76.4) -1.5% -9.8% 35.0 1.0% 4.6% -318.1%
North America 1,208.5 24.0% 30.4% 500.3 13.8% 32.1% 141.5%Consolidated 5,042.6 100.0% 31.6% 3,615.0 100.0% 30.1% 39.5%
EBITDA 2005 2004 % R$ million % Total Margin R$ million % Total Margin Change
Brazil 4,319.0 68.5% 43.6% 3,401.3 75.0% 39.9% 27.0%Beer Brazil 3,731.4 59.2% 46.0% 2,900.4 63.9% 42.0% 28.7%CSD & Nanc Brazil 517.6 8.2% 31.4% 429.1 9.5% 29.3% 20.6%Malt and By-products 70.0 1.1% 51.9% 71.8 1.6% 46.1% -2.5%
HILA 553.0 8.8% 26.6% 551.7 12.2% 28.7% 0.2%Quinsa 549.4 8.7% 42.3% 452.3 10.0% 39.2% 21.5%HILA-ex 3.7 0.1% 0.5% 99.3 2.2% 12.9% -96.3%
North America 1,433.1 22.7% 36.0% 584.3 12.9% 37.5% 145.3%Consolidated 6,305.1 100.0% 39.5% 4,537.3 100.0% 37.8% 39.0%
Tax, Labor Contingencies and OthersNet expenses with provisions for contingencies and others recorded R$ 71.5 million. The main entries that comprisethis total are:• Provision of R$ 113.3 million related to a labor claims• Reversal of R$ 56.3 million related to ICMS and IPI tax claims
Other Operating Income and ExpensesThe net balance of other operating income and expenses in 2005 represented a loss of R$1,075.3 million, 155.5% higherin relation to the loss recorded in 2004. The breakdown of the main entries is shown as follows:• A gain of R$ 151.8 million referring to assets increase resulting from fiscal incentives granted to AmBev’s subsidiaries
in Brazil.• A gain of R$ 52.2 million referring to the recovery in Brazil of PIS and COFINS tax credits.• An expense of R$ 923.5 million resulting from the goodwill amortization related to AmBev investment in Labatt.• An expense of R$ 184.3 million derived from the goodwill amortization related to Labatt investments in the North
America• An expense of R$ 164.6 million resulting from the goodwill amortization related to AmBev investments in the
Latin America.• An expense of R$ 74.1 million derived from exchange rate variation on company’s investments abroad.
Financial IncomeThe Company’s financial income in 2005 was negative at R$1,086.7 million, compared to a loss in 2004 of R$776.3million. The table below points out the main entries of Company’s financial results:

2005 | Relatório Anual | AmBev .71
Breakdown of Financial ResultR$ million 2005 2004
Financial IncomeFinancial income over cash and cash equivalents 85.5 175.2Exchange variation over investments 389.1 208.6Share Plan Income 7.6 34.4Financial charges over taxes and contributions and court deposits 10.1 11.6Others 28.9 38.8
Total 521.2 468.5
Financial expense Financial charges over debts in R$ 122.4 118.4Financial charges over debts in foreign currency 507.7 474.2Net losses over derivative instruments 714.3 412.3Taxes over financial transactions 135.8 121.3Financial charges over contingencies and others 65.3 54.0Other 62.5 64.7
Total 1,607.9 1,244.9
Net Financial Result (1,086.7) (776.3)
The Company points out that in accordance with the accounting practices adopted in Brazil, the liabilities relatedto swap and derivatives operations must be accounted by the interest curve set forth in its respective contracts; theassets referring to these same type of operations must be accounted at the lowest value between the market valueand the curve mentioned.
The Company’s total indebtedness decreased R$607.1 million compared to 2004 while its cash and cash equivalentsdecreased R$409.2 million.
As a result, there was a reduction of R$198.0 million in AmBev’s net debt. The Company estimates that if Labatt 2005results are considered, the ratio between its net debt and the accumulated EBITDA over the past 12 months is 1.0x.
The table below details AmBev’s consolidated debt profile:
Debt Breakdown Short Long R$ million Term Term TotalLocal Currency 195.1 599.6 794.7 Foreign Currency 1,014.3 5,394.6 6,408.9 Consolidated Debt 1,209.4 5,994.2 7,203.6 Cash and Cash Equivalents 1,096.3 Net Debt 6,107.3
Other Non-Operating Income and ExpensesThe net balance of other non-operating income and expenses resulted in a loss of R$234.3 million in 2005, comparedto a loss in 2004 of R$333.9 million. The breakdown of the main entries is detailed below:• A loss of R$ 158.2 million related to the provision recorded for Labatt’s brewery shutting down in Toronto. The
accrued items are the following: (i) loss of property, plant and equipment (R$46.7 million); (ii) supplement for theprovision of employees benefits (R$69.9 million); and (iii) employees dismissal costs (R$ 41.6 million).
• A loss of R$ 65.6 million related to AmBev’s investment in Quinsa, as a result of buyback of its own shares in themarket carried out by Quinsa during 2005.
Income and Social Contribution TaxesIn 2005, the net result for income and social contribution taxes was an expense of R$845.1 million. At the nominalrate of 34%, the provision for income and social contribution taxes would have been of R$807.2 million. The effectiveprovision reconciliation with the provision at the nominal rate is shown in the table below:

72. AmBev | Relatório Anual | 2005
Income TaxR$ million
Consolidated profit before income tax and social contribution 2,576.8Statutory interest and contributions (202.8)Consolidated profit, before income tax, social contribution and minority interest 2,374.0
Expectation of income tax and social contribution expenses at nominal rates (34%) (807.2)Adjustments to obtain effective rate:
Interest attributed to shareholders’ equity 253.0Foreign subsidiaries income not subject to taxation (174.1)Equity gains in subsidiaries 51.6Non-deductible goodwill amortization (211.4)Permanent additions and exclusions and others (16.1)Goodwill future profitability – CBB merger(ii) 103.4Exchange variations over investments (44.3)
Income tax and social contribution expense over profit (845.1)Income tax and social contribution effective rate 35.6%
According to the guidance announced by the Company during 2005, the effective rate of Income and SocialContribution Taxes, adjusted by the exclusion of the expenses related to goodwill amortization of the Company’sprofit basis was 22.7%.
Employees and Management Profit SharingIn 2005, expenses derived from the provision for employees and management profit sharing was R$202.8 million.This amount integrates the Company’s variable compensation policy, according to which approximately more than20,000 employees have a significant portion of their compensation subject to meeting aggressive performancetargets.
In 2004, Company’s employees and management profit sharing was R$152.4 million.
Minority InterestMinority interest in AmBev’s subsidiaries accumulated losses of R$ 16.8 million in 2005.
Net IncomeAmBev’s net income was R$ 1,545.7 million in 2005, a 33.1% increase compared to 2004. The income per lot of 1,000shares was R$23.65, representing an 11.2% increase.
The Company points out that the stock bonus implemented on May 31, 2005 distorts the net income analysis per lotof 1,000 shares between the 2005 and 2004 years. Adjusting the ownership structure of 2004 in order to be comparableto 2005, we have an increase in income per lot of 1,000 shares of 33.5%
DividendsThe allocation of profits to shareholders referring to 2005 results, representing the sum of dividends and interestattributed to shareholders’ equity was R$1,300.3 million, 2.0% lower than 2004. The amount allocated represents84.1% of the net income reported.
In addition to the profit allocation, the Company returned to its shareholders R$437.3 million through its sharebuyback program, with a total payout of R$1,737.6 million.

2005 | Relatório Anual | AmBev .73
Relationship with independent auditors Our policy in relation to our independent auditors when providing services not connected with external audit isbased on the principles that preserve the auditor’s independence.
These principles are defined as follows:(a) The auditor must not audit his/her own work;(b) The auditor must not perform managerial functions; and(c) The auditor must not advocate the interests of clients.
The independence of our external auditors is ensured in every service eventually provided by them, through specificprocedures, such as the involvement of professionals independent from audit, the services contracted do not requirethe accumulated expertise of the auditors or do not refer to the contracting of auditing services ruled, in this case,by specific procedures of professional independence; or through the involvement of other independent professionals(named as “second opinion”), among other actions performed. Additionally, all services rendered, which are notrelated to independent audit, are supervised by the management, the management bodies being responsible fordecisions, according to the levels of approval required by the Company’s Bylaws.
In the period under consideration, independent auditors rendering services to the Company and its subsidiarieswere not retained for additional services to the examination of the Company’s financial statements.

74. AmBev | Relatório Anual | 2005
To the Management and Shareholders of
Companhia de Bebidas das Américas – AmBevSão Paulo – SP
1. We have audited the accompanying individual (Company) and consolidated balance sheets of Companhia de Bebidasdas Américas – AmBev and subsidiaries as of December 31, 2005 and 2004, and the related statements of income,changes in shareholders’ equity, and changes in financial position for the years then ended, all expressed in Brazilianreais and prepared under the responsibility of the Company’s management. Our responsibility is to express an opinionon these financial statements. The financial statements: (a) of the subsidiary Labatt Brewing Company Limited, forthe years ended December 31, 2005 and 2004, which reflect, respectively, shareholders’ deficit of R$ 1,217 million andR$ 1,848 million, total assets of R$2,459 million and R$ 2,835 million, equivalent to 7.3% and 8.6% of the Company’stotal consolidated assets, net revenue of R$ 3,976 million and R$ 1,559 million, equivalent to 24.9% and 13% ofconsolidated net sales revenue, and net income of R$ 467 million and R$ 54 million, equivalent to 30.2% and 4.7% ofthe Company’s net income; and (b) of the jointly-owned subsidiary Quilmes Industrial S.A., for the year ended December31, 2004, which reflect net investment of R$ 721 million, total assets of R$ 1,799 million, equivalent to 5.5% of theCompany’s total consolidated assets, net revenue of R$ 1,153 million, equivalent to 9.6% of consolidated net salesrevenue, and net income of R$ 86 million, equivalent to 7.4% of the Company’s net income, were audited by otherindependent auditors and our opinion, insofar as it relates to the amounts included for these investments, assets andliabilities of these subsidiaries and their results of operations, is based solely on the report of the other auditors.
2. Our audits were conducted in accordance with auditing standards in Brazil and comprised: (a) planning of the work,taking into consideration the significance of the balances, volume of transactions, and the accounting and internalcontrol systems of the Company and its subsidiaries, (b) checking, on a test basis, the evidence and records thatsupport the amounts and accounting information disclosed, and (c) evaluating the significant accounting practicesand estimates adopted by management, as well as the presentation of the financial statements taken as a whole.
3. In our opinion, based on our audits and on the report of the other auditors, the financial statements referred to inparagraph 1 present fairly, in all material respects, the individual and consolidated financial positions of Companhiade Bebidas das Américas – AmBev and its subsidiaries as of December 31, 2005 and 2004, and the results of theiroperations, the changes in shareholders’ equity, and the changes in their financial positions for the years then endedin conformity with Brazilian accounting practices.
4. Our audits were conducted for the purpose of forming an opinion on the financial statements referred to in paragraph1 taken as a whole. The consolidated statements of cash flows for the years ended December 31, 2005 and 2004 arepresented for purposes of additional analysis and are not a required part of the basic financial statements preparedin conformity with Brazilian accounting practices. The consolidated statements of cash flows, prepared under theresponsibility of the Company’s management, have been subjected to the auditing procedures described in paragraph2 and, in our opinion, are fairly presented in all material respects in relation to the consolidated financial statementstaken as a whole.
5. The accompanying financial statements have been translated into English for the convenience of readers outsideBrazil
São Paulo, February 13, 2006
DELOITTE TOUCHE TOHMATSU Altair Tadeu RossatoAuditores Independentes Engagement Partner
Independent Auditor’s Report(Convenience Translation into English from the Original Previously Issued in Portuguese)

2005 | Relatório Anual | AmBev .75
COMPANHIA DE BEBIDAS DAS AMÉRICAS - AMBEV
Corporate Taxpayer’s ID (CNPJ) 02.808.708/0001-07
Corporate Registry ID (NIRE) 35.300.157.770
Publicly-held Company
Attachment to the Minutes of the Fiscal Committee Meeting of Companhia de Bebidas das Américas - AmBev (the“Company”) held on February 16, 2006.
The Fiscal Committee of Companhia de Bebidas das Américas - AmBev (“Company”), in compliance with the attributionsprovided in the Company’s Bylaws and paragraphs of the Article 163 of Law 6,404/76, examined: (i) the report issued byDELOITTE TOUCHE TOHMATSU AUDITORES INDEPENDENTES, (ii) Company’s performance report prepared by its ChiefFinancial Officer and Investor Relations Officer, and (iii) clarifications made by KPMG LLP and KPMG AUDITORESINDEPENDENTES. Based on the documents examined and clarifications made, the Fiscal Committee’s membersundersigned hereinbelow, approved in General Meeting the Management Annual Report and the Financial Statementsfor the year ended on December 31, 2005.
São Paulo, February 16, 2006.
Alcides Lopes Tápias Álvaro Antonio Cardoso de Souza
Antonio Luiz Benevides Xavier Emanuel Sotelino Schifferle(Alternate Member)
Nilson José Bulgueroni Ary Waddington(Alternate Member) (Alternate Member)
Fiscal Committee Report

76. AmBev | Relatório Anual | 2005
Parent Company ConsolidatedASSETS 2005 2004 2005 2004
CURRENT ASSETSCash and cash equivalents 384.4 1.6 837.3 1,290.9 Short-term investments - - 259.0 214.5 Marketable securities 52.7 - - - Trade accounts receivable 705.1 - 1,331.8 1,086.3 Inventories 557.5 - 1,178.1 1,380.9 Recoverable taxes 180.1 71.8 545.5 654.3 Dividends and/or interest on shareholder's equity - 709.1 - - Other assets 378.8 1.0 779.6 752.8
2,258.6 783.5 4,931.3 5,379.7
LONG-TERM RECEIVABLESRelated parties receivables 857.8 - - - Compulsory and judicial deposits and tax incentives 399.3 44.9 522.5 419.1 Advances to employees for purchase of shares 114.0 162.9 114.9 175.2 Deferred income and social contribution taxes 1,181.5 447.6 2,042.0 2,216.6 Property, plant, equipment for sale 101.3 - 104.5 113.8 Other assets 245.7 11.9 376.1 453.7
2,899.6 667.3 3,160.0 3,378.4
PERMANENT ASSETS Investments Investments in associated companies and subsidiaries
including goodwill and negative goodwill. net 19,634.0 20,059.3 16,727.1 18,172.2 Other investments 11.4 - 36.5 46.5
19,645.4 20,059.3 16,763.6 18,218.7
Property, plant and equipment 2,474.2 - 5,404.6 5,531.7 Deferred charges 3,148.0 65.5 3,233.3 294.1
25,267.6 20,124.8 25,401.5 24,044.5
TOTAL ASSETS 30,425.8 21,575.6 33,492.8 32,802.6
The accompanying notes are an integral part of these financial statements.
Balance SheetsAS OF DECEMBER 31, 2005 AND 2004
(In millions of Brazilian reais - R$)

2005 | Relatório Anual | AmBev .77
Parent Company ConsolidatedLIABILITIES AND SHAREHOLDERS' EQUITY 2005 2004 2005 2004
CURRENT LIABILITIESSuppliers 471.9 - 1,065.4 1,047.7 Loans and financing 790.0 - 1,209.4 3,443.1 Unrealized losses on derivatives 165.0 - 129.8 409.1 Payroll. profit sharing and related charges 265.6 9.2 447.7 378.2 Dividends payable 23.1 995.4 25.9 998.9 Income tax and social contribution 1.1 - 244.5 650.6 Other taxes and contributions to collect 599.4 66.9 1,030.8 983.3 Payable to related parties 1,886.1 3,336.1 - 1.2 Other liabilities 376.5 0.1 898.8 859.6
4,578.7 4,407.7 5,052.3 8,771.7
LONG-TERM LIABILITIESLoans and financings 2,994.5 - 5,994.2 4,367.6 Sales tax deferrals 352.6 - 352.6 275.7 Provision for contingencies 893.8 67.0 1,128.2 1,242.9 Payable to related parties 1,474.6 - - - Other liabilities 111.6 - 825.7 936.3
5,827.1 67.0 8,300.7 6,822.5
Deferred income 152.7 - 149.9 -
Minority interest - - 122.6 212.5
SHAREHOLDERS' EQUITYPaid-in Capital 5,691.4 4,742.8 5,691.4 4,742.8 Capital reserves 13,889.5 12,859.4 13,889.5 12,859.4 Profit reserves - - - - Legal 208.7 208.7 208.7 208.7 Statutory 471.1 225.0 471.1 225.0
Treasury shares (393.4) (935.0) (393.4) (1,040.0)19,867.3 17,100.9 19,867.3 16,995.9
TOTAL LIABILITIES AND SHAREHOLDERS' EQUITY 30,425.8 21,575.6 33,492.8 32,802.6

78. AmBev | Relatório Anual | 2005
Parent Company Consolidated2005 2004 2005 2004
GROSS REVENUEGross Sales 12,213.3 - 28,878.7 23,297.6
SALES DEDUCTIONSTaxes on Sales. discounts and returns (6,417.3) - (12,920.1) (11,290.8)
NET SALES 5,796.0 - 15,958.6 12,006.8 Cost of goods sold (2,371.2) - (5,742.3) (4,780.5)
GROSS PROFIT 3,424.8 - 10,216.3 7,226.3
OPERATING EXPENSESSales and marketing (1,021.8) - (3,499.9) (2,451.7)General and Administrative (259.7) (3.2) (802.0) (590.7)Provisions for contingencies (69.2) (1.6) (71.5) (260.2)Management fees (19.4) (6.9) (28.7) (27.2)Depreciation and amortization (487.2) - (843.0) (541.5)Financial income 264.1 43.3 521.2 468.6 Financial expenses (1,157.9) (260.4) (1,607.9) (1,244.9)Equity in earnings (losses) of subsidiaries 828.6 1,065.1 2.0 5.6 Other operating income (expenses). net 16.1 122.6 (1,075.4) (420.9)
(1,906.4) 958.9 (7,405.2) (5,062.9)
OPERATING PROFIT 1,518.4 958.9 2,811.1 2,163.4
Non-operating income (expenses). net (26.0) (1.3) (234.3) (333.9)
INCOME BEFORE INCOME TAX AND SOCIAL CONTRIBUTION 1,492.4 957.6 2,576.8 1,829.5 Income tax and social contribution 168.6 208.6 (845.1) (511.8)
INCOME BEFORE PROFIT SHARING AND CONTRIBUTIONS 1,661.0 1,166.2 1,731.7 1,317.7 Profit sharing (115.3) (4.7) (202.8) (152.4)
INCOME BEFORE MINORITY INTEREST 1,545.7 1,161.5 1,528.9 1,165.3 Minority interest - - 16.8 (3.8)
NET INCOME 1,545.7 1,161.5 1,545.7 1,161.5
Total number of shares (in thousands) 65,876,074 56,277,742
Earnings per lot of thousand shares. including treasury shares - R$ 23.46 20.64
Earnings per lot of thousand shares. excluding treasury shares - R$ 23.65 21.26
The accompanying notes are an integral part of these financial statements.
Income StatementFOR THE YEARS ENDED DECEMBER 31, 2005 AND 2004
(In millions of Brazilian reais, except for earnings per thousand shares - R$)

2005 | Relatório Anual | AmBev .79
Profit reservesSubscribed Statutoryand paid-in Capital reserves Legal Future capital reserves Treasury Retained
capital reserves increase Investments shares earnings Total
AT DECEMBER 31, 2003 3,124.1 16.6 208.7 26.1 1,271.2 (233.5) - 4,413.2
Exercise of stock ownership plan 18.0 18.0 Capital increase through stock subscription at incorporation of Labatt 1,600.7 12,840.3 14,441.0 Share buyback - (1,609.6) (1,609.6)Share buyback premium 2.5 2.5 Cancellation of treasury shares (26.1) (882.0) 908.1 - Net income for the year 1,161.5 1,161.5 Appropriations of net income for the year (164.2) 164.2 -
Prepayment of dividends (344.4) (344.4)Supplementary dividends (982.7) (982.7)Prescribed dividends and interest
on own capital 1.4 1.4
AT DECEMBER 31, 2004 4,742.8 12,859.4 208.7 - 225.0 (935.0) 0.0 17,100.9
Capital increase through captalization of reserves 948.6 (948.6) - InBev's Merger 2,883.3 2,883.3 Share Buybacks (437.3) (437.3)Merger of treasury shares held by the subsidiary CBB - (81.7) (81.7)Cancellation of treasury shares (868.1) 868.1 - Transfer of reserves to stock ownership plan (94.4) 192.5 98.1 Investment grants and tax incentives 57.9 57.9 Net income for the year 1,545.7 1,545.7 Appropriations of net income for the year 246.1 (246.1) - Prepayment of dividends as interest on capital (744.0) (744.0)
Prepayment of dividends - (556.2) (556.2)Prescribed dividends and interest on capital 0.6 0.6
AT DECEMBER 31, 2005 5,691.4 13,889.5 208.7 - 471.1 (393.4) 0.0 19,867.3
The accompanying notes are an integral part of these financial statements.
Statements of Changes in Shareholders' Equity of the Parent Company
FOR THE YEARS ENDED DECEMBER 31, 2005 AND 2004
(In millions of Brazilian reais - R$)

80. AmBev | Relatório Anual | 2005
Parent Company Consolidated2005 2004 2005 2004
SOURCES OF FUNDSOperations
Net income for the year 1,545.7 1,161.5 1,545.7 1,161.5 Expenses(income) not affecting working capital
Equity in results of investees (828.6) (1,065.1) (2.0) (5.6)Deferred income tax and social contribution (170.3) (208.6) 88.0 (228.8)Discount on the settlement of tax incentives (28.3) - (28.3) (21.9)Amortization of goodwill. net of negative goodwill 52.7 84.8 1,343.0 803.6 Depreciation and amortization 572.6 - 1,262.6 922.2 Tax. labor and other contingencies 69.2 3.2 71.5 260.1 Financial charges on tax and fiscal contingencies 25.8 - 52.7 49.8 Provision for losses on permanent assets 19.1 - 116.8 (6.7)Financial charges and variations on the stock ownership plan (12.8) (34.4) (13.3) (41.9)Exchange rate variation and charges on long-term financings (89.7) - (501.2) 278.0 Minority interest - - (16.9) 3.8 Exchange rate variation on foreign subsidiaries 2.9 (259.4) 289.3 (213.8)
Loss of interest ownership in subsidiaries 3.3 - 64.8 80.7 Residual value of property. plant and equipment and divestments 69.1 - 150.4 168.7 Dividends received and receivable 1,530.0 1,389.1 - -
2,760.7 1,071.1 4,423.1 3,209.7
From shareholdersCapital increase - 14,459.0 - 18.0 Premium on placement of stock options - 2.6 - 2.6 Financed stock sale - 53.6 73.3 101.2 Disposal of treasury shares 129.9 - 132.5 -
From third parties Prepayment of expenses - - 12.0 - Other recoverable taxes 166.0 - - - Other receivables 26.9 - 78.6 -
Changes in long-term receivablesFinancings 144.9 - 2,233.7 - Deferral of taxes on sales - - 115.5 167.9 Tax incentives 105.0 - - -
Related parties payables 1,989.4 - - - Other 5.4 - 0.5 17.3
TOTAL SOURCES OF FUNDS 5,328.2 15,586.3 7,069.2 3,516.7
The accompanying notes are an integral part of these financial statements.
Statements of Changes in Financial Position FOR THE YEARS ENDED DECEMBER 31, 2005 AND 2004
(In millions of Brazilian reais - R$)

2005 | Relatório Anual | AmBev .81
Parent Company Consolidated2005 2004 2005 2004
USES OF FUNDSChanges in long-term receivables
Compulsory and judicial deposits 106.8 1.0 72.2 52.7 Receivables from related parties - - 8.2 5.9 Other taxes and charges recoverable - 7.0 8.3 20.7 Prepayment of expenses 7.9 - - - Other - - 4.3 -
Changes in long-term liabilities Deferral of taxes 1.3 - - - Other accounts payable - - 30.0 71.9 Tax. labor and other contingencies 267.3 9.1 224.1 87.0 Permanent assetsInvestments. including goodwill and negative goodwill - 14,492.1 190.4 345.9 Property. plant and equipment 328.6 - 1,169.4 1,267.2 Deferred charges 91.6 - 265.4 101.9 Capital transactionsShare buyback 437.3 1,609.6 437.3 1,609.6 Proposed and paid dividends 1,300.3 1,325.8 1,300.3 1,394.1 Working capital of acquired subsidiary 1,480.7 - - 114.8 Working capital of acquired parent company 2.3 - - - Change in the capital of minority shareholders - - 88.3 31.9 Financing - - - 2,585.7 Total uses of funds 4,024.1 17,444.6 3,798.2 7,689.3
REDUCTION IN WORKING CAPITAL 1,304.1 (1,858.3) 3,271.0 (4,172.6)
CHANGES IN WORKING CAPITALCurrent assetsAt the end of the year 2,258.6 783.5 4,931.3 5,379.7 At the beginning of the year 783.5 69.3 5,379.7 5,500.6
1,475.1 714.2 (448.4) (120.9)
Current liabilities At the end of the year 4,578.7 4,407.7 5,052.3 8,771.7 At the beginning of the year 4,407.7 1,835.2 8,771.7 4,720.0
171.0 2,572.5 (3,719.4) 4,051.7
NET CHANGES IN WORKING CAPITAL 1,304.1 (1,858.3) 3,271.0 (4,172.6)
The accompanying notes are an integral part of these financial statements.
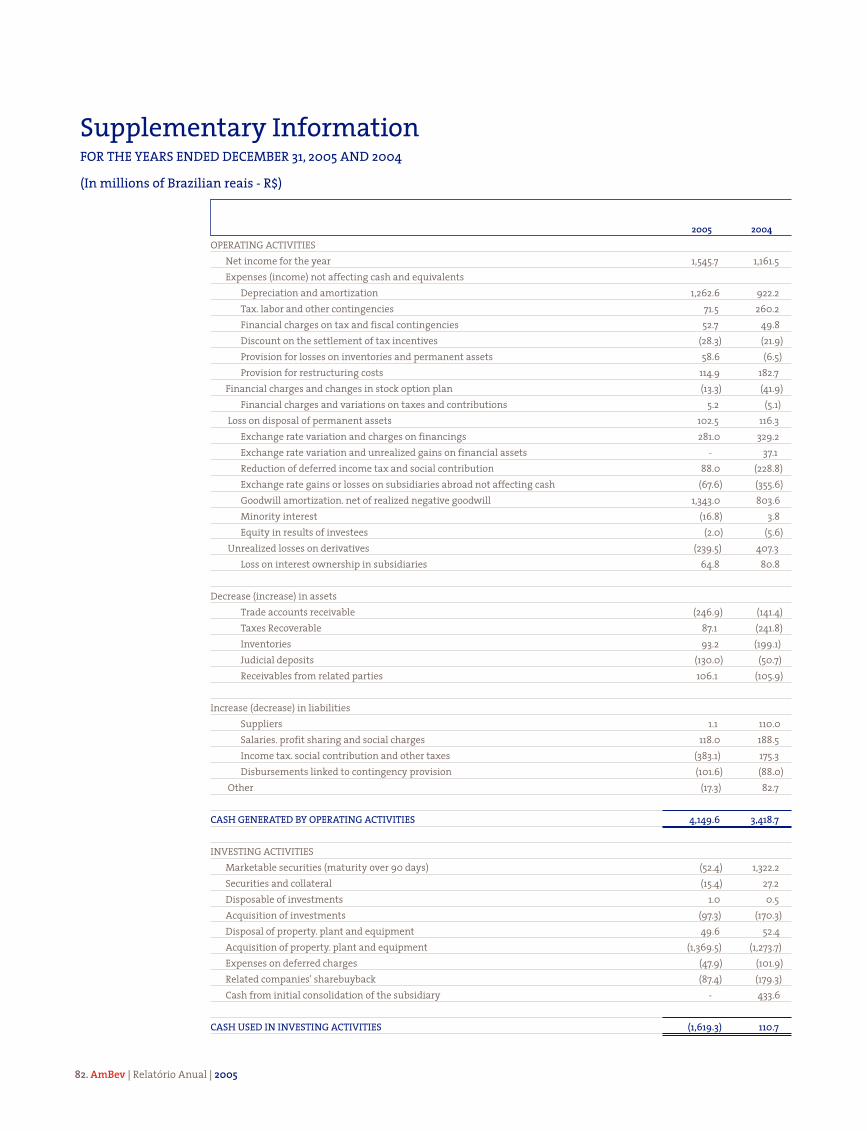
82. AmBev | Relatório Anual | 2005
2005 2004
OPERATING ACTIVITIESNet income for the year 1,545.7 1,161.5 Expenses (income) not affecting cash and equivalents
Depreciation and amortization 1,262.6 922.2 Tax. labor and other contingencies 71.5 260.2 Financial charges on tax and fiscal contingencies 52.7 49.8 Discount on the settlement of tax incentives (28.3) (21.9)Provision for losses on inventories and permanent assets 58.6 (6.5)Provision for restructuring costs 114.9 182.7
Financial charges and changes in stock option plan (13.3) (41.9)Financial charges and variations on taxes and contributions 5.2 (5.1)
Loss on disposal of permanent assets 102.5 116.3 Exchange rate variation and charges on financings 281.0 329.2 Exchange rate variation and unrealized gains on financial assets - 37.1 Reduction of deferred income tax and social contribution 88.0 (228.8)Exchange rate gains or losses on subsidiaries abroad not affecting cash (67.6) (355.6)Goodwill amortization. net of realized negative goodwill 1,343.0 803.6 Minority interest (16.8) 3.8 Equity in results of investees (2.0) (5.6)
Unrealized losses on derivatives (239.5) 407.3 Loss on interest ownership in subsidiaries 64.8 80.8
Decrease (increase) in assetsTrade accounts receivable (246.9) (141.4)Taxes Recoverable 87.1 (241.8)Inventories 93.2 (199.1)Judicial deposits (130.0) (50.7)Receivables from related parties 106.1 (105.9)
Increase (decrease) in liabilities Suppliers 1.1 110.0 Salaries. profit sharing and social charges 118.0 188.5 Income tax. social contribution and other taxes (383.1) 175.3 Disbursements linked to contingency provision (101.6) (88.0)
Other (17.3) 82.7
CASH GENERATED BY OPERATING ACTIVITIES 4,149.6 3,418.7
INVESTING ACTIVITIESMarketable securities (maturity over 90 days) (52.4) 1,322.2 Securities and collateral (15.4) 27.2 Disposable of investments 1.0 0.5 Acquisition of investments (97.3) (170.3)Disposal of property. plant and equipment 49.6 52.4 Acquisition of property. plant and equipment (1,369.5) (1,273.7)Expenses on deferred charges (47.9) (101.9)Related companies' sharebuyback (87.4) (179.3)Cash from initial consolidation of the subsidiary - 433.6
CASH USED IN INVESTING ACTIVITIES (1,619.3) 110.7
Supplementary Information FOR THE YEARS ENDED DECEMBER 31, 2005 AND 2004
(In millions of Brazilian reais - R$)

2005 | Relatório Anual | AmBev .83
2005 2004
FINANCING ACTIVITIESFinancings
Funding obtained 8,917.5 6,152.2 Amortization (9,361.1) (7,466.5)
Changes in the capital of minority shareholders (40.7) (28.4)Capital increase - 15.6 Loan to employees for purchase of shares 53.8 103.2 Share buyback (363.1) (1,609.6)Payment of dividends (2,272.0) (602.9)Share buyback premium 91.7 2.6
CASH USED IN FINANCING ACTIVITIES (2,973.9) (3,433.8)
Effect of exchange rate variations on cash and cash equivalents (10.0) (0.8)
INCREASE IN CASH AND EQUIVALENTS (453.6) 94.8
Cash and equivalents at the beginning of the year 1,290.9 1,196.1 Cash and equivalents at the end of the year 837.3 1,290.9
INCREASE (DECREASE) IN CASH AND EQUIVALENTS 453.6 (94.8)
The accompanying notes are an integral part of these financial statements.

84. AmBev | Relatório Anual | 2005
1.OPERATING ACTIVITIESa)General considerations
Companhia de Bebidas das Américas – AmBev (the “Company” or “AmBev”), headquartered in São Paulo, Brazil,produces, sells and distributes beer, draft beer, soft drinks, other non-alcoholic beverages and malt, either directly orby participating in other companies in Brazil and elsewhere in the Americas.
AmBev has a franchise agreement with PepsiCo International, Inc. (“PepsiCo”) to bottle, sell and distribute Pepsiproducts in Brazil and in other Latin American countries, including Lipton Ice Tea and Gatorade, the isotonic sportsdrink. There is also an agreement with PepsiCo for bottling, selling and distributing “Guaraná Antarctica”internationally.
The Company through its subsidiary Labatt Canada, maintains a franchise agreement with Anhenser-Busch, Inc. tobottle, sell and distribute Budweiser products in Canada.
AmBev shares are traded on the São Paulo Stock Exchange – BOVESPA (tickers AMBV4 and AMBV3), and on the NewYork Stock Exchange – NYSE (tickers ABV and ABVc), as American Depositary Receipts – ADRs.
b)Main events occurred in 2005 and 2004
I. Merger of the parent company InBev Holding Brasil S.A. (“InBev Brasil”)On July 28, 2005 in Extraordinary shareholders’ meeting, the Company’s shareholders approved the merger operationof its parent company InBev Brasil.
The referred merger viewed to simplifying the corporate structure comprised by InBev Brasil, AmBev and itssubsidiaries and it will result in financial benefits to AmBev and consequently, to its shareholders and InBev Brasil’sshareholders, as shown as follows.
a. The goodwill originally recorded by InBev Brasil is attributed to the expectation of AmBev’s future results derivedfrom: (i) the acquisition of shares issued by AmBev at the time of the mandatory tender offer, the auction of whichwas held on March 29, 2005 at the amount of R$ 1,351.1; and (ii) from contribution to InBev Brasil’s capital ofshares previously held by Interbrew International B.V. (“IIBV”), at the amount of R$ 7,159.0, which, after the merger,shall be fiscally amortized within ten years by AmBev, in accordance with the prevailing tax legislation and withno impact in AmBev’s dividends flow .
b. InBev Brasil, in compliance with CVM Instruction # 349, recorded a provision prior to its merger by AmBev, at theamount of R$ 5,616.7, corresponding to the difference between the goodwill amount and the tax benefit derivedfrom its amortization, so that AmBev merged only the assets corresponding to the tax benefit resulting from thefact that the goodwill amortization is deductible for tax purposes. The referred provision shall be reverted in sameproportion the goodwill is amortized by AmBev, thus, not affecting the results of operations.
c. The goodwill special reserve recorded at AmBev, as a result of such merger, pursuant to provisions in paragraph1 of Article 6 of CVM Instruction 319, at the end of each fiscal year and to the extent that the tax benefit to beobtained by AmBev, as a result of goodwill amortization represent an effective reduction of taxes paid by AmBev,shall be purpose of capitalization at AmBev to the benefit of InBev Brasil’s shareholders, without any prejudiceto the preemptive right assured to other AmBev’s shareholders in the capital increase subscription resulting fromsuch capitalization, in accordance with the terms of the Article 7, caput and Paragraphs 1 and 2 of CVM Instruction319.
d. InBev NV/SA, parent company of InBev Brasil, undertook by itself and by its direct or indirect subsidiaries tocapitalize only seventy per cent (70%) of the goodwill special reserve value it is entitled to at the end of each fiscalyear, verified in accordance with provisions of item III of Article 6 of the CVM Instruction 319, subject to the limitsof effective decrease of taxes paid by AmBev mentioned above. The value equivalent to the thirty per cent (30%)
Note to the Financial Statements(Amounts in millions of reais - R$, unless otherwise stated)

2005 | Relatório Anual | AmBev .85
non-capitalized balance of reserve, which will benefit AmBev and its shareholders, will be used for distributionto its shareholders as dividends or interest attributed to shareholders’ equity, whenever possible and observingAmBev’s interests.
e. The balance of contingent provisions for the Brazilian Social Integration Program (“PIS”) and Contribution forSocial Security Financing (“COFINS”) at the amount of R$ 10.2 related to the legal discussion regarding thecalculation basis increase of such contributions existing in the balance sheet of InBev Brasil drawn up on May 31,2005, as they represent the contingent liabilities on that date, they were recorded upon merger, against thegoodwill special reserve previously mentioned. If, during the goodwill enjoyment period, AmBev is ultimatelyordered to pay such contributions, the benefit to be capitalized in favor of InBev Brasil’s current shareholdersreferred to by item (b) above will be reduced in the value equivalent to the amount monetarily rested ofcontributions effectively paid. On the other hand, if the referred contingencies are not purpose of ultimatedefinition, until the last capitalization to be carried out in favor of InBev Brasil’s shareholders, the amount of suchcontingencies, duly restated will be deducted from the amount to be capitalized.
f. The merger of InBev Brasil’s assets and liabilities by AmBev on July 28, 2005, resulted in an increase of shareholders’equity of the Company, corresponding to the goodwill special reserve as described in Note 13 (e) as follows:
Merged BalanceCurrent Assets 9.9Goodwill (*) 2,893.4Deferred 2.4Current Liabilities (12.2)Contingencies Provision (10.2)Total Net Assets 2,883.3(*) Represented by the net amount of future benefit of income tax credit over goodwill balance.
II. Merger of the subsidiary Companhia Brasileira de Bebidas (“CBB”)The Company’s shareholders approved at Extraordinary Shareholders’ Meeting held on May 31, 2005 the merger ofthe subsidiary CBB.
Said merger aims at simplifying the corporate structure comprised by AmBev and its subsidiaries, as well as to allowthat the amount of R$ 702.7 of the goodwill originally recorded at AmBev, derived from CBB’s shares acquisition,attributed to the expectation of future profitability, after the merger may be fiscally amortized within ten years,pursuant to tax laws.
As from July 1, 2005, AmBev’s operational results started to incorporate the operational activities previously ownedand directly recorded at CBB. Since CBB’s financial statements were already consolidated, said merger of CBB’s assetsand liabilities by AmBev, appraised at book value, by Ambev, did not have any effects on the consolidated financialstatements. In the individual financial statements, such merger resulted in significant changes, since previouslyAmBev was a holding company, and as from May 31, 2005 started to record CBB’s operations directly in its individualfinancial statements.
The assets and liabilities merged by AmBev on May 31, 2005 are shown as follows:
Merged BalanceCurrent Assets 1,882.4Long-Term Assets 2,209.1Investments 312.9Property, plant and equipment 2,436.5Deferred 451.0Total Assets 7,291.9
Current Liabilities (3,363.1)Long-term Liabilities (3,857.7)Deferred Income (152.8)Treasury Shares 81.7Total Liabilities (7,291.9)
The total debt effect of CBB’s net assets merged by AmBev was R$ 81.7. This amount is composed of R$ 0.04 relatedto AmBev’s shares attributed to CBB’s minority shareholders, plus the amount of R$ 81.6 referring to preferred shares

86. AmBev | Relatório Anual | 2005
issued by AmBev, which were held by CBB and as a result of the merger, they started to be classified in the Company’sshareholders’ equity as “treasury shares”. Such classification is compatible with the treatment previously given tothese shares in the Company’s consolidated financial statements.
III. Integration of Labatt Canada operationsOn August 27, 2004, the Company’s shareholders approved at an Extraordinary Shareholders’ Meeting, the conclusionof the transactions with InBev NV/SA. (“InBev”, previously named as Interbrew S.A.), announced on March 3, 2004,which involved among others, the integration by AmBev of Labatt Canada’s operations through the wholly-ownedsubsidiary of Labatt Holding ApS (“Labatt ApS”), headquartered in Denmark. The total amount of transaction, at theamount of R$ 14,441.0 was recorded as follows: (a) AmBev’s capital stock increase, at the amount of R$ 1,600.7; and(b) increase of goodwill reserve, classified in the capital reserve group at the Company’s shareholders’ equity, at theamount of R$ 12,840.3.
Since Labatt’s operations were consolidated only as from August 27, 2004, the comparison between results of theyears ended on December 31, 2005 and 2004 is harmed. Labatt ApS consolidated effect in AmBev’s consolidatedfinancial statements on December 31, 2005 and 2004, is presented below:
Balances on December 31
2005 2004
Current assets 1,093.4 1,083.0Long-term assets 199.5 256.3Permanent assets 16,546.0 17,768.4Current liabilities (992.6) (3,184.8)Long-term liabilities (2,717.3) (1,499.1)Total net assets 14,129.0 14,423.8
Year endedDecember 31
2005 2004 (*)
Net sales revenue 3,975.5 1,558.8Cost of sales (1,300.3) (502.4)Gross profit 2,675.2 1,056.4Operating expenses (2,485.2) (1,040.8)Operating income 190.0 15.6Non-operating income (160.2) (198.7)Income tax provision (324.8) (93.6)Net loss for the period (295.0) (276.7)
* Labatt ApS’ consolidated result during the period between August 27 and December 31, 2004
As part of the merger agreement of Labatt Canada, InBev committed to reimburse AmBev any fiscal, tax orcontingency disbursement resulting from facts occurred prior to August 27, 2004. On the date of the operation withInBev, Labatt Canada had recognized some certain provisions in its financial statements in Canadian dollars, at theamount equivalent to R$ 193.5 (CAD 86 million). In the fourth quarter of 2004, Labatt Canada recorded additionalprovision, at the amount equivalent to R$ 80.3 (CAD 35.7 million), referring to income tax payable, which, if andwhen converted into effective disbursement, shall be reimbursed to AmBev by InBev. Therefore, on December 31,2005, in the process of elaboration of its consolidated financial statements, AmBev in accordance with the agreementwith InBev, maintained recorded the assets at the amount of CAD 121.7 million, equivalent to R$ 244.8 (R$ 273.9 onDecember 31, 2004) recognized under the item “other current assets – related parties accounts receivable”.
IV. Embotelladora Dominicana, C. per A. (“Embodom”)In February 2004, the Company acquired 51% of capital stock of Embodom, located in the Dominican Republic,generating goodwill at the amount of R$ 173.4, based on the expectation of future results to be amortized within tenyears, starting March 2004. This subsidiary is included in the Company’s consolidated financial statements.
In December 2004, the Company recalculated the goodwill due to adjustments in the shareholders’ equity basis forthe acquisition due to interest losses deriving from capitalizations made by the Company set forth in the acquisitionagreement, resulting in a net adjustment of amortization, at the net amount of R$ 24.0.

2005 | Relatório Anual | AmBev .87
In September 2005, the goodwill balance was adjusted at R$ 17.7, due to the recalculation of accumulated depreciationof property, plant and equipment of such subsidiary by depreciation rates adopted by AmBev.
In December 2005, goodwill was written-off at the amount of R$ 13.6 due to the sale by Embodom of the Red Rocksoft drink brand held by this subsidiary.
2.FINANCIAL STATEMENTS AND SIGNIFICANT ACCOUNTING PRACTICES
The individual consolidated financial statements of the Company and its subsidiaries were prepared and have beenpresented in conformity with the accounting practices adopted in Brazil, Law 6,404/76 and guidance from theBrazilian Securities and Exchange Commission – CVM, applied consistently throughout the years. The mainaccounting practices adopted are:
a)Accounting EstimatesThe preparation of financial statements requires management to make estimates that impact the reported value ofcertain assets, liabilities and other transactions. Thus, estimates are included in the financial statements referringto the useful lives of property, plant and equipment, the provisions necessary to reduce assets to the realizationamount and for contingent liabilities and the determination of provision for income tax, among others, which arebased on the best estimates of the Company’s management; however, actual results could differ from those estimates.The Company’s management periodically reviews these estimates and believes that significant differences mustnot exist.
b)Determination of net incomeIncome and expenses are recorded on accrual basis. Sales revenues and the corresponding cost of sales are recordedupon delivery of products to customers.
c)Current assets and long-term assetsCash and cash equivalents, represented by assets with immediate liquidity and with original maturity of up to 90days, are recorded at acquisition cost, plus income incurred up to the date of the balance sheet and adjusted, whenapplicable, to its equivalent market value.
Financial investments, substantially represented by marketable securities, government securities, and bank depositcertificates, including those denominated in foreign currency, are recorded at cost, adding, when applicable, incomeearned “pro rata temporis”; if necessary, a provision is recorded for reduction to market values. In addition, investmentfund quotas are assessed at market values, and when applicable, a provision is recorded aiming the deferral ofunrealized income of variable nature.
The consolidated balance of financial investments at December 31, 2005 includes bank deposits and financialinvestments given as guarantee, in connection with the issuance of foreign debt securities of subsidiaries, at theamount of R$ 16.3 (R$ 2.4 only in the consolidated on December 31, 2004).
The allowance for doubtful accounts is recorded at an amount deemed sufficient by management to cover probablelosses on realization of receivables and amounts to R$ 169.7 in the consolidated and R$ 125.9 in the parent companyon December 31, 2005 (R$ 175.9 in the consolidated on December 31, 2004).
Inventories are recorded at the average cost of purchases or production, adjusted by a provision for reduction torealizable values when necessary.
Advertising and marketing expenses are deferred within each fiscal year and systematically appropriated to resultsof each period, in accordance with projected sales volume, thereby reflecting the seasonal nature of monthly sales.There are no deferred amounts on December 31, 2005 and 2004.
Other current assets and long-term assets are recorded at cost, including, when applicable, income earned up to theclosing of the fiscal year. A provision for reduction to market values is recorded when necessary.

88. AmBev | Relatório Anual | 2005
d)Permanent assetsInvestments in subsidiaries and jointly-controlled companies are evaluated using the equity method of accountingand, upon initial appraisal, their accounting practices are consistent with those adopted by the Company. The bookvalue of these investments includes the splitting of the acquisition cost into equity investment, goodwill or negativegoodwill.
Goodwill on investments, justified by the appreciation of property, plant and equipment is amortized based on theestimated useful life of the subsidiary’s fixed assets, whereas the goodwill (negative goodwill) attributable to expectedfuture results is amortized over five to ten years and recorded under “Other operating expenses”. Negative goodwill,attributed to various economic factors, will only be amortized from possible disposal or investment written-off.
Property, plant and equipment are recorded at cost and include the interest incurred in financing during theconstruction phase of certain qualified assets. Maintenance and repair costs are recorded as expenses, when incurred.Losses from breakage of bottles and crates during production are included in the cost of goods sold. Other losses inthe realization of property, plant and equipment are appropriately evaluated by the Company’s management, andwhen applicable, a provision is established to face these risks. Depreciation is calculated by the straight-line method,considering the assets’ useful lives, at the annual rates listed in Note 7.
The deferred assets are mainly composed of expenditures incurred during the pre-operational phase, goodwill onthe acquisition of subsidiaries incorporated by the Company and expenditures related to implementation andexpansion (refer to Note 8). Amortization of deferred charges is calculated by the straight-line basis, in up to tenyears, from the date of start of operations, when related to expenses in pre-operating phase and as from the followingmonth to the acquisition, when referring to goodwill.
e) Translation of financial statements of foreign subsidiaries The malt operations located in Argentina and Uruguay, has the US dollar as functional currency, since its revenuesand cash flows are substantially pegged to this currency. The financial statements of foreign subsidiaries are preparedusing the local currency as their functional currency (i.e. the main currency of the economic environment in whichthe company operates).
The assets, liabilities and shareholders’ equity of the foreign subsidiaries are translated into Reais at the exchangerates effective on the date of the financial statements. Income and expense accounts are translated and maintainedin Reais at average exchange rates for the period.
The difference between the net result determined at the exchange rates on the date of the financial statements, andthe net result determined on average exchange rates for the period, is recorded under “Other operating income”.
f)Current and long-term liabilitiesThese are stated at their known or estimated values, added, when applicable, to the corresponding charges andmonetary variations incurred until the end date of the financial statements.
g)Operation with currency and interest derivatives – financial itemsThe Company holds derivative financial instruments to hedge its consolidated exposure to currency and interestrate risks. Accordingly, as determined by the CVM rules, operations “not designated for accounting purposes” aremeasured at their lower of cost based on the contractual conditions between the Company and counterparties (“yieldcurve”) and their market value; and accounted for as “Unrealized gain on derivatives” or “Unrealized loss onderivatives”. For operations designated as hedge, the accounting is based on the amortized cost.
The nominal values of currency and interest rate forward and swap operations are not recorded in the balance sheet.
h)Operations with currencies and commodities derivatives – operating itemsThe Company holds derivative financial instruments to hedge its consolidated exposure to the costs of raw materialto be acquired and operating expenses, prices of which are indexed to prices fluctuation of currencies andcommodities.
The net results of such derivative instruments, designated as hedges for accounting purposes, are measured at marketvalue, deferred and recorded in the Company’s balance sheet under “Other Assets and Liabilities”, and recognized inthe result when the hedge is recognized in results. Regarding raw materials, the recognition in the result occurs when

2005 | Relatório Anual | AmBev .89
product is sold in the account “Cost of goods sold”, in case of expenses, the result will be recognized when the expenseis recognized in results under operating expenses account.
i) Provision for contingencies and liabilities related to tax claimsProvision for contingencies is recorded at monetarily restated values for labor, tax, civil and commercial claims beingdisputed at the administrative and judicial levels, based on estimates of losses determined by the Company’s andits subsidiaries’ independent legal counsels, for lawsuits in which a loss is considered probable.
Expected tax savings obtained based on court decisions resulting from claims filed by the Company and itssubsidiaries against the tax authorities, if recognized in the statement of income, are subject to provisioning untilthe right is assured through a final legal decision in favor of the Company and its subsidiaries.
j) Investment tax credits The Company and its subsidiaries have the benefits of certain state fiscal incentive programs for the deferral of taxesin which taxes are partially or totally reduced. In certain states, the grace periods and reductions are unconditional.
Where conditions have been established, however, they are related to events under the Company’s control. Thebenefits relative to reduction in the payment of taxes are treated as a reserve for investment tax credits and recordedin the subsidiaries’ shareholders’ equity, on accrual basis, or when the subsidiaries comply with the main requirementsof state programs, in order to have the benefit granted. This benefit is recorded as “Other operating income” andtotaled R$ 151.8 on December 31, 2005, in the Company’s consolidated financial statements (R$ 193.3 as of December31, 2004).
k) Income and social contribution taxes on net income Income and social contribution taxes on net income are calculated at rates determined by the applicable tax law.Charges relating to income and social contribution taxes are recorded on accrual basis, with the addition of deferredincome taxes calculated on the temporary differences between book and tax bases of assets and liabilities.
A deferred income tax asset is also recorded, relating to future tax benefits of tax losses and social contributionnegative calculation bases for subsidiaries in which the realization of such benefits is probable over a maximumperiod of ten years, based on future forecasts of taxable income, discounted to present value.
l)Actuarial assets and liabilities related to employee benefitsThe Company and its subsidiaries recognize actuarial assets and liabilities related to employee benefits accordingto the criteria set forth on CVM Resolution 371, as of December 13, 2000.
Actuarial gains and losses are recorded in an amount exceeding the higher between (a) 10% of the present value ofthe actuarial liability and (b) 10% of the fair value of the plan’s assets, amortized over the average future workinglife of the plan’s members.
m)Consolidated financial statementsFor the subsidiaries, the totality of assets, liabilities and results were consolidated, and the interest of minorityshareholders in the shareholders’ equity and results for the year of subsidiaries is shown separately.
Investments in subsidiaries and their shareholders’ equities, as well as inter-company assets, liabilities, income andexpenses, were eliminated on consolidation. Also, unrealized results arising from the purchase of inputs and productsfrom subsidiaries and affiliated companies, included in the balance of inventory at the end of each period, as wellas other transactions between the Company’s subsidiaries, are eliminated.
The consolidated financial statements include the financial statements, prepared at the same dates, of the subsidiarieseither directly or indirectly controlled by the Company.
n)Proportionally consolidated financial statementsThe assets and liabilities, income and expenses of entities which are jointly-controlled through a shareholders’agreement were consolidated proportionally to the Company’s total ownership in the capital stock of the respectivejointly-controlled subsidiary. Amounts corresponding to the proportional assets, liabilities, income and expenses,arising from inter-company transactions, were eliminated on the proportional consolidation.

90. AmBev | Relatório Anual | 2005
Quilmes Industrial S.A. (“Quinsa”) has been acquiring shares of its own issuance, thus, changing the percentage ofthe Company’s economic interest in Quinsa, which on December 31, 2005 reached 59.2%. The percentage variationof stake in Quinsa resulted in a loss of R$ 65.6 for the year ended on December 31, 2005 (R$ 80.8 on December 31, 2004).
Additionally, in September 2005, Quinsa acquired from the parent company Beverage Associates Corp. (“BAC”) 5.32%stake it held in one of Quinsa’s subsidiaries, Quilmes Industrial (Bermudas) Ltd. (“QIB”), as announced on August 4,2005.
As determined in the referred announcement, the value paid of US$ 110 million will be subject to adjustments basedon the LAJIDA (earnings before taxes, amortizations and depreciations) of QIB for the year ended on December 31,2005 and a net debt of QIB on this same date. The final calculation of acquisition price shall be determined untilMarch 31, 2006.
Other joint controlling shareholders of Quinsa, BAC, are entitled to swap their 373.5 million class A shares of Quinsafor AmBev’s shares in the periods specified in each year as from April 2003 or at any moment AmBev’s controlstructure is changed. AmBev is also entitled to determine the swap of class A shares of Quinsa for AmBev’s sharesas from the end of the seventh year (as from April 2003).
On August 4, 2005, BAC and AmBev agreed to implement the following changes referring to the amount to be paidby AmBev to BAC, when Quinsa’s Class A shares held by BAC are swapped for AmBev’s shares: (i) BAC’s stake in Quinsawill be calculated considering that all Quinsa’s shares held by other people rather than AmBev or BAC have beenrepurchased by Quinsa prior to the exercise of call and put options (ii) Quinsa’s net debt used in the formula to calculatethe call and put options amount shall be then adjusted so that to reflect this hypothetical repurchase; and (iii) AmBevwill pay BAC an additional amount in cash equivalent to the LAJIDA of QIB in 2005 multiplied by 0.0638544
The net assets of Quinsa, Agrega Inteligência em Compras Ltda (“Agrega”) and Ice Tea do Brasil Ltda (“ITB”),proportionally consolidated in the Company’s financial statements, are as follows:
December 31, 2005Quinsa Agrega ITB Total
Current assets 523.8 1.4 0.4 525.6Long-term assets 115.1 - 5.1 120.2Permanent assets 1,180.0 0.4 0.8 1,181.2Current liabilities (531.6) (1.8) - (533.4)Long-term liabilities (477.8) - (11.1) (488.9)Minority interest (103.8) - - (103.8)Total net assets (liabilities) 705.7 - (4.8) 700.9
Stake percentage – % 59.2 50.0 50.0
December 31, 2004Quinsa Agrega ITB Total
Current assets 418.8 1.0 0.3 420.1Long-term assets 242.6 - 6.3 248.9Permanent assets 1,138.0 0.5 0.9 1,139.4Current liabilities (436.3) (1.1) - (437.4)Long-term liabilities (440.8) - (11.6) (452.4)Minority interest (201.6) - - (201.6)Total net assets (liabilities) 720.7 0.4 (4.1) 717.0
Stake percentage – % 54.8 50.0 50.0

2005 | Relatório Anual | AmBev .91
Quinsa’s, Agrega’s and ITB’s results, proportionally consolidated in the Company’s financial statements, are as follows:
Year ended December 31, 2005Quinsa Agrega ITB Total
Net revenues 1,299.9 1.2 - 1,301.1Cost of goods and services sold (536.7) - - (536.7)Gross profit 763.2 1.2 764.4Operating expenses (457.7) (3.1) (1.0) (461.8)Operating income (loss) 305.5 (1.9) (1.0) 302.6Non-operating income (9.0) - - (9.0)Income tax provision (113.8) - 0.4 (113.4)Statutory interest (20.1) - - (20.1)Minority interest (39.0) - - (39.0)Net income (loss) for the year 123.6 (1.9) (0.6) 121.1
Year ended December 31, 2004Quinsa Agrega ITB Total
Net revenues 1,153.0 0.8 - 1,153.8Cost of goods and services sold (510.3) - - (510.3)Gross profit 642.7 0.8 - 643.5Operating expenses (432.8) (2.8) (0.9) (436.5)Operating income (loss) 209.9 (2.0) (0.9) 207.0Non-operating income 2.4 - - 2.4Income tax provision (77.0) - 0.3 (76.7)Statutory interest (19.7) - - (19.7)Minority interest (29.2) - - (29.2)Net income (loss) for the year 86.4 (2.0) (0.6) 83.8
The table below shows Quinsa’s main holdings in subsidiaries, fully consolidated to its financial statements, andproportionally adjusted in AmBev’s consolidated financial statements:
Total holdings onDecember 31,
2005 – %Cerveceria y Malteria Quilmes S.A.I.C.A. y G. 92.67%Cerveceria Boliviana Nacional La Paz 79.25%Cerveceria Chile S.A. 92.95%Cerveceria Paraguay S.A. 81.19%Fábrica Paraguaya de Vitrios S.A. 92.68%Fábricas Nacionales de Cerveza S.A. 90.58%Quilmes Industrial (Bermuda) Ltd. – QIB 92.95%
o)ReclassificationsWith a view to improving the presentation of certain values and transactions in its consolidated financial statements,as well as to maintain the comparison between periods, the Company made the reclassification of: (i) the result of“net gains on derivative instruments” and “net losses on derivative instruments”, shown in the note 15 (d); (ii)“unrealized losses on derivative operations” and “exchange variation and unrealized gains on financial assets”, shownin the cash flow statements; (iii) the Excise Tax (“IPI”) amounts – zero rate classified in long-term assets, under theitem “other recoverable taxes and charges” for the long-term liabilities, under the item “ICMS and IPI Contingencies”;and (iv) the amount of certain projects classified as other investments for deferred charges.

92. AmBev | Relatório Anual | 2005
3.INVENTORIESParent Company Consolidated
2005 2004 2005 2004
Finished products 143.2 - 322.2 396.8Work in progress 46.1 - 67.8 62.8Raw materials 231.0 - 515.1 606.7Production materials 96.4 - 186.6 199.3Supplies and others 56.8 - 113.7 132.8Provision for losses (16.0) - (27.3) (17.5)
557.5 - 1,178.1 1,380.9
4.TRANSACTIONS WITH RELATED PARTIESThe main transactions of the Company with related parties are listed in the following table:
2005Balances Transactions
Inter- NetAccounts Accounts company Net financial
Companies receivable Payable loans sales results
AmBev 804.3 (1,748.0) (1,559.2) 366.7 (324.2)CBB (iv) - - - 113.8 108.4Fratelli (iii) - (11.2) 133.3 6.7 (6.1)IBA – Sudeste - - - 44.4 399.1Jalua - - (40.8) - (51.3)Monthiers 3.4 - 1,421.9 - (68.6)Arosuco 4.5 - 384.5 511.6 -Dunvegan 216.6 - (417.5) - 36.3Cympay 0.4 - 16.8 98.2 0.4Malteria Pampa 8.3 - - 145.4 -Eagle - (868.1) - - -CRBS 122.6 - - - -Aspen - - (153.1) - 5.7Labatt Canada (i) (ii) 283.4 - 14.6 214.8 -Other nationals 63.4 (9.2) 233.3 (1.3) 2.9Other internationals 4.0 (106.1) (35.2) (175.5) (2.9)
2004Balances Transactions
Inter- NetAccounts Accounts company Net financial
Companies receivable Payable loans sales results
AmBev - (2.0) (3,334.0) - (219.7)CBB 24.4 - 1,789.7 234.7 168.2Fratelli - (4.3) (51.8) - -IBA-Sudeste 3.2 - 1,125.5 29.8 -Jalua - - 11.9 - (55.6)Monthiers - - 1,242.2 - 68.9Arosuco 5.2 - 336.3 416.6 -Dunvegan - - (873.0) - 45.3Cympay - (12.4) - 116.2 (0.3)Malteria Pampa 6.0 - - 152.3 -Aspen - - (197.0) - (1.7)Labatt Canada (i) (ii) 323.8 (14.1) - 85.7 -Other nationals 74.3 (74.6) (38.2) 64.7 (9.1)Other internationals 5.4 (24.4) (7.7) 152.0 1.2

2005 | Relatório Anual | AmBev .93
(i) Transaction with other companies associated with InBev, which are not eliminated in the Company’s consolidated financial statements.
(ii) Additionally, there are service agreements between Labatt Canada and InBev in which services rendered or expenses incurred on behalfof the other party are reimbursed. On December 31, 2005, Labatt Canada showed accounts receivable balance, at the amount of R$ 6.6 (R$6.6 on December 31, 2004) and accounts payable balance, at the amount of R$ 3.5 (R$ 1.7 on December 31, 2004) with InBev as part of thereferred agreements.
(iii)On November 30, 2005, Fratelli merged IBA-Sudeste.
(iv) As mentioned in note 1(b)(ii), CBB was merged by AmBev on May, 31, 2005.
Names used:
Indústria de Bebidas Antarctica do Sudeste S.A. (“IBA-Sudeste”)Jalua Spain S.L. (“Jalua”)Monthiers S.A. (“Monthiers”)Arosuco Aromas e Sucos Ltda. (“Arosuco”)Dunvegan S.A. (“Dunvegan”)Cervecería y Maltería Paysandú – Cympay (“Cympay”)Maltería Pampa S.A. (“Maltería Pampa”)Aspen Equities Corporation (“Aspen”)Fratelli Vita Bebidas S.A. (“Fratelli”)
Transactions with related parties are carried out under usual market conditions and include, among other operations,the purchase and sale of raw materials such as malt, concentrates, labels, crown caps and several finished products.
Loan agreements among the Company’s subsidiaries in Brazil have undetermined duration and suffer the assessmentof market financial charges, except for some agreements with subsidiaries, which do not fall upon charges.
The agreements involving the Company’s subsidiaries headquartered abroad are usually monetarily indexed basedon the US dollar variation, plus interest of up to 10% p.a.
5.OTHER ASSETSParent Company Consolidated
2005 2004 2005 2004
Current assetsDeferred income from commodities, swap and forward operations, net 75.6 - 75.6 54.9Advertising expenses reimbursement 42.5 - 45.6 24.1Prepaid expenses 233.5 0.2 296.0 242.1Advances to suppliers and others 0.3 - 23.1 42.8Accounts receivable – related parties 13.7 - 265.4 297.8Other accounts receivable 13.1 0.8 73.9 91.1
378.8 1.0 779.6 752.8
Long-term assetsLong-term financial investments - - 69.4 147.4Other taxes and charges recoverable (i) 108.2 11.9 130.8 134.2Prepaid expenses 112.0 - 126.5 111.7Surplus assets – Instituto AmBev (Note 12 a) 20.0 - 20.0 20.6Other accounts with related parties - - 4.8 -Other accounts receivable 5.5 - 24.6 39.7
245.7 11.9 376.1 453.6
(i) The Company recognized on the book IPI credits at zero rate and not used, at the amount of R$ 171.6 in the Parent Company and R$ 228.1 inthe consolidated (R$ 73.1 and R$ 228.1 on December 31, 2004 in the Parent Company and in the consolidated respectively), for which aprovision for losses for total credits has been maintained.
On December 31, 2005 the balance of this provision, previously recorded in liabilities, was transferred to the contra-assets account, named as “Other taxes and charges recoverable” with a view to better reflecting the Company’sfinancial status.

94. AmBev | Relatório Anual | 2005
6.INVESTMENT IN DIRECT SUBSIDIARIESa)Changes in investments in direct subsidiaries, including goodwill and
negative goodwill
Interest insubsidiaries Goodwill Total
Balance on December 31, 2003 5,446.9 319.0 5,765.9Investment acquisition 14,441.0 - 14,441.0Capital increase 1.8 - 1.8Equity pick-up 1,065.1 - 1,065.1Exchange variation in subsidiary abroad 259.4 - 259.4Goodwill amortization - (84.8) (84.8)Capital refund of subsidiary (486.4) - (486.4)Prepaid dividends of subsidiary (902.7) - (902.7)
Balance on December 31, 2004 19,825.1 234.2 20,059.3Arosuco – dividends received and receivable (531.9) - (531.9)Equity pick-up (iii) 828.6 - 828.6Exchange variation in subsidiary abroad (2.9) - (2.9)Goodwill amortization - (52.8) (52.8)Direct interest held by mergee CBB (note 1 (b)(ii)) 477.0 (166.8) 310.2Provision for losses on investments (8.9) - (8.9)Capital refund of subsidiary (i) (836.8) - (836.8)Disposal of treasury shares 33.8 - 33.8Loss of ownership in subsidiary (3.3) - (3.3)Prepaid dividends IBA Sudeste (ii) (161.3) - (161.3)
Balance on December 31, 2005 19,619.4 14.6 19,634.0
(i) This balance refers to capital refund by IBA Sudeste, approved by its shareholders on June 3, 2005 at the total amount of R$ 1,100.0, and thecapital stock from R$ 1,301.9 to R$ 201.9, without changes in the number of shares issued by the subsidiary, and the capital reductionresolved herein being subject to the conditions set forth in the Article 174 of Law 6,404/76. Thus, the refund value was recognized in IBASudeste’s assets and liabilities on August 31, 2005, the date of payment and the end of the limitation period for creditors’ opposition.
(ii) On September 2, 2005, IBA Sudeste’s Board of Executive Officers, approved the dividends distribution, on account of the income earned inthe 1st half-year period of 2005 to be imputed to the mandatory minimum dividends of 2005 at the amount of R$ 210.4, the Companybeing entitled to the amount of R$ 161.3. The portion of dividends, plus the capital reduction, the benefit of which was AmBev’s was offsetwith the balance of loans receivable that AmBev maintained with IBA Sudeste.
(iii)This result considers the goodwill amortization of Labatt ApS in Labatt Canada at the amount of R$ 923.4.

2005 | Relatório Anual | AmBev .95
b)Goodwill and negative goodwill
Parent Company Consolidated2005 2004 2005 2004
GoodwillCBB – based on Property, plant and equipment fair value excess (i) - 144.6 - 144.6Expected future profitability (i) - 702.7 - 702.7
- 847.3 - 847.3Expected future profitability
Labatt Canada (v) - - 16,383.3 16,677.7Quinsa - - 1,123.2 1,123.2Cympay - - 26.6 26.6Embodom - - 224.1 214.9Malteria Pampa 9.3 - 28.1 28.1Patí do Alferes Participações S.A. 3.4 - - -Indústrias Del Atlântico - - 5.1 5.1Brakl Distributor 101.9 - - -Ribeirão Preto Distributor 73.4 - - -Jaguariúna Distributor 6.7 - - -Cervejaria Miranda Corrêa S.A. 5.5 - 5.5 5.5Labatt Canada Subsidiaries (ii) - - 3,323.9 3,648.6Quinsa Subsidiaries (proportionally consolidated) (iv) - - 622.2 547.6
Total goodwill 200.2 847.3 21,742.0 23,124.6Accumulated amortization (185.6) (463.3) (4,997.2) (4,779.1)Total goodwill, net 14.6 384.0 16,744.8 18,345.5
Negative goodwillCBB (iii) - (149.9) - (149.9)Cerversursa - - (14.4) (16.4)Incesa (Quinsa’s subsidiary) - - (8.2) (8.8)
Total negative goodwill - (149.9) (22.6) (175.1)Balance 14.6 234.1 16,722.2 18,170.4
(i) In May 2005, the Company merged the net assets of its subsidiary CBB by book value as mentioned in note 1 (b) (ii).
(ii) The balance of the accumulated amortization referring to goodwill existing in Labatt Canada amounted to R$ 3,289.7 on December 31, 2005(R$ 3,418.2 on December 31, 2004).
(iii)The negative goodwill on investment in the subsidiary CBB was reclassified to “deferred income”, as a result of net assets merger of thissubsidiary, as mentioned in note 1(b)(ii).
(iv) As mentioned in note 2 (n), Quinsa acquired by the amount of US$ 110.0 million (equivalent to R$ 244.4) the stake of 5.32% that BAC held inQIB, verifying a goodwill in this transaction of US$ 74.9 million (equivalent to R$ 166.4). The effect on the Company’s consolidated is theamount of R$ 97.3.
(v) The accumulated amortization balance referring to Labatt APS’ goodwill in Labatt Canada amounts to R$ 1,034.8 (R$ 409.7 on December 31,2004).

96. AmBev | Relatório Anual | 2005
c) Information on direct subsidiaries
December 31, 2005CRBS Arosuco (I) Agrega Hohneck Labatt ApS
Number of shares/quotas held – in thousandsCommon shares/quotas 765,961 0.3 6,510 602,468 1,000,017Preferred shares - - - - -Total shares/quotas 765,961 0.3 6,510 602,468 1,000,017
Percentage of direct ownership in capital stockIn relation to preferred shares - - - - -In relation to common shares/quotas 99.65 99.7 50.0 50.7 100.0In relation to total shares/quotas 99.65 99.7 50.0 50.7 100.0
Information on financial statements of direct subsidiaries:Adjusted shareholders’ equity 177.3 373.2 0.1 1,165.4 14,132.0
Investment 176.7 343.6 - 590.7 14,131.8
Adjusted net income (loss) (7.9) 273.2 (3.8) (80.2) (292.0)
Equity in the results of subsidiaries (ii) (9.2) 380.4 (1.9) (30.0) (292.0)
December 31, 2005Dahlen BSA Pepsi Anep Fratelli
Number of shares/quotas held – in thousandsCommon shares/quotas 480 31,595 77,084 669,019 299.06Preferred shares - - - - 143.74
Total shares/quotas 480 31,595 77,084 669,019 442.80
Percentage of direct ownership in capital stockIn relation to common shares/quotas 100.0 100.0 99.5 100.0 71.9In relation to total shares/quotas 100.0 100.0 99.5 100.0 77.8
Information on financial statements of direct subsidiaries:Adjusted shareholders’ equity 31.6 10.3 242.7 395.6 401.7
Investment 31.6 10.3 241.5 395.6 312.7
Adjusted net income (loss) 4.7 - 14.5 71.6 28.2
Equity in the results of subsidiaries(ii) 3.1 - 1.3 22.3 18.7

2005 | Relatório Anual | AmBev .97
December 31, 2005Maltaria Lambic Miranda
Pampa Eagle Holding Correa Skol Total
Number of shares/quotas held – in thousandsCommon shares/quotas 1,439,147 278 13,641 37 91Preferred shares - - - - -
Total shares/quotas 1,439,147 278 13,641 37 91
Percentage of direct ownership in capital stockIn relation to common shares/quotas 60.0 99.96 87.33 100.0 99.96In relation to total shares/quotas 60.0 99.96 87.33 100.0 99.96
Information on financial statements of direct subsidiaries:Adjusted shareholders’ equity 196.9 2,376.1 250.0 11.5 687.0
Investment 102.2 2,375.1 218.3 11.5 686.7 19,628.3
Adjusted net income (loss) 23.3 (284.4) (4.8) 6.9 (24.3)
Equity in the results of subsidiaries(ii) 7.1 (55.8) (5.1) 6.8 (16.6) 29.1
(i) The equity in the results of subsidiaries recognized by AmBev during the year ended on December 31, 2005 is impacted by tax incentivesgains, verified by the subsidiary Arosuco, at the amount of R$ 112.9.
(ii) The equity in the results of subsidiaries referring to investments held until May 31, 2005 by the mergee CBB corresponds to the incomeearned by such investees during the period between June and December 2005.
The investments balance on December 31, 2005 considers a provision for unearned income in subsidiaries at theamount of R$ 44.5 (R$ 30.2 on December 31, 2004).
The equity in the results of subsidiaries recognized by AmBev during the year ended on December 31, 2005, includesthe results of R$ 743.4 and R$ 56.1 of the merged subsidiaries CBB and IBA-Sudeste, respectively.
December 31, 2004Description CBB Arosuco Agrega Hohneck Labatt ApS Total
Number of shares/quotas held – in thousandsCommon shares/quotas 19,881,631 0.3 6,510 10,000 1,000,017Preferred shares 35,206,009 - - - -Total shares/quotas 55,087,640 0.3 6,510 10,000 1,000,017
Percentage of direct ownership in capital stock
In relation to preferred shares 99.9 - - - -In relation to common shares/quotas 99.9 99.7 50.0 0.009 100.0In relation to total shares/quotas 99.9 99.7 50.0 0.009 100.0
Information on financial statements of direct subsidiaries:Adjusted shareholders’ equity 5,067.9 334.2 0.8 1,245.5 14,423.7
Investment 5,067.8 333.2 0.4 - 14,423.7 19,825.1
Adjusted net income (loss) 948.3 219.8 (4.0) (69.6) (276.7)
Equity in the results of subsidiaries (ii) 1,035.3 308.5 (2.0) - (276.7) 1,065.1

98. AmBev | Relatório Anual | 2005
d)Main indirect holdings in subsidiaries and joint subsidiaries
Total indirect holdings – %
Company Name 2005 2004
BrazilEagle (iii) - 100.0IBA-Sudeste (ii) - 99.3
AbroadQuinsa 59.2 54.8Jalua Spain S.L. 100.0 100.0Lambic S.A. (iii) - 87.3Monthiers (i) 100.0 100.0Aspen 100.0 100.0
(i) Wholly-owned subsidiary of Jalua Spain S.L.
(ii) Company merged on November 30, 2005 by the parent company Fratelli.
(iii)With CBB merger by AmBev, the companies Eagle and Lambic S.A. became direct investees.
7.PROPERTY, PLANT AND EQUIPMENTa)Composition of property, plant and equipment
Parent Company2005 2004
AnnualAccumulated Residual Residual depreciation
Cost depreciation amounts amounts rates – %
Land 92.0 - 92.0 -Buildings and constructions 1,259.5 (652.0) 607.5 - 4Machinery and equipment 3,759.3 (3,175.3) 584.0 - 10 (i)External use movable assets 1,004.1 (457.0) 547.1 - 10 (i)Other assets and intangibles 1,082.1 (600.6) 481.5 - 4 to 20 (ii)Construction in progress 162.1 - 162.1
7,359.1 (4,884.9) 2,474.2 -
Consolidated2005 2004 Annual
Accumulated Residual Residual depreciationCost depreciation amounts amounts rates – %
Land 309.9 - 309.9 328.6Buildings and constructions 2,602.5 (1,259.8) 1,342.7 1,386.2 4Machinery and equipment 8,242.5 (6,333.3) 1,909.2 1,994.9 10 (i)External use movable assets 1,723.2 (809.5) 913.7 876.7 10 (i)Other assets and intangibles 1,262.2 (775.3) 486.9 577.0 4 to 20 (ii)Construction in progress 442.2 - 442.2 368.3
14,582.5 (9,177.9) 5,404.6 5,531.7
(i) Rates may vary due to the number of production shifts in which the good is used.
(ii) Concentration of assets with annual depreciation rate of 20% as of December 31, 2005 and 2004.
On December 31, 2005, the Company and its subsidiaries maintain immovable assets destined to sale, at the residualvalue of R$101.3 at the Parent Company and R$104.5 at the consolidated (R$ 113.8, on December 31, 2004 in theconsolidated), which are classified in long-term assets, net of provision for potential losses in the realization, at theamount of R$ 65.1 at the Parent Company and R$ 66.3 in consolidated (R$ 69.1 on December 31, 2004 in consolidated).

2005 | Relatório Anual | AmBev .99
b)Pledged assetsIn view of bank loans and leases assumed by the Company and its subsidiaries on December 31, 2005, there arepledged assets and property, at the residual amount of R$ 538.9 (R$ 781.4 on December 31, 2004). Such restrictionhas no impact on the use of such assets and on the Company’s operations.
8.DEFERREDParent Company Consolidated
2005 2004 2005 2004
CostPre-operating 168.9 71.8 243.1 208.6Implementation and expansion expenses 48.3 - 53.5 53.9Goodwill – Future Profitability (i) 9,322.0 - 9,322.0 109.1Provision for goodwill realization (ii) (5,650.4) - (5,650.4) -Other 167.4 - 202.0 162.6
Total cost 4,056.2 71.8 4,170.2 534.2Accumulated amortization (908.2) (6.3) (936.9) (240.1)Net deferred 3,148.0 65.5 3,233.3 294.1
(i) It substantially refers to goodwill balance, originally recorded at the Parent Company InBev Brasil, which was transferred to the Company,as a result of the merger process occurred on July 28, 2005. The goodwill reclassified to the deferred charges is based on the projections offuture results of operations supporting its generation.
(ii) As mentioned in note 1 (b)(i)(b), such provision corresponds to the difference between goodwill amount and tax benefit derived from itsappropriation.
9.LOANS AND FINANCING Parent Company
Current Long-term
Types/purposes Final Maturity Annual Interest Rate Currency 2005 2004 2005 2004
In R$ (local currency)ICMS sales tax incentives September 2015 4.77% R$ 86.2 - 228.0 -Investments in Long-term interest ratepermanent assets December 2010 (TJLP)+ 3% to 4.5% R$ 104.2 - 362.3 -Working Capital January 2006 104% CDI R$ 1.4 - - -
191.8 - 590.3 -
Foreign currencyWorking Capital June 2006 2.90% to 4.90% USD 541.1 - - -Bond 2011 December 2011 10.50% USD 6.0 - 1,170.4 -Bond 2013 September 2013 8.75% USD 35.1 - 1,170.4 -Investments in permanent assets January 2009 3.0% to 4.5% UMBNDES 16.0 - 63.4 -
598.2 - 2,404.2 -Total 790.0 - 2,994.5 -
ConsolidatedCurrent Long-term
Types/purposes Final Maturity Annual Interest Rate Currency 2005 2004 2005 2004
In R$ (local currency)ICMS sales tax incentives September 2015 4.77% R$ 89.5 93.5 237.3 288.2Investments Long-term interest rate in permanent assets December 2010 (TJLP) +3% to 4.5% R$ 104.2 135.2 362.3 209.5Working Capital January 2006 104% of CDI R$ 1.4 274.5 - -
195.1 503.2 599.6 497.7

100. AmBev | Relatório Anual | 2005
ConsolidatedCurrent Long-term
Types/purposes Final Maturity Annual Interest Rate Currency 2005 2004 2005 2004
Foreign currencyWorking Capital October 2010 2.5% to 5.50% USD 673.7 462.4 103.0 367.1Working Capital October 2010 BA + 0.45% CAD 4.8 1.911.7 1.408.2 737.7Working Capital January 2006 4.48% ARS 27.9 - - -Working Capital September 2008 12.0% VEB 30.8 136.1 117.4 -Working Capital April 2012 18.0% DOP 51.0 26.8 32.4 16.1Working Capital October 2010 7.75% GTQ 27.5 35.7 37.8 -Working Capital October 2010 6.75% PEN 28.8 - 158.6 -Bond 2011 December 2011 10.50% USD 6.0 6.8 1,170.3 1,327.2Bond 2013 September 2013 8.75% USD 35.1 39.8 1,170.3 1,327.2Imports financing January 2007 4.85% to 6.5% USD 4.6 262.8 58.1 -Investments in permanent assets September 2011 7.5% to 8.45% USD 70.5 - 341.3 -Investments in permanent assets January 2009 3.0% to 4.5% UMBNDES 16.0 16.8 63.5 40.1Notes –A Series July 2008 6.56% USD - - 379.2 -Notes –B Series July 2008 6.07% CAD - - 100.6 -Senior Notes – BRI June 2011 7.50% CAD - - 178.6 -Others September 2007 8.36% USD 37.6 41.0 75.3 54.5
1,014.3 2,939.9 5,394.6 3,869.9Total 1,209.4 3,443.1 5,994.2 4,367.6
Abbreviations used:USD United States Dollar CAD Canadian DollarARS Argentine Peso VEB Venezuelan BolivarDOP Dominican Peso GTQ Guatemalan quetzalPEN Peruvian sol TJLP Long-Term Interest Rate
ICMS Value-Added Tax on Sales and Services corresponding to 9.75% p.a. on 12.31.05CDI Interbank Deposit Certificate BA Bankers Acceptance – corresponding to 3.106% on 12.31.05
corresponding to 17.99% p.a. on 12.31.05 UMBNDES Rate incurring on BNDES financing pegged to Currency Basket
a)GuaranteesLoans and financings for expansion, construction of new plants and purchase of equipment are guaranteed by plantsreal estate mortgage and conditional sale on equipment, see note 7(b).
AmBev’s subsidiaries, except for North America operations, hold debt and raw materials purchase agreements securedby AmBev’s sureties and guarantees.
b)Maturities As of December 31, 2005, long-term financings fall due as follows:
2007 529.52008 1,012.42009 118.02010 1,684.52011 and onwards 2,649.8
5,994.2
c) ICMS sales tax incentives
Parent Company Consolidated2005 2004 2005 2004
Current liabilitiesFinancing 86.2 - 89.5 93.5Deferral of taxes on sales 19.5 - 19.5 54.5
Long-term liabilitiesFinancing 228.0 - 237.3 288.2Deferral of taxes on sales 352.6 - 352.6 275.7

2005 | Relatório Anual | AmBev .101
Financings refer to programs offered by certain Brazilian states, through which a percentage of the ICMS sales taxdue is financed by the financial agent associated to the Government, on average for a six-year period as from ICMSoriginal maturity date.
The remaining amounts refer to the financed deferrals of ICMS due for periods of up to twelve years, as part ofindustrial incentive programs. The deferred percentages may be fixed during the program or vary regressively, from75% in the first year to 40% in the final year. The deferred amounts are partially indexed by 60% to 80% of a generalprice index. The deferral of taxes on sales is classified in current liabilities under the item “Other taxes andcontributions payable”.
d)Notes issued on the international marketThe Company issued in September 2003 US$ 500 million in foreign securities (“Bond 2013”), with a guarantee fromAmBev. These Notes incur 8.75% interest p.a., and will be amortized semi-annually from March 2004, with finalmaturity in September 2013. On August 10, 2004, the Company registered Bond 2013 at the SEC (Securities andExchange Commission) under the U.S. Securities Act of 1933 and its subsequent amendments. In addition, Bond 2013was registered at the Luxembourg Stock Exchange for settlement through the Depository Trust Company (“DTC”),Euroclear and Clearstream.
The Company issued in December 2001 US$ 500 million in foreign securities (“Bond 2011”), with a guarantee fromAmBev. These Notes incur 10.5% interest p.a., amortized semi-annually from June 2002, with final maturity inDecember 2011. The Company registered Bond 2011 at the SEC on October 4, 2002.
e)Labatt Canada
I. Working capitalOn December 12, 2002 and on May 25, 2004, Labatt Canada entered into two forward credit agreements at therespective amounts of CAD 600 million and CAD 700 million, with a bank syndicate and with same maturity dateon December 12, 2005. Both agreements were fully paid on October 12, 2005.
On October 12, 2005 a syndicated loan of CAD 1.2 billion was also made, of which forward CAD 900 million and CAD300 million revolving credit with maturity dated on October 12, 2010, and interest at the bankers acceptance rate,plus applicable margin, the ceiling of which is 0.75% per annum. On December 31, 2005, the bankers’ acceptanceaverage rate on the debt stood at 3.106% p.a. and the applicable margin was 0.35% per annum.
II. Senior notesOn July 23, 1998, Labatt Canada entered into a loan agreement of US$ 162 million, represented by Series A Bank Notes(“Notes – Series A”) and CAD$ 50 million in Series B Bank Notes (“Notes – Series B”), contracted from a groupinstitutional investors. The Notes are subject to the following interest rates: (a) 6.56% p.a., over the portion in USdollars; and (b) 6.07% p.a. over the Canadian dollars. The Notes mature on July 23, 2008.
On June 15, 2001, Brewers Retail Inc (“BRI”), a company proportionally consolidated by Labatt Canada, entered into aCAD 200 million loan agreement through Senior Notes (“Senior Notes – BRI”), with a group of institutional investors.Senior Notes are subject to fixed interest rates of 7.5% p.a. and the maturity date is June 15, 2011.
f)Contractual clausesAs of December 31, 2005, the Company and its subsidiaries are in performance of indebtedness/liquidity ratioscommitted in view of loans obtained.

102. AmBev | Relatório Anual | 2005
10.OTHER LIABILITIESParent Company Consolidated
2005 2004 2005 2004
Current liabilitiesDividends payable - - 5.5 -Deposits for containers (i) - - 79.1 84.4Provision for restructuring (ii) - - 106.5 183.0Provision for clearance of area 48.5 - 48.5 24.5Provision for income tax contingency (Note 11h) - - 124.5 189.9Marketing accounts payable 151.7 - 151.7 101.1Deferred income of forward and swap commodities operations, net 0.3 - 41.2 12.7Provision for royalties payment - - 33.9 37.1Accounts payable for share buyback 74.2 - 74.2 -Other accounts payable 101.8 0.1 233.7 226.9
376.5 0.1 898.8 859.6
Long-term liabilitiesProvision for medical assistance benefits and others (Note 12 b) 84.4 - 584.6 646.0Deferred income and social contribution taxes (Note 16 c) 26.7 - 94.6 138.5Deferred income of debt swap operations, net - - 95.8 90.3Other accounts payable 0.5 - 50.7 61.5
111.6 - 825.7 936.3
(i) Such deposits are made by points-of-sale in Canada at the time the beer is sold, as a guarantee for the bottles, and reimbursed when thebottles are returned.
(ii) On September 8, 2004, Labatt Canada announced the shutting down of its plant in New Westminster, British Columbia. In order to faceexpenses mainly related to dismissals, based on an agreement entered into with Labor Union, Labatt recorded a provision at the totalamount of CAD 22.2 million in 2004 (equivalent to R$ 49.1 in December 31, 2004). The shutting down of such plant occurred in November2005, and said provision was reduced to CAD 3.6 million (equivalent to R$ 7.3 on December 31, 2005).
Additionally, in December 2004, Labatt Canada announced a workforce restructuring aiming at reducing overhead fixed cost by 20%. Asa result, Labatt recorded a provision of CAD$ 60.7 million (equivalent to R$ 122.1 on December 31, 2005 and R$ 134.0 on December 31, 2004)to cover the expenditures related to dismissals. On December 31, 2005 the balance of such provision was reduced to CAD 41.1 million(equivalent to R$ 82.7 on December 31, 2005).
On March 31, 2005, Labatt Canada announced the shutting down of Metro Brewery plant, in Toronto, Ontario. The closing shall occur in2006. The balance of this provision on December 31, 2005 is CAD 8.2 million (equivalent to R$ 16,5 December 31, 2005).
11.CONTINGENCIES (Consolidated)Balance Monetary Balance
on Reclassifi- and exchange on 12.31.2004 Additions Payments Reversals cations restatement 12.31.2005
PIS and COFINS 383.5 6.6 (3.4) (41.0) 10.2 38.6 394.5ICMS and IPI 312.4 50.5 (4.3) (139.2) - 2.2 221.6IRPJ and CSLL 71.3 7.9 - (5.8) - (0.4) 73.0Labor claims 309.0 218.6 (55.7) (109.9) (*) (88.7) 5.0 278.3Distributors and dealers 47.2 39.8 (9.1) (34.0) - (0.1) 43.8Other 119.5 37.0 (14.7) (19.7) (6.2) 1.1 117.0
1,242.9 360.4 (87.2) (349.6) (84.7) 46.4 1,128.2
(*) Reclassificattion of the balance for contingencies to accounts payable referring to lawsuits closed through legal agreements
Abbreviations used:
IRPJ – Corporate Income Tax; and CSLL – Social Contribution on Net Income
On December 31, 2005, the Company and its subsidiaries also maintained in progress other lawsuits for which,according to the legal counsel, the risk of loss is possible but not probable. Such lawsuits amount to R$ 4,557.0 (R$1,241.1 on December 31, 2004), for which the Company’s management understands that the recording of provisionfor possible loss is not necessary.

2005 | Relatório Anual | AmBev .103
During the year ended on December 31, 2005, possible contingencies showed an increase of approximately R$ 3,316.0,mainly due to new tax deficiency notices received by the Company and its subsidiaries related to tax authorities’understanding about the Brazilian laws dealing with taxation in Brazil of profits obtained by subsidiaries or affiliatedcompanies organized out of the country.
Based on its external consultants’ opinion, the Company understands that such tax defficiency notices were madebased on mistaken analysis of the laws mentioned above, because among other factor: (i) it considers the assumptionof availability, which did not exist in prevailing laws in the period reffering to the deficiency notice; (ii) it disregardsthe existence of a treaty entered into between Brazil and Spain to avoid double taxation; and (iii) by mistake in theascertainment of amounts suposedly due.
The Company, based on the opinion of its external consultants did not make provisions in relation to the taxdefficiency notices received in the period, as well as those previous ones about the same matter, amounting to R$3,600.5 since the Company understands these are not justified. Nevertheless, since laws had not been subject-matterof examination on highest stage by the Judiciary Branch, the Company, based on the opinion of its legal consultantsconsidered the probability of loss as possible at the amount of R$ 2,451.3 and as remote, at the amount of R$ 1,149.2
Main liabilities related to fiscal claims and provisions for contingencies:
a)PIS and COFINSI. PIS – The Company and its subsidiaries obtained an injunction during the first quarter of 1999, which was
confirmed by a lower court judgment, granting the right to pay PIS (up to December 31, 2002) on billings, withoutpaying these taxes on other revenues. Following the enactment of Law No. 10,637 as of December 31, 2002, whichestablished new rules for calculating PIS with effects from December 1, 2002, the Company and its subsidiariesbegan to pay such contribution on other revenues, as prescribed by prevailing laws.
II. COFINS – The 3rd Regional Federal Court confirmed a legal decision in favor of the Company and its subsidiaries,which allows them to pay COFINS on billings, without paying these taxes on other income. Following theenactment of Law No. 10,833/03 as of December 29, 2003, effectively February 1, 2004 the Company and itssubsidiaries began to pay these taxes, as established by prevailing laws.
b) ICMS and IPI TaxesProvision mainly relates to extemporaneous ICMS credits on purchases of property, plant and equipment prior to1996.
The Company has IPI credits at zero rate, amounting to R$ 171.6 in the parent company and R$ 228.1 in consolidatedas of December 31, 2005 (R$ 73.1 and R$ 228.1 on December 31, 2004 in the parent company and in the consolidated,respectively), was reclassified to the account “Other assets – other taxes and charges recoverable” of long-term assets,as mentioned in note 2 (o).
c) Income and social contribution These provisions relate substantially to the recognition of the deductibility of interest attributed to shareholders’equity in the calculation of social contribution tax for the year 1996.
d)Labor claimsThese provisions relate to claims from former employees. On December 31, 2005, judicial deposits for labor claimspaid by the Company and its subsidiaries amounted to R$ 151.2 (R$ 129.6 on December 31, 2004) and are recordedunder “Judicial Deposits, Compulsory and Fiscal Incentives”.
e)Distributors’ claimsThis provision relates mainly to contractual terminations between the Company’s subsidiaries and certaindistributors, due to the non-compliance, by the distributors, with the Company’s directives.
f)Other provisionsThese provisions substantially relate to issues involving the National Social Security Institute (INSS), products andto suppliers.

104. AmBev | Relatório Anual | 2005
g)Labatt CanadaCertain beverage and alcoholic beverage producers of the United States, Canada and Europe were named in collectivesuits for seeking damages over the alleged marketing of alcoholic beverages to underage consumers. Labatt Canadawas named in one of these lawsuits. Labatt will vigorously defend this litigation and, at this time, it is not possibleto estimate the risk of loss or estimate the range of loss, if any.
Labatt was sued by the Canadian Government disputing the interest rate used in certain contracts with relatedparties existing in the past. The total amount is approximately CAD$ 200 million, equivalent to R$ 402.4 millionas at December 31, 2005.
In the event Labatt is required to pay this amount, AmBev will be fully reimbursed by InBev. During the fourth quarterof 2005, Labatt paid approximately CAD 24 million, reducing the provision recorded in 2004 to CAD 62 million(equivalent to R$ 124.5 on December 31, 2005) as “Contingency Provision for Income Tax”, and AmBev has recordedaccounts receivable for the amount of R$ 173.0 (equivalent to CAD 86 million) as an adjustment in the consolidationof Labatt.
12.SOCIAL PROGRAMSa)AmBev Private Pension Plan Institute – Instituto AmBev (“IAPP”)
AmBev and its subsidiaries sponsor two types of pension plans: a defined contribution plan (open to new participants)and a defined benefit plan (closed to new participants since May 1998), with the possibility of migrating from thedefined benefit plan to the defined contribution plan. These plans are funded by the participants and the sponsor,and managed by the IAPP. The main purpose of these plans is to supplement the retirement benefits of employeesand management of the Company. During the year ended December 31, 2005, the Company and its subsidiaries madecontributions of R$ 4.8 (R$ 3.9 on December 31, 2004) to IAPP.
Based on the independent actuary reports, the position of IAPP’s plans on December 31 is as follows:
2005 2004
Fair value of assets 725.5 633.3Present value of actuarial liability (485.2) (438.1)Surplus of assets – IAPP 240.3 195.2
The surplus of assets of IAPP is recorded by the Company in its consolidated financial statements under “Surplus ofassets – Instituto AmBev” (see note 5 – other assets), at the amount of R$ 20.0 (R$ 20.6 in on December 31, 2004),amount estimated as maximum limit of its future utilization, and also considering the legal restrictions that preventthe return of a possible outstanding asset surplus, in the event of a winding up of the IAPP and for which there wasno use by means of payment of pension plan benefits.
b)Medical assistance benefits and other provided directly by the CompanyThe Company directly provides medical assistance, reimbursement of medicine expenses and other benefits tocertain retired employees, and such benefit not being granted to new retirements.
Labatt Canada, an indirect subsidiary of AmBev, offers pension plan benefits in the defined contribution model andin the defined benefit model to its employees, as well as certain post-retirement benefits; Labatt Canada also sponsorscertain post-retirement pension benefits to certain distributors.
On December 31, 2005 liabilities deriving from these obligations are recorded in the Company’s financial statementsas “Provision for medical assistance benefits and others” (see note 10 –other liabilities) in the following amounts:

2005 | Relatório Anual | AmBev .105
Pension Post -retirementPlan Benefits
Labatt Labatt AmBev Total
Present value of the actuarial liability 2,307.6 310.4 113.4 2,731.4Fair value of assets (1,630.4) - - (1,630.4)Plan deficit 677.2 310.4 113.4 1,101.0Non-amortized actuarial adjustments (459.8) (123.3) (29.0) (612.1)Distributors’ plans (i) - - - 95.7Total recognized liabilities (note 10) 217.4 187.1 84.4 584.6
The obligation related to the distributors’ plan represents Labatt Canada’s pro rata obligation under these planswhich will be financed by Labatt Canada through the allocation of service costs of these affiliated companies.
Movement of provision for medical assistance benefits and other according to independent actuary report:
AmBev Labatt TotalBalance on December 31, 2004 78.4 567.6 646.0
Incurred financial charges 13.8 149.1 162.9Exchange rate variation - (50.5) (50.5)Transfer of provision to restructuring - 14.1 14.1Benefits paid (7.8) (180.1) (187.9)
Balance on December 31, 2005 84.4 500.2 584.6
c)Fundação Antônio e Helena Zerrener Instituição Nacional de Beneficência(FAHZ)The primary objectives of FAHZ are to provide the sponsor’s employees and managers with medical/hospital anddental assistance, to aid in professional specialization and graduation courses, and to maintain facilities that provideaid and assistance to the elderly, through direct actions or financial aid agreements with other entities.
The changes in the actuarial liabilities of FAHZ, according to the independent actuary report, were as follows:
Balance on December 31, 2004 177.0Financial charges incurred 40.5Benefits paid (23.9)
Balance on December 31, 2005 193.6
The actuarial liabilities related to the benefits provided by the Zerrener Foundation on December 31, 2005 were fullyoffset by its assets. The excess assets were not recorded by the Company in its financial statements, due to thepossibility of its use for purposes other than exclusively related to the payment of benefits.
d)Actuarial assumptionsThe medium and long-term assumptions adopted by the independent actuary, in the calculation of the actuarialliability were the following:
Annual Percentage – in nominal termsAmBev Labatt
2005 2004 2005 2004
Discount rate 10.8 10.9 5.0 5.7Expected rate of return on assets 14.9 15.4 8.0 8.0Increase in the remuneration factor 7.2 7.3 3.0 3.0Increase in health care costs 7.2 7.3 - 4.0

106. AmBev | Relatório Anual | 2005
13.SHAREHOLDERS’ EQUITYa)Subscribed and paid-in capital
On December 31, 2005, the Company’s capital stock at the amount of R$ 5,691.4 (R$ 4,742.8 on December 31, 2004)was represented by 65,876,074 thousand shares (56,277,742 thousand shares on December 31, 2004) of which 34,499,423thousand are common shares and 31,376,651 thousand are preferred shares (23,558,245 thousand and 32,719,497thousand, respectively on December 31, 2004), all of them non-par registered shares.
On May 31, 2005 the Company increased its capital stock by 27 thousand common shares at the amount of R$ 0.004related to the merger of minority interest of the subsidiary CBB, merged by the Company, as mentioned in note 1(b)(ii).Additionaly, on the same date, the Company increased its capital stock by 10,941,151 thousand common sharesat the amount of R$ 948.6, by means of capitalization of the goodwill reserve, the shareholders being entitled tobonus at the ratio of 1 common share to each 5 common or preferred shares held.
The purpose of this share bonus, according to announcement to the market on December 6, 2004, was to maintainthe liquidity of the common shares after the public tender offer for the common shares of AmBev by InBev, held onMarch 29, 2005.
As mentioned in note 1(b)(iv), the AGE (Extraordinary Shareholders’ Meeting) as of August 27, 2004, approved theissuance by the Company of 19,264,363 thousand new shares, comprised of 7,866,182 thousand common shares and11,398,181 thousand preferred shares, and also decided to appropriate to the capital stock account the amount of R$1,600.7 and to the capital reserve account the amount of R$12,840.3 as premium on share subscription, which wasfully subscribed by Labatt ApS’ controlling shareholders.
b)Appropriation of net income for the year and recording of statutoryreserves The Company’s Bylaws provide for the following appropriation of net income for the year, after deductions providedfor by law:
I. 35.0% as mandatory dividend payment to all shareholders. Preferred shareholders are legally entitled to adividend 10% greater than that paid to common shareholders.
II. An amount not lower than 5% and not higher than 61.75% of net income to be recorded to a reserve forinvestments, in order to finance the expansion of the activities of the Company and its subsidiaries, includingcapital increase subscription or the foundation of enterprises. This reserve cannot exceed 80% of the capital stock.Should this limit be reached, a General Meeting of shareholders must deliberate on the balance, eitherdistributing it to shareholders or increasing capital.
III. Employee profit sharing of up to 10% of net income for the period, based on predetermined criteria. Sharing isattributed to the management until the maximum legal limits. Profit sharing is conditioned to the achievementof collective and individual targets, which are established in advance by the Board of Directors at the beginning ofthe fiscal year.
c)Proposed dividendsThe calculation of the dividends percentage approved by the Board of Directors on net income for the years endedDecember 31 is as follows:
2005 2004
Net income for the year 1,545.7 1,161.5Legal reserve (5%) (i) - -Dividends calculation basis 1,545.7 1,161.5
Prepayment of dividends 480.9 108.4Dividends prepaid as interest attributed to shareholders’ equity 219.8 236.1Supplemental dividends as interest attributed to shareholders’ equity 524.2 558.1Supplemental dividends 75.4 424.6Subtotal 1,300.3 1,327.2
Withholding income tax on dividends as interest attributed to shareholders’ equity (111.6) (119.3)Total dividends proposed 1,188.7 1,207.9

2005 | Relatório Anual | AmBev .107
2005 2004
Percentage of dividends on the calculation basis – % 76.9 103.99
Dividends net of income tax per lot of thousand sharesoutstanding (excluding Treasury shares) at year-end – R$
Common 17.32 (ii) 20.86Preferred 19.05 (ii) 22.95
(i) No legal reserve was recorded in 2004, as Brazilian Corporation Law determines that this reserve may no longer be established when,together with the capital reserves exceeds 30% of the Company’s capital stock.
(ii) Dividends per lot of thousand shares outstanding (excluding Treasury shares) at year-end – before withholding income tax (IRRF): commonshares – R$ 18.95 and preferred shares – R$ 20.85 (common shares – R$ 22.92 and preferred shares – R$ 25.21 on December 31, 2004).
d) Interest attributed to shareholders’ equityCompanies legally have the option to distribute to shareholders interest attributed to shareholders’ equity based onthe TJLP – long-term interest rate – on shareholders’ equity, and such interest, which is tax deductible, can beconsidered as part of the mandatory dividend when distributed.
Although such interest is recorded in the results for tax purposes, it is reclassified to shareholders’ equity andpresented as dividends.
e)Goodwill special reserveAs mentioned in note 1b(i), as a result of the merger of the parent company InBev Brasil on July 28, 2005, a goodwillspecial reserve was recorded by the Company at the amount of R$ 2,883.3 corresponding to the future benefit ofgoodwill amortization merged. The realization of this reserve will occur under the molds previously described innote 1(b)(i)(f).
f)Treasury sharesChanges in the Company’s Treasury shares for the year were as follows:
Number of shares – lots of thousandDescription Preferred Common Total R$
On December 31, 2004 1,437,710 - 1,437,710 935.0Purchases 530,615 16,869 547,484 437.3Cancellations (1,342,846) - (1,342,846) (868.1)Merger of CBB 151,894 - 151,894 81.7 Stock ownership plan transfer (257,993) (6,389) (264,382) (192.5)
On December 31 2005 519,380 10,480 529,860 393.4
During 2005 period, the Company delivered 264,382 treasury shares to the employess who exercised their right toacquire shares through the Stock Ownership Plan at the amount of R$ 98.1. The written-off cost value of such sharesis R$ 192.5, verifying a loss of R$ 94.4, which was recorded against the origin reserve.
g)Public Tender Offer for the Common SharesOn February 14, 2005, the Brazilian Securities and Exchange Comission (CVM) granted the registry of the Public TenderOffer for Common Shares (“OPA”) issued by the Company, pursuant to Article 29 of CVM Instruction 361/02. OPAstarted on February 14, 2005 with the Public Notice published and was concluded on March 29, 2005 by means of theOffering Auction (“Auction”).
InBev acquired 2,960,071,177 common shares of AmBev at the Auction, which represented at that time 81.2% ofAmBev’s total common shares, subject-matter of the OPA, of which 1,612,915,545 are common shares in Cash PaymentOption; and 1,347,155,632 are common shares in Shares Payment Option .
The shares acquired, pursuant to the Offering, increased the stake directly or indirectly held by InBev at AmBev, now81% of voting capital stock and 54.2% of the total capital stock of AmBev (55.8% of total capital, net of treasury shares).

108. AmBev | Relatório Anual | 2005
14.STOCK OWNERSHIP PLAN AmBev operates a plan for the purchase of shares by qualified employees, with the objective of aligning the interestsof both shareholders and executives. As defined in the Bylaws, the Plan is managed by a committee that includesnon-executive members of the Company. This committee periodically creates stock ownership programs for commonor preferred shares, defining the terms and categories of employees to be benefited, and determines the price forwhich the shares will be purchased, which cannot be lower than 90% of the average stock price traded on the SãoPaulo Stock Exchange (BOVESPA) during the three business days prior to the granting date, indexed to inflation upto the exercise date. The number of shares that may be granted during each year cannot exceed 5% of the total numberof shares of each class on that date (0% and 0.02% in 2005 and 2004, respectively).
When shares are purchased, the Company may opt to issue new shares, or use possible balances of shares held in treasury.The purchase rights granted have no expiration date. Should the employment relationship be terminated, the rightsexpire. The Company has the right to repurchase the shares subscribed by the employees, at a price equal to:
I. at the price paid by the employee, monetarily indexed by inflation, if the employee sells the shares during the firstthirty months following the purchase;
II. 50% at the price paid by the employee, adjusted by inflation, and 50% at the market price, if the employee sells theshares after the first thirty months, but before sixty months following the purchase;
III. at the market price, if the shares are sold at least sixty months following the purchase.
Employees who do not apply at least 70% of their annual bonuses (net of income tax and other charges) will forfeittheir purchase rights by the same number of shares they could have purchased, with the amount corresponding tothe difference between percentage of the bonus and the amount effectively purchased, unless the equivalent amounthad been previously purchased in cash by the employee.
The Company and its subsidiaries were allowed to take advances to employees for the purchase of shares for plansgranted through 2002. Such financings normally do not exceed four years and bear 8% interest p.a. above the GeneralMarket Price Index (IGP-M). These financings are guaranteed by the shares issued at the time of purchase. OnDecember 31, 2005, these advances amounted to R$ 114.9 (R$ 175.2 in 2004) in consolidated. For the plans grantedbeginning 2003, the Company and its subsidiaries no longer finance the purchase of shares, and such shares mustbe purchased in cash, by the employees, upon issuance.
The change in stock call options during the years ended December 31 is as follows:
Stock call option – lots of thousand2005 2004
Preferred Common Preferred Common
Balance of stock call options exercisable at the beginning of the year 651,036 - 733,689 -Changes during the year
Exercised (257,993) (6,389) (55,727) -Cancelled (27,942) (1,227) (35,926) -Granted (*) - - 9,000 -Share Bonus - 80,636 - -
Balance of stock call options exercisable at year-end 365,101 73,020 651,036 -
(*) The Company is reviewing its stock ownership plan with a view to aligning this to the model adopted by InBev.

2005 | Relatório Anual | AmBev .109
15.FINANCIAL INSTRUMENTSa)General considerations
The Company and its subsidiaries maintain certain amounts of cash and cash equivalents in foreign currency, andenter into cross-currency, interest rate and commodities swaps and forward contracts to mitigate the exposure tochanges in exchange rate on the consolidated exposure to foreign currency, interest rate fluctuations, and changesin raw materials costs, particularly aluminum, sugar and wheat.
Financial instruments are purchased to hedge against financial liabilities,which does not prevent the Company from redeemingthem at any time,even though our real intent is to hold such instruments to maturity on their respective due dates.
b)DerivativesComposition of the net exposure marked to the market on December 31:
Description 2005 2004
Currency hedgeReais/US$ 3,610.4 3,929.6Argentine Peso/US$ 206.0 132.9Peruvian Sol/US$ 210.7 -Canadian Dollar/US$ 240.5 299.0
Interest rate hedgeFloating LIBOR vs. fixed LIBOR - 55.7CDI (Interbank Deposit Certificate)x Pre-Fixed Rate (186.3) -Pre-Fixed Rate vs. Canadian Bankers Acceptance 367.1 943.2
Commodities hedgeAluminum 119.6 13.2Sugar 31.5 60.3Wheat 16.1 2.3
4,615.6 5,436.2
I. Market Value of Financial Instruments – currency and interest rate hedgeAs of December 31, 2005, unrealized gains on variable earnings from financial instruments were limited to the lowervalue between the instrument’s yield curve and their relative market value, in accordance with the BrazilianCorporation Law.
Had the Company recorded its derivative instruments at market value, it would have recorded, for the period endedDecember 31, 2005, an additional gain of R$ 44.4 (R$ 189.0 on December 31, 2004), as presented below:
Unrealized Financial instruments Book value Market value variable gainsPublic bonds 299.2 318.9 19.7Swaps/forwards (164.8) (150.4) 14.4“Cross Currency Swap” Labatt Canada (*) (95.8) (85.6) 10.3
38.6 82.9 44.4
(*) Swaps of Labatt Canada for the conversion of the Notes issued at fixed interest in US dollars to fluctuating interest in Canadian dollars.
II. Commodities and currency hedgeThe net results, appraised at their market value, with the specific view to minimizing the Company’s exposure tofluctuation of raw material costs to be purchased and operating expenses, the prices of which are pegged to foreigncurrency or commodities prices, are deferred and recognized in earnings, when corresponding product is sold or atthe moment when the corresponding expense is recognized in earnings.
During the year ended December 31, 2005, the effect relating to the commodities and currency hedge operationsrecorded in earnings as “Cost of goods sold” were:

110. AmBev | Relatório Anual | 2005
Description Net reduction (increase) in the cost of goods sold
Currency hedge (268.1)Hedge of aluminum 3.8Hedge of sugar 15.3Hedge of wheat and corn (0.5)
(249.5)
On December 31, 2005 unrealized losses at the amount of R$ 34.4 were deferred, of which R$ 75.6 in “other assets”and R$ 41.2 in “other liabilities”. This loss will be recognized at debt of the Company’s results, and the amount of R$36.0 at cost of goods sold, when corresponding finished product is sold and the remaining balance at operatingexpense, as this is an expense hedge.
c)Financial liabilitiesThe Company’s financial liabilities, mainly represented by operations of issuance of debt securities and importfinancing are recorded at cost value, monetarily restated at the preliminary rates of interest rates contracted, accruedof monetary and exchange variations, according to closing indexes for each period.
Had the Company been able to use a method where its financial liabilities could be recognized at market values, itwould have recognized an additional loss, before income and social contribution taxes, of R$ 523.4, on December 31,2005, as presented in the chart below:
Financial liabilities Book value Market value DifferenceSeries A Notes (i) 379.1 392.9 (13.8)Series B Notes (ii) 100.6 104.7 (4.1)Senior Notes – BRI (iii) 178.6 202.8 (24.2)International Financing other currencies(iv) 2,827.5 2,827.5 -Financing in Reais (iv) 328.3 328.3 -BNDES/ FINEP/ EGF (iv) 466.4 466.4 -Res. 63/ Compror 63 541.1 536.4 4.7Bonds – AmBev 11 and AmBev 13 2,381.9 2,867.9 (486.0)
7,203.5 7,726.9 (523.4)
(i) Series A Bank Notes entered into by Labatt Canada in US dollars.
(ii) Series B Bank Notes entered into by Labatt Canada in Canadian dollars.
(iii)Private Bonds entered into by Brewers Retail Inc. (BRI) and proportionally consolidated by Labatt Canada in Canadian dollars.
(iv) Loans for which book value and market value are similar.
The criteria used to estimate the market value of the financial liabilities was carried out based on quotations ofinvestment brokers, in quotations of banks which render services to AmBev and Labatt Canada and at the secondarymarket value of securities on the reference date as of December 31, 2005. The Bonds, approximately 124.50% of facevalue for Bond 2011 and 117.50% for Bond 2013 and the Series A Notes and Series B Notes of Labatt Canada, the priceswere calculated based on the cash flow discounted at present value, using market rates available for Labatt Canadafor similar instruments.

2005 | Relatório Anual | AmBev .111
d)Financial income and expensesYear ended on December 31
Parent Company Consolidated2005 2004 2005 2004
Financial incomeExchange variations on financial investments 161.6 - 389.1 208.6Financial income on cash and cash equivalents 30.7 - 85.5 175.2Financial charges on taxes, contributions and judicial deposits 2.8 4.7 10.1 11.6Income on Stock Ownership Plan 12.8 34.3 7.6 34.4Revenue and exchange variation on loans 51.0 - - -Other 5.2 4.3 28.9 38.8
264.1 43.3 521.2 468.6
Financial expensesNet losses on derivative instruments (334.3) - (714.3) (412.3 )Financial charges on foreign currency debts (167.3) - (507.7) (474.2)Financial charges on debt in Reais (47.2) - (122.3) (118.4)Interest and exchange variation on loans (483.7) (219.8) - -Taxes on financial transactions (73.9) (36.7) (135.8) (121.3)Financial charges on contingencies and others (36.9) (3.9) (65.3) (54.0)Other (14.6) - (62.5) (64.7)
(1,157.9) (260.4) (1,607.9) (1,244.9)Net financial income (893.8) (217.1) (1,086.7) (776.3)
e)Concentration of credit risk A substantial part of the Company’s sales are to distributors, supermarkets and retailers, within a broad distributionnetwork. Credit risk is reduced because of the large number of customers and control procedures to monitor this risk.Historically, the Company and its subsidiaries have not recorded significant losses on receivables from customers.
To minimize the credit risk of its investments, the Company has adopted procedures for the allocation of cash andinvestments, taking into consideration loan limits and appraisals of financial institutions, not allowing concentration,i.e., the loan risk is monitored and minimized for the negotiations are carried out only with a select group ofcounterparties highly qualified. At Labatt Canada, compensation agreements are entered into with its counterparties,allowing them to realize financial assets and liabilities in the event of default.
16.INCOME AND SOCIAL CONTRIBUTION TAXESa)Reconciliation of consolidated income and social contribution taxes
expenses on income with nominal ratesConsolidated
2005 2004
Consolidated income, before income and social contribution taxes 2,576.8 1,829.5Profit sharing and contributions (202.8) (152.4)Consolidated income, before income and social contribution taxes and minority interest 2,374.0 1,677.1
Expenses expectations with income and social contribution taxes at nominal rates (34%) (807.2) (570.2)Adjustments for obtaining effective rate:
Interest attributed to shareholders’ equity 253.0 270.0Foreign subsidiaries’ income not subject to taxation (174.1) (66.1)Equity gains ot fiscal incentives in subsidiaries 51.6 65.7
Effect on goodwill written-off upon merger of subsidiary - (12.4)Goodwill amortization, non-deductible portion(i) (211.4) (197.5)Losses in exclusive investment funds - (39.5)Goodwill future profitability–CBB merger (ii) 103.4 -Exchange variation on investments (44.3) 85.0Permanent additions, exclusions and other (16.1) (46.8)
Income and social contribution taxes expenses (845.1) (511.8)

112. AmBev | Relatório Anual | 2005
(i) This value considers the goodwill amortization effects of Labatt ApS in Labatt Canada, according to note 18, generating a tax effect as it isnot deductible, at the amount of R$ 314.0 (R$ 139.3 on December 31, 2004).
(ii) This value refers to the tax credit derived from future deductibility of AmBev’s goodwill in CBB, as a result of CBB merger by AmBev (note1(b)(ii)).
b)Composition of benefit (expense) with income and social contributiontaxes on net income
Parent Company Consolidated2005 2004 2005 2004
Current (1.7) - (757.1) (740.5)Deferred 170.3 208.6 (88.0) 228.7Total (168.6) 208.6 (845.1) (511.8)
c)Composition of deferred taxes
Parent Company Consolidated2005 2004 2005 2004
Long term assetsTax losses carryforwards 357.6 210.2 896.9 1,049.2Temporary differencesNon-deductible provisions 342.4 47.6 422.7 491.3Provision for interest attributed to shareholders’ equity (*) - 188.1 - 190.0Goodwill future profitability – Merger 132.6 - 132.6 -Provision for restructuring - - 46.4 66.4Provision for medical assistance benefits 28.7 - 165.9 194.8Provision on employees profit sharing 43.4 - 47.8 35.2Provision for losses on hedge 116.9 - 116.9 -Provision for marketing and sales expenses 51.6 - 51.6 34.4Other 108.3 1.7 161.2 155.3
1,181.5 447.6 2,042.0 2,216.6
Long-term liabilitiesTemporary differences
Accelerated depreciation - - 59.9 100.5Other 26.7 - 34.7 38.0
26.7 - 94.6 138.5
(*) Interest attributed to shareholders’ equity are considered deductible only when effectively credited to shareholders.
Based on projections of future taxable income of the Parent Company and its domestic and foreign subsidiaries, theestimated recovery of consolidated deferred income tax and social contribution on tax losses carryforwards is asfollows:
Nominal amounts 2006 472007 962008 1362009 1872010 2292011 202
897
Deferred tax assets are limited to the amounts for which offset is supported by profit projections for the next tenyears, discounted to present values, also considering that tax loss carryforwards are available for offset up to 30% oftaxable income in any year, according to Brazilian tax laws.

2005 | Relatório Anual | AmBev .113
The deferred tax assets as of December 31, 2005 includes the total effect of tax losses of Brazilian subsidiaries, whichhave no expiration dates and may be offset with future taxable income. Part of tax benefit corresponding to taxlosses of foreign subsidiaries was not recorded as assets, as management cannot determine whether its realizationis probable.
It is estimated that the balance of deferred taxes on temporary differences as of December 31, 2005 will be realizeduntil the fiscal year 2010. However, it is not possible to accurately estimate when such temporary differences willbe realized, because the mostly of them depends on legal decisions, over which the Company has no control nor anymeans of anticipating exactly when a final decision will be reached.
The projections of future taxable income include various estimates on the performance of the Brazilian and globaleconomy, the determination of foreign exchange rates, sales volume, sales prices, tax rates, and other factors thatmay differ from the data and actual values.
As income and social contribution taxes on income derive not only from taxable income but also from the Company’stax and corporate structure, the existence of non-taxable income, non-deductible expenses, tax exemption andincentives, and other variables, there is no relevant correlation between Company’s net income and the determinationof income and social contribution taxes on income. Therefore, we recommend that the tax loss should not be takenas an indicator of future profits.
17.COMMITMENTS WITH SUPPLIERSThe Company has agreements with certain suppliers to acquire certain quantities of materials that are importantfor the production and packaging processes, such as malt, plastics for PET bottles, aluminum and natural gas.
The Company has commitments assumed with suppliers for 2006 and 2007, already contracted on December 31,2005 totaling approximately R$ 533.4 and R$ 3.3, respectively.
18.OPERATING INCOME (EXPENSES), NETParent Company Consolidated
2005 2004 2005 2004
Operating incomeEquity in the results and gains from subsidiaries - - 151.8 193.3
Exchange variation in foreign subsidiary - 259.4 74.1 252.4Negative goodwill in advanced payment of fiscal incentives 28.3 - 28.3 21.9Taxes and contributions recovered 52.2 - 52.6 14.2Other operating income 4.7 - 3.6 22.9
85.2 259.4 310.4 504.7
Operating expensesExchange variation in subsidiary abroad (2.9) - - -Amortization of goodwill (i) (52.7) (84.8) (1.342.9) (803.6)
Taxes on other revenues (3.1) (46.6) (3.5) (67.5)Other (10.4) (5.4) (39.4) (54.5)
(69.1) (136.8) (1,385.8) (925.6)Operating income (expenses), net 16.1 122.6 (1,075.4) (420.9)
(i) Labatt ApS’s goodwill in Labatt Canada resulted in amortization expense of R$ 923.4 (R$ 409.7 in the period from August 27, 2004 to December31, 2004).

114. AmBev | Relatório Anual | 2005
19.NON-OPERATING INCOME (EXPENSES), NETParent Company Consolidated
2005 2004 2005 2004
Non-operating incomeReversal of provision for losses on property, plant and equipment - - - 13.2Gain on disposal of property, plant and equipment 1.8 - 24.9 53.5Other non-operating income 4.2 - 15.6 9.1
6.0 - 40.5 75.8
Non-operating expensesProvision for losses on permanent assets (i) (19.1) - (58.6) (10.4)Loss of ownership in investee (3.3) - (64.9) (80.8)Loss on disposal of property, plant and equipment (8.4) - (19.0) (97.8)Provision for restructuring (i) - - (114.9) (198.7)Other non-operating expenses (1.2) (1.3) (17.4) (22.0)
(32.0) (1.3) (274.8) (409.7)Total non-operating expenses, net (26.0) (1.3) (234.3) (333.9)
(i) As mentioned in Note 10 (ii) Labatt Canada announced the shutting down of Metro Brewery plant, in Toronto, Ontario. As part of the planto shut down this plant, Labatt Canada recognized in the non-operating result (i) provision for loss on property, plant and equipment atthe amount of CAD 19.8 million (equivalent to R$ 46.7), recorded in the account “Provision for losses on permanent assets”, and adjustmentin the actuary liabilities of the pension plan at the amount of CAD 31.7 million (equivalent to R$ 69.9) and provision for dismissal expendituresat the amount of CAD 18.9 million (equivalent to R$ 41.6), recorded in the account “Provision for Restructuring”.
20INSURANCEAs of December 31, 2005 the main assets of the Company and its subsidiaries, such as property, plant and equipmentand inventories are insured against fire and other risks, based on their replacement values. According to theCompany’s Management assessment, the coverage amount of the insurance policies is higher than those amountsrecorded, observing the probable maximum risk of loss.

2005 | Relatório Anual | AmBev .115
Shares outstanding (12/31/05)65,346 million shares653.5 million ADRs equivalents
Stock exchange
Bolsa de Valores de São Paulo (Bovespa)Ticker symbols: AMBV3 (ON), AMBV4 (PN)
Main indices AmBev stock participates:IBX e IBOVESPA
New York Stock Exchange (NYSE)Ticker symbols: ABVc (ON), ABV (PN)
Dividend policyAmBev’s by-laws provide for a minimum mandatory dividend of 35% of the company’s annual net income, asdetermined by Brazilian Corporate law accounting principles. The mandatory dividend includes amounts paid asinterest attributable to shareholders’ equity. This is equivalent to a dividend but is a more tax efficient way todistribute earnings as they are generally deductible by the company for Brazilian income tax purposes, and thecompany manage to repass a higher amount to its shareholders. The shareholders (including holders of ADRs) payBrazilian withholding tax on the amounts received as interest attributable to shareholders’ equity, whereas no suchpayment is required in connection with dividends received. However, the increase in the amount distributed relatedto the tax benefit more than offsets the amount paid by the shareholder for withholding tax. Withholding tax isusually paid by Brazilian companies on behalf of their shareholders. AmBev has two classes of shares, common (ON)and preferred (PN). Common share holders are entitled to voting rights, while preferred shares have priority inliquidation. As per Brazilian Corporate Law, dividend payments to preferred shareholders must be 10% greater thanthose made to common shareholders.
Investor Information

116. AmBev | Relatório Anual | 2005
Cash dividends declaredEarnings Generated First Payment Share Type R$ per US$ equivalent per
Date 1,000 shares 1,000 shares
Second Half 2005 31-mar-2006 preferred 14.68 6.41common 13.35 5.82
First Half 2005 30-sep-2005 preferred 10.69 4.74common 9.72 4.31
Second Half 2004 15-feb-2005 preferred 17.15 6.66common 15.59 6.05
First Half 2004 8-oct-2004 preferred 5.80 2.05common 5.28 1.87
Second Half 2003 25-mar-2004 preferred 6.75 2.30common 6.14 2.09
First Half 2003 13-oct-2003 preferred 18.70 6.59common 17.00 5.99
Second Half 2002 28-feb-2003 preferred 9.27 2.60common 8.43 2.37
First Half 2002 25-nov-2002 preferred 4.37 1.15common 3.97 1.04
Share price performance% Change % Change
31-Dec-2003 31-Dec-2004 31-Dec-2005 04 x 03 05 x 04
AMBV4 (PN) - R$ 739.0 740.0 898.0 0.1% 21.3%AMBV3 (ON) - R$ 635.0 1,368.0 752.0 115.4% -45%IBOVESPA - R$ 22,236.0 26,196.0 33,455.94 17.8% 27.7%ABV (PN) - US$ 25.5 28.3 38.5 11.1% 36.0%ABVc (ON) - US$ 20.5 52.0 36.25 153.9% -30.0%S&P 500 - US$ 1,111.9 1,211.9 1,248.29 9.0% 3.0%
RatingsAgency Local Rating Foreign Rating OutlookFitch BBB BBB- EstávelMoody’s Baa3 Ba3 EstávelS&P BBB BBB- Estável
Note: as of March 2006.

2005 | Relatório Anual | AmBev .117
Shareholder account assistanceFor address changes, dividend checks, account consolidations, direct deposit of dividends, registration changes,lost stock certificates, stock holdings and Dividend and Cash Investment plan, please contact:
Retail shareholders in BrazilNilson CasemiroPhone: 11 2122-1402E-mail: [email protected]
Depositary bank in BrazilBanco ItaúPhone: 11 5029-7780
Depositary bank and transfer agent in the USABank of New York101 Barclay StreetNew York, NY 10286Phone: 1 888 269-2377E-mail: [email protected]
Independent AuditorsDeloitte Touche TohmatsuRua Alexandre Dumas, 1.981São Paulo, SP 04717-004BrazilPhone: 11 5185-2444

118. AmBev | Relatório Anual | 2005
AmBev – Corporate officesRua Dr. Renato Paes de Barros, 1.017 – 4º andarSão Paulo, SP 04530-000BrazilPhone : 11 2122-1200Fax: 11 2122-1526
Information resourcesPlease direct all requests for information to:
AmBev – Investor Relations DepartmentRua Dr. Renato Paes de Barros, 1017 – 4th floorSão Paulo, SP 04530-000BrazilPhone: 55 11 2122-1414/1415Email: [email protected]
Investor websiteOur investor website has additional company financial and operating information, as well as conference callstranscripts. Investors may also register to automatically receive press releases by email and be notified ofcompany presentaions and events.
www.ambev-ir.com
PublicationsThe company’s Annual Report, Proxy Statement, Form 20-F reports are available free of charge from the InvestorRelations Department, listed above. If you are receiving duplicate or unwanted copies of our Annual Report, pleasecontact the Investor Relations Department.
Send us your feedbackWe value your opinion on this annual report. Please send your comments to [email protected].

2005 | Relatório Anual | AmBev .119
Text Steve Yolen, Christina Brentano Graphic Design Project Adroitt Bernard Photos Sergio Santorio, João Musa Printing Gráficos Burti


Table of Contents
1. A AmBev2. Highlights3. Message to shareholders 024. Map of Operations 045. Beer Brazil 076. Soft Drinks Brazil 117. Hispanic Latin America (HILA) 158. North America 199. Passion for Execution 23
10. Brands 2611. Distribution 2912. Cost Consciousness 3313. Financial discipline 3614. Culture 3815. AmBev People 4216. Sustainability 47
a. Social responsibility 48b. Environment 52c. Corporate governance 56
17. Shares as an investment 5918. Our Team 6019. Financial Section 62
2005 Annual Report
2005A
nnual Report
PASSION FOR EXECUTION