Southeast Asia. Southeast Asian Archaeology Scholarly Website.
ASIAN DEVELOPMENT BANK
A Smarter Future: Skills, Education, and Growth in AsiaKey Indicators for Asia and the Pacific 2015 Special Chapter
Asia has made substantial progress in improving educational attainment. Nevertheless, there remain significant shortfalls in the quantity and quality of education. To raise quality, will require commitment to making evidence based policy decisions and accountability, financial e�ciency that delivers better skill outcomes per dollar of public investment, educational delivery and access, and generating conditions for learning on-the-job. The chapter provides suggestive evidence that three features of education systems that deliver better cognitive skills are those that have (i) information systems that collect timely, relevant, and credible data on schooling inputs and skill outcomes; (ii) curriculum content that are well-matched to student capabilities and emphasizes development of critical skills; and (iii) broad support for early childhood education.
About the Asian Development Bank
ADB’s vision is an Asia and Pacific region free of poverty. Its mission is to help its developing member countries reduce poverty and improve the quality of life of their people. Despite the region’s many successes, it remains home to the majority of the world’s poor. ADB is committed to reducing poverty through inclusive economic growth, environmentally sustainable growth, and regional integration.
Based in Manila, ADB is owned by 67 members, including 48 from the region. Its main instruments for helping its developing member countries are policy dialogue, loans, equity investments, guarantees, grants, and technical assistance.
ASIAN DEVELOPMENT BANK6 ADB Avenue, Mandaluyong City1550 Metro Manila, Philippineswww.adb.org
COGN
ITIVE
NONCOGN
ITIV
E
TECHNI
CAL
Aa Bb Cc
A SMARTER FUTURESKILLS, EDUCATION, AND GROWTH IN ASIA
KEY INDICATORS FOR ASIA AND THE PACIFIC 2015SPECIAL CHAPTER
KI2015-Special-Chapter-Cover.indd 1 27/01/2016 7:51:39 AM

ASIAN DEVELOPMENT BANK
A SMARTER FUTURESKILLS, EDUCATION, AND GROWTH IN ASIA
KEY INDICATORS FOR ASIA AND THE PACIFIC 2015SPECIAL CHAPTER

© 2015 Asian Development Bank
All rights reserved. Published in 2015.Printed in the Philippines.
ISBN 978-92-9257-272-3 (Print), 978-92-9257-273-0 (e-ISBN)Publication Stock No. FLS157539-2
Cataloging-In-Publication Data
Asian Development Bank. A Smarter Future: Skills, Education, and Growth in Asia— Key indicators for Asia and the Pacific 2015 special chapter.Mandaluyong City, Philippines: Asian Development Bank, 2015.
1. Economic Indicators. 2. Asia and the Pacific. I. Asian Development Bank.
The views expressed in this publication do not necessarily reflect the views and policies of the Asian Development Bank (ADB) or its Board of Governors or the governments they represent.
ADB does not guarantee the accuracy of the data included in this publication and accepts no responsibility for any consequence of their use.
By making any designation of or reference to a particular territory or geographic area, or by using the term “country” in this document, ADB does not intend to make any judgments as to the legal or other status of any territory or area.
ADB encourages printing or copying information exclusively for personal and noncommercial use with proper acknowledgment of ADB. Users are restricted from reselling, redistributing, or creating derivative works for commercial purposes without the express, written consent of ADB.
ADB recognizes “China” as the People’s Republic of China.
Asian Development Bank6 ADB Avenue, Mandaluyong City1550 Metro Manila, PhilippinesTel +63 2 632 4444Fax +63 2 636 2444www.adb.org

iii
ForewordOver the past few decades many Asian economies have experienced dramatic reductions in poverty and have achieved middle-income-country status. A key contributor has been the development of human capital, as most prominently reflected in increases educational attainment that nearly doubled average years of education between 1970 and 2010.
However, for developing Asian economies to continue their economic transformation and continue closing the gap with developed economies, they must increasingly stress the quality of education. This will help ensure human capital competitiveness that creates a workforce with sucient levels of transferable cognitive and noncognitive skills, as well as technical skills relevant to both current and future labor market demands.
To improve skills quality, the special chapter of Key Indicators for Asia and the Pacific 2015, “A Smarter Future: Skills, Education, and Growth in Asia” provides evidence that the region will increasingly need to improve public financing eciency by basing public investment decisions on measurable educational outcomes, designing curriculum content that is well matched to student capabilities and labor market needs, making sure that curricula are delivered well, and making sure that the disadvantaged receive high-quality basic education. Above all, however, decisions in these areas must be guided by information and data collection for monitoring, performance evaluation, and accountability of teachers and schools to achieve better learning outcomes.
Natalie Chun was the lead author for this special chapter prepared under the overall supervision of Director Rana Hasan. Christine Ablaza, Joe Marvin Alpuerto, Glenita Amoranto, Kenn Chua, Dean Dulay, Mark Andrew Elepaño, Francine Claire Fernandez, Lilac Florentino, Maria Beatrice Anne Tanjangco, and Priscille Villanueva provided valuable research and technical assistance for the work contained throughout the chapter. Rhommell Rico designed the graphics and typeset the chapter. Francine Claire Fernandez assisted in copy editing. Maarten Goos, Rana Hasan, Aashish Mehta, and Tania Rajadel provided key technical advice and detailed reviews throughout the process of drafting the chapter. Important advice was provided by Nicholas Bloom, Erik Churchill, Jesus Felipe, Eric Hanushek, Shang-Jin Wei, Juzhong Zhuang, and Joseph Zveglich. Altay Mussorov and Chunbing Xing made substantive contributions.
The special chapter benefited greatly from key participants at the April 2015 workshop related to the chapter, particularly Nicholas Bloom, Laura Brewer, Kenn Chua, Lilac Florentino, Gouri Gupta, Eric Hanushek, Kee Beom Kim, V.K. Madhvan, Koji Miyamoto, Tania Rajadel, David Roland-Holst, Jouko Sarvi, Lei Zhang, and Asma Zubairi for their presentations; Christine Ablaza, Oth Marulou Gagni, Aileen Gatson, Iva Sebastian, Eric Suan, and Orlee Velarde for organization and administrative assistance. We are also grateful to members of the education sector group, particularly Brajesh Panth, Tania Rajadel, Jouko Saarvi; Jazira Asanova, Tadateru Hayashi, Sophea Mar, Sofia Shakil, Gi Soon Song, Christopher Spohr, Karina Veal, Emma Veve, Betty Wilkinson, and Wolfgang Kubitzki for their review and comments on the chapter.
Shang-Jin WeiChief Economist


ContentsForeword................................................................................................................................................................................ iiiAbbreviations ..................................................................................................................................................................... viiiHighlights .............................................................................................................................................................................. ix
A Smarter Future: Skills, Education, and Growth in Asia
Section 1. Introduction.................................................................................................................................... 3Section 2. Skills, Education, and Economic Growth ..................................................................................... 6
2.1 Asia has made progress on expanding education, but challenges remain .................................................... 62.2 Quality, not quantity, is the driver of economic growth ................................................................................... 92.3 The future of skill demand................................................................................................................................... 14
Section 3. Enhancing Skill Development ......................................................................................................173.1 Skill development systems in Asia...................................................................................................................... 173.2 Capturing key features of skill development systems..................................................................................... 183.3 What matters for skill development?................................................................................................................. 18
Section 4. Evidence-based Policy Decisions and Accountability.............................................................. 224.1 Evidence-based policy decisions........................................................................................................................224.2 Accountability........................................................................................................................................................234.3 Data for evidence-based policy decisions and accountability......................................................................28
Section 5. Financial E�ciency ...................................................................................................................... 305.1 Targeting public investments ..............................................................................................................................305.2 Reducing costs of educational provision.......................................................................................................... 40
Section 6. Educational Delivery.................................................................................................................... 456.1 Curriculum content...............................................................................................................................................456.2 Instruction ..............................................................................................................................................................48
Section 7. Educational Access ...................................................................................................................... 527.1 Financial aid............................................................................................................................................................537.2 Information for students and their families......................................................................................................577.3 Programs for high-risk students......................................................................................................................... 607.4 Rural–urban parity ................................................................................................................................................ 617.5 Gender equality .....................................................................................................................................................62
Section 8. Learning On The Job.................................................................................................................... 658.1 Training investments by firms .............................................................................................................................658.2 Human resource management practices ..........................................................................................................678.3 Matching workers and jobs ..................................................................................................................................69
Section 9. Concluding Remarks.................................................................................................................... 72
Appendices1: Growth Regressions and Projections ....................................................................................................................732: Education and Skill Development System Indicators Construction and Analysis........................................773: Key Metrics for Targeted Policy, Accountability, and Private Decisions ........................................................834: Notes for Various Tables and Figures....................................................................................................................86

vi Contents
References ..................................................................................................................................................... 93
Tables3.1: Education and Skill Development Checklist ..................................................................................................... 195.1: Public Investments that are More Complementary, or More Substitutable,
to Private Investments ................................................................................................................................. 315.2: There is Too Little Causal Evidence to Settle the Debate over TVET versus General
Education in Asia ..........................................................................................................................................35Figures
2.1: Average Years of Schooling .................................................................................................................................. 62.2: Share of Secondary Educated and Above, Age 15–29 .................................................................................... 72.3: Share of Employment by Industrial Sector ........................................................................................................ 82.4: Employment in Occupations Remains Predominantly Low Skilled .............................................................. 82.5: Industrial Structure and the Share of Secondary or Tertiary Educated Workers Employed..................... 82.6: Qualification Mismatches .................................................................................................................................... 92.7: Education Share in High-Skilled Occupations .................................................................................................. 92.8: Growth and Years of Schooling, 1970–2010 .................................................................................................... 11
2.9: Test Scores Across Asian and OECD Economies ............................................................................................ 11 2.10: Growth, Skills and Years of Schooling, 1970–2010 ........................................................................................ 12 2.11: Growth Projections to 2045 from 15-Year Reform Policies for Education and Skills .............................. 13 2.12: Percent of Employment Facing Possible Job Destruction ............................................................................ 15 3.1: Importance of Skill Development Policies for Basic Education to Mean Test Scores ............................ 20 4.1: Quality Data is the Basis for Evidence-based Policy Decisions ..................................................................22 4.2: Quality Data is the Basis for Accountability ...................................................................................................24 4.3: Private Provider Penetration in TVET ..............................................................................................................26 4.4: E«ects of School Accountability and Autonomy on Math Test Scores .....................................................27 5.1: Public Spending on Education ...........................................................................................................................30 5.2: Benefits to Starting School a Year Earlier on Test Scores .............................................................................34 5.3: Growth and Share of Secondary TVET Students ...........................................................................................35 5.4: Share of Secondary TVET Students .................................................................................................................36 5.5: TVET and Secondary General Graduate Employment and Wage Outcomes Within 5 Years of Graduation ..............................................................................37
5.6: Employment Probabilities and Wage Returns for TVET and Secondary General Graduates ................38 5.7: School Computer and Internet Penetration ....................................................................................................43 6.1: Enhancing Educational Quality Must Address Curriculum Content and Delivery ..................................45 6.2: E«ects of Schools O«ering Additional Math Lessons on Math Test Scores .............................................46 6.3: E«ect of Perceived Di¬culty of Curriculum on Math Test Scores .............................................................46 6.4: E«ect of Instruction Approach on Math Test Scores ....................................................................................48 6.5: E«ects of Teacher Certificates or Degrees on Test Scores ...........................................................................48 6.6: Technology and Scripted Curricula are Possible Alternatives if Teachers are Not Accountable, Incentivized or Su¬ciently Skilled ................................................50 7.1: Policies to Address Di«erent Barriers to Optimizing Skill Investments .....................................................52 7.2: Inequality of Opportunity in Mathematics ......................................................................................................53 7.3: Di«erences in College Aspirations Due to Di«erences in Socioeconomic Status ...................................54

viiContents
7.4: E«ect of Parental Engagement on Students’ Total Study Hours .................................................................59 7.5: Di«erences in Educational Inputs by School Location .................................................................................62 7.6: Gender Parity Index for Secondary Gross Enrollment ...................................................................................63 8.1: Firm Training across Global Regions by Number of Employees ..................................................................65 8.2: Formal Wage Employment in India ...................................................................................................................66 8.3: Training and E¬ciency of Product Markets ....................................................................................................66 8.4: Average Management Scores among Manufacturing Firms .........................................................................68 8.5: E«ects of Eliminating Search Frictions on Labor Market Mismatch ...........................................................70
Boxes 1.1: Skills, Tasks, and Skill Formation ...........................................................................................................................4 2.1: The Link between Occupations, Tasks, Skills, and Education ......................................................................... 7 2.2: Identifying Technical Qualification Mismatches ............................................................................................. 10 2.3: Measuring Cognitive Skills across Countries ..................................................................................................... 11 2.4: The Value of a Liberal Arts Education ............................................................................................................... 12 3.1: Comparing the E«ects of Interventions on Skills using Standard Deviations ............................................ 21 4.1: Quality Assurance Mechanisms for Data Collection and Accountability ..................................................23 4.2: Measuring Di«erent Types of Skills ....................................................................................................................29 4.3: Designing E«ective Accountability Metrics .....................................................................................................29 5.1: How Much is More Education Worth? ..............................................................................................................32 5.2: Skill Formation over the Lifecycle .......................................................................................................................33 5.3: Nonformal Training Programs—Di¬cult to Consistently Implement to Generate Benefits ..................34 5.4: The German Dual Training System—Not Easy to Replicate .........................................................................39 5.5: Development Impact Bonds for Education ...................................................................................................... 41 5.6: Crowdsourcing for Funding, Information, and Ideas ......................................................................................42 5.7: Nine Advantages of Online Learning over Traditional Learning ...................................................................43 6.1: Venture Capital—Funding the Next Generation of Education Technology ............................................... 51 7.1: Some Consequences of Risk Aversion ..............................................................................................................53 7.2: Helping Families Commit to Educational Investments ..................................................................................56 8.1: Di«using Knowledge .............................................................................................................................................68

viii
AbbreviationsADB Asian Development BankATMs automated teller machineCAL computer-assisted learningCCT conditional cash transferDIB development impact bondDME developing member economyDTS dual training system ECE early childhood educationGDP gross domestic productGPI gender parity indexHRM human resource managementILO International Labour OrganizationIQ intelligence quotientISCO International Standard Classification of OccupationsISIC International Standard Industrial Classification of All Economic ActivitiesJOLTS Job Openings and Labor Turnover SurveyLao PDR Lao People’s Democratic RepublicLFS Labor Force SurveyLTS Labor Turnover SurveyM&E monitoring and evaluationMIS management information systemOECD Organisation for Economic Co-operation and DevelopmentPIAAC Program for the International Assessment of Adult CompetenciesPISA Programme for International Student AssessmentPPP public–private partnershipPRC People’s Republic of ChinaPWT Penn World TableSABER Systems Approach for Better Education ResultsSD standard deviationSOC Standard Occupational ClassificationSTEP Skills Toward Employment and ProductivityTIMSS Trends in International Mathematics and Science StudyTVET technical vocational education and trainingUCT unconditional cash transferUIS UNESCO Institute of StatisticsUNESCO United Nations Educational, Scientific and Cultural OrganizationUNEVOC UNESCO International Centre for Technical and Vocational Education and TrainingUS United StatesWDI World Development Indicators$PPP purchasing power parity3D three dimensional

ix
Note: Scenarios for the growth projections are: Scenario 1: Raise average years of schooling to OECD levels (11.6 years); Scenario 2: Raise share of students achieving 400 + on PISA/TIMSS to OECD levels (85%); Scenario 3: Raise share of students achieving 400 + and 600+ on PISA/TIMSS to OECD levels (85% and 15%, respectively).
020406080
100120140160
Viet Nam
Kazakhstan
Armenia
Malaysia
Thailand
Mongolia
Indonesia
Philippines
Kyrgyz RepublicIndia
Percen
t
Percentage Increase in GDP per capita between2015 and 2045
Scenario 1 Scenario 2 Scenario 3
Highlights1. While progress in the spread of
education is noticeable, shortfalls in the quantity and, especially, quality of education constrain skill development and growth.
• Developing Asia has made large strides inexpanding educational access to education.Average years of schooling nearly doubled from 3.9 in 1970 to 8.0 in 2010. Over 1990–2012, literacy grew from 79% to 87% and gross enrollments in secondary and tertiary education rose from 62% to 81% and from 15% to 27%, respectively. These gains have been the result of conscious e§orts of both governments and households to invest in education, perhaps the most important channel through which individuals acquire skills.
• Skills remain weak in many parts of the region,due to gaps in both the quantity and qualityof education provided. In some economies, as many as 90% of high-skilled occupations in which tertiary education is important are filled by people with, at most, a secondary education. This points to the need to continue e§orts to expand the quantity of education. But, perhaps more importantly, the quality of education (the level and relevance of skills in this chapter’s terminology) needs to improve. As revealed by international tests of cognitive skills that schooling is intended to provide, in 10 of 15 regional economies that participated in recent PISA and TIMSS tests (measuring critical cognitive skills in reading, mathematics, and science among students aged 14–15), more than 30% of participants had scores below the level corresponding to the minimum basic cognitive skills needed for functioning eciently in the workplace (a score of at least 400). Very few students—less than 1% in five developing Asian economies—had top-end skills that allow individuals to solve complex problems and think strategically (captured by scores above
600 on PISA/TIMSS). Many Asian schools are also not providing students with good noncognitive skills. Employer surveys often cite this as a major “missing skill” in their workers, in addition to certain types of technical skills.
• A failure to raise the quality of education willhave consequences for growth prospects.Empirical analysis reveals a strong positive relationship between education and economic growth (controlling for initial income levels). However, for education to be growth promoting, it must be of suciently high quality that it builds cognitive skills. Empirical analysis suggests that the extra growth from raising the average years of schooling to 11.6 years—the average in economies of the Organisation for Economic Co-operation and Development (OECD) (Scenario 1 in the figure below)—will be relatively low. In contrast, growth could be far higher if economies focus on achieving basic cognitive skills that are similar to the average of OECD economies (Scenario 2: 85% of students achieve at least 400 on PISA/TIMSS). If economies can also develop a critical mass of students with top-end skills that go on to become innovators there will be an additional boost to growth (Scenario 3: 85% of students achieve at least 400; 15% achieve at least 600).

x Highlights
2. Toward more effective skill development systems
• In principle, many factors can matterfor improving the quality of education.Policymakers have to decide on a number of issues, including: How should public finances be allocated across di§erent levels and types of education to deliver better educational outcomes per dollar of investment? Is it teacher skills or motivation that is the greater constraint to enhancing learning outcomes? What role can information play in helping to improve educational outcomes? How can the public sector invest to catalyze educational investments by families and firms? Answering such questions relies crucially on data and evidence.
• This study compiles a new database onhow economies across the region managetheir education systems. A database of over 150 indicators has been developed to compare and contrast educational inputs and practices followed by 67 economies globally for managing their basic education systems. For 23 economies from developing Asia, the database also includes indicators for technical and vocational education and training (TVET) and higher education. The indicators reveal considerable variations in inputs and practices across economies. Three economies in developing Asia—the Republic of Korea; Singapore; and Taipei,China—have consistently better practices in virtually all areas considered. In particular, these economies are dedicated to collecting detailed information that is important to e§ectively manage schools and teachers and ensure that their incentives are aligned with better learning outcomes of their students. Some lower-income economies such as Viet Nam also rank high in many areas.
• Some features of education systems are betterpredictors of learning outcomes than others.To determine whether some practices matter more for skill development, this study examines
the relationship between performance on the international PISA and TIMSS tests and indicators for basic education using the global sample of 67 economies. Analysis reveals that economies with better cognitive skills are those that are committed to collecting quality information, particularly on learning outcomes; that have curricula emphasizing critical thinking and matched to student capabilities (through remedial and enrichment courses); and that invest in early childhood education.
• The importance of collecting information onlearning outcomes emphasizes that data arean essential basis for making evidence-basedpolicy decisions and imposing accountability.Closing the gap between the economies with the best practices in the collection and provision of educational information and the economies with relatively weak practices could raise average PISA/TIMSS test scores of the latter by as much as 16%. Timely, credible, and relevant data allow governments to decide among alternative investments on the basis of evidence and hold schools and teachers accountable to learning outcomes. Providing information to parents on measures of student and school performance on standardized tests also improves test scores, as this information can empower families to demand better educational quality. It can also enable families to make more informed skill investment decisions. Indeed, families are likely to invest more in their children’s education when they are assured of its quality.
• Good curriculum content needs to be matchedto student capabilities to improve studentlearning and help develop transferablelabor market–relevant skills. Closing the gap between the best and relatively weaker performers on curriculum content could raise average test scores of the latter by as much as 10%. When the curriculum is too hard or too easy, students may learn very little. Additionally, basic

xiHighlights
education curricula, especially at the secondary level, should focus on developing skills that are highly transferable, whether they are cognitive, noncognitive, or technical. In particular, basic digital, financial, and marketing skills may be important technical skills that could help, independent of the occupation one may ultimately enter.
• Early childhood education has large payoffsto skill development by building the capacityto learn later in life. In fact, this brings some of the largest gains in tests of cognitive skills. On the PISA/TIMSS tests of 14-15 year olds, for example, test scores are 9% higher for students who started school before age 5 rather than 7, but are only 2% higher for those who started at age 6. Given the scientific evidence that early education builds the capacity to learn, its benefits continue to accrue over the long term. Moreover, as lower-income families have diculties in financing education, there is a strong case for public financing of early childhood education. Nevertheless, a good number of developing economies in Asia are lagging behind on the indicator for early childhood education. Early childhood investments targeted at the most disadvantaged may also be critically important in ensuring greater educational access and ensuring that the best and most promising students have a better opportunity to enter higher levels of education.
• Public educational expenditures are necessary,but not sufficient to improve learningoutcomes. While public educational expenditures as a percentage of GDP vary considerably across economies they are not systematically associated with higher test scores. This suggests that how public finances for education are utilized and invested matters as much as the amount of finance. In particular, public finances need to be directed at di§erent levels and types of education so as to yield better educational quality per dollar of investment.
• Our analysis does not cover all potentiallyimportant issues due to the absence of gooddata that are essential to building hardevidence. Some important questions on skill development beyond the scope of our analysis include TVET systems and the use of technology in education. For example, what are e§ective models for TVET and higher education that can better guarantee successful skill and labor market outcomes? Under what conditions can technology serve as a democratizer of education that creates more equity in educational inputs? A review of recent literature points to some important issues for future research.
• For TVET there is a strong need to getcurriculum design and delivery right.As the costs of public secondary TVET are higher than public secondary general education (some estimates suggest 20%–40% higher), there is a need to ensure that either the benefits from returns are also high or to focus on methods for reducing the costs. O§ering curricula that develop foundational skills in addition to technical skills so graduates have pathways into higher levels of education, and hiring teachers with relevant industry experience are examples of promising approaches being implemented in the region. To control costs, the use of technology that can simulate technical processes (such as a virtual-reality welding simulator) and cost-sharing arrangements with industry are being tried.
• Technology could provide alternativeswhen teacher effort and skills arelow and aid in cost reductions. When combined with high-quality content that is customized to a level and pace that match student capabilities, technology can enhance educational quality by countering variations in teaching quality and in lower costs of educational delivery. Blended learning,
xii Highlights
A SMARTER FUTURESKILLS, EDUCATION, AND GROWTH IN ASIA
which replaces some traditional classroom time with online interactive content to reduce costs paid for instruction when curricula are more standardized, is one form gaining traction in higher education for developed economies, as it has been shown to have minimal adverse consequences for student learning outcomes.
• Families and firms also need to be involved inthe region’s skill development agenda. This will be vital for developing the skills that will underpin the region’s path to prosperity. Families play a significant role in the process of skill development by ensuring that their children attend school and
taking an active role in their studies. Firms matter as well, and estimates for developed countries suggest that a sizable portion of skills acquired over the lifetime are learned on the job. But the type of firm in which a worker is employed matters, too. Formal firms using modern technologies and human resource management practices not only demand more skilled workers, they typically also do a better job in developing further the skills of their workers. Finally, competitive product and labor markets and a pro-investment business climate encourage such firms and practices. All these areas lie outside the domain of education policies, but governments with ambitious skill development agendas should not ignore them.

COGN
ITIVE
NONCOGN
ITIV
E
TECHNI
CAL
Aa Bb Cc
A SMARTER FUTURESKILLS, EDUCATION, AND GROWTH IN ASIA


3Special Chapter
3
Section 1. IntroductionThe development of skills—part of human capital—is an essential driver of economic growth and inclusion. Skills raise the productivity of workers, help build innovative capacity that sets the basis for developing and acquiring new technologies, and makes workers more adept at exploiting them. Skills can also improve economic growth by developing a more cohesive society that is less prone to socioeconomic disruptions such as crime.
What types of skills are critical to better match labor market demands? How can the public sector improve the relevancy of cognitive, noncognitive, and technical skills (Box 1.1) given that there are limited public finances that cannot expand to fulfill all needs? This special chapter aims to answer these two questions for developing Asia—a region that has seen burgeoning growth in demand for skills.
The chapter takes a holistic approach to skill development. This draws on two key facts: that public financing is limited; and, that to make financially efficient investments that improve the quality and relevancy of skills, policy makers must make decisions based on evidence. This means identifying the skills in demand relative to the types of skills or education being supplied. Moreover, to invest efficiently, it is important to determine the right mix of investments between different levels of education (early childhood, basic and upper secondary, and tertiary), different types of education (general or technical), and how to target investments (disadvantaged groups, teachers, etc.). It also requires developing policies around the primary actors and the incentives they face to invest and enhance skills. These actors include school managers, teachers, individuals, families, and firms.
Structure of the special chapter
Section 2 shows that developing Asia has made substantial progress in increasing educational
attainment. However, for economies to continue to grow and transform, they will need to pay more attention not only to the quantity, but also the quality of education to ensure that education delivers more relevant types of skills for labor market demands. To meet the demands not just of current labor markets, but those of the future as well, education must work on developing broad-based quality cognitive and noncognitive skills.
Section 3 lays out three primary elements to guide skill development: financial efficiency, educational delivery, and educational access (taken up further in sections 5, 6, and 7). They are based on good governance in education, which means making evidence-based policy decisions and facilitating practices that improve school and teacher accountability. Original work documents skill development systems for the three elements, across 23 Asian economies, using over 200 indicators. Our findings suggest that good governance that collects timely, credible, and relevant information on education—particularly measuring critical skills—and providing information to parents on school and student performance is crucial.
Section 4 emphasizes that evidence-based policy decision making and implementing accountability should be top priorities to enhancing learning outcomes. Accountability is inherently tied to developing better human resource management practices in schools that align school manager and teacher incentives with learning outcomes. Above all, however, there must be attention and commitment to collecting quality information.
Section 5 starts with the premise that, to achieve financial efficiency, public investments that complement rather than substitute for private investments are required. This means making investments where there are clear social returns, including providing education earlier. Section 6 shows that educational delivery requires curriculum

4 Key Indicators for Asia and the Pacific 20154
Understanding skill development and its role in generating shared prosperity depends on careful and consistent use of language. Box figure 1.1 shows the connections between skills, tasks, and the inputs into the formation of skills—family, education, and the job.
Skills provide individuals with the ability to execute tasks e�ciently, i.e. a worker executes the task quickly and accurately, with little supervision. Because all but the most menial of jobs entrust workers with multiple tasks, workers must possess multiple skills. The tasks required of a worker depends on the goods and services they help
produce. Hence, the skills demanded from a country’s workforce depend on the structure of goods and services produced by the economy.
Tasks are the actions that workers must complete for their firm to produce goods and services. The variety of tasks that even a single worker executes can be very broad. Tasks include, for example, interacting with customers, designing a solution to an engineering problem, maintaining classroom discipline, cleaning a floor, stitching a collar, writing an email, or supervising employees.
Box 1.1: Skills, Tasks, and Skill Formation
continued on next page
�.
+
Executing tasks e�ciently
Rudimentary Academic Skills:Literacy, numeracy
Technical Skills:Industry or occupation-specific
Foundational Skills:Cognitive and noncognitive
TRAINABILITY
Family General Education Higher Education
Quality Quantity
Technical Vocational Education and Training
Learning on the Job
Box figure 1.1: Skills, Tasks, and Skill Formation

5A Smarter Future: Skills, Education, and Growth in AsiaSpecial Chapter
5
This special chapter defines skills as nontechnical or technical. Nontechnical skills comprise mainly foundational skills (which in turn consist of cognitive and noncognitive skills) and include basic literacy and numeracy for learning and for undertaking more complex operations—to learn and function in a workplace environment. These skills are transferable as they are not specific to an occupation.
Cognitive skills are the thinking skills that enable individuals to learn, solve problems, and create new knowledge. They require conscious intellectual e�ort such as thinking, reasoning, and remembering. They include memory, comprehension, application, analysis, synthesis, evaluation, reasoning, perception, and intuition. Critical cognitive skills are best developed early in life.
Noncognitive skills—also known as soft skills or socio-emotional skills—are the character traits that enable a person to function e�ectively at work, in school, and in society. They are features of an individual’s personality, temperament, and attitude. They include interpersonal skills, as well as motivation, integrity, persistence, self-discipline, adaptability, creativity, self-control, conscientiousness, and grit. Less consciously delivered than cognitive skills, noncognitive skills require intellect, and are highly prized in work environments that require teamwork and other forms of human interaction. While important to develop early on, they are generally considered more malleable later in life than cognitive skills (Heckman, Stixrud, and Urzua 2006).
Technical skills encompass the knowledge and capabilities that enable workers to perform specialized tasks that are specific to occupations or industries. They can range from the more basic operations of assembling parts to the complexities of building robotics or diagnosing diseases.
General education is crucial in skill development. A high-quality education is one capable of delivering a wide range of foundational skills and of delivering rudimentary academic skills quickly.
Technical vocational education and training (TVET) is provided to workers before they begin work or to help in re-skilling. It is
focused on the acquisition of technical skills, and typically involves a high degree of supervised practice. TVET may be preferable to learning on the job when the technical skills required are cheaper to provide prior to labor market entry (for example, because errors during production are too expensive) or are useful to a wide range of employers. TVET is sometimes accompanied by remedial education to help students who received a low-quality general education to acquire the missing foundational skills.
Higher education is designed to build higher-order skills. Nontechnical and technical skills can be developed through higher education. However, in contrast to TVET that typically focuses more on basic technical skills, it is typically aimed at developing the innovators, leaders, and strategic thinkers of the future.
Low-quality education can create a trainability gap leading to shortages of other skills—technical and otherwise. Technical skills build on rudimentary and foundational skills. Workers who can read, write, and do arithmetic, and possess both the cognitive skills needed to process new information and the noncognitive skills needed to manage the social process of vocational skill acquisition, are more trainable. Trainability allows workers to acquire more technical skills through learning on the job. Trainable workers not only pick up technical skills more quickly, but use their strong foundational skills to acquire more complex cognitive skills. A large part of cognitive and technical skills, with estimates in the range of 20%–60%, can be developed on the job, once su�cient foundational skills have been built (Yamaguchi 2012; Heckman, Lochner, and Taber 1998).
Families also play a large role in developing skills. Many foundational skills are acquired and practiced in the home and before children are old enough to attend school (e.g. Barnham, Macours, and Maluccio 2013; Helmers and Patnam 2011). Some studies have found that supportive families contribute as much as 30% to all skill development (Heckman, Stixrud, and Urzua 2006). Family circumstances also exert a sizable influence on the types of education, jobs, and training that children and workers can access.
Box 1.1: Skills, Tasks, and Skill Formation (continued)
content to be matched to student capabilities and complemented by effective teaching, traditionally from skilled and motivated teachers. Section 7 claims that to overcome barriers to educational access, targeted financial aid that is complemented by the right type of information is needed to ensure that the optimal choices in skill investments are made.
Section 8 recognizes that the skills that raise greater productivity go beyond the education and training system. Many skills can be learned on the job,
requiring governments to focus on the demand side to ensure that skills developed through educational investments are fully utilized and workers can continue to learn on the job.
Section 9 provides some parting messages—particularly the importance of developing broader commitment not just from policy makers, but also practitioners, researchers, students and families, and firms.

6 Key Indicators for Asia and the Pacific 20156
Section 2. Skills, Education, and Economic Growth2.1 Asia has made progress on
expanding education, but challenges remain
Developing Asia has made significant progress in expanding educational attainment over recent decades driven by Asia’s educational investments that amounted to $1.2 trillion by governments and $690 billion by households in 2014 alone.1 Average years of schooling have nearly doubled across the region, rising from around 4 years to 8 years between 1970 and 2010 (Figure 2.1, left panel). The region has also dramatically increased rates of enrollment and levels of education during the past few decades. Literacy rates have climbed from 79% to 87%, and gross secondary and tertiary enrollment rates have surged from 62% to 81% and 15% to 27%, respectively, between 1990 and 2012.2 A number of Asian economies have also seen increasing shares of youth aged 15 to 29 in secondary general or tertiary education (Figure 2.2).
1 ADB estimates. See Appendix 4 for detailed methodology.
2 ADB estimates for Asian economies using Barro-Lee databases.
Notwithstanding these improvements in educational attainment, Asia’s agenda on education and skill development is far from complete. Asia still remains behind more advanced economies in educational attainment (Figure 2.1, right panel). For the region to continue along the path of economic or structural transformation its workers need to have more sophisticated skills, many of which come from greater quantities of education and more specialized education.3
Using a framework that maps jobs (occupations) to the skills and education they need (Box 2.1), a large share of the region’s workforce continues to be engaged in low-skilled agriculture (Figure 2.3). Because most farm work continues to rely on traditional and labor-intensive technologies, employment in many parts of Asia is still predominantly in low-skilled occupations where a quality primary education is typically sufficient (Figure 2.4).
3 A process central to economic development and entailing a reallocation of resources to more productive sectors and firms, diversification of production baskets, and use of new technologies, among other aspects. For a detailed discussion of structural transformation, see Key Indicators for Asia and the Pacific 2013.
* Excluding the PRC.Source: Barro-Lee Dataset (1970–2010).
Figure 2.1: Average Years of Schooling
ADB Developing Member Countries Global Regions
2
4
6
8
10
1970 1975 1980 1985 1990 1995 2000 2005 2010
People’s Republic of China (PRC) South Asia Southeast Asia
Developing Asia Central Asia East Asia* The Pacific
0
2
4
6
8
10
12
1970 1975 1980 1985 1990 1995 2000 2005 2010
Year
Advanced economies Developing Asia
Latin America and the Caribbean Middle East and North Africa
Sub-Saharan Africa
Year
7A Smarter Future: Skills, Education, and Growth in AsiaSpecial Chapter
7
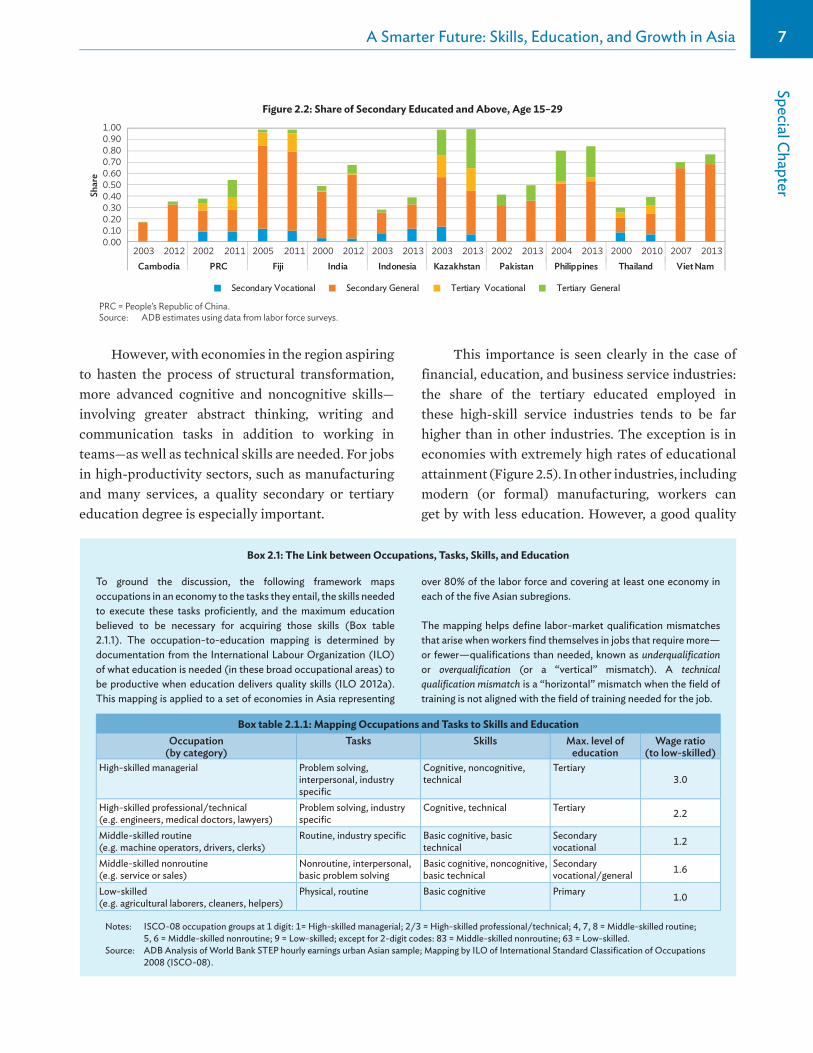
However, with economies in the region aspiring to hasten the process of structural transformation, more advanced cognitive and noncognitive skills—involving greater abstract thinking, writing and communication tasks in addition to working in teams—as well as technical skills are needed. For jobs in high-productivity sectors, such as manufacturing and many services, a quality secondary or tertiary education degree is especially important.
This importance is seen clearly in the case of financial, education, and business service industries: the share of the tertiary educated employed in these high-skill service industries tends to be far higher than in other industries. The exception is in economies with extremely high rates of educational attainment (Figure 2.5). In other industries, including modern (or formal) manufacturing, workers can get by with less education. However, a good quality
PRC = People’s Republic of China.Source: ADB estimates using data from labor force surveys.
Figure 2.2: Share of Secondary Educated and Above, Age 15–29
0.000.100.200.300.400.500.600.700.800.901.00
Shar
e
2003 2012 2002 2011 2005 2011 2000 2012 2003 2013 2003 2013 2002 2013 2004 2013 2000 2010 2007 2013Cambodia PRC Fiji India Indonesia Kazakhstan Pakistan Philippines Thailand Viet Nam
Secondary Vocational Secondary General Tertiary Vocational Tertiary General
To ground the discussion, the following framework maps occupations in an economy to the tasks they entail, the skills needed to execute these tasks proficiently, and the maximum education believed to be necessary for acquiring those skills (Box table 2.1.1). The occupation-to-education mapping is determined by documentation from the International Labour Organization (ILO) of what education is needed (in these broad occupational areas) to be productive when education delivers quality skills (ILO 2012a). This mapping is applied to a set of economies in Asia representing
over 80% of the labor force and covering at least one economy in each of the five Asian subregions.
The mapping helps define labor-market qualification mismatches that arise when workers find themselves in jobs that require more—or fewer—qualifications than needed, known as underqualification or overqualification (or a “vertical” mismatch). A technical qualification mismatch is a “horizontal” mismatch when the field of training is not aligned with the field of training needed for the job.
Box 2.1: The Link between Occupations, Tasks, Skills, and Education
Box table 2.1.1: Mapping Occupations and Tasks to Skills and EducationOccupation
(by category)Tasks Skills Max. level of
educationWage ratio
(to low-skilled)High-skilled managerial Problem solving,
interpersonal, industry specific
Cognitive, noncognitive, technical
Tertiary3.0
High-skilled professional/technical (e.g. engineers, medical doctors, lawyers)
Problem solving, industry specific
Cognitive, technical Tertiary 2.2
Middle-skilled routine (e.g. machine operators, drivers, clerks)
Routine, industry specific Basic cognitive, basic technical
Secondary vocational 1.2
Middle-skilled nonroutine (e.g. service or sales)
Nonroutine, interpersonal, basic problem solving
Basic cognitive, noncognitive, basic technical
Secondary vocational/general 1.6
Low-skilled (e.g. agricultural laborers, cleaners, helpers)
Physical, routine Basic cognitive Primary 1.0
Notes: ISCO-08 occupation groups at 1 digit: 1= High-skilled managerial; 2/3 = High-skilled professional/technical; 4, 7, 8 = Middle-skilled routine; 5, 6 = Middle-skilled nonroutine; 9 = Low-skilled; except for 2-digit codes: 83 = Middle-skilled nonroutine; 63 = Low-skilled.
Source: ADB Analysis of World Bank STEP hourly earnings urban Asian sample; Mapping by ILO of International Standard Classification of Occupations 2008 (ISCO-08).

8 Key Indicators for Asia and the Pacific 20158
PRC = People’s Republic of China.Notes: Only latest survey year available for each country is used. ISIC
Rev. 4 industry groups. Agriculture = 1–3; Manufacturing = 10–33; Other Industry = 41–43; Services (Low-Skilled) = 49–56, 94–98; Services (High-Skilled) = 58–93, 99.
Source: ADB estimates using labor force surveys. Data for the PRC is based on published survey results from the Tabulation on the 2010 Population Census of the People’s Republic of China.
Figure 2.3: Share of Employment by Industrial Sector
0.0 0.1 0.2 0.3 0.4 0.5 0.6 0.7 0.8 0.9 1.0
Viet Nam
Thailand
Philippines
Pakistan
Kazakhstan
Indonesia
India
Fiji
PRC
Cambodia
ShareAgriculture Manufacturing Other Industry
Services (Low-Skilled) Services (High-Skilled)
PRC = People’s Republic of China.Source: ADB estimates using labor force surveys. Data for the PRC is
based on published survey results from the Tabulation on the 2010 Population Census of the People’s Republic of China.
Figure 2.4: Employment in OccupationsRemains Predominantly Low-Skilled
0.0 0.1 0.2 0.3 0.4 0.5 0.6 0.7 0.8 0.9 1.0
Viet Nam
Thailand
Philippines
Pakistan
Kazakhstan
Indonesia
India
Fiji
PRC
Cambodia
Share
Low-Skilled Mid-Skilled (Nonroutine)
Mid-Skilled (Routine) Professional/Technical Managerial
secondary education is still essential, especially for the production of more sophisticated products (Felipe, Mehta, and Rhee 2014).
Under- and overqualification
The data reveal the simultaneous presence of under- and overqualification (as defined in Box 2.1). In some economies (Cambodia, Indonesia, Pakistan, and Thailand), underqualification is more prevalent;
Note: See Figure 2.3 notes for ISIC Rev. 4 industry groups.Source: ADB estimates using data from labor force surveys.
Figure 2.5: Industrial Structure and the Share of Secondary or Tertiary Educated Workers Employed
0.000.100.200.300.400.500.600.700.800.90
Agriculture Manufacturing Other Industry Services (Low-Skilled) Services (High-Skilled)
Shar
e
Cambodia (2012) People’s Republic of China (2007) Fiji (2011) India (2012) Indonesia (2013)
Kazakhstan (2013) Pakistan (2013) Philippines (2013) Thailand (2010) Viet Nam (2013)
in others (Fiji, Kazakhstan, and the Philippines), overqualification (Figure 2.6).
From a skill development perspective—and in the context of an economy’s prospects for rapid growth and structural transformation—underqualification is more important as it points to shortages in the skills needed and possible constraints to economic growth. This is especially likely when a high share of individuals in high-skilled

9A Smarter Future: Skills, Education, and Growth in AsiaSpecial Chapter
9
PRC = People’s Republic of China.Note: Only latest survey year available for each country is used.Source: ADB estimates using data from labor force surveys.
Figure 2.6: Qualification Mismatches
0.0 0.1 0.2 0.3 0.4 0.5 0.6 0.7 0.8 0.9 1.0
Share
Match Overqualification Underqualification
Viet Nam
Thailand
Philippines
Pakistan
Kazakhstan
Indonesia
India
Fiji
PRC
Cambodia
occupations have only at most a primary or secondary education. Cambodia and India appear especially susceptible to this type of underqualification (Figure 2.7). Many of the high-skilled occupations where underqualification is particularly severe are in managerial as opposed to professional occupations.
One issue in education, however, is whether it generates the relevant skills. This means that students must have learned enough of the right type of skills to achieve better labor market outcomes.
In some occupations and industries, having a technical qualification is more critical than others. Which occupations require technical qualifications? Using labor force survey data, analysis of Indonesia, Thailand, and the Philippines suggests that it is high-skilled and a small set of middle-skilled routine occupations where specific technical skills are really necessary (Box 2.2). However, there are far more people unemployed or in other types of temporary wage jobs with the relevant level of education and technical qualification than employed in occupations needing specific technical degrees. The exceptions are health professionals, and those in teaching, business administration, and managerial occupations.
Nevertheless, overqualification and technical qualifications that go unused are a cause for concern if they reflect a poor education or weaknesses in the labor market to generate sustained demand for skilled workers.4 While demand-side policies lie outside the domain of education policy, supply-side policies require gathering the right information to make informed educational investment decisions, which can generate efficiency gains in educational provision, helping ensure that the skills developed are actually utilized (Section 3).
2.2 Quality, not quantity, is the driver of economic growth
In the chapter so far, several references have been made to the quality of education. How is quality to be measured, and how much does it matter? These questions are examined in the context of the cognitive skills that general education is expected to provide and their relationship to economic growth.
Educational attainment—generally measured by years of schooling—is important to economic growth (Figure 2.8). However, a number of
4 Simultaneous over- and underqualification also arise because of search frictions and indicate scope for reallocation of labor that could eliminate the existence of underqualification in some economies.
PRC = People’s Republic of ChinaSource: ADB estimates using data from labor force surveys.
Figure 2.7: Education Share in High-Skilled Occupations
0.0 0.1 0.2 0.3 0.4 0.5 0.6 0.7 0.8 0.9 1.0
Share
Primary Secondary Tertiary
Viet Nam
Thailand
Philippines
Pakistan
Kazakhstan
Indonesia
India
Fiji
PRC
Cambodia

10 Key Indicators for Asia and the Pacific 201510
The type of detail and timeliness required to identify technical qualification mismatches are largely missing in developing Asian economies (Box table 2.2.1).
E�ciency of public financing that emphasizes technical skills requires constant assessments of what skills are in demand. Surveys based on firm perception data (e.g. Manpower Group’s Talent Shortage Surveys) are inadequate for identifying true skill shortages, making it di�cult to develop e�ective skill policies as these surveys su�er from multiple biases.
First, these samples are typically nonrepresentative and focused entirely on large firms—atypical for most developing economies. Second, they rarely di�erentiate between true skill shortages (due to an absence of workers with the right skills) versus reported skill shortages (due to an unwillingness to pay higher wages or provide the right incentives to maximize worker e�ort). Third, most have only just started to distinguish between skills to ascertain whether the investment needed relates to transferable cognitive and noncognitive skills or to technical skills. The surveys that have asked firms about skills tend to reveal that noncognitive skills are more often the “missing” skills than cognitive or specific technical skills.
More objective data would combine annual labor force survey data that contain the supply of workers with specific education and
technical training with data that reflect firm employment demands such as vacancy rates for specific occupations. These could then be complemented by micro-level worker and firm data for critical occupations such as the World Bank STEP data that get more at the issue of “missing” skills, whether cognitive, noncognitive, or technical.
Given that this type of data rarely exist, the following approach is taken to identify technical qualification mismatches:
First, the concentration of education and fields of training in given occupations are examined. This provides a perspective on the degree of reliance that an occupation has on a specific type of technical training and education. Second, if an occupation is highly reliant on a technical field of training (say, more than 10% of workers in that occupation) and if the number of unemployed and temporarily employed workers with the right technical qualifications is small (relative to the share of permanently employed workers in that occupation), the occupation is identified as “potentially” more constrained in technical skill supply.
Some drawbacks, however, are that identification depends on the degree of detail that the data has on occupation, education, and training, and the extent to which permanent employees in occupations actually reflects skill demands.
Box 2.2: Identifying Technical Qualification Mismatches
Box table 2.2.1: Data Collection Across CountriesLabor force data Enterprise data
Collection ratea
Occupational code detailb
Industrial code detailc
Field/ Education
major informationd
Collection ratea
Vacancy informatione
Occupational code detailb
Occupation groupsf
Industrial code
detailc
United StatesRepublic of KoreaArmeniaCambodiaChina, People’s Rep. ofIndiaIndonesiaPakistanPhilippinesThailandViet Nam
= first best practices = second best practices = third best practices. Blank = no information exists.
Note: See Appendix 4 for detailed methodology.a. Collection rate: dark blue = quarterly or monthly collection; blue = biannual or annual collection; light blue = less than annual.b. Occupational code detail: dark blue = 5–6 digit level; blue = 2–4 digit level; light blue = no collection or 1 digit.c. Industrial code detail: dark blue = 5–6 digit level; blue = 2–4 digit level; light blue = no collection or 1 digit.d. Field/Education major information: dark blue = 50+ majors/ tech fields; blue = 10–49 majors/tech fields; light blue = broad level or no collection.e. Vacancy information: dark blue = data collection on vacancy; light blue = no data collected.f. Occupational groups: dark blue = data collected on more than 4 categories; blue = collected on 3–4 categories; light blue = data collected on
fewer than 3 categories.Source: Various labor force and enterprise surveys.

11A Smarter Future: Skills, Education, and Growth in AsiaSpecial Chapter
11
developing Asian economies have not been able to translate educational investments into quality skills (Figure 2.9)—a large share of the population have not achieved basic skills as evidenced by the share of the students scoring below 400 on international PISA and TIMSS tests (Box 2.3). This is one reason why educational investments have sometimes fallen short of expectations to drive higher growth within economies (Pritchett 2001; 2006).5
It is educational quality not quantity that really matters for economic growth. Controlling for a country’s average level of cognitive skills as proxied by international PISA and TIMSS science and mathematics test scores—the effect of years of education on growth disappears while skills strongly predicts growth (Figure 2.10; Hanushek and Woessmann 2008).
However, this does not mean that science and mathematics should be the sole focus of economies aiming to develop greater economic growth. Many important cognitive and noncognitive skills could
5 Moreover, the e�ect of average years of schooling on average growth between 1960 to 2000 versus 1970 to 2010 finds that the predicative power of years of schooling to explain growth has weakened.
HKG = Hong Kong, China; IND = India; INO = Indonesia; JPN = Japan; KOR = Republic of Korea; MAL = Malaysia; PHI = Philippines; SIN = Singapore; TAP = Taipei,China; THA = Thailand.Note: See Appendix 1 for detailed methodology.Source: ADB estimates using data from Penn World Table Version 8.1
and Barro-Lee Dataset (1970–2010) using approach by Hanushek and Woessmann (2008).
Figure 2.8: Growth and Years of Schooling, 1970–2010(Conditional on initial GDP per capita)
−4−2
02
4
−4 −2 0 2 4 6
HKG
INO
IND
JPN
KOR
MALPHI
SIN
THA
TAP
Cond
ition
al G
row
th
Conditional Years of Schooling
Coe�cient = .39, se = .102, t = 3.822
The Programme for International Student Assessment (PISA) and Trends in International Mathematics and Science Study (TIMSS) are two tests aimed at revealing the knowledge of students around the world. They are run every 3 or 4 years.
PISA tests students at age 15, while TIMSS tests 4th and 8th grade students (mean age 10–11 and 14–15 across economies). Both tests are modeled similarly and use similar scales to measure competencies on a 1,000-point scale with a mean 500 and standard deviation of 100. Scores around 400 (Level 2) should demonstrate that a student has reasoning skills and can do simple mathematical or science procedures. Hanushek and Woessmann (2015) consider this as representing the basic level of skills needed to function adequately in a modern economy. A student who scores above 600 (Level 5) has top-level skills and demonstrates ability to solve complex problems, reason, and strategize.
Test measures have several limitations. First, the tests are only based on the student population rather than all individuals age 15. This is problematic in economies where a large share of the population is no longer in education at age 15 (e.g. in Viet Nam this share is one-third). This could result in upward bias in estimated cognitive skills. Second, test questions could have cultural or socioeconomic biases that can influence test results (e.g. Wuttke 2007). Third, the underlying psychometric model for scoring test results could be flawed in the assumptions that various questions are equally di�cult across countries (Kreiner and Christensen 2014). Nevertheless, these tests remain some of the best internationally comparable measures of cognitive skills across countries.
Box 2.3: Measuring Cognitive Skills across Countries
Note: OECD estimate includes Republic of Korea, Japan, and United States.
Source: PISA 2009* and 2012; TIMSS 2003**; TIMSS 2007***.
Figure 2.9: Test Scores across Asian and OECD Economies
0 10 20 30 40 50 60 70 80 90 100
Kyrgyz Republic*India (Tamil Nadu)*
IndonesiaGeorgia*
Philippines**Azerbaijan*
MalaysiaKazakhstan
ThailandMongolia***
Armenia**United States
OECDTaipei,China
Viet NamJapan
SingaporeRepublic of KoreaHong Kong, China
600+ 400+

12 Key Indicators for Asia and the Pacific 201512
be developed through other coursework outside mathematics and science, but have remained difficult to capture due to the absence of standardized measurement. For example, a liberal arts education could have an important role in fostering critical
logic and reasoning skills that generate workers who are more adaptable to evolving workplace tasks (Box 2.4). In addition, noncognitive skills have been shown to improve a variety of economic and noneconomic outcomes (OECD 2015).
A science and mathematics education is crucial, but the importance of a liberal arts education, which studies philosophy, politics, literature, and history among other topics, should not be overlooked. Whether as a degree in college or a liberal arts course integrated into the curriculum of science and mathematics in basic education or higher education, it has the potential to impart learning that fosters creativity, develop observational acuity, hone communication skills, and sharpen analytic thinking—skills needed in the knowledge economy.
As technology moves ahead and computers become exponentially more e�cient than humans in performing more routine tasks, the skills needed in the knowledge economy will be innately human. While valuable, technical skills will no longer be enough to ensure long-term career stability or success. In a survey of chief executive o�cers and other executives in the US, 93% of respondents agreed that a candidate’s ability to think critically and communicate ideas eectively is more important than their choice of college major. Fifty-five percent of employers surveyed agreed that having both field-specific knowledge and a broad range of skills (that exposure to a liberal arts education can provide) is crucial for long-term success in a chosen field (Hart Research Associates 2013). Analysis of career earnings show that those with liberal arts degrees in the US have higher earnings at peak earning ages (56–60) than
professional and preprofessional degrees and earn significantly more after attaining advanced degrees (AACU 2014).
A rising number of educational institutions in Asia, which have in the past been dominated by highly structured curricula with science and math subjects being of prime importance, have slowly begun to expand liberal arts courses and relax the rigid structure of their curricula. Students are increasingly having more freedom to choose courses that pique their interest.
The People’s Republic of China (PRC) and Thailand are among the countries that have developed partnerships with liberal arts colleges in the US to oer a more broad-based education to students. New York University Shanghai, in the PRC, was formed as a partnership between New York University and East China Normal University, and provides students with 2 years of core education in liberal arts. In Thailand, Mahidol University, originally established as a medical school, partnered with the College of Liberal Arts of De La Salle University in the Philippines to oer student and faculty exchange programs. By laying a foundation that places equal emphasis on liberal arts and scientific methods, these colleges aim to produce graduates who are creative and critical thinkers who can be productive members and leaders in technologically advanced economies.
Box 2.4: The Value of a Liberal Arts Education
Growth and Test Scores (Science and Mathematics)(Conditional on initial GDP per capita and years of schooling)
Growth and Years of Schooling(Conditional on initial GDP per capita and test scores)
Figure 2.10: Growth, Skills and Years of Schooling, 1970–2010
HKG = Hong Kong, China; IND = India; INO = Indonesia; JPN = Japan; KOR = Republic of Korea; MAL = Malaysia; PHI = Philippines; SIN = Singapore; TAP = Taipei,China; THA = Thailand.Note: See Appendix 1 for detailed methodology.Source: ADB estimates using data from Penn World Table Version 8.1, Barro-Lee Dataset (1970–2010), and PISA and TIMSS science-mathematics test
scores (2000–2012), using approach by Hanushek and Woessmann (2008).
Cond
ition
al G
row
th
Conditional Years of Schooling
Coe�cient = .141, se = .091, t = 1.541
Cond
ition
al G
row
th
Conditional Test Scores
Coe�cient = 1.491, se = .23, t = 6.484
−20
24
68
−1 0 1 2
HKGINOIND
JPN
KOR
MAL
PHI
SINTHA
TAP
−2
0
2
4
6
8
−4 −2 0 2 4
HKGINO
IND
JPN
KORMAL
PHI
SINTHA
TAP

13A Smarter Future: Skills, Education, and Growth in AsiaSpecial Chapter
13
Yet it is not just average skills that matter, but also top-end skills. Building a critical mass of highly educated and skilled workers provides increased returns to economic growth, especially in times of fast-paced technological change (Squicciarini and Voigtlander 2014). A larger mass of highly educated workers has positive spillovers, resulting in the least educated having greater wage growth than those with higher levels of education (Moretti 2004).
Across countries, those that have developed higher-level cognitive skills, as captured by the share of science-mathematics test scores over 600 on the PISA or TIMSS, have higher economic growth (Hanushek and Woessmann 2008). Projections imply that if developing Asian economies focus on achieving levels of basic skills that match those in OECD economies (Scenario 2) rather than focusing on ensuring greater access that raises years of schooling to OECD levels while maintaining current skill levels (Scenario 1), growth could be substantially higher (Figure 2.11). Moreover, by focusing on top-end skills where at least 15% of the population achieves test scores over 600, similar to OECD economies, growth could be at least 30% higher than just focusing on improving basic skills (Scenario 3).
The challenge for developing Asian economies will not only be to improve the quality of basic education, but also to build a higher education system that can foster and develop more of the top-end and highly technical skills. The Republic of Korea; Singapore; and Taipei,China, which had significant growth, built a system of high-end universities with close links to industry. These economies have a disproportionate share of universities that rank in the global top 500 compared with their university- aged population. In contrast, Asia’s low- and middle-income economies, which account for more than half of the global population, have only 36 universities in the top 500, suggesting a lack of quality, higher
Notes: Projections assume that educational reforms take 15 years and another 40 years to fully replace the entire labor force with new skills. Scenario 1 simulates raising the average years of schooling in Asian economies to average OECD level (11.6 years). Scenario 2 simulates raising the share of students with scores above 400 to OECD level (85%). Scenario 3 simulates raising the share of students with scores above 400 and 600 to OECD level (85% and 15%, respectively). See Appendix 1 for detailed methodology.
Source: ADB estimates following Hanushek and Woessmann (2011).
Figure 2.11: Growth Projections to 2045from 15-Year Reform Policies for Education and Skills
300
55
202
160
2420
432
0 20 40 60 80 100 120 140 160 180
Viet NamKazakhstan
ArmeniaMalaysiaThailand
AzerbaijanMongolia
GeorgiaIndonesia
PhilippinesKyrgyz Republic
India
013
920
2330
2237
5472
91103
0 20 40 60 80 100 120 140 160 180
Viet NamKazakhstan
ArmeniaMalaysiaThailand
AzerbaijanMongolia
GeorgiaIndonesia
PhilippinesKyrgyz Republic
India
139
4255
60676971
101119
132151
0 20 40 60 80 100 120 140 160 180
Viet NamKazakhstan
ArmeniaMalaysiaThailand
AzerbaijanMongolia
GeorgiaIndonesia
PhilippinesKyrgyz Republic
India
Percent increase in GDP per capita between 2015 and 2045
Scenario 1: Raising average years of schoolingin Asian economies to average OECD level
Percent increase in GDP per capita between 2015 and 2045
Scenario 2: Raising the share of studentsscoring 400+ to OECD level
Percent increase in GDP per capita between 2015 and 2045
Scenario 3: Raising the share of studentsscoring 400+ and 600+ to OECD level

14 Key Indicators for Asia and the Pacific 201514
education institutes to develop a critical mass that can drive skill and human capital competitiveness.6
Thus economies hoping to achieve faster economic growth should start focusing more on ensuring that education is delivering quality and relevant skills. This requires them to understand what types of skill gaps exist—noncognitive, cognitive, or technical—in matching educational supply to labor market demands and to invest in quality education that can better develop the critical skills not just to meet current labor market needs, but those of the future as well.
2.3 The future of skill demand
Though the pace has varied, many economies in Asia have experienced increases in both the demand and supply for mid- and high-skill occupations relative to low-skill ones. The most successful have been economies in East and Southeast Asia that have managed to shift more of their production and employment toward modern manufacturing and high-skilled services which incorporate automation into their production processes, reducing the burden on labor to perform routine tasks, and integrating themselves into the global economy.
To a considerable extent, these shifts have mirrored earlier ones in today’s developed countries where technological change saw small artisanal workshops being replaced by large plants employing workers who operated purpose-built machinery. Often, these workers were unskilled farm laborers who could learn to become machine operators with some basic training and move into the ranks of medium-skilled laborers (Goos 2013).
The continued relevance of this process of skill upgrading, however, is being called into question.
6 QS World University Rankings list for 2014/2015: 18 in the PRC, 7 in India, 2 in Thailand, 5 in Malaysia, 2 in the Philippines, 2 in Indonesia; US News lists 27 in the PRC, 4 in India, 1 in Malaysia, and 1 in Thailand.
Technological change involving the growing use of computers and automation in production are increasingly associated with job polarization in developed countries where employment has shifted away from middle-skilled routine jobs into low- and high-skilled jobs. This has occurred because routine tasks carried out by medium-skilled workers in manufacturing and services have increasingly been displaced by computers and automated processes and offshored—when firms have relocated particular tasks to firms and workers in other countries with lower wages (e.g., Autor and Dorn 2013; Blinder and Krueger 2013; Goos, Manning, and Salomons 2014).7
So far, low wages and openness to trade have helped make Asian economies the beneficiaries of these changes. Nevertheless, more attention will need to be paid to how new technologies influence the demand for different types of skills in these economies. Recent work finds that the peak share of employment in manufacturing over the course of economic development has declined even as peak shares of manufacturing output have stayed the same (Felipe, Mehta, and Rhee 2014; Rodrik 2015).
Computerization and automation likely have already had some role to play in dampening the demand for workers, at least in manufacturing. More recent advances could seriously alter the mix of skills, and not just in manufacturing. For example, cloud computing and 3D printing are new technologies that are potentially disruptive forces in services and manufacturing. Cloud technologies provide an avenue for highly skilled workers in developing economies to market their skills abroad and obtain a higher wage premium without leaving their home countries.8
7 The process of offshoring has been made possible in part by improvements in information and communications technologies.
8 Cloud computing technologies enable employers to pull together teams of skilled workers that can transcend geographic boundaries. Cloud technologies create transparency in the production process allowing team members to visualize their contribution to the overall project and easily track the inputs of others. As employers in developed economies are increasingly adopting these technologies, they have the potential to open up opportunities for the most skilled workers in developing-country labor markets.

15A Smarter Future: Skills, Education, and Growth in AsiaSpecial Chapter
15
Similarly, the use of 3D printing and robotics is still nascent, but can alter the manufacturing sector by significantly reducing production costs of smaller and more customizable products making it more efficient for production to be relocated closer to the sources of demand (McKinsey Global Institute 2013). This could alter skill demands by placing more emphasis on engineers, graphic designers, and printing operators and largely eliminate the need for workers who conduct simple routine tasks.9
It is difficult to predict how evolving trends in technology could change the nature of occupations and ultimately the skills in demand. In the context of the US, some researchers have predicted that many low- and middle-skilled occupations entailing the execution of routine tasks may face job destruction in the coming future (Frey and Osborne 2013). Applying these authors’ estimates of probabilities of job destruction to all regular wage employment—capturing employment where there is reasonable stability that the worker will remain employed within that firm in the near future–to the labor force survey data, estimates suggest that anywhere from 5% to 28% of all jobs are at high risk for job destruction (Figure 2.12).
However, if the history of technological change over the last two centuries is a guide to the future—the green revolution that displaced workers from farming is one example10—occupations involving mastery of new tasks that complement the technologies will arise as replacements for older occupations. Moreover, “efficiency effects”
9 Traditional manufacturing has specific tooling requirements creating upfront fixed costs and material waste that adds to variable costs. In comparison, 3D printing machines can easily create new and customizable products through simple changes in digital designs.
10 As Autor (2014) points out, 41% of the US workforce in 1900 was employed in agriculture. This share had fallen to 2% by 2000 largely due to the productivity gains resulting from the Green Revolution. He states: “It is unlikely however that farmers at the turn of the 20th century could foresee that 100 years later, healthcare, finance, information technology, consumer electronics, hospitality, leisure and entertainment would employ far more workers in agriculture.”
may occur that enable more efficient and profitable provision of goods or services resulting in a larger number of total employees hired even while the number of employees required to carry out specific sets of tasks declines.
The case of automated teller machines (ATMs) and (human) bank tellers in the US is illustrative (Bessen 2015). Introduced in the US in 1971, ATMs reduced the number of bank tellers and other support employees required to manage a bank branch. However, the number of bank tellers tended to increase between 1980 and 2010 even with the dramatic increase in the use of ATMs. One factor responsible was that, while the number of employees to operate a bank branch declined (from about 20 in 1988 to a little over 13 in 2004), banks used the decline in the cost of opening a new branch to expand the number of their branches. This expansion in output ensured that demand for human tellers continued to increase.
In the face of all these changes and uncertainties about how new technologies will play out, what, if any, lessons are there for skill development policy?
First, the example of cloud computing implies that new technologies likely will increase the
Notes: Only latest survey year available for each country is used. Mappings from standard occupational classification (SOC) codes 2010 to ISCO-08 at 3- or 2-digit level used. Employee weights used. Only regular employees assumed to be at risk for job destruction.
Source: ADB estimates using Frey and Osborne (2013) computerization probabilities and data from labor force surveys.
Figure 2.12: Percent of EmploymentFacing Possible Job Destruction
5.0
14.7
15.7
20.1
21.0
21.2
23.1
26.4
28.0
2.7
16.6
15.9
15.7
7.3
13.1
12.4
10.3
8.4
0 5 10 15 20 25 30 35 40
IndiaViet Nam
CambodiaPhilippines
IndonesiaPakistan
FijiThailand
Kazakhstan
PercentHigh Risk Mid Risk
16 Key Indicators for Asia and the Pacific 201516
demand for skilled workers who can solve highly complex tasks and think creatively and innovatively. Thus developing Asia must ensure that it has an educational system that can produce a critical mass of workers with these top-end skills.
Second, while many routine tasks might be susceptible to automation, many middle-skilled jobs involve the execution of a mixture of routine and nonroutine tasks, including interpersonal interaction, problem-solving, flexibility, and adaptability (Autor 2014). Medical-support, many skilled trade and repair, marketing, and even modern
clerical occupations fit this bill. Such jobs are likely to continue to exist and performing them well will require not only some specific technical skills (including digital skills) but also solid foundational cognitive and noncognitive skills.
The main essence is that economies that invest in providing high-quality education will likely be the least affected by disruptive innovations—and will be better placed to exploit them—because solid foundational skills are the basis for adapting to new opportunities and technical tasks driven by these shifting occupational demands.

17Special Chapter
17
Section 3. Enhancing Skill Development
Developing Asian economies have dramatically increased their educational attainment over the past few decades, though some have fallen short in delivering high-quality and relevant cognitive and noncognitive skills for today’s labor market. To take skill development to the next stage, policy makers will need to commit to policies that weigh the trade-offs involved and make critical decisions on where to invest—effectively and efficiently.
More specifically, education policies must be guided by three (interlinked) elements:
(i) Financial efficiency recognizes that public finances are limited and skill needs are many and diverse. Improving financial efficiency requires difficult choices to be made, such as how much to invest in early childhood development and how to balance investments across general and technical education. It can help improve educational quality in terms of skill gains per dollar of public investment by making them complementary to private investments, targeting investments to earlier ages, targeting to more disadvantaged groups, figuring out how to balance investments in technical education versus general education, and identifying ways to reduce the costs of educational provision with no detriment to learning outcomes.
(ii) Educational delivery entails attention to the details of curriculum content that are well matched to student skills, and to curriculum delivery, whether through enhancing teacher effort and skills or using alternatives to reduce variations in content and delivery of educational provision.
(iii) Educational access involves mitigating traditional barriers in costs to access through constructing buildings and other infrastructure, designing programs that
eliminate credit and informational market failures, and complementing these programs with small nudges to enhance and optimize skill-investment decisions by families and individuals (i.e. behavioral aspects).
Implementing these elements effectively is fundamentally about good governance. This requires making evidence-based policy and investment decisions and imposing accountability by setting concrete targets for educational inputs, skill development, or labor market outcomes. It is also important to align the educational system with school and teacher incentives through rewards or punishments based on performance using clear and specified targets.
Crucially, information that collects quality data is at the heart of both. To show this, key features of skill development systems and their relationship to measures of cognitive skill outcomes are discussed.
3.1 Skill development systems in Asia
Developing Asian economies differ widely in how they design and manage their skill development systems. Context matters, but are some approaches more effective at developing skills than others? How much do the three elements above really matter?
In tackling these questions the approach involves systematically documenting different types of skill-investment programs and policy priorities in various economies that capture aspects of financial efficiency, educational delivery, and educational access. Crucially, an attempt is made to describe the extent to which economies make an effort to collect the data that underlie evidence-based policy making and accountability—the essence of good governance.

18 Key Indicators for Asia and the Pacific 201518
3.2 Capturing key features of skill development systems
To identify relevant indicators, a vast literature of empirical studies was referenced that provided rigorous evidence of programs and policies that work.11 The evidence on optimal design features, including cross-country analysis and impact evaluations that identified causality between policies and improved skill-development outcomes, with a primary focus on literature that used test scores as the primary outcome of interest was reviewed.
Based on this literature, a questionnaire was constructed comprising 200-plus indicators—for which no standardized objective information exists across economies—to capture variations in quality and breadth of policy implementation at the country level. Quality is represented by numerical values. For 77 economies, 67 of which had taken the PISA or TIMSS test within the last 15 years, this questionnaire was filled out for areas that are related to delivery of skills in basic education.
For 23 developing member economies (DMEs) the entire questionnaire was assessed for basic and upper secondary, TVET, and higher education, as well as learning on the job to gauge current levels of institutions, investments, and policies governing these levels of education compared with to the top DMEs that have achieved quality delivery in these areas—namely the Republic of Korea; Singapore; and Taipei,China (Table 3.1). This set of DMEs covers 95% of Asia’s population.12 However, because of the absence of concrete outcomes, particularly for TVET and higher education, there is especially a need to develop research further in these areas.
11 See, e.g., Glewwe et al. (2013) and Murnane and Ganimian (2014) for detailed literature reviews of primary and secondary education. However, a much broader review was conducted which is included throughout the remainder of the chapter.
12 These economies were selected for the following reasons: PISA/TIMSS test scores existed and therefore allowed us to relate indicators for basic education to test score outcomes; skill development programs have already been carefully documented and secondary information was easy to access; and ADB has major operations in these economies and therefore documentation may help to inform future discussions.
The questionnaire was filled out through reviews of UNESCO, World Bank SABER, government documents, and consultations with independent country experts when insufficient information was available. Indicators from the questionnaire were combined with important objective indicators such as educational financing as a share of GDP and enrollment rates that are reported in World Development Indicators (WDI) and UNESCO databases. The questionnaire and key indicators are broadly described in Appendix 2.
3.3 What matters for skill development?
To answer this question, the aim was to identify indicators that were significant predictors of higher internationally comparable science-mathematics test scores, as measured by the PISA/TIMSS. To ensure that these indicators are not explained by a country’s income or current stock of human capital, both GDP per capita and average years of schooling for those aged 15–65 in 2010 were controlled for in the regressions. Multiple pairwise regressions were run to try and ensure that some indicators were not just a proxy for other indicators. Our findings should not be interpreted as causal, however, but are more suggestive, viewed as a starting point to arrive at more concrete policy priorities and investments that appear to work across economies and institutional contexts.
A rank ordering of basic education indicators associated with greater test score outcomes suggests that improving information practices through quality data collection for evidence-based policy decisions, targeting, and accountability is key. This also includes providing information directly to parents on school and student performance that allows them to improve private skill investment decisions and to hold schools and teachers accountable. By improving informational practices from the economies with the least developed practices to the three economies with the most developed practices in developing Asia

19A Smarter Future: Skills, Education, and Growth in AsiaSpecial Chapter
19
Table 3.1: Education and Skill Development ChecklistIn comparison to average of High-Income Asian Developing Member Economies (Korea, Republic of; Singapore; Taipei,China)
Level Area Topic Indicator #Central
AsiaSouth Asia
Southeast Asia
East Asia
The Pacific
NationalFinancial e¤ciency Public educational expenditure as % of GDP 1
Data and information Information for evidence-based policy decisions 46
Financial e¤ciency Targeted funding for early childhood education 4
Financial e¤ciency Emphasizing technical education 1
Learning on the job Competitive markets 3
Learning on the job Firm training investments 1
Learning on the job Matching workers to jobs 4
Learning on the job Gender equality 1
Basic and Upper Secondary Education
Data and information Information 43
Financial e¤ciency Public-private partnerships 11
Educational delivery Curriculum content 16
Educational delivery Teacher certification, wages, incentives 19
Educational delivery Technology and software usage 1
Educational access Financial aid 3
Educational access Counseling and mentoring 4
Educational access Rural–urban parity 2
Educational access Gender equality 2
Technical Vocational Education and Training
Data and information Information 28
Data and information Public-private partnerships 4
Data and information Curriculum content 17
Educational delivery Teacher certification, wages, incentives 18
Educational delivery Technology and software usage 4
Educational access Financial aid 5
Educational access Rural–urban parity 2
Educational access Gender equality 1
Higher Education
Data and information Information 27
Financial e¤ciency Public-private partnerships 4
Educational delivery Teacher certification, wages, incentives 16
Educational access Financial aid 3
Educational access Gender equality 1
PISA score (science-mathematics) 1 401 347 427 441Average years of schooling (15–65) 1 11.2 7.2 7.6 8.7 10.3
= Indicator is within 90% = Indicator is within 50% = Indicator is below 50%. Blank = No information exists for indicator.
Note: Central Asia (Armenia, Azerbaijan, Georgia, Kazakhstan, Kyrgyz Republic, Tajikistan); South Asia (Bangladesh, India, Pakistan, Sri Lanka); Southeast Asia (Cambodia, Indonesia, Malaysia, Myanmar, the Philippines, Thailand, Viet Nam); East Asia (Mongolia, the PRC); Pacific (Fiji).
Source: ADB estimates.

20 Key Indicators for Asia and the Pacific 201520
(Singapore; the Republic of Korea; Taipei,China) test scores could rise by 55 points or 0.55 standard deviations (Figure 3.1; SD is explained in Box 3.1).
Also important is curriculum content adjusted to match a student’s capabilities through provision of remedial and enrichment courses and fostering critical problem-solving and noncognitive skills while emphasizing basic digital and financial skills. Implementing practices of the best Asian economies in this area could raise average test scores by as much as 41 points. Investing in programs that target early childhood education—programs that are provided at a broad level nationally and start earlier—could result in a 34-point increase in skill outcomes (Figure 3.1).
Notably, greater educational financing as a share of GDP has little bearing on skill differences across economies. This suggests that while financing
is necessary to fund different educational inputs, it is not sufficient to obtain better skill outcomes. More attention must be paid to how educational finances are spent on different types of inputs and allocated among different levels, types of education (general and technical), and targeted to different disadvantaged groups. Public–private partnerships (PPPs), financial aid, and technology usage also are never consistently a determinant of better skill outcomes across economies. Moreover, teacher quality—certification, wages, and incentives that help in recruiting better teachers—are not a significant determinant of better skills. This is perhaps because institutional context matters a lot to ensure these types of inputs are effective and must be complemented by other types of inputs. However, while complementary inputs may be necessary for certain investments to be effective, none of the interaction effects between different indicators came up as significant in the data.
Figure 3.1: Importance of Skill Development Policies for Basic Education to Mean Test Scores(controlling for GDP per capita and years of schooling, 15–65)
Notes: Information comprises data for evidence-based policy decisions (National) and informationfor basic and upper secondary education. Solid columns significant at 10% at least 8 out of 15 times.
See Appendix 2 for details.Source: ADB estimates.
8
19
19
20
26
34
34
41
55
0 10 20 30 40 50 60
Financial aid
Public educational expenditure as % of GDP
Technology and software usage
Public-private partnerships
Teacher certification, wages, incentives
Counseling and mentoring
Gender equality in enrollment
Early childhood education
Curriculum content
Information
Change in PISA/TIMSS test scores
Moving indicator from bottom 3 to top 3 developing member economies

21A Smarter Future: Skills, Education, and Growth in AsiaSpecial Chapter
21
Many regions have observed gaps in their information collection policies, design of curriculum content, and funding for early childhood education (Table 3.1, above). Taking a closer look at the data in various developing Asian economies, it was found that 17 out of 20 economies still have scope to raise their investment to close gaps with the top three DMEs in informational practices.13 All 20 economies examined could also improve their curriculum development. 18 out of 20 economies could also improve their attention and funding for early childhood education relative to the top three DMEs.
A balanced view of the indicators recognizes that the indicators are limited by the ability to adequately capture the quality of various policies and investments. For example, teacher certification, wages, and incentives are captured by share of teachers trained, an indicator of relative wages compared with other professional jobs and whether teachers receive compensation based on their performance. This, however, could be insufficient as a proxy to capture important aspects of teacher
13 The 20 referenced here do not include the top three DMEs (the Republic of Korea; Singapore; and Taipei,China).
Standard deviations (SDs) can provide a comparison of the e�ectiveness of project interventions independent of di�erences in the type of skill test administered. Conceptually, a one-SD improvement in test scores (assuming they are normally distributed) would be equivalent to moving a student’s rank from the 33rd to the 66th percentile.
Box table 3.1.1 shows a range of estimated impacts from interventions. Financial accountability, school accountability, and scripted curriculum have shown significant e�ects in improving test score outcomes. If all interventions had equivalent costs per student, technology usage and school accountability are the most cost e�ective. Nevertheless, costs associated with quality implementation often di�er and alter the relative trade-o�s between these di�erent types of educational investments.
Box 3.1: Comparing the E�ects of Interventions on Skills using Standard Deviations
Box table 3.1.1: Estimated Impacts of InterventionsIntervention SD Skill Change Source
Financial accountability 0.35 Ferraz, Finan, and Moreira (2012)School accountability 0.23–0.42 Bloom et al. (2015)Teacher accountability 0.17–0.27 Duflo, Hanna, and Ryan (2012); Lavy (2015)Public accessibility of information 0.10–0.31 Andrabi, Das, and Khwaja (2014)Educational vouchers 0.23 Muralidharan and Sundararaman (2015)Contract teachers 0.15–0.22 Muralidharan and Sundararaman (2013); Duflo, Dupas, and Kremer (2015)Remedial Education 0.28 Banerjee et al. (2007)Technology usage (computer-assisted learning) 0.12–0.47 Banerjee et al. (2007); Lai et al. (2012); Huang et al. (2014); Mo et al. (2014a)Scripted curriculum 0.31–0.33 He et al. (2007)Classroom reorganization 0.26 Li et al. (2014)
skills and motivation. In particular, quality of human resource management practices and performance- based pay could fundamentally matter, but are difficult to capture by the indicators created. Financial aid is captured by conditional cash transfer, school-feeding, and scholarship programs for basic education, but has still not been developed to better capture quality dimensions of these programs in terms of targeting.
Future extensions to these indicators therefore will aim to improve the precision of the indicators along quality dimensions. However, the difficulty in constructing indicators that adequately capture and describe quality could also point to the difficulty that economies face in design and implementation. For policies that are not consistent predictors of test scores across economies, undertaking rigorous evaluations before scaling up are likely far more important to ensure that these type of public investments are effective and result in real gains to critical skills.

22 Key Indicators for Asia and the Pacific 201522
Section 4. Evidence-based Policy Decisions and Accountability
Implementing financial efficiency, educational delivery, and educational access requires making evidence-based policy and investment decisions and imposing accountability. These are the essence of good governance. They require commitment by policy makers to develop concrete and clear targets and to support data collection practices and analysis. These in turn will inform decision-making and accountability practices, whether through administrator monitoring or publicly sharing information.
4.1 Evidence-based policy decisions
Evidence-based policy decisions formulate policy from rigorous research, rather than from advocacy, beliefs, or political priorities. They require having a clear theory of change that documents the mechanisms through which different investments and inputs subsequently lead to enhanced skill or educational outcomes. Key considerations include when to directly provide education, which types of skills to invest in, and how to make investments
more effective such that it leads to greater gains in economywide skill outcomes (Figure 4.1).
For financial efficiency this relies on collecting the right data and information that can inform how to allocate finances to different types of investments (e.g. infrastructure, human resource management [HRM], direct provision of education), among different ages, over different types of skills (e.g. technical versus general), and deciding what types of programs could lead to cost reductions in educational provision while maintaining quality.
For educational delivery it is important to evaluate how to design quality curriculum content that teaches critical and relevant skills—cognitive, noncognitive, or technical—but also enables students to learn independent of their current ability level. It requires figuring out the best mode of instruction. This in turn involves evaluating the conditions under which teachers enhance student learning or whether alternatives, such as technology with quality content, may do better at delivering improved learning outcomes.
Identification oftargeted
educationaloutcomes
Collection ofquality data
on inputsand outcomes
Analysis
BETTER SKILLOUTCOMES
EVIDENCED-BASED POLICYDECISIONS AND INVESTMENTS · Financial e�ciency · Educational delivery · Educational access
Figure 4.1: Quality Data is the Basis for Evidence-based Policy Decisions
Source: ADB.

23A Smarter Future: Skills, Education, and Growth in AsiaSpecial Chapter
23
For educational access it is critical to collect data that can help inform effective interventions that should be targeted at different disadvantaged groups to close gaps in educational outcomes. This includes understanding when gender biases, locational differences, or socioeconomic status precludes students and families from optimizing their skill investments.
4.2 Accountability
Accountability requires committed legislators, competent administrators, and enough funding to collect the right data to monitor and evaluate outcomes (Figure 4.2). Accountability is about developing mechanisms that hold people—educational officials, school managers, and teachers—accountable to identified performance targets, whether for finances, enrollment, educational attendance, or learning outcomes.
Collecting quality data is the essential basis for implementing accountability practices that enhance skills (Box 4.1). Accountability can work through two mechanisms: HRM practices, undertaken by competent administrators, to ensure that school managers and teachers are performing as expected; and publicly sharing information with parents and students who undertake actions that place social pressure on teachers and schools to improve educational delivery. When either type of accountability exists, school autonomy has the potential to provide an extra boost in delivering better skill outcomes at a lower cost.
The documentation in Section 3 suggested that many economies in Asia do not collect the right information and data needed to implement accountability practices, especially for TVET and higher education. Quality data collection is the first step toward enhancing skills that will allow economies to promote better HRM practices.
Human resource management practices
Quality HRM practices entail rewarding or punishing educational administrators, school managers, or teachers, based on targeted outcomes. Rewards could involve bonuses in pay, promotions, or additional training, while punishments could involve pay deductions or firing for failure to comply with performance targets.
Accountability and collection of credible metrics require legislation that allows the overseeing institution to gather, collect, and audit educational institutions and punish noncompliance or misreporting. Legislation must state how institutions can use the data, and maintain the privacy and security of individuals and entities for which the data are collected.
Quality assurance practices involve activities before, during, and after data collection. Before, protocols must be set and sta� responsible for data collection trained and retrained. During and after, monitoring practices must be followed and outliers identified.
Auditing can improve compliance. In Indonesia, a randomized experiment showed that increasing auditing from 4% to 100% decreased missing road expenditures by 8 percentage points, or 30% (Olken 2007). It is, however, costly. Audit probabilities and consequences of noncompliance should be set to optimize compliance in relation to the costs of auditing. The greater the benefits there are to noncompliance the greater is the need to raise the fines or probabilities of audits (Mookherjee and Png 1989). Cost e�ciency dictates random auditing with strategies for auditing that di�er with the probability that there has been misreporting (Ravikumar and Zhang 2012).
Auditors themselves should be audited if there are incentives for institutions to bribe auditors. Thus auditing should be randomized and unexpected, with mechanisms to ensure the integrity and credibility of the auditors that could punish auditors for noncompliance. There also should be a process for educational institutions to challenge audits that they think are unfair or biased.
Technology can help to enforce accountability, and to monitor and ensure quality of inspections. For example, requiring inspectors to film and document each of the audited facilities and how the facility was scored can ensure easier review and documentation of the inspection process and enhance compliance by the inspection team, as well as the quality of educational providers. This is a similar idea to making teachers photograph themselves to ensure school attendance in India (Duflo, Hanna, and Ryan 2012). An alternative is to get the community and students involved in monitoring and rating schools.
Box 4.1: Quality AssuranceMechanisms for Data Collection and Accountability

24 Key Indicators for Asia and the Pacific 201524
Targeted outcomes can be as simple as ensuring there is no misuse of educational funds to maintaining levels of enrollment, retention, or attendance. In the most complex case, it is setting concrete targets for skill outcomes based on value added measures of teacher or school contributions to student skills. Across economies, a unit increase in school management practices was associated with a 0.23–0.42 SD increase in achievement—a magnitude far larger than investments in reducing class size or increasing school competition. In India, HRM scores, however, fell almost entirely outside of the distribution of school HRM scores in the US, with only 1.6% of schools scoring above the halfway point of the maximum possible score (Bloom et al. 2015).14
14 Bloom and Van Reenen (2007) have pioneered an objective double-blind management practice survey that has been applied to education, as well as to public and private institutions. These indicators use open-ended questions covering 20 areas under broad areas of operations (adoption of best practices), monitoring (performance review, tracking, and dialogue), target setting (tracking meaningful outcomes such as skills and ensuring school and individual incentives are aligned with these target outcomes), and people talent management (which promotes, rewards, and dismisses teachers based on their performance, as well as promoting morale).
Holding administrators accountable to management of educational funds or teacher attendance is an issue possibly faced by many developing economies and is a simple form of HRM (Pritchett and Murgai 2007). Dealing with these two aspects can result in significant improvements in student outcomes. In Brazil, areas with minimal leakages had test scores that were 0.35 SD higher than areas with larger leakages (Ferraz, Finan, and Moreira 2012). In India, an experiment that monitored teacher attendance through cameras and paid salaries as a function of teacher attendance cut teacher absences by 21% and increased learning outcomes by 0.17 SD (Duflo, Hanna, and Ryan 2012).
The absence of accountability practices is one explanation for why evidence often finds no effect of teacher capacity building, textbooks, and additional resources on student outcomes in developing countries (Glewwe et al. 2013; Murnane and Ganimian 2014). It is also why there have been observed improvements in learning outcomes even when lower-cost, lower-skilled teachers have been used, but have been correctly incentivized and made accountable (e.g. Muralidharan and Sundararaman 2011a; Muralidharan and Sundararaman 2013).
Collectingquality data
Publicly sharing informationwith families and students
to improve private skillinvestment decisions
Administratormonitoring
(HRM)
Accountability(Schools orteachers)
Schoolautonomy
BETTER SKILLOUTCOMES
Figure 4.2: Quality Data is the Basis for Accountability
Source: ADB.

25A Smarter Future: Skills, Education, and Growth in AsiaSpecial Chapter
25
Providing incentives based on student skill outcomes
Yet HRM practices should go beyond monitoring of skill development inputs and instead provide rewards (or sanctions) to school managers or teachers based on learning outcomes. This requires careful construction of targeted outcomes to ensure that schools and teachers continue to face the right incentives over time, to optimize learning outcomes, and to make sure that all students have equal opportunity to receive a quality education.
Teacher accountability programs that reward teachers based on student performance can be low-cost and have widespread acceptance. In India, bonus payments amounted to only 3% of a teacher’s annual salary, but increased test scores by 0.27 and 0.17 SD in math and language tests, and generated significant spillovers to science test results (Muralidharan and Sundararaman 2011a). Over 80% of teachers favored the bonus payment system that rewarded teachers based on student test performance in math and language tests, and viewed the bonus payment system even more positively once exposed to the program (Muralidharan and Sundararaman 2011b). These programs can have long-term and lasting skill development outcomes. In Israel, teacher accountability systems that paid teachers based on student achievement saw students matriculate into higher levels of education and improve their job earnings. It also helped reduce public spending on unemployment benefits (Lavy 2015).
Sharing information on school and teacher performance
Improves private educational investments
Providing information to parents on school or teacher performance can align incentives for schools and teachers to improve performance
and skill development outcomes without explicit accountability mechanisms imposed by formal institutions (Hastings and Weinstein 2008; Kane and Staiger 2002; World Bank 2004; Dranove and Jin 2010). Publicly providing information enables individuals to keep public services accountable and make more informed choices. To implement policies that share administrative information on a wide and detailed level requires legislation that ensures consumer protection and helps entities collect and share information without fear of repercussion.
Better information is useful, especially in developing economies where schools and teachers often provide after-school tutoring to students to supplement their income or where penetration of private education providers is high (Jayachandran 2014). The introduction of school accountability laws in the US, which mandated testing of students and public reporting of school report cards, has been important in improving skill outcomes (Rockoff and Turner 2010; Jackson 2010). Introducing these policies could be particularly effective in economies where quality is relatively unknown and there is sufficient penetration of private schools and school choice, creating competition to improve quality. Public information provision on measures that relate to quality outcomes could be effective for tertiary TVET in developing Asian economies where there are large shares of private providers that are competing for student enrollments, but where information on provider quality remains limited (Figure 4.3).
In Pakistan, a randomized experiment that provided information on school performance to families in markets with public and private education raised student achievement by 0.11 SD, while reducing private school tuition costs by 17%. Private school tuition likely declined because better schools were forced to spend more with little real return to learning outcomes, simply to differentiate themselves enough from competing schools (Andrabi, Das, and Khwaja 2014).

26 Key Indicators for Asia and the Pacific 201526
The information that is provided must be clear, relevant, and have value added over what is already known. In the US, the publication of teacher ratings were found to result in higher quality students entering classrooms for teachers with better ratings, but also generated improvements in performance due to reputation concerns (Bergman and Hill 2015). If information has no value added it will have little impact on altering behavior or even distort choices from the optimum. In Chile, school rankings that used a mixture of enrollment, tuition levels, and socioeconomic composition could have been too difficult for families to discern, resulting in little change in enrollment or student performance (Mizala, Romaguera, and Urquiola 2007; Mizala and Urquiola 2013). Creating the right format and information to hold schools accountable, however, can be difficult. In India, a participatory community program to monitor school performance and allocate resources had no effect on student achievement or community involvement in schools (Banerjee et al. 2010).
Representative surveys of students, alumni, or firms provide an alternative way to gather information on educational providers without having to devise and enforce rules and regulations
that ensure compliance. Surveys that ask firms to perform rankings of education institutions and programs they think are better at producing candidates that perform well and are considered for different occupations could provide valuable public information. Identifying ways to synthesize educational consumer ratings that optimally align incentives of educational providers with enhanced outcomes remains an important area for further development.
Educational vouchers
Complements public sharing of information and imposes greater accountability when there is school competition
Vouchers are certificates given to students or parents to pay for tuition, allowing for greater school choice. They are a solution that generates demand-side incentives for private educational providers to improve educational provision along price-quality dimensions when individuals and families have enough information on provider quality and there is competition among schools (Hanushek and Rivkin 2003; Andrabi, Das, and Khwaja 2014).
Notes: Shown for latest year available—2013 for Pakistan and Sri Lanka; 2012 for Cambodia and the Philippines; 2011 for Bangladesh, Fiji, and Viet Nam; 2009 for Indonesia and Thailand; 2008 for Malaysia; and 2005for India. Numbers are for tertiary TVET only.
Sources: ADB (2014), SEAMEO (2015), UNESCO (2011), PATVET (2012), World Bank (2005), UNEVOC (2008, 2009, 2012), NAVTTC (2012/2013).
Figure 4.3: Private Provider Penetration in TVET (%)
0 20 40 60 80 100
Percent
Bangladesh
Cambodia
Fiji
India
Indonesia
Malaysia
Pakistan
Philippines
Sri Lanka
Thailand
Viet Nam

27A Smarter Future: Skills, Education, and Growth in AsiaSpecial Chapter
27
In India, a program that provided primary school students with vouchers through a lottery system had no differential effect on math or native language test scores between lottery winners and losers at either 2 or 4 years after program implementation. However, students who won the lottery and received a voucher attended private schools that exposed them to longer days, longer school years, and smaller class sizes, allowing them to be introduced to a more diverse set of subjects and classes that were better tailored to their level of skill. This resulted in lottery winners having scores 0.23 SD higher in English, Hindi, science, and social studies subjects. Voucher provision was also cost efficient, with private schools costing one-third as much as public schools, as they used teachers who had no formal training and therefore received lower pay (Muralidharan and Sundararaman 2015).
Vouchers in theory could play a large role in improving the development of relevant technical skills and labor market outcomes. In Kenya, TVET vouchers provided through a lottery to unemployed youth were found to improve educational attainment, but had no effect on earnings unless the voucher recipient was able to enter a wage job. However, private institutions that received more voucher recipients tended to expand course offerings in response to increased demand for certain types of training (Hicks et al. 2013). However, as evidence remains limited, further evaluations should be undertaken before making wide-scale investments in voucher provision.
School autonomy
Recommended only if there is enough accountability
Greater autonomy—decentralizing decision making to schools—can improve student outcomes if schools are accountable. The premise is that schools are closer to operational realities and therefore have better information about how to effectively
manage financial and human resources to improve student skill outcomes. School autonomy requires recruitment of school management that understands the value of quality management and has scope to remove teachers that are underperforming and hires better and more motivated teachers. Having school management that is accountable and incentivized is essential to generating better student skills (Bloom et al. 2015).
This does not mean that decentralizing decision making to improve autonomy will be effective everywhere. Cross-country evidence finds that these gains only materialize in economies with strong institutions. In contrast, more centralized policy and decision making is typically better under weaker institutions (Hanushek, Link, and Woessmann 2013). Our analysis largely confirms this point, as in economies with good governance and accountability, autonomy is significantly important in raising student test scores. In contrast, in developing Asian economies where governance is lower, accountability (through publicly sharing of information) is of primary importance, with autonomy having no significant effect on test score outcomes (Figure 4.4).
Improving information for school managers when there is sufficient autonomy and accountability can help generate gains in skills. For example, a study
Note: Solid columns significant at 10%. See Appendix 4 for detailed methodology.
Source: ADB estimates using PISA 2012 student data.
Figure 4.4: E�ects of School Accountabilityand Autonomy on Math Test Scores
0
5
10
15
20
25
OECD Developing Asia
Chan
ge in
Mat
h Te
st S
core
Autonomy Accountability Accountability and Autonomy

28 Key Indicators for Asia and the Pacific 201528
in the US that gave school managers indicators of teacher performance based on class achievement on math and English tests found that it increased the probability of job separation for teachers with lower performance estimates, and led to small improvements in student achievement in subsequent years (Rockoff et al. 2012).
4.3 Data for evidence-based policy decisions and accountability
Data should be relevant, credible, accurate, and timely
Data are fundamental to making informed policy decisions that are effective and financially responsible. The level and detail of the data should be aligned with skill and learning outcomes. Ideally, the data should be able to inform how to allocate financing to different levels of education, different demographic groups, and specific skill areas that match labor market demands. They should enable evaluation of the effect of various educational inputs on critical educational outcomes. A detailed listing of key data to collect is in Appendix 3, and includes:
• Educational inputs (e.g. infrastructure, materials, curriculum content, teacher certifications and experience);
• Enrollment rates for different grades and in specific types of technical training by socioeconomic status;
• Skill measures (cognitive, noncognitive, technical) based on nationally or internationally standardized tests;
• Labor market outcomes (over time) in specific occupations by different types of education and technical training; and
• Skill and occupational demands by firms.
Imposing a national data collection system is more cost-efficient given the large fixed costs of buying and servicing hardware and in identifying relevant indicators. A centralized system also helps
minimize duplication, facilitate aggregation, and can limit data distortions.
Nationally, regionally, and locally representative data are important to formulate policy decisions that determine investments in different types of education and skills training. Detailed industry-occupation data needs to be collected over time, while measures of skills are important to monitor what students are learning. Still, there is room for developing tests that can better measure critical cognitive, noncognitive, and technical skills and limit the number of teachers who focus on teaching to the test.
Although creating quality skill assessments from scratch is costly, developing economies can adapt from existing tests for core subjects. Psychometric testing or item response theory, which scores questions by degree of difficulty and can be executed through computer adaptive testing, requires fewer questions to gauge absolute cognitive learning and therefore serves as an approach that reduces some of the costs to test design.
Many developing Asian economies have substantial room to improve data collection practices for skill investment policy decision making. Many still do not collect sufficiently detailed data on schools and school performance, nor do they collect labor market information for making decisions on the types of technical skills to invest. Engaging in standardized international assessments (e.g. PISA, TIMSS and PIAAC—Box 4.2), which measure critical skills, also remains an important area for many Asian economies to gauge absolute skill development and assess their human capital competitiveness.
Data for accountability require a greater level of detail
Data for accountability should be more detailed than data used in broad national evidence-based, policy decision making. The process entails collecting detailed measures of teacher and school performance based on student skill measures (Appendix 3). The

29A Smarter Future: Skills, Education, and Growth in AsiaSpecial Chapter
29
right measures for accountability, however, must be carefully designed to measure inputs and adjust for differences in difficulty in achieving certain skill outcomes based on the student population, quality of infrastructure, and materials available. Without this
Skill measurement is a growing business. Governments and firms are increasingly realizing that broad measures of educational attainment are insu�cient for analyzing an individual’s skills, capabilities, and capacity to learn. Globalization has driven the need to measure skills internationally, to better understand workforce competitiveness.
Cognitive
PISA and TIMSS are two types of internationally standardized tests that can be used to measure reading, mathematics, and science (see Box 2.3).
Noncognitive
Tests are increasingly measuring noncognitive skills, given recognition of their importance to enhance skill development and labor market outcomes. PISA 2012 and World Bank STEP in 2012–2013 are two of the tests that have collected measures of noncognitive skills, capturing openness to learning, conscientiousness, self-esteem, and work ethic. STEP uses measures based on self-reported assessments of the “big five” personality traits (openness, conscientiousness, extraversion, agreeableness, and neuroticism) that are believed to be essential to adapting and working in teams (World Bank 2014). Proxies for
noncognitive skills are reflected through standardized assessments of teachers on student behavior, absences, suspensions, grades, and grade progression (Jackson 2013).
However, many achievement tests still do not adequately measure noncognitive characteristics such as grit, conscientiousness, self-control, trust, attentiveness, self-esteem, and self-e�cacy, resilience to adversity, openness to experience, empathy, humility and tolerance, and ability to engage with society. These traits are often valued in the labor market and by society at large and therefore further investments should be made to measure these skills (Almlund et al. 2011).
Technical and workplace
Technical skills should be measured to capture current industry knowledge. Tests should capture individuals’ ability to apply their knowledge in practical workplace situations for their occupation. The Program for the International Assessment of Adult Competencies (PIAAC) 2012–2016 survey measures an individual’s ability to collaborate, plan, communicate, and negotiate—essential skills to navigate the workplace. These tests are still evolving, and greater e�ort is needed to measure critical technical skills, in addition to the more generalizable workplace skills.
Box 4.2: Measuring Di�erent Types of Skills
Quality metrics for accountability should be designed to ensure they do not distort school or teacher incentives (Dranove and Jin 2010). The ideal metrics should represent the value added contribution of the school or teacher and capture the key skills (Chetty, Friedman, and Rocko� 2014). If metrics are narrowly defined, teachers and schools could focus too much on improving performance in measurable aspects to the detriment of other skill development.
Metrics need to account for challenges driven by locational conditions and disadvantaged students, and should be based on recent historical trends rather than a single point in time. Measures that use simple average levels of student outcomes on achievement tests create incentives for schools and teachers to “cherry pick” better and more innately intelligent students, which can magnify inequalities in educational provision (Kane and Staiger 2002). In the US, accountability was shown to have perverse e�ects by creating greater segregation and inequalities between di�erent demographic groups even while it improved overall student achievement (Hanushek and Raymond 2005).
Deriving useful metrics from test scores is rendered problematic by many aspects. Fluctuations can occur between years that have little to do with actual school or teacher value added. For example, small schools may disproportionately end up at the top or bottom of the distribution, while proficiency-based schemes (that set targets for schools independent of the level and achievement of students) could encourage schools to focus on marginal students at the expense of higher-performing students. Even value added metrics that adjust for heterogeneity in student populations, but provide rewards based on performance changes, can cause distortions in incentives over time. If current performance makes it harder to improve performance in subsequent years, teachers and schools could become less responsive to incentives (Macartney 2014). Quality accountability metrics therefore should create long-term incentives for schools to provide quality instruction that enhances learning outcomes independent of the student population.
Box 4.3: Designing E�ective Accountability Metrics
information it will be impossible to construct the appropriate measure that aligns teacher and school incentives with enhanced skill outcomes, and may instead result in distortions to teacher and school incentives (Box 4.3).

30 Key Indicators for Asia and the Pacific 201530
Section 5. Financial EfficiencyPublic finances are limited. Given many skill needs, financial efficiency that delivers better educational quality per dollar of investment is one of the keys to enhancing the relevancy and level of skills.
Absolute spending by developing Asian economies per student (at different levels of education) is well below that of OECD and other high-income economies. While some developing Asian economies ideally will spend more as a share of GDP to enhance skill development, financing will likely remain a major constraint (Figure 5.1). Thus, economies need to make choices about how to allocate financing and weigh issues of equity versus efficiency of skill investments, as expecting public financing to expand to meet all skill needs is unrealistic. The overarching premise is that policy-based evidence and accountability are essential for economies to achieve financial efficiency.
Financial efficiency relies on collecting the right data to inform how to target finances that complement private investments, identifying how to balance direct educational provision among different ages and different sets of groups, and the right mixture of education that will better meet labor market demands, in addition to undertaking programs that could lead to cost reductions while maintaining quality of educational provision.
5.1 Targeting public investments
Optimal public financing should not crowd out private investments. Policy makers should support investments that lead to high societal returns and do not substitute for private investments. Society benefits when individuals improve their skills and human capital. For example, improved human
Lao PDR = Lao People’s Democratic Republic; PRC = People’s Republic of China.Note: Shown for latest year available—2012 for Pakistan and the PRC; 2011 for Azerbaijan, Bhutan, top 3 DMEs (Singapore;
Taipei,China; the Republic of Korea), high-income OECD, India, Kyrgyz Republic, and Sri Lanka; 2010 for the Lao PDR, Malaysia, and Mongolia; 2009 for Bangladesh and Kazakhstan; 2008 for Georgia, the Philippines, and Thailand.
Sources: ADB estimates using data from China Statistical Yearbook 2013 and 2014; Directorate-General of Budget, Accounting and Statistics (DGBAS). http://eng.stat.gov.tw (accessed March 2015); World Bank EdStats; and World Development Indicators Online.
Figure 5.1: Public Spending on Education
-
500
1,000
1,500
2,000
2,500
3,000
3,500
4,000
4,500
-
1
2
3
4
5
6
7
8
9
cons
tant
201
1 $
PPP
Perc
ent
% of GDP Per student (constant $ PPP)
High-income OECD (5.2%)
Top 3 DMEs (4.5%)
Sri Lanka
Pakistan
Bangladesh
Azerbaijan
Philippines
Lao PDR
Georgia
Kazakhstan
ThailandIndia
PRCBhutan
Malaysia
Mongolia
Kyrgyz Republic

31A Smarter Future: Skills, Education, and Growth in AsiaSpecial Chapter
31
capital reduces the probability of crime, time in unemployment, and can generate knowledge spillovers that improve aggregate labor productivity and innovation. However, individuals, families, and firms derive significant private benefits from additional skills as well (Moretti 2004; Lochner 2011).
Individuals derive benefits from better skills as it gives them the ability to market their skills to get higher wages, nonfinancial satisfaction, greater resiliency to economic shocks and, even improve prospects on the marriage market (Heckman, Stixrud, and Urzua 2006). Firms derive benefits from better skills as a greater number of skilled workers raises labor productivity, which in turn can lead to greater profits (Acemoglu and Pischke 1998).
The value of skill development becomes increasingly linked to private returns as individuals become older and more capable workers. This is why
estimates of social returns tend to decline relative to the private returns for higher levels of education (Psacharopoulos and Patrinos 2004). Thus, public investments should be less focused on dedicating resources to direct financing of individuals to access education, especially beyond secondary education, with two exceptions: to improve supply in technical skill sectors where skill shortages could hinder economic growth, and to help disadvantaged individuals who have no marketable skills because a minimum standard of living is viewed as a basic human right and is critical to achieving a more equitable distribution of income.
Ideally, public financing that encourages greater investments in the number of years of education is based on evidence of how extra investments affect the quantity of skills developed and subsequent social returns to those investments. However, this is no easy task as the data demands to evaluate the returns to educational investments are hard to come by (Box 5.1).
Public investments that focus on classroom and building infrastructure, and on improving educational institutions and teacher skills are important investments that are more likely to complement private investments. It is estimated that in the US, government educational investments unrelated to school infrastructure and teacher quality can crowd out 20–30% of private parental investments (Abbott et al. 2013).15 Public investments that are more complementary rather than substitutable to private individual and firm investments are listed in Table 5.1.
Earlier education
Efficient public financing that directly finances an individual’s education should be targeted at earlier skill investments. Developing skills earlier has significant complementarities with life-long learning, subsequent wages, and other positive outcomes,
15 One way to ensure that financing is more complementary is through the provision of unanticipated grants. In India, unanticipated (rather than anticipated) grants to elementary schools that reduced crowding-out of private spending saw students having 0.07 SD higher test scores in mathematics at the end of the first year. However these gains were only temporary and largely eliminated by the end of the second year (Das et al. 2013).
Table 5.1: Public Investments that are More Complementary, or More Substitutable, to Private InvestmentsMore Complementary More Substitutable
•
• •
• •
• • • •
•
Source: ADB summary synthesis of the literature.

32 Key Indicators for Asia and the Pacific 201532
pointing to efficiency in earlier investments (Caucutt and Lochner 2012; Box 5.2). This is one area where there is more consistent evidence across economies.
Earlier education is of considerable importance for Asia. Starting education by age 4 versus age 7 or older results in test scores 0.41–0.49 SD higher, even after controlling for differences in socioeconomic status and background. This is significant given that most educational interventions often have effects that shift test scores by less than 0.2 SD. Moreover there is a clear nonlinear decline from starting at age 6 as opposed to age 4 (Figure 5.2).
Disadvantaged groups
Financing targeted at disadvantaged groups—especially for earlier childhood programs—is efficient because those from poorer backgrounds tend to have parents who do not have the aptitude, mental tools, or time to prepare their child for entry into school. Nevertheless, as targeted funding for the disadvantaged and financial aid does not come out strongly in the cross-country analysis, this points to the difficulty of adequately implementing and targeting programs nationally. Studies of early childhood education in developed economies
Apart from the private benefits to the individual, additional education confers positive externalities on society. Policy makers need to know this split before deciding on priorities.
Further education provides individual nonpecuniary benefits that reverberate throughout life. In the labor market, more educated workers generally su�er shorter unemployment durations and higher job satisfaction. Outside this, they make better decisions about health, marriage, and parenting.
Social benefits are manifold. First, low-skilled workers enjoy productivity spillovers from working with highly skilled colleagues, leading to higher wages. Second, higher parental education, especially that of the mother, are associated with better health outcomes for infants, suggesting intergenerational transmission of human capital. Finally, education reduces the likelihood of criminal activity and incarceration, which impose substantial costs on society (e.g., Lochner and Moretti 2004; Heckman, Stixrud, and Urzua 2006).
Information is crucial
Research that evaluates social and private returns to education is an important missing piece in the development debate in many countries. First-best analysis should rely on detailed panel data and initial skill measures of individuals over time—data that are currently beyond the scope of most developing Asian countries. The second best is for returns to be calculated using accounting methods typically requiring private and public costs of education, unemployment, tax returns, and welfare expenditures. When actual returns are far from perceived benefits, private individuals and the public sector underinvest or make investments that are wasteful.
Calculating returns
Accounting methods can be used to estimate social versus private individual returns, and require at a minimum estimates on public financing for education, private tuition costs, wages, labor market
returns, tax contributions, and unemployment-linked costs to society (OECD 2013). These estimates reflect the fact that private returns exceed social returns and that the gap between private and social returns widens with the level of education. In Asia, social returns at primary and higher education were estimated at 16% and 11% respectively, and private returns at 20% and 18%, over the 1980s and 1990s (Psacharopoulos and Patrinos 2004). Nevertheless, the social returns are likely to be underestimated as they do not take into account externalities and spillovers derived from having a higher mass of skills in the economy.
The best approach to causally measuring social returns to education is by exploiting variations arising from policy experiments, such as compulsory schooling laws or wide-scale school-building programs. Randomized studies also provide a way to obtain causal estimates of the benefits of education and training and to ascertain whether public financing costs outweigh the benefits. Using local labor market conditions at the time the educational investments are made helps both to determine their true returns based on set demographic characteristics and to design public educational expansion and targeting policies (Carneiro, Heckman, and Vytlacil 2011).
Estimated private individual returns vary across labor markets, with estimated returns generally larger in developing than industrialized countries. Most studies that estimate the private individual returns to 1 year of schooling put them at 6%–13% (e.g. Duflo 2001). Macro estimates of years of schooling on long-term growth are far higher, at 27%–37% (Hanushek and Woessmann 2008), though these estimates assume that educational expansion is consistent, independent of the level of education.
Still, there is a need to better map earning profiles over longer periods to analyze employment and career trajectories over time. Optimal decision making requires access to reliable evidence—without it, people are far more likely to make poor choices and investments.
Box 5.1: How Much is More Education Worth?

33A Smarter Future: Skills, Education, and Growth in AsiaSpecial Chapter
33
Certain stages in an individual’s lifecycle are easier for developing critical cognitive and noncognitive skills, and should be considered to help ensure e�cient financing of skills. While most rigorous studies are US based, studies in Asia generally support the applicability of these findings to the region.
Scientific and economic studies on the formation of skills have found that:
• Cognitive and noncognitive skills are easiest to develop at early ages with the ability to develop them declining with age. However, noncognitive skills remain easier to develop at later ages than cognitive skills (Kautz et al. 2014; Cunha, Heckman, and Schennach 2010). Per-dollar investments early are therefore estimated to have a much greater impact on human capital skill formation than later spending (Box Figure 5.2.1).
• Skill development is dynamic. Later skill investments complement and build on earlier skill investments (Cunha and Heckman 2007).
• Continued skill investments ensure that skills do not erode and that early investments result in long-term (not just short-term) development of skills (e.g. Rothstein 2010; Andrabi et al. 2011).
• Cognitive and noncognitive skills ensure more e�cient formation of labor market–relevant technical skills (Cunha and Heckman 2007).
• Cognitive skill formation can enhance the formation of noncognitive skills and vice versa. Whether one or the other type is more important changes over time and by context: in the US, noncognitive skills were found to be important in the formation of cognitive skills (Cunha and Heckman 2008; 2009); in India, cognitive skills tended to influence the formation of noncognitive skills in adolescents (Helmers and Patnam 2011).
Box 5.2: Skill Formation over the Lifecycle
Source: Based on Heckman (2008).
Box Figure 5.2.1: Returns to a Dollar Invested
Programs targeted toward the earliest years
Preschool programs
Schooling
Job training
0–3 4–5 School Post-school
Rate
of R
etur
n to
Inve
stm
ent i
n H
uman
Cap
ital
find that those who benefit the most from early childhood education are children from low-income backgrounds and immigrant populations. Early childhood education programs are found to improve cognitive skills, educational attainment, and long-term adult outcomes (e.g. Germany: Cornelissen et al. 2012; US: Heckman 2006). Early interventions for the disadvantaged can mitigate the effects of adverse environments and have high rates of social and economic returns (Heckman 2006; Heckman and Masterov 2007).
The efficiency–equity trade-off becomes more complex as individuals become adults. From an efficiency perspective, public financing for older ages should target the most disadvantaged and promising students to help ensure they have access to higher education. From an equity perspective, implementing financing for nonformal training or remedial education could be important in helping unemployed individuals develop marketable skills to achieve a minimum standard of living. But these nonformal training programs can be difficult to implement, resulting in large variations in effectiveness (Box 5.3).

34 Key Indicators for Asia and the Pacific 201534
Technical education
Financial efficiency entails identifying under what conditions public investments in TVET yield sufficient social returns that justify the costs and determine how costs should be shared among the
public and private sectors. TVET spans multiple levels and takes different forms: secondary TVET, polytechnics, short-term placement-linked training, upskilling for current workers, etc. The fragmentation of the sector has complicated broad assessments, particularly across countries.
Nonformal employment and training programs are targeted at poor and vulnerable workers as safety nets to teach marketable skills and decrease inequities in access to skill development. These programs range from bridging the gap between education and employment for out-of-work youth to teaching skills in underserved rural areas. These programs are socially e�cient if they can generate a more sustained source of income and productivity growth over the long term, but implementation of these programs have not been consistently successful.
Cost-e�ective training investments should consider the optimal length of training (to avoid courses that are unnecessarily long). The evidence suggests that training programs should be weeks rather than months. In Germany, unemployed short-term trainees had just as fast transitions to stable jobs as long-term trainees, from the start of training (Osikominu 2013). In the Republic of Korea, training dropouts had better employment outcomes than similar youth with no training 1 year after dropping out, but only if they had completed at least 12–15 weeks of training. The benefits to training declined after 2 years, however (Flores-Lagunes, Choe, and Lee 2015).
Quality, relevancy, and targeting of training matter. Evaluations suggest that quality training programs, if correctly targeted at the poor, can increase earnings and improve employment outcomes (Attanasio, Kugler, and Meghir 2011; Blattman, Fiala, and Martinez 2014). In India, a subsidized training program for women increased
participant employment, work hours, and earnings, and was highly cost-e�ective (Maitra and Mani 2014). In Peru, quality publicly sponsored training programs had far better outcomes than low-quality ones, producing trainees with far higher earnings and better-quality jobs. Nevertheless, the most important training attribute was expenditure per trainee: teacher experience, class size and infrastructure, and market knowledge had little or no impact (Galdo and Chong 2012).
The value of training to raise incomes hinges on providing technical training that can be sustained by labor market demands. In Bhutan, a skills training program for construction-related activities found that trainee households in rural villages saw their income rise only when there were fewer trainees relative to the village population ensuring that not too many were trained in the same skills at the same time (Chun and Watanabe 2012). In Turkey, a large, randomized evaluation of a vocational education program for unemployed youth found no significant e�ect on quality employment outcomes 1 year after the training (Hirshleifer et al. 2015)—results largely consistent with similar studies in other developing economies (e.g. Card et al. 2011; Cho et al. 2013).
For each success, however, there are just as many failures, underscoring the challenges of running informal training programs. Governments considering investments in this area should undertake evaluations of pilot schemes before scaling up.
Box 5.3: Nonformal Training Programs—Dicult to Consistently Implement to Generate Benefits
Note: Solid columns significant at 10%. See Appendix 4 for detailed methodology.Source: ADB estimates using PISA 2012 student data.
Figure 5.2: Benefits to Starting School a Year Earlier on Test Scores(Base = Age 7)
16.8 16.912.5 8.7 8.9 7.8
11.4 12.311.9 17.3 18.4
16.2
12.9 14.6
12.915.0
17.4
13.5
05
101520253035404550
Reading Math Science Reading Math Science
OECD Developing Asia
Chan
ge in
Tes
t Sco
re
Age 6 Age 5 Age <= 4
Age 6
Age 5
Age <= 4

35A Smarter Future: Skills, Education, and Growth in AsiaSpecial Chapter
35
Economies that have greater shares of secondary students enrolled in TVET are no more likely to have higher growth even after controlling for GDP per capita and years of schooling (Figure 5.3). Of course, quality of TVET systems varies greatly from one country to another and simply emphasizing basic technical skills in secondary education is not sufficient for countries to achieve greater growth. Evaluations are needed to determine the preconditions that ensure technical and vocational training can consistently contribute to greater economic development. Prime examples exist in the region that suggest TVET can work effectively. Countries such as the Republic of Korea and Singapore that achieved rapid growth over recent decades succeeded in part by aligning TVET reforms with their economic development strategies (Cheon 2014; Ra and Shim 2009).
Developing Asian economies are increasingly shifting attention and financing toward TVET in the hope that it will enhance labor market outcomes and ultimately economic development.16 Indonesia and the PRC are just a few of the economies that
16 Our documentation reveals that almost all of the Asian economies have TVET at the secondary level (one exception is Sri Lanka) and many economies have some type of apprenticeship or dual-apprenticeship system in place. This includes the PRC, Fiji, India, Indonesia, Malaysia, Pakistan, the Philippines, Sri Lanka, and Thailand.
have increased their share of students enrolled in vocational high school in the last decade alone (UNESCO-UIS).17 The premise for these investments is that missing technical skills are a crucial barrier to youth entering the labor market. While employer surveys often cite technical and noncognitive skills as the primary culprit of skill shortages (e.g. Manpower Group 2015; Bruni, Luch, and Kuoch 2013), there is a need to analyze skill supply through detailed assessments and tracer studies to have more complete evidence as to whether existing technical skill investments are meeting labor market demands. To date, the best rigorous evidence on effective TVET in Asia primarily covers secondary TVET and some very specific cases of informal training (Table 5.2).
The share enrolled in secondary TVET in some Asian economies is sizable with enrollment accounting for more than 10% of the secondary enrollment population (Figure 5.4). However, the costs of public secondary TVET provision are estimated to be 20–40% more than general secondary education due to differences in the types of training offered (OECD 2013; Newhouse and
17 In Indonesia, the government has targeted that 70% of students would be in vocational (versus general) high schools (up from 30%) by 2015 (Ministry of National Education 2006). In the PRC, the target is to maintain 50% enrollment in vocational versus general high schools, and there has been a doubling of enrollment in vocational high schools over the last decade, with more than 22 million students (about 45% of all high school enrollment) in TVET (NBS 2001; NBS 2012).
Table 5.2: There is Too Little Causal Evidence to Settle the Debate over TVET versus General Education in Asia
Type DefinitionQuasi-
Experimental Studies
Randomized Controlled
TrialsSchool-based Contains formal curriculum
and in theory should teach more generalizable skills. Can span secondary or tertiary.
2 0
Dual training German model. Combines school-based learning with on the job training.
0 0
Informal TVET More of an apprenticeship system. Does not include any general skills training and training may not always be significantly structured.
1 1
Source: ADB review of literature. Papers referenced were Newhouse and Suryadarma (2011); Moenjak and Worswick (2003); Chun and Watanabe (2012); Maitra and Mani (2014).
HKG = Hong Kong, China; IND = India; INO = Indonesia; JPN = Japan; KOR = Republic of Korea; MAL = Malaysia; SIN = Singapore; THA = Thailand.Note: See Appendix 1 for detailed methodology.Source: ADB estimates using data from Penn World Table Version 8.1,
Barro-Lee Dataset (2010), and World Bank EdStats.
Figure 5.3: Growth and Share of Secondary TVET Students(Conditional on initial GDP per capita and years of schooling)
Cond
ition
al G
row
th
Conditional Share of Secondary TVET Students
Coe�cient = .011, se = .013, t = .849
−25−20−15−10
−505
1015202530354045
−4 −2 0 2 4 6
HKG
INO
INDJPN
KOR
MAL SIN
THA

36 Key Indicators for Asia and the Pacific 201536
Suryadarma 2011). Many countries are currently seeking to improve the cost-effectiveness of TVET and are acknowledging that the public sector alone cannot respond to the increasing demand for TVET. It is thus important to understand what investments will create the right conditions that ensure the returns to TVET sufficiently outweigh the higher costs of provision.
Evidence on returns to secondary TVET is currently thin with results suggesting that more attention should be paid to the types of TVET investments that are effective in improving returns. In Thailand, TVET graduates during the early 1990s were found to have received returns to educational investments that were significantly higher than those in secondary general education (Moenjak and Worswick 2003). In Indonesia, male public secondary TVET students were found to be more likely to engage in the labor market than males who entered public secondary general education, and had no differences in wage returns even after controlling
for initial levels of skill achievement, parental socioeconomic status, and parental educational attainment. In contrast, male private secondary TVET graduates had equivalent rates of labor force participation to public general secondary graduates, but had far lower wage returns. Female public and private vocational secondary education graduates had similar rates of labor force participation, with public vocational secondary graduates even having 13% higher wages. The findings indicated that for Indonesia, females were more likely to have benefits that justified the additional 28% higher costs to secondary TVET education (Newhouse and Suryadarma 2011).
Further evidence from labor force survey data can add to this debate. The labor market outcomes of recent secondary TVET versus secondary general graduates in Indonesia and Thailand, two of the Asian economies with sufficiently large populations of secondary TVET students, reflect differential returns. In Indonesia, those who recently graduated
PRC = People’s Republic of China, Lao PDR = Lao People’s Democratic Republic.Note: Only data for the latest year available for each country is used.Sources: World Bank EdStats (2005–2013); UNESCO (2007).
Figure 5.4: Share of Secondary TVET Students
NepalIndia
Lao PDRFiji
TajikistanTonga
CambodiaPakistan
BangladeshViet NamSri Lanka
KazakhstanGeorgia
Papua New GuineaKyrgyz Republic
MalaysiaArmenia
Republic of KoreaMongolia
SingaporeJapan
ThailandAzerbaijanIndonesia
UzbekistanPRC
0 5 10 15 20 25Percent
Central West Asia East Asia South Asia Southeast Asia The Pacific

37A Smarter Future: Skills, Education, and Growth in AsiaSpecial Chapter
37
from TVET are more likely to be employed, and conditional on obtaining a job they are more likely to be in regular employment and have slightly higher average wages. In contrast, secondary TVET graduates in Thailand have far lower shares in regular employment than secondary general graduates, however, conditional on being employed secondary TVET graduates earn substantially higher wages (Figure 5.5).
The importance of different types of education, however, is not just about average earnings, but expected career employment and earnings over time. In OECD economies with more rapid technological change and an overemphasis on technical rather than general skills, employment of TVET graduates has
tended to decline over time (Hanushek, Woessmann, and Zhang 2011). The TVET system is taking stock of this and is currently shifting to the development of broader skill sets for a more adaptable workforce. Although this section mainly looks into secondary TVET, it is important to note that the sector expands over multiple levels and is not limited to new labor market entrants. It also includes upskilling of current workers as skills upgrading is part of a continuous process.
Analysis of multiple cross-sections of data finds that employment and wage outcomes of secondary TVET graduates versus secondary general graduates vary depending on the country. In Thailand, the market value of TVET education tends to decline with
Notes: TVET = Tertiary Vocational Education and Training; Male sample only. Indonesia: Secondary (TVET): 33%; Secondary (General): 67%;Tertiary (TVET): 0%; Thailand: Secondary (TVET): 44%; Secondary (General): 34%; Tertiary (TVET): 22%.
Source: ADB estimates using Indonesia SAKERNAS (2013) and Thailand Labor Force Survey (2010).
Wage outcomesEmployment outcomes
Figure 5.5: TVET and Secondary General Graduate Employment and Wage Outcomes Within 5 Years of Graduation0
.2.4
.6.8
Den
sity
2 4 6 8log (wage)
Secondary (TVET)Secondary (General)Tertiary (TVET)
Indonesia
0.5
11.
52
Den
sity
5 6 7 8log (wage)
Thailand
UnemployedTemporary employmentRegular employment
0.2
.4.6
.8Sh
are
Secondary (TVET) Secondary (General) Tertiary (TVET)
Thailand
0.2
.4.6
Shar
e
Secondary (TVET) Secondary (General)
Indonesia

38 Key Indicators for Asia and the Pacific 201538
experience, leading to gaps in wage returns between TVET and general secondary education graduates with greater labor market experience. In contrast, Indonesia’s secondary TVET graduates on average retain a comparative advantage versus secondary general graduates in employment outcomes with virtually no difference in wage outcomes over time (Figure 5.6). This evidence suggests that TVET can be effective in certain circumstances.
Reforming TVET institutions will take time, particularly when it comes to changing pedagogical practices and building stronger ties with employers. This could be a contributing factor to why TVET has not always had success in all situations. In the PRC,
item response theory tests were used to estimate gains to skills from attending upper secondary TVET, suggesting that it resulted in substantially reduced general skills while not improving any technical specific skills (Loyalka et al. 2014). A possible reason that secondary TVET did not have any success in improving skills was because it was underfunded. However, more funding alone will not guarantee better educational outcomes. A subsequent study showed that students who matriculated into model secondary TVET schools that had better financing (and presumably teachers, equipment, and alignment with industry standards) were no more likely to be employed or have higher wages than those who went to standard TVET schools (Li et al. 2015).
Notes: Predicted outcomes from pooled cross-sectional samples for each subgroup. Probit of permanent employment probability and regression of log wages are run on controls for years of experience, squared years of experience, 5-year cohort fixed e�ects, and region fixed e�ects. Reference group is the cohort born in 1970 and the largest region in the country.
Source: ADB estimates using Indonesia SAKERNAS (2003, 2008, and 2013) and Thailand Labor Force Survey (2000, 2005, and 2010).
Figure 5.6: Employment Probabilities and Wage Returns for TVET and Secondary General Graduates3
45
67
89
Log
(wag
e)
0 10 20 30 40
0 10 20 30 40
Experience
Secondary TVET Secondary General Tertiary
Indonesia (Males)Predicted Log (Wage)
34
56
78
9
Log
(wag
e)
Experience
Thailand (Males)Predicted Log (Wage)
Thailand (Males)Probability of Permanent Employment
0.2
.4.6
.81
Prob
abili
ty o
f Em
ploy
men
tPr
obab
ility
of E
mpl
oym
ent
0 10 20 30 40
0 10 20 30 40
Experience
Indonesia (Males)Probability of Permanent Employment
0.2
.4.6
.81
Experience

39A Smarter Future: Skills, Education, and Growth in AsiaSpecial Chapter
39
Many factors influence labor market outcomes of TVET students. TVET systems are often plagued by large numbers of low-quality providers that do little to develop real growth in measurable or relevant skills. Because TVET is often a second choice for students in developing Asia, TVET entrants frequently lack critical foundational skills, which prevent them from acquiring new technical skills. Training also tends to be very specialized, making TVET graduates vulnerable to sector-specific shifts in production processes (Mertaugh and Hanushek 2005). This is gradually changing as TVET systems are now focusing more on portable skills and paying greater attention to noncognitive skills, which are essential to success in the workplace. The profile of students in TVET is often very different from that of students in the general track (e.g. socioeconomic background, parental involvement, social and emotional skills). Although increasing, evidence on private returns to TVET remains limited and more research is needed to understand career paths of TVET graduates.
In general, apprenticeship programs can bridge the link with the labor market, generating higher returns and effectiveness. In countries with well-established apprenticeship systems like Australia, Germany, the United Kingdom and the United States, the returns to TVET are high (Steedman 1993; Acemoglu and Pischke 2000; ILO 2012b; Lerman 2014), but vary widely by qualification and mode of study (Ryan 2001). While many point to the German dual-training system, its success resides in its flexibility that allows students to move from technical or low-tiered tracks to higher-tiered tracks and its greater emphasis on more general adaptable skills. If developing Asian countries are to successfully adopt a dual-training system, broad-based interventions and attention to quality statistics will be required (Box 5.4).
Developing countries face large variations in quality of TVET provision, often reflecting weaker institutions and greater difficulty in monitoring and ensuring quality. This underlines the need to ensure
Germany, with its dual training system (DTS), is touted as a model for vocational schooling systems around the world (Eichhorst et al. 2012). The success of the DTS is embedded in the complementarity between classroom theory and in-firm training with a greater emphasis on more adaptable skills (Dustmann, Puhani, and Schonberg 2014). The system has been adopted in Asian countries such as India, Indonesia, Malaysia, the Philippines, and Viet Nam. But these countries have faced challenges in replicating its success (Majumdar 2011).
The DTS depends crucially on the commitment of stakeholders and the institutional environment. At the core of Germany’s longstanding support for TVET is the Vocational Training Act of 1969. It specifies rights and responsibilities of the federal government, local government, private sector, trade unions, and students. The high degree of formalization is enforced by the social partners, while the local chamber of commerce conducts the functions of promotion, administration, and oversight, working at local level closely with employers. This web of institutional checks and balances nationally and locally underpins the German model. Vocational Education and Training (VET) systems in developing Asian economies, however, su�er from weak institutions with many ministries, organizations, and agencies involved, making coordination di�cult. In Viet Nam, enterprises acknowledge that vocational training has failed to meet requirements for technically
skilled graduates or to attract businesses that are willing to train (Huy 2009). Moreover, labor unions in Asia tend to play a much smaller role and have less influence than their western counterparts (Kuruvilla et al. 2002).
Even with the right institutional framework in place, issues remain. First, ministries need to invest in guaranteeing teacher competency, maintaining curricular consistency, promoting high stakeholder participation, and providing career guidance to impose minimum standards for the quality of TVET provision. Second, students entering a dual system should possess basic literacy and numeracy skills expected of basic education graduates. Third, the dual system should address transition barriers to tertiary education, allowing for multiple pathways (e.g. apprenticeship graduates should be able to attend university). With a large share of 15-year-olds in developing Asian economies not having these basic skills and the questionable quality of education received by TVET students, TVET so far has not had much success in being a pathway to higher learning (Hummelsheim and Baur 2014).
For developing Asian economies looking to develop a skilled workforce, the key lies in balanced investments in education and training that strengthen foundational skills, improve the relevance of technical skills, and generate pathways to higher learning.
Box 5.4: The German Dual Training System—Not Easy to Replicate

40 Key Indicators for Asia and the Pacific 201540
commitment to legislation and institutions on quality TVET provision, and that skills taught are aligned with labor market demands. The lack of reliable and timely information on labor market demand impedes many TVET systems’ efforts to improve labor market relevance. TVET needs to respond to current labor market needs and anticipate future demand. It is therefore necessary to encourage private providers to participate in the sector. For example, India’s±National Skill Development Corporation±is±partnering with private providers to increase TVET provision in the country while aligning skill development with actual industry needs. Thus industry engagement, detailed data on industry demands, and monitoring skill and labor market outcomes of TVET students will remain critical to making decisions on how to allocate finances efficiently among different types of technical skill investments that result in better labor market outcomes.
5.2 Reducing costs of educational provision
Efficient public financing aims to lower the costs per level of quality provision. Three areas stand out: PPPs, contract teachers, and technology.
Public–private partnerships
PPPs can help catalyze scarce financing to deliver better student learning outcomes at a lower cost when the public sector can impose sufficient accountability (Chaudhury et al. 2006). By circumventing rigid, dated, and ineffective public institutional features, PPPs typically involve tasking the private sector with educational provision and public sector partners with funding education and monitoring progress. PPPs can also enhance the relevance of educational provision to develop technical skills more in line with labor market demands. These models are effective given that the private sector has greater knowledge and ability to act on market opportunities in educational provision.
While private schools have shown great promise in improving the quality and efficiency of educational provision, their ability to consistently fulfill a predominant role in providing basic education must be carefully examined within different contexts. In many cases, higher levels of private school achievement could be due to selection of students into schools rather than true benefits to privately provided education (Murnane and Ganimian 2014).
Public funds can be used to contract out the management of public schools to private entities in providing public education. This includes staff hiring, curriculum design, and building maintenance. It requires ability to allocate funding and construct legally binding contracts that guarantee financial payments to the private sector based on student attendance or performance. For these modalities to work financial payments must be set high enough that the private sector can reap profitable returns from these contracts. However, to date, there has been relatively little evidence that has explicitly demonstrated the causal effects of PPP provided education.
Still, accountability-based public subsidies to private entities may be useful in guaranteeing that contracting out management to private entities improves student achievement. This entails actual measurement of student test performance rather than enrollment. It requires government commitment to evaluation that imposes private sector accountability. Such mechanisms have been used for students to attend low-cost private schools in Pakistan with significant increases in student enrollment and school inputs (Barrera-Osorio and Raju 2014). These programs required private providers to provide students with free schooling and mandated that students in these schools achieved a minimum pass rate on a standardized exam administered twice a year. Attending a private school was estimated to have significant value added, improving student achievement by 0.25 SD for each additional year of schooling (Andrabi et al. 2011).

41A Smarter Future: Skills, Education, and Growth in AsiaSpecial Chapter
41
Development impact bonds are a more recent innovation that has been gaining traction in extending educational financing through private sector provision while imposing accountability. While PPPs have large potential to improve future educational investments, the capabilities to conduct monitoring and evaluation and undertake appropriate analysis are best for economies committed to improving their educational institutions (Box 5.5).
Contract teachers
Rapid school expansion in developing Asian economies has resulted in heavy overcrowding in many public schools. Hiring contract teachers is a practical short-term and low-cost solution to reduce class size and fill gaps in educational provision. The use of contract teachers could be a viable solution for TVET provision where there is a need to more frequently adjust technical skill areas to meet changing labor market demands.
While a major concern surrounding the use of contract teachers is that it could hurt the quality of provision, several studies have shown this need not be the case for basic education. In India, an experiment that randomly provided funds to schools to hire non-civil-service contract workers under fixed-term renewable contracts (rather than permanent contracts) found significant improvements in student math and language test scores at these schools (0.16 and 0.15 SD). This occurred even though contract teachers were not professionally trained and were hired at one-fifth of the typical civil service teacher wage (Muralidharan and Sundararaman 2013).
Similar results were found in Kenya, where students had test scores 0.22 SD higher in schools that received an extra contract teacher. However, only students who received the contract teachers experienced real gains to learning—students assigned to civil servant teachers had no gains in test scores despite reductions in class size, suggesting that
Development impact bonds (DIBs) are a “pay-for-success” financing mechanism to fund educational infrastructure and projects. They are valuable when the public sector is too risk adverse to allocate funding and scale up programs without demonstrated success. DIBs involve private investors that supply funds to educational providers to adopt educational interventions to meet targets set by project “impact funders” (typically the public sector). If these targets are achieved, the impact funders repay investors their principal plus a financial return.
DIBs incentivize private providers to enter where they see a viable business model that can meet the targets within the terms of the impact funders. In theory it can lead to greater program success and encourage educational providers to adopt more innovative and cost-e ective approaches to educational provision.
The Harvard Kennedy School Social Impact Bond Technical Assistance Lab (2013) outlines crucial steps in developing a successful DIB project. At design stage, it is necessary to determine whether DIBs are a realistic fit for an organization conditioning on internal enthusiasm from the impact funder and external interest from private investors. Once a suitable policy initiative is selected, the organization must undertake data analysis and financial modeling as well as engage would-be partners, including the educational service provider, the private investor, and the evaluator of project targets. A contract is drafted and signed before project implementation. Finally, once outcomes
are determined and payments are made, decisions on scaling and follow-up contracts are made. This financing mechanism relies on reliable and trustworthy contracting mechanisms, forward-looking impact funders that set quality and educational targets, and sophisticated monitoring and evaluation processes that adequately can ensure and determine the causal impacts of the investments.
In Asia, DIB-financed projects are used in India and Pakistan to fund expansion of low-cost private schools in rural areas, improve educational enrollment, and help reduce gender inequalities in education. The DIB in rural Pakistan was aimed at adding 5,000 school classes. Private entrepreneurs were recruited and tasked with establishing and operating primary schools in randomly selected rural areas for which children were eligible for free enrollment. These entrepreneurs were given a per-child subsidy with some schools receiving a higher subsidy for girls than boys. Recent evidence suggests that while this program did not succeed in inducing greater female enrollment, it did lead to large gains in overall enrollment (Barrera-Osorio et al. 2013).
DIBs’ success in enhancing educational outcomes at lower cost will hinge on funders’ ability to define and monitor outcomes while providing incentives to encourage private investment. With many institutions in developing Asia still not heavily vested in quality data collection or transparency, it still could be too early for such models to achieve widespread success.
Box 5.5: Development Impact Bonds for Education

42 Key Indicators for Asia and the Pacific 201542
contract teachers were more effective despite their lower pay (Duflo, Dupas, and Kremer 2015).
These examples show that contract teachers are not a solution in all contexts, but are good alternatives especially in countries faced with problems of overcrowding and low accountability among civil servant teachers.
PPPs and contract teachers are but two of the more typical mechanisms to improve financial efficiency. Yet technologies are bringing a new angle to enhancing educational outcomes, not only to collect vital information for accountability but to create new ideas for curriculum design and teaching, in addition to generating new sources of funding (Box 5.6).
Technology
Technology use can be highly important in lowering costs while maintaining quality of provision. When
technology has quality educational content, it can help keep students engaged and interested while broadening educational access, working to reduce the burden on teachers to improve skill outcomes (Murnane and Ganimian 2014). It can also lower the costs of educational provision by replacing teaching time with computerized content.
Technology can range from software-based courses to those with an internet connection and involve real-time interactions with teachers. Essentially it requires hardware (such as computers, tablets, or smartphones) and good enough content provided through software, apps, or online materials.
Technology in education is increasingly feasible given the penetration of computer and internet technology in schools (Figure 5.7). Technology (where students can simulate performing different technical tasks) could generate significant reductions in costs of TVET provision due to the large range of skills training, design of curriculum, equipment, and
With the increasing penetration of broadband and mobile networks throughout Asia, crowdsourcing—leveraging the global online community—has the potential to improve multiple aspects of education including cost e�ciency. This includes “sourcing the crowd” to fund new and innovative educational projects; generating information and ideas for enhanced curriculum design, teaching delivery, and homework; and developing ratings for teachers and schools.
In theory, synthesizing information from a large crowd can help cut through the “noise” to help get important projects funded, help identify important learning outcomes, and generate information for individuals and families to make more informed educational decisions. The main cost is setting up and maintaining the website platform.
Crowdsourcing is underused in Asia. While models for curriculum design (e.g. BetterLesson), teacher ratings (e.g. RateMyProfessors.com), and funding for educational projects (e.g. Adopt-A-Classroom) have gained traction across the US, most crowdsourcing in Asia has remained largely confined to areas outside education. However, this is slowly beginning to change. Bangla Braille is a website that uses the crowd to record books for the visually impaired in Bangladesh. Checkmyschool has been developed in the Philippines to monitor school services. Two major online education platforms—Khan Academy and Coursera—have been asking the
global community to add more localized subtitles to their course and videos to make them more widely accessible.
Successful crowdsourcing platforms are designed with an understanding of what motivates people to contribute (Agrawal, Catalini, and Goldfarb 2014). For project-funding platforms it is important to have a way to match potential funders with proposed projects, an accountability mechanism to instill greater trust between donor and recipient, and a threshold pledge systems that is time bound (Belleflamme, Omrani, and Peitz 2015). For example, donorschoose.org has an accountability mechanism where schools or teachers who have received funding for proposed projects provide progress and detailed cost reports in addition to photos. To obtain funding, the quality of proposed projects and personal networks are important (Mollick 2014; Zheng et al. 2014).
In contrast, crowdsourcing of information for curricula or reviews should generate utility for participants through recognition of their contributions and value from being part of a community that provides a public service (Lerner and Tirole 2005). This means including feedback mechanisms to contributors. Similarly, websites that source information and generate ratings or rankings must be carefully constructed to improve their validity and increase reputational incentives. With many viable platforms operating, it is now time for Asian economies to start tapping into the wisdom and funding provided by the crowd.
Box 5.6: Crowdsourcing for Funding, Information, and Ideas

43A Smarter Future: Skills, Education, and Growth in AsiaSpecial Chapter
43
material required relative to the needs of general education.
On-line and blended learning
A good fit for nonselective higher education and TVET
Downloaded materials from the web on a computer combined with real-time interaction through the web can have a strong comparative advantage over traditional classroom learning. This approach has the potential to enable quality education to be more equally distributed among the population and to cut out some of the large disparities in access often faced by lower socioeconomic groups. Nine key advantages are outlined in Box 5.7.
Online learning still accounts for a small share of the educational market. However, it has the most potential to compete and displace nonselective higher education and TVET institutions that tend
PRC = People’s Republic of China.Source: PISA 2012.
Figure 5.7: School Computer and Internet Penetration
0 20 40 60 80
Percent of schools
Malaysia
Viet Nam
Indonesia
Kazakhstan
Thailand
Republic of Korea
Taipei,China
Shanghai (PRC)
Hong Kong, China
Macau, China
Singapore
Japan
Computer Internet Software
The advantages of online learning are:
1. It can leverage the best teachers and creators of content, providing a way for more students to access better quality teaching.
2. Students can easily adapt the pace of learning to fit their needs, going as fast or slowly as needed to understand core concepts.
3. Because it is at one’s fingertips it reduces unnecessary time and money spent on commuting.
4. Students have the flexibility to consume lectures to fit their schedules rather than having to adapt their schedules to lecture times.
5. Productivity is enhanced as the costs of delivering a lecture or class for the revenue should be higher than in traditional models.
6. There are strong benefits to investing in quality as the market grows, in contrast to traditional models that have capacity constraints and so there is no quantity–quality trade-o�.
7. High-quality online learning can be more capable and cost-e�ective at engaging students than sub-par lecturers.
8. Because the systems are web-based they can easily collect information, experiment, and identify ways to improve learning outcomes to maximize skill development.
9. As online learning competes with certain forms of traditional learning as well as with other online learning providers, competition should cause costs to decline for traditional and online learning.
Source: Cowen and Tabarrok (2014).
Box 5.7: Nine Advantagesof Online Learning over Traditional Learning
to teach a more basic set of skills (e.g. Hoxby 2014). These institutions provide little value added in terms of learning experience or social networks as teachers and curriculum content are relatively standardized and students tend to commute rather than live on campus. Thus the learning environment and content can more easily be replicated in a virtual environment without being detrimental to student learning outcomes.
Blended learning
Blended learning substitutes a portion of traditional classroom instruction with online learning, helping lower the costs of delivery. Blended learning still remains nascent, but is believed to be an area that holds significant promise especially for TVET and higher education.

44 Key Indicators for Asia and the Pacific 201544
However, investments so far have not developed quality content enough to maximize the potential of online learning. Randomized evaluations comparing lower-cost blended learning to traditional classroom instruction have found mixed results (Zhao and Breslow 2013). For example, an introductory statistics class in the US that replaced 3 hours of classroom instruction with machine-guided learning and 1 hour of classroom instruction found that students had similar pass rates, final exam scores, and performance on a statistical literacy test (Bowen et al. 2014). An introductory microeconomics course examining blended versus traditional learning found that students in traditional classroom format had a 2 percentage point higher score on the combined midterm and final tests. Another evaluation of an
introductory economics course at a public university in the US found similar exam scores between blended and classroom learning, but those receiving only online learning had lower test scores than those receiving traditional classroom instruction (Joyce et al. 2014).
Moving some classroom time to online learning modules could lower classroom-instruction costs while maintaining similar standards for student learning. However, the model still needs to be tested in developing economies where quality of instruction, culture of interaction and discussion, and students’ access to the internet could be far different from that in the US.18
18 For information on how to implement blended learning in practice see Horn and Staker (2014).

45Special Chapter
45
Section 6. Educational DeliveryImproving educational delivery requires having the right curriculum content well matched to student capabilities that is focused on developing the relevant skills, and having skilled teachers who are incentivized to provide quality instruction so students learn (Figure 6.1).
6.1 Curriculum content
Curricula that are engaging, compatible with student skills, and use clear and up-to-date skill targets are more likely to develop the critical and relevant skills needed to meet labor market demands. Quality curriculum content needs to recognize the capabilities and limits of teachers, but also be appropriate to current levels of student capabilities. Because costs are fixed and there are benefits to having compatible and standardized quality across regions, base standards for curricula can achieve cost efficiencies at a national level.
Student-centered learning
Curricula taught at a level that lets students gain skills
Curricula that are well matched to student capabilities can significantly improve student learning outcomes. If curricula (and teachers) are overambitious it can hinder student learning (Pritchett and Beatty 2012).
Tracking that separates low- and high-performing students or provides additional help that is better paced to student capabilities can have beneficial effects on student learning outcomes. It allows time-constrained teachers to personalize their teaching to the level of students in the class. In India, a remedial education program that hired young women to teach students who were lagging in basic literacy and numeracy increased average test scores by 0.28 SD due to gains in test scores of children at the bottom of the distribution (Banerjee et al. 2007). Remediation programs are also effective, even for college students: remediation math and English programs in the US targeted at students who had graduated from high school academically unprepared resulted in students who were less likely to drop out of college and more likely to transfer to better colleges (Bettinger and Long 2009).
Nevertheless, tracking can have mixed results, preventing knowledge spillovers derived from interactions between low- and high-performing students. Cross-country evidence finds that students tracked earlier have significantly lower achievement on mathematics and reading. Yet early tracking is related to higher levels of achievement on science tests, reflecting uneven gains and losses to early tracking depending on the subject area (Hanushek and Woessmann 2005). Remedial and honors courses within schools are observed to have variable effects among different regions. In high-income Asian economies, remedial education is fundamentally important in driving higher test scores, while
Better skilloutcomes
Contentmatched
to studentcapabilities
Skilledand motivated
teachers
+
Contentteachingrelevant
skills
+
Source: ADB.
Figure 6.1: Enhancing Educational QualityMust Address Curriculum Content and Delivery

46 Key Indicators for Asia and the Pacific 201546
it has little effect in OECD or developing Asian economies. In fact, in developing Asian economies that offer extra math courses, whether honors or non-differentiated to student capabilities and used to supplement standard course work, have students that perform far better on the math test on average (Figure 6.2). On the other hand, schools that only offer supplementary remedial courses have no significant effect on student performance.
Student perceptions of teaching content may provide a better measure of whether content is well matched to student capabilities. Independent of the region, students who report that the content is too difficult have significantly lower test score outcomes (Figure 6.3).
Fostering critical skills
Curriculum content for basic education combined with new teaching methods can keep students engaged and better develop critical labor market–relevant skills. These include skills that emphasize computing and noncognitive skills, as well as critical cognitive, problem-solving skills (World Bank 2007). At the secondary level, helping students prepare for the world of work requires provision of job skills for those not going on to higher education. A quality curriculum pushes students to solve problems critically rather than use rote memorization.
Noncognitive skills
Fostering noncognitive skills can be integrated with standard basic and secondary education. The best evidence on the development of noncognitive skills comes from the Perry Preschool Program (for disadvantaged children of 3–4 years old) in the US which taught social skills in a daily plan-do-review sequence in which children planned a task, executed it, and then reviewed it with teachers and fellow students. The aim was to develop skills to work with others. These children had no higher IQs at age 10 than comparable students who did not attend the program, but these children had higher educational achievement and 7–10% higher earnings per year as adults (Heckman et al. 2010; Heckman, Pinto, and Savelyev 2013).
Curricula that use group projects, presentation activities, and volunteer activities are also avenues for curriculum design that can generate gains in noncognitive skills. However, there is a need to build further evidence on the effectiveness of curricula to develop cognitive and noncognitive skills that have sustained impacts.
Digital and basic computer skills
Basic computing skills are increasingly becoming a necessity for operating in modernizing economies that are increasingly integrating
Note: Solid columns significant at 10%. See Appendix 4 for detailed methodology.
Source: ADB estimates using PISA 2012 student data.
Figure 6.2: E�ects of Schools O�eringAdditional Math Lessons on Math Test Scores
-10
-5
0
5
10
15
20
25
OECD Developing Asia
Chan
ge in
Mat
h Te
st S
core
Remedial Honors Non-di�erentiated
Note: Solid columns significant at 10%. See Appendix 4 for detailed methodology.
Source: ADB estimates using PISA 2012 student data.
Figure 6.3: E�ects of PerceivedDiculty of Curriculum on Math Test Scores
-35
-30
-25
-20
-15
-10
-5
0
OECD Developing Asia
Chan
ge in
Mat
h Te
st S
core

47A Smarter Future: Skills, Education, and Growth in AsiaSpecial Chapter
47
technologies into everyday work tasks. Many websites and smartphone apps allow self-employed or own-account service workers (typically low-skilled) to market themselves and gain access to a larger consumer base. At a minimum this requires familiarity and comfort with basic smartphone or web technology. For example, Uber, which has expanded rapidly to a number of countries in developing Asia, allows technically independent drivers to easily be hired by potential passengers through the simple push of a button on a computer app.19
Early introduction to computers can improve student comfort, interaction, and manipulation of computer technology. This does not mean, however, that there should be mass public investments in providing computers to every child. One Laptop per Child programs are costly at $100–$200 per machine, and have achieved only moderate success. In the People’s Republic of China (PRC), student achievement in math increased, but not in Peru or Uruguay (Mo et al. 2013a; Cristia et al. 2012; De Melo, Machado, and Miranda 2014). Another computer-distribution program in Romania saw lower school grades but higher computer skills and improved cognitive ability (Malamud and Pop-Eleches 2011). More viable and simple low-cost solutions would include curricula and schools with computer labs where students receive exposure through shared computers.
Informal sector skills
A weak evidence base pervades their teaching impact
The continued prevalence of individuals in informal or self-employment in developing Asian economies requires curricula in secondary and TVET that can teach practical skills, such as basic financial
19 The state of California, US, has challenged this “independence” in the courts, and won, i.e. they are employees and not independent. However, several more rounds in the courts over several more years are likely until a final decision, at least for California, is made.
management and marketing. Given the difficulty in moving from informal to formal wage employment, targeting populations that enter the informal sector can be important for enhancing their long-term labor-market prospects (Gunther and Launov 2012).
Studies find mixed results of business and entrepreneurship training, however, in terms of survivorship and increased revenue or profits in existing firms. A business training course conducted for women in Sri Lanka using a business training course developed for microenterprises and new entrepreneurs in developing countries, known as the Start and Improve Your Own Business Program, found that the training had no impact on profits, sales, or capital stock despite some small changes in business practices for existing businesses. Those receiving a grant for business investments temporarily increased profitability, but the effect dissipated by the second year. In comparison the training helped business startups speed up their process of entry into the market and increased their profitability, suggesting that training is better targeted and effective for new owners than existing ones (De Mel, McKenzie, and Woodruff 2014; McKenzie and Woodruff 2014; Field, Jayachandran, and Pande 2010).
In Uganda, a randomized study found that female-targeted training that taught technical skills plus budgeting, financial, negotiating, and accounting skills resulted in a 35% increase in engagement in income-generating activities (Bandiera et al. 2014). Yet the heterogeneity of various curricula and training interventions for the informal sector means that knowledge on how to design effective curricula for the informal sector is not complete. The difference in interventions and outcomes means that many more evaluations will have to be done to arrive at a greater consensus to better understand what works independent of the context.

48 Key Indicators for Asia and the Pacific 201548
6.2 Instruction
Quality curriculum content needs to be combined with quality instruction to enhance student skills. As teachers are fundamental to student learning, developing programs to enhance teacher quality and skills is important. Nevertheless, when either the skills or motivation of teachers are suspect, looking to alternative delivery methods that cut out variations in teacher quality could generate gains to learning.
Teacher quality
Teachers are the main mode through which education has been traditionally delivered. Teachers who engage students more in problem solving activities (cognitive activation) and teachers who are perceived to care more about student learning are small but important factors in enhancing student outcomes (Figure 6.4).
Yet teacher test scores, credentials, degrees, experience, and training are seldom very good indicators of quality teaching skills (Hanushek 2013; Hanushek and Rivkin 2012). In developing Asia, teacher certification and degrees have no effect on student outcomes (Figure 6.5). This may in part be
reflective of institutions where certification provides no credible signal of teacher skills that matter for skill outcomes, unlike OECD economies where teacher certification is a large and significant determinant of student performance.
While complementing new curricula with teacher training is necessary, it is by no means sufficient for guaranteeing that new curricula are adopted. Low-cost methods for training teachers include providing mini-lessons to teachers through video and small incentives to participate in training. However, new curricula should be aligned with teacher incentives to better guarantee adoption into classroom instruction. Incentives for teachers to adopt new curricula could range from financial rewards to reductions in the time it takes to design or administer curricula.
As evaluations of teacher capacity building on student learning often find no impacts, the absence of incentives could be the missing component that ensures these interventions are effective (see Glewwe et al. 2013 and Murnane and Ganimian 2014 for literature reviews). In India, an intervention providing low-stakes diagnostic tests and feedback to teachers to improve instruction found that teachers exerted more effort when observed in the classroom,
Note: Solid columns significant at 10%. See Appendix 4 for detailed methodology.
Source: ADB estimates using PISA 2012 student data.
Figure 6.4: E�ects of Instruction Approach on Math Test Scores
5
6
7
8
9
10
11
12
13
14
OECD Developing Asia
Chan
ge in
Mat
h Te
st S
core
No emotional support but with cognitive activationEmotional support but no cognitive activationEmotional support and cognitive activation
Note: Solid columns significant at 10%. See Appendix 4 for detailed methodology.
Source: ADB estimates using PISA 2012 student data.
Figure 6.5: E�ects of TeacherCertificates or Degrees on Test Scores
0
4
8
12
16
20
24
OECD Developing AsiaCh
ange
in M
ath
Test
Sco
reCertification University
University mathematics University education

49A Smarter Future: Skills, Education, and Growth in AsiaSpecial Chapter
49
but their students did no better in independent administered tests than students of teachers who received no feedback (Muralidharan and Sundararaman 2010). To generate gains in learning outcomes through improved teacher quality could require policy that is more focused on human resource management practices and labor market policies that improves recruitment and retention of better teachers and imposes accountability (Section 4).
How to effectively improve teacher quality remains an open question, especially for TVET and higher education. While donor spending often focuses on teacher training, research needs to be undertaken to understand the incentives that induce teachers to adopt these new practices so that they ensure the development of better student skills.
Positive peer effects
A low-cost way to improve teacher skills and student outcomes is to leverage knowledge of more experienced and effective teachers. There are large spillovers (generated by knowledge or competition) between teachers that can have potential to be just as effective as more formal training methods and incentives. In the US, students of teachers who gained more effective colleagues were observed to have larger increases in math and reading tests. These effects were larger for less experienced teachers, indicating that allocating better teachers across various schools and creating mentorship links with new teachers could improve student skills (Jackson and Bruegmann 2009; Bacher-Hicks, Kane, and Staiger 2014).
TVET’s need for industry knowledge
Industries that see faster technological change require more frequent reviews and updates to maintain relevancy to changing labor market demands. Intuition and best-practice reports for TVET suggest that partnering with industry experts and engaging teachers who have hands-on industry experience are key to making TVET curricula more
relevant and producing real technical skill gains. While there are efforts to develop industry linkages to address concerns on relevancy of skills, there is relatively little rigorous evidence that confirms the widespread effectiveness of these initiatives.
Skills councils that are driven by industry investments and that set time frames for reviewing and updating skills (e.g. the National Skills Development Council in India), while in line with best practice, still need to be rigorously evaluated. Precisely because of changing industry demands, TVET curricula should place more emphasis on building adaptable, noncognitive, and computing skills.
Teachers with industry experience are important in TVET to generate gains in technical skills. In the PRC, students that had secondary vocational teachers with experience in computers had higher levels of computer proficiency; those who had had teachers with no such experience learned very little, and had no measured gains to computing proficiency even when the teacher had professional certification in these skills (Johnston et al. 2015). Caution therefore should be exercised in economies undergoing TVET expansion to ensure that increased emphasis on technical education leads to improved labor market outcomes (e.g. the Philippines for secondary education). The limited existing evidence suggests that expansion would be more effective by hiring teachers with relevant industry experience rather than trying to develop new technical skills of existing teachers. To potentially facilitate effective delivery of TVET likely relies on having greater flexibility in teacher hiring and termination practices to ensure that TVET can quickly shift to meet changing industry demands.
Alternatives to variable teacher quality
Technology use and scripted curriculum are alternatives to consider to improve learning outcomes when there are concerns with teacher skills or effort (Figure 6.6).

50 Key Indicators for Asia and the Pacific 201550
Technology combined with content
Delivering more student-centered learning
Technology that has quality educational content can keep students engaged and interested, raising the amount of productive time spent on learning. It can help reduce much of the large variation in teacher quality, and holds promise especially in rural areas where outreach, teacher monitoring, and school choice are usually more limited.
Gamification
Turning tedious problem solving into a game that rewards learning and knowledge
Gamification is a type of computer-assisted learning (CAL) that is designed to incentivize students to invest more time in learning by making learning into a game. The gamification of education has been found to be highly effective at improving performance on achievement tests as curriculum content can be easily adjusted to match student capabilities. In the PRC, educational computer games in math and English
were used to supplement traditional classroom learning in schools catering to children of migrant workers. Eighty minutes of shared computer time a week on top of standard classroom learning over 13 weeks increased student math scores by 0.12 SD (Lai et al. 2012; Huang et al. 2014).
CAL integrated directly into regular school time is also highly effective. Regular computer class time replaced by CAL for 3rd and 5th graders receiving 80 minutes of shared computer time a week, and monitored by two teacher supervisors, raised math scores by 0.16 SD (Mo et al. 2014a). A low-cost CAL program in India (costing $15.20 per student per year), where students spent 2 hours per week with education software, found that math scores rose by 0.47 SD. However, the effects on learning diminished 1 year after the program ended to only 0.10 SD (Banerjee et al. 2007). Thus interventions may need to be implemented and evaluated over longer time periods to ensure they can sustain improvements in learning outcomes to truly justify their effectiveness.
Innovations in gamification have become more sophisticated and provide ways to more precisely
Teachers notaccountable,
incentivized orsu�ciently skilled
Technology
Scripted curriculum Better skill outcomes
Better skill outcomes
Requires quality and relevant content matched to student
capabilities
Source: ADB.
Figure 6.6: Technology and Scripted Curricula are Possible Alternativesif Teachers are Not Accountable, Incentivized, or Su�ciently Skilled

51A Smarter Future: Skills, Education, and Growth in AsiaSpecial Chapter
51
analyze behavior and better assess how to help people extend their investments in learning, whether through increased effort or improved capacity. These innovations are being applied across a range of education levels as well as training and learning on the job. Badgeville, for instance, integrates gamification into clients’ mobile applications to increase collaboration among their employees as well as facilitate training and development (Badgeville 2015).
Development of quality content
The ability to develop learning modules and quality content in developing economies is more feasible than ever before. The Khan Academy, for example, has reduced costs of provision by allowing teachers to build their own courses while having access to in-depth analytical tools. Engaging the private sector to design and develop technological content especially for TVET is important to standardize and reduce some of the variations in the quality of TVET provision. Venture capital in
educational technology has been on the rise and may provide an efficient answer to improving the quality of educational provision in terms of curriculum content, testing, and delivery (Box 6.1).
Scripted curriculum
A low-tech solution to reduce variances in teacher quality
When teachers are not incentivized or accountable and teacher skills are low, scripted lessons can improve delivery by providing explicit guidance to teachers on what to say and do. In Maharashtra, India, a randomized implementation of scripted lessons had significant impacts on student achievement, raising math scores by 0.31–0.33 SD (He, Linden, and MacLeod 2007). As scripted curriculum can eliminate teacher effort in designing and constructing the curriculum, unmotivated teachers will have greater incentive to adopt these types of lessons, which can be effective for basic education but remain untested for higher education and TVET.
Venture capital fills a crucial void in financing that allows entrepreneurs without collateral to scale up their businesses. Venture capitalists invest in small, high-risk businesses for an equity stake with funding driven by expectations of how large and profitable a startup can become.
Such funding for education technology globally rose by nearly half from 2013 to $2.3 billion in 2014, with 24% going to companies operating in the PRC (Ambient Insight 2015). For Asia, development of education technology is expected to continue to rise, given that Asia has massive market potential with roughly 630 million basic and upper secondary students and an average household that is estimated to spend 6.5% of its income on education-related products, according to ADB calculations.
The market for education technology is expected to expand as schools are beginning to outsource specific tasks and services to private educational technology providers so that the schools can function more e�ciently and focus more on meeting specific skill targets. Education technology products range from textbooks, custom-designed hardware (e.g. tablets by Amplify), software for assisting instruction (e.g. Khan Academy, Duolingo), provision of online courses (e.g. EdX, Coursera) and ways to validate and
assess student learning. They cater to a wide and diverse audience including students, teachers, and schools across all age segments: compulsory education, higher education, corporations for training, and lifelong learning.
Due to the fixed costs of developing quality systems, a cost-e�cient and sustainable model for developing countries would be to find ways to partner with good education-technology firms to enhance programs and adapt them to their context. Khan Academy, for example, has developed an open educational platform that generates subtitling to enhance accessibility to English videos for people who speak other languages and an adaptive learning tool that is open source and can be restructured to fit a country’s needs. The New Schools Venture Fund, a nonprofit venture philanthropy firm supported by the Gates Foundation, and Learn Capital, the venture capital firm behind BloomBoard and Edmodo, are two examples that are aiming to develop and fund education-technology content for a global audience. As private venture capital is better positioned than government to identify, produce, and scale innovative products, it will likely play a large role in funding new education technology that will disrupt educational markets (Greenfield and Vander Ark 2014).
Box 6.1: Venture Capital—Funding the Next Generation of Education Technology

52 Key Indicators for Asia and the Pacific 201552
Section 7. Educational Access
Increased access to quality skill development opportunities is important from an equity and efficiency perspective, and entails targeted program interventions that generate greater equality of opportunity. A key distinction is between uncontrollable circumstances (that generate inequality of opportunity) and controllable circumstances (that stem from differences in effort) (Roemer 1998).
Uncontrollable circumstances, which need to be countered through public investments, include being born into families that lack financial resources to pay for school or have insufficient information or time to mentor and coach their child; being born into a society that favors one gender over another; or living in a rural area with little access to quality schools. Thus policies that increase access could involve providing financial aid, providing targeted information to help individuals and families make more informed decisions, supporting programs to help limit adverse or detrimental behavior for high-risk students, and promoting gender and rural–urban equity in access to education (Figure 7.1). Success in enhancing educational access is tied to good data
collection as it helps set the parameters for the right groups to target and to assess the quality of implementation of the targeting mechanisms.
Low-cost ways to enhance effectiveness of many of these interventions is to incorporate knowledge of behavioral responses that will help “nudge” individuals into better skill investment decisions and enhance access (Lavecchia, Liu, and Oreopoulos 2015; Levitt et al. 2013; World Bank 2014). These can complement many interventions that enhance educational access from reducing perceived risks to borrowing, to reducing negative self-identities that are driven by social, gender, or rural–urban inequalities.
In developing Asian economies, a high share of educational outcomes appears to be driven by differences in parental education and occupations rather than geographic or gender factors (Figure 7.2). Policies that target based on socioeconomic status therefore could be far more effective at increasing access than those that focus on a specific gender or increase resources in rural locations.
Information forparents and students
(to inform choices)
Programs for high-riskstudents (to limitadverse behavior)
Gender equality Rural–urban parity
Financial aid(for credit constraints)
Figure 7.1: Policies to Address Dierent Barriers to Optimizing Skill Investments
Source: ADB.

53A Smarter Future: Skills, Education, and Growth in AsiaSpecial Chapter
53
7.1 Financial aid
Resolving credit market failures
Financial aid products can help students increase their educational investments. Credit constraints in skill investments arise because parents do not value education, are unable to borrow against a child’s future income, or are unable to borrow against their own income to fund a child’s skill investments (Cunha and Heckman 2007). Yet credit market failures faced by poor families make it difficult to fund skill investments even when the expected benefits from investing in skills outweigh the costs. These failures in the credit market can result in far less educational investments, less intergenerational mobility, and higher wealth or income inequality (Lochner and Monge-Naranjo 2012; Belley and Lochner 2007). Credit constraints create inequities
in school attendance, but also manifest themselves in less observable investments such as private tutoring, leading to lower levels of overall skill investments.
Credit constraints experienced during early childhood have a more detrimental impact on skill development than in adulthood (Caucutt and Lochner 2006, 2012; Milligan and Stabile 2011; Dahl and Lochner 2012). As the impact of a parent’s investments in skills in early childhood are highly uncertain, risk aversion (Box 7.1) and time-inconsistent preferences can contribute to underinvestment.
TN = Tamil Nadu; HP = Himachal Pradesh.Notes: Based on Ferreira-Gignous (2011) measures of inequality of
opportunity without scale. Includes only economies where less than 5% of the population has dropped out by age 15 to ensure results are more representative and less driven by selection of who drops out.
Source: ADB estimates using PISA 2012 and 2009*.
Figure 7.2: Inequality of Opportunity in Mathematics
0.00 0.05 0.10 0.15 0.20 0.25
Azerbaijan
Macau, China
Kazakhstan
Hong Kong, China
India (TN)*
Republic of Korea
Singapore
OECD
United States
India (HP)*
Georgia
Japan
Taipei,China
Thailand
Kyrgyz Republic
Parent’s occupation Location (rural/urban)
Gender Parent’s education
Risk aversion is part of psychological behavior that causes students who are credit constrained to make more suboptimal educational investments when faced with credit constraints. This could cause them to prefer to take an immediate job with guaranteed income rather than take out loans and continue education or to undertake paid work while enrolled in school leaving less critical studying time (Belzil and Leonardi 2013; Brodaty, Gary-Bobo, and Prieto 2014; Caucutt, Lochner, and Park 2015).
High-performing children with parents with low cognitive skills tend to be more at risk for lower educational investments since risk aversion tends to be higher independent of credit constraints and income for those with lower levels of cognitive skills (Dohmen et al. 2010). Risk aversion can widen inequalities in skill investments as poorer families and females are often more risk averse (Borghans et al. 2009; Attanasio and Kaufmann 2014). Thus, designing complementary policies that address both credit constraints and risk aversion is important especially for higher education.
Box 7.1: Some Consequences of Risk Aversion
NEEDED
HAVE
???
Credit constraints prevent individuals from investingin education even when expected returns exceed costs.

54 Key Indicators for Asia and the Pacific 201554
Credit constraints are particularly severe in developing Asian economies with limited public financing of education and insufficiently developed credit markets to fund skill investments. Socioeconomic status can affect student expectations of attending college independent of the student’s ability or their parents’ level of education. In developing Asia, an individual in the bottom 20% of the socioeconomic distribution in their country is 13 percentage points less likely to aspire to attend college than a student in the top 20%, suggesting that credit constraints may be driving these aspirations (Figure 7.3).
Conditional cash transfers
Conditional cash transfers (CCTs) are among the options for governments to consider. Typically targeted at poor families who face larger credit constraints, these can help improve child and family incentives for early skill investments by providing cash based on a child’s health check-ups and school attendance or other conditions. Proxy means-testing identify families that are poor, by using indicator proxies that are significant predictors of welfare, such as parental educational background, physical housing characteristics, and ownership of durable goods.
CCTs have had considerable success in raising learning outcomes in the long-term in Latin America. CCTs have helped increase educational participation and attendance (see Fiszbein and Schady 2009 for a summary). With quality education, this can translate into gains in skills. In Nicaragua, CCTs were found to have long-term impacts on cognitive skills (Barnham, Macours, and Majuccio 2013). Developing Asian economies, such as Cambodia, India, Indonesia, Pakistan, and the Philippines, have only recently latched onto the CCT trend. A smaller volume of funds earmarked for transfers, older ages at which transfers take place, or less effective institutions are possible factors for why evaluations of CCTs in Asia have so far found less success pointing to challenges faced in immediately developing a CCT model that is effective. In the Philippines for example, CCTs were more effective at increasing enrollment among younger children than older children, while in Indonesia CCTs had no effect on enrollment for children ages 7–15 (Alatas 2011; Chaudhury, Friedman, and Onishi 2013).
CCTs tend to be less effective per dollar of investment at older ages. In contrast to younger ages, adolescents who have greater capabilities as workers often require greater amounts to induce significant changes in educational investment behavior. In the PRC, a cash transfer worth around one-third of annual
Note: Solid columns significant at 10%. See Appendix 4 for detailed methodology.
Source: ADB estimates using PISA 2012 student data.
Figure 7.3: Di�erences in CollegeAspirations Due to Di�erences in Socioeconomic Status
0.3
0.4
0.5
0.6
0.7
OECD Developing Asia
Prob
abili
ty
Bottom 20% Middle 60% Top 20%
PRESENT FUTURE
50–50Chance
Risk averse and poor individuals may underinvestin education to avoid having to take out loans for education.
55A Smarter Future: Skills, Education, and Growth in AsiaSpecial Chapter
55
wages (around 150 $PPP) of low-skilled workers led to a sharp fall in dropouts among junior high school students with poor academic performance (Mo et al. 2013b).
In contrast, a CCT program that provided cash conditional on a child’s enrollment in secondary school in Cambodia provided parents with a cash equivalent to 2% of the consumption of the median household. This transfer increased attendance rates by 25 percentage points. However, providing a larger cash transfer did not dramatically affect attendance rates suggesting that the lower cash transfer amount was a more cost-efficient transfer for improving enrollment (Filmer and Schady 2011).
Due to the targeting mechanism and conditionality requirements, CCT administration and monitoring mechanisms are costly. They typically require close coordination between the bodies distributing cash with those overseeing the education and health institutions. CCTs could rethink current models by providing cash conditional on making real gains to additional skills or maintaining minimum standards of achievement rather than focusing solely on targets such as enrollment.
Unconditional cash transfers
Unconditional cash transfers (UCTs) remove the conditions of CCTs and retain the targeting mechanisms, greatly lowering the cost of institutional administration and coordination. Ideally UCTs are labeled for education to help with mental accounting that sets expectations that the cash is used for education (Thaler 1990). In Morocco, a UCT program labeled for education had success equivalent to the CCT in increasing enrollment (Benhassine et al. 2014). When UCTs are not labeled for education, however, they may be less successful at inducing changes in educational investments. An unlabeled UCT versus CCT program in Malawi found less than half of the increase in school enrollment under the UCT compared to the CCT (Baird, McIntosh, and Ozler 2011).
Designing a cost-effective CCT or UCT system requires identifying the optimal amount of cash and types of conditions needed to induce significant changes in investment behavior of targeted groups. Most importantly, for UCTs or CCTs to be worth the cost, the quality of schools should be good enough that the additional years of education lead to gains in critical skills.
Loans
Loans for higher education can mitigate credit-market failures. This is especially important for publicly backed loans via private loan providers targeted at poor students with higher assessed returns to education. Society can receive large returns on investments if it creates more productive workers that pay back loans, but also add to the public tax base over the longer term. Access to finances can help ensure that students focus on their studies rather than working to support themselves, possibly raising levels of learning.
Repayment terms and amount of loan relative to grants offered to individuals are an important consideration. Policies that have shifted loans to grants have showed that loans increased the probability that students pursued high-salaried jobs and reduced the probability of low-paying jobs that were of public interest and have had significant impacts in developed economies on improving learning experiences and building skills (Belley and Lochner 2007; Rothstein and Rouse 2011). In developed economies, government-backed loans have low to zero interest and allow students to defer payments until they enter a job to mitigate some of the perceived risks to borrowing (Vandenberghe and Debande 2007).
Universities, colleges, and TVET institutions are presumably in a better position than banks and governments to screen potential loan applicants due to scale efficiencies created in screening during standard admittance process, but also should share in the risks of loan provision. This shifts some of the

56 Key Indicators for Asia and the Pacific 201556
burden to schools to better ensure candidates will receive and obtain a quality education that results in employment. This is a financial model for universities and colleges that can generate endowments and develop a strong alumni base (Hoxby 2014). While this model is typical in the US, it should be considered by Asian universities that aim to develop financial sustainability and maintain competitiveness over the long term. Singapore University of Technology and Design in collaboration with Massachusetts Institute of Technology is one leader in the Asia region that is trying to build an endowment to sustain its own financial base. For TVET institutions, the model would have to be different. In particular, one model that is considered to reduce risks of loan defaults occurs through TVET institutions partnering with firms to generate automatic payroll deductions once loan recipients become employed.
Financial loans are viable in developing economies that are looking to lessen the burden of public finances while mitigating some part of the risks of promising students going onto higher education. However there must be solid institutions that can enforce contracts for loan repayment. The Philippines’ Study Now, Pay Later Program is just one example of a loan program that was not able to achieve financial sustainability because of institutions that were not sufficiently strong enough to enforce loan repayments (UNESCO 2003). To have sustainability and success, public loans, or educational provider–backed loans, require good legal systems that can enforce loan repayment. It may also be helpful to create financial products that can encourage families that are credit constrained to save for education (Box 7.2).
Other approaches
Vouchers or subsidies for training or education can relax credit constraints while enabling greater school choice or access. These are useful for TVET and higher education where there is widespread private educational provider penetration and individuals are sophisticated enough to differentiate between
educational provider quality and different types of technical training. Provision of vouchers can lead to greater enrollment in education and training and improve earnings, conditional on entering a wage job (e.g. Kenya as in Hicks et al. 2013). A program in India that subsidized stitching and tailoring training to females found that participants had higher rates of employment and earnings 18 months after program completion (Maitra and Mani 2014). For these programs to be successful, vouchers and subsidies
Educational commitment savings accounts are financial products that provide assistance to those that have long-term skill development goals. These accounts are for families and students who recognize the value of investing in education, but know that their choices might deviate from these goals in the short term, preventing them from making the optimal financial or skill investments.
Such accounts are useful even among poor populations. In Uganda, a randomized experiment found that a weak account permitting families to withdraw the money for other uses had greater deposits than a strong account restricting withdrawals to education only. Combined with parental informational sessions on how to support their child’s education the savings accounts resulted in more household expenditure on school supplies and an increase in language and math scores (0.14 SD increase) that was just as large as some of the (presumably) more costly technology and contract teacher interventions (Karlan and Linden 2014).
Educational remittance accounts can also help improve educational investments. These are useful for countries such as Nepal, the Philippines, and Tajikistan where remittances from migrants workers account for a large portion of national income. Risk-averse migrants can reduce the amount of remittances it sends back due to concerns over usage of funds. To address this risk-aversion, Filipino migrant workers in Italy were randomly o�ered accounts to send remittances back to the Philippines for education. The weak account labeled the account for education, but did not put explicit restrictions on expenditures while the strong account paid remittances directly to schools. The weak account increased remittances by 15% while the strong remittance account increased payments by 17.2% (De Arcangelis et al. 2015). Given the small increase in remittances, but the much larger increase in cost of administration of the strong remittance account, the weak remittance account is viewed as the more cost-e�ective financial product.
The creation of these accounts can be driven by the private banking sector or be a joint initiative of the public and private sectors. Very few changes to current financial products, or additional costs for infrastructure, are needed.
Box 7.2: Helping Families Commit to Educational Investments

57A Smarter Future: Skills, Education, and Growth in AsiaSpecial Chapter
57
should restrict provision to selected cases where programs have high enough quality to justify the investment.
Two-step targeting of scholarships can be financially efficient (Barrera-Osorio and Filmer 2014). As children age and their abilities become more clearly developed, targeting those that are credit constrained and have greater potential is more prudent use of limited public finances. In Cambodia, a project offered primary school scholarships through a two-step targeting process that first restricted attention to individuals based on need and then within this set those based on merit. The evaluation found that only those needy students who were targeted based on merit had significant improvements in their test scores. This indicates that even well-intentioned need-based targeting is not always enough to broaden access for the most impoverished groups.
Framing messages are simple and low-cost interventions that can help risk-averse individuals to perceive borrowing as a less risky proposition and improve educational decision making. However, these policies still need to be evaluated as experiments that have shown the beneficial effects of framing to shift choice decisions have existed mostly outside education (Holt and Laury 2002; Levy-Garboua et al. 2012).
7.2 Information for students and their families
Helping people make informed choices where expectations and reality coincide
The right information is not always available for students and their families to make informed decisions, leading to suboptimal skill investments. In TVET and higher education where information especially tends to be lacking in developing Asia, the problems could be especially severe.
Over- or underestimation of costs and returns to education is a problem more prevalent among disadvantaged groups. Overestimation of returns can lead to individuals and families incurring significant expenditures on education that provides little improved labor-market returns. In Chile for instance, prospective college students who significantly overestimated costs of college attendance were less likely to attend college and more likely to drop out of school. In contrast, those who overestimated earnings of past graduates were more likely to enter degree programs that provided less viable career paths, underscoring the consequences of inadequate information (Hastings et al. 2015).
Inadequate information can cause individuals to invest in technical or vocational training that does not fully match individual preferences or aspirations. This can cause promising students to focus on a very narrow scope of schools or degree programs, preventing them from fully developing their talents
EXPECTATIONS
REALITY
REALITY
EXPECTATIONS
CHOICE SET FULL
OPTIMAL DECISION
Choice Set Awareness
Optimal decisionin focused set, but notoptimal decision in true set
Informational failures where expectation and realitydo not coincide can lead to less than optimal educational investments.
Bounded rationality causes peopleto make mistakes in educational investments.

58 Key Indicators for Asia and the Pacific 201558
or interests. Inadequate information can also cause students to rule out higher education altogether because of a misguided belief that there is no way to fund it.20
In the PRC, inadequate information resulted in children of poor migrant worker families overestimating the returns to continuing onto secondary education relative to entering wage labor. Thus when provided with information on wage returns to a middle-school education, a significant share chose not to pursue secondary education due to the low quality of education and burden faced in trying to finance their education (Loyalka et al. 2013). In the Dominican Republic, the lack of quality information meant that poor families initially underestimated the returns, causing them to invest in significantly more years of schooling once they received targeted information on schooling returns (Jensen 2010).
Individuals also over or underestimate the relative returns to different types of training or entering different educational institutions with varying quality. In Kenya, the provision of information on different returns to technical training improved the rates of females entering skills training in more male dominated fields such as electrical and construction (Hicks et al. 2013).
Information on returns to education, training, or educational quality can be a low-cost method to improve skill optimization among poor and disadvantaged groups. Targeted information that is credible, clear, and concise represent low-cost interventions that are valuable in helping those that have more limited social and financial resources to make better skill investment decisions (Hastings and Weinstein 2008). The information should help individuals weigh the value that additional
20 Bounded rationality is a term used in behavioral economics to refer to the tendency of people to use rules of thumbs and defaults to make decisions when trying to sort through, perhaps too much, information leading to suboptimal decisions (Kimball 2015).
educational investments provide given the quality of education available and career prospects over time. Policy and financial investments should be guided by analysis that helps to understand how expectations match the reality of returns to education, quality of schools, and types of skills in demand.
Career and financial-aid guidance
Career and financial-aid guidance can be important for those entering TVET and higher education. In the US these services have encouraged high-ability, low-income students to enter better colleges (Avery and Kane 2004; Hoxby and Turner 2013; Hoxby and Avery 2013). In the PRC, an intervention that provided information booklets on college costs and financial opportunities had significant effects on the likelihood that poor students applied for and received financial aid. This ultimately improved matriculation into college, pointing to the importance of targeted information.
Computerized solutions can substitute for the necessity of having to train and finance quality career counselors. Online career-counseling modules and career assessment tests can provide students with a narrower range of occupations that fit their skills and preferences. The US Department of Labor has increasingly used online tools providing individuals with the opportunity to learn about a large range of occupations, career growth, and type of training required (US Department of Labor 2015). The efficacy of developing computerized platforms makes financial sense when the expected use of the targeted population is large. Online platforms should be user friendly and the information and advice must have value added over existing knowledge. Studies indicate that those with more stable goals and clear vocational preferences derived more value from these types of computerized services, generating improvements in career decision making (e.g. Kivlighan et al. 1994). Nevertheless, as these studies are based on small samples and focus on self-reported beliefs there remains a need for further

59A Smarter Future: Skills, Education, and Growth in AsiaSpecial Chapter
59
evaluations to assess if they are cost-effective models for developing economies.
Students who discount the future in comparison to the present (i.e. have present-biased preferences) may inadvertently underinvest in skill development.21
For example, students may not study enough because they are not fully informed about how their current actions may affect their future. Children and teenagers who exhibit this behavior are less likely to study and more likely to drop out of school (Cadena and Keys 2015). Across economies, students who have parents engaged in their schoolwork invest more hours in studying that could lead to significant gains to learning (Figure 7.4). In developing Asia, students whose parents are involved in their studies spend 15 hours more on average.
21 Laibson (1997) and O’ Donoghue and Rabin (1999) discuss the theory and consequences of these types of preferences.
Parent informational programs
Parents can face informational gaps that prevent them from fully supporting their child’s learning development. Programs that provide information on a child’s education—assignments, homework completion, attendance, and overall performance— can enhance parental monitoring and engagement helping their child to get more out of educational investments.
Note: Solid columns significant at 10%. See Appendix 4 for detailed methodology.
Source: ADB estimates using PISA 2012 student data.
Figure 7.4: E�ect of ParentalEngagement on Students’ Total Study Hours
11
12
13
14
15
OECD Developing AsiaChan
ge in
Hou
rs P
er W
eek
on S
choo
l Wor
kTime consistent preferences Time inconsistent preferences
ZZZZ
ZZZZZ
ZZZZZZ
GOAL!YEARS
123456789
10
Time inconsistent preferences can lead to less than optimal investments.

60 Key Indicators for Asia and the Pacific 201560
Text messaging, for example, has gained ground as a way to communicate with parents. In a program where parents of disadvantaged preschoolers were sent messages on how to better engage in their child’s literacy development, the program was found to have large gains to student learning (York and Loeb 2014). In the US, middle-school children whose parents were randomly chosen to receive text messages on their child’s incomplete homework were 25% more likely to complete their homework, as well as to achieve significant gains in test performance (Bergman 2015).
How information is relayed matters. In a program for disadvantaged students in an urban area in the US, teachers sent weekly messages to parents on a student’s performance. When the teacher communicated information to parents on what the student could do to improve in school, this increased the probability that high-school students earned course credits by 6 percentage points—a 41% reduction in the proportion failing to earn credits (Kraft and Rogers 2015). In contrast, a text messaging program that sent weekly health messages on addressing anemia to caregivers in rural areas in the PRC found that these were effective when combined with monthly quiz questions to test retention of information. This resulted in caregivers with greater health knowledge and subsequently primary school students that had gains to health and academic performance (Mo et al. 2014b).
Parental informational programs are potentially cost-effective investments that entail relatively minimal institutional resources to implement in developing economies. Given the proliferation of mobile phones throughout developing Asia, text messaging programs are low-cost solutions that could improve parental interactions with their child and enhance educational outcomes.
7.3 Programs for high-risk students
Diffusing detrimental behavior
Self-identity, which captures how individuals view and perceive themselves in relation to their social context, can affect test performance. A negative self-identity can cause underperformance even when an individual has higher innate skills. It can also become self-fulfilling, resulting in long-term consequences on student skill development, magnifying inequalities that have little to do with a student’s real ability. In India, for example, public revelation of caste status resulted in students putting in less effort and receiving lower test scores for inferior castes than when caste status was kept private (Hoff and Pandey 2006). Even in the PRC where there is less social stratification, a randomized experiment showed that public revelation of an inferior residential status (hukou) resulted in a 10% decrease in test performance compared with keeping the status private (Afridi, Li, and Ren 2015).
The learning environment can have a large impact, as disruptive students with negative self-identities can prevent others from learning, lowering academic achievement of an entire class or neighborhood (Kristoffersen et al. 2015; Helmers and Patnam 2014). High-stakes learning environments can erode confidence and create anxiety, leading individuals to drop out, or in the worst case to commit suicide (Glewwe and Kremer 2006). Implementing small policies that reduce spillovers from negative self-identities in environments with high levels of social stratification are low-cost methods to improve student performance and reduce inequities that are driven more by a child’s circumstances than intelligence or effort.
Mentoring or coaching is an alternative for children from disadvantaged backgrounds where parents have burdensome time constraints and other

61A Smarter Future: Skills, Education, and Growth in AsiaSpecial Chapter
61
priorities. These programs help high-risk students to focus on positive rather than negative self-identities (identity priming) to enhance test performance. This can involve priming students just before tests by giving them encouraging messages that help them think about the broader picture and their self-worth rather than messages driven by cultural or socioeconomic context (Jordan and Lovett 2007). These programs can also help students stay on track and enhance awareness and attention to the long-term benefits of skill investments. A text messaging and peer-mentoring program in the US that reminded low-income students to complete the necessary tasks to enter college led to increased college entry and higher rates of degree completion (Castleman and Page 2015).
Psychological counseling can help mitigate negative self-identities associated with decreased confidence and increased anxiety arising from high-stakes learning environments and lead to increased likelihood of dropout (Glewwe and Kremer 2006). Interventions could range from low-cost volunteer solutions to high-cost solutions with professional counselors. In the PRC, counseling to junior high school students reduced dropout and learning anxiety in the short term, but was ineffective over the long run, except for those students at most risk of dropping out (Wang et al. 2014). Workplace-based programs that develop character and skills have also showed some promise in improving self-identity. Successful interventions in these areas tend to emulate the mentoring environment offered by successful families (Kautz et al. 2014).
Classroom reorganization can also reduce the consequences of negative self-identities, providing large benefits at little to no cost.22 For example, in migrant schools in the PRC an intervention was introduced that encouraged low-achieving students to interact more with high-achieving peers; the latter were given financial rewards when they improved scores of their low-achieving peers. This intervention raised the grades of low achievers by 0.26 SD with no negative impact on high achievers (Li et al. 2014).
7.4 Rural–urban parity
Those who live in rural areas face some of the greatest difficulties in gaining access to quality education, but infrastructure, transport, and technology programs present opportunities to narrow disparities. In developing Asia, the gaps in educational inputs based on geography remain large, especially compared with OECD economies, as cities have far more qualified teachers, better instructional materials, and better buildings and facilities (Figure 7.5). Eliminating disparities requires investing more in educational infrastructure or adopting transport or technology programs to lower costs individuals face in gaining access.
School infrastructure provision for underserved rural populations can help increase skill development.
22 School uniforms can also help with negative self-identity. They are less of an issue in developing Asia given that many schools mandate uniforms as a policy, but elsewhere they can decrease negative self-identities (and improve student performance and learning, as in the US—Gentile and Imberman 2012).
*@#!!
*@#!!
E=mc2
ABCDEF123456
Self-identity can influence how much students learn and perform on tests.
Negative self-identity Positive self-identity

62 Key Indicators for Asia and the Pacific 201562
In Indonesia, a massive school-building program not only increased educational attainment, but also improved labor market earnings, suggesting that the value of education improved productivity enough that it outpaced the supply of additional skills (Duflo 2001).
The high cost of supplying to rural areas and maintaining quality can be extremely challenging. In some cases, boarding schools could serve as more cost-effective solutions to narrow disparities in access to quality education. Nevertheless, this comes with its own set of challenges. In Shaanxi, the PRC, the Rural Boarding School Construction Program highlighted concerns with safety, hygiene, supervision, diet, and nutrition as some of the challenges in provision at boarding schools. These students had poorer health, worse behavioral outcomes, and lower academic performance than their nonboarding peers. To improve provision, a teacher training program on caretaking was implemented to help improve student performance. While fewer students had tardiness or misbehavior outside of class, the program had little effect on academic performance or misbehavior during class (Yue et al. 2014).
In general, the need remains for innovative interventions to identify how to cost-effectively improve skill development in remote rural regions.23
Internet technology and online learning form one possible solution to improve educational access to rural populations conditional on students having access to technology. This can improve the variety of educational and training opportunities that eliminate the costs of commuting and still enable real-time engagement with a teacher. This becomes increasingly viable as the costs of providing internet technology continue declining and through increasing penetration of the Internet in remote rural areas.24
7.5 Gender equality
Discrimination is socially inefficient as it creates skill inequities and differential investments that have little to do with innate skill or talent. Cultural or social biases against females (or males) lead to inequalities and socially inefficient allocation of education and training as well as subsequent labor market outcomes. Gender disparities due to cultural or labor market biases for or against either sex can create differences in parental educational investments that have little to do with ability or skill. Gender disparities are larger among poorer populations with multiple children of both sexes. Thus expanding access and increasing incentives for families to invest in education for the disadvantaged gender has an important role in improving aggregate skill development outcomes.
A number of countries in the region have been successful in closing gender differences in secondary
23 Bike programs mentioned (see the subsection on gender equality below) is also a low-cost solution that could apply to both genders, even though that particular intervention was targeted only at females (Muralidharan and Prakash 2015). An important finding was that changes to enrollments were disproportionately higher for those living furthest away from the schools.
24 Google’s Project Loon uses balloon technology to lower internet access costs in remote areas.
Note: Solid columns significant at 10%. See Appendix 4 for detailed methodology.
Source: ADB estimates using PISA 2012 school data.
Figure 7.5: Di�erences in Educational Inputs by School Location
0.0
0.1
0.2
0.3
0.4
0.5
0.6
0.7
OECD Developing Asia
Chan
ge in
Mea
n Q
ualit
y In
dex
Qualified teachers Instruction materials Building and facilities

63A Smarter Future: Skills, Education, and Growth in AsiaSpecial Chapter
63
enrollment as measured by the gender parity index. In fact, many countries have gross enrollment in secondary education significantly over 1 (notably Armenia and Bangladesh), indicating that males have lower enrollment. Still, some economies have female enrollments far behind those of males (e.g. Cambodia and Pakistan) (Figure 7.6).
Gender-segregated classrooms or schools are useful where gender inequality is created through biases in teacher investments and can result in detrimental impacts in the allocation of gender to occupations. In Israel, it was found that girls who had teachers that favored males (based on departures in scoring in nonblind classroom exams compared with scores from a blind national exam in math and language tests) were less likely to enter science and mathematics occupations. The consequences of teacher gender biases were more severe among girls whose fathers were more educated and for those from lower socioeconomic backgrounds (Lavy and Sand 2015). Thus separating girls from boys could reduce gender biases that occur in mixed classrooms and eliminate negative self-identities that arise from differential treatment by teachers toward a specific gender. The need to better understand the effects of various interventions and identify when gender biases are prevalent could provide a more equal footing for students to access educational opportunities irrespective of their gender.
CCT programs targeted at females are a common intervention to reduce gender disparities in education. In India, a program that provided a financial grant to parents who gave birth to daughters and a long-term savings bond that could be redeemed by the daughter conditional on being unmarried at age 18 was found to have a positive effect on educational investments in the daughter (Yoong and Sinha 2009). In Pakistan, a female secondary school stipend increased girls’ enrollment rates by 9% relative to those who did not receive CCTs (Chaudhury and Parajuli 2010).
Bike programs targeted at females can serve as a lower-cost alternative to reduce gender disparities. In India, an intervention that provided bikes to females conditional on school enrollment increased female attendance by 41%, reducing gender disparities by 46%. This program cost only $1 per month, in contrast to a CCT program targeted at secondary school age girls in Pakistan, which increased enrollment by only 9% and cost $3 per month (Muralidharan and Prakash 2015).
Identity priming can reduce gender disparities in test performance. Studies in the US have found that females primed to contemplate their identity as a student in a selective school performed far better than those primed to think about their sex (McGlone and Aronson 2006).
Note: Only data for the latest year available for each country is used.Source: World Bank EdStats (2008–2013).
Figure 7.6: Gender Parity Index on Secondary Gross Enrollment
0.6 0.7 0.8 0.9 1 1.1 1.2
Pakistan
Cambodia
Tajikistan
Malaysia
India
Indonesia
Azerbaijan
Korea, Rep. of
Kyrgyz Republic
Georgia
Kazakhstan
China, People’s Rep. of
Myanmar
Sri Lanka
Philippines
Mongolia
Thailand
Fiji
Bangladesh
Armenia
Index
High-incomeOECD = HighIncome Asia = 1.0
64 Key Indicators for Asia and the Pacific 201564
Occupational information can enhance female skill development and reduce gender disparities in wages by helping girls and women better focus on labor market opportunities. In Kenya, the provision of information on occupation to voucher recipients of TVET training resulted in increased entry into male-dominated occupations that had higher wages (Hicks et al. 2013). In India, recruiting services targeted at young women in rural villages for business process outsourcing led to significant decreases in early marriage and child-bearing. These women were more likely to enter the labor market or invest more in schooling or training (Jensen 2012).
Flexible training schedules, child care provision, location, and time of day in which training is provided are considerations in designing training programs that ensure more equitable take-up of informal training programs serving as a safety net for females from disadvantaged backgrounds. These are necessary because of expectations of female roles and responsibilities in their home and family and because of more restricted mobility that generates disparities between males and females in take-up of training programs.
Greater evaluation is needed of gender-targeted programs, especially to understand long-term
effects. Just because certain programs are effective for males does not guarantee effectiveness of the training program for females (e.g. De Mel, McKenzie, and Woodruff 2009). A study that randomized business training to females in Sri Lanka found that it led to large increases in business entry in the first year, but there were few differences in business ownership compared with those that did not receive training 16–25 months after the training had ended (De Mel, McKenzie, and Woodruff 2014). There are also significant differences in training effects among females of different socioeconomic groups. In India, a business training program showed positive effects only among upper castes (Field, Jayachandran, and Pande 2010).
There are many programs that can be designed to effectively reduce gender disparities without explicitly targeting or setting quotas for female participation (Duflo 2012). For example, effective training in female-dominated sectors, such as agriculture production activities, can reduce gender differences in skill and labor market outcomes without explicit targeting. Identifying cost-effective interventions that ensure more equitable investments along gender dimensions can therefore go a long way to enhancing educational access.

65Special Chapter
65
Section 8. Learning On The Job The cognitive and noncognitive skills developed on the job over 20 years of work are estimated to account for 20–60% of all skills developed, and 30–70% of wage growth over a person’s lifetime, depending on the level of education obtained (Yamaguchi 2012; Heckman, Lochner, and Taber 1998).25 Such learning on the job is therefore vital to developing a nation’s skills base.
What elements encourage learning on the job? First, setting the conditions for adoption of firm training that can ensure workers continue to learn on the job. Second, following good human resource management (HRM) practices, which are vital in terms of targeted training practices, creating incentives for workers to improve their performance, and leveraging the competitive and knowledge spillovers that come from working in firms. Third, improving the efficiency in matching workers and jobs. Similar to a curriculum needing to be pitched to a student’s capabilities, workers who get jobs better matched to their skills can learn far more, and better utilize the skills they have.
8.1 Training investments by firms
Firm training investments may account for as much as 8.6% of growth in firm productivity according to Almeida and Carneiro (2009), while panel data regressions of the World Business Enterprise Surveys provide suggestive evidence that firm training that builds worker skills is key to raising labor productivity. New technologies require training to ensure that workers can use them and promote new worker skills. Thus policies that drive technology adoption and promote the development and competitiveness of firms are important to developing learning on the job (Almeida and Aterido 2010).
25 Based on detailed US panel data of individuals.
Partially subsidizing firm training can enhance skills training and is warranted when employers and workers cannot adequately capture the full returns to training investments, leading to underinvestment. It can be a large part of better aligning skills to labor market demand and has strong economic returns, particularly in the form of higher wages and firm productivity (Almeida and Carneiro 2009; Blundell et al. 1999; Konings and Vanormelingen 2015). Subsidies makes sense when firm training is general enough that it develops important transferable skills at a lower cost than public sector provision and draws concretely on industry knowledge, leading to broader productivity gains (Acemoglu and Pischke 1999). More thorough evaluation is required, however, to identify the amount of training costs that should be shared between government and firms.
Regular employment and large firms are more likely to promote learning on the job
Innovation and training are more often conducted by foreign and larger firms (Figure 8.1) even if they do not always use more skilled or educated workers.
Note: Only latest survey year available for each country is used.Source: ADB estimates using the World Bank Enterprise Surveys
(2006–2014).
Figure 8.1: Firm Training across Global Regionsby Number of Employees
0.00
0.10
0.20
0.30
0.40
0.50
0.60
0.70
0.80
0.90
Africa Asia Europe Latin America
Shar
e
Small (<20) Medium (20–99) Large (100+)

66 Key Indicators for Asia and the Pacific 201566
More regular as opposed to temporary jobs and jobs in larger firms seem more likely to develop learning on the job, a pattern reflected in wages rising with experience. In India for example, regular26
jobs—providing sufficient stability that a worker could expect to remain in the firm over multiple years—in private firms are more likely to have wages that rise with experience independent of the level of education, unlike temporary jobs where wages tend to decline. In Germany—an economy with high rates of skill development and formal wage employment—highly skilled workers were found to have high returns to experience and firm tenure compared with unskilled workers who had almost no returns to experience or tenure in a sector (Dustmann and Meghir 2005). Individuals in larger firms have wages that grow more with experience than those in small firms (Figure 8.2). Thus, policies that encourage growth of larger firms and more regular jobs will likely enhance productivity and learning on the job.
26 These jobs are sometimes referred to as “permanent” jobs in labor force surveys. Their chief characteristic is that they are distinct from daily-contract jobs (or work with no contract at all, formal or informal) where the employment relationship is expected to be short term. Regular or permanent jobs are those that involve some expectation of working in the medium to long term with a firm. Thus these terms, when used, do not imply the need to introduce strong employment-protection legislation.
Competitive labor and product markets are among the keys to developing more innovative firms that train
Several factors are key to encouraging firm training, including competitive labor markets that promote innovative firms that invest in training. This can be seen explicitly in cross-country regressions relating competition to higher rates of training (Figure 8.3).
Relaxing labor market regulations is important. Tough rules on hiring and firing and on working hours can cut into the skill premium and create distortions
Notes: Plotted wages for sample of male workers in nonpublic sector only. Estimates from log monthly wage regressions controlling for experience, squared experience, education, cohort group, and calendar year fixed e�ects. Left chart includes type of employment while right chart includes an indicator for the firm having at least 20 employees.
Source: ADB estimates using data from India Employment and Unemployment Survey (2000, 2005, and 2012).
Figure 8.2: Formal Wage Employment in India5.
56
6.5
Log
(wag
e)
0 10 20 30 40Experience
Regular Temporary
By Type
5.5
66.
57
Log
(wag
e)
0 10 20 30 40Experience
Large (20+)
By Firm Size
Small
BAN = Bangladesh; CAM = Cambodia; IND = India; INO = Indonesia; JPN = Japan; KAZ = Kazakhstan; KGZ = Kyrgyz Republic; KOR = Republic of Korea; MAL = Malaysia; MON = Mongolia; MYA = Myanmar; NEP = Nepal;PAK = Pakistan; PHI = Philippines; PRC = People’s Republic of China;SIN = Singapore; SRI = Sri Lanka; THA = Thailand; VIE = Viet Nam. Notes: Regression residuals of competition index and training extent
conditional on log GDP per capita (PPP) and country fixed e�ects.Source: ADB estimates using the World Economic Forum Global
Competitiveness Index (2006–2014).
Figure 8.3: Training and E�ciency of Product Markets
Exte
nt o
f tra
inin
g
Competition
BAN CAM
PRC
IND
INOKAZ
KOR
KGZMAL
MON
MYANEP PAK
PHI
SIN
SRI
THA
VIE

67A Smarter Future: Skills, Education, and Growth in AsiaSpecial Chapter
67
in demand for skilled labor. Restrictive labor market regulations were found to dull technology adoption in the highest skilled sectors while inducing it in low-skilled sectors (Alesina, Battisti, and Zeira 2015), and even temper overall demand for high-skilled labor. Tough laws that raise the costs of firing workers after a specified period create disincentives for firms to hire more regular labor on a longer-term basis and disproportionately favor temporary and contract labor (Nataraj et al. 2014).
Enforcing contracts is a precondition to ensure that written legal agreements are binding. It can improve firm sponsorship of training by helping firms capture more of the returns to training. However, the more complex the training, the more difficult it becomes to write a contract to guarantee the quality of training. In these cases, sophisticated, but costly, monitoring programs are required to ensure quality training. Much of the success of vocational education programs in Germany is argued to stem from the regulatory and monitoring environment (Dustmann and Schonberg 2012).
Removing trade barriers can enhance competition by eliminating policies that favor less productive domestic firms over foreign firms. By opening economies, domestic firms are forced to compete and upgrade their productivity to survive. Removal of trade barriers has had significant effects in enhancing firm productivity and strengthening labor demand (Hasan et al. 2012; Nataraj 2011).
Removing small-firm promotional policies that disincentivize enterprise growth is important for competition. Policies that favor small firms under the premise that they are the primary generators of jobs in developing economies and are needed to level the playing field can have unintended consequences if not appropriately designed. Unless they are young firms, many small firms are run by individuals who would be more productive as wage workers as they are not “capitalists in waiting” (Banerjee and Duflo 2008). Policies to help smaller firms overcome
various types of market failures may inadvertently discourage more dynamic firms to enter the market or lead to consolidation of market share by larger, more productive firms that are better able to generate productive and relatively well-paying jobs. Interventions should provide only short-term support targeted toward young, small firms rather than broadly favoring all firms that are small.
Regulating monopolies (via antitrust policy) is important for maintaining a competitive market environment. The process entails evaluating and removing unnatural barriers, created by monopolies, that prevent new firm entry and competition, whether domestic or foreign. Such regulation requires strong institutional commitment and financial resources to review and break up existing or potential monopolies and capacity to evaluate the market power of firms. These requirements could make this type of policy a much greater challenge to implement in developing Asian economies where even applying simpler policies, such as a one-stop shop for business registration, remains difficult.
8.2 Human resource management practices
Pushes employees to reach peak performance to create better conditions for learning on the job
HRM involves business practices that set guidelines and expectations for workers. It aims to incentivize workers, improve retention of highly skilled and motivated workers, while dismissing consistent underperformers to reach optimal labor productivity. An effective HRM system sets targets, collects data to measure progress, and rewards workers through bonus payments, training and promotions. HRM is therefore essential to developing greater learning on the job. The most effective HRM systems leverage knowledge spillovers to improve worker skill development and generate greater productivity gains (Box 8.1).

68 Key Indicators for Asia and the Pacific 201568
However, HRM practices in developing Asian economies are often behind the curve. Although the top manufacturing formal sector firms in developing economies tend to be in line with the best HRM practices globally, there is a long-tail of formal firms with poor HRM practices that draws down the average HRM score. Out of 33 developed and developing economies worldwide, the PRC, India, Myanmar, and Viet Nam were ranked in the bottom half (Figure 8.4). These rankings imply less than optimal skill development on the job which could arise because of the larger share of employment in small, informal firms.
Returns to adopting HRM can be substantial and should therefore not be viewed as a main barrier for firms to developing greater learning on the job. In India, managers of medium-sized manufacturing firms randomly selected to receive training in HRM and provided with performance-based pay saw a 17% gain in labor productivity within the first year of training (Bloom et al. 2013). Declines in computer and internet costs are increasingly improving returns to HRM and have helped speed adoption (Bloom et al. 2013; Bloom and Van Reenen 2010). Better HRM is shown to be closely linked to higher levels of productivity and profitability in a large range of studies (Bloom et al. 2012; Black and Lynch 2001; Oyer and Schaefer 2011; Syverson 2011). Incentivizing
workers by having them share in the gains from additional effort is the most important aspect of HRM in raising productivity, but relies on tracking worker output (Cappelli and Neumark 2001).
The structure of the work environment can enhance knowledge spillovers that generate greater learning on the job. A study of medical research scientists found significant knowledge spillovers within firms leading to enhanced firm performance (Waldinger 2013). In organizations such as universities where individuals work more in self-contained environments, knowledge spillovers may be determined more by topic of research rather than physical or social space (Azoulay, Gra�-Zivin, and Wang 2010). Thus the incentives individuals face, as well as how the firm or institution is organized, a�ect knowledge spillovers.
Workers in large firms are better placed to develop skills due to opportunities for collaboration that enables information and knowledge to flow. Independent or self-employed workers in developing economies have fewer such opportunities, which is one reason why collaborative work spaces and communities for
entrepreneurs hold promise (Waber, Magnolfi, and Lindsay 2014). These types of environments are starting to crop up in economies throughout Asia—India, Indonesia, Malaysia, Thailand, and Singapore are just a few of the places known to have them. They are intended to stimulate larger work environments by bringing together multiple entrepreneurs working in complementary areas, so as to facilitate knowledge spillovers. Small business groups and business-facilitation communities provide a secondary means to enhance the cross-flow of knowledge between entrepreneurs and the self-employed.
Developing work conditions that leverage knowledge spillovers for seemingly disparate entrepreneurs could be one step that developing economies can take toward helping innovation and learning to thrive.
Box 8.1: Di�using Knowledge
PRC = People’s Republic of China.Source: Bloom, Sadun, and Van Reenen (2015). Management
practices data covers various years (2004–2014).
Figure 8.4: Average ManagementScores among Manufacturing Firms
2.22.2
2.22.3
2.32.3
2.52.5
2.52.62.6
2.62.62.72.72.72.72.72.7
2.82.82.82.82.8
2.92.93.03.0
3.13.13.23.2
3.3
2 2.5 3 3.5Score
EthiopiaGhana
TanzaniaZambia
MyanmarNicaragua
NigeriaKenya
ColombiaViet Nam
IndiaBrazil
ArgentinaTurkey
PRCGreece
SpainChile
IrelandPortugal
New ZealandSingapore
PolandMexico
ItalyAustralia
FranceUnited Kingdom
CanadaSweden
GermanyJapan
United States
Africa Asia Australasia
Europe Latin America North America

69A Smarter Future: Skills, Education, and Growth in AsiaSpecial Chapter
69
Encouraging better HRM practices in smaller firms that are more typical of the firm size in many developing economies can be valuable to developing learning on the job, and are also aligned with firm objectives as they can generate productivity gains. A recent employer–employee matched survey in Viet Nam on micro and small firms (with 44 employees on average) provides evidence that HRM is important even for small firms. Better HRM practices were correlated with higher labor productivity and lower probabilities of skilled workers expecting to leave the firm (Chun and Villanueva 2015).
Sharing information on returns to HRM could induce greater adoption of HRM that promotes learning on the job as there could be informational gaps in the benefits of adopting better HRM. Owners and managers of medium-sized and large firms in India were found to be generally aware of HRM, but 45% of these firms were skeptical that HRM adoption could increase profitability by improving product quality and reducing costs.
Incentivized managers with sufficient skills and autonomy to make critical decisions could speed the adoption of HRM. Incentives could range from profit- sharing arrangements to promotional opportunities. Managerial incentives are necessary to address, as implementing better HRM entails undertaking costly actions to monitor worker effort (Bloom and Van Reenen 2007; Lazear 2000; Moretti and Perloff 2002). In India, a study using a representative panel of firms suggested that managerial bonus payments were a far more important factor in explaining differences in firm productivity than incentivized workers (Chun and Lee 2015). Managerial characteristics, namely openness to new ideas and willingness to take risks, are also found to be important determinants of adoption of HRM (Bloom and Van Reenen 2007).
Improving competition through regulating monopolies, relaxing trade barriers, and reducing overly restrictive labor regulations are beneficial in speeding the adoption of HRM in addition to promoting firm investments in training. Even when
firms know that HRM can improve practices, many are slow to adopt it. Weak product and labor markets with little competition allow badly managed, less productive firms to survive. Across countries and sectors, more competitive sectors have much higher levels of HRM (Bloom et al. 2013).
8.3 Matching workers and jobs
Labor market frictions by gender, race, caste, or socioeconomic status prevent individuals from entering occupations for which they have a comparative advantage and diminish productivity. These have long-term consequences for job development and reduce learning on the job. Improving the matching process, including eliminating search costs and difficulties in certifying skills, can improve worker opportunities to develop skills that better match their qualifications and capabilities to enhance aggregate productivity. Search frictions can account for up to nearly half of all overqualification mismatches (Figure 8.5).
Overqualification mismatches result in penalties in wage returns that can have long-term consequences to life-time earnings, not to mention dulled incentives to develop learning on the job (Sattinger and Hartog 2013; Allen and van der Velden 2001). Analysis indicates that individuals who are poorer and are female are more likely to be overqualified even after accounting for cognitive and noncognitive skills and level of education (Chua and Chun 2015). Thus, targeted labor market programs to reduce search frictions can help to improve matching and subsequent learning on the job. The effects can be substantial as analysis indicates that in urban Asian economies search frictions could be a major factor in up to half of all overqualification mismatches (Figure 8.5).
Employment services can reduce employment search costs resulting in more efficient allocation of labor—better matching people to jobs. One of the major barriers to search arises because workers, more often poor, do not live close to most of the available

70 Key Indicators for Asia and the Pacific 201570
jobs nor have adequate networks or information to find out about viable job opportunities. Providing information on available jobs can help. For example, in the rural Philippines the impact of attending a job fair increased the likelihood of looking for work in Manila (the capital and primary generator of jobs in the country) and formal employment 10 months after the job fair, pointing to the beneficial effects of providing job information (Beam 2013). Nevertheless, solving informational search frictions is not always the solution to improving job matches. As another study in the rural Philippines shows, facilitating job search abroad through information on available jobs and assistance with filling out forms and gathering documents provided no increased probability of international migration over a 2-year period (Beam, McKenzie, and Yang 2014).
Transport subsidies can reduce labor market search costs. Recent studies provide evidence that transport subsidies to the poor can raise the intensity of job search: in the US, intensity of search was 19% larger for those receiving subsidies relative to those who did not receive subsidies (Phillips 2014). In Ethiopia, transport subsidies increased the probability of employment by 6 percentage points in the short term (Franklin 2015). Such interventions hold promise, if administrative costs can be lowered while maintaining an effective targeting mechanism.
But what if workers themselves are not interested in the jobs offered? An evaluation in Jordan—an economy with high youth unemployment —found that a job-matching service that lowered search costs for both employers and youth was unsuccessful. Out of 1,000 possible matches based on employer requirements and youth skills, only nine matches were made in which job candidates accepted a job offer by a firm (Groh et al. 2015). A major reason was youth aspiration: they were primarily interested in high-status jobs and failed to even appear for job interviews that had low prestige.
Reasons for minimal job matches, however, may also suggest the need for other interventions that provide incentives to employers to hire workers or develop critical interviewing skills. But, a study that investigated subsidies to employers, training in noncognitive skills, and a combination of both, for female junior college graduates in Jordan found that subsidies had only short-term effects on employment but these were not sustained over the longer term (Groh et al. 2012). Such expectation mismatches could drive higher rates of youth unemployment in developing economies—such as Armenia, Georgia, and Fiji— with already high rates of unemployment and less informal or self-employment.
Helping youth to transition faster into decent jobs is complex. Greater evidence on effectiveness of interventions that can help youth to better adjust to labor market realities is needed to speed the transition into jobs where youth continue the learning process.
Standardizing skill certification and occupational licensing that uses standardized tests to measure skills will create greater incentives for individuals to develop real skills. These programs can have broad effects, better ensuring that TVET and higher education focus on developing critical and relevant occupational skills. In the US, occupational licensing has proven benefits for employment and pay outcomes (Gittleman, Klee, and Kleiner 2015). Standardizing skill certifications and occupational
Note: See Appendix 4 for detailed methodology. Source: ADB estimates using World Bank STEP Skills Measurement
Surveys for Armenia, People’s Republic of China (Yunnan Province), Georgia, the Lao PDR, Sri Lanka, and Viet Nam.
Figure 8.5: E�ects of EliminatingSearch Frictions on Labor Market Mismatch
0.2
.4.6
(Pre
dict
ed) I
ncid
ence
of M
ismat
ch
Actual Model Search only Search+
Well−matched UnderqualifiedOverqualified Unemployed

71A Smarter Future: Skills, Education, and Growth in AsiaSpecial Chapter
71
licensing improves matching between workers and employers. This is because it enables employers to obtain a clearer signal of true ability that cannot be assessed from non-standardized qualifications and certifications. This diminishes perverse incentives for individuals to undertake costly educational investments to signal their ability when employers resort to screening based on level of education because they are unable to differentiate between a vast number of possible candidates. These types of programs can significantly improve welfare, especially for those who could find it harder to pay for higher education, and help promising candidates to get into jobs that induce greater learning.
Occupational licensing and skill certification programs allow individuals to signal or demonstrate competency, with occupational licensing placing explicit entry barriers into certain occupations. However, in many economies certification has largely been ad hoc and based on passage through certain programs rather than on a true measure of skills possessed. These programs need to impose clear and credible international or national standards for skill recognition, certification, and occupational licensing programs.
Once the credibility of these programs is acknowledged, they can help individuals enhance their marketability and occupational mobility. Over the long term, they can generate greater incentives for firms to sponsor outside training if there are clear skill targets that are seen as important for workers to have to enhance their productivity (Acemoglu and Pischke 2000). Quality of national governance is paramount though, as bad regulation could see proliferation of fraudulent degrees and low-quality educational providers.27
Although skill-recognition programs are usually costly and require close coordination among
27 For example, in Pakistan a recent “university” was exposed as simply a diploma mill, developing very few student skills (Walsh 2015).
employers and vocational education institutes, they can potentially be outsourced to private companies. India Skills Private Limited, for example, has developed assessments and experts to measure skills in 72 vocations and trade with the intent of creating an independent and credible certification agency to measure the quality of technical skills. These types of firms hold promise in developing Asian economies— where weak institutions have eroded the value of many TVET certifications—by helping to reduce the “noise” that prevents individuals from clearly signaling their actual skills.
Standardized certification programs are increasingly feasible through modularized online learning and digital programs, circumventing traditional barriers and costs to access (Weise and Christensen 2014). Through these programs, individuals can update their skills, remain in work, and continue to learn, while having the flexibility to take the time they need to master a skill. Certification by this route requires self-discipline, but incentives tied to worker productivity and competitive labor markets can motivate workers to continue to learn and develop greater skills on the job. Coursera and EdX are just two examples of such programs. Nevertheless, these programs still need to evolve to ensure that they are accessible to a wider population not only by providing a more diverse set of skill training, but by ensuring they are available in a wider set of languages.
Online learning and digital certification programs are seemingly the future for “democratizing” learning on the job. With standardized and credible mechanisms for verifying certification, these programs can help lead to better matches between workers and jobs, and ensure continued learning on the job.

72 Key Indicators for Asia and the Pacific 201572
Section 9. Concluding RemarksTo meet current and future labor market demands and maintain human capital competitiveness in an increasingly globalized world, fostering cognitive and noncognitive skills is essential. These skills set the foundation to easily acquire new technical skills that enable adaptation to changing labor market and occupational demands. Technical skills are primarily important in high-skilled managerial and professional occupations and some nonroutine occupations, but each country must undertake careful assessments as technical skills largely depend on the industrial structure of labor market demands.
Enhancing skill development to improve the quality and relevancy of skill in developing Asia will take commitment, vision, and coordination of the disparate groups involved—policy makers, practitioners, researchers, students, families, and firms. To increase the relevancy and quality of skill development these groups will broadly want to direct their efforts along the following lines:
Policy makers must focus more on developing the basic preconditions for better governance of educational institutions to maximize efficiency of financing. This means policy makers must make key decisions on financing and curriculum design and delivery that are guided by robust data metrics for monitoring, performance evaluation, and ensuring accountability of teachers and schools to enhance skill outcomes. With the reduction in costs of management information systems that can aid in data collection and analysis, financial reasons should increasingly be less of a barrier to adoption.
Practitioners should design programs that incorporate theories of change and results from rigorous evidence. As the effectiveness of specific programs differs depending on cultural and social
conditions, pilot evaluations should be undertaken to provide critical information to develop workable and cost-efficient approaches that maximize skill outcomes before taking projects to scale. One promising solution is to invest in technologies with quality content as they provide the ability to democratize education, as hardware and software costs have declined dramatically and digital content development has cost-efficiency effects over large populations.
Researchers play an important role in filling gaps in knowledge to improve labor market relevant skills and identify how to structure investments in education for TVET and higher education. There needs to be greater consensus and attention to designing and measuring cognitive, noncognitive, computer and technical skills that capture absolute skill development as well as changes over time. Skill measures are inherently important for evaluating cost-effectiveness of educational investments that can lead to long-term labor market advantages. Developing metrics that optimally align incentives of teachers and schools with long-term enhanced learning outcomes can help to get more out of traditional forms of educational provision.
Students and families need to advocate for transparent and credible information that is critical to making more informed skill investment decisions that can impose accountability on schools and help students to achieve greater access to quality education.
Firms or industry representatives need to get involved in curricula design and delivery, particularly in ensuring accountability of training providers, as they are important beneficiaries of skill-linked productivity gains.

73Special Chapter
73
Appendix 1: Growth Regressions and ProjectionsData and data sources
Test scores as measures of cognitive skills
The Programme for International Student Assessment (PISA) and Trends in International Mathematics and Science Study (TIMSS) are two international surveys that provide comparable and timely data on reading, mathematics and science achievement of students across the globe. In the analysis, all the PISA years from 2000 to 2012 were covered, while TIMSS covers 2003 to 2011. In both sets of data the average age range is 14–15 years in which skills are tested. The skill measure used was the average of science-mathematics scores averaged over the entire time period considered within a country and is intended to capture a country’s level of cognitive skills.
To date, around 70 economies have taken part in the assessments. The two tests use similar structure and scaling methods to measure the aptitude of the students on a 1,000-point scale. To demonstrate the importance of top-level skills and basic-level skills in long-term economic development, the threshold of Hanushek and Woessmann (2015) was used to examine top-level skills (the share of students scoring above 600) and basic-level skills (the share of students scoring 400–600).
Years of schooling (Barro-Lee)
The Barro-Lee dataset provides cross-county information on educational attainment for 5-year intervals covering 1950 to 2010. As data is not complete for all countries, interpolation and extrapolation was used to fill in missing observation years. This study uses the average years of schooling of the population aged 15 to 64 over 1970–2010 to represent the quantity of education held by the workforce over the time period of analysis. While initial human capital in 1970 was also examined, it did not drastically alter the signs or magnitudes of the effects.
PWT’s gross domestic product per capita
The National Income data for the period 1970–2010 were extracted from the Penn World Table (PWT) database version 8.1. PWT database provides cross- country information on relative levels of income, output, inputs and productivity, with period coverage depending on the release. In this study the output-side real GDP per capita at chained PPPs across countries and over time was used.
Growth model
A standard growth model used by Hanushek and Woessmann (2008) examines the effect of the quantity and quality of education on growth. Specifically the following model was estimated:
= 0 + 1 2 3+ + + (1)
where Yi is the average GDP per capita growth rate for country i for the period 1970–2010. G is the variable used to denote the initial income level (GDP per capita) of the country, S denotes the average years of schooling from 1970–2010 of a particular country, T represents the standardized average test score of a country and is the error term capturing the variability not explained by the explanatory variables. Initial income is included as it is one of the most important controls in standard growth regression models.
To capture the relative importance of both top- and basic-level skills on economic growth, the average test score in equation (1) was replaced with the share of students with scores above 600 denoted by H for country i and the share of students with scores between 400 and 600 denoted by M.
= 0+ 1 2 3 4+ ++ +S (2)

74 Key Indicators for Asia and the Pacific 201574
Output from the regression estimates is displayed in Appendix table 1. The country sample excludes countries affected by civil war (e.g. eastern European economies and those of the former Soviet Union) over 1970–2010 resulting in a final sample of 59 countries. These regressions are not causal. Many other important factors that could also explain growth are omitted from the regression framework. However, inclusion is difficult due to the small sample size. However, the effect of skills (test scores) on growth tends to be substantially robust to inclusion of additional factors such as property rights, trade openness, and regional controls. The results are also robust to dropping the East Asian Tiger economies (the Republic of Korea; Singapore; Taipei,China; Hong Kong, China) from the sample suggesting that there is a strong relationship between skills and growth.
To investigate the importance of technical vocational education and training (TVET) programs in fostering higher economic growth the following regression model is run:
= 0+ 1 2 3+ + +S V ε (3)
In this regression, V is the share of secondary TVET students, controlling for the initial GDP per capita G and average years of schooling S for country i.
Added-variable plots
The plots are graphical representations of the regression results shown in Appendix table 1. In Figure 2.8 the residual of years of schooling is graphed with the residual of growth after taking out the effect of initial income (GDP per capita in 1970) with the slope corresponding to estimates between years of schooling and growth in model 1. The figure implies that an additional year of schooling is significantly associated with a 0.39 percentage point increase in the average long-run growth.
In Figure 2.10 (left panel) the residual of skills (test scores) is graphed with the residual of growth after taking out the effect of initial income and years of schooling with the slope corresponding to estimates between skill and growth in model 2. In Figure 2.10 (right panel) the residual of years of schooling is graphed with the residual of growth after taking out the effect of initial income and skills with the slope corresponding to estimates between
Appendix Table 1: Result: Schooling, Skills and the Relationship with Economic Growth
Variables (1) (2) (3) (4) (5)Average GDP per capita Growth Rate (1970–2010)
Initial Income (1970 GDP per capita) -0.219*** -0.245*** -0.263*** -0.248*** -0.234***
(0.048) (0.043) (0.049) (0.046) (0.056)Average years of schooling (1970–2010) 0.390*** 0.141 0.167 0.126 0.393***
(0.102) (0.091) (0.114) (0.092) (0.114)Average test score (standardized) 1.491*** 1.329***
(0.230) (0.329)Share of students with a score of 400–600 3.254***
(0.917)Share of students with a score of above 600 5.772***
(1.024)Share of secondary TVET students 0.011
(0.013)Constant 1.597** 3.968*** 3.792*** 1.459** 1.493**
(0.630) (0.556) (0.741) (0.559) (0.630) Observations 59 59 59 59 54Regional Dummies NO NO YES NO NOR-squared 0.287 0.506 0.531 0.506 0.2763
Robust standard errors in parentheses*** p<0.01, ** p<0.05, * p<0.1Source: ADB estimates using data from Penn World Table Version 8.1, Barro-Lee Dataset (1970–2010), PISA and TIMSS science-mathematics test scores
(2000–2012), and World Bank EdStats, using approach by Hanushek and Woessmann (2008).

75A Smarter Future: Skills, Education, and Growth in AsiaSpecial Chapter
75
years of schooling and growth in model 2. The two graphs suggest that skills matter for growth more than the years of schooling as the positive effect of education nearly disappears once controlling for skills. Concretely, a one standard deviation increase in test scores (equivalent to 100 points on PISA or TIMSS) is associated with a 1.49 percentage point increase in long-run growth.
Figure 5.3 displays the residual of the share of secondary TVET students and the residual of growth after taking out the effect of initial income with the slope corresponding to estimates between share of secondary TVET students and growth in model 5. The figure shows that the share of students enrolled in secondary TVET is not significantly associated with long-term growth after controlling for years of education and initial income.
Growth projections
Various educational reforms were simulated under the assumption that it takes 15 years for any reform to be implemented. These reforms aimed to raise the average years of schooling of the workforce and/or performance on international tests (PISA and TIMSS) following a similar methodology to Hanushek and Woessmann (2010).
The following are GDP growth scenarios used in the simulations:
Scenario 1. Raise the average years of schooling of each developing Asian country to the average years of schooling of high-income OECD economies. This is equivalent to increasing the years of schooling of developing Asian countries by 3.6 years on average, from 8 years to 11.6 years.
Scenario 2. Raise the share of students with score above 400 to OECD level (85%)
Scenario 3. Raise the share of students with score above 400 and 600 to OECD levels (85% and 15%, respectively)
Using estimates from an updated growth model (1970–2010), each developing Asian economy starts the reform in 2015 and full implementation occurs by 2030. It requires many years for the full effect of the reforms on economic growth to take place as human capital in the workforce must be slowly replaced. Following Hanushek and Woessmann (2010) it is assumed that the working life for individuals in the economy is 40 years and the specific phases of reforms take place as follows:
Phase 1 (2015–2030). The first phase is the educational reform implementation phase where the effect of the reform on GDP growth is assumed to be linear. The additional growth in GDP per capita brought about by the reform in year t is given by:
= 1 t –201515
+Growth coef Test score* * *t t–1working life
where the growth coefficient comes from the above regression results (model 4 for scenarios 1–3).
Phase 2 (2031–2055). The education reform is fully implemented, and achievement of all subsequent students remains at the new level. However, there are still workers with initial levels of skills and education being replaced in retirement by new entrants to the labor force with higher level of skills. During this phase, the additional growth in GDP per capita in year t is given by:
= 1 +Growth coef Test score* *t t–1working life
Phase 3 (2056–2070). The first 15 labor-market cohorts, which only partially benefited from the education reform, are replaced by those who benefited from the fully enacted education reform:
= 1 – –Growth coef Test score* *t ( t–40 t–41)+ t–1working life
Phase 4 (2070+). During this final stage the whole workforce has gone through the reformed education system. Thus the annual growth rate is now increased by the constant long-run growth effect :

76 Key Indicators for Asia and the Pacific 201576
=Growth coef Test score*t
GDP growth with and without reform
Without reform: the economy grows at the constant potential GDP growth rate (equivalent to predicted Y in equation (2)) such that:
GDP t (1+potential growth)no reform
GDP t–1no reform
= *
With reform: there would be an additional growth t on top of the potential GDP growth rate:
GDP t (1 + t)reform GDP t–1reform= *
Total effect of the reform to 2045
The total value of any reform is computed as the sum of the discounted values of the annual differences between the GDP with reform and the GDP without reform:
(GDP tTotal Value of reform = (1 + discount rate)–(t–2015)reform GDP tno reform– *∑
2045
t = 2015
){2015, 2045}
Where the discount rate is assumed to be 5%. This formula was used to calculate the cumulative percentage increase in GDP per capita levels by 2045 as shown in figure 2.11.
Total Value of reform
GDP per capita2015
Percent Change = *{2015,2045} 100

77Special Chapter
77
Appendix 2: Education and Skill Development System Indicators Construction and Analysis
The questionnaire used as the basis for the indicators was constructed based on a thorough literature review of research that found causal evidence between certain types of programs and enhanced outcomes, particularly in terms of measured skills (primarily cognitive). The literature review is detailed in much of Sections 3 through 8. The questionnaire was designed to assess a country’s performance in different areas of skill development covering both national policy legislation and investments and for different education levels: basic and upper secondary, technical vocational education and training (TVET), and higher education. Questions covered the five major areas discussed: governance, financial efficiency, educational quality, educational access, and learning on the job. The survey questionnaire was designed to systematically encode a country’s level of development where higher values were associated with better quality or breadth of implementation for areas that are seen as potentially important for skill development, but where no objective data exists.
To fill out the questionnaire, a team of consultants undertook a desk review of government reports and country documents for 78 economies for basic education and 22 developing member economies for all other skill areas. Referenced documents included UNESCO, World Bank SABER, UNEVOC, OECD and ministry of education websites. For aspects of the questionnaire where information was difficult to obtain or there were conflicting reports by different sources, country experts were consulted. The most recent source documents and databases were used in the documentation process (i.e. within the last 5 years).
Indicators of skill development
Indicators that were used in the analysis and presented in Table 3.1 were created using simple averages of encoded values from the questionnaire
and objective data that comes from primarily the UNESCO Institute of Statistics (UIS) and the World Bank’s World Development Indicators (WDI) database. The composites were generated using what were viewed as logical groupings for various indicators given the literature review, but future work could consider construction based on factor analysis that would provide groupings based on actual variations in the data. These composite indicators are described in further detail below. However, for a detailed mapping of indicators into values and a country by country documentation of the various indicators please see the background paper of Chun, Elepano, and Florentino (2015).
Public educational expenditure as % of GDP (National)
This is an objective indicator drawn from the WDI database and covers the entire educational sector as there were fewer values available for different levels of education.
Data for evidence-based policy decisions (National)
This is a composite indicator of data needed to make the right types of skill investment decisions at the national level. Specifically, this requires getting detailed data on numbers enrolled in different levels of education and for different types of technical training, attendance rates, and whether an economy measures skill outcomes either at a nationally or internationally comparable basis. It also entails collection of data on disadvantaged populations (whether by gender, ethnicity, or socioeconomic status) that are important for targeting disadvantaged groups. Finally, the indicator captures collection of data on key occupations demanded by the labor market through vacancy rate data that can inform the need for different types of technical

78 Key Indicators for Asia and the Pacific 201578
skill investments. For each of the indicators, both the method (i.e. paper-based or digital) and the timeliness of data collection (i.e. annually versus less than annually) were evaluated. The indicator also includes a component that measures the availability of legislation or a designated institution that oversees the audit of data collection, manner of audit, and the percentage of schools subjected to audits.
Information (Basic education, TVET, higher education)
These are composite indicators of data used for imposing accountability that allows for monitoring and evaluation. It captures four types of data:
1. Enrollments, dropouts, attendance, certification, skill outcomes, graduation and employment rates that are generated at the school or teacher level.
2. Public reporting of different educational inputs such as teachers, equipment, extracurricular programs that are supposed to be delivered based on public financing, and the level at which the information is available (regional, district, or school level).
3. Inputs on the degree to which information is provided directly to parents on student performance as well as school performance (compared to other schools in a region) as measured by nationally standardized exams. This is seen as essential for parents to monitor and impose accountability on schools, and to monitor the performance of their child to make sure they get the right type of help.
4. Availability of career guidance counselling at different education levels. This information is important to improve individual decision making on the types of skills to invest in and to enhance access to higher levels of education.
Similar to data for evidence-based policy decisions, it evaluates whether data are collected digitally. This informs the ease at which critical analysis are conducted and policies tied to accountability are imposed. Accountability requires greater timeliness in data collection than collection that occurs for national level policy decisions (e.g. quarterly).
Early childhood education (ECE) (National)
This is a composite indicator that includes the amount spent on ECE as a share of GDP obtained from the UIS database. It also includes indicators that capture the extent to which ECE is broadly provided for the general public and the start age at which provision occurs.
Emphasizing technical education (National)
This indicator, drawn from the UIS database, captures the share of secondary students enrolled in TVET out of all secondary students. These ideally would be supported by measures of financing given to TVET both at the secondary and tertiary levels, but currently this type of data was not found to be available.
Competitive markets (Learning on the job)
This comprises two composite indicators that come from the Global Competitiveness Indicators database (2015) representing quality of institutions in terms of contract enforcement and market competition (composite indicators 1 and 6).
Firm training investments (Learning on the job)
This is an indicator of average share of firms investing in training as drawn from the World Bank Enterprise Surveys where the latest year of data for a country was used.

79A Smarter Future: Skills, Education, and Growth in AsiaSpecial Chapter
79
Matching workers to jobs (Learning on the job)
This is a composite indicator that captures if the country has skill recognition and occupational licensing programs, employment programs that help facilitates worker and employer job matching, and government-supported job websites.
Gender equality (Basic and upper secondary, TVET, higher education, learning on the job)
This indicator is based on objective data that uses (or creates) the gender parity index (GPI) from UIS and WDI on females versus males enrolled in different levels of education and participating in the labor force. The GPI is then converted into a measure where less absolute deviations from equality measures greater gender equality.
Rural–urban parity (Basic and upper secondary education, TVET)
The indicator for basic and upper secondary education is an objective indicator based on the parity of enrollment rates at the primary and secondary levels for basic education between rural and urban areas. This is currently based on data from the WDI. Ideally this indicator would also include measures in the quality of infrastructure, teacher, and extracurricular inputs.
The indicator for TVET is based on the availability of short-term and long-term training programs that are located across the country and therefore provides more equality in access between rural and urban areas.
Public–private partnerships (Basic and upper secondary education, TVET, higher education)
This is a composite indicator capturing the availability of public financing for private schools to supply public education and contracting out of curriculum design.
Curriculum content (Basic and upper secondary education, TVET, higher education)
This is a composite indicator that captures the inclusion of academic programs that are meant to foster critical thinking, problem solving and noncognitive skills in the curriculum. The indicators also include provision of remedial and enrichment programs that may help to better match student capabilities. Support and provision for the development of basic financial, marketing and computer skills are also included.
Teacher certification, wages, incentives (Basic and upper secondary education, TVET, higher education)
This is a composite indicator that captures the degree to which teachers are certified. For basic education this is objective data (based on the UIS) of number of trained teachers at basic and secondary education. The extent to which the wages offered to teachers are higher or lower than other professional occupations were also collected to capture competitiveness of the occupation. While wage data ideally is based on actual values, no database was identified that contained available data for different occupations over a large set of countries. For TVET and higher education these indicators included whether there were clear policies that require faculty members to have a certain level of industry experience (TVET) or have produced a certain number of publications (higher education). Future development of this indicator would ideally better capture aspects of merit-based hiring policies, human resource management, and quality of institutions generating certification or entry into the education profession to better measure teacher quality.
It also examines the practice of policies that provide training and bonus incentives to teachers based on enrollment, performance and welfare data. This indicator also includes an indicator capturing the stability of key education officials in terms of their length of stay in office as this is seen as integral

80 Key Indicators for Asia and the Pacific 201580
to generating accountability over the long term rather than being driven by political factions.
Technology and software usage (Basic and upper secondary education, TVET, higher education)
This composite indicator is comprised of an indicator of sufficient availability of computers (i.e. to cover at least 10% of the student population) and the availability of software to teach coursework. Future development of this indicator would capture the quality of content that is available to teach students—in particular the usage of computer adaptive learning content that is provided in an engaging format (e.g. gamification).
Financial aid (Basic and upper secondary education, TVET, higher education)
This indicator captures the availability of financial aid programs such as scholarships, stipends, and grants for students in the basic, TVET, and higher education policy levels. At basic and upper secondary education levels it also examines whether there are conditional cash transfers and school feeding programs in place. Future indicators could better capture the quality of these programs in terms of targeting mechanisms.
Counselling and mentoring (Basic and upper secondary education)
This indicator captures the availability of mentoring programs and psychological counselling programs provided in the school. These programs are seen as essential to limit disruptive classroom behavior.
Examples of indicators
Indicators in the database are of two types. The first is objective. It includes measures such as public educational expenditures as a % of GDP and measures of gender parity in enrollment. The second type of indicator is ordinal. Two examples of ordinal
measures assign scores to each country based on the level of development of a given area are provided below:
Example 1: How does government institutions in (COUNTRY) collect and store data on student enrollment rates
0 = No collection;
1 = Paper-based collection which is collected occasionally and/or without good compliance;
2 = Paper-based collection which is collected consistently with good compliance;
3 = Digital collection (MIS) which is held at state level rather than national level;
4 = National-level collection (MIS) which is collected consistently over time and with high levels of compliance.
Example 2: In (COUNTRY), how integrated is noncognitive skill development in the primary education curriculum?
0 = Skill not systematically part of curriculum
1 = Skill only systematically integrated in curriculum for all schools as an elective
2 = Skill systematically integrated into curriculum for all schools
Construction of standardized (Composite) indicators
As indicators have varying ranges of values, the following three step procedure was used to group these measures and subsequently standardize them.

81A Smarter Future: Skills, Education, and Growth in AsiaSpecial Chapter
81
Step 1: Convert all indicators to range from 0 to 1 whether objective or ordinal
For each country, i, and indicator type, m, create a revised indicator IR:
={ }
Step 2: Consolidate indicators into composite where relevant. Composite will range from 0 to 1.
The composite indicator, ICi, is constructed by
taking the average value of the indicator by summing up over the relevant group, C, of revised indicators:
=∑ є
Step 3: Standardize each composite indicator to have mean 0 and standard deviation 1:
= ( )
National basic education inputs and cognitive skill outcomes
This discussion corresponds to the results reported in Figure 3.1. To examine whether different inputs at the national level and for basic education are important to enhanced skill outcomes for a country for ages 14–15, as measured by the latest PISA or TIMSS test scores, TestScore, available between 2003 and 2012, in a given country, i, regression analysis was conducted. More specifically, for each standardized indicator, I, some of which are composite, m≠n (m={1,2,……16}; n={1,2,……16}) the following regressions were run:
TestScorei mnIim nmIin i i εi
Where TestScore is the test score for the latest PISA or TIMSS test taken in a given country, G represents log GDP per capita of the country for 2012 or latest year available, S captures average years of schools for those aged 15–65 in 2010 and is the error term. The average mn over all regressions was obtained and the number of times for which the coefficient on mn was significant at the 10% level was counted. Given that mn was significant in the regressions more than half the time the indicator was identified as being statistically important to national skill development outcomes.
Only two indicators at any given time were included due to potential multicollinearity that arises from having too many indicators included in a single regression and because of the small total sample size. The results of the regressions cannot be explained by low variations in the data as the coefficient of variation of the indicators all had values that were over 20 with the exception of gender equality.
In extensions to the analysis, the relationship of indicators with test scores were examined for those in the bottom 20% of socioeconomic status and those students whose mother has at most a primary education. The results did not fundamentally change in terms of the effects on these distributions. Interaction terms were also tested to examine if different policies could be complementary in terms of producing higher skills. However, the interaction terms were not found to have any statistically significant effect on test scores. The effects of different indicators in economies with more information compared to those with less information were also examined. Only in economies with low information did country support for public–private partnerships have a statistically negative relationship with test scores, suggesting that it may be more difficult to implement effective public-private partnerships when there is too little information.

82 Key Indicators for Asia and the Pacific 201582
The average coefficient estimates for each indicator from the pairwise regressions were then multiplied by the difference between the average of the three economies in Asia with the highest values (the Republic of Korea; Singapore; and Taipei,China), I CS
T3 , and the average of the three economies with the lowest values for any given indicator (most often Bangladesh, Cambodia, and Pakistan), ICS
B3 . This was meant to simulate what a low ranked Asian economy could gain in terms of skills by improving inputs up to the level of one of the best performing economies in terms of skills. More specifically, the following equation represents the value of estimates displayed in Figure 3.1 for each indicator m:
= 1� �m �Imn15
15CST3
n=1
ICSB3∑ — �
In the regressions, the information indicator was decomposed into the five different components of information including information for evidence-based policy plus the four components of information
described above for basic education. Only after the multivariate regressions were run were the estimates for information then averaged to construct a single indicator of information. Similarly, the indicator for teacher incentives and the indicator for teacher certification and wages were separate indicators in the regressions, but were subsequently combined into a single indicator of teacher certification, wages, and incentives based on the average of the estimates of these two indicators.
TVET and higher education inputs and educational outcomes
While it remains important to identify how different legislation, quality of policy implementation and breadth of investments for TVET and higher education may lead to better skill development or labor market outcomes, no data that could adequately examine these relationships across a large enough set of economies were identified. This remains an important area for further research.

83Special Chapter
83
Appendix 3: Key Metrics for Targeted Policy, Accountability, and Private Decisions
Appendix Table 3: Key Metrics for Targeted Policy, Accountability and Private DecisionsLevel Topic Variable Type of decision making
Policy Accountability (school)
Accountability (teacher)
Private
National or Regional This type of data is ideally obtained at an aggregate regional level and is collected on an annual basis and for a minimum of several dierent grade levels in basic education, for detailed skill areas in TVET and higher education. It can serve as a basis for evaluating how the education system is performing and setting financing priorities. The data is ideally designed to be able to link people with specific types of skills training to labor market outcomes at a broad level.
Educational supply of skills This data helps to assess how well the education system is in producing skilled individuals.
Level of disaggregation: Grade Degree type (if TVET or higher education) School type {private or public} Gender Disadvantaged
Private cost of provision per student Public cost of provision per student Share enrolled in school type {public or private} Grade (if basic education) Degree type (if TVET or higher education) Total students enrolled (by gender and disadvantaged) Total students dropped out (by gender and disadvantaged) Total students passed or graduated (by gender and disadvantaged) Total potential students enrolled who could have sat for certificate or licensing exam (if TVET or higher education)
Total students sitting for certificate or licensing exam (if TVET or higher education) Total students passing certificate or licensing exam (if TVET or higher education) Measured average skills on nationally or internationally standardized tests Cognitive Noncognitive Technical (if TVET or higher education)
Skill supply and labor market outcomes This type of data could be gathered through labor force survey or administrative data given tracking of students or cohorts. This data is essential to properly assess how well graduates of certain types of education and technical skills are matching labor market demands. It can also help individuals make better skill investment decisions. It requires su�ciently sampling a large enough population in key education-technical skill areas. It ideally will be gathered at a minimum 1, 5, 10 years after completion of education to assess career trajectories.
Level of disaggregation: Highest level of education completed Type of technical training Received certificate or license Gender Disadvantaged at age 15
Total in main activity: in school working employed formally in occupation related to skill trained employed temporarily in occupation related to skill trained employed formally not in skill trained unemployed not in labor force
Occupation related to main field of training (if applicable) Level of education needed for occupation Measured workplace skills (e.g. PIAAC; World Bank STEP)Average wages
Skill demand This type of data is gathered to assess the types of occupations (and hence skills) that are in demand by enterprises. It is ideally gathered on an annual basis at a minimum. It could be collected from administrative enterprise data, industry groups, or more costly enterprise survey data. Note that skills and education measures may not have to be updated on an annual basis, but should reflect current education and skill needs. Useful examples are the US O*NET and World Bank STEP employer surveys.
Level of disaggregation: Industry-occupationTotal employedTotal hiringTotal firingTotal vacancies (open for 1, 3, 6+ months)Average wages
continued on next page

84 Key Indicators for Asia and the Pacific 201584
Appendix Table 3: Key Metrics for Targeted Policy, Accountability and Private DecisionsLevel Topic Variable Type of decision making
Policy Accountability (school)
Accountability (teacher)
Private
Minimum education required:Minimum skills required: Cognitive Noncognitive Technical Other workplace skills
School This type of data is at the school level and is important for imposing school accountability and for helping individuals make more informed decisions about which schools to attend or whether to invest in further education. It is ideally gathered on an annual basis.
Year established Location Type of school {public, private} Private cost of provision per student Public cost of provision per student Net revenue - costs Tuition fee Financial budget expenditures Number of teachers Number of teachers with relevant industry experience (if TVET) Number of classrooms Internet connectivity Number of working computers Principal identity Principal degree/certification Principal years of teaching experience Principal years of school management experience Principal years of other experience Number of classes o�ered and type Number of students at start of school year/program Accreditation level (if TVET or higher education) Number of large firm industry linkages (if TVET) Number of peer-reviewed journal publications (if higher education) Number of patents, trademarks or copyrights received (if higher education) School/Degree teacher attendance rates Level of disaggregation for student indicators: Disadvantaged Female
Total applied (if TVET or higher education) Total accepted (if TVET or higher education) Total enrolled Total dropped out Total graduated Total students sitting for certificate or licensing exam (if TVET or higher education) Total students passing certificate or licensing exam (if TVET or higher education) Measured average skills on nationally or internationally standardized tests (upon entry)a Cognitive Noncognitive Technical (if TVET or higher education)
Measured average skills on nationally or internationally standardized tests (upon exit) Cognitive Noncognitive Technical (if TVET or higher education)
Total in main activity (1, 5, 10 years after graduation): in school working employed formally in occupation related to skill trained employed temporarily in occupaton related to skill trained employed formally not in skill trained unemployed not in labor force
Number entering occupation related to main field of training (1, 5, 10 years after graduation; if applicable)
Derived indicator of principal or dean value added Derived indicator of school value added
continued on next page

85A Smarter Future: Skills, Education, and Growth in AsiaSpecial Chapter
85
Appendix Table 3: Key Metrics for Targeted Policy, Accountability and Private DecisionsLevel Topic Variable Type of decision making
Policy Accountability (school)
Accountability (teacher)
Private
Teacher This type of data is used for teacher accountability. It is aimed at incentivizing teachers to improve their performance. It also is potentially essential for principals or administrators to impose better management practices, identify which teachers are underperforming and figure out solutions to improve performance.
Birth year Certification or degree of training Skills training completed Years of teaching experience Years of other experience Years of relevant industry/professional experience (if TVET or higher education) Last year of industry experience (if TVET) Number of peer-reviewed journal publications (if higher education) Number of patents, trademarks or copyrights received (if higher education) Class level or subject taught Level of disaggregation for student indicators: Disadvantaged Female
Total enrolled Class attendance rate (if basic education) Class dropout rates Class pass rates Students evaluations of teacher performance Measured average skills on nationally or internationally standardized tests (upon entry)a Cognitive Noncognitive Technical (if TVET or higher education)
Measured average skills on nationally or internationally standardized tests (upon exit) Cognitive Noncognitive Technical (if TVET or higher education)
Derived indicator of teacher value addeda Student This type of data is important for teachers, parents and individuals to evaluate individual student performance. It helps to better ensure that individuals are learning and figure out stop-gap measures for those that are not. It also is useful information for targeting merit based scholarships and providing programs to help those that are disadvantaged. It envisions student linked data overtime that allows for performance tracking.
Birth year Gender Socioeconomic status Attendance rate (if basic education) Classes passed Classes repeated Disciplinary infractionsYear skill training receivedSkill training received (if TVET or higher education)Skill certification test taken (if TVET or higher education) Skill certification test passed (if TVET or higher education) Measured average skills on nationally or internationally standardized tests (and year of test) Cognitive Noncognitive Technical (if TVET or higher education)
a Entrance exams are not necessary if one is able to derive a measure of value added based on historical test performance of students or skills at entry into institution or classrooms. This requires a database containing unique student identification that allow tracking over time.
Note: Most metrics should be collected on a yearly or monthly basis. Some key metrics such as those for accountability should be carefully constructed to ensure they capture true value added or quality of schools.

86 Key Indicators for Asia and the Pacific 201586
Appendix 4: Notes for Various Tables and FiguresEducational investment estimates
Footnote 1
All estimates are in 2011 $PPP using 2010 as a base reference group. Private estimates are computed using actual education expenditure of households in 2010 for 24 economies using the World Bank’s Global Consumption Database. Average education share of household expenditure across the 24 Asian economies for each income group (low, middle, upper) is used to estimate education expenditure of economies without data by multiplying the share with the national accounts estimates of household final consumption expenditure (HFCE). Public education expenditure estimates are computed using the WB EdStats’ education expenditures as a share of GDP. If data does not exist, the average shares for each income group are assumed to apply. Private and public estimates for 2014 are derived by multiplying the 2010 estimated education expenditure with the ratio of HFCE 2014 to HFCE 2010 or with the ratio of general government consumption expenditure (GGCE) 2014 to GGCE 2010, respectively.
Data collection across countries
Box table 2.2.1
To assess the frequency and detail of collection on labor force data across countries, the following surveys were utilized: United States—Current Population Survey (CPS); the Republic of Korea—Economically Active Population Survey (EAPS); Armenia—Household’s Integrated Living Conditions Survey (HILCS); Cambodia—Cambodia Socio-Economic Survey (CSES); India—Employment and Unemployment Survey; Indonesia—SAKERNAS; for Pakistan, the Philippines, Thailand, and Viet Nam, countries’ respective Labor Force Surveys (LFS) were used. The labor force survey for the PRC refers to the Annual Sample Survey on Labour
Force. Details on the data collected using this survey were based on published survey results found in the China Statistical Yearbook, China Labour Statistical Yearbook, and Tabulation on the 2010 Population Census of the People’s Republic of China.
To assess the level of collection on enterprise data across countries, the following surveys were used: United States—Occupational Employment Statistics; the Republic of Korea—Labor Force Survey of Establishments; Armenia—Report on Number of Employees and Wages/Salaries; Cambodia—Economic Census of Cambodia; India—Annual Survey of Industries; Indonesia—Annual Manufacturing Survey; Pakistan—Census of Manufacturing Industries; Philippines—Quarterly Survey of Philippine Business and Industry; Thailand—Annual Survey on Thailand’s Productivity and Industries Performance; and Viet Nam—Enterprise Survey. Vacancy information for the United States is made available through its monthly Job Openings and Labor Turnover Survey (JOLTS). For the Philippines, this data is collected quarterly through the Labor Turnover Survey (LTS).
Cells with darker circles refer to a higher frequency or a greater degree of detail in collecting data from labor force and enterprise surveys. For the collection rate criterion, the darkest shade implies that data collection is done on a quarterly or monthly basis while the lightest shade implies collection is done sporadically. It should be noted that the Employment and Unemployment Survey in India, from which labor force data is collected, is done consistently but only once every 5 years. For the criteria on occupational code detail and industrial code detail, the darkest shade indicates that data collection is done at the 5- or 6-digit level, while the lightest shade indicates that data collection is only made at the broadest level (1-digit) or are not collected in the surveys. It is worthwhile to note that in the Philippines, occupational and industrial codes are based on the Philippine Standard Occupational

87A Smarter Future: Skills, Education, and Growth in AsiaSpecial Chapter
87
Classification and the Philippine Standard Industrial Classification, respectively, which disaggregates occupations and industries at a higher level, but the LFS only reports at the 2-digit level. For the education major criterion, the darker shade implies greater detail in the collection of data on fields of study (at least 10 fields of education) while the lighter shade implies data collection is only done at a very broad level (less than 10 fields of education). The criterion on occupational groups refer to the availability of a broad classification of employees’ occupations within the firm. The darker shade indicates that the survey reports at least three categories of occupation groups, while the lighter shade indicates that the survey does not collect data on occupation groups, or only reports, at the most, two categories of occupation groups.
Computerization probabilities
Figure 2.12
To estimate computerization probabilities the following process was undertaken.
Step 1: Probabilities of future occupational destruction due to computerization were obtained from Frey and Osborne (2013). These probabilities are provided at the 5- or 6-digit US standard occupational classification (SOC).
Step 2: For various labor force surveys country occupational codes were mapped into the 2 or 3 digit International Standard Classification of Occupations 2008 (ISCO-08).
Step 3: Given loss of detail from going from 5- to 6-digit SOC down to 3- or 2-digit ISCO-08 and the mapping not being 1 to 1, employment weights from the US Census were utilized to redistribute and collapse down occupation codes while maintaining the overall values of the employment distribution.
Step 4: Only occupations that were in regular wage employment, indicating stable employment typically in more formalized firms and with some sort of contract or promise of longer term work, were considered as open to computerization. The reasoning was that in developing economies there are many temporary wage and informal self-employment type labor that are considered more to be jobs of last resort. Hence, these type of jobs probably are less likely to face job destruction as they are low pay and short term.
Step 5: Define cut-off probabilities for risk of job to computerization as follows:
High risk: greater than or equal to 0.70Mid risk: 0.30 to 0.70
These estimates are believed to be fairly conservative. If temporary wage and informal self-employment were also considered to be open to job destruction, then many estimates would indicate that more than 30% of jobs in a country would be at a high risk for job destruction.
PISA student and school surveys
PISA 2012 micro data was used to estimate the effects of various school policies in addition to physical, teaching, and family inputs on various outcomes over a large set of economies. The average sample size per country ranges from 4,000–34,000 and approximately 43 economies were covered.
Factors affecting test scores
To estimate effects on student reading, mathematics, or science test score, TestScore, outcomes around age 15 standard regressions on the student sample were run which took the form for each student i, belonging to school j, in country k:
= +TestScoreijk ijk+ ijk+ µSjk+ k+ εijk (1)

88 Key Indicators for Asia and the Pacific 201588
In this equation is the main coefficient of interest representing the relationship of the student or school level indicator, I, on test score outcomes abstracting away from other factors. X is a series of controls that include gender, current age, indicators for age first started school (less than or equal to 4, 5, or 6 versus age 7), indexed socioeconomic status, indexed socioeconomic status squared, and indicators for mother’s education (secondary degree or university degree). S represents school indicators capturing school ownership (public versus private) and school location (rural versus urban). are country fixed effects. Regressions were run separately for OECD and Developing Asia28 samples and standard errors are clustered at the school level.
Figure 4.4
The main indicators of interest were school accountability and school autonomy indicators. In this regression school autonomy is an indexed score provided in the public PISA dataset that is based on a series of questions regarding the school’s ability to make decisions in terms of curriculum design, hiring or firing of teachers, financial allocations, etc. This was converted into a 0 or 1 indicator based on a school autonomy measure being above 0.5 standard deviations (top one-third). Accountability is an indicator representing whether student and school performance data is shared publicly.
Figure 5.2
The estimates from start age were displayed based on the standard regression framework of equation (1). Since few students attend school after age 7 these students were dropped from the sample.
28 Includes Hong Kong, China; Indonesia; Kazakhstan; the Republic of Korea; Malaysia; Shanghai, the PRC; Singapore;Taipei,China; Thailand; and Viet Nam.
Figure 6.2
The main indicator of interest was whether the school offered extra remedial, enrichment mathematics courses, or an extra non-differentiated-to-skill-level course, compared to offering none at all.
Figure 6.3
Curriculum difficulty is an index score of a student’s perceived difficulty with the mathematics curriculum. It is based on a question on whether a student agrees with the following statement: “Sometimes the course material is too hard.”
Figure 6.4
The main indicators of interest were cognitive activation and teacher support. Cognitive activation is an indicator derived from student responses in terms of the frequency with which teachers used cognitive activation strategies in teaching mathematics lessons. Cognitive activation strategies include: asking questions that make students reflect on the problem, giving problems that require students to think for an extended time, asking students to decide on their own procedures for solving complex problems, presenting problems for which there is no immediately obvious method of solution, presenting problems in different contexts to know whether students understood the concepts being taught, helping students learn from their mistakes, asking students to explain how they solved a problem, presenting problems that require students to apply the concepts they have learned in new contexts, and giving problems that can be solved in several different ways. Choices to these questions ranged from “almost or almost always” to “never or rarely”. A dummy variable was constructed using this indicator, where 1 corresponds to teachers using cognitive activation strategies frequently (“almost always” or “often”) and 0 corresponds to teachers rarely utilizing cognitive activation strategies (“sometimes” or “never or rarely”).

89A Smarter Future: Skills, Education, and Growth in AsiaSpecial Chapter
89
Teacher support is an indicator based on responses to a series of questions on the frequency with which mathematics teachers fulfilled the following: showed an interest in every student’s learning, gave extra help when students needed it, helped students with their learning, continued teaching until the students understood the lesson, and gave students an opportunity to express opinions. Choices to these questions ranged from “every class” to “never or hardly ever”. A dummy variable was constructed using this indicator, where 1 corresponds to teachers providing support at a greater frequency (“every class” or “most classes”) and 0 corresponds to teachers not usually being able to provide support (“some classes” or “never or hardly ever”).
An index was created using the 4 possible combinations of cognitive activation strategies and teacher support. The highest value in the index indicates that mathematics teachers provide both cognitive activation strategies as well as support to their students, while the lowest value in the index indicates mathematics teachers providing neither cognitive activation strategies nor support to their students.
Figure 6.5
The main indicator of interest was based on questions that ask the current status of mathematics teachers (full-time or part-time) and their professional qualifications. Teachers working full-time were given a weight of 1, while teachers working part time were given a weight of 0.75. These were used to compute the share of teachers that are fully certified by a local authority in their main field of assignment; percentage of mathematics teachers with a bachelor’s degree or a master’s degree, regardless of the field of study; percentage of mathematics teachers with a bachelor’s or master’s degree in mathematics, physics, or engineering; percentage of mathematics teachers with a bachelor’s degree or a master’s degree in the field of education.
Factors affecting college aspirations
To examine factors affecting college aspirations a probit model was estimated:
P(Cijk= 1) ( ijk+ ijk+ µSjk+ k) (2)
In this equation C is an indicator capturing whether a student has strong college aspirations. It is based on a question on the extent to which students agree to the following statement: “Trying hard at school will help me get into a good college.” A dummy variable was created using this indicator, where 1 corresponds to a student strongly agreeing with the statement. Similar to equation (1), X is a series of controls that include gender, current age, indicators for age first started school (less than or equal to 4, 5, or 6 versus age 7), indicators for mother’s education (secondary degree or university degree), and skill level as measured by the average PISA test scores for mathematics and science. S represents school indicators capturing school ownership (public versus private) and school location (rural versus urban). are country fixed effects.
Figure 7.5
The main indicators of interest were those that reveal the relationship between socioeconomic status and college aspirations. In the regression, socioeconomic status was divided into three categories using as cut-offs the 20th and 80th percentile of the distribution for each country. The socioeconomic status indicators was adopted from the PISA 2012 index of economic, social and cultural status (ESCS). It is a composite index derived from the following indicators: highest occupational status of parents, highest educational level of parents, and home possessions. The index of home possessions includes indicators on family wealth, home educational resources and cultural possessions. A more detailed description of the ESCS is available on the OECD website (http://www.oecd.org/pisa/keyfindings/pisa-2012-results.htm).

90 Key Indicators for Asia and the Pacific 201590
Factors affecting student time spent studying
To examine factors affecting the number of hours, H, students spend on school work per week the following regression was run:
= +Hijk ijk+ ijk+ µSjk+ k+ εijk (3)
Similar to equation (1) X is a series of controls that include gender, current age, indicators for age first started school (less than or equal to 4, 5, or 6 versus age 7), indexed socioeconomic status, indexed socioeconomic status squared, and indicators for mother’s education (secondary degree or university degree). S represents school indicators capturing school ownership (public versus private) and school location (rural versus urban). are country fixed effects.
The total number of hours spent on school work was derived from a series of disaggregated questions capturing: time spent doing homework or other materials assigned by the teacher, doing homework with somebody overlooking and providing help if necessary, working with a personal tutor, attending out of school classes organized by a commercial company, and practicing content from school lessons by working on a computer.
Figure 7.8
The main indicator of interest captures parental monitoring. It was created using the number of reported hours spent studying with a parent or other family members. A dummy variable was created using this indicator, where 1 corresponds to parents devoting at least 5 hours a week on studying with the child, and 0, otherwise.
Differences in educational inputs
Figure 7.10
To examine differences in educational inputs, Q, that provide some insights into gaps in educational access that may be due to school locational differences the following regressions was run:
= +Qjk jk+ k+ εjk (4)
In this equation U is an indicator for whether a student resides in an urban location. Non-urban areas are defined as villages, hamlets, rural areas or small towns with populations no greater than 15,000. Urban areas are defined as towns or cities with populations greater than 15,000. are country fixed effects.
Three different types of education inputs were examined: teacher quality, instructional material, and school infrastructure. Teacher quality was captured by an indexed score corresponding to school responses that stated that the lack of qualified science teachers, the lack of qualified mathematics teachers, the lack of qualified English teachers and the lack of qualified teachers of other subjects were not problematic. Instructional material was captured by an indexed score of school responses capturing that shortage or inadequacy of science laboratory equipment, instruction materials such as textbooks, computers for instruction, internet connectivity, computer software for instruction, and library materials was not problematic. School infrastructure quality was captured by an indexed score of school responses that stated that the shortage or inadequacy of school buildings and grounds, heating or cooling and lighting systems, and instructional space (e.g. classrooms) was not problematic.

91A Smarter Future: Skills, Education, and Growth in AsiaSpecial Chapter
91
World Bank STEP worker surveys
The World Bank STEP worker survey sample covered six economies in Asia (Armenia, Georgia, PRC (Yunnan Province), the Lao PDR, Sri Lanka, and Viet Nam) for workers aged 15–65. These surveys were run in 2012–2013. Viet Nam covered only Ho Chi Minh and Ha Noi. As only the Lao PDR and Sri Lanka covered rural areas, analysis concentrated on urban areas only.
A multinomial logistic model was run to estimate the probability that a person, i, was matched, overqualified, underqualified or unemployed based on observed job outcomes and worker responses to the level of qualification that is needed to perform the job the worker is in. This model is based on the model described in Chua and Chun (2015). More, precisely the model took the following form where k is the outcome observed for person i:
Pr (Matchi = k) (Si k+ Xi ' k+ Zj' k+ c) [1+ ∑k = 2 (Si k+ Xi ' k+ Zj' k+ c)]–14 (5)
In this model, the systematic component of utility is comprised of search variables, Si, human capital and socioeconomic characteristics of the worker, Xi, features of the local labor market jdenoted by Zj and a set of country dummies c. The
unobserved component of the utility is assumed to follow a Type-I extreme value distribution. Search captures variables that report a worker’s access to information on vacancies and ability to demonstrate abilities. Human capital include indicators for education, experience, cognitive and noncognitive skills. Socioeconomic status includes indicators at age 15.
Figure 8.5
The multinomial logistic model in equation (5) was used to estimate the predicted job-qualification match outcomes pooling across the 6 economies and using population weights. Actual refers to the true distribution of match types, while model refers to the model prediction described in equation (5). Search simulates the predicted distribution of job matches that is expected to occur if search costs are eliminated. Search + refers to the predicted distribution of jobs that is expected to occur if search costs are eliminated and if parental education is moved to at least a postsecondary level and socioeconomic status at age 15 is moved to at least a middle income level. This is meant to capture that low socioeconomic status can create greater difficulties for workers to search for jobs due to locational and network differences that are not picked up by other variables in the model.

92 Key Indicators for Asia and the Pacific 201592
Surveys UsedArmenia National Statistical Service. 2007, 2010, and 2013. Household’s Integrated Living Conditions Survey.Cambodia National Institute of Statistics. 2003, 2009, 2011, 2012, and 2013. Socio-Economic Survey.China Institute For Income Distribution. 2002 and 2007. China Household Income Project.Fiji Bureau of Statistics. 2005 and 2011. Employment/Unemployment Survey.India National Sample Survey Organization. 2000, 2005, and 2012. National Sample Survey: Employment
and Unemployment.Indonesia BPS - Statistics Indonesia. 2003, 2008, and 2013. SAKERNAS. Kazakhstan Agency of Statistics. 2003 and 2013. Labor Force Survey.Pakistan Bureau of Statistics. 2002, 2004, and 2013. Labor Force Survey.Philippines National Statistics Office, 2004, 2009, and 2013. Labor Force Survey.Thailand National Statistics Office. 2000, 2005, and 2010. Labor Force Survey.Viet Nam General Statistics Office. 2009 and 2013. Labor Force Survey.
93Special Chapter
93
Abbott, B. et al. 2013. Education Policy and Intergenerational Transfers in Equilibrium. NBER Working Paper 18782. Cambridge, MA: National Bureau of Economic Research (NBER).
Acemoglu, D. and J-S. Pischke. 1998. Why Do Firms Train? Theory and Evidence. Quarterly Journal of Economics. 113(1). pp. 79–119.
Acemoglu, D. and J-S. Pischke. 1999. Beyond Becker: Training in Imperfect Labour Markets. The Economic Journal. 109(453). pp. 112–142.
Acemoglu, D. and J-S. Pischke. 2000. Certification of Training and Training Outcomes. European Economic Review. 44 (4–6). pp. 917–927.
ADB. 2013. Key Indicators for Asia and the Pacific 2013. Manila: Asian Development Bank.
ADB. 2014. Innovative Strategies in Technical and Vocational Education and Training for Accelerated Human Resource Development in South Asia. Manila: Asian Development Bank.
Afridi, F., S. Li, and Y. Ren. 2015. Social Identity and Inequality: The Impact of China’s Hukou System. Journal of Public Economics. 123. pp. 17–29.
Agrawal, A., C. Catalini, and A. Goldfarb. 2014. Some Simple Economics of Crowdfunding. In J. Lerner and S. Stern, eds. Innovation Policy and the Economy Volume 14. Chicago, IL: The University of Chicago Press.
Alatas, V. 2011. Program Keluarga Harapan: Impact Evaluation of Indonesia’s Pilot Household Conditional Cash Transfer Program. Washington, DC: World Bank.
Alesina, A., M. Battisti, and J. Zeira. 2015. Technology and Labor Regulations: Theory and Evidence. NBER Working Paper 20841. Cambridge, MA: National Bureau of Economic Research (NBER).
Allen, J. and R. van der Velden. 2001. Educational Mismatches versus Skill Mismatches: Effects on Wages, Job Satisfaction, and On-The-Job Search. Oxford Economic Papers. 53(3). pp. 434–452.
Almeida, R. and P. Carneiro. 2009. The Return to Firm Investments in Human Capital. Labour Economics. 16(1). pp. 97–106.
Almeida, R. and R. Aterido. 2010. Investment in Job Training: Why are SMEs Lagging So Much Behind? Policy Research Working Paper. No. 5358. Washington, DC: World Bank.
Almlund, M. et al. 2011. Personality Psychology and Economics. In E. Hanushek, S. Machin, and L. Woessmann, eds. Handbook of the Economics of Education Volume 4. Amsterdam: Elsevier–North Holland.
Ambient Insight. 2015. 2014 International Learning Technology Investment Patterns. Monroe, WA: Ambient Insight.
Andrabi, T. et al. 2011. Do Value-Added Estimates Add Value? Accounting for Learning Dynamics. American Economic Journal: Applied Economics. 3(3). pp. 29–54.
Andrabi, T., J. Das, and A.I. Khwaja. 2014. Report Cards: The Impact of Providing School and Child Test Scores on Educational Markets. HKS Working Paper No. RWP14-052. Cambridge, MA: Harvard Kennedy School.
Association of American Colleges and Universities. 2014. How Liberal Arts and Science Majors Fare in Employment: A Report on Earnings and Long-Term Career Paths. Washington, DC: Association of American Colleges and Universities.
Attanasio, O. and K.M. Kaufmann. 2014. Education Choices and Returns to Schooling: Mothers’ and Youths’ Subjective Expectations and their Role by Gender. Journal of Development Economics. 109. pp. 203–216.
Attanasio, O., A. Kugler, and C. Meghir. 2011. Subsidizing Vocational Training for Disadvantaged Youth in Colombia: Evidence from a Randomized Trial. American Economic Journal: Applied Economics. 3(3). pp. 188–220.
Autor, D. 2014. Polanyi’s Paradox and the Shape of Employment Growth. NBER Working Paper
References

94 Key Indicators for Asia and the Pacific 201594
20485. Cambridge, MA: National Bureau of Economic Research (NBER).
Autor, D. and D. Dorn. 2013. The Growth of Low Skill Service Jobs and the Polarization of the U.S. labor market. American Economic Review. 103(5). pp. 1553–1597.
Avery, C. and T. Kane, 2004. Student Perceptions of College Opportunities: The Boston COACH Program, In C. Hoxby, ed. College Choices: The Economics of Where to Go, When to Go, and How to Pay For It. Chicago, IL: The University of Chicago Press.
Azoulay, P., J. Graff-Zivin, and J. Wang. 2010. Superstar Extinction. Quarterly Journal of Economics.125(2). pp. 549–589.
Bacher-Hicks, A., T. Kane, D. Staiger. 2014.Validating Teacher Effect Estimates Using Changes in Teacher Assignments in Los Angeles. NBER Working Paper 20657. Cambridge, MA: National Bureau of Economic Research (NBER).
Badgeville. 2015. https://badgeville.com/ (accessed July 27, 2015).
Baird, S., C. McIntosh, and B. Ozler. 2011. Cash or Condition? Evidence from a Cash Transfer Experiment. Quarterly Journal of Economics. 126. pp. 1709–1753.
Bandiera, O. et al. 2014. Women’s Empowerment in Action: Evidence from a Randomized Controlled Trial in Africa. Economic Organisation and Public Policy Discussion Papers No. 50. London, UK: The London School of Economics and Political Science, Suntory and Toyota International Centres for Economics and Related Disciplines
Banerjee, A. and E. Duflo. 2008. What Is Middle Class about the Middle Classes around the World? Journal of Economic Perspectives. 22(2). pp. 3–28.
Banerjee, A. et al. 2007. Remedying Education: Evidence From Randomized Experiments in India. Quarterly Journal of Economics. 122(3). pp. 1235–1264.
Banerjee, A. et al. 2010. Pitfalls of Participatory Programs: Evidence from a Randomized Evaluation in Education in India. American
Economic Journal: Economic Policy. 2(1). pp. 1–30.
Barnham, T.,K. Macours, and J. Maluccio. 2013. Boys’ Cognitive Skill Formation and Physical Growth: Long-Term Experimental Evidence on Critical Ages for Early Childhood Interventions. American Economic Review. 103(3). pp. 467–471.
Barrera-Osorio, F. and D. Filmer. 2014. Incentivizing Schooling for Learning: Evidence on the Impact of Alternative Targeting Approaches. Journal of Human Resources, forthcoming.
Barrera-Osorio, F. and D. Raju. 2014. Evaluating the Impacts of Public Student Subsidies to Low-cost Private Schools in Pakistan. Journal of Development Studies, forthcoming.
Barrera-Osorio, F. et al. 2013. Leveraging the Private Sector to Improve Primary School Enrolment: Evidence from a Randomized Controlled Trial in Pakistan. Working Paper.
Barro, R. and J-W. Lee. A New Data Set of Educational Attainment in the World, 1950–2010. Journal of Development Economics. 104. pp. 184–198.
Beam, E. 2013. Information and Labor Markets in the Philippines. Doctoral Dissertation, The University of Michigan.
Beam, E., D. McKenzie, and D. Yang. 2014. Unilateral Facilitation Does Not Raise International Labor Migration from the Philippines. NBER Working Paper 20759. Cambridge, MA: National Bureau of Economic Research (NBER).
Belleflamme, P., N. Omrani, and M. Peitz. 2015. The Economics of Crowdfunding Platforms. Information Economics and Policy. 33. pp. 11–28.
Belley, P. and L. Lochner. 2007. The Changing Role of Family Income and Ability in Determining Educational Achievement. Journal of Human Capital. 1 (1). pp. 37–89.
Belzil, C. and M. Leonardi. 2013. Risk Aversion and Schooling Decisions. Annals of Economics and Statistics. 111/112. pp. 35–70.
Benhassine, N. et al. 2014. Turning a Shove into a Nudge? A “Labeled Cash Transfer” for Education. Working Paper.

95A Smarter Future: Skills, Education, and Growth in AsiaSpecial Chapter
95
Bergman, P. 2015. Parent-Child Information Frictions and Human Capital Investment: Evidence from a Field Experiment. CESifo Working Paper No. 5391. Munich: CESifo Group Munich.
Bergman, P. and M. Hill. 2015. The Effects of Making Performance Information Public: Evidence from Los Angeles Teachers and a Regression Discontinuity Design. CESifo Working Paper No. 5383. Munich: CESifo Group Munich.
Bessen, J. 2015. Toil and Technology. Finance & Development. 52(1). Washington, DC: International Monetary Fund.
Bettinger, E. and B. Long. 2009. Addressing the Needs of Underprepared Students in Higher Education: Does College Remediation Work? Journal of Human Resources. 44(3). pp. 736–771.
Black, S. and L. Lynch. 2001. How to Compete: The Impact of Workplace Practices and Information Technology on Productivity. The Review of Economics and Statistics. 83(3). pp. 434–445.
Blattman, C., N. Fiala, and S. Martinez. 2014. Generating Skilled Self-employment in Developing Countries: Experimental Evidence from Uganda. Quarterly Journal of Economics. 129(2). pp. 697–752.
Blinder, A. and A. Krueger. 2013. Alternative Measures of Offshorability: A Survey Approach. Journal of Labor Economics. 31. pp. S97 – S128.
Bloom, N. and J. Van Reenen. 2007. Measuring and Explaining Management Practices Across Firms and Countries. Quarterly Journal of Economics. 122(4). pp. 1351–1408.
Bloom, N. and J. Van Reenen. 2010. Why do Management Practices Differ Across Firms and Countries? Journal of Economic Perspectives. 24(1). pp. 203–224.
Bloom, N. et al. 2012. Management Practices across Firms and Countries. Academy of Management Perspectives. 26 (1). pp. 12–33.
Bloom, N. et al. 2013. Does Management Matter? Evidence from India. Quarterly Journal of Economics. 128(1). pp. 1–51.
Bloom, N. et al. 2015. Does Management Matter in Schools? The Economic Journal. 125 (584). pp. 647–674.
Bloom, N., R. Sadun, and J. Van Reenen. 2015. Management as a Technology? Working Paper. Stanford, CA: Stanford University.
Blundell, R. et al. 1999. Human Capital Investment: The Returns from Education and Training to the Individual, the Firm and the Economy. Fiscal Studies. 20(1). pp. 1–23.
Borghans, L. et al. 2009. Gender Differences in Risk Aversion and Ambiguity Aversion. Journal of the European Economic Association. 7(2–3). pp. 649–658.
Bowen, W. et al. 2014. Interactive Learning Online at Public Universities: Evidence from a Six-Campus Randomized Trial. Journal of Policy Analysis and Management. 33(1). pp. 94–111.
Brodaty, T., R.J. Gary-Bobo, and A. Prieto. 2014. Do Risk Aversion and Wages Explain Educational Choices? Journal of Public Economics. 117. pp. 125–148.
Bruni, M, L. Luch, and S. Kuoch. 2013. Skills Shortages and Skills Gaps in the Cambodian Labour Market: Evidence from Employer Skills Needs Survey. ILO Asia-Pacific Working Paper Series. Geneva: International Labour Organization.
Cadena, B.C. and B.J. Keys. 2015. Human Capital and the Lifetime Costs of Impatience. American Economic Journal: Economic Policy. 7 (3). pp. 126–153.
Cappelli, P. and D. Neumark. 2001. Do “High-Performance” Work Practices Improve Establishment-Level Outcomes? Industrial and Labor Relations Review. 54(4). pp. 737–775.
Card, D. et al. 2011. The Labor Market Impacts of Youth Training in the Dominican Republic. Journal of Labor Economics. 29(2). pp. 267–300.
Carneiro, P., J.J. Heckman, and E.J. Vytlacil. 2011. Estimating Marginal Returns to Education. American Economic Review. 101(6). pp. 2754–81.
Castleman, B.L. and L. Page. 2015. Summer Nudging: Can Personalized Text Messages and Peer Mentor Outreach Increase College Going
96 Key Indicators for Asia and the Pacific 201596
among Low-income High School Graduates? Journal of Economic Behavior and Organization. 115. pp. 144–160.
Caucutt, E.M. and L. Lochner. 2006. Borrowing Constraints on Families with Young Children. In Innovation in Education. pp. 39–48. Cleveland: Federal Reserve Bank of Cleveland.
Caucutt, E.M. and L. Lochner. 2012. Early and Late Human Capital Investments, Borrowing Constraints, and the Family. NBER Working Paper 18493. Cambridge, MA: National Bureau of Economic Research (NBER).
Caucutt, E.M., L. Lochner, and Y. Park. 2015. Correlation, Consumption, Confusion or Constraints: Why Do Poor Children Perform so Poorly. NBER Working Paper 21023. Cambridge, MA: National Bureau of Economic Research (NBER).
Chaudhury, N. and D. Parajuli. 2010. Conditional Cash Transfers and Female Schooling: The Impact of the Female School Stipend Programme on Public School Enrolments in Punjab, Pakistan. Applied Economics. 42 (28). pp. 3565–3583.
Chaudhury, N., J. Friedman, and J. Onishi. 2013. Philippines Conditional Cash Transfer Program Impact Evaluation 2012. Washington, DC: World Bank.
Chaudhury, N. et al. 2006. Missing in Action: Teacher and Health Worker Absence in Developing Countries. Journal of Economic Perspectives. 20(1). pp. 91–116.
Cheon, B. Y. 2014. Skills Development Strategies and the High Road to Development in the Republic of Korea. In J.M. Salazar-Xirinachs, I. Nübler, and R. Kozul-Wright, eds. Transforming economies: making industrial policy work for growth, jobs and development (pp. 213-238). Geneva: ILO.
Chetty, R., J. Friedman, and J. Rockoff. 2014. Measuring the Impacts of Teachers II: Teacher Value-Added and Student Outcomes in Adulthood. American Economic Review. 104(9). pp. 2633–2679.
Cho, Y. et al. 2013. Gender Differences in the Effects of Vocational Training: Constraints on Women
and Drop-Out Behavior. Policy Research Working Paper No 6545. Washington, DC: World Bank.
Chua, K. and N. Chun. 2015. In Search of a Better Match: Qualification Mismatches in Developing Asia. Background Paper for the KI 2015. Manila: Asian Development Bank.
Chun, N. and S. Lee. 2015. Bonus Compensation and Productivity: Evidence from Indian Manufacturing Plant-level Data. Journal of Productivity Analysis. 43(1). pp. 47–58.
Chun, N. and P. Villanueva. 2015. Human Resource Management, SME Performance, and Worker Wages in Viet Nam. Background Paper for the KI 2015. Manila: Asian Development Bank.
Chun, N. and M. Watanabe. 2012. Can Skill Diversification Improve Welfare in Rural Areas? Evidence from Bhutan. Journal of Development Effectiveness. 4(2). pp. 214–234.
Chun, N., M.A. Elepano, and L. Florentino. 2015. Indicators of Skill Development Across Asia. Background Paper for the KI 2015. Manila: Asian Development Bank.
Cornelissen, T. et al. 2012. Assessing Heterogeneity in the Effects of a Universal Childcare Intervention using Marginal Treatment Effect Estimates.
Cowen, T. and A. Tabarrok. 2014. The Industrial Organization of Online Education. American Economic Review. 104(5). pp. 519–522.
Cristia, J.P. et al. 2012. Technology and Child Development: Evidence from the One Laptop per Child Program. IZA Discussion Paper No. 6401. Bonn: Institute for the Study of Labor.
Cunha, F. and J.J. Heckman. 2007. The Technology of Skill Formation. American Economic Review. 97(2). pp. 31–47.
Cunha, F. and J.J. Heckman. 2008. Formulating, Identifying and Estimating the Technology of Cognitive and Noncognitive Skill Formation. Journal of Human Resources. 43(4). pp. 738–782.
Cunha, F. and J.J. Heckman. 2009. The Economics and Psychology of Inequality and Human

97A Smarter Future: Skills, Education, and Growth in AsiaSpecial Chapter
97
Development. Journal of the European Economic Association. 7(2–3). pp. 320–364.
Cunha, F., J.J. Heckman, and S. Schennach. 2010. Estimating the Technology of Cognitive and Noncognitive Skill Formation. Econometrica. 78(3). pp. 883–931.
Dahl G. and L. Lochner. 2012. The Impact of Family Income on Child Achievement: Evidence from the Earned Income Tax Credit. American Economic Review. 102(5). pp. 1927–1956.
Das, J. et al. 2013. School Inputs, Household Substitution, and Test Scores. American Economic Journal: Applied Economics. 5(2). pp. 29–57.
De Arcangelis, G. et al. 2015. Directing Remittances to Education with Soft and Hard Commitments: Evidence from a Lab-in-the-field experiment and new product take-up among Filipino Migrants in Rome. Journal of Economic Behavior & Organization. 111. pp. 197–208.
De Mel, S., D. McKenzie, and C. Woodruff. 2009. Are Women More Credit Constrained? Experimental Evidence on Gender and Microenterprise Returns. American Economic Journal: Applied Economics. 1(3). pp. 1–32.
De Mel, S., D. McKenzie, and C. Woodruff. 2014.Business Training and Female Enterprise Start-Up, Growth, and Dynamics: Experimental Evidence from Sri Lanka. Journal of Development Economics. 106. pp. 199–210.
De Melo, G., A. Machado, and A. Miranda. 2014. The Impact of a One Laptop per Child Program on Learning: Evidence from Uruguay. IZA Discussion Paper No. 8489. Bonn: Institute for the Study of Labor
Directorate-General of Budget, Accounting and Statistics (DGBAS). 2013. Statistical Yearbook. http://eng.stat.gov.tw (accessed March 2015).
Dohmen, T. et al. 2010. Are Risk Aversion and Impatience Related to Cognitive Ability? American Economic Review. 100(3). pp. 1238–60.
Dranove, D. and G. Jin. 2010. Quality Disclosure and Certification: Theory and Practice. Journal of Economic Literature. 48(4). pp. 935–963.
Duflo, E. 2001. Schooling and Labor Market Consequences of School Construction in Indonesia: Evidence from an Unusual Policy Experiment. American Economic Review. 91 (4). pp. 795–813.
Duflo, E. 2012. Women Empowerment and Economic Development. Journal of Economic Literature. 50 (4). 1051–79.
Duflo, E., P. Dupas, and M. Kremer. 2015. School Governance, Teacher Incentives, and Pupil–Teacher Ratios: Experimental Evidence from Kenyan Primary Schools. Journal of Public Economics. 123. pp. 92–110.
Duflo, E., R. Hanna, and S. Ryan. 2012. Incentives Work: Getting Teachers to Come to School. American Economic Review. 102(4). pp. 1241–1278.
Dustmann, C. and C. Meghir. 2005. Wages, Experience and Seniority. Review of Economic Studies. 72 (1). pp. 77–108.
Dustmann, C. and U. Schonberg. 2012. What Makes Firm-Based Vocational Training Schemes Successful? The Role of Commitment. American Economic Journal: Applied Economics. 4(2). pp. 36–61.
Dustmann, C., P. Puhani, and U. Schonberg. 2014. The Long-Term Effects of Early Track Choice. IZA Discussion Paper7897. Bonn: Institute for the Study of Labor.
Eichhorst, W. et al. 2012. A Roadmap to Vocational Education and Training Systems around the World. IZA Discussion Paper No. 7110. Bonn: Institute for the Study of Labor.
Feenstra, R., R. Inklaar, and M. Timmer. The Next Generation of the Penn World Table. www.ggdc.net/pwt (accessed September 2015).
Felipe, J., A. Mehta, and C. Rhee. 2014. Manufacturing Matters… But It’s the Jobs that Count. ADB Working Paper Series No. 420. Manila: Asian Development Bank.
Ferraz, C., F. Finan, and D. Moreira. 2012. Corrupting Learning: Evidence from Missing Federal Education Funds in Brazil. 96(9–10). pp. 712–726.

98 Key Indicators for Asia and the Pacific 201598
Ferreira, F. and J. Gignoux. 2011. The Measurement of Inequality of Opportunity: Theory and an Application to Latin America. Review of Income and Wealth. 57(4). pp. 622-657.
Field, E., S. Jayachandran, and R. Pande. 2010. Do Traditional Institutions Constrain Female Entrepreneurship? A Field Experiment on Business Training in India. American Economic Review.100(2). pp. 125–129.
Filmer, D. and N. Schady. 2011. Does More Cash in Conditional Cash Transfer Programs Always Lead to Larger Impacts on School Attendance? Journal of Development Economics. 96(1). pp. 150–157.
Fiszbein, A. and N. Schady. 2009. Conditional Cash Transfers: Reducing Present and Future Poverty. Washington, DC: World Bank.
Flores-Lagunes, A., C. Choe, and S-J. Lee. 2015. Do Dropouts with Longer Training Exposure Benefit from Training Programs? Korean Evidence Employing Methods for Continuous Treatments. Empirical Economics. 48 (2). pp. 849–881.
Franklin, S. 2015. Location, Search Costs and Youth Unemployment: A Randomized Trial of Transport Subsidies in Ethiopia. CSAE Working Paper No. 2015–11. Centre for the Study of African Economies, University of Oxford.
Frey, C.B. and M.A. Osborne. 2013. The Future of Employment: How Susceptible are Jobs to Computerization? Oxford Martin Programme on the Impacts of Future Technology, University of Oxford.
Galdo, J. and A. Chong. 2012. Does the Quality of Public-sponsored Training Programs Matter? Evidence from Bidding Processes Data. Labour Economics. 19 (6). pp. 970–986.
Gentile, E. and S. Imberman. 2012. Dressed for Success? The Effect of School Uniforms on Student Achievement and Behavior. Journal of Urban Economics. 71(1). pp. 1–17.
Gittleman, M., M.A. Klee, and M.M. Kleiner. 2015. Analyzing the Labor Market Outcomes of
Occupational Licensing. NBER Working Paper 20961. Cambridge, MA: National Bureau of Economic Research (NBER).
Glewwe, P. and M. Kremer. 2006. Schools, Teachers, and Education Outcomes in Developing Countries. In E. Hanushek and F. Welch, eds. Handbook of the Economics of Education Volume 2. Amsterdam: Elsevier–North Holland.
Glewwe, P. et al. 2013. School Resources and Educational Outcomes in Developing Countries: A Review of the Literature from 1990 to 2010. In P. Glewwe, ed. Education Policy in Developing Countries. Chicago, IL: The University of Chicago Press.
Goos, M. 2013. How the World of Work is Changing: A Review of the Evidence. Geneva: International Labour Organization.
Goos, M., A. Manning, and A. Salomons. 2014. Explaining Job Polarization: Routine-Biased Technological Change and Offshoring. American Economic Review. 104(8). 2509–26.
Greenfield, M. and T. Vander Ark. 2014. Boosting Impact: Why Foundations Should Invest in Education Venture Funds. Cornerstone Capital Group: Journal of Sustainable Banking and Finance. 1(10). pp. 46.
Groh, M. et al. 2012. Soft Skills or Hard Cash? The Impact of Training and Wage Subsidy Programs on Female Youth Employment in Jordan. Policy Research Working Paper No. 6141. Washington, DC: World Bank.
Groh, M. et al. 2015. Testing the Importance of Search Frictions and Matching Through a Randomized Experiment in Jordan. IZA Journal of Labor Economics. 4 (7). DOI 10.1186/s40172-015-0022-8.
Gunther, I. and A. Launov. 2012. Informal Employment in Developing Countries: Opportunity or Last Resort? Journal of Development Economics. 97(1). pp. 88–98.
Hanushek, E. 2013. Economic Growth in Developing Countries: The Role of Human Capital. Economics of Education Review. 37. pp. 204–212.

99A Smarter Future: Skills, Education, and Growth in AsiaSpecial Chapter
99
Hanushek, E. and M. Raymond. 2005. Does School Accountability Lead To Improved Student Performance? Journal of Policy Analysis and Management. 24 (2). pp. 297–327.
Hanushek, E. and S. Rivkin. 2003. Does Public School Competition Affect Teacher Quality? In C. Hoxby, ed. The Economics of School Choice. Cambridge, MA: National Bureau of Economic Research (NBER).
Hanushek E. and S. Rivkin. 2012. The Distribution of Teacher Quality and Implications for Policy. Annual Review of Economics. 4. pp. 131–157.
Hanushek, E. and L. Woessmann. 2008. The Role of Cognitive Skills in Economic Development. Journal of Economic Literature. 46 (3). pp. 607–668.
Hanushek, E. and L. Woessmann. 2010. The High Cost of Low Educational Performance: The Long-Run Economic Impact of Improving PISA Outcomes. Paris: OECD Publishing.
Hanushek, E. and L. Woessmann. 2011. How Much do Educational Outcomes Matter in OECD Countries? Economic Policy. 26(67). pp. 427–491.
Hanushek, E. and L. Woessmann. 2015. Universal Basic Skills: What Countries Stand to Gain. Paris: OECD Publishing.
Hanushek, E., A. Link, and L. Woessmann. 2013. Does School Autonomy Make Sense Everywhere? Panel estimates from PISA. Journal of Development Economics.104. pp. 212–232.
Hanushek, E., L. Woessmann, and L. Zhang. 2011. General Education, Vocational Education, and Labor-Market Outcomes over the Life-Cycle. NBER Working Paper 17504. Cambridge, MA: National Bureau of Economic Research (NBER).
Hart Research Associates. 2013. It Takes More than a Major: Employer Priorities for College Learning and Student Success. Washington, DC: The Association of American Colleges and Universities.
Harvard Kennedy School Social Impact Bond Technical Assistance Lab. 2013. Social Impact Bonds: A Guide for State and Local Governments.
Cambridge, MA: Harvard Kennedy School of Government.
Hasan, R. et al. 2012. Trade Liberalization and Unemployment: Theory and Evidence from India. Journal of Development Economics. 97 (2). pp. 269–280.
Hastings, J. and J. Weinstein. 2008. Information, School Choice, and Academic Achievement: Evidence from Two Experiments. Quarterly Journal of Economics.123(4). pp. 1373–1414.
Hastings, J., C.A. Neilson, A. Ramirez, and S. Zimmerman. 2015. (Un)Informed College and Major Choice: Evidence from Linked Survey and Administrative Data. NBER Working Paper 21330. Cambridge, MA: National Bureau of Economic Research (NBER).
He, F., L. Linden, and M. MacLeod. 2007. Helping Teach What Teachers Don’t Know: An Assessment of the Pratham English Language Program. Cambridge, MA: Abdul Latif Jameel Poverty Action Lab (J-PAL).
Heckman, J.J. 2006. Skill Formation and the Economics of Investing in Disadvantaged Children. Science. 312(5782). pp. 1900–1902.
Heckman, J.J. and D. Masterov. 2007. The Productivity Argument for Investing in Young Children. Review of Agricultural Economics. 29(3). pp. 446–493.
Heckman, J.J., L. Lochner, and C. Taber. 1998. Explaining Rising Wage Inequality: Explorations with a Dynamic General Equilibrium Model of Labor Earnings with Heterogeneous Agents. Review of Economic Dynamics. 1 (1). pp. 1–58.
Heckman, J.J., R. Pinto, and P. Savelyev. 2013. Understanding the Mechanisms through Which an Influential Early Childhood Program Boosted Adult Outcomes. American Economic Review. 103(6). pp. 2052–86.
Heckman, J.J., J. Stixrud, and S. Urzua. 2006. The Effects of Cognitive and Noncognitive Abilities on Labor Market Outcomes and Social Behavior. Journal of Labor Economics. 24(3). pp. 411–482.

100 Key Indicators for Asia and the Pacific 2015100
Heckman, J.J. et al. 2010. The Rate of Return to the High Scope Perry Preschool Program. Journal of Public Economics. 94 (1–2). pp. 114–128.
Helmers, C. and M. Patnam. 2011. The Formation and Evolution of Childhood Skill Acquisition: Evidence from India. Journal of Development Economics. 95(2). pp. 252–266.
Helmers, C. and M. Patnam. 2014. Does the rotten child spoil his companion? Spatial Peer Effects Among Children in Rural India. Quantitative Economics. 5(1). pp. 67–121.
Hicks, J. et al. 2013. Vocational Education Voucher Delivery and Labor Market Returns: A Randomized Evaluation among Kenyan Youth. enGENDER IMPACT: The World Bank’s Gender Impact Evaluation Database. Washington, DC: World Bank.
Hirshleifer, S. et al. 2015. The Impact of Vocational Training for the Unemployed: Experimental Evidence from Turkey. The Economic Journal, forthcoming.
Hoff, K. and P. Pandey. 2006. Discrimination, Social Identity, and Durable Inequalities. American Economic Review.96(2). pp. 206–211.
Holt, C. and S. Laury. 2002. Risk Aversion and Incentive Effects. American Economic Review. 92(5). pp. 1644–1655.
Horn, M. and H. Staker. 2014. Blended: Using Disruptive Innovation to Improve Schools. San Francisco, CA: Jossey-Bass.
Hoxby, C. 2014. The Economics of Online Postsecondary Education: MOOCs, Nonselective Education, and Highly Selective Education. American Economic Review.104(5). pp. 528–533.
Hoxby, C. and C. Avery. 2013 The Missing “One-Offs”: The Hidden Supply of High-Achieving, Low-income Students. Brookings Papers on Economic Activity. 46 (1). pp. 1–65.
Hoxby, C. and S. Turner. 2013. Expanding College Opportunities for High- Achieving, Low Income Students. SIEPR Discussion Paper No. 12– 014. Stanford, CA: Stanford Institute for Economic Policy Research.
Huang, W. et al. 2014. Computer Technology in Education: Evidence from a Pooled Study of Computer Assisted Learning Programs among Rural Students in China. REAP Working Paper 278. Stanford, CA: Stanford University.
Hummelsheim, S. and M. Baur. 2014. The German Dual System of Initial Vocational Education and Training and its Potential for Transfer to Asia. Prospects. 44 (2). pp. 279–296.
Huy, P.Q. 2009. Viet Nam Chamber of Commerce and Industry’s Role in Vocational Training. In Linking Vocational Training with the Enterprises—Asian Perspectives. Germany: InWEnt – Internationale Weiterbildung und Entwicklungg GmbH.
Indonesia Ministry of National Education. 2006. Rencana Strategis Departemen Pendidikan National Tahun 2005–2009. Jakarta: Ministry of National Education.
International Association for the Evaluation of Educational Achievement (IEA). 2003, 2007, and 2011. Trends in International Mathematics and Science Study (TIMSS). http://www.iea.nl/
International Labour Organization (ILO). 2012a. International Standard Classification of Occupations ISCO-08 Volume 1: Structure, Group Definitions and Correspondence Tables. Geneva: International Labour Organization.
International Labour Organization (ILO). 2012b. Overview of Apprenticeship Systems and Issues: ILO Contribution to the G20 Task Force on Employment. Geneva.
Jackson, C.K. 2010. The Effects of an Incentive-Based High-School Intervention on College Outcomes. NBER Working Paper 15722. Cambridge, MA: National Bureau of Economic Research (NBER).
Jackson, C.K. 2013. Non-Cognitive Ability, Test Scores, and Teacher Quality: Evidence from 9th Grade Teachers in North Carolina. Selected Works. Berkeley Electronic Press.
Jackson, C.K. and E. Bruegmann. 2009. Teaching Students and Teaching Each Other: The

101A Smarter Future: Skills, Education, and Growth in AsiaSpecial Chapter
101
Importance of Peer Learning for Teachers.American Economic Journal: Applied Economics. 1(4). pp. 85–108.
Jayachandran, S. 2014. Incentives to teach badly: After-School Tutoring in Developing Countries. Journal of Development Economics. 108. pp. 190–205.
Jensen, R. 2010. The (Perceived) Returns to Education and the Demand for Schooling. Quarterly Journal of Economics. 125(2). pp. 515–548.
Jensen, R. 2012. Do Labor Market Opportunities Affect Young Women’s Work and Family Decisions? Experimental Evidence from India. Quarterly Journal of Economics. 127 (2). pp. 753–92
Jin, G. and J. Lee. 2014. Inspection Technology, Detection, and Compliance: Evidence from Florida Restaurant Inspections. RAND Journal of Economics. 45(4). pp. 885–917.
Johnston, J. et al. 2015. The Impact of Vocational Teachers on Student Learning in Developing Countries: Does Enterprise Experience Matter? Comparative Education Review, forthcoming.
Jordan, A.H. and B.J. Lovett. 2007. Stereotype Threat and Test Performance: A Primer for School Psychologists. Journal of School Psychology. 45 (1). pp. 45–59.
Joyce, T. et al. 2014. Does Classroom Time Matter? A Randomized Field Experiment of Hybrid and Traditional Lecture Formats in Economics. NBER Working Paper 20006. Cambridge, MA: National Bureau of Economic Research (NBER).
Kane, T. and D. Staiger. 2002. The Promise and Pitfalls of Using Imprecise School Accountability Measures. Journal of Economic Perspectives. 16(4). pp. 91–114.
Karlan, D. and L. Linden. 2014. Loose Knots: Strong versus Weak Commitments to Save for Education in Uganda. NBER Working Paper 19863. Cambridge, MA: National Bureau of Economic Research (NBER).
Kautz, T. et al. 2014. Fostering and Measuring Skills: Improving Cognitive and Non-Cognitive Skills to Promote Lifetime Success. NBER Working Paper 20749. Cambridge, MA: National Bureau of Economic Research (NBER).
Kimball, M.S. 2015. Cognitive Economics. NBER Working Paper 20834. Cambridge, MA: National Bureau of Economic Research (NBER).
Kivlighan Jr., D. et al. 1994. Who Benefits from Computerized Career Counseling. Journal of Counseling & Development. 72 (3). pp. 289–292.
Konings, J. and S. Vanormelingen. 2015. The Impact of Training on Productivity and Wages: Firm-Level Evidence. Review of Economics and Statistics. 97(2). pp. 485–497.
Kraft, M. and T. Rogers. 2015. The Underutilized Potential of Teacher-to-Parent Communication: Evidence from a Field Experiment. Economics of Education Review. 47. pp. 49–63.
Kreiner, S. and K. Christensen. 2014. Analyses of Model Fit and Robustness. A New Look at the PISA Scaling Model Underlying Ranking of Countries According to Reading Literacy. Psychometrika. 79(2). pp. 210-231.
Kristoffersen, J.H.G. et al. 2015. Disruptive School Peers and Student Outcomes. Economics of Education Review. 45. pp. 1–13.
Kuruvilla, S. et al. 2002. Union Growth, Decline and Revitalization in Asia. British Journal of Industrial Relations. 403. 431–463.
Lai, F. et al. 2012. Does Computer-Assisted Learning Improve Learning Outcomes? Evidence from a Randomized Experiment in Public Schools in Rural Minority Areas in Qinghai, China. REAP Working Paper 237. Stanford, CA: Stanford University.
Laibson, D. 1997. Golden Eggs and Hyperbolic Discounting. Quarterly Journal of Economics. 112 (2). pp. 443–478.
Lavecchia, A.M., H. Liu, and P. Oreopoulos. 2015. Behavioral Economics of Education: Progress and Possibilities. IZA Discussion Paper No. 8853. Bonn: Institute for the Study of Labor.
102 Key Indicators for Asia and the Pacific 2015102
Lavy, V. 2015. Teachers’ Pay for Performance in the Long-Run: Effects of Students’ Educational and Labor Market Outcomes in Adulthood. NBER Working Paper 20983. Cambridge, MA: National Bureau of Economic Research (NBER).
Lavy, V. and E. Sand. 2015. On the Origins of Gender Human Capital Gaps: Short and Long Term Consequences of Teachers’ Stereotypical Biases. NBER Working Paper 20909. Cambridge, MA: National Bureau of Economic Research (NBER).
Lazear, E. 2000. Performance Pay and Productivity. American Economic Review. 90(5). pp. 1346–1361.
Lerman, R. 2014. The Benefits, Costs, and Financing of Technical and Vocational Education and Training. In Zhiqun Zhao and Felix Rauner, eds. Areas of Vocational Education Research. Springer.
Lerner, J. and J. Tirole. 2005. The Economics of Technology Sharing: Open Source and Beyond. Journal of Economic Perspectives. 19 (2). pp. 99–120.
Levitt, S. et al. 2013. The Behavioralist Goes to School: Leveraging Behavioral Economics to Improve Educational Performance. Framed Field Experiments 00379. Field Experiments, University of Chicago.
Levy-Garboua, L., et al. 2012. Risk Aversion and Framing Effects. Experimental Economics. 15(1). pp. 128–144.
Li, G et al. 2015. Do Resources Matter? The Impacts of Attending Model Vocational Schools on Student Outcomes in China. REAP Working Paper 279. Stanford, CA: Stanford University.
Li, T. et al. 2014. Encouraging Classroom Peer Interactions: Evidence from Chinese Migrant Schools. Journal of Public Economics. 111. pp. 29–45.
Lochner, L. 2011. Nonproduction Benefits of Education: Crime, Health, and Good Citizenship. In E. Hanushek, S. Machin, and L. Woessmann, eds. Handbook of the Economics
of Education Volume 4. Amsterdam: Elsevier-North Holland.
Lochner, L. and A. Monge-Naranjo. 2012. Credit Constraints in Education. Annual Review of Economics. 4. pp. 225–256.
Lochner, L. and E. Moretti. 2004. The Effect of Education on Crime: Evidence from Prison Inmates, Arrests, and Self-Reports. American Economic Review. 94(1). pp. 155–189.
Loyalka, P. et al. 2013. Can Information and Counseling Help Students from Poor Rural Areas Go to High School? Evidence from China. Journal of Comparative Economics.41(4). pp. 1012–1025.
Loyalka, P. et al. 2015. The Impact of Vocational Schooling on Human Capital Development in Developing Countries: Evidence from China. Policy Research Working Paper No. 7396. Washington, DC: World Bank.
Macartney, H. 2014. The Dynamic Effects of Educational Accountability. NBER Working Paper 19915. Cambridge, MA: National Bureau of Economic Research (NBER).
Maitra, P. and S. Mani. 2014. Learning and Earning: Evidence from a Randomized Evaluation in India. GCC Working Paper Series14–05. Philadelphia, PA: University of Pennsylvania.
Majumdar, S. 2011. Emerging Challenges and Trends in TVET in the Asia-Pacific Region. Rotterdam: Sense Publishers.
Malamud, O. and C. Pop-Eleches. 2011. Home Computer Use and the Development of Human Capital. Quarterly Journal of Economics. 126 (2). pp. 987–1027.
ManpowerGroup. 2015. Talent Shortage Survey. Milwaukee, WI: ManpowerGroup.
McGlone, M.S. and J. Aronson. 2006. Stereotype Threat, Identity Salience and Spatial Reasoning. Journal of Applied Developmental Psychology. 27(5). pp. 486–493.
McKenzie, D. and C. Woodruff. 2014. What are We Learning from Business Training and Entrepreneurship Evaluations around the Developing World? World Bank Research Observer. 29(1). pp. 48-82.

103A Smarter Future: Skills, Education, and Growth in AsiaSpecial Chapter
103
McKinsey Global Institute. 2013. Disruptive Technologies: Advances that will Transform Life, Business, and the Global Economy. New York, NY: McKinsey & Company.
Mertaugh, M. and Hanushek, E. A. 2005. Education and Training, N. Barr (ed.), Labor Markets and Social Policy in Central and Eastern Europe: The Accession and Beyond. Washington, DC, World Bank, pp. 207–42.
Milligan, K. and M. Stabile. 2011. Do Child Tax Benefits Affect the Well-being of Children? Evidence from Canadian Child Benefit Expansions. American Economic Journal: Economic Policy. 3(3). pp. 175–205.
Mizala, A. and M. Urquiola. 2013. School Markets: The Impact of Information Approximating Schools’ Effectiveness. Journal of Development Economics. 103. pp. 313–335.
Mizala, A., P. Romaguera, and M. Urquiola. 2007. Socioeconomic Status or Noise? Tradeoffs in the generation of school quality information. Journal of Development Economics.84(1). pp. 61–75.
Mo, D. et al. 2013a. Can One-to-One Computing Narrow the Digital Divide and the Educational Gap in China? The Case of Beijing Migrant Schools. World Development. 46. pp. 14–29.
Mo, D. et al. 2013b. School Dropouts and Conditional Cash Transfers: Evidence from a Randomised Controlled Trial in Rural China’s Junior High Schools. The Journal of Development Studies. 49(2). pp. 190–207.
Mo, D. et al. 2014a. Integrating Computer-assisted Learning into a Regular Curriculum: Evidence from a Randomized Experiment in Rural Schools in Shaanxi. Journal of Development Effectiveness. 6(3). pp. 300–323.
Mo, D. et al. 2014b. Text Messaging and its Impacts on the Health and Education of the Poor: Evidence from a Field Experiment in Rural China. World Development. 64. pp. 766–780.
Moenjak, T. and C. Worswick. 2003. Vocational Education in Thailand: A Study of Choice and Returns. Economics of Education Review. 22 (1). pp. 99–107.
Mollick, E. 2014. The Dynamics of Crowdfunding: An Exploratory Study. Journal of Business Venturing. 29(1). pp. 1–16.
Mookherjee, D. and I. Png. 1989. Optimal Auditing, Insurance, and Redistribution. Quarterly Journal of Economics. 104(2). pp. 399–415.
Moretti, E. 2004. Estimating the Social Return to Higher Education: Evidence from Longitudinal and Repeated Cross-sectional Data. Journal of Econometrics. 121 (1–2). pp. 175–212.
Moretti, E. and J. Perloff. 2002. Efficiency Wages, Deferred Payments and Direct Incentives in Agriculture. American Journal of Agriculture Economics. 84(4). pp. 1144–1155.
Muralidharan, K. and N. Prakash. 2015. Cycling to School: Increasing Secondary School Enrollment for Girls in India. Working Paper.
Muralidharan, K. and V. Sundararaman. 2010. The Impact of Diagnostic Feedback to Teachers on Student Learning: Experimental Evidence from India. The Economic Journal.120 (546). pp. F187–F203.
Muralidharan, K. and V. Sundararaman. 2011a. Teacher Performance Pay: Experimental Evidence from India. Journal of Political Economy. 119(1). pp. 39–77.
Muralidharan, K. and V. Sundararaman. 2011b. Teacher Opinions on Performance Pay: Evidence from India. Economics of Education Review. 30(3). pp. 394–403
Muralidharan, K. and V. Sundararaman. 2013. Contract Teachers: Experimental Evidence from India. NBER Working Paper 19440. Cambridge, MA: National Bureau of Economic Research (NBER).
Muralidharan, K. and V. Sundararaman. 2015. The Aggregate Effect of School Choice: Evidence from a Two-Stage Experiment in India. Quarterly Journal of Economics. 130 (3). pp. 1011–1066.
Murnane, R.J. and A.J. Ganimian. 2014. Improving Educational Outcomes in Developing Countries: Lessons from Rigorous Evaluations. NBER Working Paper 20284. Cambridge,

104 Key Indicators for Asia and the Pacific 2015104
MA: National Bureau of Economic Research (NBER).
Nataraj, S. 2011. The Impact of Trade Liberalization on Productivity: Evidence from India’s Formal and Informal Manufacturing Sectors. Journal of International Economics. 85(2). pp. 292–301.
Nataraj, S. et al. 2014. The Impact Of Labor Market Regulation On Employment In Low-Income Countries: A Meta-Analysis. Journal of Economic Surveys. 28(3). pp. 551–572.
National Bureau of Statistics. 2013. China Labour Statistical Yearbook. Beijing: China Statistics Press.
National Bureau of Statistics. 2001. China Statistical Yearbook. Beijing: China Statistics Press.
National Bureau of Statistics. 2012. China Statistical Yearbook. Beijing: China Statistics Press.
National Bureau of Statistics. 2013. China Statistical Yearbook. Beijing: China Statistics Press.
National Bureau of Statistics. 2014. China Statistical Yearbook. Beijing: China Statistics Press.
National Bureau of Statistics, Department of Population and Employment Statistics, and Population Census Office under the State Council. 2010. Tabulation on the 2010 Population Census of the People’s Republic of China. Beijing: China Statistics Press.
Newhouse, D. and D. Suryadarma. 2011. The Value of Vocational Education: High School Type and Labor Market Outcomes in Indonesia. World Bank Economic Review. 25(2). pp. 296–322.
O’Donoghue, T. and M. Rabin. 1999. Doing It Now or Later. American Economic Review. 89(1). pp. 103–124.
OECD. 2000, 2003, 2006, 2009, and 2012. Programme for International Student Assessment (PISA). http://www.oecd.org/pisa/
OECD. 2004. Attracting, Developing and Retaining Effective Teachers. Paris: OECD Publishing.
OECD. 2013. Education at a Glance 2013: OECD Indicators. Paris: OECD Publishing.
OECD. 2015. Skills for Social Progress: The Power of Social and Emotional Skills. Paris: OECD Publishing.
Olken, A. 2007. Monitoring Corruption: Evidence from a Field Experiment in Indonesia. Journal of Political Economy. 115 (2). pp. 200–249.
Osikominu, A. 2013. Quick Job Entry or Long-Term Human Capital Development? The Dynamic Effects of Alternative Training Schemes. Review of Economic Studies. 80(1). pp. 313–342.
Oyer, P. and S. Schaefer. 2011. Personnel Economics: Hiring and Incentives. In O. Ashenfelter and D. Card, eds. Handbook of Labor Economics Volume 4b. Amsterdam: Elsevier–North Holland.
Pacific Association of Technical Vocational Education and Training. 2012. TVET Providers Fiji. http://www.fnu.ac.fj/patvet/2012-08-14-15-04-20/tvet-providers (accessed July 15, 2015).
Pakistan National Vocational and Technical Training Commission. 2013. TVET Institutes in Pakistan. http:// www.navttc.org/TVET_Pakistan.aspx?cat=0 (accessed July 15, 2015).
Phillips, D. 2014. Getting to work: Experimental Evidence on Job Search and Transportation Costs. Labour Economics. 29. pp. 72–82.
Pritchett, L. 2001. Where Has All the Education Gone? World Bank Economic Review. 15 (3). pp 367–391.
Pritchett, L. 2006. Does Learning to Add up Add up? The Returns to Schooling in Aggregate Data. In E. Hanushek and F. Welch, eds. Handbook of the Economics of Education Volume 1. Amsterdam: Elsevier–North Holland.
Pritchett, L. and A. Beatty. 2012. The Negative Consequences of Overambitious Curricula in Developing Countries. Center for Global Development Working Paper 293. Washington, DC: Center for Global Development.
Pritchett, L. and R. Murgai. 2007. Teacher Compensation: Can Decentralization to Local Bodies Take India from the Perfect Storm Through Troubled Waters to Clear Sailing? In S. Bery, B.P. Bosworth, and A. Panagariya, eds. India Policy Forum Volume 3. Washington, DC: Brookings Institution.

105A Smarter Future: Skills, Education, and Growth in AsiaSpecial Chapter
105
Psacharopoulos, G. and H.A. Patrinos. 2004. Returns to Investment in Education: A Further Update. Education Economics. 12 (2). pp. 111–134.
QS World University Rankings. 2014. http://www.topuniversities.com/university-rankings/world-university-rankings/2014 (accessed March 2015).
Ra, Y.S. and K.W. Shim. 2009. The Korean Case Study: Past Experience and New Trends in Training Policies. Social Protection Discussion Paper No. 0931. Washington, D.C.: World Bank.
Ravikumar, B. and Y. Zhang. 2012. Optimal Auditing and Insurance in a Dynamic Model of Tax Compliance. Theoretical Economics. 7 (2). pp. 241–282
Rockoff, J. and L. Turner. 2010. Short-Run Impacts of Accountability on School Quality. American Economic Journal: Economic Policy. 2(4). pp. 119–147.
Rockoff, J. et al. 2012. Information and Employee Evaluation: Evidence from a Randomized Intervention in Public Schools. American Economic Review. 102(7). pp. 3184–3213.
Rodrik, D. 2015. Premature Deindustrialization. NBER Working Paper 20935. Cambridge, MA: National Bureau of Economic Research (NBER).
Roemer, J. 1998. Equality of Opportunity. Cambridge, MA: Harvard University Press.
Rothstein, J. 2010. Teacher Quality in Educational Production: Tracking, Decay, and Student Achievement. Quarterly Journal of Economics.125(1). pp. 175–214.
Rothstein, J. and C. Rouse. 2011. Constrained After College: Student Loans and Early-career Occupational Choices. Journal of Public Economics. 95(1–2). pp. 149–163.
Ryan, P. 2001. The School-to-Work Transition: A Cross-National Perspective. Journal of Economic Literature. 39 (1). pp. 34–92.
Sattinger, M. and J. Hartog. 2013. Nash Bargaining and The Wage Consequences of Educational Mismatches. Labour Economics. 23. pp. 50-56.
Southeast Asian Ministers of Education Organization (SEAMEO). 2015. Technical and Vocational Education and Training in Cambodia. http://seatvet.seameo.org/template/docs/TVET_Cambodia_2015.pdf (accessed August 2015).
Squicciarini, M. and N. Voigtlander. 2014. Human Capital and Industrialization: Evidence from the Age of Enlightenment. NBER Working Paper 20219. Cambridge, MA: National Bureau of Economic Research (NBER).
Steedman, H. 1993. The Economics of Youth Training in Germany. The Economic Journal. 103(420). pp. 1279–1291.
Syverson, C. 2011. What Determines Productivity? Journal of Economic Literature. 49(2). pp. 326-365.
Thaler, R. 1990. Anomalies: Saving, Fungibility, and Mental Accounts. Journal of Economic Perspectives. 4(1). pp. 193–205.
UNESCO. 2003. Student Loans in the Philippines: Lessons from the Past. Bangkok: UNESCO International Institute for Educational Planning.
UNESCO. 2007. World Data on Education. http://www.ibe.unesco.org/en/services/online-materials/world-data-on-education/sixth-edition-2006-07.html
UNESCO. 2011. World Data on Education. http://www.ibe.unesco.org/en/services/online-materials/world-data-on-education/seventh-edition-2010-11.html
UNESCO Institute of Statistics. http://data.uis.unesco.org/
UNEVOC. 2014. World TVET Database. http://www.unevoc.unesco.org/go.php?q=fwd2World+TVET+Database
US Department of Labor. 2015. O*NET Resource Center. https://www.onetonline.org/ (accessed October 15, 2015).
Vandenberghe, V. and O. Debande. 2007. Deferred and Income-Contingent Tuition Fees: An Empirical Assessment using Belgian, German and UK Data. Education Economics. 15(4). pp. 421–440.

106 Key Indicators for Asia and the Pacific 2015106
Waber, B., J. Magnolfi, and G. Lindsay. 2014. Workspaces That Move People. Harvard Business Review. Boston, MA: Harvard Business Publishing.
Waldinger, F. 2013. Bombs, Brains, and Science: The Role of Human and Physical Capital for the Creation of Scientific Knowledge. CAGE Working Paper. Centre for Competitive Advantage in the Global Economy, University of Warwick.
Walsh, D. 2015. Fake Diplomas, Real Cash: Pakistani Company Axact Reaps Millions. The New York Times. 17 May.
Wang, H. et al. 2014. Can School Counseling Reduce School Dropout in Developing Countries? REAP Working Paper 275. Stanford, CA: Stanford University.
Weise, M.R. and C. Christensen. 2014. Hire Education: Mastery, Modularization and the Workforce Revolution. San Mateo, CA: The Clayton Christensen Institute for Disruptive Innovation.
World Bank. 2004. World Development Report 2004: Making Services Work for Poor People. Washington, DC.
World Bank. 2007. World Development Report 2007: Development and the Next Generation. Washington, DC.
World Bank. 2012. Putting Higher Education to Work: Skills and Research for Growth in East Asia. Washington, DC: World Bank.
World Bank. 2014. STEP Skills Measurement Surveys: Innovative Tools for Assessing Skills. Social Protection and Labor Discussion Paper No. 1421. Washington, DC: World Bank Group.
World Bank. Various years, 2006-2014. Enterprise Surveys.
World Bank EdStats. 2015. http://data.worldbank.org/data-catalog/ed-stats (accessed July 2015).
World Bank SABER. 2015. http://saber.worldbank.org/index.ctm (accessed August 2015).
World Economic Forum Global Competitiveness Index. http://www.weforum.org/ (accessed September 2015).
World Management Survey. 2015. http://www.worldmanagementsurvey.com/
Wuttke, J. 2007. Uncertainties and Bias in PISA. In S.T. Hopmann, G. Brinek, M. Retzl, eds. PISA According to PISA: Does PISA Keep What it Promises? Wien: Lit-Verlag. pp. 241-263.
Yamaguchi, S. 2012. Tasks and Heterogeneous Human Capital. Journal of Labor Economics. 30 (1). pp. 1–53.
Yoong, J. and N. Sinha. 2009. Long-Term Financial Incentives and Investment in Daughters. Policy Research Working Paper No. 4860. Washington, DC: World Bank.
York, B. and S. Loeb. 2014. One Step at a Time: The Effects of an Early Literacy Text Messaging Program for Parents of Preschoolers. NBER Working Paper 20659. Cambridge, MA: National Bureau of Economic Research (NBER).
Yue, A. et al. 2014. Dormitory Management and Boarding Students in China’s Rural Primary Schools. China Agricultural Economic Review. 6 (3). pp. 523–550
Zhao, Y. and L. Breslow. 2013. Literature Review on Hybrid/Blended Learning. TLL Working Paper. Cambridge, MA: Teaching and Learning Laboratory, Massachusetts Institute of Technology.
Zheng, H. et al. 2014. The Role of Multidimensional Social Capital in Crowdfunding: A Comparative Study in China and US. Information and Management. 51(4). pp. 488–496.

ASIAN DEVELOPMENT BANK
A Smarter Future: Skills, Education, and Growth in AsiaKey Indicators for Asia and the Pacific 2015 Special Chapter
Asia has made substantial progress in improving educational attainment. Nevertheless, there remain significant shortfalls in the quantity and quality of education. To raise quality, will require commitment to making evidence based policy decisions and accountability, financial e�ciency that delivers better skill outcomes per dollar of public investment, educational delivery and access, and generating conditions for learning on-the-job. The chapter provides suggestive evidence that three features of education systems that deliver better cognitive skills are those that have (i) information systems that collect timely, relevant, and credible data on schooling inputs and skill outcomes; (ii) curriculum content that are well-matched to student capabilities and emphasizes development of critical skills; and (iii) broad support for early childhood education.
About the Asian Development Bank
ADB’s vision is an Asia and Pacific region free of poverty. Its mission is to help its developing member countries reduce poverty and improve the quality of life of their people. Despite the region’s many successes, it remains home to the majority of the world’s poor. ADB is committed to reducing poverty through inclusive economic growth, environmentally sustainable growth, and regional integration.
Based in Manila, ADB is owned by 67 members, including 48 from the region. Its main instruments for helping its developing member countries are policy dialogue, loans, equity investments, guarantees, grants, and technical assistance.
ASIAN DEVELOPMENT BANK6 ADB Avenue, Mandaluyong City1550 Metro Manila, Philippineswww.adb.org
COGN
ITIVE
NONCOGN
ITIV
E
TECHNI
CAL
Aa Bb Cc
A SMARTER FUTURESKILLS, EDUCATION, AND GROWTH IN ASIA
KEY INDICATORS FOR ASIA AND THE PACIFIC 2015SPECIAL CHAPTER
KI2015-Special-Chapter-Cover.indd 1 27/01/2016 7:51:39 AM