PROPOSAL › sites › clrtap-tfrn.org › files › docu… · Web viewGrazing 12h/24h (Cat. 1),...
173
WGSR-49 Informal document no. xxx. DRAFT GUIDANCE DOCUMENT FOR PREVENTING AND ABATING AMMONIA EMISSIONS FROM AGRICULTURAL SOURCES Submitted by the Co-chairs of the Task Force on Reactive Nitrogen Article 3, paragraph 8 (b) of the 1999 Protocol to Abate Acidification, Eutrophication and Ground-level Ozone requires each Party to “apply, where it considers it appropriate, best available techniques for preventing and reducing ammonia emissions, as listed in guidance document V (EB.AIR/1999/2, part V) adopted by the Executive Body at its seventeenth session (decision 1999/1)”, the updated guidance document (ECE/EB.AIR/WG.5/2007/13) and any amendments thereto. In line with the decision of the Executive Body in 2008 to establish a Task Force on Reactive Nitrogen (TFRN) aiming at “developing technical and scientific information, and options which can be used for strategy development across the UNECE to encourage coordination of air pollution policies on nitrogen in the context of the nitrogen cycle and which may be used by other bodies outside the Convention in consideration of other control measures” the TFRN has updated the guidance document to provide an amended text. The update includes the results of the workshop on “The Costs of Ammonia abatement and the climate co-benefits” (Paris, 25-27 October 2010), and additional up-dates discussed during the TFRN-6 meeting in Rome in May 2011 and that of the TFRN-7 in St Petersburg. 1
Transcript of PROPOSAL › sites › clrtap-tfrn.org › files › docu… · Web viewGrazing 12h/24h (Cat. 1),...

WGSR-49 Informal document no. xxx.
DRAFT GUIDANCE DOCUMENT FOR PREVENTING AND ABATING AMMONIA EMISSIONS FROM AGRICULTURAL SOURCES
Submitted by the Co-chairs of the Task Force on Reactive Nitrogen
Article 3, paragraph 8 (b) of the 1999 Protocol to Abate Acidification, Eutrophication and Ground-level Ozone requires each Party to “apply, where it considers it appropriate, best available techniques for preventing and reducing ammonia emissions, as listed in guidance document V (EB.AIR/1999/2, part V) adopted by the Executive Body at its seventeenth session (decision 1999/1)”, the updated guidance document (ECE/EB.AIR/WG.5/2007/13) and any amendments thereto. In line with the decision of the Executive Body in 2008 to establish a Task Force on Reactive Nitrogen (TFRN) aiming at “developing technical and scientific information, and options which can be used for strategy development across the UNECE to encourage coordination of air pollution policies on nitrogen in the context of the nitrogen cycle and which may be used by other bodies outside the Convention in consideration of other control measures” the TFRN has updated the guidance document to provide an amended text. The update includes the results of the workshop on “The Costs of Ammonia abatement and the climate co-benefits” (Paris, 25-27 October 2010), and additional up-dates discussed during the TFRN-6 meeting in Rome in May 2011 and that of the TFRN-7 in St Petersburg.
1

2

CONTENTSCONTENTS...............................................................................................................................4
0. SUMMARY............................................................................................................................5
I IINTRODUCTION 11
II. LIVESTOCK PRODUCTION AND DEVELOPMENTS .................................................15
III. NITROGEN MANAGEMENT, TAKING ACCOUNT OF THE NITROGEN CYCLE 21
IV. LIVESTOCK FEEDING STRATEGIES 25
V. LIVESTOCK HOUSING 27
A. Housing systems for dairy and beef cattle.................................................................29
B. Housing systems for pigs...........................................................................................32
C. Housing systems for poultry......................................................................................38
VI. MANURE STORAGE TECHNIQUES.............................................................................47
VII. MANURE APPLICATION TECHNIQUES 47
VIII. FERTILIZER APPLICATION 61
IX. OTHER MEASURES RELATED TO AGRICULTURAL NITROGEN 67
a. Grazing 67
b Manure treatment 67
c Non-agricultural manure use 68
X. NON-AGRICULTURAL STATIONARY AND MOBILE SOURCES...........................73
a General techniques
b Techniques suited to selected sectors
c Production of inorganic N fertilizers, urea and ammonia
XI. REFERENCES...................................................................................................................73
Appendix 1. Supplementary Information: Nitrogen management 83
Appendix 2. Supplementary Information: Livestock feeding strategies 97
3

4

SUMMARY1. The purpose of this document is to provide guidance to the Parties to the Convention in identifying ammonia (NH3) control measures for reducing emissions from agriculture.
2. This document summarizes the options for provisions in a revised ANNEX IX of the UNECE Gothenburg protocol. For each category of provision, a summary is given of
- the background of the provisions- the proposed ammonia emission abatement strategies, techniques and approaches- the economic cost of the techniques, in terms of euro per kg of NH3 abated- any limitation and constraint
3. Annex IX includes the following provisions (which are further described below):- A Code of Good Agricultural Practices- Nitrogen management, taking into account the whole nitrogen cycle- Livestock feeding strategies- Animal housing strategies and techniques- Manure storage techniques- Manure application techniques- Fertilizer application techniques and approaches- Other measures related to agricultural nitrogen- Measures related to non-agricultural and stationary sources
4. The advisory code of good agricultural practice (GAP) to control ammonia emissions is a mandatory provision. However, the provisions within the code of GAP are voluntary. Parties shall establish, publish and disseminate the advisory code of GAP on basis of the framework code. This requires that the framework code is made country-specific and up-dated regularly. This requires also that the country-specific code of GAP is published and disseminated regularly. It may also require that advisory services and personnel of firms are trained. The economic cost for governments are likely in the range of 10,000 to 100,000 euro per Party per yr, depending on the experience and regional differences. Voluntary codes of GAP encourage farmers to apply a combination of measures, adjusted for the farm-specific conditions. Thereby, farmers can select the best combination of measures, adjusted for the farm-specific conditions. This requires, of course, that farmers are well-informed of the pros and cons of the measures. Hence, active dissemination and training of advisory services is prerequisite for the code of GAP to become active. The economic cost for the farmers are estimated to be small, as the provisions are voluntary. Currently, there are no estimates available of the effectiveness of the code of GAP and this is likely to vary across regions. Therefore, the economic costs of the code of GAP cannot be expressed in terms of euro per kg of NH3 abated.
5. Nitrogen management is an integral measure to decrease nitrogen losses. Nitrogen management is based on the premise that decreasing the N surplus and increasing nitrogen use efficiency contribute to abatement of ammonia emissions. On mixed livestock farms, between 10 to 40% of the N surplus is related to NH3 emissions. For large landless pig and poultry houses, NH3 losses as percentage of the N surplus are in the range of 10 to 60%.
5

Nitrogen management is also based on the premise that it will prevent pollution swapping induced by any other provision of ANNEX IX.
The cost of establishing a farm nitrogen balance is in the range of 200 to 500 euro per farm per year. (The farm balance refers to an accounting for all nitrogen inputs such as feed, fertilizer etc, and all nitrogen outputs in products). This translates to 1 to 10 euro per ha per year, depending on farm size and efficiency due to economies of scale. The costs of establishing a nitrogen budget at national level are in the range of 1000 to 10000 euro per year. The cost of increasing nitrogen use efficiency through improving management are in the range of -1.0 to 2.0 euro per kg N saved. The possible savings are related to less cost for fertilizer and increased crop quality. The possible costs are related to increased cost for advisory services and soil, crop and manure analyses. The economic cost of possible investments in techniques are not include here, but discussed with other provisions. Table S1 list indicative ranges for Nitrogen Use Efficiency (NUE) and the N surplus of the input-output balance of different farming systems. These ranges serve as rough guidance; they should be made more farm and country specific. Nitrogen use efficiency should be managed in concert with overall nutrient efficiencies and other factors such as pest control.
Table S1. Indicative ranges for target N surplus and NUE as function of farming system, crop species and animal categories.
Farming systems
Species/ categories
NUE, kg/kg
Nsurplus, kg/ha/yr
Comments
Specialized cropping systems
Arable crops 0.6-0.9 0-50 Cereals have high, root crops low NUE;
Vegetables 0.4-0.8 50-100 Leafy vegetables have low NUEFruits 0.6-0.9 0-50
Grassland-based Dairy cattle 0.3-0.5 100-150 High milk yield, high NUE; Low stocking density, low Nsurplus
ruminant systems
Beef cattle 0.2-0.4 50-150 Veal production, high NUE; 2yr old beef cattle, low NUE
Sheep & goat 0.2-0.3 50-150Mixed crop-animal systems
Dairy cattle 0.4-0.6 50-150 High milk yield, high NUE; Concentrate feeding, high NUE
Beef cattle 0.3-0.5 50-150Pigs 0.3-0.6 50-150Poultry, 0.3-0.6 50-150Other animals 0.3-0.6 50-150
Landless systems
Dairy cattle 0.8-0.9 0-1000 N Output via milk, animals, manure + N-loss ~equals N input; Nsurplus is gaseous N losses from storages.
Beef cattle 0.8-0.9 0-1000Pigs 0.7-0.9 0-1000Poultry, 0.6-0.9 0-1000Other animals 0.7-0.9 0-1000
6. Livestock feeding strategies decrease ammonia emissions from both manure in housing, storage and following application to land. Livestock feeding strategies are less applicable to grazing animals; also because grazing itself is a category 1 measure. Livestock feeding strate-gies are implemented through (i) phase feeding, (ii) low-protein feeding, with or without sup-plementation of specific synthetic amino acids and ruminal bypass protein, (iii) increasing the
6
paule, 02/04/12,
Should this be on an animal basis since land =0

non-starch polysaccharides of the feed, (iv) supplementation of pH-lowering substances, such as benzoic acid. Phase feeding is an effective and economically attractive measure. Young an-imals and high-productive animals require more protein than 'old' and low-productive ani-mals. Target protein values have been listed in this Guidance Document. Combined ammonia emissions for all farm sources decrease roughly by 10% when mean protein content decreases by 10 g per kg (1%) in the diet. The economic cost of the livestock feeding strategies depend on the cost of the feed ingredients and the possibilities of adjusting these ingredients to opti-mal proportions. The reference here is the mean current practice, which varies a lot across countries. The net costs of livestock feeding strategies depend on the manipulation of the diet and the changes in animal performance. In general, high-protein diets and low-protein diets cost more than diets with medium high protein contents. Both, too high and too low protein content in the diet have negative effect on animal performance. The cost of the diet manipula-tions are in the range of -10 to 10 euro per 1000 kg of feed, depending on market conditions for feed ingredients and the cost of the synthetic amino acids. Hence, in some years there are benefits, in other years costs associated with changes in diets. Table S2 summarizes possible target for lowering protein values maintaining production efficiencies for each animal cate-gory. Note that the economic costs increase as the ambitions to decrease the mean protein content increase from low to high.
Table S2: Indicative target protein levels (percent of dry feed with a standard dry matter content of 88%) for housed animals as function of animal category and for different ambition levels.Animal type Mean crude protein content of the animal feed, %1
Low ambition Medium ambition High ambitionDairy cattle, early lactation (>30kg/day) 17-18 16-17 15-16Dairy cattle, early lactation (<30kg/day) 16-17 15-16 14-15Dairy cattle, late lactation 15-16 14-15 12-14Replacement cattle (young cattle) 14-16 13-14 12-13Veal 20-22 19-20 17-19Beef <3 months 17-18 16-17 15-16Beef >6 months 14-15 13-14 12-13
Sows, gestation 15-16 14-15 13-14Sows, lactation 17-18 16-17 15-16Weaner, <10 kg 21-22 20-21 19-20Piglet, 10-25 kg 19-20 18-19 17-18Fattening pig 25-50 kg 17-18 16-17 15-16Fattening pig 50-110 kg 15-16 14-15 13-14Fattening pigs >110 13-14 12-13 11-12
Chicken, broilers, starter 22-23 21-22 20-21Chicken, broilers, growers 21-22 20-21 19-20Chicken, broilers, finishers 20-21 19-20 18-19Chicken, layers, 18-40 weeks 17-18 16-17 15-16Chicken, layers, >40 weeks 16-17 15-16 14-15
Turkeys, <4 weeks 26-27 25-26 24-25Turkeys, 5-8 weeks 24-25 23-24 22-23Turkeys, 9-12 weeks 21-22 20-21 19-20Turkeys, 13 -16 weeks 18-19 17-18 16-17Turkeys, >16 weeks 16-17 15-16 14-15
1With adequately balanced and optimal digestible amino acid supply.
7

7. For animal housing, abating ammonia emissions is based on one or more of the following principles:
- Decreasing the surface area fouled by manure;- Adsorption of urine (e.g. by straw);- Rapid removal of urine; rapid separation of faeces and urine;- Decreasing of the air velocity above the manure;- Reducing the pH and temperature of the manure and of surfaces it covers.- Removing (scrubbing) ammonia from exhaust air through scrubbers- Increased grazing time;
All principles have been applied in category 1 techniques; i.e., scientifically sound and practically proven. Different animal categories require different housing systems and environmental conditions; hence different techniques. Because of the different requirements and techniques, there are different provisions for different animal categories. The references here are the most conventional housing systems, without techniques for abating NH3 emissions. The costs of techniques used to lower ammonia emissions from housings are related to: (i) depreciation of investments costs, (ii) rent on investments costs, (iii) energy costs, (iv) maintenance costs. In addition to costs, there are benefits related to increasing animal health and performance. These benefits are difficult to quantify and have not always been included in the total cost estimate. The economics vary because of different techniques/variants and farms sizes. Table S3 presents an overview of the emission reduction and economic cost for the major animal categories
Table S3. Ammonia emission reduction requirements for animal housing.Category Minimum emission reduction
compared with the reference aExtra Cost (€/kg NH3 reduced)
Existing pig and poultry housing on farms with >2,000 fattening pigs or >750 sows or >40,000 poultry
20% Mean range: 0 to 3
There are also more expensive techniques and approaches
New or largely rebuilt cattle housing b
25% Mean range: 1 to 6Techniques and approaches still in development
New or largely rebuilt pig housing b
25 to 60%, depending on the housing systems
Mean range: 0 to 10
New and largely rebuilt broiler housing b
20% Mean range: 0 to 2
New and largely rebuilt layer housing b
30 to 60%, depending on the housing systems
Mean range: 0 to 8
New and largely rebuilt animal housing on farms for animals other than those already listed in this table b
0 to 60%, depending on the housing systems
Mean range: 0 to 2
a/ The references are specified further on in the Guidance Document. b/ Livestock farms with five livestock units or less would be exempt from these requirements.]
8

8. For manure storages, abating ammonia emissions is based on one or more of the following principles (i) decreasing the surface area where emissions can take place, i.e. through covering of the storage, encouraging crusting and increasing depth, (ii) decreasing the time that emissions can take place, i.e. through frequent removal of the slurry/manure (this should not encourage farms to have insufficient storage so that spreading is done at times of high pollution risk); and (iii) decreasing the source strength of the emitting surface, i.e., through lowering the pH and NH4 concentration. Minimizing disturbances such as aerating or manipulating? All principles have been applied in category 1 techniques; i.e., scientifically sound and practically proven. These principles are equally applicable to slurry storages and manure (dung) storage. However, the practical feasibility of implementing the principles are larger for slurry storages than for manure (dung) storages. The reference here is the uncovered slurry store and uncovered solid manure heap.The costs of techniques used to lower ammonia emissions from housings are related to (i) depreciation of investments costs, (ii) rent on investments costs, and (iii) maintenance costs.Here, a summary is provided of the total costs, in terms of euro per kg NH3-N saved (Table S4). In addition to costs, there are benefits related to decreased odour emissions, decreased rain water and increased safety (no open pits); some of these benefits are difficult to quantify and therefore have not been included here. Ranges of costs relate to different techniques/variants and farms size. Note that the cost of the storage system itself are not included in the cost estimates of Table 4. There may be some risk to covers such as toxic gases (H2S, CO) and increased GHG and damage form extreme weather. Some covers can only be implemented when new storages are built. Manure processing such as separation, composting and digestion have implications for storage losses.
Table S4. Ammonia emission reduction requirements for manure storages.
Techniques Emission reduction, %
Cost, € per m3 per year
Cost, € per kg NH3-N saved
Tight lid > 80 2 to 8 2 to 4Plastic cover > 60 1 to 2 0.5 to 1.5Floating cover > 40 1 to 2 1 to 2
9. Low-emission manure application is based on one or more of the following principles: (i) decreasing the surface area where emissions can take place, i.e. through band application, injection, incorporation; (ii) decreasing the time that emissions can take place, i.e. through rapid incorporation of manure into the soil or immediate irrigation or rapid infiltration; and (iii) decreasing the source strength of the emitting surface, i.e., through lowering the pH and NH4 concentration (through dilution), All principles have been applied in category 1 techniques; i.e., scientifically sound and practically proven. These principles are equally applicable to slurry and solid manure application. For solid manure, the most feasible technique is rapid incorporation into the soil and immediate irrigation. However, abatement techniques are more applicable and effective for slurry than for solid manures. The reference here is the broadcast application / spreading of slurry and solid manure. A fourth principle, applying when volatilization potential is low, such as low temperature and wind is considered category 2 because it requires a method of validation. The costs of techniques used to lower ammonia emissions from housings are related to:
9

- increased depreciation of investments costs of the applicator - increased rent on investments costs - increased tractor costs and labor costs - increased maintenance costsHere, a summary is provided of the total costs, in terms of euro per kg NH3-N saved (Table S5). The co-benefits relate to decreased odor emissions and biodiversity loss, and increased palatability of herbage. Some of these benefits are difficult to quantify and therefore have not all been included in the cost estimations. Ranges of costs relate to the NH4 content of the slurry/manure; the higher the NH4 content, the lower the abatement cost. Mean costs are likely in the lower half of the range, especially when application is done by contractors.
Table S5. Ammonia emission reduction requirements for manure application.
Manure type Application techniques
Emission reduction, %
Cost, € per kg NH3-N saved
Slurry Injection > 60 -0.5 to 2Shallow injection > 60 -0.5 to 2Trailing shoe, > 30 0 to 2Band application > 30 0 to 2Dilution > 30 0 to 2Management systems > 30 0 to 2
Solid manure Direct incorporation >30 -0.5 to 2
10. For application of urea and ammonium based fertilizers, abating emissions is based on one or more of the following principles: (i) decreasing the surface area where emissions can take place, i.e. through band application, injection, incorporation (but note that rapid increase in pH in concentrated bands of urea, especially where there is high crop residue, may lead to high emissions due to rise in pH); (ii) decreasing the time that emissions can take place, i.e. through rapid incorporation of fertilizers into the soil or fertigation; (iii) decreasing the source strength of the emitting surface, i.e., through urease inhibitors, blending and acidifying substances, and (iv) a ban on its use (as in the case of ammonium (bi)carbonate). All principles have been applied in category 1 techniques; i.e., scientifically sound and practically proven.The reference here is the broadcast application of the urea- and ammonium based fertilizers.The costs of techniques used to lower ammonia emissions from fertilizers are related to (i) increased depreciation of investments costs of the applicator, (ii) increased rent on investments costs, (iii) increased tractor costs and labor costs; and (iv) increased maintenance costs. Here, a summary is provided of the total costs, in terms of euro per kg NH3-N saved (Table S6). The possible benefits relate to decreased fertilizer costs, decreased application costs in a combined seeding and fertilizing system and decreased biodiversity loss. These benefits are difficult to quantify and have not all been included. Ranges of costs relate to the farm size (economics of scale), soil conditions and climate (high emission reduction in relatively dry conditions). Mean costs are likely in the lower half of the range when application is done by contractors or low emitting fertilizers are substituted.
10

Table S6. Ammonia emission reduction requirements for urea fertilizer application.
Fertilizer type Application techniques Emission reduction, %
Cost, € per kg NH3-N saved
Urea Injection > 80 -0.5 to 1Band spreading > 501 -0.5 to 2Urease inhibitors > 50 -0.5 to 2Incorporation > 30 0 to 2Surface spreading with irrigation > 30 0 to 2
Ammonium carbonate
Ban ~100 -1 to 2
Ammonium-based fertilizers
Injection separately or with seeding
> 80 -0 to 4
Band spreading > 50 0 to 4Incorporation > 30 0 to 4Surface spreading with irrigation > 30 0 to 2
1Surface banding of urea without incorporation may have high emissions where there is high urease activity such as on reduced till with crop residue
11

I. INTRODUCTION
2. The purpose of this document is to provide guidance to the Parties to the Convention in identifying ammonia (NH3) control measures for reducing emissions from agricultural sources, taking account of the whole nitrogen cycle. This guidance document will facilitate the implementation of the Basic Obligations of the Protocol mentioned in Article 3, as regards NH3 Emission, and more specifically will contribute to the effective implementation of the measures listed in Annex IX, and to achieving the national NH3 emission ceilings listed in Annex II, Table 3 of the Protocol.
3. The document addresses the abatement of NH3 emissions produced by agricultural sources. Agriculture is the major source of NH3, chiefly from livestock excreta in livestock housing, during manure storage, processing, treatment and application to land, and from excreta from animals at pasture. Emissions also occur from inorganic nitrogen (N) fertilizers following their application to land and from nitrogen-rich crops and crop residues, including grass silage. Emissions can be reduced through abatement measures in all the above areas but with varying degrees of practicality, efficacy and costs.
4. The first version of the Guidance document (EB.AIR/1999/2) provided general guidance on the abatement of NH3 emissions. This version was revised in 2007 ECE/EB.AIR/WG.5/2007/13). The current version is further revised and addresses the provisions in the proposal for revision of the Annex IX of the 1999 Protocol to Abate Acidification, Eutrophication and Ground-level Ozone (Gothenburg Protocol). Following a brief introduction to ‘livestock production and development’, this Guidance Document follows the order of the provisions in the proposal for revision of Annex IX, and provides also background to the measures outlined in Annex IX.
5. In this document, strategies and techniques for the abatement of NH3 emissions and N losses are grouped into three categories:
(a) Category 1 strategies: These are well researched, considered to be practical or poten-tially practical, and there are quantitative data on their abatement efficiency, at least on the experimental scale;
(b) Category 2 strategies: These are promising, but research on them is at presentinadequate, or it will always be difficult to generally quantify their abatement effi-ciency. This does not mean that they cannot be used as part of an NH3 abatement strategy, depending on local circumstances.
(c) Category 3 strategies: These have not been shown to be effective or are likely to beexcluded on practical grounds.
6. Based on the available research, Category 1 techniques can be considered as already verified for use in abatement strategies. Category 2 and Category 3 techniques may also be used in abatement strategies. However, for these categories independent verification should be provided by Parties using them in order to demonstrate the reductions in NH3 emissions
12

that they report. It should be noted that cost of a technique is not considered for the classification, and that Category 1 techniques are frequently but not necessarily the cheapest or most convenient. Information on costs is provided to support decisions on the use of the techniques.
7. Separate guidance has also been prepared, at European Union level, under the Integrated Pollution Prevention and Control (IPPC) Directive 2008/1/EC (from November 2011 ‘Directive on Industrial Emissions’ 2010/75/EU) to reduce a range of polluting emissions from large pig and poultry units. The “Reference Document on Best Available Techniques (BAT) for Intensive Rearing of Poultry and Pigs”, the BREF (BAT reference) document, may be found at: http://eippcb.jrc.es/reference/irpp.html. The BREF is currently under revision. There is only partial overlap between BAT and the present guidance document, since BAT has only been defined for the pig and poultry sectors, and has not been defined for cattle, sheep or other livestock, nor for the land application of manures or fertilizers. The current document is more inclusive for farms and sectors because it addresses also ammonia emissions from manure and fertilizer application to land and various other sources.
8. Options for NH3 reduction at the various stages of livestock manure production and handling are interdependent, and combinations of measures are not simply additive in terms of their combined emission reduction. Controlling emissions from applications of manures to land is particularly important, because these are generally a large component of total livestock emissions and because land application is the last stage of manure handling. Without abatement at this stage, much of the benefit of abating during housing and storage may be lost. Likewise, controlling emissions from land application will have less benefit if large losses occur in barns and storages. Reduction in excretion rates from livestock has the most direct effect on emissions and has been added to this document. Because of this interdependency, Parties should as far as possible exploit models where the overall mass-flow of ammonia nitrogen is assessed, in order to optimise their abatement strategies. Therefore the whole farm context, including animal feeding, has also been added to this document.
9. Many measures may incur both capital and annual costs (see Table 1). In addition to theoretical calculations based on capital and operating expenditure, actual data on costs (e.g. as charged by contractors) should be used where available. In addition to calculating the direct costs, the benefits of measures should as far as possible be calculated. In many cases, the combined benefits to the farmer (e.g., reduced mineral fertilizer need, improved agronomic flexibility, reduced emissions of other pollutants, less complaints due to odour) may outweigh the costs. Comparison of the net cost to the farmer (i.e. cost minus benefit) with other environmental benefits (e.g., improved air, water quality and soil quality, reduced biodiversity loss, reduced perturbation of climate) is beyond the scope of this document.
10. The costs of the techniques will vary from country to country. It should be noted that, due to economies of scale, some of the abatement techniques may be more cost-effective on large farms than on small farms. This is especially so when an abatement technique requires the purchase of capital equipment, e.g. reduced-emission slurry applicators. In such cases, the unit costs decrease as the volumes of manure increase. A greater cost burden for smaller farms may also be the case for immediate incorporation of manures. Both for slurry application and manure incorporation, the costs for small farms will often be reduced by
13

spreading the costs of the equipment over several farms through use of contractors with access to suitable equipment, sometimes locally designed and built. Costs may also be reduced by focusing mitigation efforts on medium and large farms, e.g. using farm-size thresholds or equipment-size thresholds, above which the measures are targeted, as outlined in the draft revised Annex IX.
Table 1 (a): Capital costs (capital expenditure (CAPEX))Consideration NotesCapital for fixed equipment or machinery.
Fixed equipment includes buildings, conversions of buildings, feed storage bins, or manure storage. Machinery includes feed distribution augers, field equipment for manure application or equipment for manure treatment, etc.
Labour cost of installation.
Use contract charges if these are normal. If farm staff are normally used to install the conversion, employed staff should be rated at typical hourly rates. Farmers’ input should be charged at the opportunity cost.
Grants Subtract the value of capital grants available to farmers.CAPEX (new) means the investment costs in new build situations, in contrast with CAPEX (retrofit) meaning rebuilding or renovation of buildings.
Table 1(b): Annual costs (operational expenditure, OPEX): the annual cost associated with the introduction of a technique.
Consideration NotesAnnualized cost of capital should be calculated over the life of the investment.
Use standard formula. The term will depend on the economic life. Conversions need to take account of remaining life of original facility.
Repairs associated with the investment should be calculated.
A certain percentage of the capital costs.
Changes in labour costs. Additional hours x cost per hour.
Fuel and energy costs. Additional power requirements may need to be taken into account.
Changes in livestock performance.
Changes in diets or housing can affect performance, with cost implications.
Cost savings and production benefits.
The introduction of techniques will often result in the saving of costs for the farmer. These should be quantified as far as possible.Separate note should be taken of the avoidance of fines for pollution in costing benefits.
11. Wherever possible, techniques listed in this document are clearly defined and assessed against a “reference” or unabated situation. The “reference” situation, against which percentage emission reduction is calculated, is defined at the beginning of each chapter. In most cases the “reference” is the practice or design that is the most commonly practised technique presently found on commercial farms in the UNECE and is used to construct baseline inventories.
12. Each abatement level shown in the draft revised Annex IX is linked directly to a Category I measure(s) described in the Guidance Document. Category 2 and Category 3 measures listed may also be used, subject to the cautions listed in paragraph 5. In introducing new measures there is often a cost associated with education, promotion and start-up which are not
14

considered here. In most cases, there are substantial co-benefits arising from the measures, not included in the costing, which will improve the overall wellbeing of farming operations and of the public. An example is reduction of odour, resulting from reduced emission measures, which will benefit the public (may even improve tourism) and farmers and their families. The secondary cost savings are also not counted, for example, reduced pollution and energy use from fertilizer manufacturing plants due to better conservation of ammonia on farms. Some measures (e.g. manure injection, covers for FYM, acidification, scrubbing exhaust air) reduce risk of contaminating waterways with N, other nutrients, pathogens and other contaminants.
15

II. LIVESTOCK PRODUCTION AND DEVELOPMENTS
13. Livestock excreta in livestock housing, during manure storage, processing, treatment and application to land, and from excreta from animals at pasture are the main sources of NH 3
emissions in most UNECE countries. Therefore, it is imperative to explain briefly the livestock sector.
14. The livestock sector is an important contributor to the global food and agricultural economy and to human nutrition and culture, accounting for 40 percent of the value of world agricultural output and providing 10-15 percent of total food calories and one-quarter of dietary protein. In most of the developing country regions it is the fastest growing segment of the agricultural sector. The livestock sector is expected to provide safe and plentiful food and fibre for growing urban populations, livelihoods for almost one billion poor producers, enables exploitation of non arable lands, provides food security against crop failure for subsistence farmers, utilizes food wastes and field losses or residues and even provides fuels, as well as global public goods related to food security, environmental sustainability and public health (Geers and Madec, 2006; FAO, 2009; Steinfeld et al., 2010).
15. While livestock provides various useful functions to society and the global demand for dairy, meat and egg products continues to increase for the next decades, there is also increasing pressure on (intensive) livestock production systems to become more environmentally friendly. The livestock sector is a major land user globally and has been implicated in deforestation and biodiversity loss (Steinfeld et al., 2006; FAO, 2009; Steinfeld et al., 2010). It is also a main user of fresh water, mainly through animal feed production, while fresh water resources become scarce in some areas. Livestock production is a main source of atmospheric ammonia (NH3) and the greenhouse gases methane (CH4) and nitrous oxide (N2O). The emissions of ammonia mainly originate from the nitrogen in manure of animals. Emissions of NH3 from livestock production are related to the type, number and genetic potential of the animals, the feeding and management of the animals, and to the technology of animal housing and manure management (Bouwman et al., 1997; Steinfeld et al., 2006; Oenema et al., 2008). Livestock dominate the requirement for reactive nitrogen in Europe. For example, the European Nitrogen Assessment has estimated that 85% of harvested nitrogen goes to feed livestock, with only 15% feeds people directly (Sutton et al., 2011).
16. Livestock production systems can broadly be classified into (i) grazing systems, (ii) mixed systems and (iii) fully confined landless or industrial systems (e.g. Seré and Steinfeld, 1996). Grazing systems are entirely land-based systems, with stocking rates less than one or two livestock unit per ha, depending on grassland productivity. In mixed systems a significant part of the value of production comes from other activities than animal production while part of the animal feed often is imported. Industrial systems have stocking rates greater than 10 livestock units per ha and they depend primarily on outside supplies of feed, energy and other inputs. In industrial systems, 0-10% of the dry matter fed to animals is produced on the farm. Relevant indicators for livestock production systems are animal density in animals per ha (AU/ha) and kg milk or meat/ha/year. A common and useful indicator for the pressure on the environment is the total N or P excretion of the livestock per ha per year (e.g., Menzi et al., 2010).
16

17. In each livestock category, a distinction can be made between conventional and organic farming. Further, there is often a distinction between intensive and extensive systems, which may coincide with the distinction between conventional and organic farming, but not necessarily. Intensive livestock production systems are characterized by a high output of meat, milk, and eggs per unit of agricultural land and per unit of stock (i.e. livestock unit), which usually coincides with a high stocking density per unit of agricultural land. This is generally achieved by high efficiency in converting animal feed into animal products. Because of their capacity to rapidly respond to a growing demand for low-cost animal products, intensive livestock production systems now account for a dominant share of the global pork, poultry meat and egg production (respectively 56, 72 and 61 percent) and a significant share of milk production (Steinfeld et al., 2006; FAO, 2009).
18. Traditionally, most animal products consumed by humans were produced locally using locally produced animal feeds. Increasingly, many animal products consumed by humans in urban areas are produced using animal feeds imported from outside the animal production areas. This holds especially for pig and poultry products. Thereby, areas of animal feed production and pig and poultry production become increasingly disconnected from the site of animal product consumption. This disconnection has been made possible through the development of efficient transport infrastructure and the relatively low price of fossil energy; the shipment of concentrated feed is cheap relative to other production costs. Transportation of meat and egg products has also become cheaper. However, the uncoupling of animal feed production from animal production has major consequences for the proper reuse and management of animal manure (FAO, 2009; Steinfeld et al., 2010 and references therein).
19. Increasingly, production chains are organized and regionally clustered in order to minimize production, processing and delivery costs. Animal feed is the major input to livestock production, followed by labor, energy, water and services. Input costs vary substantially from place to place within countries as well as across countries and continents. Access to technology, labour and know-how is also unevenly distributed, as is the ability to respond to changing environments and to market changes. There are also institutional and cultural patterns that further affect production costs, access to technologies and transaction costs. The combination of these factors determines that livestock production systems become larger, more specialized, and more intensive (FAO, 2009; Steinfeld et al., 2010 and references therein).
20. Livestock production systems are dynamic systems because of continuous developments and changes in technology, markets, transport and logistics. Increasingly, livestock products become ‘global commodities’, and livestock production systems are operating in an ‘open’, highly competitive, global market. These developments are facilitated by the increasing demand for low-cost animal products because of the increasing urban population and the increasing consumption of animal products per capita, although there are large economic, regional and continental differences. The additional demand for livestock products concentrates in urban centers (FAO, 2009; Steinfeld et al., 2010).
21. The rapid developments in livestock production systems have a strong effect on the emissions of NH3, N2O and CH4 from these systems to the atmosphere and of the leaching and runoff of N to waters. Emission abatement strategies have to take such developments into
17

account and to anticipate new developments, so as to make these strategies effective and efficient into the future.
18

III. NITROGEN MANAGEMENT, TAKING ACCOUNT OF THE WHOLE NITROGEN CYCLE
22. Management is often called the ‘fourth production factor’, in addition to land, labour and capital (techniques). Its importance for the economic and environmental performances of agricultural is enormous. Management is commonly defined as ‘a coherent set of activities to achieve objectives’. Nitrogen management can be defined as ‘a coherent set of activities related to the handling and allocation of nitrogen on farms to achieve agronomic and environmental/ecological objectives’ (e.g., Oenema and Pietrzak, 2002). The agronomic objectives relate to crop yield and quality, and animal performance in the context of animal welfare. The environmental/ecological objectives relate to minimizing nitrogen losses from agriculture. ‘Taking account of the whole nitrogen cycle’ emphasizes the need to consider all aspects of nitrogen cycling, also in ‘NH3 emissions abatement’, to circumvent ‘pollution swapping’. Although not considered here, other pollutants and impacts must also be avoided. Nitrogen management can be considered as the ‘soft-ware’ and ‘org-ware’, while the techniques may be considered as the ‘hard-ware’ of the nitrogen emissions abatement. Hence, nitrogen management has to be considered in conjunction with the techniques.
23. Nitrogen management varies greatly across the UN-ECE region, and NH3 emissions will vary accordingly. In general, emissions of nitrogen tend to decrease when:
a. All nitrogen sources on the farm are fully considered in a coherent whole-farm perspective and a whole nitrogen cycle perspective;
b. All nitrogen sources are stored and handled properly;c. Amounts of nitrogen used are strictly according to the needs of growing plants
and animals;d. Nitrogen sources are used in a timely manner, using the appropriate
techniques, in the appropriate amounts and appropriate place.e. All possible nitrogen loss pathways are considered in a coherent manner
Supplementary information about ‘nitrogen management, taking account of the whole nitrogen cycle’ is provided in Appendix 1.
24. Reference situation. The reference is a farm situation without nitrogen management planning and without use of nitrogen balances. Because of intrinsic differences in nitrogen cycling, a distinction has to be made between different farming systems, such as:
a. Specialized crop producing farms, further divided into: i. arable crops,
ii. vegetables iii. fruits
b. Grassland-based ruminant production farms, further divided into: i. dairy cattle
ii. beef cattle iii. sheep and/or goativ. other animals (buffalo, bison, deer, etc)
c. Mixed crop-animal systems, with as dominant animali. dairy cattle
ii. beef cattleiii. pigs
19

iv. poultry v. other animals
d. Specialized, landless, systems with i. dairy cattle
ii. beef cattleiii. pigs, iv. poultry v. other animals.
Category 1 strategies
25. Implementing effective nitrogen management at farm level is an effective strategy to increase the nitrogen use efficiency and to decrease nitrogen losses. It involves implementing an iterative set (cycle) of common management activities, carried out annually:
a. Analysis: what arei. the nitrogen demands of crops and animals,
ii. the available nitrogen sources, iii. the storage conditions and possible leakages, iv. the available techniques, methods, procedures for using nitrogen
efficientlyb. Decision making, including:
i. development of options on the basis of the previous analyses,ii. assessment of the consequences of the various options, and
iii. selecting the best option for achieving both agronomic and environmental targets.
c. Planning, includingi. working out in broad outline the things that need to be done and
measured: when and where and how and with how much. ii. making the actual plan, that allocates the available nutrients in a way
that maximizes the economic benefit, while minimizing the environmental impact and satisfying environmental limits.
d. Execution, i.e., i. implementation of the nitrogen management plan in practice,
ii. taking into account actual environmental conditions, iii. taking into account best management guidelines and recommendations.
e. Monitoring and control, i.e. i. collecting data on yield and nitrogen contents.
ii. making nitrogen input-output balancesf. Evaluation (verification and control of achievements relative to the set
objectives) including:i. nitrogen surplus
ii. nitrogen use efficiency (NUE)
26. The nitrogen input-output balance (also referred to as the farm-gate balance) can be seen as the monitoring tool to help achieve improvement in nitrogen management. It records at the farm level all nitrogen inputs and all nitrogen outputs in useful products. The difference between total nitrogen inputs and total nitrogen outputs is the nitrogen surplus (Nsurplus),
20

while the ratio between total nitrogen output in useful products and total nitrogen input is a measure of the nitrogen use efficiency (NUE). The Nsurplus is an indicator for the pressure on the environment, and is expressed in terms of nitrogen per ha per year. NUE is an indicator for the efficiency of resources use (how much protein-N in food is produced per unit of input nitrogen) and is expressed in terms of kg per kg. Both, Nsurplus and NUE depend highly on farming systems and management level. Indicative target values can be set for both Nsurplus and NUE, depending again on farming system and management level.
27. Nitrogen input-output balances have been used in research for more than 100 years and also on farms in some countries for more than 10 years now, also as regulatory tool. However, there is less experience with the use of input-output nitrogen balance as a tool to decrease NH3 emissions specifically. The effectiveness of nitrogen input-output balances to decrease NH3 emissions is greatest on farms with high livestock density. Constructing nitrogen input-output balances at farm level requires knowledge about bookkeeping in general and about nitrogen inputs and outputs. The experience so far is that these balances are easily understood by farmers and therefore can be used easily in communications and for comparing different farms and their performances. This is especially the case because an improvement in the N balance provides the basis for farmers to reduce costs in the purchase of mineral fertilizers. Similarly, for ‘organic’ farmers, where mineral fertilizers are not used, improving the nitrogen balance makes better use of nitrogen as a scarce resource on the farm.
28. Nsurplus and NUE depend on farming system and on the agronomic and environmental objectives. Hence, target levels for Nsurplus and NUE are farm-type-specific, and must be considered and evaluated from a regional perspective.
29. The progress in nitrogen management can be evaluated on the basis of changes in Nsurplus and NUE over time, for a specific farm or group of farms. A five-year period should be considered to account for inter-annual variations in weather conditions or incidental losses. Improvement in nitrogen management will be reflected in decreases in Nsurplus and increases in NUE. The improvement in nitrogen management can continue until a level of ‘best management practice’ has been achieved. This ‘best management level’ is commonly set by experimental farms or by the upper 5 percentile of practical farms. Hence, the improvement in nitrogen management performance can continue until the farms achieve the level that has been achieved by the upper 5 percentile of practical farms. Farms in Denmark and The Netherlands have been able to achieve decreases in Nsurplus and increases in NUE of the order of 30% in 5-year periods and 50% in 10-year periods (e.g. Mikkelson et al., 2010; Oenema et al., 2011). Further decreases in Nsurplus and further increases in NUE slow down greatly once a level of ‘best management practices’ has been achieved.
30. Indicative target levels for Nsurplus and NUE are presented in Table 2. Note, that NUE is related inversely and non-linearly to Nsurplus.
31. The costs of making a nitrogen N input-output balance are in the range of 200 to 500 euros per farm per year, depending on the farming system and on the assistance of accountancy and/or advisory services. The costs tend to decrease over time (learning effect).
21

32. The net cost of improving nitrogen management and thereby increasing NUE and decreasing Nsurplus are in the range of -1 to +1 euro per kg N (TFRN Workshop on economic cost of ammonia emission abatement, Paris, October 2010). The net costs are the result of gains through fertilizer savings and increased production performances and gross cost related to sampling and analyses, training and advisory costs.
33. National nitrogen budgets for agriculture provide insight into (i) the nitrogen cost of food production, (ii) nitrogen losses associated with food production at national level and (iii) possible options for improving NUE at national level. National nitrogen budgets when expressed in terms of kg per ha per year also provide a means of comparing agricultural sectors of different UN-ECE countries and assessing progress toward reduced overall losses from national nitrogen cycles. Uniform formats and procedures (on-line) have been established for constructing such national nitrogen budgets.
Table 2. Indicative ranges for target Nsurplus and NUE as function of farming system, crop species and animal categories.
Farming systems
Species/ categories
NUE, kg N removed /kg N applied
Nsurplus, kg/ha/yr
Comments
Specialized cropping systems
Arable crops 0.6-0.9 0-50 Cereals have high NUE; Root crops have low NUE
Vegetables 0.4-0.8 50-100 Leafy vegetables have low NUEFruits 0.6-0.9 0-50
Grassland-based
Dairy cattle 0.3-0.5 100-150 High milk yield, high NUE; Low stocking density, low Nsurplus; presence of legumes improves NUE
Ruminant systems
Beef cattle 0.2-0.4 50-150 Veal production, high NUE; 2yr old beef cattle, low NUE
Sheep & goat 0.2-0.3 50-150
Mixed crop-animal systems
Dairy cattle 0.4-0.6 50-150 High milk yield, high NUE; Concentrate feeding, high NUE
Beef cattle 0.3-0.5 50-150Pigs 0.3-0.6 50-150Poultry 0.3-0.6 50-150Other animals 0.3-0.6 50-150
Landless systems
Dairy cattle 0.8-0.9 0-1000 N Output via milk, animals and manure ~equals N input; Nsurplus is gaseous N losses from storages. Low N surplus is accomplished with manure eports
22
Beef cattle 0.8-0.9 0-1000Pigs 0.7-0.9 0-1000Poultry, 0.6-0.9 0-1000Other animals 0.7-0.9 0-1000
23

IV. LIVESTOCK FEEDING STRATEGIES
34. Gaseous nitrogen losses from livestock production originate from the feces (dung) and urine excreted by the livestock. The animal feed composition and the feed management has a strong influence on animal performance and on the composition of the dung and urine, and thereby also on the emissions of ammonia (NH3). This section focuses on feeding strategies to reduce NH3 emissions. Supplementary information about ‘feeding strategies’ is provided in Appendix 2.
35. Reference techniques. The abatement strategies described in this chapter are not defined and assessed against a uniform “reference” (or unabated or baseline) feeding strategy, because these “reference” feeding strategies are different for different UNECE Countries. Further, a distinction has to be made between different animal categories, as animal feed requirements and the resulting nitrogen excretion greatly differ between animal categories.
36. Low-protein animal feeding is one of the most cost-effective and strategic ways of reducing NH3 emissions. For each percent (absolute value) decrease in protein content of the animal feed, NH3 emissions from animal housing, manure storage and the application of animal manure to land are decreased by 5 to 15%, depending also on the pH of the urine and dung. Low-protein animal feeding also decreases N2O emissions, and increases the efficiency of nitrogen use in animal production. Moreover, there are no animal health and animal welfare implications as long as the requirements for all amino acids are met.
37. Low-protein animal feeding is most applicable to housed animals and less for grassland-based systems with grazing animals, because grass is in an early physiological growth stage and thus high in degradable protein, and grassland with leguminous species (e.g. clover and lucerne) have a relatively high protein content. While there are strategies to lower the protein content in herbage (balanced N fertilization, grazing/harvesting the grassland at later physiological growth stage, etc.), as well as in the ration of grassland-based systems (supplemental feeding with low-protein feeds), these strategies are not always fully applicable.
38. The economic cost of animal feeding strategies to lower the NH3 volatilization potential of the animal excrements through adjusting the crude protein content, depends on the initial animal feed composition and on the prices of the feed ingredients on the market. In general, the economic costs range from -2 to +2 euro per kg NH3-N saved, i.e. there are potential net gains and potential net costs. Commonly, the economic costs increase when the target for lowering the NH3 volatilization potential increases. The increasing marginal costs relate in part to the cost of synthetic amino acids supplementation relative to using soya beans. The costs of amino acids supplementation tend to go down. The cost of supplementation of amino acids increases when the target protein content in the animal feed is lowered.
24

Category 1 feeding strategies for dairy and beef cattle
39. Lowering crude protein of ruminant diets is an effective and category 1 strategy for decreasing NH3 loss. The following guidelines hold (Table 3):
The average CP content of diets for dairy cattle should not exceed 150 – 160 g/kg DM (Broderick, 2003; Svenson, 2003). For beef cattle older than 6 months this could be further reduced to 120 g/kg DM.
Phase feeding can be applied in such a way that the CP content of dairy diets is gradually decreased from 160 g/kg DM just before parturition and in early lactation to below 140 g/kg DM in late lactation and the main part of the dry period.
Phase feeding can also be applied in beef cattle in such a way that the CP content of the diets is gradually decreased from 160 g/kg DM to 120 g/kg DM over time.
Table 3: Indicative target levels for crude protein (CP) content, in gram per kg of the dry mass of the ration, and resulting efficiency of cattle N utilisation (NUE), in mass fractions (kg/kg) for cattle (see text)
Cattle species CP, g/kg NUE of cattle product kg/kg
Milk + maintenance, early lactation 150-160 0.30Milk + maintenance, late lactation 120-140 0.25Replacement 130-150 0.10Veal 170-190 0.45Cattle <3 months 150-160 0.30Cattle 3-18 months 130-150 0.15Cattle >18 months 120 0.05
40. In many parts of the world, cattle production is land-based or partly land-based. In such systems protein rich grass and grass products form a significant proportion of the diet, and the target values for crude protein noted in Table 3 may be difficult to achieve, given the high CP content of grass from managed grasslands. The CP content of fresh grass in the grazing stage (2000-2500 kg DM per ha) is often in the range of 180 to 200 g/kg (higher when legumes present), the CP content of grass silage often between 160 and 180 g/kg and the CP content of hay between 120 and 150 kg/kg (e.g., Whitehead, 2000). In contrast, the CP content of maize silage is only about 70 to 80 g/kg. Hence, grass-based diets often contain a surplus of protein and the magnitude of the resulting high N excretion strongly depends on the proportions of grass, grass silage and hay in the ration and the protein content of these feeds. The protein surplus and the resulting N excretion and NH3 losses will be highest for grass (or grass-legume)-only summer rations with grazing young, intensively fertilized grass or grass legume mixtures. However, urine excreted by grazing animals typically infiltrates into the soil before substantial NH3 emissions can occur and overall NH3 emissions per animal are therefore less for grazing animals than for those housed where the excreta is collected, stored and applied to land.
25

41. The NH3 emission reduction achieved by increasing the proportion of the year the cattle spent grazing outdoors will depend on the baseline (emission of ungrazed animals), the time the animals are grazed, and the N fertilizer level of the pasture. The potential to increase grazing is often limited by soil type, topography, farm size and structure (distances), climatic conditions, etc. It should be noted that grazing of animals may increase other forms of N emissions (e.g. On porous soils, the NO3 may leach and on fine soils urine patches may contribute to N2O, especially in compacted areas). However, given the clear and well quantified effect on NH3 emissions, increasing the period that animals are grazing all day can be considered as a category 1 strategy to reduce emissions. The actual abatement potential will depend on the base situation of each animal sector in each country. The effect of changing the period of partial housing (e.g. grazed during daytime only) is less certain and is rated as a category 2 strategy. Changing from a fully housed period to grazing for part of the day is less effective in reducing NH3 emissions than switching to complete (24 hour) grazing, since buildings and stores remain dirty and continue to emit NH3. Grazing management (strip grazing, rotational grazing, continuous grazing) is expected to have little additional effect on NH3 losses and is considered a category 3 strategy.
42. In general, increasing the fibre?energy/protein ratio in the diet by using ‘older’ grass (higher sward surface height, SSH) and/or supplementing grass by high energy feeds (e.g., silage maize) is category 1 strategy. However, for grassland-based ruminant production systems, the feasibility of these strategies may be limited, as older grass may reduce feeding quality, especially when conditions for growing high energy feeds are poor (e.g. warm climates), and therefore have to be purchased. Hence, full use of the grass production would no longer be guaranteed (under conditions of limited production, e.g. milk quotas or restrictions to the animal density). Hence, improving the energy/protein equilibrium on grassland-based farms with no possibilities of growing high energy feeds is therefore considered a category 2 strategy.
Category 1 feeding strategies for pigs
43. Feeding measures in pig production include phase feeding, formulating diets based on digestible/available nutrients, using low-protein amino acid-supplemented diets, and feed additives/supplements. These are all considered category 1 techniques. Further techniques are currently being investigated (e.g. different feeds for males (boars and castrated males) and females) and might be additionally available in the future.
44. The crude protein content of the pig ration can be reduced if the amino acid supply is optimised through the addition of synthetic amino acids (e.g. lysine, methionine, threonine, tryptophan) or special feed components, using the best available information on “ideal protein’ combined with dietary supplementation.
45. A crude protein reduction of 20 to 30 g per kg of feed can be achieved depending on pig production category and the current starting point. The resulting range of dietary crude
26

protein contents is reported in Table 4. The values in the table are indicative target levels and may need to be adapted to local conditions. It has been shown that a decrease of 10 g per kg of crude protein in the diet of finishing pigs, results in a 10% lower TAN (total ammonia nitrogen) content of the pig slurry and a 10% lower NH3 emissions (Canh et al., (1998b).
Table 4: Indicative target crude protein levels in feed for pig rations (Adopted from BREF,2003) Species Phases Crude protein content, % *)Weaner < 10 kg 19–21Piglet < 25 kg 17–19Fattening pig 25–50 kg 15–17
50–110 kg 14–15>110 kg 12-13
Sows Gestation 13–15Lactation 15–17
*) With adequately balanced and optimal amino acid supply
Category 1 feeding strategies for poultry
46. For poultry, the potential for reducing N excretion through feeding measures is more limited than for pigs because the conversion efficiency currently achieved on average is already high and the variability within a flock of birds is greater. A crude protein reduction of 1 to 2 per cent (10 to 20 g/kg of feed) can usually be achieved depending on the species and the current starting point. The resulting range of dietary crude protein contents is reported in Table 5. The values in the table are indicative target levels, which may need to be adapted to local conditions. Further applied nutrition research is currently being carried out in EU Member States and North America and this may support further possible reductions in the future. A reduction of the crude protein content by 1-2% is a category 1 measure for growers and finishers.
Table 5: Indicative target crude protein levels in feed for poultry (Adopted from BREF-2003)Species Phases Crude protein content, % *)Chicken, broilers Starter 20–22
Grower 19–21Finisher 18–20
Chicken, layers 18–40 weeks 15.5– 16.540+ weeks 14.5– 15.5
Turkeys < 4 weeks 24–275–8 weeks 22–249–12 weeks 19 –2113+ weeks 16-1916+ weeks 14 –17
*) With adequately balanced and optimal amino acid supply
27

V. LIVESTOCK HOUSING
47. Animal housing varies enormously across the UN/ECE region and NH3 emissions will vary accordingly. In general, emissions from livestock housing will be reduced if the surface area of exposed manures is reduced and/or such manures are frequently removed and placed in covered storage outside the building. Emission reductions can also be achieved in poultry housing by drying manure and litter to a point where NH3 is no longer formed by hydrolysis of uric acid. Many of the options for reducing emissions from housing can be implemented only for newly built houses. Others require significant structural changes or energy inputs. For these reasons they are often more expensive than improved techniques for livestock diets, manure storage and the application of manure to land.
48. Reference techniques. The level of NH3 emission reduction achieved through new livestock housing designs will depend critically? on the housing types currently in use. The reference techniques are described according to each livestock type.
A. Housing systems for dairy and beef cattle
49. Techniques to reduce NH3 emissions in cattle housing apply one or more of the following principles:
- Decreasing the surface area fouled by manure;- Adsorption of urine (e.g. by straw);- Rapid removal of urine; rapid separation of faeces and urine;- Decreasing of the air velocity above the manure except where manure is being dried;- Reducing the temperature of the manure and of surfaces it covers;- Increased grazing;
50. Housing systems for cattle vary across the UN/ECE region. While loose housing is most common, dairy cattle are still kept in tied stalls in some countries. In loose housing systems all or part of the excreta is collected in the form of slurry. In systems where solid manure is produced (such as straw-based systems), it may be removed from the house daily or it remain there for up to the whole season, such as in deep litter stables. The system most commonly researched is the “cubicle house” for dairy cows, where NH3 emissions arise from fouled slatted and/or solid floors and from manure pits and channels beneath the slats/floor.
51. Reference Systems: Two references apply for cattle housing depending on national practices: the cubicle house and the tied animal house. In Table 6, cubicle housing is referred to as reference 1, while tied housing is reference 2. Buildings in which the cattle are held in tied stalls emit less NH3 than loose housing, because a smaller floor area is fouled with dung and urine. However, tied systems are not recommended because of animal welfare considerations.
28

52. Animal welfare considerations tend to lead to an increase of the soiled walking area per animal, increased ventilation, and a corresponding increase of emissions. Changes in building design to meet new animal welfare legislation in some countries (e.g. changing from tied stall to cubicle housing) will therefore increase NH3 emissions unless other measures are introduced at the same time to combat this increase. Importantly changes in building design to meet animal welfare requirements represent an important opportunity to introduce NH3
mitigation measures at the same time, thereby reducing the costs of the mitigation measures. Note that tied systems can be compatible with animal welfare considerations if daily exercise periods are applied
53. Solid versus slurry manure systems. Research to date has shown that straw-based systems for cattle are not likely to emit less NH3 in the animal houses than slurry-based systems. Further, nitrous oxide (N2O) and di-nitrogen (N2) losses due to (de)nitrification tend to be larger in litter-based systems than slurry-based systems. However, straw-based systems producing solid manure can give less NH3 emission than slurry after spreading the manure on the surface of fields (e.g., Powel et al., 2008a) although slurry systems provide more opportunity for reduced emissions applicators. Similarly, the physical separation of faeces (which contains urease) and urine in the housing system can reduce emissions both during housing and at the time of manure spreading (Burton, 2007; Fanguiro et al., 2008a, 2008b; Moller et al., 2007). Verification of any NH3 emission reductions from using solid-manure versus slurry-based systems and from solid-liquid separation should consider all the stages of emission (housing, storage, land application).
Category 1 techniques
54. In the "grooved floor" system for dairy and beef cattle housing, the use of a “toothed” scraper running over a grooved floor is a reliable technique to abate NH3 emissions. Grooves should be equipped with perforations to allow drainage of urine. This results in a clean, and therefore reduced-emission floor surface, while still providing enough grip for the cattle to prevent problems of slipping. Ammonia emission reduction ranges from 25-46% relative to the reference system (Smits, 1998; Swierstra et al., 2001).
55. In houses with traditional slats (either non-sloping, 1% sloping or grooved), an optimal barn climatization with roof insulation (RI) and/or automatically controlled natural ventilation (ACNV) can achieve a moderate emission reduction (20%) due to the decreased temperature (especially in summer) and reduced air velocities (Braam et al., 1997a; 1997b; Smits, 1998; Monteny, 2000).
56. Decreasing the amount of animal excrements in animal housing systems through increased grazing is an effective measure to decrease ammonia emissions. Though emissions from grazing animal will increase, the emissions from animal housing systems decrease much more provided surfaces are clean (see grazing above). Total emissions (from housing, storage and spreading) from ruminant systems may decrease by up to 15% (Webb et al., 2005).
29

Category 2 techniques
57. Different improved floor types based on slats or solid, profiled concrete elements have been tested in the Netherlands. These designs combine emission reduction from the floor (increased run off of urine) and from the pit (reduction of air exchange by rubber flaps in the floor slots). The emission abatement efficiency depends on the specific technical characteristics of the system,
58. Bedding material in animal housing can have impacts on NH3 emissions. The physical characteristics (urine absorbance capacity, bulk density) of bedding materials are of more importance than their chemical characteristics (pH, cation exchange capacity, carbon to nitrogen ratio) in determining ammonia emissions from dairy barn floors (Misselbrook and Powell, 2005; 2008a; Gillespy et al., 2009). Ammonia emissions were significantly lower from sand (23% of applied urine N), followed by pine shavings (42% of applied urine N), than from the other four (straw, newspaper, cornstalks and recycled manure solids) bedding types (mean 63% of applied urine N). Ammonia emissions (g/cow/d) from manure solids (20.0), newspaper (18.9) and straw (18.9) were similar and significantly greater than emissions using pine shavings (15.2). Note that sand bending may interfere with manure handling and low emission spreading equipment.
59. Chemical air scrubbers are effective in decreasing NH3 emissions from animal houses, but are less applicable to naturally vented cattle housing. Although such scrubbers have been demonstrated to be very effective for pig housing systems (see paras. 73-75), for cattle housing they are currently considered a category 2 technique (Ellen et al., 2008).
Category 3 techniques
60. Scraping and flushing systems. A number of systems have been tried involving the regular removal of the slurry from the floor to a covered store outside of the building. These involve flushing with water, acid, diluted or mechanically-separated slurry, or scraping with or without water sprinklers. In general, these systems have proved to be ineffective or too difficult to maintain. The use of smooth and/or sloping floors to assist in scraping or flushing has given rise to problems with animals slipping and potentially injuring themselves. These systems are therefore considered as category 3 techniques.
61. Table 6 gives emissions from different cattle housing systems (reference systems and category 1 and 2 techniques).
Table 6: Ammonia emissions of different cattle housing systems (reference systems and category 1 and 2 techniques)
Housing type Reduction(%)
c/ Ammonia emission(kg/cow place/year)
30

Tied systema/ (Reference 2) 60 4.8Grooved floor (Cat. 1) 25 9Optimal barn climatization with roof insulation (Cat. 1) 20 9.6Chemical air scrubbers (forced ventillation systems only) (Cat. 2) 70-95 1.2Bedding of sand (solid manure system only) (Cat. 2) 60 4.8Bedding of pine shavings (solid manure system only) (Cat. 2) 30 8.4
Cubicle house (Reference 1) 0 12d/
Bedding of straw (Cat. 2) 50%Grazing 12h/24h (Cat. 1), relative to ref 1 20% 9.6e Grazing 18h/24h (Cat. 1) relative to ref 1 57% 5.2e Grazing 22h/24h (Cat. 1) relative to ref 1 79% 2.5e a/ Tied systems are not favoured for animal welfare reasons. Any conversion from tied stall to cubicle houses
(e.g. to meet welfare requirements) should address the opportunity to include NH3 emission mitigation measures at the same time.
c/ Emissions with full time housing of the animals. With grazing, emissions are potentially reduced if surfaces are kept clean (see grazing).
d/ Based on a walking area of 4-4.5 m2 per cow and permanent housing.e/ These numbers hold for the hypothetical situation of ‘whole-year round grazing’. Grazing for part days requires
that barn surfaces are always kept cleabn If grazing is practiced for just half of the year, emission reduction percentages must be multiplied by 0.5.
B. Housing systems for pigs
62. Reference system: Emissions from fully slatted pig houses with a storage pit underneath are taken as the reference, although in some countries these systems are prohibited for animal welfare reasons.
63. Designs to reduce NH3 emissions from pig housing systems have been described in detail in BREF (2003), and apply the following principles:
(a) Reducing emitting manure surfaces (soiled floor, slurry surface in channels with sloped walls). Partly slatted floors (some 50% area), generally emit less NH3, particularly if the slats are metal- or plastic-coated, allowing the manure to fall more rapidly and more completely into the pit below. Emissions from the solid part of the floor can be reduced by using an inclined or convex, smoothly finished surface, by appropriate location of the feeding and watering facilities to prevent fouling the solid areas and by good climate control;
(b) Removing the manure (slurry) from the pit frequently to an external slurry store (e.g. rapid removal of manure from pits can be achieved by vacuum removal systems or gravity systems operated at least twice a week; flushing systems);
(c) Additional treatment, such as liquid/solid separation;(d) Cooling the manure surface: Cooling of the surface of the manure in the under-
floor pit to 12º C or less by pumping groundwater through a floating heat ex-changer can substantially reduce NH3 emissions. A readily-available source of groundwater is required and the system may not be allowed where drinking water is extracted. There may be significant costs to setting up such a system;
(e) Changing the chemical/physical properties of the manure (after excretion), such as decreasing pH;
31
paule, 02/04/12,
Accdording to papragraph 41 these are all cat 2.
paule, 02/04/12,
The 60% reduction in tied system is confusing. I would leave this as ‘0’ or blank since the lower base level is shown as 4.8 vs 12.0

(f) Using surfaces which are smooth and easy to clean;(g) Treatment of exhaust air by acid scrubbers or biotrickling filters;(h) Lowering the indoor temperature as animal welfare and production allow;(i) Reducing ventilation rate taking into account the minimum levels required
for animal welfare and health reasons;(j) Reducing air flow over the manure surface
64. Concrete, steel and plastic are used in the construction of slatted floors. Generally speaking, and given the same slat width, manure dropped on concrete slats takes longer to fall into the pit and this is associated with greater emissions of NH3 than when using steel or plastic slats. It is important to note that steel slats are not allowed in some countries, for animal welfare reasons.
65. Frequent removal of manure by flushing with slurry may result in a peak in odour emissions with each flush. Flushing is normally done twice a day: once in the morning and once in the evening. These peaks in odour emissions can cause nuisance to neighbours. Additionally treatment of the slurry also requires energy, unless passive systems are used where the plug is removed manually. These cross-media effects have been taken into account in defining BAT on the various housing designs.
66. With respect to bedding?litter, it is expected that the use of straw in pig housing will increase due to raised awareness of animal welfare. It may be applied in conjunction with (automatically) controlled naturally-ventilated housing systems, where straw would allow the animals to control the temperature themselves, thus requiring less energy for ventilation and heating. In systems where litter is used, the pen is sometimes divided into a dunging area without litter and a solid floor area with litter. It is reported that pigs do not always use these areas in the correct way and dung in the littered area and use the slatted area to lie on to cool off in warm weather. Although the pen design can influence the behaviour of the pigs, it is reported that in regions with a warm climate this might not be sufficient. Integrated evaluation of benefits of straw use includes the extra costs for straw supply and mucking out as well as the possible consequences for emissions from storage of farmyard manure and for the application onto land. The use of straw bedding results in farmyard manure that has the benefit of increasing the organic matter (carbon storage) of the soils, although the opposite may be true for the fields that have had straw removed. .
67. Reference technique for growers/finishers: Growers/finishers are always housed in a group and most of the systems for group housing of sows apply here as well. The reference system for growers/finishers is a fully slatted floor with a deep manure pit underneath and mechanical ventilation. The associated emission level range is between 2.39 and 3.16 kg NH3 per pig place per year. The system has been applied commonly throughout Europe.
32

68. Reference technique for farrowing sows: Farrowing sows in Europe are generally housed in crates with steel and/or plastic slatted floors and a deep manure pit underneath. In the majority of the houses, sows are confined in their movement, with piglets walking around freely. All houses have controlled ventilation and often a heated area for the piglets during the first few days. The difference between fully and partly slatted floors is not so distinct in the case of farrowing sows, where the sow is confined in its movement. In both cases, manuring takes place in the same slatted area. Reduction techniques therefore focus predominantly on alterations in the manure pit.
69. Reference technique for mating and gestating sows: Mating and gestating sows are housed individually or in a group. Group-housing systems require other feeding systems (e.g. electronic sow feeders) and a pen design that influences sow behaviour (use of manure and lying areas). Group housing is compulsory in new sow housing throughout EU Member States and as from 2013 all mating and gestating sows, for four weeks after being served or inseminated, will have to be housed in groups. Group-housing systems have similar emission levels to those from individual housing, if identical emission reduction techniques are applied. The reference system for housing of mating and gestating sows is the fully slatted floor (concrete slats) with a deep pit.
70. Reference technique for weaners: Weaners are housed in groups in pens or flat decks (raised pen). In principle, manure removal is the same for a pen and a flat deck design. It is assumed that in principle, reduction measures applicable to conventional weaner pens can also be applied to the flat deck. Straw-based systems with solid concrete floors are conditional BAT, but cannot be assigned to a category as no data on NH3 emissions have been reported.
Category 1 techniques
71. Partly slatted floors (some 50% area) generally emit less NH3, particularly if the slats are metal- or plastic-coated, allowing the manure to fall more freely?rapidly and more completely into the pit below. Emissions from the solid part of the floor can be reduced by using an inclined or convex, smoothly finished surface, by appropriate siting of the feeding and watering facilities to prevent fouling the solid areas and by good climate control. Results in France have shown that partly slatted floor could induce a 40-60% increase in NH3 emissions if pigs foul mainly the un-slatted area? So careful management is needed (Guigand and Courboulay, 2007; Ye et al., 2008a, 2008b).
72. A housing system has been developed incorporating manure surface cooling fins using a closed system with heat pumps. It performs well therefore it can be classified as Category 1 technique, but is a very costly system. In new constructions and major? retrofit situations this technique can be economically viable, but this has to be decided on a case-by-case basis. It should be noted that energy efficiency can be less in situations where the heat that removed from cooling the barns is not used, because e.g. there are no weaners to be kept warm (Huynh et al., 2004).
33

73. New designs for pig housing should, ideally, integrate the floor, manure pit and removal system with pen geometry to influence drinking and dunging areas in combination. Manure pit surface area can be reduced by using, for example, manure pans, manure gutters or small manure channels. This integrated design is considered as category 1 technique.
74. Treatment of exhaust air by acid scrubbers or biotrickling filters is another option that has proven to be practical and effective for large scale operations in Denmark, Germany and the Netherlands (e.g., Melse et al., 2006). A number of manufacturers provide scrubber and trickling filters that are subject to field test and certification procedures in these countries to be admitted for practical use (Category 1). They are most economically practical when installed into ventilation systems during the building of new houses. Application in existing housing demand extra costs to modify ventilation systems. Further information is desirable on the suitability of these systems for housing systems in South and Central Europe.
75. Acid scrubbers mainly apply sulphuric acid in their recirculation water to bind ammonia as ammonium sulphate and have demonstrated ammonia removal efficiencies between 70 and 95 per cent, depending on their pH-set values. Nitrogen is removed out of the system by controlled discharge of recirculation water that contains the ammonium sulphate solution. In biotrickling filters, ammonia is converted to nitrate by biomass on the synthetic package material and in the recirculation water. Ammonia removal efficiencies of 70 per cent can be guaranteed for properly designed filters. Operational costs of both acid scrubbers and trickling filters are especially dependent on the extra energy use by water recirculation and increased back pressure on the fans. However, the high ammonia removal capacity of scrubbers enables scales of farming operations that outweigh the higher operational costs in several parts of Europe.
76. Wet scrubbers (water only) have been tested in France and results show a reduction of odors and ammonia above 50% if the air velocity is less than 1.5 m.s-1. The NH3 emission reduction efficiency of such scrubber is in the range of 40 to 90%. Furthermore, efficiencies towards odor and particulate matter are 75% and 70%, respectively (Guinand, 2009). The fogging technology has also been implemented to cool housings when warm summers occur. Emission reductions range from 22% to 30%. Furthermore, particulate matter and odors emission reductions can be achieved of 14-46% and 12-23%, respectively.
77. Table 7 provides an overview of the low emission housing and emission reduction techniques for pig houses, including the emission reduction percentages and the estimated cost of the low-emission techniques. Some of the techniques are costly, especially when applied in existing housing systems. Further, the estimated costs show a wide range, because the cost will depend on the farm-specific conditions. Evidently, the choice of the technique and low-emission systems must be considered from a whole-farm perspective. When considered from a whole-farm perspective, the costs/benefits of low-emission techniques and systems may be much lower than in the case techniques that reduce emissions downstream compared to the summed costs of several individual techniques.
34

78. Denmark and The Netherlands have acquired considerable experience with implementation of low-emission techniques and housing systems. A recent study showed that the overall mean cost of NH3 emission reduction from pig housing systems in The Netherlands in 2007 was 0.016 euro per kg of pig produced (Baltussen et al., 2010). By that time all large farms (IPPC farms), had low emission techniques installed with an emission reduction target of 40-60%. These costs relate to the low-emission housing and covered storages. The estimated cost will be 0.036 euro per kg of pig produced (carcass weight) in 2013 when all pig farms (including also small farms) have to fulfill the low-emission targets (and animal welfare restrictions) in The Netherlands. When assuming that about 200 kg of pig meat is produced per pig place per year, the total mean cost of the NH3
emission reduction measures in the Netherlands are 7.2 euro per pig place. This is an upper estimate, as all cost for the NH3 emission reduction measures for housing and slurry storages are transferred to fatteners, while a significant fraction of the NH3 also originates from the sows and piglets. The mean costs expressed in euro per kg saved are estimated 3 euro per kg N saved. This estimate may be used as a robust mean for the whole sector in The Netherlands.
79. Apart from the cost of low-emission techniques, there are also benefits of low emission housing, in terms of a higher feed conversion rate; the feed costs reduce by 1-3% (Baltussen et al., 2010). These reduced feed costs are approximately equivalent to the operational cost of air scrubbers (about 5 euro per fattening pig place per year). The investment costs of scrubbers are 60-80 euro per pig place or 5-10 euro per fattening pig place per year based on the life expectancy of the scrubbers. Replacing scrubbers is less costly than installing new ones.).
Table 7: Category 1 techniques: reduction and costs of low-emission housing systems for pigs
Category (% Reduction)
Extra Cost(€/place per
year)
Extra Cost(€/kg pig
produced) (**)
Ammonia emission (kg NH3/place per year) (*)
ExtraCost (€/kg NH3 reduced)
Pig housing (Existing) Gestating Sows 2.7
Partially slatted floor with reduced pit 20 – 50 5.69 – 6.83 0.0021 –
0.0030 4.21 - 12.65
Frequent manure removal 25 0 0 0Lactating Sows 3.73
Combination water manure channel 52 16.74 –
20.090.0021 – 0.0025 8.63 – 10.36
Manure pan underneath 32 - 65 30.98 – 37.17
0.0039 – 0.0046
12.80 – 31.23
Piglets (6 - 20 kg) 0.72
35
Oenema, Oene, 02/04/12,
This technique should be discusses also in the text

Category (% Reduction)
Extra Cost(€/place per
year)
Extra Cost(€/kg pig
produced) (**)
Ammonia emission (kg NH3/place per year) (*)
ExtraCost (€/kg NH3 reduced)
Manure channel with sloped floor 30 - 60 1.27 – 2.67 0.0015 –
0.0031 2.94 – 12.36
Partially slatted floor with reduced pit 25 - 35 0.88 – 2.25 0.0010 –
0.0026 3.49 – 12.50
Frequent manure removal 25 0 0 0Growers - Finishers (20 – 100 kg) 3.16
Manure channel with sloped floor 10 - 30 6.45 – 7.74 0.0219 –
0.0263 4.08 – 12.25
Partially slatted floor with reduced pit 30 - 35 3.61 – 4.33 0.0123 –
0.0147 4.57 – 3.26
Frequent manure removal 30 - 60 0 0 0Pig housing (New build)
Gestating Sows 2.7
Partially slatted floor with reduced pit 20 – 50 0 0 0Frequent manure removal 25 0 0 0Lactating Sows 3.73
Combination water manure channel 52 3.29 – 3.95 0.0004 –
0.0005 1.70 – 2.04
Manure pan underneath 32 - 65 17.52 – 21.02
0.0022 – 0.0026 17.66 – 7.24
Piglets (until 20 kg) 0.72
Manure channel with sloped floor 30 - 60 0 – 0.25 0 – 0.0003 0 – 1.16Partially slatted floor with reduced pit 25 - 35 0 0 0 Frequent manure removal 25 0 0 0Growers - Finishers (20 – 100 kg) 3.16
Manure channel with sloped floor 10 - 30 0 – 0.73 0 – 0.0025 0 – 2.31Partially slatted floor with reduced pit 30 - 35 0 0 0 Frequent manure removal 30 - 60 0 0 0Air scrubbing techniques 40 - 95 0 - 7 0 – 0.04 0 - 3(*) non official data, in revision (**) % gestating sows = 75% productive sows; Sow production = 20 pigs (100 kg) per sow per year; Pig marketed = 100 kg body weight
36
Oenema, Oene, 02/04/12,
This technique should be discusses also in the text

C. Housing systems for poultry
80. Designs to reduce NH3 emissions from poultry housing systems apply the following principles:
(i) Reducing emitting manure surfaces;(ii) Removing the manure frequently to an external slurry store (e.g. rapid re-
moval of manure can be achieved by belt removal systems; (iii) Quickly drying the manure(iv) Additional treatment, such as acidification;(v) Using surfaces which are smooth and easy to clean;(vi) Treatment of exhaust air by acid scrubbers or biotrickling filters;(vii) Lowering the indoor temperature as animal welfare and production allow;(viii) Reducing ventilation rate taking into account the minimum levels required for
animal welfare reasons;
i. Housing systems for laying hens
79. The evaluation of housing systems for layers in the European Union (EU) Member States has to consider the requirements laid down by the European Directive 1999/74/EC on housing of laying hens (EC, 1999). These requirements prohibit the installation of new conventional cage systems and lead to a total ban on the use of such cage systems by 2012. Therefore, only enriched cages (called also furniture cages) or non-cage systems, i.e. litter (or deep litter) housing system or aviary system, will be allowed thereafter. As these housing systems are fundamentally different from caged systems, these systems are described also briefly below and are meant as ‘reference systems’.
80. Reference system for Caged housing systems. This system foresees an open manure storage under the cages. Most laying hens in non EU states are still housed in conventional cages and most of the information on NH3 emission reduction addresses this type of housing.
81. Enriched cages. This system could be used as a replacement of conventional cages without a need for significant changes in design of existing building. Enriched cages offer the laying hens increased space and are equipped by areas for nesting, scratching and perches. Birds are kept in a group of 40 – 60 of hens. A (ventilated) belt placed under cages is the most common method of manure removal.
37

82. Reference system for non caged housing systems: Deep pit housing in combination with partly littered floor. A building equipped with this housing system is characteristically 80-90 cm high dropping pits covered with wooden or plastic slats or wire mesh. The manure is collected in pits under the slats. Pits take two-third of total floor space. Remaining one third of the floor is covered by litter. As litter, sand, wood shavings, straw or other materials can be used. The litter area is used for scratching and dust-bathing of hens. A stocking density of birds is not more than 9 hens per m² of floor space.
83. Aviary system (perchery). A building is divided into different functional areas used for feeding and drinking, egg laying, scratching and resting. The available surface area is increased by means of elevated slatted floors combined in stacks. A stocking density up to 18 hens per m² floor area is permitted. The same system of manure ventilation and removal as in cage systems can apply to some aviary systems where manure belts are placed under the tiers to collect the manure where the hens are free to walk around. Ventilated belts can be installed for collection, drying and removal of litter. Litter is provided on the floor of the hen house.
84. In some countries, the definition of “free range” includes deep-pit with partly littered floor (or deep litter) housing system or aviary system but with access of birds to outdoors. In other countries, laying hens in “free-range systems” are housed on solid or partly slatted floors. In these systems the solid floor area is covered with litter and the hens have some access to the outdoors. Manure accumulates either on the solid floor or under the slatted area for the laying period (about 14 months).
85. Ammonia emissions from battery deep-pit or channel systems can be lowered by reducing the moisture content of the manure by ventilating the manure pit.
86. The collection of manure on belts and the subsequent removal of manure to covered storage outside the building can also reduce NH3 emissions, particularly if the manure is dried on the belts through forced ventilation. The manure should be dried to a dry-matter content of 60–70% to reduce the formation of NH3. If the manure from the belts is collected in an intensively ventilated drying tunnel, inside or outside the building, the dry-matter content of the manure can reach 60 –80 % in less than 48 hours. Bi-weekly or even more frequent removal from the manure belts to covered storage has been shown to significantly reduce emissions compared with removal every week. In general, emission from laying hen houses with manure belts will depend on (a) The length of time that the manure is present on the belts; (b) The drying system; (c) The poultry breed; (d) The ventilation rate at the belt (low rate = high emissions) and (e) Feed composition.
87. The aviary systems with manure belts for frequent dropping collection and removal to a closed storage allow a significant emission reduction (higher than 70% compared to the deep litter housing system).
38

88. Reference system for non EU countries: Caged housing systems. This system foresees an open manure storage under the cages. Most laying hens in non EU states are still housed in conventional cages and most of the information on NH3 emission reduction addresses this type of housing.
89. Reference system for EU countries: Enriched cages. This system could be used as a replacement of conventional cages without a need for significant changes in design of existing building. Enriched cages offer the laying hens increased space and are equipped by areas for nesting, scratching and perches. Birds are kept in a group of 40 – 60 of hens. A ventilated belt placed under cages is the most common method of manure removal.
90. Deep litter housing system. A building equipped with this housing system is charac-tererized by 80-90 cm high dropping pits covered with wooden or plastic slats or wire mesh. The manure is collected in pits under the slats. Pits take two-third of total floor space. Remaining one third of the floor is covered by litter. As a litter sand, wood shavings, straw or other materials can be used. The litter area is used for scratching and dust-bathing of hens. A stocking density of birds is not more than 9 hens per m² of floor space.
91. Aviary system (perchery). A building is divided into different functional areas used for feeding and drinking, eggs laying, scratching and resting. All areas are covered with wooden or plastic slats or wire mesh. There could be installed ventilated manure belts for dropping collection and removal. A stocking density up to 18 hens per m² floor area is permitted. The same system of manure ventilation and removal as in cage systems can apply to some aviary systems where manure belts are placed under the tiers to collect the manure where the hens are free to walk around.
92. In some countries, the definition of “free range” includes deep litter housing system or aviary system but with access of birds to outdoors. In other countries, laying hens in “free-range systems” are housed on solid or partly slatted floors. In these systems the solid floor area is covered with litter and the hens have some access to the outdoors. Manure accumulates either on the solid floor or under the slatted area for the laying period (about 14 months).
Category 1 techniques
93. Ammonia emissions from battery deep-pit or channel systems can be lowered by reducing the moisture content of the manure by ventilating the manure pit.
94. The collection of manure on belts and the subsequent removal of manure to covered storage outside the building can also reduce NH3 emissions, particularly if the manure is dried on the belts through forced ventilation. The manure should be dried to a dry-matter content of 60–70% to prevent the formation of NH3. If the manure from the belts is
39
paule, 02/04/12,
Paragraph 88 -94 are similar to 80-86.

collected in an intensively ventilated drying tunnel, inside or outside the building, the dry-matter content of the manure can reach 60 –80 % in less than 48 hours. Weekly removal from the manure belts to covered storage has been shown to reduce emissions by 50% compared with removal every two weeks. In general, emission from laying hen houses with manure belts will depend on (a) The length of time that the manure is present on the belts; (b) The drying system; (c) The poultry breed; (d) The ventilation rate at the belt (low rate = high emissions) and (e) Feed composition.
95. Treatment of exhaust air by acid scrubber or biotrickling filters is a technique that has been successfully applied on in several countries (Ritz et al., 2006; Atterson and Adrizal, 2005; Zhao et al., 2011). It is highly effective in terms of ammonia removal (90%) and also in PM2.5 and PM10 removal. The high dust loads in poultry housings can complicate reliable long term functioning of current designs. The relatively high costs to treat the fully installed ventilation capacity have delayed wider application of the current generation of scrubbers in laying hens systems and is the reason that some Parties consider this as Cat. 2.
96. Treating poultry manure in non-caged housing systems with aluminum sulfate (alum) is a technique that is being practiced in Northern America. Regular addition of alum decreases ammonia emissions by up to 70%. This results in lower ammonia levels in the rearing facilities and improves poultry production, also because alum reduces particulate matter (PM2.5). The techniques of applying alum have been introduced originally as a procedure to lower phosphorus leaching losses from agricultural land following application of poultry manure. The treatment of poultry manure with alum has been well researched. Results so far indicate that the benefits are twice as large as the cost of applying alum. However, there is no experience with this technique in other countries.
97. An overview of emission reduction techniques for conventionally caged layers is shown in Table 8, for enriched caged housing systems in Table 9 and for non-caged layers in Table 10.
Category 2.
98. So-called “stilt houses”, where the removal of side walls from the lower areas used to store manures, can provide a highly effective means of ventilation although no data are available to enable a categorization of this approach.
40
paule, 02/04/12,
If Cat 1 why not in table?

Table 8: Caged housing systems (conventional and enriched cages) for laying hens (reference system): techniques and associated NH3 emission reduction potential
Category 1 kg NH3/year/
place
NH3
reduction (%)
Extra cost (€/place/ year
Cost (€/Kg NH3 abated/year)**)
Reference *)
Conventional cages, non-aerated open manure storage under cages (Reference Technique)
0.083 (0.220 in
warm regions)
0 0 0 1
Conventional cages, aerated open manure storage under cages to dry manure
30 0-2 1
Conventional cages, rapid manure removal to closed manure storage
50–80 0-4 1
Enriched cages (EC), ventilated belts, tworemovals a week (Reference Technique)
55 0 0 1
Enriched cages (EC), ventilated belts (with 0.7 m3 ventilation per animal unit) two removals a week
70 NA KG (NL) personal comm..
Enriched cages (EC), ventilated belts, three removals a week
65 0-1 0.35 (Spain)
2
Enriched cages (EC), ventilated belts (?), tworemovals a day
75 1-4 4.36 (Spain)
2
Chemical scrubbing of exhaust air (Cat 1; some members -e.g. Italy- consider Cat. 2).
75-95 5-8 1
*)1 BREF, 2003; 2. Draft revised BREF 2011**) NA refers to ‘not analysed’ yet;.
Table 9: Non-caged housing systems for laying hens: techniques and associated NH3 emission reduction potential Category 1 and 2 techniques
kg NH3/year/
place
NH3
reduction (%)
Extra cost (€/place/year
Cost (€/Kg NH3 abated/year)**)
Reference*)
Deep litter or deep pit with partial litter, perforated floor, manure belts (Reference Technique)
0.315 – 0.320 0 0 0 2
Slatted floors with below-floor ventiation (Cat. 1)
60 NA KG (NL) personal comm.
Aviaries, perch design, non ventilated manure belts (Cat. 1)
72 - 85 1-4 2
Aviaries, ventilated manure 81 - 95 1-6 2
41
paule, 02/04/12,
Listed as Cat 1 above

Category 1 and 2 techniques
kg NH3/year/
place
NH3
reduction (%)
Extra cost (€/place/year
Cost (€/Kg NH3 abated/year)**)
Reference*)
belts (Cat.1)
Chemical scrubbing of ex-haust air (Cat 1- some mem-bers -e.g. Italy- consider Cat. 2).
75-90 5-8 1
Deep litter, partly slatted, manure belts (Cat 2)
78 2-4 2
Deep litter with forced manure drying (Cat.2)
40-60 1-4 (---) 2
*) 1. BREF, 2003; 2. Draft revised BREF 2011**) NA refers to ‘not analysed’ yet;.
ii. Housing systems for broilers
99. Reference system for broilers: Traditionally, broilers are kept in buildings with a solid, fully littered floor. This is taken as the reference.
100. To minimize NH3 emission, it is important to keep the litter as dry as possible. The dry-matter content and the emission of NH3 depend on the (Table 11):
(a) Drinking-water system (avoiding leakage and spills);(b) Duration of the breeding period;(c) Animal density and weight;(d) Use of air purification systems;(e) Use of floor insulation;(f) Feed.(g) Type of litter
Category 1 techniques
101. Reducing spillage of water from the drinking system: A simple way of maintaining dry manure and reducing NH3 emission is to reduce the spillage of water from the drinking system (e.g. using a nipple drinking system).
102. Air scrubber technology to remove NH3 from ventilation air of broiler houses is highly effective (e.g. 90% removal), but has not been widely implemented yet, in part because of the economic costs involved. In The Netherlands, Germany and Denmark packed-bed filters and acid scrubbers for removal of ammonia from exhaust air of animal houses are off-the-shelf techniques for ammonia removal (70 - 95% average removal). At the moment a new generation of so-called "multi-pollutant scrubbers" is being developed and tested that not only removes ammonia but also aims for significant removal of odor and particulate matter (PM10 and PM2.5) from the air (Zhao et al., 2011; Ritz et al., 2005;
42

Patterson and Adrizal, 2005. So far, removal efficiencies are higher for ammonia than for odour and PM2.5 (Table 10).
Category 2 techniques
103. Forced drying: Effective emission reduction can be achieved through forced drying and several systems are currently being evaluated. These systems are energy-intensive and may increase dust emissions. However, the extra ventilation improves the distribution of heat, giving some savings on heating costs (Table 10).
104. The Combideck System can also be considered a category 2 technique because it is BAT only if local conditions allow its adoption (Table 10).
105. Use of additives (aluminium sulphate, micro-organisms) can reduce ammonia emissions and can lead to a higher dry matter content of the manure (+9%). Tests have shown a decrease in NH3 emissions: emissions as per kg of live weight decrease by 9% from day 0 to day 29, and then by 59% from day 30 to day 50, with an average of 36%. Such technique also offers positive impacts on mortality (which can be reduced by 27%). (Aubert et al., 2011).
43
paule, 02/04/12,
Should this be defined briefly?

Table 10: Housing systems for broilers: techniques and associated NH3 emission reduction potential. Data on economic costs of low-emission housing systems are scarce, also because there are often only few of these systems in practice yet.
kg NH3/year/ place
NH3
reduction (%)
Extra cost (€/place/ year
Cost (€/Kg NH3 abated/year)
Reference*)
Deep litter; fan ventilated house (Reference Technique)
0.080 0
Naturally-ventilated house or insulated fan-ventilated house with a fully littered floor and equipped with non-leaking drinking system (cat.1)
20-30 0 0
Perforated floor with forced air drying (cat. 2)
82
Tiered floor and forced air drying (cat. 2)
94
Tiered removable sides; forced air drying (cat.2)
94
Combideck System (cat. 2) 44Chemical scrubbing of exhaust air (cat. 1; some members –e.g. Italy- consider Cat. 2))
90 5-8
*) 1. BREF, 2003; 2. Draft revised BREF 2011
iii. Housing systems for turkeys and ducks
106. Reference system turkeys: Traditionally, turkeys are kept in buildings with a solid, fully littered floor, very similar to the housing of broilers. Birds are housed in closed, thermally insulated buildings with forced ventilation or in open houses with open sidewalls. Manure removal and cleaning takes place at the end of each growing period. NH3 emission has been measured under practical conditions in a commonly used turkey house with a fully littered floor and has been found to be 0.680 kg NH3 per turkey place per year. It should be kept in mind that turkeys are a minor source of NH3 in the UNECE region.
107. Reference system ducks: The commonly applied duck house is a traditional housing system, very similar to the housing of broilers. A distinction has to be made between ducks for roasting and ducks for ‘foie gras’, as the former generates slurry and the latter solid manure. Partly slatted/partly littered floor and fully slatted floor are other housing systems for fattening of ducks. It should be kept in mind that ducks are a minor source of NH3 in the UNECE region.
Category 1 techniques
44

108. Techniques that can be considered as category 1 include: (a) Naturally-ventilated house with a fully littered floor and equipped with non-leaking drinking system; and (b) Well-insulated fan ventilated house with a fully littered floor and equipped with non-leaking drinking system (Table 11).
109. Frequent removal of manure may reduce the NH3 emissions by ~30%.
Category 2 techniques
110. The following techniques are considered as category 2, because data on NH3
emission reduction are not currently available : (a) Perforated forced air drying; (b) Tiered floor and forced air drying; (c) Tiered removable sides; forced air drying; and (d) Air scrubber technology to remove NH3 and fine particles (Table 11).
Table 11: Housing systems for turkeys techniques and associated NH3 emission reduction potential. Data on economic costs of low-emission housing systems are scarce, also because there are often only few of these systems in practice yet.
kg NH3/year/ place
NH3
reduction (%)
Extra cost (€/place/year
Cost (€/Kg NH3 abated/year
Reference*)
Fully littered floor (Reference technique for turkeys)
0.680 0
Naturally-ventilated or well-insulated fan-ventilated house with a fully littered floor and equipped with non-leaking drinking system (cat 1)
20-40 0 0
Frequent removal of manure (cat. 1)?
30%
Perforated floor with forced air drying (cat. 2)
82
Tiered floor and forced air drying (cat. 2)
94
Tiered removable sides; forced air drying (cat.2)
94
Chemical scrubbing of exhaust air (cat. 1)
90 5-8
45
paule, 02/04/12,
Not mentioned in text above; refer to paragraph 102?

VI. MANURE STORAGE TECHNIQUES
111. Reference technique. The baseline for estimating the efficiency of an abatement measure is the emission from the same type of store, without any cover or crust on the surface. Table 12 gives an overview of the different emission abatement measures for slurry stores and their efficiency in reducing NH3 emissions.
112. After removal from animal houses, slurry is commonly stored in concrete or steel tanks or silos, or in an earth-banked lagoon (with an impermeable liner – clay or plastic). The latter tend to have a relatively larger surface area per unit volume than the former and there is recent evidence of intense natural chemical denitrification in these structures due in part to wind action. Emissions from slurry stores can be reduced by decreasing or eliminating the airflow across the surface by installing a solid or floating cover (different types), by allowing the formation of a surface crust, or by reducing the surface area per unit volume of the slurry store. Reducing the surface area is only a consideration at initial store design or at replacement. Co-benefits: Solid covers (and roofs) prevent rain from filling the storage have the co-benefit of lower and more predictable capacity requirement since this is not affected by variable precipitation and with less water, lower haling costs. All covers reduce odour and most also reduce green house gas emissions although under some conditions straw may increase emissions of N2O. Reducing the surface to volume ration tends to have the same co-benefits.
113. Where poultry manure is already dry (e.g. within poultry housing), for any further long term storage elsewhere, it is BAT to provide a barn or building with an impermeable floor with sufficient ventilation; this will keep the manure dry and prevent further significant losses.
114. When using an emission abatement technique for manure stores, it is important to prevent loss of the conserved NH3 during spreading on land by using an appropriate reduced-emission application technique.
Category 1 techniques
115. ‘Tight’ lid, roof or tent structure: The best proven and most practicable techniques to reduce emissions from slurry stored in tanks or silos are to provide a ‘tight’ lid, roof or tent structure. While it is important to guarantee that such covers are well sealed or “tight” to minimize air exchange, there will always need to be some small openings or a facility for venting to prevent the accumulation of flammable gases, such as methane. The application of these techniques to existing stores depends on the structural integrity of the stores and whether they can be modified to accept the extra loading.
46

116. Floating cover: floating cover sheeting may be a type of plastic, canvas or other suitable material. It is considered to be a category 1 technique for small earth-banked lagoons.
117. Storage bags for slurry on small farms (e.g. < 150 fattening pigs) also provide a system that reduces emissions.
118. Replacement of lagoons by tanks/silos: If shallow earth-banked lagoons are replaced by taller tanks or silos, emissions will be reduced due to the reduced surface area per unit volume. This could be an effective (though expensive) NH3 reduction option, particularly if the tanks are covered by a lid, roof or tent structure (category 1 techniques). However, the effectiveness of this option is difficult to quantify, as it is strongly dependent on the characteristics of the lagoon and the tank.Table 12: Ammonia emission abatement measures for cattle and pig slurry storage. (Under costs, A, B, C refer to the options for revision of Annex IX)
AbatementMeasure
NH3 emission reduction
%a/
Applicability BAT for IPPC pig farms?#
Costs (OPEX)(€ per m3/yr) c/
Store with no cover or crust
0
‘Tight’ Lid, roof or tent structure (Cat. 1) 80
Concrete or steel tanks and silos. May not be suitable on existing stores.
Yes – but decisions taken on a case by case basis
8.00b/ (A)
Plastic sheeting٭(floating cover) (Cat. 1) 60
Small earth-banked lagoons. Yes – but decisions taken on a case by case basis
1.25 (B)
Natural crust (floating cover)(Cat. 2)
40Higher dry matter slurries only. Not suitable on farms where it is necessary to mix and disturb the crust in order to spread slurry frequently. Crust may not form on pig manure in cool climates.
Yes – but decisions taken on a case by case basis
0.00
Replacement oflagoon, etc. with covered tank or tall open tanks (H> 3 m) (Cat.1)
30– 60Only new build, and subject to any planning restrictions concerning taller structures.
Not assessed14.9 (cost of tank 6.94)
Storage bag(Cat. 1)
100 Available bag sizes may limit use on larger livestock farms.
Not assessed 2.50 (A)
Plastic sheeting٭(floating cover) (Cat. 2) 60
Large earth-banked lagoons and concrete or steel tanks.Management and other factors may limit use of this technique.
Yes – but decisions taken on a case by case basis 1.25 (B)
“Low technology” floating covers (e.g. chopped straw, peat, bark, LECA balls, etc.) (Cat. 2)
40Concrete or steel tanks and silos. Probably not practicableon earth-banked lagoons. Not suitable if materials likely to cause slurry management
Yes – but decisions taken on a case by case basis
1.10 – tanks
47
paule, 02/04/12,
Andy vd Zaag asks Can/ should ‘hexacovers’ be added into to list and is the attached company report sufficient to support Cat 2 or perhaps cat 1 status?
paule, 02/04/12,
From Andy vander Zaag: he has not find any supporting publications on this. Is it needed?

problems.* Sheeting may be a type of plastic, canvas or other suitable material.a/ Emission reductions are agreed best estimates of what might be achievable across the UNECE region. Reductions are expressed relative to emissions from an uncovered slurry tank/silo.b/ Costs are for the United Kingdom. Costs refer to the cost of the lid/roof only, and do not include the cost of the silo.c/ Based on a depreciation period of 10 years, and an interest rate of 6 per cent, and an additional cost of €12,000. (The cost €2.5 maybe adjusted)# The definition of BAT includes a non-quantified element of cost. Category 1 techniques may not, therefore, have been defined as BAT because of perception of costs, or may only have been defined as BAT where already fitted.
Category 2 techniques
119. Floating cover (for stores other than small earth-banked lagoons): There is a range of floating covers that can reduce NH3 emissions from stored slurries by preventing contact between the slurry and the air. However, the effectiveness and practicality of these covers are not well tested, except for plastic sheeting on small earth-banked lagoons, and are likely to vary according to management and other factors. Examples include plastic sheeting, chopped straw, peat, LECA (light expanded clay aggregates) balls, hexacovers? or other floating material applied to the slurry surface in tanks or earth-banked lagoons. Impermeable floating covers need venting and a method to remove rain water that gathers on top. Permeable floating covers must be carefully retrained against the wind. The durability of floating covers is not well tested. Floating covers might hinder homogenization of the slurry prior to spreading; some of the materials used may hinder the spreading process itself, by clogging up machinery, or cause other slurry management problems.
120. Formation of natural crust: Minimizing stirring of stored cattle slurry of sufficiently high dry matter content will allow the build-up of a natural crust. For the time that this crust totally covers the slurry surface and is thick enough, and slurry is introduced below the crust, such a crust can significantly reduce NH3 emissions at little or no cost. This natural crust formation is an option for farms that do not have to mix the manure and disturb the crust in order to spread slurry frequently. The emission abatement efficiency will depend on the nature and duration of the crust (Misselbrook, et al., 2005; Smith et al., 2007).
121. Covering farmyard manure: There are few options for reducing NH3 emissions from stored farmyard (solid) manures for cattle and pigs. Experiments have shown that covering farmyard manure piles with plastic sheeting can substantially reduce NH3
emissions and did not show any significant increase in methane or nitrous oxide emissions (Chadwick, 2005; Hansen et al., 2006). At present, this is considered as a category 2 technique, due to the need for more general testing of abatement efficiency and practicability.
48

49

VII. MANURE APPLICATION TECHNIQUES
122. Reference technique. The reference manure application technique is defined as untreated slurry or solid manure spread over the whole soil surface (“broadcast”) and not followed by incorporation, and not targeting application timing conditions that minimize ammonia loss. For slurry, for example, this would typically consist of a tanker equipped with a discharge nozzle and splash-plate. For solid manures, the reference case would be to leave the manure on the soil surface without incorporation.
123. Emissions of ammonia from the reference technique expressed as a percentage of the TAN (total ammoniacal nitrogen) applied are typically in the range of 40-60% (although emissions outside this range are also common). Emissions will vary with the composition of the slurry or solid manure and with prevailing weather and soil conditions. Emissions of ammonia as a percentage of TAN applied are normally decreased with decreasing: evapotranspiration (air temperature, wind speed, solar radiation); and slurry DM concentration. Emissions of ammonia as a percentage of TAN applied are normally decreased with increasing: TAN concentration; and application rate. Emissions from different manure types will also vary. Emissions are also dependant on soil conditions that affect infiltration rates. For example, well draining, coarse textured, dry soils, which allow faster infiltration, will give rise to lower emissions than wet and compact soils with reduced infiltration rate (Søgaard et al., 2002). However, when very dry, some soils may become hydrophobic which can also reduce infiltration and therefore increase emissions.
124. Specification of abatement efficiency. Emissions will vary with the composition of the slurry and solid manure and with prevailing weather and soil conditions. Abatement efficiencies will also vary relative to reference emissions depending on these factors. For this reason, the figures quoted in Table 14 represent averages from many studies in different countries over a wide range of conditions. The absolute magnitude of ammonia emission levels of the reference techniques varies temporally and at a regional scale in response to variation in environmental conditions. While these factors also affect the absolute magnitude of ammonia emissions from low-emission approaches, the relative emission levels are comparable; for this reason the benefits of using low-emission approaches are expressed as percentage reduction compared with the reference.
125. Category 1 techniques include machinery for substantially decreasing the exposed surface area of slurries applied to surface of soil or burying slurry or solid manures through injection or incorporation into the soil. Economic costs of these techniques are in the range 0.1 to 5 Euro per kg NH3-N saved, with the smallest costs for immediate incorporation of slurries and solid manure, where this is feasible (i.e. on bare arable land). The estimates are very sensitive to assumed farm size, with substantially improved economies of scale on larger farms, where low emission equipment is shared between several farms, or where specialist contractors are used. The techniques included in category 1 are:
(a) Band-spreading slurry at the soil surface using trailing hose or trailing shoe methods(b) Injecting slurry – open slot;(c) Injecting slurry – closed slot;(d) Incorporation of surface-applied solid manure and slurry into soil;
50

(e) Dilution of slurry by at least 50% applied in low pressure? water irrigation systems
The average NH3 abatement efficiencies of category 1 techniques, relative to the reference, and an indication of the cost of each technique relative to the reference are given in Table 14 for slurries and Table 15 for solid manures.
Table 14: Category 1 abatement techniques for slurry* application to land. The abatement measures refer to the category 1 techniques listed in provision 158.
Abatement measure
Land use Emission reduction (%)†
Factors affecting emission reduction
Applicability compared with the reference
Cost (€/Kg NH3 abated/year)
(a) Band-spreading slurry with a trailing hose
GrasslandArable
30-35% More crop canopy will increase reduction, de-pending on placement precision and the extent of herbage contamina-tion.
Less suitable where: Slope >15%Can be used on solid seeded crops and wide units may be compatible with tramlines
-0.5 – 1.5 (note that the costs may be reduced if the equipment is locally designed and built)
Band spread-ing with trailing shoe
GrasslandArable (pre-seeding) and row crops
30-60% More crop canopy will increase reduction, de-pending on placement precision and the extent of herbage contamina-tion.
Not suitable for use in growing solid seeded crops but may be possible to use in the rosette stage and in row crops.
-0.5 – 1.5
(b) Injecting slurry (open slot)
Grassland 70% Injection depth ≤ 5 cm Unsuitable where: Slope >15%; High stone content; Shallow soils; High clay soils (>35%) in very dry conditions,Peat soils (>25% organic matter content). Tile drained soils suscept-ible to leaching
-0.5 – 1.5
(c) Injecting slurry (closed slot)
GrasslandArable
80% (shallow slot 5-10 cm)90% (deep injection >15cm)
Effective slit closure -0.5 – 1.2
(d) Incorpor-ation of sur-face applied slurry
Arable Immediately by ploughing = 90%
-0.5 – 1.0
Immediately by non-inversion cultivation = 70%
-0.5 – 1.0
Incorporation within 4 hrs = 45-65%
Efficiency depends on application method and weather conditions between application and incorporation
-0.5 – 1.0
Incorporation within 24 hours = 30%
0 – 2.0
(e) Active di-lution of slurry of >4% DM to <2% DM for use in water irrigation systems
ArableGrassland
30% Emission reduction is proportional to the ex-tent of dilution. A 50% reduction in dry matter (DM) content is neces-sary to give a 30% re-duction in emission
Limited to low pressure water irrigation systems (not ‘big guns’). Not ap-propriate where irrigation is not required.
-0.5 – 1.0
* slurry is defined as flowable manure usually less that 12% dry matter. Material with a higher dry matter content or containing high amounts of fibrous crop residue may require pretreatment (e.g. chopping or water addition) to be applied as a slurry, and should otherwise be handled as for solid manures (Table 18b).† Average emission reductions agreed to be achievable across the UNECE region. The wide ranges reflect slight differences in techniques, management, weather conditions, etc.
51
paule, 02/04/12,
Not sure why ‘slight’

Table 15: Category 1 abatement techniques for solid manure*) application to landAbatement measure
Land use Emission reduction (%) † Factors affecting emission reduction
Limitations to applicability compared with the reference
Cost (€/Kg NH3 abated/year)
(d) Incorpor-ation of sur-face applied manure
Arable Immediately by ploughing = 90%
Degree of burying the manure
-0.5 – 1.0
Immediately by non-inversion cultivation = 60%
Degree of burying the manure
0 – 1.5
Incorporation after 4 hrs = 45-65%
Degree of burying the manure Efficiency depends on time of day of spreading and weather conditions between application and incorporation;
0 – 1.5
Incorporation within 12 hours = 50%Incorporation within 24 hours = 30%
0.5 – 2.0
0.5 – 2.0
* solid manure is defined as non-flowable manure usually with more than 12% dry matter† Emissions reductions are agreed as likely to be achievable across the UNECE region.
126. Each efficiency for techniques (a)–(c) is valid for soil types and conditions that allow infiltration of liquid and satisfactory travelling conditions for the machinery.
127. Tables 14 and 15 also summarize the limitations that must be taken into account when considering the applicability of a specific technique. These factors include: soil type and condition (soil depth, stone content, wetness, travelling conditions), topography (slope, size of field, evenness of ground), manure type and composition (slurry or solid manure). Some techniques are more widely applicable than others. Additional costs are negligible, if the ploughing or soil cultivation has to be done anyway, but for emission mitigation has to be done directly after application which may require additional resources.
128. Techniques (a) - (c) operate on the basis that the surface area of slurry exposed to the prevailing weather conditions is reduced by at least 75% through confining the slurry to lines / bands which are approximately 250 (+/- 100) mm apart. The slurry is distributed through a number of relatively narrow pipes (usually 40-50 mm diameter). These machines usually incorporate systems for filtering, chopping and homogenising slurry, which minimise the occurrence of blockages in narrow pipes caused by slurries that are very viscous or that contain large amounts of fibrous material or foreign objects such as stones. Band-spreading and injection systems are normally fitted to the rear of slurry tankers, which are either towed by a tractor or form parts of a self-propelled machines. An alternative is for the application system to be attached directly to the rear of a tractor and slurry transported to it by an ‘umbilical’ hose from a stationary tanker or store. Such umbilical systems can reduce soil compaction damage caused by heavy slurry tankers.
129. Band-spreading slurry at or above the soil surface. Band-spreading at or above the soil surface can be carried out using implements commonly referred to as ‘trailing hose’ (also known as ‘drag hose’ and ‘drop hose’)’ and ‘trailing shoe’ (also known as ‘drag shoe’ and ‘sleighfoot’). Trailing shoe and trailing hose systems are distinguishable from
52

each other through the presence (trailing shoe) or absence (trailing hose) of a ‘shoe’ or ‘foot’ device at the outlet of each slurry distributionapplication pipe which slides (or floats) on the surface of the ground with little or no penetration. The hose or shoe is intended to part of the herbage or any crop residue present to allow slurry placement directly on the soil surface. Greater efficiency generally reported with the sliding shoe (Webb et al. 2010) is attributed to manure being in narrower bands, having more contact with the soil and having less contact with live or dead vegetative material because it is better pushed aside by the shoe than the hose, even if the hose is very close to the ground. The benefit of the shoe compared with the hose is greatest for taller canopies because of the reduced degree of canopy contamination. Both systems are usable in a range of cropping situations although of the two the hoses are less restrictive because they can be wider, used in standing crops without damage and are amenable to tramline systems. Both systems apply manure more uniformly, and are less susceptible to wind, compared to the reference system. They increase the time available for spreading and allow spreading closer to field margins with low risk of contaminating adjacent areas.
130. Trailing hose: This technique discharges slurry at or just above ground level through a series of hanging or trailing pipes or flexible hoses, which either hang a short distance (<150 mm) above the soil or are dragged along the soil surface. The working width is typically between 6 and 12 m, although larger units of up to 24 m width are commercially available. The possible working width (requiring manual or powered swing arms for transport) is much larger than for the ‘splash plate’ reference system (6-9 m), representing a clear advantage of the trailing hose method. The spacing between bands (centre to centre) is typically 250-350 mm. The technique is applicable to grass and arable crops, and can be used with tramlines. The pipes may become clogged if the DM content of the slurry is high (>7-10%) or if the slurry contains large solid particles. However, the clogging of pipes is usually avoided by including a chopping and distribution system. This system improves spreading uniformity which improves nutrient use, but contributes significantly to the cost and maintenance of the system. The chopper/ distributor device can often be designed and built locally so that the costs may be quite low.
131. Trailing shoe: This technique is mainly applicable to grassland and arable crops at early stages or with widely spaced rows. The machine working width is typically limited to 6 – 8 m, which, as with the reference system, is insufficient for practical operation in growing combinable crops, which are normally established in 12 m or 24 m tramline systems. The method is not recommended for growing solid seeded arable crops where the action of the shoe can result in excessive plant disturbance. Grass leaves and stems are parted by trailing a narrow shoe or foot over the soil surface and slurry is placed in narrow bands on the soil surface. The spacing between bands is typically between 200 and 300 mm. Ammonia emission reductions are optimised when the slurry bands are partially sheltered by a crop canopy. Applicability is limited where there are significant stones on the soil surface. Large amounts of crop residue such as on untilled land will gather on the trailing shoes and interfere with their performance.
53

132. The ammonia emission abatement potential of trailing shoe or trailing hose machines is more effective when slurry is applied below well-developed crop canopies rather than on bare soil because the crop canopy increases the resistance to air turbulence from wind and shades the slurry from solar radiation. In general, ammonia emission reductions have typically been found to be larger from trailing shoe than from trailing hose, which is most likely due to the higher degree of canopy contamination resulting from certain types and implementation of the trailing hose methods. This emphasizes the need to avoid canopy contamination with slurry when using either method, which also has benefits for herbage quality.
133. Injection – open slot: This technique is mainly for use on grassland or minimum till cropland prior to planting. Different shaped knives or disc coulters are used to cut vertical slots in the soil up to 50 mm deep into which slurry is placed. Spacing between slots is typically 200–400 mm and machine working width is typically ≤6 m. To be effective in both reducing ammonia emissions and increasing the availability of nitrogen to the crop, while also reducing crop injury, injection should be to a depth of approximately 50 mm and the space between injector tines should be ≤ 300 mm. Also, the application rate must be adjusted so that excessive amounts of slurry do not spill out of the open slots onto the surface. The technique is not applicable on very stony soils, or on very shallow or compacted soils, where it is impossible to achieve uniform penetration to the required working depth. The method may not be applicable on very steeply sloping fields due to the risk of runoff down the injection furrows. Slurry injection systems will have a higher tractor power requirement than broadcast or band-spreading equipment.
134. Injection – closed slot. This technique can be relatively shallow (50–100 mm depth) or deep (150–200 mm). Slurry is fully covered after injection by closing the slots with press wheels or rollers fitted behind the injection tines. Deeper injection is required when greater volumes of manure are injected to avoid the manure oozing to the surface. Shallow closed-slot injection is more efficient than open-slot in decreasing NH3 emission. To obtain this added benefit, soil type and conditions must allow effective closure of the slot. The technique is, therefore, less widely applicable than open-slot injection. Some deep injectors comprise a series of tines fitted with lateral wings or “goose feet” to aid soil penetration and lateral dispersion of slurry in the soil so that relatively large application rates can be achieved. Tine spacing is typically 250–500 mm and working width ≤4 m. Although NH3
abatement efficiency is high, the applicability of the technique is mainly restricted mainly to pre-sowing application to arable land and widely spaced row crops (e.g. maize), while mechanical damage may decrease herbage yields on grassland or growing solid-seeded arable crops. Other limitations include soil depth, clay and stone content, slope and a high tractor power requirement and increased risk of leaching particularly on tile drained soils.
135. Incorporation of surface-applied solid manure and slurry into soil: Incorporating surface applied manure or slurry by either ploughing or shallow cultivation is an efficient means of decreasing NH3 emissions. Highest reduction efficiencies are achieved when the manure is completely buried within the soil (Table 15). Ploughing results in higher emission reductions than other types of machinery for shallow cultivation. The applicability
54
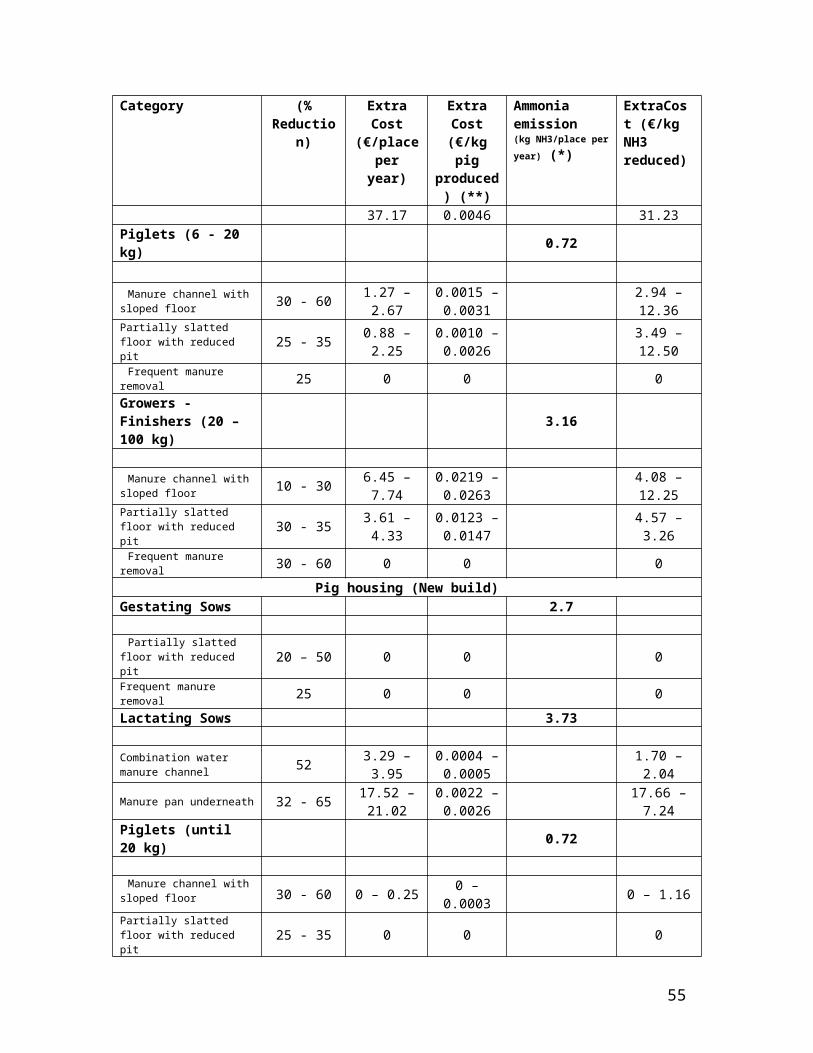
of this technique is confined to arable land. Incorporation is not applicable on permanent grassland, although it may be possible to use in grassland systems either when changing to arable land (e.g. in a rotation) or when reseeding pasture although nutrient requirements may be low at both of these times. It is also less applicable to arable crops grown using minimum cultivation techniques compared to crops grown using deeper cultivation methods. Incorporation is only possible before crops are sown. The technique is the main technique applicable to achieve emission reductions from application of solid manures on arable soils although new applicators for injecting poultry litter into sod are being tested in North America. The technique is also effective for slurries where closed-slot injection techniques are not possible or available or present a risk of leaching. Cultivation also reduces macropores which can facilitate leaching.
136. Ammonia loss takes place quickly (over several hours and days) after manures are spread on the surface, so greater reductions in emissions are achieved when incorporation takes place immediately after spreading. Immediate incorporation often requires a second tractor to be used for the incorporation machinery, which must follow closely behind the manure spreader. Where labour or machinery requirements limit this option, such as for small farms, manures should be incorporated within 4 hours of spreading the manure, but this is less efficient in reducing emissions (Table 15). Incorporation within 24 hours of spreading will also reduce emissions to an even smaller extent, but increases agronomic flexibility, which may be especially important for small farms. It is most important to incorporate rapidly when manure is applied near midday in hot conditions. It may be possible to spread and incorporate with a single implement. This can work well, provided that less than 25% of the manure is left exposed to the atmosphere.
137. Slurry dilution for use in irrigation systems. Ammonia emissions from dilute slurries with low dry matter (DM) content are generally lower than for whole (undiluted) slurries because of faster infiltration into the soil (e.g. Stevens and Laughlin, 1998; Misselbrook et al., 2004). Doses of slurry, calculated to match the nutrient requirement of crops, can therefore be added to irrigation water to be applied onto grassland or growing crops on arable land. Slurry is pumped from the stores, injected into the irrigation water pipeline and brought to a low pressure sprinkler or travelling irrigator (not big gun with high pressure), which sprays the mix onto land. Dilution rates may be up to 50:1 water: slurry. This approach is included as a Category 1 method so far as this is an active dilution for use in water irrigation systems with a dilution of at least 50% (1:1 water:slurry) sufficient to reduce emissions by at least 30%, where there is a need for water irrigation. In the case of slurry with a DM content of 4%, this would need to be diluted to ≤ 2% DM content (see Figure 1). In order to be considered a category 1 method, the following conditions should apply:
i. The slurry is actively diluted for use in irrigation systems by at least the required amount of 1:1 dilution with water. By contrast, the slurry should not simply be dilute through poor management practice, such as because of slurry storage in shallow un-covered lagoons that collect a lot of rainwater. These storages are discouraged be-cause they are in themselves potentially significant sources of emissions that are diffi-cult to control with covers.
55

ii. Conditions are suitable for irrigation to meet crop water needs. Dilution of slurry without a water need adds to hauling costs and may exacerbate nitrate leaching.
iii. The amounts of slurry applied are calculated to match nutrient needs. The method should not be seen as an easy option for slurry disposal, with the possible risk of over fertilization and nitrate leaching or manure runoff, especially on sloped fields.
iv. Soil conditions allow for rapid soaking of dilute slurries because there are no physical impediments to infiltration, such as high soil water content, poor soil structure, fine texture or other soil attributes that reduce infiltration rates of liquids in to soil, and that there is no decrease in infiltration rate due to high application volumes.
138. In addition to the specific dilution of slurry in irrigation systems, other methods of reducing slurry DM content can provide a useful means to reduce ammonia emissions. These include reducing DM levels through anaerobic digestion and by solid-liquid separation. Because such methods can tend to increase the pH of the low DM fraction and also produce a sludge with higher DM content, they are not included as Category 1 methods. Such methods can, nevertheless, provide a useful approach as part of Category 2 methods, where verification of the emission reductions should be provided.
0
10
20
30
40
50
60
70
80
90
100
1 2 3 4 5 6 7 8 9 10
Slurry DM %
NH4-N
em
itted
as
% o
f TAN
app
lied
Moal et al., 1995 Smith and Chambers, 1995Misselbrook et al., 2005 (cattle) Misselbrook et al., 2005 (pig)Sommer and Olesen, 1991 Smith et al., 2000
Figure 1: Relationship between the percentage of total ammoniacal nitrogen (TAN) emitted as ammonia during the land application of slurry and the dry matter content (DM % weight) of the slurry, according to six estimates. Even though ammonia emissions are still significant at 1% DM content (10-30% of TAN lost through volatilisation), a 50% reduction in DM content will achieve roughly a 30% reduction in average ammonia emissions.
139. Additional benefits of techniques to reduce ammonia emissions from the land application of slurry and solid manure. The experimental quantification of increased manure N efficiency associated with reduced ammonia emissions has given variable results (Webb et al. 2010). This may be partly explained by the difficulty implicit in any attempt to
56

detect a significant crop response to low N fertilizer additions against relatively large background soil N mineralisation rates. In practice, the reduction in ammonia emission translates into a reduction of application rate of additional N. Although the uptake of the ammonia-N by the crop will vary, the TAN that is not volatilised can be considered as potentially equivalent to chemical N fertilizer. Therefore, reduced ammonia losses can be considered to replace chemical fertilizer applications on a 1:1 ratio.
140. Band-spreading and injection techniques, as well as the rapid incorporation of solid manures, considerably reduce the odour associated with manure application. The reduction in odour emissions achieved by these techniques can allow application on areas or at times that may otherwise be unavailable due to complaints.
141. Band-spreading and injection techniques can allow more accurate slurry application rates than the reference technique, as the slurry should be distributed in equal proportions to pipes that are equally spaced apart along a fixed bout width. By comparison, the spatial distribution following application using the splashplate applicator (the reference system) is often more variable, depending on the design and condition of the splashplate unit. Also, the bout width using splashplates can be more variable (e.g. affected by wind), resulting in imperfect alignment of adjacent bout strips and less accurate application along field boundaries. This potential improvement in accuracy of application increases efficiency of slurry as a nutrient source. The improvement in application accuracy also reduces the risk of nitrate, phosphorus and microbial pollution by avoiding spreading slurry onto adjacent areas such as near water courses.
142. The window of opportunity for slurry application using the reference technique (broadcast spreading) is restricted by the risk of crop quality deterioration or damage caused by slurry contamination. Band-spreading and injection reduce the occurrence of herbage contamination and therefore increase the crop canopy height onto which slurry can be applied without threatening crop quality. This is particular relevant to grassland, where slurry contamination can reduce grazing palatability or silage quality and may transfer pathogens (eg Johne’s disease) between farms if manure or equipment is shared. These methods also allow slurry application on growing arable crops (particularly cereals) which are generally not considered suitable to receive slurry applied using splashplate. The use of low-emission techniques can therefore help to increase the flexibility of slurry application management by allowing more land area to be available on days when weather conditions are more suitable for reduced ammonia volatilisation and optimal slurry-N utilisation, and when soil moisture conditions are suitable to allow machinery traffic with minimal soil compaction.
143. Potential cost implications of abatement techniques. Cost increases associated with purchasing and maintaining, or hiring contractors with, new application machinery can be a disincentive to adoption. Injection techniques also require higher tractor power, further adding to the cost of adoption for those systems. These additional costs can be partially or totally outweighed by the financial benefit of improving yield and yield consistency, reducing nitrogen losses (by reducing mineral fertilizer requirements), by more precise
57

delivery of manure nitrogen to the crop, by the increased agronomic flexibility and by other co-benefits such as reduction of odour and crop contamination and improved visual aesthetics during and fter manure application (Webb et al. 2010). The overall benefit-cost ratio depends especially on equipment costs and abatement efficiency.
144. Impact of reduced ammonia losses on N cycle. If no crops are present, or growing, following manure application to take up the readily available N, the risk of N loss via leaching or gaseous N2O increases. Hence incorporation and especially injection of manures involves a risk of exchanging air pollution for water pollution, but reduces the risk of surface run-off from subsequent rainfall events. For this reason, the timing of slurry and solid manure application needs to balance the potential for low ammonia emissions against the other loss pathways, while considering the timing of crop needs. To avoid overall losses of N, manure should not be applied when there is no or very limited crop uptake. Ammonia mitigation makes an important contribution to the overall reduction of nitrogen losses from agriculture, thereby maximizing the agronomic benefits of applied mineral fertilisers. The financial benefit to the farmer of reducing the need for mineral nitrogen fertilizers is complemented by a regional-scale greenhouse gas benefit due to reduced mineral fertilizer needs, given the high energy costs of nitrogen fertilizer manufacture.
145. Results suggest that injection of slurry may either increase or have no impact on emissions of N2O. The addition of readily-degradable C in slurry has been proposed as a mechanism responsible for increasing emissions of N2O by more than would be expected due to the additional N entering the soil as a result of ammonia abatement. This addition of readily-degradable slurry-C, without significantly aerating the soil, may increase denitrification activity. There are a number of reasons why reduced ammonia emission application techniques would not always lead to greater emissions of N2O such as: (1) deeper injection (> 5 cm) or incorporation, by increasing the length of the diffusion path from the site of denitrification to the soil surface, may lead to a greater proportion of denitrified N being emitted as N2; (2) the subsequent soil moisture status and hence aeration may not be suitable for increased N2O production; (3) in soils already well-supplied with both readily-degradable C and mineral N any increase in N2O emission may be too small to have a significant effect; and (4) the impact of subsequent weather on soil moisture content and water-filled soil pore space will also effect subsequent emissions of N2O. The reflection of these interactions is that mitigation of ammonia emissions reduces the N2O emissions associated with atmospheric nitrogen deposition to semi-natural ecosystems and allows a saving of fertilizer inputs, leading to overall reduction in N2O emissions.
146. Incorporation of farmyard manure (FYM) appears to reduce or have no impact on N2O emissions. In contrast to slurry, there is evidence that readily-degradable-C is lost as part of the effluent arising during storage of solid manures. Hence the C added to soil by incorporation of solid manures will have less effect than slurry on microbial metabolism.
Category 2 techniques
58

147. Verification of Category 2 techniques. Category 2 techniques may form a useful part of a package of measures to reduce ammonia emissions, but may be more uncertain or the emission reductions inherently harder to generalize. For this reason, Annex IX specifies that, where Category 2 methods are used to achieve the specified emission reductions, details should be provided by parties to verify the reported emission reductions from the methods. Such verification should also be provided for Category 3 methods where these are used. For techniques based on a) increasing the rate of infiltration into the soil and b) pressurized injection of slurry documentation should describe the practice used and give evidence from field or farmscale measurements demonstrating and justifying the emission reduction. Specific requirements apply to the verification of Application Timing Management Systems (ATMS) as described in the paragraph below.
148. Increasing rate of infiltration into the soil. When soil type and conditions allow rapid infiltration of liquid, NH3 emission decreases with decreasing slurry dry matter content. Dilution of slurry with water not only decreases the ammonium-N concentration, but also increases the rate of infiltration into the soil following spreading on land. For undiluted slurry (i.e. 8–10% dry matter), dilution must be at least 1:1 (one part slurry to one part water) to achieve reduced emissions by at least 30%. A major disadvantage of the technique is that extra storage capacity may be needed and a larger volume of slurry must be applied to land. In some slurry management systems, slurry may be already diluted (e.g. where milking parlour or floor washings, rainfall, etc. are mixed with the slurry) and there may be only a small advantage in actively diluting further. Extra cost for storage capacity and, mainly, for transport in land application, should discourage use of this technique. Also, there may be more risk of aquifer pollution, more water wastage and greater carbon footprint because of the additional transport.
149. When applying diluted slurries to land there may be a greater risk of surface run-off and leaching and this must be guarded against by paying attention to application rate, soil conditions, slope of the land, etc. For these reasons, apart from the active dilution of slurry for irrigation (Category 1), this method is included as Category 2.
150. Another means of decreasing slurry dry matter content, and hence increasing the rate of infiltration into the soil, is to remove a proportion of the solids by mechanical separation or anaerobic digestion. Using a mechanical separator with a mesh size of 1–3 mm reduces NH3 loss from the separated liquid by a maximum of 50 per cent. Another advantage lies in reduced soiling of grass swards. Disadvantages of the technique include the capital and operating costs of the separator and ancillary equipment, the need to handle both a liquid and a solid fraction, and emissions from the solids. Information to verify such systems should include demonstration of the overall ammonia emission reduction, taking account of the emissions from both the low DM and high DM fractions.
151. A third option for increasing infiltration rate is to wash slurry off grass and into the soil by applying water after spreading. A plentiful supply of water is needed, the application of which is an additional operation, but Canadian results have shown that 6 mm
59

of water can under some circumstances reduce NH3 losses by 50 per cent compared to surface application alone. Information to verify such systems should specify the time delay between slurry application and washing the grass with water, the amounts of water used, and the percentage emission reduction achieved. When applying water after spreading, there may be a greater risk of surface run-off and leaching, depending on soil conditions, slope of the land, etc. For these reasons, apart from the active dilution of slurry for irrigation (Category 1), this method is included as Category 2.
152. Pressurized injection of slurry. In this technique, slurry is forced into the soil under pressure of 5–8 bars. Because the soil surface is not broken by tines or discs the technique is applicable on sloping land and stony soils where other types of injector cannot be used. Emission reductions of typically 60 per cent, similar to that for open slot injection, have been achieved in field trials, but further evaluation of the technique is needed.
153. Application timing management systems (ATMS). Ammonia emissions are highest under warm, dry, windy conditions (i.e. when evapotranspiration rates are high). Emissions can be reduced by optimising the timing of application, i.e. cool humid conditions, in the evenings, before or during light rain and by avoiding spreading during warm weather conditions, particularly during periods when solar elevation, and hence solar radiation input, is most intense (June/July) (Reidy and Menzi 2007). This is potentially a cost-effective approach as it can be done using broadcast application equipment. The ATMS approach might also lead an additional benefit when used in combination with a low-emission application technique, like the trailing hose. Potential emission reductions achievable through these measures will vary depending on regional and local soil and climatic conditions, and therefore the suite of measures that may be included will be specific to regional conditions.
154. While the benefits of using such timing management practices has been long known, the main constraints are:
(a) the need to demonstrate that the approach can deliver a specified ammonia emission reduction target in practice,
(b) the need to carefully define what is meant by reference conditions (in order to ensure correct reporting of the outcomes),
(c) the need to implement a system to manage this approach that verifies its efficacy and implementation and
(d) reduced flexibility when spreading manure with respect to soil trafficability, labour and equipment availability and consideration of other regulations.
155. This approach can be considered as rather different to the technical methods listed as Category 1, such as band spreading, manure incorporation, where the efficiencies reported in Tables 13 and 14 are based on the average outcomes from many studies. In the case of ATMS the assessment uses the responses of models (based on many studies and accounting for meteorological conditions) to the actual timing practice.
60

156. In order to allow the benefits of timing practices to be included as an abatement measure, the above listed constraints must be addressed. This can be achieved through the use of an Application Timing Management System (ATMS), which is here defined as: a verifiable management system for the direction and recording of solid and liquid manure application at different times, the adoption of which is demonstrated to show quantified farm scale reductions in ammonia emissions. The use of any ATMS must demonstrate achievement of a specified ammonia emission reduction target, by comparison to the reference, in order for its benefit to be considered as part of international emission control strategies.
157. Application Timing Management Systems may be designed to exploit several principles in the variation of ammonia emissions, the benefits of which will vary with local climate, so that ATMS implementations will vary regionally. The following principles may be exploited in an ATMS:
(a) Weather-determined variation in ammonia emissions. Ammonia emissions tend to be smaller in cool and wet conditions and after light rain (though water-logging of soils can make spreading conditions unfavourable). Ammonia emissions can there-fore be forecasted by coupling ammonia emissions models with weather forecast-ing, as is already available in some countries, with land application timing restricted to forecasted periods of low ammonia emissions.
(b) Seasonal variation in ammonia emissions. Ammonia emissions can be estimated on a seasonal basis by generalising weather conditions for particular seasons. For ex-ample, seasonal variations lead to largest ammonia emissions in warm summer con-ditions and smaller emissions in cool moist winter conditions. Subject to other con-straints, such as the objective to match manure application to the timing of crop needs, and the need to avoid water pollution, a targeted seasonal management of solid and liquid manure application has the potential to reduce overall annual am-monia emissions.
(c) Diurnal variation in ammonia emissions. Ammonia emissions tend to be smaller at night due to reduced windspeed, cooler temperatures and higher humidity.
(d) The effect of timing of animal housing versus grazing on ammonia emissions. Am-monia emissions from livestock allowed to range outdoors with sufficient foraging area (e.g. cattle grazing) tend to be much smaller than for housed livestock, since this practice avoids ammonia emissions associated with housing, manure storage and landspreading of slurries and solid manures. Therefore, subject to other con-straints, such as water and soil quality issues arising from grazing during the winter, increasing the period in which animals are in the field (especially when 24 hours a day) can reduce ammonia emissions. Changes in timing practice may be included in an ATMS since these affects the total amounts of manure to be spread.
158. Verification procedures for ATMS. One of the main challenges for any ATMS is to demonstrate an appropriate verification of the approach, particularly given the requirement to demonstrate the achievement of a specified emission reduction. The ATMS approach is considered most relevant at a farm scale, as it results from the overall outcome of a package
61

of timing practices. The emission reduction target should be applied on an annual scale as the emission reduction potential of this method is time dependent.
159. Verification of an ATMS should include each of the following steps:
(a) Verification of the core biophysical modelling tool used. A transparent description of the numerical model used should be provided, underpinned by appropriate inde-pendent verification from field measurements.
(b) Verification of the effect of a specific timing management on ammonia emissions. The degree to which the timing management leads to the target emission reduction required as compared with the reference conditions for that region should be demonstrated for any ATMS being used.
(c) Verification that actual practices conform to those reported. Any ATMS should be implemented in conjunction with an appropriate recording system, to ensure and demonstrate that the timing management recorded in the ATMS is being fully im-plemented.
160. Definition of the reference conditions for an ATMS. In the case of most low emission techniques for land application, the percentage reduction achieved can be generalized over a wide climatic area. By contrast, where an ATMS is used, a more detailed definition of the reference conditions is needed. Overall, the same reference technique applies (free broadcast surface application of slurries and solid manures), but where an ATMS is used, the reference must also be defined on a farm level according to existing practices. In order to account for regional variability in climate and inter-year variability in meteorological conditions, the reference condition for ATMS is extended to include: “the combination of manure application management practices, and their timing, at a farm scale during a specified reference period, when using the reference application method (broadcast spreading), accounting for three-year variability in meteorological conditions”.
161. The emission reduction potential of an ATMS should be verified for the region within which it is adopted. Numerical ammonia emission simulation models will, in general, need to be used as part of the verification of ATMS.
162. An ATMS may be used in combination with other measures for reducing ammonia emissions following land application of manures, such as slurry application technologies or incorporation of manures into soil. However, the additional absolute ammonia emission reduction of an ATMS will vary depending on the emission reduction potential of the accompanying application method. The joint contribution of both low emission application methods and an ATMS should be assessed to ensure that the overall farm-scale ammonia reduction target is met.
163. Depending on the type of ATMS to be implemented, the main additional costs will be associated with reduced flexibility in timing of manure application, and the associated administrative costs necessary for the verification. Potential cost savings may be found by
62

combining ATMS approaches with advice on managing farm nitrogen stocks more effectively such as through a proven expert system.
164. Application prior to or during weather conditions that increase the risk of nutrient loss to waters should be avoided. Aspects of safety associated with machinery operation at certain times, particularly during hours of darkness, should also be considered when designing an ATMS. Conditions that favour reduced ammonia emissions (e.g. humid, no wind) may give rise to problems with offensive odours by preventing their rapid dispersion.
165. Acidified slurry: The equilibrium between ammonium-N and NH3 in solutions depends on the pH (acidity). High pH favours loss of NH3; low pH favours retention of ammonium-N. Lowering the pH of slurries to a stable level of 6 and less is commonly sufficient to reduce NH3 emission by 50 per cent or more. The technique of adding sulphuric acid to slurry is now practiced in Denmark, with considerable success. When adding acids to slurry, the buffering capacity needs to be taken into account, usually requiring regular pH monitoring and acid addition to compensate for CO2 produced and emitted during the preparation of the acidified slurry. Acidification preferably has to be carried out during storage of slurry and also during spreading using specially designed tankers. Although efficient, the technique has the major disadvantage that handling strong acids on farms is very hazardous.
166. Options to achieve acidified slurry are by adding organic acids (e.g. lactic acid) or inorganic (e.g. nitric acid, sulphuric acid, phosphoric acid) or by the modifying or supplementation of animal feed (e.g. benzoic acid) (see section on Livestock Feeding Strategies) or slurry of components (e.g. lactic acid forming bacteria) that enhance pH reduction. Organic acids have the disadvantage of being rapidly degraded (forming and releasing CO2); moreover, large quantities are required to achieve the desired pH level, since they are usually weak acids. Nitric acid has the advantage of increasing the slurry N content so giving a more balanced NPK (nitrogen-phosphorus-potassium) fertilizer, but has the potential large disadvantage of nitrification – denitrification mediated N2O production and associated pH rise. A pH value of ~4 is required when using nitric acid to avoid nitrification and denitrification, causing loss of nitrate and production of unacceptable quantities of N2O. Using sulphuric acid and phosphoric acid adds nutrients to the slurry that may cause over fertilization with S and P. Moreover, adding too much acid could produce hydrogen sulphide and worsen odour problems and health and safety issues.
Category 3 techniques
167. Other additives. Salts of calcium (Ca) and magnesium (Mg), acidic compounds (e.g. FeCl3, Ca(NO3)2) and super-phosphate have been shown to lower NH3 emission, but the quantities required are too large to be practically feasible. Absorbent materials such as peat or zeolites have also been used. There is also a range of commercially available additives, but in general these have not been independently tested.
63

VIII. FERTILIZER APPLICATION
(a) Urea-based fertilizers
168. Ammonia emission from fertilizer applications are dependant on fertilizer type, weather and soil conditions. Emissions from urea-based fertilizers are much greater than other fertilizer types because rapid hydrolysis of urea will cause localised rise in pH. Rapid hydrolysis often occurs in soils with a lot of urease enzyme due to an abundance of crop residue. Emissions from anhydrous ammonia may be significant when the injection in the soil is poor and the soil is not well covered following injection; success depends on having the right soil and soil moisture to allow the furrow to cloe well. Emissions from ammonium sulphate and diammonium phosphate are greater following application of these fertilizer types to calcareous (high pH) soils. Emission reduction techniques are therefore focused on applications of urea-based fertilizers to all soil types and of ammonium sulphate and diammonium phosphate applications to calcareous soils. Emission reduction techniques rely on either slowing the hydrolysis of urea to ammonium carbonate, or encouraging rapid transfer of the fertilizer into the soil (Sommer et al., 2004).
169. The use of methods to reduce ammonia emissions from urea-based compounds makes an important contribution to overall ammonia emission reductions in agriculture. In particular it should be noted that ammonia emissions from urea-based fertilizers (typically 5-40% nitrogen loss as ammonia) are much larger than those based on ammonium nitrate (typically 0.5-5% nitrogen loss as ammonia). Although ammonium nitrate is the main form of nitrogen fertilizer used in Europe, there remains an ongoing risk that its use might be restricted or prohibited in certain countries for security and/or safety consideration in the future. Already. due to security reasons and higher costs costs, ammonium nitrate has been largely replaced by urea forms throughout North America. Since the measures to reduce ammonia emissions from urea-based fertilizers remain limited in certain crops, especially on perennial crops, such a change would be expected to significantly increase regional ammonia emissions.
170. If applied at agronomically sensible rates and times, improved crop nitrogen uptake will be the main benefit of mitigating ammonia emissions, with minimal increases via the other loss pathways (e.g. nitrate leaching, denitrification). In addition, by reducing ammonia emissions, a similar reduction in indirect nitrogen losses is expected (e.g. by reduced leaching and denitrification from forest soils). Considering the whole system (agricultural land, non agricultural land and transfers by atmospheric dispersion), these measures are not generally expected to increase overall nitrate leaching or nitrous oxide loss. The measures focus on retaining nitrogen in the farming system, thereby maximizing productivity (see also the section on ‘Nitrogen management taking account of the whole nitrogen cycle).
64

171. Reference technique. The reference application technique is surface broadcast application of the nitrogen fertilizer. The effectiveness, limitations and cost of the low-emission application techniques are summarized in Table 16.
Category 1 techniques
172. Category 1 techniques for urea-based fertilizers include: urease inhibitors, slow-release coatings, soil injection, rapid soil incorporation, and irrigation immediately following application. Of these, soil injection, rapid soil incorporation, and irrigation immediately following application would also apply to ammonium sulphate (and diammonium phosphate) applications to calcareous soils.
173. Urease inhibitors delay the conversion of urea to ammonium carbonate by directly inhibiting the action of the enzyme urease. This delayed/slower hydrolysis is associated with a much smaller increase in pH around the urea prill and, consequently, a significantly lower ammonia emission (Chadwick et al., 2005; Watson et al., 1994). The delay to the onset of hydrolysis also increases the opportunity for the urea to be washed into the soil matrix, further reducing the potential for ammonia emissions. Approved urease inhibitors have been listed by the European Union (EC 1107/2008) (http://www.clrtap-tfrn.org/webfm_send/239).
174. Polymer coated urea granules provide a slow release fertilizer that may reduce ammonia emissions (e.g. Rochette et al., 2009), the extent to which will depend on the nature of the polymer coating and whether used with surface fertilizer application or combined with urea injection.
175. Incorporation of fertilizer into the soil either by direct closed-slot injection or by cultivation can be an effective reduction technique (Sommer et al., 2004). For urea prills, combining injection or incorporation with slow-release coatings may allow for a single fertilizer application prior to crop establishment negating the need for surface application at a later date. Depth of injection and soil texture will influence reduction efficiency. Mixing of the fertilizer with the soil through cultivation may be a less efficient reduction measure than injection to the same depth because a part of the mixed-in fertilizer will be close to the surface. For short season crops, the seasonal supply of N can be provided by injection of urea in the seeding operation saving time and money for the farmer. This has been widely adopted by farmers in Western Canada.
176. Irrigation with at least 5 mm water immediately following fertilizer application has been shown to reduce ammonia emissions by up to 70% (Oenema and Velthof, 1993; Sanz-Cobeña, 2010). Water should not be applied to wet soils beyond field capacity. This is only considered a category 1 technique where there is a water need for irrigation, as the method may otherwise increase the risk of nitrate leaching.
65

177. Switching from urea to ammonium nitrate fertilizer is a rather easy way to reduce ammonia emissions, with an effectiveness of around 90%. A possible negative side effect is the potential increase in nitrous oxide (N2O), especially when the ammonium-nitrate based fertilizers are applied to moist or wet soils. The cost of this measure is simply the price differential between the two fertilizer types and the amounts of fertilizer N needed for optimum N fertilization. The gross cost of the ammonia nitrate fertilizer is higher that urea-based fertilizers, depending on market conditions (range 10-30%). However, the net cost may negligible or there may be a net gain, because of the lower N losses.
178. Potential cost implications. The increased cost of implementing these techniques will be offset to some extent (or provide a net benefit) by savings on fertilizer use to achieve the same yield as for the reference method, or an increased yield from the same rate of fertilizer application.
179. Impact on N cycle. If applied at agronomically sensible rates and times and placement, improved crop nitrogen uptake will be the main benefit of mitigating ammonia emissions, with minimal increases via the other loss pathways (e.g. nitrate leaching, denitrification). In addition, by reducing NH3 emissions, a similar reduction in indirect nitrogen losses is expected (e.g. by reduced leaching and denitrification from forest soils). Considering the whole system (agricultural land, non agricultural land and transfers by atmospheric dispersion), these measures are not generally expected to increase overall nitrate leaching or nitrous oxide loss. The measures focus on retaining nitrogen in the farming system, thereby maximizing productivity.
Table 16: Mitigation options (Category 1) for reducing ammonia emissions from urea-based fertilisers.Abatement measure
Fertilizer type
Emission reduction (%)
Factors affecting emission reduction
Applicability Cost (€/kg NH3 abated /year)
Surface broadcast
Urea-based Reference
Urease inhibitor Urea-based 70% for solid urea 40% for liquid urea ammonium nitrate
All -0.5 – 2.0
Slow release fertilizer (polymer coatings)
Urea-based c. 30% Polymer coating type and integrity; fertilizer application technique (surface or injected)
All -0.5 – 2.0
Closed-slot injection
Urea-based and anhydrous ammonia fertilizers
80-90% Depth of placement; soil texture; closure of slot (improperly closed slots may lead to high emissions due to high concentration of urea in the slot increasing pH)
Tilled or reduced-till land prior to seeding or during the seeding operation or during the mechanical weed control operation after emergence
-0.5 – 1.0
Incorporation Urea-based fertilizers
50-80% Delay after fertilizer application; depth of
Tilled land prior to crop establishment
-0.5 – 2.0
66

mixing; soil textureIrrigation All 40-70% Irrigation timing and
volume (immediate with c. 10mm is most effective); soil humidity; soil texture
Where crop irrigation is commonly practiced
-0.5 – 1.0
Substitution with ammonium nitrate
Urea-based and anhydrous ammonia fertilizers
Up to 90% Under conditions where urea based fertilizers would have emissions of at least 40%.
All, especially where only surface application of fertilizer and no irrigation is possible
-0.5 – 1.0
Notes: 1. Local costs/benefits will vary, though trials have shown that the financial benefit of increased crop productivity can more than outweigh the costs of the technique for some abatement measures.
Category 2 techniques
180. Application timing management system (ATMS). This represents a verified system to exploit the variation in ammonia emission potential based on environmental conditions, so as to use management of application timing to reduce overall emissions. Fertilizer applications under cooler conditions and prior to rainfall (although bearing in mind the need to avoid the associated risk of run-off to water bodies) are associated with lower ammonia emissions. If it is to be used, this strategy has to be associated with verification of the reference conditions and of the achieved reductions in emission.
181. Mixing urea with ammonium sulphate. Co-granulation of urea and ammonium sulphate may reduce ammonia emissions compared with urea alone on certain soil types (Oenema and Velthof, 1993). Further studies are required across more soil types before recommendations can be made.
Category 3 techniques
182. Band incorporation of urea. This technique is not recommended on soils with high urease activity (e.g. with crop residue) and poor ability to adsorb urea as it can be associated with increased ammonia emissions in comparison with the reference technique (e.g. Rochette et al., 2009).
(b) Ammonium sulfate and ammonium phosphate based fertilizers
183. Reference technique. The reference application technique is the surface application of ammonium sulfate and ammonium phosphate fertilizers.
Category 1 techniques
184. Several of the techniques described above for urea can also be used to reduce ammonia emissions from ammonium sulfate and ammonium phosphate based fertilizers. The highest risks occur when these fertilizers are applied on calcareous or other high pH
67

soils. Category 1 techniques for ammonium sulphate and ammonium phosphate based fertilizers include: incorporation, injection, immediate irrigation and slow release fertilizers with polymer coatings on high-pH soils (subject to the result of trials).
Category 2 techniques
185. Emissions from non-urea fertilizers such as ammonium nitrate and calcium ammonium nitrate are small, but may occur partly as a result of direct fertilizer emission and partly from indirect emission resulting from plants as a consequence of fertilization. Grass cutting also contributes to the NH3 emissions, with emissions arising from the re-growing sward as a consequence of cutting-induced N mobilization in the vegetation. Fertilizing grassland within the first few days after cutting provides surplus N resulting in a larger emission from the combined effects of cutting and fertilization. Delaying N fertilizer application following cutting allows the grass to recover thereby reducing NH3 emissions. Model analysis found that a two-week delay in N fertilization reduced total (net annual) NH3 emissions from cut and fertilized grassland by 15 per cent. Similar effects may be achieved with different timing depending on regional conditions. However, this practice is will cost herbage yield. Given the interactions with weather and the need for further work to identify the optimum delay in relation to different management systems, this is classed as a category 2 technique. The approach may be integrated into Application Timing Management Systems.
68

IX. OTHER MEASURES RELATED TO AGRICULTURAL NITRO-GEN
(a) Grazing186. Urine excreted by grazing animals often infiltrates into the soil before substantial NH3 emissions can occur. Therefore, NH3 emissions per animal are less for grazing animals than for those housed where the excreta is collected, stored and applied to land. The emission reduction achieved by increasing the proportion of the year spent grazing will depend, inter alia, on the baseline (emission of ungrazed animals), the time the animals are grazed, and the N fertilizer level of the pasture. The potential for increasing grazing is often limited by land availability soil type, topography, farm size and structure (distances), climatic conditions, economic considerations, etc. It should be noted that additional grazing of animals may increase other forms of N emission (e.g. N2O, NO3). However, given the clear and well quantified effect on NH3 emissions, this can be classed as a category 1 technique (in relation to modification of the periods when animals are housed or grazed for 24 hours a day). The abatement efficiency may be considered as the relative total NH 3
emissions from grazing versus housed systems.
187. The effect of changing the period of partial housing (e.g. grazed during daytime only) is less certain and is rated as a category 2 technique. Changing from a fully housed period to grazing for part of the day is less effective in reducing NH3 emissions than switching to complete (24 hour) grazing, since buildings and stores remain dirty and continue to emit NH3.
(b) Manure treatment
188. Research on various options of reducing NH3 emissions by manure treatment have been investigated. Some potentially promising options are:
(a) Composting of solid manure or slurry with added solids: experimental results are very variable and often show increased NH3 emissions; for this reason, systems for composting of manure should consider the inclusion of additional methods to reduce NH3 emissions from this source, such as covers and air scrubbing systems.
(b) Controlled denitrification processes in the slurry: pilot plants show that it might be possible to reduce NH3 emissions by transforming ammonium to N2 gas by controlled denitrification (alternating aerobic and anaerobic conditions). To achieve this, a special reactor is necessary. The efficiency and the reliability of the system and its impact on other emissions need further investigation.
(c) Manure separation to remove P or to provide bedding. Emissions from these systems need to be investigated.
189. The efficiency of manure treatment options should generally be investigated under country- or farm-specific conditions. Apart from NH3 emissions, other emissions, nutrient
69

fluxes and the applicability of the system under farm conditions should be assessed. Due to the mentioned uncertainties, these measures generally have to be grouped in categories 2 or 3. An exception is the use of air scrubbing systems for manure composting facilities (Category 1), which are well-tested but have significant costs.
(c) Non-agricultural manure use
190. If manure is used outside of agriculture, agricultural emissions may be reduced. Examples of such uses already common in some countries are the incineration of poultry manure and the use of horse and poultry manure in the mushroom industry. The emission reduction achieved depends on how fast the manure is taken away from the farm and how it is treated. An overall reduction of the emissions will only be achieved if the use of the manure itself does not generate large emissions (including other emissions than NH3). For example, the use of manure in horticulture or the export of manure to other countries will not reduce overall emissions. There are also other environmental aspects to be considered, for example, poultry litter incineration is a renewable source of energy, but not all the nutrients in the litter will be recycled within agriculture.
70

X. NON-AGRICULTURAL STATIONARY AND MOBILE SOURCES
191. There are many non-agricultural sources of NH3, including motor vehicles, waste disposal, residential solid-fuel combustion, and various industries, of which fertilizer production is likely to be the most significant across Europe. There is also a small, but collectively significant group of natural sources, including, for example, human breath and sweat and emissions from wild animals (Sutton et al. 2000). The UNECE Protocols for reporting emissions do not currently distinguish between natural and anthropogenic sources in the same way that they do for volatile organic compounds (VOCs).
192. A common factor across many of these sectors is that NH3 emissions have previously been ignored. This is most notable with respect to transport, as shown below. A first recommendation for reducing NH3 emissions from non-agricultural sources is therefore to ensure that NH3 is considered when assessing the performance of industry and other sources. Where NH3 emissions are found to arise, or are likely to increase through some technical development, it will be appropriate for operators and designers to consider ways in which systems may be optimized to avoid or minimize emissions.
(a) General techniques193. Venturi scrubbers are suitable for large gas flows bearing large concentrations of NH3. Abatement costs are in the region of €3,500 /ton, excluding effluent treatment costs. As in all cases discussed in this section, the precise cost-effectiveness will vary according to the size of plant, NH3 concentrations and other factors.
194. Dilute acid scrubbers, consisting of a tower randomly packed with tiles through which slightly acidic water is circulated, are suitable for dealing with flows of between 50 and 500 tons per year. Barriers to the technology include its limited suitability for large volume gas flows, potentially high treatment costs for effluents, and safety hazards linked to storage of sulphuric acid. Reported costs show much variability, from €180 to €26,000 /ton NH3. Variation is again largely a function of plant size and NH3 flow rate.
195. Regenerative thermal oxidation uses a supplementary fuel (typically natural gas) to burn NH3 present in a gas stream, with costs reported in the range of €1,900 to €9,100 /ton of NH3.
196. Biofiltration is suitable for low-volume gas flows with low concentrations of NH3, abating emissions of around 1 ton per year. It is the least cost system for small sources. Abatement costs of €1,400 to €4,300 /ton have been reported, depending on sector.
71

197. Abatement efficiencies of the techniques described in this section are typically around 90 per cent.
(b) Techniques suited to selected sectors
198. Emissions of NH3 from road transport increased greatly in the 1990s as a result of the introduction of catalyst-equipped vehicles (an estimate for the United Kingdom shows a factor of 14 increase over this period). The problem is largely being resolved through the introduction of better fuel management systems, moving from carburetor control to computerized systems that exercise much tighter control over the ratio of air to fuel. Moves to reduce the sulphur content of fuels, some methods for NOx control from diesel-engine vehicles, and the use of some alternative fuels may start to increase emissions. Despite the consequences for NH3 of all of these actions, it has not been considered as a priority pollutant by either vehicle manufacturers or by regulators. It is therefore important that for this and other sectors, account be taken of the impact of technological changes on NH3
emissions. By doing so, actions can be undertaken to avoid or minimize emissions during the design phase, where potential problems are identified.
199. Ammonia slippage in stationary catalytic reduction plant. For a number of sectors, the most significant source of NH3 release may be linked to the slippage of NH3 from NOx abatement plant. Two types of technique are available, scrubbing NH3-slip from the flue gases, which can reduce emissions from about 40 mg/m3 by around 90 per cent, and more effective control of NOx control equipment. The potential for NH3 emissions from this source will need to be considered carefully as NOx controls increase through wider adoption of BAT.
200. Non-evaporative cooling systems are applicable to the sugar beet industry. These systems are more than 95 per cent effective in reducing emissions. Costs are estimated at €3,500/ton NH3 abated.
201. Emissions from domestic combustion can be reduced using a wide variety of techniques, ranging from the adoption of energy efficiency measures, to the use of better quality fuels, to optimization of burning equipment. There are significant barriers to the introduction of some of these options, ranging from the technical (e.g. lack of natural gas infrastructure) to the aesthetic (e.g. people liking the appearance of an open wood burning fire).
202. Capping landfill sites. Waste disposal by landfilling or composting has the potential to generate significant amounts of NH3. Actions to control methane emissions from landfill, such as capping sites and flaring or utilizing landfill gas are also effective in controlling NH3.
72

203. Biofiltration (see above) is effectively used at a number of centralized composting facilities, often primarily for control of odours, rather than NH3 specifically. A more general technique, applicable to home composting as well as larger facilities, is to control the ratio of carbon to nitrogen, aiming for an optimum of 30:1 by weight.
204. Horses. Assessment needs to be undertaken of the extent to which emissions from horses are included in the agricultural and non-agricultural inventories. Many horses are kept outside of farms and so may be excluded from agricultural inventories. The most effective approach for reducing emissions from these sources is good housekeeping in stables, with provision of sufficient straw to soak up urine, and daily mucking out. More sophisticated measures for controlling emissions, such as the use of slurry tanks are unlikely to be implemented at small stables, but are described elsewhere in this document.
(c) Production of inorganic N fertilizers, urea and ammonia
205. The most important industrial sources of NH3 emissions are mixed fertilizer plants producing ammonium phosphate, nitrophosphates, potash and compound fertilizers, and nitrogenous fertilizer plants manufacturing, inter alia, urea and NH3. Ammonia phosphate production generates the most NH3 emissions from the sector. Ammonia in uncontrolled atmospheric emissions from this source has been reported to range from 0.1 to 7.8 kg N/ton of product.
206. Nitrogenous fertilizer manufacture covers plants producing NH3, urea, ammonium sulphate, ammonium nitrate and/or ammonium sulphate nitrate. The nitric acid used in the process is usually produced on site as well. Ammonia emissions are particularly likely to occur when nitric acid is neutralized with anhydrous NH3. They can be controlled by wet scrubbing to concentrations of 35 mg NH3/m3 or lower. Emission factors for properly operated plants are reported to be in the range 0.25 to 0.5 kg NH3/ton of product.
207. Additional pollution control techniques beyond scrubbers, cyclones and baghouses that are an integral part of the plant design and operations are generally not required for mixed fertilizer plants. In general, an NH3 emission limit value of 50 mg NH3-N/m3 may be achieved through maximizing product recovery and minimizing atmospheric emissions by appropriate maintenance and operation of control equipment.
208. In a well-operated plant, the manufacture of NPK fertilizers by the nitrophosphate route or mixed acid routes will result in the emission of 0.3 kg/ton NPK produced and 0.01 kg/ton NPK produced (as N). However, the emission factors can vary widely depending on the grade of fertilizer produced.
209. Ammonia emissions from urea production are reported as recovery absorption vent (0.1-0.5 kg NH3/ton of product), concentration absorption vent (0.1-0.2 kg NH3/ton of product), urea prilling (0.5-2.2 kg NH3/ton of product) and granulation (0.2-0.7 kg NH3/ton
73

of product). The prill tower is a source of urea dust (0.5-2.2 kg NH3/ton of product), as is the granulator (0.1-0.5 kg/ton of product as urea dust).
210. In urea plants, wet scrubbers or fabric filters are used to control fugitive emissions from prilling towers and bagging operations. This control equipment is similar to that in mixed fertilizer plants, and is an integral part of the operations to retain product. If properly operated, new urea plants can achieve emission limit values of particular matter below 0.5 kg/ton of product for both urea and NH3.
74

11. REFERENCES
Aarnink, A.J.A., E.N.J.van Ouwerkerk, and M.W.A. Verstegen. 1992. A mathematical model for estimating the amount and composition of slurry from fattening pigs. Livestock Production Science 31:133-147.
Aarnink, A. J. A., and M. W. A. Verstegen. 2007. Nutrition, key factor to reduce environmental load from pig production. Livestock Sciences 109: 194-203.
Aarnink, A. J. A., J. M. G. Hol, and G. M. Nijeboer. 2008. Ammonia emission factor for using benzoic acid (1% vevovitall) in the diet of growing-finishing pigs., Animal Sciences Group, Divisie Veehouderij, Lelystad.
Aarnink A.J.A. & A. Elzing, 1998. Dynamic model for ammonia volatilization in housing with partially slatted floors, for fattening pigs. Livestock Production Science 53 (2): 153-169.
Aarts, H.F.M., B. Habekotté and H. Van Keulen, 2000. Nitrogen management in the “De Marke” dairy farming system. Nutr. Cycl. Agroecosyst. 56 : 231–240.
Amon, B. Th. Amon, J. Boxberger & Ch. Alt, 2001. Emissions of NH3, N2O and CH4 from dairy cows housed in a farmyard manure tying stall (housing, manure storage, manure spreading). Nutrient Cycling in Agroecosystems 60: 103–113.
Anonymous, 2008. Evaluering af det generelle ammoniakkrav Rapport April 2008, Aarhus University, DK, 115 pp.
Atapattu, N. S. B. M., Senaratna, D. and Belpagodagamage, U.D. 2008 Comparison of Ammonia Emission Rates from Three Types of Broiler Litters. Poultry Science 87:, 2436-2440.
Aubert et al, Journées de la Recherche Avicole, 2011
Bakker, G. C. M., and M. C. J. Smits. 2002. Dietary factors are additive in reducing in vitro ammonia emission from pig manure. J. Anim. Sci. 79 Suppl. 1: Abstract 757.
Economische gevolgen van bestaande regelgeving voor de Nederlandse varkenshouderij
Baltussen, W.H.M., R. Hoste, H.B. van der Veen, S. Bokma, P. Bens en H. Zeewuster. 2010. Economic impacts of governmental policy measures for the Pig industry in The Netherlands. LEI Rapport 2010-010; ISBN 978-90-8615-404-3 Den Haag, The Netherlands, 96 pp.
Bannink, A., H. Valk, and A. M. Van Vuuren. 1999. Intake and Excretion of Sodium, Potassium, and Nitrogen and the Effects on Urine Production by Lactating Dairy Cows J Dairy Sci 82:1008–1018
Berntsen, J., B. M. Petersen, P. Sørensen and J. E. Olesen. 2007. Simulating residual effects of animal manures using 15N isotopes. Plant Soil 290: 173-187
Bittman, S., Kowalenko, C.G., Forge, T.A., Hunt, D.E., Bounaix, F., and Patni, N.K. (2007). Agronomic effects of multi-year surface-banding of dairy slurry on grass. Bioresource Technology, 98: 3249-3258.
Bouwman, A.F., Lee, D.S., Asman, W.A.H., Dentener, F.J., Van der Hoek, K.W. and Olivier J.G.J. 1997. A global high-resolution emission inventory for ammonia. Global Biogeochemical Cycles 11: 561- 587.
Braam, C.R., Smits, M.C.J., Gunnink, H. and Swierstra D. 1997(a). Ammonia Emission from a Double-Sloped Solid Floor in a Cubicle House for Dairy Cows. Journal of Agricultural Engineering Research 68, 375-386.
Braam, C.R., Ketelaars, J. and Smits, M.C.J., 1997(b). Effects of floor design and floor cleaning on ammonia emission from cubicle houses for dairy cows. Netherlands Journal of Agricultural Science 45: 49-64.
BREF, 2003. Reference Document on Best Available Techniques for Intensive Rearing of Poultry and Pigs. Integrated Pollution Prevention and Control (IPPC). July 2003 http://eippcb.jrc.es/reference/.
75

Broderick, G.A. 2003. Effects of Varying Dietary Protein and Energy Levels on the Production of Lactating Dairy Cows. J. Dairy Sci. 86:1370–1381
Burton, C. H., and C. Turner. 2003. Manure management—treatment strategies for sustainable agriculture. 2nd ed. Silsoe: Silsoe Research Institute.
Burton, C.H. 2007. The potential contribution of separation technologies to the management of livestock manure, Livest. Sci. 112: 208–216.
Bussink, D.W. and O. Oenema. 1998. Ammonia volatilization from dairy farming systems in temperate areas; a review. Nutr. Cycl. Agroecosyst. 51:19-33.
Canh, T. T. et al. 1998a. Influence of electrolyte balance and acidifying calcium salts in the diet of growing-finishing pigs on urinary pH, slurry pH and ammonia volatilisation from slurry. Livest. Prod. Sci. 56: 1-13.
Canh, T. T. et al. 1998b. Dietary protein affects nitrogen excretion and ammonia emission from slurry of growing-finishing pigs. Livest. Prod. Sci. 56: 181-191.
Canh, T. T. et al. 1998d. Effect of dietary fermentable fibre from pressed sugar-beet pulp silage on ammonia emission from slurry of growing-finishing pigs. Animal Science 67: 583-590.
Canh, T. T. et al. 1998e. Dietary carbohydrates alter the faecal composition and ph and ammonia emission from slurry of growing pigs. J. Anim. Sci. 76: 1887-1895.
Canh, T. T., A. J. A. Aarnink, M. W. A. Verstegen, and J. W. Schrama. 1998c. Influence of dietary factors on the ph and ammonia emission of slurry from growing-finishing pigs. J. Anim. Sci. 76: 1123-1130.
Castillo, A.R., E. Kebreab, D.E. Beever, and J. France. 2000. A review of efficiency of nitrogen utilization in dairy cows and its relationship with the environmental pollution. J. Anim. & Feed Sci. 9:1-32.
Chadwick D., Misselbrook T., Gilhespy S., Williams J., Bhogal A., Sagoo L., Nicholson F., Webb J., Anthony S., Chambers B. (2005) Ammonia emissions from nitrogen fertilizer applications to grassland and tillage land. In: WP1B Ammonia emissions and crop N use efficiency. Report for Defra Project NT2605 (CSA 6579). 71 p.
Chadwick, D.R., F. John, B.F. Pain, B.J. Chambers, and J. Williams. 2000. Plant uptake of nitrogen from the organic nitrogen fraction of animal manures: A laboratory experiment. J. Agric. Sci. (Camb.) 134:159–168.
Chadwick, D.R. 2005. Emissions of ammonia, nitrous oxide and methane from cattle manure heaps: effect of compaction and covering, Atmospheric Environment 39: 787–799.
Doberman, A. 2007. Nutrient use efficiency – measurement and management. In: Fertilizer Best Management Practices. General Principles, Strategy for their Adoption and Voluntary Initiatives vs Regulations. International Fertilizer Industry Association, Paris, France.
Dourmad, J. Y., Y. Henry, D. Bourdon, N. Quiniou, and D. Guillou. 1993. Effect of growth potential and dietary protein input on growth performance, carcass characteristics and nitrogen output in growing-finishing pigs. Proceedings Congress on Nitrogen Flow in Pig Production and Environmental Consequences, Wageningen 8-11 june, p. 206-211.
EC, 1999. Council Directive 1999/74/EC of 19 July 1999 laying down minimum standards for the protection of laying hens [Official Journal L 203 of 3 August 1999]. Also at: http://europa.eu/legislation_summaries/food_safety/animal_welfare/l12067_en.htm (retrieved 5 July, 2011).
Ellen, H.H., J.M.G. Hol, A.I.J. Hoofs, J. Mosquera, A.J.J. Bosma, 2008. Ammonia emission and costs of a chemical air scrubber with bypass ventilation at a pig house. Wageningen UR Animal Sciences Group Rapport 151, 26 pp
Fangueiro, D., J. Coutinho, D. Chadwick, N. Moreira and H. Trindade, 2008a.Effect of cattle slurry separation on greenhouse gas and ammonia emissions during storage, J. Environ. Qual. 37 2322–2331.
76

Fangueiro, D., J. Pereira, D. Chadwick, J. Coutinho, N. Moreira and H. Trindade, 2008b. Laboratory assessment of the effect of cattle slurry pre-treatment on organic N degradation after soil application and N2O and N2 emissions, Nutr. Cycl. Agroecosyst. 80: 107–120.
FAO, 2009. The State of Food and Agriculture 2009. Towards a responsible livestock future, FAO, Rome.
Galloway, J.N., Aber, J.D, Erisman, J.W., Seitzinger, S.P., Howarth, R.W., Cowling, E.B., Cosby, B.J., 2003. The Nitrogen Cascade. BioScience 53, 341-356.
Geers, R. and F. Madec (Eds.) 2006. Livestock production and Society. Wageningen Academic Publishers, Wageningen, The Netherlands, 307 pp.
Gilhespy, S.L., J. Webb, D.R. Chadwick, T.H. Misselbrook, R. Kay, V. Camp, A.L. Retter and A. Bason, 2009. Will additional straw bedding in buildings housing cattle and pigs reduce ammonia emissions?, Biosystems Engineering 102: 180–189.
Groenestein, C.M. & H.G. van Faassen, 1996. Volatilization of ammonia, nitrous oxide and nitric oxide in deep-litter systems for fattening pigs. Journal of Agricultural Engineering Research 65: 269-274.
Groot Koerkamp, P.W.G. and C.M. Groenestein, 2008. Ammonia and odour emission from a broiler house with a litter drying ventilation system In: AgEng2008 Agricultural and Biosystems Engineering for a Sustainable World. - International Conference in Agricultural Engineering & Industry Exhibition, Crete, Greece, 2008-06-23/ 2008-06-25.
Guingand, N., L. Demerson, and J. Broz. 2005. Incidence de l'incorporation d'acide benzoïque dans l'alimentation des porcs charcutiers sur les performances zootechniques et l'émssion d'ammoniac. Journées Recherche Porcine 37: 1-6.
Guingand, N. and V. Courboulay, 2007. Reduction of the number of slots for concrete slatted floor in fattening buildings: consequences for pigs and environment. In: G.J. Monteny and E. Hartung, Editors, Proceedings of the International Conference on Ammonia in Agriculture: Policy, Science, Control and Implementation, pp. 147–148 Wageningen, The Netherlands.
Guingand N. 2009. Wet scrubber: one way to reduce ammonia and odours emitted by pig units. 60th EAAP meeting, Barcelona, Spain
Gutser, R., Th. Ebertseder, A. Weber, M. Schraml, U. Schmidhalter. 2005. Short-term and residual availability of nitrogen after long-term application of organic fertilizers on arable land. Journal of Plant Nutrition and Soil Science 168: 439 – 446.
Hadas A, Doane TA, Kramer AW, van Kessel C, Horwath WR (2002) Modelling the turnover of 15N-labelled fertilizer and cover crop in soil and its recovery by maize. Eur J Soil Sci 53:541–552.
Hart, P. B. S.; Powlson, D. S.; Poulton, P. R.; Johnston, A. E.; Jenkinson, D. S. 1993. The availability of the nitrogen in the crop residues of winter wheat to subsequent crops. Journal of Agricultural Science 121: 355-362.
Hansen, M.N., K. Henriksen and S.G. Sommer, 2006. Observations of production and emission of greenhouse gases and ammonia during storage of solids separated from pig slurry: Effects of covering. Atmospheric Environment 40: 4172-4181.
Hatch, D.J., Chadwick D.R., Jarvis S.C. and Roker J.A. (eds). 2004. Controlling nitrogen flows and Losses. Wageningen Academic Publishers, Wageningen, 624 pp.
Histov, A.N., W. Hazen and J.W. Ellsworth, Efficiency of use of imported nitrogen, phosphorus and potassium and potential for reducing phosphorus imports on Idaho dairy farms. J. Dairy Sci. 89: 3702–3712.
Huynh, T.T.T., A.J.A. Aarnink, H.A.M. Spoolder, B. Kemp and M.W.A. Verstegen, 2004. Effects of floor cooling during high ambient temperatures on the lying behavior and productivity of growing finishing pigs. Transactions of the ASAE 47 (5), 1773-1782.
77

IFA, 2007. Fertilizer Best Management Practices. General Principles, Strategy for their Adoption and Voluntary Initiatives vs Regulations. International Fertilizer Industry Association, Paris, France, 259 pp.
Janssen B.H. (1984): A simple method for calculating decomposition and accumulation of ‘young’ soil organic matter. Plant Soil 76:297-304.
Jarret G, Martinez J, Dourmad J-Y, 2011. Effect of biofuel co-products in pig diets on the excretory patterns of N and C and on the subsequent ammonia and methane emissions from pig effluent". Animal, 5, 622-631.
Jarvis, S.C. and B.F. Pain (Eds.) 1997. Gaseous Nitrogen Emissions from Grasslands. CAB International. Wallingford, UK, 452 pp.
Jarvis S. , Hutchings N., Brentrup F., Olesen J.E. and van der Hoek K.W. (2011) Nitrogen flows in farming systems across Europe. In: The European Nitrogen Assessment: Sources, Effects and Policy Perspectives (Eds: Sutton, M.A., Howard, C., Erisman, J.W., Billen, G., Bleeker, A., Grennfelt, P., van Grinsven, H. and Grizzetti B.) pp 211-228. Cambridge University Press.
Jenkinson, D.S. and K.A. Smith (Eds.) 1988. Nitrogen Efficiency in Agricultural Soils. Elsevier Applied Science. London, UK, 450 pp.
Kebreab, E., J. France, D.E. Beever, and A.R. Castillo. 2001. Nitrogen pollution by dairy cows and its mitigation by dietary manipulation. Nutr. Cycl. Agroecosyst. 60, 275-285.
Kirchgessner, M., M. Kreuzer, D. A. Roth-Maier, F. X. Roth, and H. L. Muller. 1991. Bestimmungsfaktoren der gullecharakeristik beim schwein. Einfluss von futterungsintensitat und den anteilen an unverdaulichen sowie an bakteriell fermentierbaren substanzen (bfs) im futter. Agribiol. Res. 44 (4), p. 325-344.
Kolenbrander G.J. and L.C.N. De La Lande Cremer, 1967. Solid and Liquid Manures. Value and Possibilities (In Dutch). H. Veenman & Zonen NV, Wageningen, 188 pp.
Langmeier M, Frossard E, Kreuzer M, Mäder P, Dubois D, Oberson A (2002) Nitrogen fertilizer value of cattle manure applied on soils originating from organic and conventional farming systems. Agronomie 22:789–800.
Lenis, N. P., and J. B. Schutte. 1990. Aminozuurvoorziening van biggen en vleesvarkens in relatie tot de stikstofuitscheiding. In: Jongbloed A W; Coppoolse J (Eds.), Mestproblematiek: aanpak via de voeding van varkens en pluimvee. Onderzoek inzake de mest en ammoniakproblematiek in de veehouderij 4, Dienst Landbouwkundig Onderzoek, Wageningen.
MacDonald, A. J., Poulton, P. R., Powlson, D. S., Jenkinson, D. S. 1997. Effects of season, soil type and cropping on recoveries, residues and losses of 15N-labelled fertilizer applied to arable crops in spring. Journal of Agricultural Science 129, 125-154.
Melse, R.W., Wagenberg, A.V. van Mosquera, J., 2006. Size reduction of ammonia scrubbers for pig and poultry houses: Use of conditional bypass vent at high air loading rates Biosystems Engineering 95: 69 - 82.
Menzi, H., O. Oenema, C. Burtun, O. Shipin, P. Gerber, T. Robinson, G. Franceshini, 2010. Impacts of intensive livestock production and manure management on the environment. In Livestock in a changing landscape: Drivers, Consequences and Responses, ed. H. Steinfeld, H. Mooney, F. Schneider and L.E. Neville. Washington, DC: Island Press.
Mikkelsen, S. A., T. M. Iversen, B. H. Jacobsen, and S.S. Kjaer. 2010. Denmark–EU: the regulation of nutrient losses from intensive livestock operations. In Livestock in a changing landscape: regional perspectives, ed. P. Gerber, H. Mooney, J. Dijkman, S. Tarawali, and C. de Haan. Washington, DC: Island Press.
Misselbrook, T.H., K.A. Smith, D.R. Jackson, and S.L. Gilhespy. 2004. Ammonia emissions from irrigation of dilute pig slurries. Biosystems Engineering 89:473-484.
78

Misselbrook, T.H., Powell, J.M. 2005. Influence of bedding material on ammonia emissions from cattle excreta. Journal of Dairy Science 88, 4304-4312.
Misselbrook, T. H., Brookman, S. K. E., Smith, K. A., Cumby, T. R., Williams, A. G. and McCrory, D. F. 2005. Crusting of stored dairy slurry to abate ammonia emissions: pilot-scale studies. Journal of Environmental Quality 34, 411-419.
Misselbrook, T. H., Nicholson, F. A. and Chambers, B. J. (2005). Predicting ammonia losses following the application of livestock manure to land. Bioresource Technology 96, 159-168.
Misselbrook, T. H., Powell, J. M., Broderick, G. A. and Grabber, J. H. 2005. Dietary manipulation in dairy cattle: laboratory experiments to assess the influence on ammonia emissions. Journal of Dairy Science 88, 1765-1777.
Moal, J.F., J. Martinez, F. Guiziou, and C.M. Coste. 1995. Ammonia volatilization following surface applied pig and cattle slurry in France. Journal of Agricultural Science 125:245-252.
Møller, H.B. J.D. Hansen and C.A.G. Sorensen, 2007. Nutrient recovery by solid–liquid separation and methane productivity of solids, Trans ASABE 50: 193–200.
Monteny, G. J.; Erisman, J. W. "Ammonia Emissions from Dairy Cow Buildings, A Review of Measurement Techniques, Influencing Factors, and Possibilities for Reduction", Netherlands Journal of Agricultural Science. 1998, 46, 225-247.
Monteny, G.J., 2000. Modelling of ammonia emissions from dairy cow houses. Thesis Wageningen University. ISBN 90-5808-348-9, Wageningen, NL, 156 pp.
Mooney, H., H. Steinfeld, F. Schneider, L. Neville 2009 Livestock in a Changing Landscape. Drivers, Consequences and Responses (In press)
Mosier, A.R., J.K. Syers and J.R. Freney, 2004. Agriculture and the Nitrogen Cycle. Assessing the Impacts of Fertilizer Use on Food Production and the Environment. SCOPE 65. Island Press, 296 pp.
Mroz, Z., A. W. Jongbloed, T. T. Canh, and N. P. Lenis. 1996. Lowering ammonia volatilization from pig excreta by manipulating dietary acid-base difference. Proceedings of the 8-th Animal Science Congress of AAAP Tokyo.
Nevens, F., Reheul, D. 2005. Agronomical and environmental evaluation of a long-term experiment with cattle slurry and supplemental inorganic N applications in silage maize. European Journal of Agronomy 22, 349–361.
Nicholson, F.A., B. J. Chambers, A. W. Walker. 2004. Ammonia emissions from broiler litter and laying hen manure management systems, Biosystems Engineering, 89: 175-185.
Nørregaard Hansen, M., S.G. Sommer, N.J. Hutchings and P. Sørensen. 2008. Emission factors for calculation of ammonia volatilization by storage and application of animal manure. Det Jordbrugsvidenskabelige Fakultet. DJF HUSDYRBRUG nr. 84 • December 2008, Aarhus, DK, 48 pp.
OECD, 2008. Environmental Performance of Agriculture in OECD Countries Since 1990, Organisation for Economic Co-operation and Development, OECD Publications, Paris.
Oenema, O. and S. Pietrzak. 2002. Nutrient management in food production: achieving agronomic and environmental targets. Ambio 31: 159:168
Oenema, O., H. Kros and W. de Vries. 2003. Approaches and uncertainties in nutrient budgets: implications for nutrient management and environmental policies. European Journal of Agronomy 20: 3-16.
Oenema, O., A. Bannink, S.G. Sommer, J.W. Van Groenigen, G.L. Velthof, 2008. Gaseous Nitrogen Emissions from Livestock Farming Systems. pp 395-441 In: Nitrogen in the Environment: Sources,Problems, and Management, Second edition, J. L. Hatfield & R. F. Follett (Eds.) Acad. Press, Amsterdam.
79

Oenema, O., H.P. Witzke, Z. Klimont, J.P. Lesschen, and G.L. Velthof: Integrated assessment of promising measures to decrease nitrogen losses from agriculture in EU-27. Agriculture, Ecosystems & Environment 133: 280-288.
Oenema, O., Velthof, G.L. (1993) Ammonia volatilization from compound nitrogen-sulfur fertilizers. IN: Optimization of Plant Nutrition (Eds. M.A.C. Fragaso and M.L. van Beusichem), Kluwer Academic Publishers, Netherlands, p341-349.
Oenema, J., H. van Keulen, R.M.L. Schils and H.F.M. Aarts. 2011. Participatory farm management adaptations to reduce environmental impact on commercial pilot diary farm in the Netherlands. NJAS-Wageningen Journal of Life Sciences 58: 39-48.
Pain, B. and Menzi H. 2003. Glossary of terms on livestock manure management 2003. RAMIRAN Network, 59 pp.
Patterson, P.H. and Adrizal. 2005. Management Strategies to Reduce Air Emissions: Emphasis - Dust and Ammonia. Journal of Applied Poultry Research, 2005, 14:638-650.
Patience, J. F., R. E. Austic, and R. D. Boyd. 1987. Effect of dietary electrolyte balance on growth and acid-base status in swine. J. Anim. Sci. 64: 457.
Paul, J.W., N.E. Dinn, T. Kannangara, and L.J. Fisher. 1998. Protein content in dairy cattle diets affects ammonia losses and fertiliser nitrogen value. J. Environ. Qual. 27:528-534.
Portejoie, S., J.Y. Dourmad, J. Martinez and Y. Lebreton. 2004. Effect of lowering dietary crude protein on nitrogen excretion, manure composition and ammonia emission from fattening pigs. Livest. Prod. Sci. 91, 45–55.
Powell, J.M., M.A. Wattiaux, G.A. Broderick, V.R. Moreira, and M.D. Casler. 2006. Dairy diet impacts on fecal properties and nitrogen cycling in soils. Science Society of America Journal 70:786-794.
Powell, J.M., Misselbrook, T.H., and Casler, M.D. 2008a. Season and bedding impact ammonia emissions from tie-stall dairy barns. Journal of Environmental Quality 37:7-15.
Powell, J.M., Broderick, G.A., and Misselbrook, T.H. 2008b. Seasonal diet impacts on ammonia emissions from tie-stall dairy barns. Journal of Dairy Science 91:857-869.
Powell, J.M and G.A. Broderick. 2009. Ammonia emissions from dairy barns: What have we learned? Cornell Nutrition Conference, 20-22 October 2009. Syracuse, NY
Powell, J.M., Rotz, C.A. and Weaver, D.M. Nitrogen use efficiency in dairy production. In: Grignani, C., M Acutis, L. Zavattaro, L. Bechini, C. Bertora, P. Marino Gallina and D. Sacco (Eds.). Proceedings of the 16th Nitrogen Workshop-Connecting different scales of nitrogen use in agriculture. June 28-July 1, 2009. . Turin, Italy. Pp. 241-242.
Powell, J.M. and M.P. Russelle. 2009. Dairy heifer management impacts manure N collection and cycling through crops. Agric., Ecosyst. Environ. 131:170-177.
Reidy, B., and H. Menzi. 2007. Assessment of the ammonia abatement potential of different geographical regions and altitudinal zones based on a large-scale farm and manure management survey. Biosystems Engineering 97:520-531.
Ritz, C.W., B.W. Mitchell, B.D. Fairchild, M. Czarick and J.W. Worley. 2006. Improving In-House Air Quality in Broiler Production Facilities Using an Electrostatic Space Charge System. Journal of Applied Poultry Research, 2006, 15:333-340.
Rochette P., MacDonald J.D., Angers D.A., Chantigny M.H., Gasser M.O., Bertrand N. (2009) Banding of urea increased ammonia volatilization in a dry acidic soil. Journal of Environmental Quality 38:1383-1390.
Rotz, C.A. 2004. Management to reduce nitrogen losses in animal production. J. Anim. Sci. 2004. 82(E. Suppl.):E119-E137.
80

Rotz, C.A., F. Taube, M.P. Russelle, J. Oenema, M.A. Sanderson and M. Wachendorf, 2005. Whole-farm perspectives of nutrient flows in grassland agriculture. Crop Sci. 45: 2139–2159.
Rotz, C.A., J. Oenema and H. van Keulen, Whole farm management to reduce nitrogen losses from dairy farms: a simulation study. Appl. Eng. Agric. 22: 773–784.
Rufino, M.C., E.C. Rowe, R.J. Delve and K.E. Giller. 2006. Nitrogen cycling efficiencies through resource-poor African crop-livestock systems. Agric Ecosyst Environ 116:261-282.
Rufino, M.C., P. Tittonell, M.T. van Wijk, A. Castellanos-Navarrete, R.J. Delve, N. de Ridder and K.E. Giller. 2007. Manure as a key resource within smallholder farming systems: analysing farm-scale nutrient cycling efficiencies with the NUANCES framework. Livest Sci 112: 273-287.
Sanz-Cobeña, A. (2010) Ammonia emissions from fertiliser application: Quantification techniques and mitigation strategies. PhD Thesis, University Polytechnic Madrid.
Schils, R.L.M. & I. Kok, 2003. Effects of cattle slurry manure management on grass yield. Netherlands Journal of Agricultural Science 51, 41-65.
Schlegel, P., S. Durosoy and A.W. Jongbloed (Eds.) Trace Elements in animal production systems. Wageningen Academic Publishers, Wageningen, 347.
Schröder, J. J., H. F. M. Aarts, H. F. M. ten Berge, H. van Keulen and J. J. Neeteson. 2003. An evaluation of whole-farm nitrogen balances and related indices for efficient nitrogen use. European Journal of Agronomy 20: 33-44.
Schröder J. J., D. Uenk and G. J. Hilhorst, 2007. Long-term nitrogen fertilizer replacement value of cattle manures applied to cut grassland. Plant Soil 299:83–99.
Schroder J.J. & Stevens R.J. (2004). Optimizing N additions: can we integrate fertilizer and manure use? In: Hatch, D.J., Chadwick D.R., Jarvis S.C. and Roker J.A. (eds) Controlling nitrogen flows and losses, Wageningen Pers, Wageningen, 586-593.
Schröder J.J., A.G. Jansen, G.J. Hilhorst. 2005. Long-term nitrogen supply from cattle slurry. Soil Use and Management 21:196 – 204.
Schroder J.J., Neeteson J.J., Oenema O. & Struik P.C. (2000). Does the crop or the soil indicate how to save nitrogen in maize production? Field Crops Research 62, 151-164.
Schroder, J.J. (2005). Revisiting the agronomic benefits of manure: a correct assessment and exploitation of its fertilizer value spares the environment. Bioresource Technology 92: 253-261.
Seré, C. and H. Steinfeld, 1996. World Livestock Production Systems. Current Status, Issues and Trends. FAO ANIMAL PRODUCTION AND HEALTH PAPER NO. 127, FAO, Rome, 58 pp.
Smil, V. 2002. Eating meat: Evolution, patterns, and consequences. Population and Development Review 28: 599-639.
Smil, V., 2001. Enriching the Earth. MIT Press, Cambridge, Massachusetts, 338 pp.
Smith, K.A., and B.J. Chambers. 1995. Muck: from waste to resource. Utilisation: the impacts and implications. The Agricultural Engineer 50:33-38.
Smith, K.A., D.R. Jackson, T.H. Misselbrook, B.F. Pain, and R.A. Johnson. 2000. Reduction of ammonia emission by slurry application techniques. Journal of Agricultural Engineering Research 77:277-287.
Smith, K., Cumby, T. Lapworth J. Misselbrook T.H. and Williams A. 2007. Natural crusting of slurry storage as an abatement meaure for ammonia emissions on dairy farms. Biosystems Engineering 97, 464-471.
Smits, M.C.J., 1998. Grooving a solid V-shaped floor; some observations on walking behaviour and ammonia emission, in Dutch.. IMAG Report P 98-60. IMAG-DLO, Wageningen, the Netherlands.
Søgaard, H.T., S.G. Sommer, N.J. Hutchings, H.J.F. M., D.W. Bussink, and F. Nicholson. 2002. Ammonia volatilization from field-applied animal slurry - the ALFAM model. Atmospheric Environment 36:3309-3319.
81

Sommer, S.G., and J.E. Olesen. 1991. Effects of dry matter content and temperature on ammonia loss from surface-applied cattle slurry. Journal of Environmental Quality 20:679-683.
Sommer, S.G., S. Genermont, P. Cellier, N.J. Hutchings, J.E. Olesen, and T. Morvan. 2003. Processes controlling ammonia emission from livestock slurry in the field. European Journal of Agronomy 19:465-486.
Sommer S.G., Schjoerring J.K., Denmead O.T. (2004) Ammonia emission from mineral fertilizers and fertilized crops. Advances in Agronomy 82:557-622.
Sommer S.G., Oenema O., Chadwick D., Misselbrook, Harrison R., Hutchings N.J., Menzi H., Monteny G.-J., Ni, J.-Q. and Webb J., 2006. Algorithms determining ammonia emission from buildings housing cattle and pigs and from manure stores. Agronomy Journal 89: 264-335.
Sommerfeldt, T. G., Chang, C., Entz, T. 1988. Long-term annual manure applications increase soil organic matter and nitrogen, and decrease carbon to nitrogen ratio. Soil Science Society of America Journal 52, 1668-1672.
Sørensen, P., 2004. Immobilisation, remineralisation and residual effects in subsequent crops of dairy cattle slurry nitrogen compared to mineral fertiliser nitrogen. Plant and Soil 267, 285–296.
Sørensen, P., Amato, M. 2002. Remineralisation and residual effects of N after application of pig slurry to soil. European Journal of Agronomy 16, 81-95.
Sørensen, P., and I.K. Thomsen. 2005. Separation of Pig Slurry and Plant Utilization and Loss of Nitrogen-15-labeled Slurry Nitrogen. Soil Sci. Soc. Am. J. 69:1644–1651.
Sørensen, P., Weisbjerg, M.R., Lund, P. 2003. Dietary effects on the composition and plant utilization of nitrogen in dairy cattle manure. Journal of Agricultural Sciences, Cambridge 141, 79-91.
Spoelstra, S. F. 1979. Volatile fatty acids in anaerobically stored piggery wastes. Neth. J. Agric. Sci. 27: 60-66.
Steinfeld, H., Gerber, P., Wassenaar, T., Castel V., Roslaes, M., De Haan, C., 2006. Livestock’s long Shadow. Environmental Issues and Options. FAO report, Rome, Italy, 390 pp.
Steinfeld, H., H. Mooney, F. Schneider and L.E. Neville (Eds.), 2010. In Livestock in a changing landscape: Drivers, Consequences and Responses. Washington, DC: Island Press. 396 pp.
Stevens, R.J. and Laughlin, R.J., 1997. The impact of cattle slurries and their management on ammonia and nitrous oxide emissions from grassland. In: Jarvis, S.C. and Pain, B.F., Editors, 1997. Gaseous Nitrogen Emissions from Grasslands, CAB International, Wallingford UK, pp. 233–256.
Sutton, M.A., Dragosits, U., Tang, Y.S. and Fowler, D. (2000) Ammonia emissions from non-agricultural sources in the UK. Atmos. Environ. 34 (6), 855-869.
Sutton, M.A., Howard, C., Erisman, J.W., Billen, G., Bleeker, A., Grennfelt, P., van Grinsven, H. and Grizzetti B. (2011) The European Nitrogen Assessment: Sources, Effects and Policy Perspectives (Eds.) Cambridge University Press. 612 pp.
Svenson, C. 2003. Relationship between content of crude protein in rations for dairy cows, N in urine and ammonia release. Livestock Production Science 84 (2003) 125–133.
Swierstra, D., C.R. Braam, & M.C.J. Smits, 2001. Grooved floor systems for cattle housing: ammonia emission reduction and good slip resistance. Applied Engineering in Agriculture17 (1): 85-90
Tamminga, S., 1996. A review on environmental impacts of nutritional strategies in ruminants. J. Anim. Sci. 74, 3112-3124.
Van Duinkerken, G. M.C. Blok, A. Bannink, J.W. Cone, J. Dijkstra, A.M. van Vuuren and S. Tamminga. 2011. Update of the Dutch protein evaluation systems for ruminants: the DVE/OEB2010 system. Journal of Agricultural Science, 149: 351-367.
82

Van Duinkerken, M.C. J. Smits, G. Andre, L.B.J. Sebek and J. Dijkstra, 2011b. Milk urea concentration as an indicator of ammonia emission from dairy cow barn under restricted grazing. Journal of Dairy Science, 94: 321-335.
Van der Meer H.G., R.J. Unwin, T.A. van Dijk and G.C. Ennik (Eds.) 1987 Animal Manure on grassland and fodder crops. Fertilzer of Waste? Martinus Nijhoff Publishers, Dordrecht, Netherlands. 388 pp.
Van Vuuren, A.M., C.J. Van der Koelen, H. Valk and H. de Visser, 1993. Effect of partial replacement of ryegrass by low protein feeds on rumen fermentation and nitrogen loss by dairy cows. J. Dairy Sci., 76, 2982-2993.
Van Vuuren A.M. and J.A.C. Meijs, 1987. Effects of herbage composition and supplement feeding on the excretion of nitrogen in dung and urine by grazing cows. Pages 17-25 in Animal Manure on grassland and fodder crops. Fertilzer of Waste? Van der Meer H.G., R.J. Unwin, T.A. van Dijk and G.C. Ennik (Eds.) Martinus Nijhoff Publishers, Dordrecht, Netherlands.
Velthof, G.L., M.L. van Beusichem, W.M.F. Raijmakers and B.H. Janssen, 1998. Relationship between availability indices and plant uptake of nitrogen and phosphorus from organic products. Plant and Soil 200: 215–226.
Watson C.J., Miller H., Poland P., Kilpatrick D.J., Allen M.D.B., Garrett M.K., Christianson C.B. (1994) Soil properties and the ability of the urease inhibitor to reduce ammonia volatilization from surface-applied urea. Soil Biology & Biochemistry 26:1165-1171.
Watson CA & Atkinson D 1999. Using nitrogen budgets to indicate nitrogen use efficiency and losses from whole farm systems: a comparison of three methodological approaches. Nutrient Cycling in Agroecosystems 53, 259-267.
Webb, J., Pain, B., Bittman, S., and Morgan, J. 2010. The impacts of manure application methods on emissions of ammonia, nitrous oxide and on crop response-A review , Agriculture, Ecosystems and Environment, 137: 39-46. doi: 10.1016/j.agee.2010.01.001.
Webb, J., S. Anthony and S. Yamulki, 2006. Optimising incorporation to reduce ammonia emissions from litter-based manures: the MAVIS Model, Trans. Am. Soc. Agric. Biol. Eng. 49 : 1905–1913.
Webb, J., D. Chadwick and S. Ellis, 2004. Emissions of ammonia and nitrous oxide following rapid incorporation of farmyard manures stored at different densities. Nutr. Cycl. Agroecosyst. 70 : 67–76.
Webb, J., H. Menzi, B.F. Pain, T.H. Misselbrook, U. Dämmgen, H. Hendriks and H. Döhler, 2005. Managing ammonia emissions from livestock production in Europe, Environ. Pollut. 135: 399–406.
Webb, J. and T.H. Misselbrook, 2004. A mass-flow model of ammonia emissions from UK livestock production, Atmos. Environ. 38: 2163–2176.
Webb, J. S. G. Anthony, L. Brown, H. Lyons-Visser, C. Ross, B. Cottrill, P. Johnson and D. Scholefield, 2005. The impact of increasing the length of the cattle grazing season on emissions of ammonia and nitrous oxide and on nitrate leaching in England and Wales. Agriculture, Ecosystems & Environment 105, 307-321
Webb, M. Ryan, S.G. Anthony, A. Brewer, J. Laws, F.A. Aller and T.H. Misselbrook, 2006. Identifying the most cost-effective means of reducing ammonia emissions from UK agriculture using the NARSES model, Atmos. Environ. 40: 7222–7233.
Whitehead, D.C. 2000. Nutrient Elements in Grassland. Soil-Plant-Animal Relationships. CABI Publ., Wallingford, UK.
Ye, Z. Y., G. Q. Zhang, B. M. Li, J. S. Strøm, G. H. Tong, and P. J. Dahl. 2008a. Influence of airflow and liquid properties on the mass transfer coefficient of ammonia in aqueous solutions. Biosystems Eng. 100: 422‐434.
Ye, Z. Y., G. Q. Zhang, B. M. Li, J. S. Strøm, and P. J. Dahl. 2008b. Ammonia emissions affected by airflow in a model pig house: effects of ventilation rate, floor slat opening and head space I a manure storage pit. Transactions of the ASABE 51: 2113-2122.
83

Zhao, Y., A. J. A. Aarnink, M. C. M. de Jong, N. W. M. Ogink, P. W. G. Groot Koerkamp, 2011. Effectiveness of multi-stage scrubbers in reducing emissions of air pollutants from pig houses. Transactions of the American Society of Agricultural and Biological Engineers 54: 285-293.
------
84

85

Appendix 1. Supplementary Information
Guidance Document for Preventing and Abating Ammonia Emissions from Agricultural Sources of the Gothenburg Protocol:
B. Nitrogen management, taking account of the whole nitrogen cycle
1. Management is commonly defined as ‘a coherent set of activities to achieve objectives’. This definition applies to all sectors of the economy, including agriculture. Nitrogen management can be defined as ‘a coherent set of activities related to nitrogen use in agriculture to achieve agronomic and environmental/ecological objectives’ (e.g., Oenema and Pietrzak, 2002). The agronomic objectives relate to crop yield and quality, and animal performance in the context of animal welfare. The environmental/ecological objectives relate to nitrogen losses from agriculture. ‘Taking account of the whole nitrogen cycle’ emphasizes the need to consider all aspects of nitrogen cycling, also in ‘NH3
emissions abatement’, to circumvent ‘pollution swapping’.
2. Nitrogen is a constituent of all plant and animal proteins (and enzymes) and it is involved in photosynthesis, eutrophication, acidification, and various oxidation-reduction processes. Through these processes, nitrogen changes in form (compounds), reactivity and mobility. Main mobile forms are the gaseous forms di-nitrogen (N2), ammonia (NH3), nitrogen oxides (NO and NO2), and nitrous oxide (N2O), and the water soluble forms nitrate (NO3
-), ammonium (NH4+) and dissolved organically bound nitrogen (DON). In organic
matter, most nitrogen is in the form of amides, linked to organic carbon (R-NH2). Because of the mobility in both air and water, reactive nitrogen is also called ‘double mobile’.
3. The nitrogen cycle is strongly linked with the carbon cycle and with other nutrient cycles. Hence, managing nitrogen may affect the cycling of carbon and the net release of carbon dioxide (CO2) into the atmosphere and the sequestration of carbon in soils. Generally, a leaky system for nitrogen is also a leaky system for carbon, and vice versa. This re-iterates the importance of considering N management from a whole-farm perspective.
4. Depending on the type of farming systems, N management at farm level involves a series of management activities in an integrated way, including:
Fertilization of crops; Crop growth, harvest and residue management; Growth of catch or cover crops; Grassland management; Soil cultivation, drainage and irrigation; Animal feeding; Herd management (including welfare considerations), including animal housing Manure management, including manure storage and application; Ammonia emission abatement measures; Nitrate leaching and runoff abatement measures; Nitrous oxide emission abatement measures;
86

Denitrification abatement measures;To be able to achieve high crop and animal production with minimal N losses and other unintended environmental consequences, all activities have to be considered in an integrated and balanced way.
5. Nitrogen is essential for plant growth. In crop production, it is often the most limiting nutrient, and therefore must be available in sufficient amount and in a plant-available form in soil to achieve optimum crop yields. Excess and/or untimely N applications are the main source of N losses in the environment, including ammonia emissions to air. To avoid excess or untimely N applications is one of the best ways to minimize N losses (and other environmental impacts), while not affecting crop and animal production. Guidelines for site-specific best nutrient management practices should be adhered to, including:
Nutrient management planning and record keeping, for all essential nutrients; Calculation of the total N requirement by the crop on the basis of realistic estimates
of yield goals, N content in the crop and N uptake efficiency by the crop; Estimation of the total N supply from indigenous sources, using accredited methods:
- mineral N in the upper soil layers at planting and in-crop stages (by soil and or plant tests);
- mineralization of residues of the previous crops;- net mineralization of soil organic matter, including the residual effects of
livestock manures applied over several years and, on pastures, droppings from grazing animals;
- deposition of reactive N from the atmosphere;- biological N2 fixation by leguminous plants;
Computation of the needed N application, taking account of the N requirement of the crop and the supply by indigenous N sources;
Calculation of the amount of nutrients in livestock manure applications that will become available for crop uptake. The application rate of manure will depend on:
- the demands for nitrogen, phosphorus and potassium by the crops;- the supply of nitrogen, phosphorus and potassium by the soil, based on soil
tests;- the availability of livestock manure;- the immediately-available nitrogen, phosphorus and potassium contents in
the manure; and- the rate of release of slowly-available nutrients from the manure, including
the residual effects. Estimation of the needed fertilizer N and other nutrients, taking account of the N
requirement of the crop and the supply of N by indigenous sources and livestock manure;
Application of livestock manure and/or N fertilizer shortly before the onset of rapid crop growth, using methods and techniques that prevent ammonia emissions;
Where appropriate, application of N fertilizer in multiple portions (split dressings) with in-crop testing, where appropriate.
6. Preferred measures for reducing overall NH3 emissions are those that decrease other unwanted N emissions simultaneously, while maintaining or enhancing agricultural
87

productivity (measures with synergistic effects). Conversely, measures aimed at reducing NH3 emissions, which increase other unwanted emissions (antagonistic effects) should be modified to such extent that the antagonistic effects are minimized. Such antagonistic effect may include increased methane (CH4) emissions from ruminants. Similarly, abatement measures should avoid increasing other types of farm pollution (e.g., P losses, pathogens, soil erosion) or resource use (e.g., fuel), reducing the quality of food (e.g., increased antibiotics, hormones or pesticides) or detrimentally impacting the health and welfare of farm animals (e.g., by limiting barn size or animal densities) (Jarvis et al., 2011).
7. The effectiveness of nitrogen management can be evaluated in terms of (i) decreases of nitrogen surplus, and (ii) increases of N use efficiency. Nitrogen use efficiency (NUE) indicators provide a measure for the amount of N that is retained in crop or animal products, relative to the amount of nitrogen applied or supplied. N surplus is an indicator for the N pressure of the farm on the wider environment, also depending on the pathway through which surplus N is lost either as ammonia volatilization, N leaching and/or nitrification/ denitrification. Management has a large effect on both the nitrogen use efficiency (Tamminga 1996; Mosier et al., 2004) and N surplus.
8. While the ratio of total N output (via products exported from the farm) and total N input (imported into the farm, including via biological N2 fixation) (mass/mass ratios) is an indicator for the N use efficiency at farm level, the total N input minus the total N output (mass per unit surface area) is an indicator of the N surplus (or deficit) at farm level.
9. Commonly, a distinction is made between N input-output balances and N input-output budgets. Balances and budgets apply similar input items; the main difference is that balances record the N output in harvested/marketable products only, while budgets records the N output via harvested/marketable products and losses from the system. Hence, budgets provide a full record and account of all N flows.
10. There are various procedures for making nitrogen input-output balances, including the gross nitrogen balance, the soil-surface balance, the farm-gate balance, and the farm balance (e.g., Watson et al., 1999; Schroder et al., 2003; Oenema et al., 2003; OECD, 2008;). Basically, the gross nitrogen balance and the soil-surface balance record all N inputs to agricultural land and all N outputs in harvested crop products from agricultural land. However, the balances differ in the way they account for the N in animal manure; the gross nitrogen balance includes the total amount of N excreted as N input item, while the soil-surface balance corrects the amount of N excreted for NH3 losses from manure in housing systems and manure storage systems. The farm-gate balance and the farm balance records all N inputs and all N outputs of the farm; the farm balance includes N inputs via atmospheric deposition (both reduced and oxidized N compounds) and biological N2
fixation. Various methods can be applied at field, farm, regional and country levels; it is important to use standardized formats for making balances and to report on the methodology, so to improve comparability.
11. A farm nitrogen budget of a mixed crop-animal production farm is the most complex budget (Figure S1). The main inputs are mineral/inorganic fertiliser, imported animal
88

manure, fixation of atmospheric nitrogen (N2) by some (mainly leguminous) crops, deposition from the atmosphere, inputs from irrigation water and livestock feed. Inputs in seed and bedding used for animals are generally minor inputs, although the latter can be significant for some traditional animal husbandry systems. The main outputs are in crop and animal products, and in exported manure. Gaseous losses occur from manure in animal housing, in manure storage and after field application. Other gaseous losses occur from fields; from applied fertiliser, crops, soil and crop residues. Losses to ground and surface water occur via leaching or run off of nitrates, ammonium and dissolved organic nitrogen (DON). Run-off of undissolved organic N may also occur.
Figure S1. A farm N budget of a mixed crop-animal production farm (from Jarvis et al., 2011).
12. The corresponding components of a farm nitrogen balance of a mixed crop-animal production farm are shown in Figure S2. Evidently, a farm N balance is much simpler than a farm N budget, as N losses to air, groundwater and surface waters are not included in the N balance. A farm N balance of a specialized crop production farm or a specialized animal production farm are much simpler than a farm gate-balance of a mixed crop-animal production farm, because of less types of N inputs and outputs.
Figure S2: Components of a farm N balance of a mixed crop-animal production farm.
13. A soil surface nitrogen balance of agricultural land is shown in figure S3. The main N inputs are mineral/inorganic fertiliser, animal manure, fixation of atmospheric nitrogen
89

by some (mainly leguminous) crops and deposition from the atmosphere. Other N inputs may include bio-solids, and organic amendments like compost and mulches. Inputs in seed and composts are generally minor inputs. The main outputs are in harvested crop products, which may be the grain or the whole crop. Note that animal products other than animal manure do not show up in the soil surface balance, as they are not placed onto the soil surface.
Figure S3: Components of a soil surface nitrogen balance of agricultural land (see OECD, 2008).
14. For using N balances and N use efficiency (NUE) as indicators at farm level, a distinction has to be made between:
(a) specialized crop production farms, (b) mixed crop (feed) – animal production farms and (c) specialized animal production farms.
Specialized crop production farms have relatively few NH3 emission sources (possibly imported animal manure, urea and ammonium-based fertilizers, crops and residues). These farms can be subdivided according to crop rotation (e.g., percentage of cereals, pulses, vegetables and root crops). Specialized animal production farms produce only animal products (milk, meat, egg, animal by-products and animal manure) and all these products are exported from the farm. Energy may also be produced through digestion of organic carbon. These farms can be subdivided according to animal categories (e.g., pig, poultry, and cattle). Mixed systems have both crops and animals; the crops produced are usually fed to the animals, while the manure produced by the animals is applied to the crop land. These farms can be subdivided according animal categories (e.g., dairy cattle, beef cattle, pigs, and) and livestock density (or feed self-sufficiency).
15. The variation between farms in NUE (output/input ratios) and N surpluses (input minus output) is large in practice, due to the differences in management and farming systems (especially as regards the types of crops and animals, the livestock density and the farming system). Indicative ranges can be given for broad categories of farming systems (see Table S2).
90
Inorganic N fertilizers
Agricultural land
Animal manure
Biological N2 fixation
Atmospheric N deposition
Seeds & plants Composts
Harvested crop products
Grass and fodder products
N balance(N Surplus)
N inputs
N outputs
Inorganic N fertilizers
Agricultural land
Animal manure
Biological N2 fixation
Atmospheric N deposition
Seeds & plants Composts
Harvested crop products
Grass and fodder products
N balance(N Surplus)
N inputs
N outputs

16. Nitrogen balances and N output-input ratios can be made also for compartments within a farm, especially within a mixed farming system. For estimating NUE, three useful compartments or levels can be considered:
(a) feed N conversion into animal products (feed-NUE or animal-NUE), (b) manure and fertilizer N conversion into crops (manure/fertilizer-NUE), and (c) whole-farm NUE.
These NUEs are calculated as the percentage mass of N output per mass of N input:- feed-NUE = [(N in milk, animals and eggs) / (N in feed and fodder)] x 100%- manure/fertilizer-NUE = [N uptake by crops / N applied as manure/fertilizer] x 100%- whole-farm NUE = [Σ(N exported off-farm) / Σ(N imported on to the farm)] x 100%Indicative ranges of NUEs for dairy farms are shown below in Table S1(Powel et al., 2010).
Table S1. Indicative values for N input and NUE of dairy farms (from Powell et al., 2010)
17. For assessing the feed-NUE or animal-NUE, the amounts of feed + fodder consumed and the N contents of the feeds + fodders have to be known. Also the amounts of N in animal products (protein in milk, meat and eggs) have to be known. Default values can be used for N in milk-protein, eggs and live-weight, carcass-weight and meat for cattle, pigs, and poultry.
91

Table S2: Nitrogen surplus and nitrogen use efficiency indicators of farming systems, with typical values for specialized crop production farms, specialized animal production farms and mixed farms (see text).
Index Calculation Interpretation Typical levelsN surplus = sum of all nitrogen inputs minus the nitrogen outputs that pass the farm gate, expressed in kg/ha/yr
N surplus = Σ (InputsN) – Σ (outputsN)
N surplus depends on types of farming system, crops and animals, and indigenous N supply, external inputs (via fertilizers and animal feed) management and environment N surplus is a measure of the total N loss to the environmentN deficit [Σ (InputsN) < Σ (outputsN] is a measure of soil N depletionFor specialized animal farming systems (landless), the N surplus can be very large, depending also on the possible N output via manure processing and export
Depends on types of farming systems, crops and animals:
Crop: 0-50 kg/haMixed: 0-200 kg/haAnimal: 0-1000 kg/ha
NUE = nitrogen use efficiency, i.e., the N output in useful products divided by the total N input
NUE = Σ (outputsN) / Σ (InputsN)
N use efficiency depends on types of farming system, crops and animals, and indigenous N supply, external inputs (via fertilizers and animal feed) management and environmentFor specialized animal farming systems (landless), there may be N output via manure processing and export
Depends on types of farming systems, crops and animals:
Crop 0.6-1.0Mixed: 0.5-0.6Animal 0.2-0.6*
Animal 0.8-0.95**
*) no manure export**) landless farms; all manure exported off-farm
18. For assessing the manure/fertilizer-NUE, it is useful to make a distinction between different N input sources. The ‘fertilizer N equivalence value’ indicates how well N from animal manures, composts and crop residues are used relative to the reference fertilizer (commonly NH4NO3 based fertilizers), which is set 1 (100%). A high value is indicative for a high N use efficiency. The fertilizer N equivalence value depends on the type (solid, slurry or liquid), origin (cattle, pigs, poultry) of manure and the time frame (year of application versus long-term effects). It also depends on crop type and environmental conditions (soil type, temperature, rainfall). A most decisive factor for a high fertilizer N equivalence value is management, i.e. the time and method of application. Table 3 gives ranges of N fertilizer equivalence values for cattle, pig and poultry manure, slurries and liquid manures, as found in literature. Organic N sources usually contain a significant fraction organically-bound N, which becomes available to growing crops only after mineralization. Therefore, a distinction is made between short-term (i.e. during the growing season immediately after application of the organic N source) and long-term fertilizer N equivalence values; the latter being higher than the former. Some organic N sources have only mineral N and easily mineralizable organic N, and as a consequence there is essentially no difference between short-term and long-term values.
92

Table S3: Ranges of short-term and long-term fertilizer nitrogen equivalence values (FNEV) of applied animal manures and crop residues, expressed in percentage of the reference fertilizer ammonium-nitrate. The manures are applied with common low-emission application techniques. The short-term fertilizer nitrogen equivalence values relate to the fertilizer nitrogen equivalence value of timely applications during the year of application. The long-term fertilizer nitrogen equivalence values include residual effects and assume repeated annual applications.Nitrogen sources Fertilizer nitrogen equivalence values, %
Short-term Long-termSeparated cattle and pig liquid manures 70-100 70-100Digested cattle and pig slurries 40-60 50-80Cattle slurries 30-50 50-80Pig slurries 30-65 50-80Poultry slurries 30-65 50-80Solid cattle, pig and poultry manures 20-40 40-60Composts of cattle, pig and poultry manures 20-40 40-60Urine and dung from grazing animals 10-20 20-40Crop residues with more than 2.5% N 10-40 30-50Crop residues with 1.5 – 2.5% N 0-30 20-40Crop residues with less than 1.5% N 0 0-20References: Berntsen et al., 2007; Bittman et al., 2007; Burton and Turner, 2003; Chadwick et al., 2000; Gutser et al., 2005; Hadas et al., 2002; Hart et al., 1993; Hatch et al., 2004; Janssen, 1984; Jenkinson and Smith, 1988; Kolenbrander and De La Lande Cremer, 1967; Langmeier et al., 2002; MacDonald et al., 1997; Mosier et al., 2004; Nevens and Reheul, 2005; Rufino et al., 2006; Rufino et al., 2007; Schils and Kok, 2003; Schroder et al., 2000; Schroder and Stevens, 2004; Schroder 2005; Schroder et al., 2005; Schroder et al., 2007; Sommerfeldt et al., 1988; Sorensen, 2004; Sorensen and Amato, 2002; Sorensen et al., 2003; Sorensen and Thomsen, 2005; Van der Meer et al., 1987; Velthof et al., 1998;
19. For whole-farms, the N surplus and NUE of specialized crop production farms are estimated as follows: SurplusN = [FertN + ManureN + CompostN + BNF + Atm.N + SeedN] – [CropN] [1]
NUEcrop = [CropN] / [FertN + ManureN + CompostN + BNF + Atm.N + SeedN] [2]
Where,SurplusN = N Surplus at farm level, kg/haNUEcrop = N use efficiency at farm level, mass/mass ratio (dimensionless)FertN = Amount of fertilizer N fertilizer imported to the farm, kg/haManureN = Amount of manure N imported to the farm, kg/haCompostN = Amount of compost N imported to the farm, kg/haBNF= Amount of biologically fixed N2 by leguminous crops, kg/haAtm.N = Amount of N from atmospheric deposition, kg/ha.SeedN = Amount of N imported via seed and plants, kg/ha.CropN = Net amount of N in harvested crop exported from the farm, including residues, kg/ha
There may be additional N inputs at the farm via for example autotrophic N2 fixation, crop protection means, irrigation water, biosolids, mulches. These inputs are usually small relative to the former and are also difficult to manage. Therefore, these additional N inputs are often disregarded. However, when these inputs are a significant percentage of the total
93

input (>10%), they should be included in the balance calculations. This may hold for farms on organic soils where the net mineralization of organically bound N may release 20-200 kg of N per ha per year, depending on the trophic status of the peat and drainage conditions.
20. A more accurate expression of the N use efficiency and N surplus of specialized crop production farms takes into account the differences in fertilizer N equivalence values of manure, composts and BNF, and is estimated as follows: NUEcrop = [CropN] / [FertN+(ManureN x FnevM)+(CompostN x FnevC)+(BNF)+Atm.N+ SeedN] [7]
Where,FnevM = fertilizer N equivalence value for manure, kg/kgFnevC = fertilizer N equivalence value for compost, kg/kg
21. For specialized landless animal production farms, the N surplus and NUE are estimated as follows: SurplusN = [FeedN] – [AnimalN + ManureN] [3]
NUEanimal = [AnimalN + ManureN] / [FeedN] [4]
Where,SurplusN = N Surplus at farm level, kgNUEanimal = N use efficiency at farm level, mass/mass ratio (dimensionless)FeedN = Net amount of N in animal feed imported to the farm, kgAnimalN = Net amount of N in animals exported from the farm (i.e., including dead animals and
corrected for imported animals), kgManureN = Net amount of manure N exported from the farm (including feed residues), kg
There will be small additional N inputs at the farm via for example drinking and cleaning water, litter (bedding material) and medicines but these inputs are usually small (<5%) relative to the former and may be disregarded in this case.
22. For mixed crop – animal production farms, the N surplus and NUE are estimated as follows: SurplusN = [FertN+ FeedN + ManureNi +CompostN+BNF+Atm.N+SeedN]–[AnimalN + CropN +
ManureNe] [5]
NUEmixed=[AnimalN+CropN+ManureNe]/[FertN+ FeedN + ManureNi+CompostN+BNF+Atm.N+SeedN] [6]
Where,SurplusN = N Surplus at farm level, kg/haFertN = Amount of fertilizer N fertilizer imported to the farm, kg/haFeedN = Amount of N in animal feed imported to the farm, kg/haManureNi = Amount of manure N imported to the farm, kg/haCompostN = Amount of compost N imported to the farm, kg/haBNF= Amount of biologically fixed N2 by leguminous crops, kg/haAtm.N = Amount of N from atmospheric deposition, kg/ha.SeedN = Amount of N imported via seed and plants, kg/ha.CropN = Amount of N in harvested crop exported from the farm, including residues, kg/ha
94

AnimalN = Amount of N in animals exported from the farm (i.e., including dead animals and corrected for imported animals), kg
ManureNe = Amount of manure N exported from the farm, kg/ha
23. Improvements in N management (and hence decreases in N losses) over time follow from decreases in N surpluses and increases in N use efficiencies over time. Progress in N management can thus be assessed through the monitoring of the annual N surplus and N use efficiency at farm level. To account for annual variations in weather conditions and incidental occasions, it is recommended to calculate five-year averages of N surplus and NUE.
24. The relative performance of the N management of farms can be assessed on the basis of comparisons with other farms, model farms or experimental farms. Target values for N surpluses and NUE of specialized crop production systems can be based on the performance of best managed (experimental/model) crop production systems in practice taking soil factors into account.
25. Crops differ in their ability to take up N from soil, due to differences in root length distribution and length of the growing season. Graminae (cereals and grassland) have a high uptake capacity; leafy vegetable (lettuce, spinach) a small uptake capacity. Indicative target values for N surplus and NUE should be specified according to the areal fraction of cereals and grassland on the farm (e.g. in case of five classes: <25%; 25-50, 50 – 75, 75 - 90 and >90%) (Table S4).
26. For specialized crop production farms growing cereals on > 90% of the area, and using the input items of equation [7] and Fertilizer N equivalence values (FNEV) of Table 3, the harvested N roughly equals the total effective N input and NUEcrop may be up to 100%. However, NUEcrop decreases with increasing N input, impact of pests, or limitation of other nutrients; the challenge is to find the optimum N fertilization level where both crop yield, crop quality and NUE are high and N surplus is low. With decreasing relative area of cereals in the crop rotation, target NUE will decrease and N surpluses will increase, depending also on the effective N input (Table S4). The N surplus and NUE also depend on the fate of the crop residue; harvesting and withdrawal of the crop residues increases NUE and decreases N surplus, especially at short term. However, removing crop residues may contribute ultimately to decreasing stocks of soil organic matter and nitrogen. Note that NUE and N surplus are inversely related (Table S4). However, this is not always the case; there are possible situations where increasing NUE is associated with slightly increasing N surplus.
95

Table S4: Indicative values for N use efficiency (NUE) and N surpluses of specialized crop production farms at moderate and high N inputs, and as function of the percentage of cereals in the crop rotation (see text). Cereals, % Moderate N inputs High N inputs N surpluses, in kg/ha/yr N surpluses, in kg/ha/yr NUE,
%50 kg/ha/yr 100 kg/ha/yr NUE, % 150 kg/ha/yr 200 kg/ha/yr
90 – 100 100 0 0 80 30 4075 – 90 95 2.5 5 75 37.5 5050 – 75 90 5 10 70 45 6025 – 50 80 10 20 60 60 80
<25 70 15 30 50 75 100
27. The NUE of specialized animal farms and mixed farms depend in part on the ‘unavoidable’ gaseous N losses from animal manures in housing systems and manure storages due to NH3 volatilization and nitrification-denitrification processes. Unavoidable N losses are N losses that occur when using best available techniques (BAT). Target values for NUEanimal should be based on the following equation:
TargetNUEanimal = [AnimalN + (ExcretedN – ManureNloss)] / [FeedN] [8]
Where,TargetNUEanimal = N use efficiency at farm level, mass/mass ratio (dimensionless)AnimalN = Net amount of N in animals exported from the farm (i.e., including dead animals
and corrected for imported animals), kgFeedN = Net amount of N in animal feed imported to the farm, kgExcretedN= Amount of N excreted by animals during confinement, kg ManureNloss= Unavoidable N losses from animal manure in animals housings and manure
storages due to NH3 volatilization and nitrification-denitrification processes, kg.ExcretedN – ManureNloss = amount of manure N exported from the farm
28. ManureNloss values depend on the animal housing system, manure management systems and farm practices. For cattle and pigs housed whole-year in slurry-based systems with covered manure storages, ManureNloss will be in the range of 5-20% of manure N excreted during confinement, with the lower value for low-emission housing systems (and tie stalls) and the higher value for houses with partially slatted floors, but depending also on climatic conditions (Amon et al., 2001; Monteny and Erisman, 1998; Oenema et al., 2008). When animals are confined only during the winter season, less N will be excreted during confinement and ManureNloss per animal head will be lower. ManureNloss from housing systems with solid manure tend to be higher (20-40% when housed all-year), due to larger nitrification-denitrification losses during manure storage.
29. For poultry, ManureNloss is in the range of 10 to 50% of ExcretedN with the lower value for low-emission housing systems and the higher value for deep pits and ground-
96

based litter systems without scrubbing and retaining NH3 from exhaust air (Groot Koerkamp and Groenestein, 2008).
30. NUE of specialized animal production farms increases with increasing feed N retention and decreasing ‘unavoidable gaseous N losses’ (Table S5; Figure S4). Feed N retention depends on animal type, animal productivity and animal feeding. The ‘unavoidable gaseous N losses’ depend on housing system and animal manure management, including low-emission management systems. Hence, NUE of specialized animal production farms is very responsive to gaseous N losses, including NH3 volatilization losses; it is an integrated N management indicator.
Table S5: Calculated N use efficiency of specialized animal production farms as function of the feed N retention percentage and the percentage ‘unavoidable N losses’ during housing and storage of animal manure (according to equation [8]). It is assumed that all animal products, including animal manure, are exported from the farm (see text).
Feed N retention, %
N use efficiency, in %‘unavoidable N losses’ as % of N excreted
5 10 20 40 605 95 91 81 62 4310 96 91 82 64 4620 96 92 84 68 5230 97 93 86 72 5840 97 94 88 76 64
0102030405060708090
100
0 10 20 30 40 50 60 70
Gaseous N losses, %
N us
e ef
ficie
ncy,
%
5
10
20
30
40
Feed N retention, %
Figure S4: Calculated N use efficiency of specialized animal production farms as function of the feed N retention percentage and the percentage ‘unavoidable N losses’ during storage of animal manure; according to equation [8]. It is assumed that all animal products, including animal manure, are exported from the farm (see text)
31. Whole farm N balance and N use efficiency are indicators for estimating the pressure of N on the environment and the N resource use efficiency, respectively. Some countries (e.g., Denmark and The Netherlands) use and have used N balances and N surplus as an
97

integrative regulatory instruments for decreasing N losses to the environment. However, there is as yet no experience with using Nsurplus and NUE as specific indicators for abating NH3 emissions. However, there is solid theoretical and also empirical evidence that increases in NUE are associated with decreases in N losses per unit of produce. Similarly, increases in NUE of animal production systems and mixed production systems are typically associated with decreases in NH3 losses per unit of produce, as shown for example in Denmark (Mikkelsen et al., 2010; Nørregaard Hansen et al., 2008; Anonymous, 2008).
32. Experiences in Denmark and the Netherlands show that most farmers are able to understand the N balance and NUE indicators easily and are also able to establish N balances and NUE indicators on the basis of bookkeeping records and default values for N contents in various products. However, training and participation in farmers-discussion groups is helpful. Alternatively, N balances and NUE can be made by accountants, again on the basis of bookkeeping records and default values for N contents in various products. The annual costs for establishing N balances and NUE indicators is in the range of 200 - 500 euro per farm.
33. Roughly, three strategies / technologies can be distinguished to increase NUE and decrease N surplus: (i) increase N outputs through increasing crop and animal yields, while keeping N inputs more or less constant, (ii) decrease inputs via N fertilizers and purchased animal feed, while keeping crop and animal yields and N outputs more or less constant, and (iii) decrease N losses through N saving technologies (low emissions techniques, cover crops, better timing of N application, etc.) and thereby save on N inputs, while maintaining N outputs more or less constant. The last mentioned strategy relates in part to the other measures of Annex IX of the Gothenburg Protocol; the emphasis is here on cashing in the N saved through re-utilizing this N and through reducing N input concomitantly. The best results will occur when decreased losses will be associated with decreased inputs which, will reduce operating costs and increased outputs necessary for profitability. Hence, the approach to decrease N surplus and increase NUE is farm-specific; there is no uniform approach applicable to all farming systems.
34. There is an abundant amount of information available for increasing NUE and decreasing N surplus in crop production systems. Various institutions and fertilizer production companies provide clear guidelines. The International Plant Nutrition Institute IPNI provides easy-to-understand and easy accessible guidelines and videos on the website (http://www.ipni.net/4r) for using mineral fertilizers effectively and efficiently. The best management practices (BMPs) for fertilizer is known as the ‘4R nutrient stewardship concept’, i.e., the Right Source, Right Rate, Right Time, and the Right Place. It can be applied to managing either crop nutrients in general (including organic sources) or fertilizers in specific. This concept can help farmers and the public understand how the right management practices for fertilizer contributes to sustainability goals for agriculture. In a nutshell, the 4R nutrient stewardship concept involves crop producers and their advisers selecting the right source-rate-time-place combination from practices validated by research conducted by agronomic scientists. Goals for economic, environmental and social
98

progress are set by—and are reflected in performance indicators chosen by—the stakeholders to crop production systems. These are all considered category 1 techniques. Inability to predict weather remains the main impediment to improving crop NUE; other factors include crop pests, poor soils, etc.
35. Increasing NUE and decreasing N surplus in mixed crop – animal production systems requires the measures and activities needed for the crop production component (e.g. the 4R concept indicated above in 53), as well as the measures and activities needed in the animal production component (animal feeding, housing and management), and the measures and activities related to manure storage and management. The measures and activities in the animal production components and manure storage and management are discussed further in the following chapters.
36. There is not much empirical information about the economic cost of increasing NUE and decreasing N surplus direct economic costs. Estimating the direct economic cost is also not easy; it requires proper definitions about the activities that are included in ‘nitrogen management, taking account of the whole nitrogen cycle’. Also, a distinction should be made between direct costs and indirect cost. Direct costs relate to the activities needed to increase NUE and decrease N surplus, e.g., selection of high-yielding crop and animal varieties, improved tuning of N supply to N demand. These costs are estimated to range between -1 to +1 euro per kg N saved. Indirect cost relate to better education of farmers, increased data and information availability through sampling and analysis, and through keeping records. The indirect cost are higher than the direct costs, though part of these costs will be returned in terms of higher yields and quality.
99

Appendix 2. Supplementary Information
Guidance Document for Preventing and Abating Ammonia Emissions from Agricultural Sources of the Gothenburg Protocol:
C. Livestock feeding strategies
General considerations
1. Gaseous nitrogen losses from livestock production originate from the feces (dung) and urine excreted by the livestock. The animal feed composition and the feed management has a strong influence on animal performance and on the composition of the dung and urine, and thereby also on the emissions of ammonia (NH3). This section focuses on feeding strategies to reduce NH3 emissions.
2. Reference techniques. The abatement strategies described in this chapter are not defined and assessed against a uniform “reference” (or unabated or baseline) feeding strategy, because these “reference” feeding strategies are different for different UNECE Countries.
3. Animals require energy, protein, water, various nutrients including trace elements, and vitamins for their nutrition. The value of animal feed is usually defined by the quantity of energy and protein that can be metabolized by the animal after digestion of the feed in the gastrointestinal tract. The protein value of a diet is estimated by the fraction of protein that is absorbed from the gastrointestinal tract. For pig and poultry diets, the protein value is also defined by the quantity of individual amino acids absorbed in order to identify those amino acids that are most limiting protein deposition in animal products.
4. In practice, protein levels in animal feed are often higher than actually required. Safety margins in the protein content of the diet are used to account for: 1) suboptimal amino acid ratios; 2) variations in requirement between animals with different genotypes; 3) variations in requirement caused by differences in age or production stadiums; and 4) variations in the actual content and digestibility of essential amino acids in the diet. Protein content of the diet and the resulting N excretion can be reduced by matching the protein / amino acids content of the diet as close as possible to the animal’s requirement.
5. The fraction of feed intake not digested, absorbed and retained by the animal is excreted via dung and urine. The excess N in the feed is excreted in the form of protein (organically bound nitrogen), urea, uric acid and ammonium. The partitioning of N over these compounds together with the pH of the dung and urine affects the potential for NH3 loss.
6. There is large variation in the composition of dung and urine from dairy cattle, finishing pigs and chicken, due to variations in animal feeding. Table S6 provides ranges of values
100

observed in literature (Canh et al., 1998a; 1998b; Bussink and Oenema, 1998; Whitehead, 2000).
Table S6: Ranges of N components in dung and urine of some animal species.Animal Category
Dry matter g per kg
Total Ng per kg
dung/urine
Urea-N% of
total N
Uric acid –N, % of total N
Protein-N, % of total N
Ammonium-N, % of total
NDairy cattle- Dung 100-175 10-17 0 0 90-95 1-4- Urine 30-40 4-10 60-95 0-2 0 1
Finishing pigs- Dung 200-340 8-10 0 86-92 8-14- Urine 30-36 4-7 70-90 10-20 2-10
Chicken 200-300 10-20 5-8 35-50 30-50 6-8
7. Since the losses of NH3 are linked to the ammonium, urea and uric acid contents of the urine and dung, the main options to influence the NH3 emissions potential by livestock feeding are by (Figure S5; Aarnink and Verstegen, 2007):
(a) Lowering the ammonium, urea and uric acid contents of the urine and dung, through:
(i) Lowering the crude protein intake;(ii) Increasing the non-starch polysaccharides intake (which shifts the nitro-
gen excretion from urea/uric acid in urine to protein in dung);(b) Lowering pH of manure by:
(i) lowering the pH of dung;(ii) lowering the pH of urine.
(c) Lowering the urease activity, and hence the ammonium concentrations in ma-nure.
8. The ammonium content of manure (dung + urine), following the hydrolysis of urea and the anaerobic digestion of protein in manure, can be calculated as follows (Aarnink et al., 1992):[NH4
+] = (dc*Pf - Pr + adc*(1-dc)*Pf) / (Mm)
Where: dc = apparent digestibility coefficient of proteinPf = protein in feedPr = protein retentionadc = anaerobic digestion coefficient for protein in manureMm = mass of manure
101

•P=Protein
•C/A=cations/anions (Na,K,Ca,Mg,Cl,S,P)
•NSP=Non starch polysaccharides
P, C/A, NSP, H2O
P, C/A
Urea, C/A, H2O
NH4+, pH
urine
P, CA, VFA, H2O
pH dung
NH4+, pH
manure
NSP
VFA
UreaP
urea
•P=Protein
•C/A=cations/anions (Na,K,Ca,Mg,Cl,S,P)
•NSP=Non starch polysaccharides
P, C/A, NSP, H2O
P, C/A
Urea, C/A, H2O
NH4+, pH
urine
P, CA, VFA, H2O
pH dung
NH4+, pH
manure
NSP
VFA
UreaP
NSP
VFA
UreaP
urea
Figure S5: Schematic view of the main factors of the animal ration (protein content, cation-to-anion ratio and the content of non-starch polysaccharides) influencing the urea and ammonium contents and pH of the urine and dung excreted by animals.
9. The pH of urine and manure can be estimated by making a complete cation-to-anion balance. In this estimation also the concentration of ammonium and carbonate has to be included.
10. Livestock feeding strategies can influence the pH of dung and urine. The pH of dung can be lowered by increasing the fermentation in the large intestine. This increases the volatile fatty acids (VFA) content of the dung and causes a lower pH. The pH of urine can be lowered by lowering the electrolyte balance (Na + K – Cl) of the diet (Patience et al., 1987). Furthermore, the pH of urine can be lowered by adding acidifying components to the diet, e.g. CaSO4, Ca-benzoate, benzoic acid. A low pH of the dung and urine excreted results also in a low pH of the slurry / manure during storage, also after a certain storage period. This pH effect can significantly reduce ammonia emissions from slurries during storage and also following application. These effects have been proven especially for pigs (Aarnink and Verstegen, 2007; Canh et al., 1998a; Canh et al., 1998c; Canh et al., 1998d; Canh et al., 1998e).
11. Depending on enzyme activity, urea and uric acid are hydrolyzed into ammonium usually within a few hours to days. The mineralization of organic nitrogen (apparent undigested protein) in dung is a slow process. At a temperature of 18 oC it takes 70 days before 43% of the organic nitrogen in pig manure is mineralized to ammonia (Spoelstra, 1979). Therefore, by shifting N excretion in cattle and pigs from urine to dung, the N excretion via protein (organically bound nitrogen) is increased and the N excretion via urea, uric acid and ammonium is decreased. As a result, NH3 emissions from the urine are reduced (while NH3 emissions from dung are not increased).
12. Two indicators are key to indicate the efficiency of conversion of feed into animal product. They are defined as follows:
102

(a) The requirement of crude protein (CP; often estimated as the N content multiplied by 6.25) as proportion of the dietary dry matter (DM). It depends on animal species, type of production, digestibility of the diet DM and the quality (amino acid ratio) in the CP. Information on this indicator for concentrate feeds is usually available from the feed company. For forages, notably grazed forages, this may be more difficult, but the sward surface height (SSH) may be a helpful tool; the higher SSH, the lower the protein content. However, with an increase of SSH, the digestibility of the herbage may decrease.
(b) Efficiency of N utilisation (NUE = AYN /FN), where AYN is the mass of N in animal products (in kg), FN is the mass of N in the feed used (kg). This indicator requires information on the N content of animal products and animal feeds. Such figures have been extensively tabulated in recent years.
13. Production of animal products (milk, meat, eggs) is not possible without first meeting the nutrient requirements to maintain the animals. Dietary protein levels required for maintenance are much lower than those needed for the synthesis of animal products. Hence, optimal levels of CP/DM vary with the proportion of ingested nutrients that is required for maintenance. This proportion is highest in slow growing animals, like replacement animals in cattle and lowest in rapidly growing animals like broilers.
Feeding strategies for ruminants (especially dairy and beef cattle)
14. Ultimately, the nitrogen use efficiency (NUE) in whole dairy production systems is limited by the biological potential of cows to transform feed N into milk and of crops and pasture to convert applied manure N and fertilizer N into grain, forage and other agronomic products. However, the disparity between actual NUE achieved by producers and the theoretical NUE indicates that substantial improvements in NUE can be made on many commercial dairy farms (e.g., Van Vuuren and Meijs, 1987). Although dairy producers can do little about the biological limitations of N use, practices such as appropriate stocking rates, manure N crediting and following recommendations to avoid wastage can substantially enhance NUE, farm profits and the environmental outcomes of dairy production. (Powell et al., 2009)
15. Lowering crude protein of ruminant diets is an effective and category 1 strategy for decreasing NH3 loss. The following guidelines hold (Table S7):
The average CP content of diets for dairy cattle should not exceed 150 – 160 g/kg DM (Broderick, 2003; Svenson, 2003). For beef cattle older than 6 months this could be further reduced to 120 g/kg DM.
Phase feeding can be applied in such a way that the CP content of dairy diets is gradually decreased from 160 g/kg DM just before parturition and in early lactation to below 140 g/kg DM in late lactation and the main part of the dry period.
103

Phase feeding can also be applied in beef cattle in such a way that the CP content of the diets is gradually decreased from 160 g/kg DM to 120 g/kg DM over time.
Table S7: Indicative target levels for crude protein (CP) content, in gram per kg of the dry mass of the ration, and resulting efficiency of N utilisation (NUE), in mass fractions (kg/kg) for cattle (see text)
Cattle species CP, g/kg NUE, kg/kgMilk + maintenance, early lactation 150-160 0.30Milk + maintenance, late lactation 120-140 0.25Replacement 130-150 0.10Veal 170-190 0.45Cattle <3 months 150-160 0.30Cattle 3-18 months 130-150 0.15Cattle >18 months 120 0.05
16. In many parts of the world, cattle production is land-based or partly land-based. In such systems protein rich grass and grass products form a significant proportion of the diet, and the target values for crude protein noted in Table S7 may be difficult to achieve, given the high CP content of grass from managed grasslands. The CP content of fresh grass in the grazing stage (2000-2500 kg DM per ha) is often in the range of 180 to 200 g/kg, the CP content of grass silage often between 160 and 180 g/kg and the CP content of hay between 120 and 150 kg/kg (e.g., Whitehead, 2000). In contrast, the CP content of silage maize is only about 70 to 80 g/kg. Hence, grass-based diets often contain a surplus of protein and the magnitude of the resulting high N excretion strongly depends on the proportions of grass, grass silage and hay in the ration and the protein content of these feeds. The protein surplus and the resulting N excretion and NH3 losses will be highest for grass-only summer rations with grazing young, intensively fertilized grass or grass legume mixtures. However, urine excreted by grazing animals typically infiltrates into the soil before substantial NH3
emissions can occur and overall NH3 emissions per animal are therefore less for grazing animals than for those housed where the excreta is collected, stored and applied to land.
17. The NH3 emission reduction achieved by increasing the proportion of the year the cattle spent grazing outdoors will depend on the baseline (emission of ungrazed animals), the time the animals are grazed, and the N fertilizer level of the pasture. The potential to increase grazing is often limited by soil type, topography, farm size and structure (distances), climatic conditions, etc. It should be noted that grazing of animals may increase other forms of N emissions (e.g. N2O, NO3). However, given the clear and well quantified effect on NH3 emissions, increasing the period that animals are grazing can be considered as a category 1 strategy to reduce emissions. The actual abatement potential will depend on the base situation of each animal sector in each country. The effect of changing the period of partial housing (e.g. grazed during daytime only) is less certain and is rated as a category 2 strategy. Changing from a fully housed period to grazing for part of the day is less effective in reducing NH3 emissions than switching to complete (24 hour) grazing, since buildings and stores remain dirty and continue to emit NH3. Grazing management (strip grazing, rotational grazing, continuous grazing) is expected to have little additional effect on NH3 losses and is considered a category 3 strategy.
104

18. In general, increasing the energy/protein ratio in the diet by using ‘older’ grass (higher sward surface height, SSH) and/or supplementing grass by high energy feeds (e.g., silage maize) is category 1 strategy. However, for grassland-based ruminant production systems, the feasibility of these strategies may be limited, as older grass may reduce feeding quality, especially when conditions for growing high energy feeds are poor, and therefore have to be purchased. Hence, full use of the grass production would no longer be guaranteed (under conditions of limited production, e.g. milk quotas or restrictions to the animal density). Hence, improving the energy/protein equilibrium on grassland-based farms with no possibilities of growing high energy feeds is therefore considered a category 2 strategy.
19. The use of modern protein evaluation systems (e.g., PDI in France, MP in the UK, DVE/OEB in The Netherlands, AAT/PBV in Scandinavian countries) is recommended (e.g. Van Duinkerken et al., 2011). In dairy cattle, the use of rumen protected limiting amino acids, like lysine and methionine may be helpful to better balance the amino acid composition of protein digested from the small intestine. Because for a successful introduction of this method detailed additional information on the behaviour of the feed in the digestive tract is required, this is considered a category 2 strategy.
20. Shifting N excretion from urea in urine to protein in dung is also an effective measure for decreasing ammonia loss. Dietary composition should be such that a certain degree of hindgut fermentation is stimulated, without disturbing rumen fermentation. This will shift the excretion of N from urine to dung. Hind-gut fermentation can be stimulated by the inclusion of rumen resistant starch or fermentable fibre that escapes fermentation in the rumen (Van Vuuren et al., 1993). Because in the hindgut acetogenic rather than methanogenic bacteria are present, there is little risk of elevated CH4 losses. Knowledge on factors responsible for shifting N excretion from urea in urine to protein in dung are still insufficient and this approach is considered a category 3 strategy.
21. The pH of freshly excreted urine ranges from 5.5-8.5 and mainly depends on the electrolyte content of the diet. Although the pH will eventually rise towards alkaline values due to the hydrolysis of urea irrespective of initial pH, the initial pH and the pH buffering capacity of urine determine the rate of NH3 volatilization from urine immediately following urination. Lowering the pH of urine of ruminants is theoretical possible. However, there are interactions with urine volume, ruminant performance, and animal welfare and it is therefore considered a category 3 technique. Similarly, lowering the pH of dung is theoretically possible, but this might easily coincide with disturbed rumen fermentation and is therefore not recommended. Because of the possible side effects involved this is considered a category 3 technique. Dung consistency could be used to monitor the adequacy of rumen fermentation.
22. Monitoring the protein status is possible with the (calculated) rumen degradable protein balance (e.g. PBV in Scandinavian countries, OEB in The Netherlands) and/or milk urea nitrogen (MUN) can be used too (e.g. Van Duinkerken et al., 2011b). MUN should
105

preferably not exceed 10 mg/dl (milk urea below 22 mg/dl). Knowledge on factors responsible for variation in MUN is still insufficient and this approach is considered a category 2 strategy.
23. There are also herd management options to reduce NH3 emissions. Firstly, by increasing the genetic potential of the cows (more milk per cow). This will lead to a higher NUE at herd level because of the lower share of maintenance energy. By equal total annual milk output per country the number of dairy cows and replacement cattle will consequently decrease. Secondly, by increasing the number of lactations per cow. This will reduce the number of replacement cattle. Finally, the actual number of replacement cattle per dairy cow should be optimized. All three options are a long term approach, but nevertheless represent category 1 techniques where to reduce overall ammonia emissions. Also, these strategies may have positive animal welfare implications, and likely contribute to a decrease in methane (CH4) emissions from enteric fermentation as well, especially when expressed in terms of emissions per unit of milk produced (Tamminga, 1996; Kreab et al., 2001; Powel et al., 2009).
24. Rotational corralling of ruminants on crop land may reduce NH3 emissions and increase N recovery from animal manure compared to the conventional practice of barn manure collection and land application of manure (Powell and Russelle, 2009). Overall results demonstrated that corralling dairy cattle on cropland improves urine N capture, reduces ammonia loss and enhances manure N recycling through crops. This is considered as a category 2 strategy.
25. Various feed strategies are able to reduce urinary N excretion from housed dairy cattle. A close matching of diets to animal nutritional requirements, feeding only enough protein to meet cows’ metabolizable protein requirements, reducing particle size to increase ruminal digestion of grain starch and increase microbial protein formation (so long as ruminal pH is not depressed) optimizes microbial protein synthesis, maximizes feed N conversion into milk and minimizes urinary N excretion. These are considered as category 2 strategies.
Feeding strategies for pigs
26. Feeding measures in pig production include phase feeding, formulating diets based on digestible/available nutrients, using low-protein amino acid-supplemented diets, and feed additives/supplements. These are all considered category 1 techniques. Further techniques are currently being investigated (e.g. different feeds for males (boars and castrated males) and females) and might be additionally available in the future.
27. Phase feeding (different feed composition for different age or production groups) offers a cost-effective means of reducing N excretion from pigs and could be implemented in the short term. Multi-phase feeding depends on computer-aided automated equipment.
106

28. The crude protein content of the pig ration can be reduced if the amino acid supply is optimised through the addition of synthetic amino acids (e.g. lysine, methionine, threonine, tryptophan) or special feed components, using the best available information on “ ideal protein’ combined with dietary supplementation.
29. A crude protein reduction of 2 to 3 per cent (20 to 30 g/kg of feed) can be achieved depending on pig production category and the current starting point. The resulting range of dietary crude protein contents is reported in Table S8. The values in the table are indicative target levels and may need to be adapted to local conditions.
Table S8: Indicative target crude protein levels in feed for pig rations (Adopted from IPPC-BREF-2003 document)Species Phases Crude protein content, % *)Weaner < 10 kg 19–21Piglet < 25 kg 17–19Fattening pig 25–50 kg 15–17
50–110 kg 14–15>110 kg 12-13
Sows Gestation 13–15Lactation 15–17
*) With adequately balanced and optimal amino acid supply
30. For every 10 g/kg reduction in crude protein content of the diet a 10% lower TAN (total ammonia nitrogen) content of the pig slurry and 10% lower NH3 emissions can be achieved in growing finishing pigs (Canh et al., (1998b). Currently, the most common crude protein content of the diet of growing-finishing pigs is approximately 170 g/kg. In experiments, it has been demonstrated that decreases to 120 g protein per kg diet can be achieved without any effect on growth rate or feed efficiency when limiting amino acids are added (= 50% NH3 emission reduction). In practice, 140 g protein per kg diet is economically feasible (= 30% NH3 emission reduction, relative to the baseline value with a protein content of 170 g/kg). This can be achieved by phase feeding and adding the most limiting amino acids (Canh et al., 1998b; Dourmad et al., 1993; Lenis and Schutte, 1990). Economically feasible means that the cost of lowering the protein content till 140 g/kg (plus the supplementation with synthetic amino acids) more or less balance the benefits of improved animal performance. Although still some work needs to be done for the practical implementation, this is considered a category 1 technique for growing-finishing pigs. For sows and weaned piglets additional studies are needed, so for these categories it is considered a category 2 technique.
31. The addition of special components with high non-starch polysaccharide (NSP) content (e.g. sugar beet pulp, soybean hulls) can reduce the pH of pig excreta and thus NH3
emissions. Increasing the amount of non-starch polysaccharides (NSP) in the diet increases the bacterial fermentation in the large intestine, which results in the immobilization of urea-N from the blood into bacterial protein. Ammonia emissions decrease by approximately 16 and 25% when NSP content of the diet increases from 200 to 300 and further to 400 g/kg diet, respectively. However, the effect on NH3 emissions depends to a certain extent also on
107

the kind of NSP in the diet. Increasing the level of NSP in the diet may also have negative impacts. At high NSP levels, nutrient digestibility decreases and this increases waste production, which is undesirable in animal dense areas. Furthermore, at increasing NSP levels in the diet volatile fatty acids (VFA) concentrations in the manure increases. Although VFA’s are not the most important odorous compounds, increased VFA levels may increase odour release from the manure. At increasing NSP levels in the diet methane production from animal and manure may also increase (Kirchgessner et al., 1991; Jarret et al., 2011). Because of all these reasons increasing the amount of NSP in the diet as means to decrease NH3 emissions is considered a category 3 strategy in animal dense areas and a category 2 strategy in other areas. Including too much NSP in pig diets can have a negative effect on pig performance and reduce feed conversion efficiency.
32. Replacing CaCO3 in the animal feed by CaSO4, CaCl2, or Ca-benzoate reduces the pH of urine and slurry and the NH3 emission from the urine and slurry. By replacing calcium (6 g/kg) in the diet in the form of CaCO3 by Ca-benzoate, urinary and slurry pH can be lowered by more than 2 units. In that case NH3 emission can be reduced up to 60%. Benzoic acid is degraded in the pig to hippuric acid, that lowers the urine pH and consequently the pH of the slurry stored in the pig house. Benzoic acid is officially allowed in the EU as acidity controlling agent (E210), and is also admitted as feeding additive for fattening pigs (1% dosage) and piglets (0.5% dosage) (registered trade mark: Vevovitall). Addition of 1% benzoic acid to the diet of growing-finishing pigs lowers NH3 emissions by approximately 20% (Aarnink et al., 2008; Guingand et al., 2005). A similar replacement of CaCO3 by Ca-sulphate or Ca-chloride reduces the pH of slurry by 1.2 units and NH3
emission by approximately 35% (Canh et al., 1998a; Mroz et al., 1996). Addition of benzoic acid is considered a category 1 technique for growing-finishing pigs and a category 2 technique for other pig categories. Replacement of CaCO3 by CaSO4, CaCl2, or Ca-benzoate is considered a category 2 technique for all pig categories.
33. The effects of the various feeding measures have independent effects on NH3 emission. This means that these effects are additive (Bakker and Smits (2002). Combined feeding measures are considered category 2 techniques for all categories of pigs.
Feeding strategies for poultry
34. For poultry, the potential for reducing N excretion through feeding measures is more limited than for pigs because the conversion efficiency currently achieved on average is already high and the variability within a flock of birds is greater. A crude protein reduction of 1 to 2 per cent (10 to 20 g/kg of feed) can usually be achieved depending on the species and the current starting point. The resulting range of dietary crude protein contents is reported in Table S9. The values in the table are indicative target levels, which may need to be adapted to local conditions. Further applied nutrition research is currently being carried out in EU Member States and North America and this may support further possible reductions in the future. A reduction of the crud protein content by 1-2% is a category 1 measure for growers and finishers.
108

Table S9: Indicative target crude protein levels in feed for poultrySpecies Phases Crude protein content, % *)Chicken, broilers Starter 20–22
Grower 19–21Finisher 18–20
Chicken, layers 18–40 weeks 15.5– 16.540+ weeks 14.5– 15.5
Turkeys < 4 weeks 24–275–8 weeks 22–249–12 weeks 19 –2113+ weeks 16-1916+ weeks 14 –17
*) With adequately balanced and optimal amino acid supply
Summary and synthesis and of feeding strategies
35. Low-protein animal feeding is one of the most cost-effective and strategic ways of reducing NH3 emissions. For each percent (absolute value) decrease in protein content of the animal feed, NH3 emissions from animal housing, manure storage and the application of animal manure to land are decreased by 5 to 15%, depending also on the pH of the urine and dung. Low-protein animal feeding also decreases N2O emissions, and increases the efficiency of nitrogen use in animal production. Moreover, there are no animal health and animal welfare implications as long as the requirements for all amino acids are met.
36. Low-protein animal feeding is most applicable to housed animals and less for grassland-based systems with grazing animals, because grass in an early physiological growth stage and grassland with leguminous species (e.g. clover and lucerne) have a relatively high protein content. However, there are strategies to lower the protein content in herbage (balanced N fertilization, grazing/harvesting the grassland at later physiological growth stage, etc.) as well as in the ration of grassland-based systems (supplemental feeding with low-protein feeds), but these strategies are not always fully applicable.
37. Table S10 presents ranges of target crude protein values for various animal categories and for three ‘ambition levels’ of ammonia emission mitigation. The ‘high ambition values’ relate to the lowest ranges of crude protein contents for best feed management practices and low-protein feeding management. These values have been tested manifold in research and proven to be solid in practice. The medium and low ambition target crude protein values have been derived from the high ambition targets by simply increasing the target crude-protein content by 1 percent point. The achievable ambition levels for housed animals depend on the management skill of the farmer and the availability of the animal feedstuffs with low protein content, including synthetic amino acids.
38. The high ambition values presented in Table S10 may be difficult to achieve when the feed quality is low (high fiber content and low digestibility of the feed). In these conditions, specific feed additives may help to increase the digestibility. Ruminants and also pigs
109

(especially sows) need minimum fiber content in the feed for proper functioning of the rumen and for welfare reasons.
39. For producing special meat (and milk) products, the recommended protein content of the animal feed for a specific animal category may be slightly above the upper value of the indicated ranges in Table S10.
Table S10: Possible crude protein levels (percent of dry feed with a standard dry matter content of 88%) for housed animals as function of animal category and for different ambition levels. These crude protein values can be used as annual mean targets in low-protein animal feeding strategies. Animal type Mean crude protein content of the animal feed, %2
Low ambition Medium ambition High ambitionDairy cattle, early lactation (>30kg/day) 17-18 16-17 15-16Dairy cattle, early lactation (<30kg/day) 16-17 15-16 14-15Dairy cattle, late lactation 15-16 14-15 12-14Replacement cattle (young cattle) 14-16 13-14 12-13Veal 20-22 19-20 17-19Beef <3 months 17-18 16-17 15-16Beef >6 months 14-15 13-14 12-13
Sows, gestation 15-16 14-15 13-14Sows, lactation 17-18 16-17 15-16Weaner, <10 kg 21-22 20-21 19-20Piglet, 10-25 kg 19-20 18-19 17-18Fattening pig 25-50 kg 17-18 16-17 15-16Fattening pig 50-110 kg 15-16 14-15 13-14Fattening pigs >110 13-14 12-13 11-12
Chicken, broilers, starter 22-23 21-22 20-21Chicken, broilers, growers 21-22 20-21 19-20Chicken, broilers, finishers 20-21 19-20 18-19Chicken, layers, 18-40 weeks 17-18 16-17 15-16Chicken, layers, >40 weeks 16-17 15-16 14-15
Turkeys, <4 weeks 26-27 25-26 24-25Turkeys, 5-8 weeks 24-25 23-24 22-23Turkeys, 9-12 weeks 21-22 20-21 19-20Turkeys, 13 -16 weeks 18-19 17-18 16-17Turkeys, >16 weeks 16-17 15-16 14-15
2With adequately balanced and optimal digestible amino acid supply.
110

40. The economic cost of animal feeding strategies to lower the NH3 volatilization potential of the animal excrements through adjusting the crude protein content, the cation-anion-balance and the non-starch polysaccharide (NSP) content (e.g. sugar beet pulp, soybean hulls) depends on the initial animal feed composition and on the prices of the feed ingredients on the market. In general, the economic costs range from -2 to +2 euro per kg N saved, i.e. there are potential net gains and potential net costs. Commonly, the economic costs increase when the target for lowering the NH3 volatilization potential increases. The increasing marginal costs relate in part to the cost of synthetic amino acids supplementation relative to using soya beans. The economic costs depend on world market prices of these amino acids and soya bean, but the costs of amino acids supplementation tend to go down. The cost of supplementation of amino acids increases when the target protein content in the animal feed is lowered. This is show below for feed of fattening pits (personal communication Dr. Andre Aarnink, October, 2009). Additional information is provided in the report on the workshop “Economic Cost of Ammonia Emission Abatement”, Paris 25-25 October 2011.
Target protein content, %. Extra costs, euro per 100 kg feed15 0.0013.5 0.9012.7 3.10
111

112