Arrl. .Qst.magazine. .a.regenerative.receiver.for.Beginners.ww
QEX – May/June 2012 3
John E. Post, KA5GSQ
Embry-Riddle Aeronautical University, 3700 Willow Creek Road, Prescott, AZ, 86301; [email protected]
A Simple Sensor Package for High Altitude Ballooning
High-altitude ballooning provides a unique opportunity to motivate high school students to pursue careers in science and engineering, as well as
introduce them to exciting Amateur Radio applications.
This paper describes a simple sensor system designed for a balloonsat that was assembled and flown by high school stu-dents during an intensive four-day summer camp experience. The camp was held on
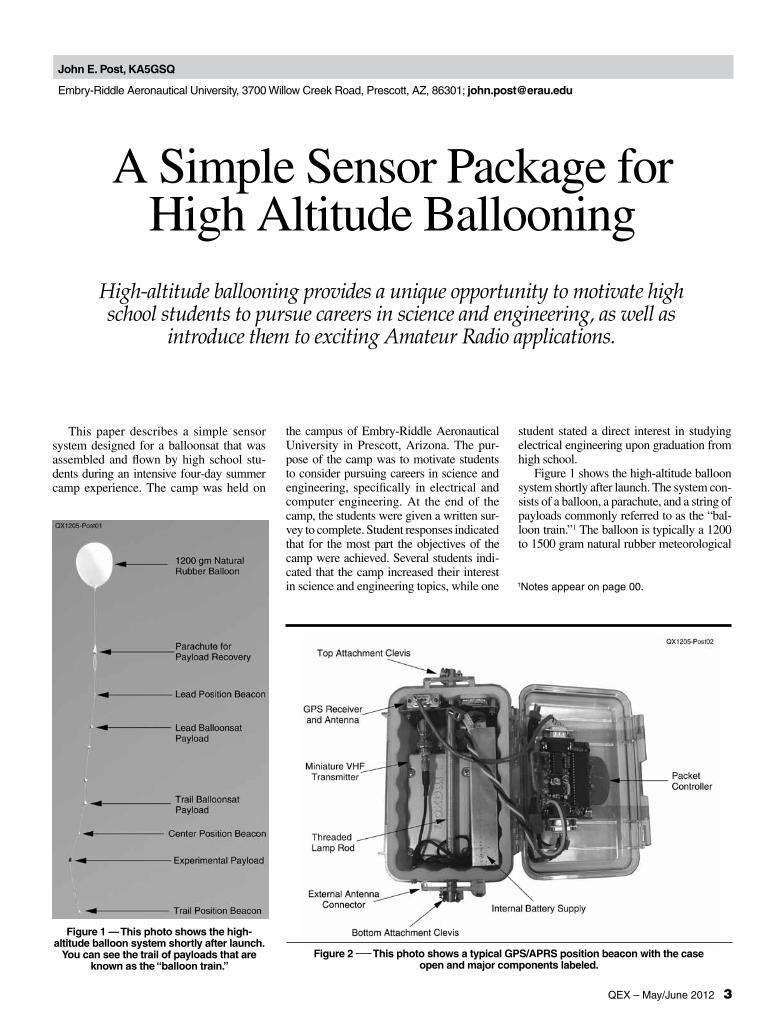
Figure 1 — This photo shows the high-altitude balloon system shortly after launch.
You can see the trail of payloads that are known as the “balloon train.”
the campus of Embry-Riddle Aeronautical University in Prescott, Arizona. The pur-pose of the camp was to motivate students to consider pursuing careers in science and engineering, specifically in electrical and computer engineering. At the end of the camp, the students were given a written sur-vey to complete. Student responses indicated that for the most part the objectives of the camp were achieved. Several students indi-cated that the camp increased their interest in science and engineering topics, while one
student stated a direct interest in studying electrical engineering upon graduation from high school.
Figure 1 shows the high-altitude balloon system shortly after launch. The system con-sists of a balloon, a parachute, and a string of payloads commonly referred to as the “bal-loon train.”1 The balloon is typically a 1200 to 1500 gram natural rubber meteorological
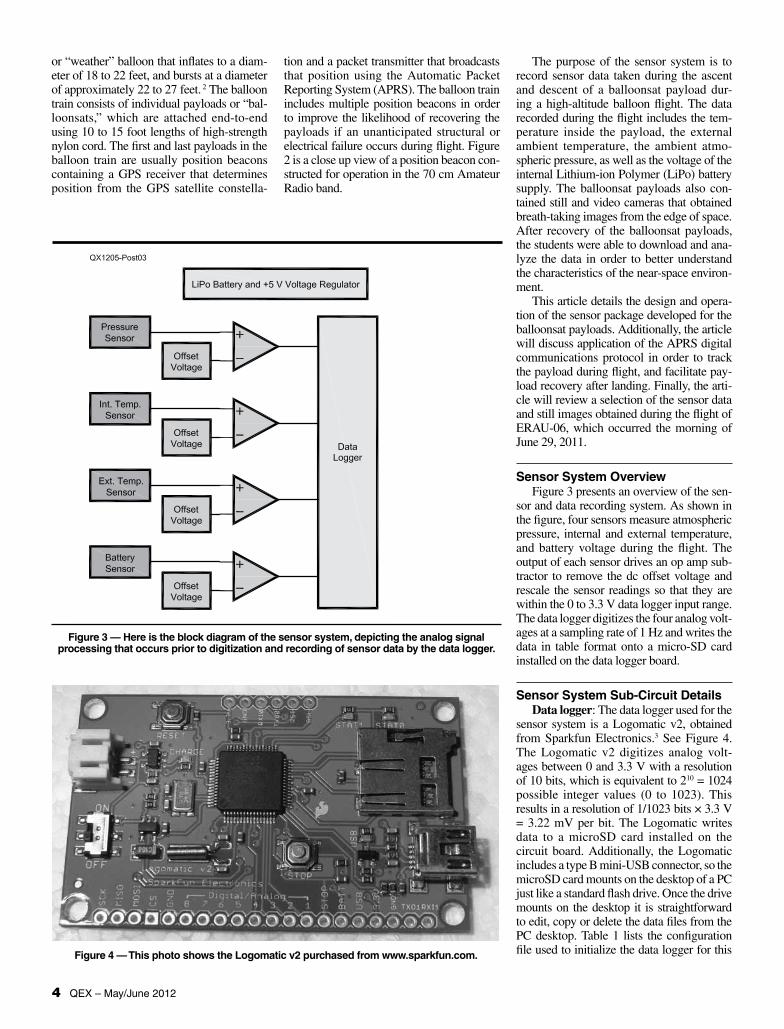
Figure 2 — This photo shows a typical GPS/APRS position beacon with the case open and major components labeled.
1Notes appear on page 00.
4 QEX – May/June 2012
The purpose of the sensor system is to record sensor data taken during the ascent and descent of a balloonsat payload dur-ing a high-altitude balloon flight. The data recorded during the flight includes the tem-perature inside the payload, the external ambient temperature, the ambient atmo-spheric pressure, as well as the voltage of the internal Lithium-ion Polymer (LiPo) battery supply. The balloonsat payloads also con-tained still and video cameras that obtained breath-taking images from the edge of space. After recovery of the balloonsat payloads, the students were able to download and ana-lyze the data in order to better understand the characteristics of the near-space environ-ment.
This article details the design and opera-tion of the sensor package developed for the balloonsat payloads. Additionally, the article will discuss application of the APRS digital communications protocol in order to track the payload during flight, and facilitate pay-load recovery after landing. Finally, the arti-cle will review a selection of the sensor data and still images obtained during the flight of ERAU-06, which occurred the morning of June 29, 2011.
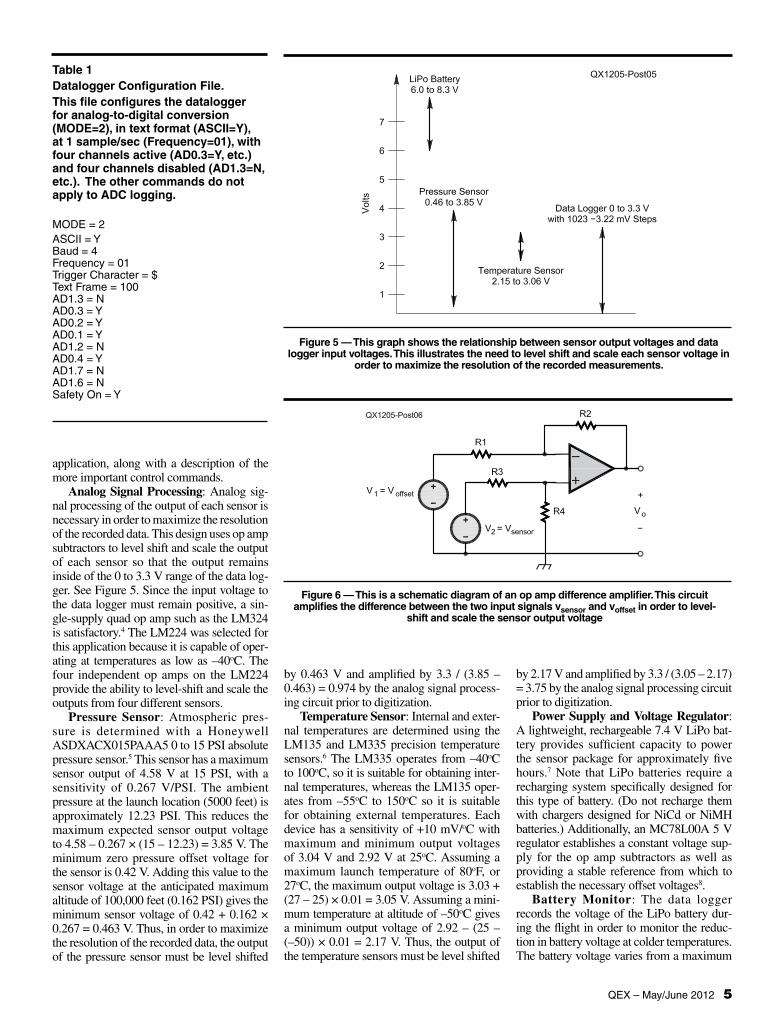
Sensor System OverviewFigure 3 presents an overview of the sen-
sor and data recording system. As shown in the figure, four sensors measure atmospheric pressure, internal and external temperature, and battery voltage during the flight. The output of each sensor drives an op amp sub-tractor to remove the dc offset voltage and rescale the sensor readings so that they are within the 0 to 3.3 V data logger input range. The data logger digitizes the four analog volt-ages at a sampling rate of 1 Hz and writes the data in table format onto a micro-SD card installed on the data logger board.
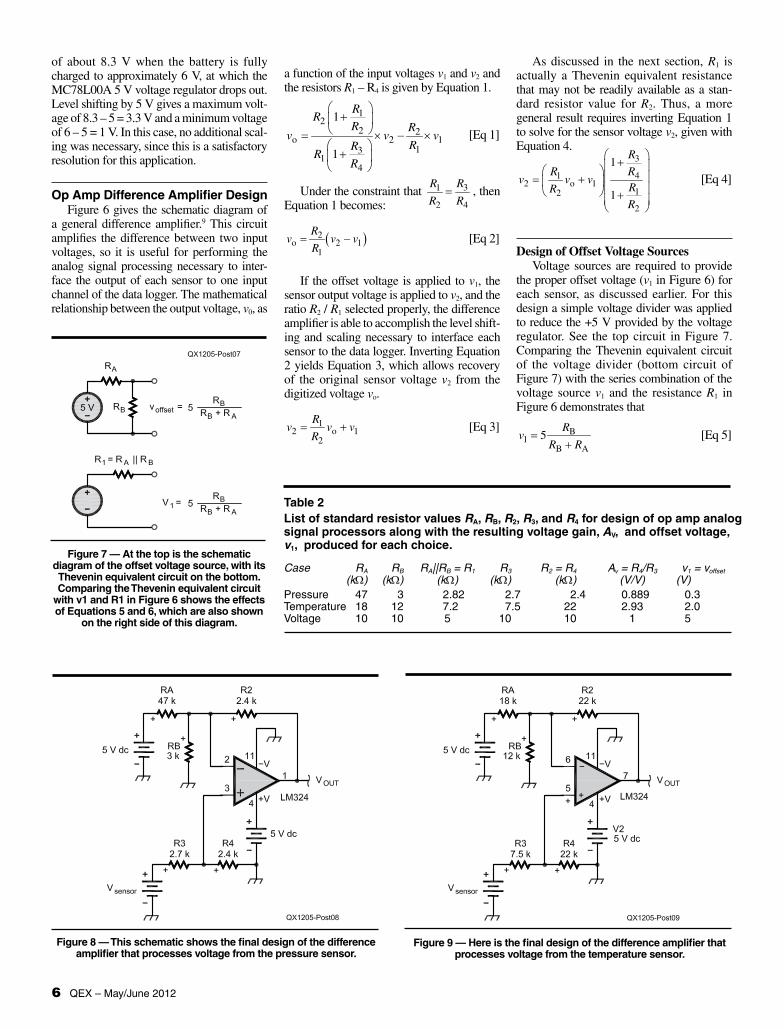
Sensor System Sub-Circuit DetailsData logger: The data logger used for the
sensor system is a Logomatic v2, obtained from Sparkfun Electronics.3 See Figure 4. The Logomatic v2 digitizes analog volt-ages between 0 and 3.3 V with a resolution of 10 bits, which is equivalent to 210 = 1024 possible integer values (0 to 1023). This results in a resolution of 1/1023 bits × 3.3 V = 3.22 mV per bit. The Logomatic writes data to a microSD card installed on the circuit board. Additionally, the Logomatic includes a type B mini-USB connector, so the microSD card mounts on the desktop of a PC just like a standard flash drive. Once the drive mounts on the desktop it is straightforward to edit, copy or delete the data files from the PC desktop. Table 1 lists the configuration file used to initialize the data logger for this
or “weather” balloon that inflates to a diam-eter of 18 to 22 feet, and bursts at a diameter of approximately 22 to 27 feet. 2 The balloon train consists of individual payloads or “bal-loonsats,” which are attached end-to-end using 10 to 15 foot lengths of high-strength nylon cord. The first and last payloads in the balloon train are usually position beacons containing a GPS receiver that determines position from the GPS satellite constella-
Figure 4 — This photo shows the Logomatic v2 purchased from www.sparkfun.com.
Figure 3 — Here is the block diagram of the sensor system, depicting the analog signal processing that occurs prior to digitization and recording of sensor data by the data logger.
tion and a packet transmitter that broadcasts that position using the Automatic Packet Reporting System (APRS). The balloon train includes multiple position beacons in order to improve the likelihood of recovering the payloads if an unanticipated structural or electrical failure occurs during flight. Figure 2 is a close up view of a position beacon con-structed for operation in the 70 cm Amateur Radio band.
QEX – May/June 2012 5
Table 1Datalogger Configuration File. This file configures the datalogger for analog-to-digital conversion (MODE=2), in text format (ASCII=Y), at 1 sample/sec (Frequency=01), with four channels active (AD0.3=Y, etc.) and four channels disabled (AD1.3=N, etc.). The other commands do not apply to ADC logging.
MODE = 2ASCII = YBaud = 4Frequency = 01Trigger Character = $Text Frame = 100AD1.3 = NAD0.3 = YAD0.2 = YAD0.1 = YAD1.2 = NAD0.4 = YAD1.7 = NAD1.6 = NSafety On = Y
application, along with a description of the more important control commands.
Analog Signal Processing: Analog sig-nal processing of the output of each sensor is necessary in order to maximize the resolution of the recorded data. This design uses op amp subtractors to level shift and scale the output of each sensor so that the output remains inside of the 0 to 3.3 V range of the data log-ger. See Figure 5. Since the input voltage to the data logger must remain positive, a sin-gle-supply quad op amp such as the LM324 is satisfactory.4 The LM224 was selected for this application because it is capable of oper-ating at temperatures as low as –40oC. The four independent op amps on the LM224 provide the ability to level-shift and scale the outputs from four different sensors.
Pressure Sensor: Atmospheric pres-sure is determined with a Honeywell ASDXACX015PAAA5 0 to 15 PSI absolute pressure sensor.5 This sensor has a maximum sensor output of 4.58 V at 15 PSI, with a sensitivity of 0.267 V/PSI. The ambient pressure at the launch location (5000 feet) is approximately 12.23 PSI. This reduces the maximum expected sensor output voltage to 4.58 – 0.267 × (15 – 12.23) = 3.85 V. The minimum zero pressure offset voltage for the sensor is 0.42 V. Adding this value to the sensor voltage at the anticipated maximum altitude of 100,000 feet (0.162 PSI) gives the minimum sensor voltage of 0.42 + 0.162 × 0.267 = 0.463 V. Thus, in order to maximize the resolution of the recorded data, the output of the pressure sensor must be level shifted
Figure 5 — This graph shows the relationship between sensor output voltages and data logger input voltages. This illustrates the need to level shift and scale each sensor voltage in
order to maximize the resolution of the recorded measurements.
Figure 6 — This is a schematic diagram of an op amp difference amplifier. This circuit amplifies the difference between the two input signals vsensor and voffset in order to level-
shift and scale the sensor output voltage
by 0.463 V and amplified by 3.3 / (3.85 – 0.463) = 0.974 by the analog signal process-ing circuit prior to digitization.
Temperature Sensor: Internal and exter-nal temperatures are determined using the LM135 and LM335 precision temperature sensors.6 The LM335 operates from –40oC to 100oC, so it is suitable for obtaining inter-nal temperatures, whereas the LM135 oper-ates from –55oC to 150oC so it is suitable for obtaining external temperatures. Each device has a sensitivity of +10 mV/oC with maximum and minimum output voltages of 3.04 V and 2.92 V at 25oC. Assuming a maximum launch temperature of 80oF, or 27oC, the maximum output voltage is 3.03 + (27 – 25) × 0.01 = 3.05 V. Assuming a mini-mum temperature at altitude of –50oC gives a minimum output voltage of 2.92 – (25 – (–50)) × 0.01 = 2.17 V. Thus, the output of the temperature sensors must be level shifted
by 2.17 V and amplified by 3.3 / (3.05 – 2.17) = 3.75 by the analog signal processing circuit prior to digitization.
Power Supply and Voltage Regulator: A lightweight, rechargeable 7.4 V LiPo bat-tery provides sufficient capacity to power the sensor package for approximately five hours.7 Note that LiPo batteries require a recharging system specifically designed for this type of battery. (Do not recharge them with chargers designed for NiCd or NiMH batteries.) Additionally, an MC78L00A 5 V regulator establishes a constant voltage sup-ply for the op amp subtractors as well as providing a stable reference from which to establish the necessary offset voltages8.
Battery Monitor: The data logger records the voltage of the LiPo battery dur-ing the flight in order to monitor the reduc-tion in battery voltage at colder temperatures. The battery voltage varies from a maximum
6 QEX – May/June 2012
of about 8.3 V when the battery is fully charged to approximately 6 V, at which the MC78L00A 5 V voltage regulator drops out. Level shifting by 5 V gives a maximum volt-age of 8.3 – 5 = 3.3 V and a minimum voltage of 6 – 5 = 1 V. In this case, no additional scal-ing was necessary, since this is a satisfactory resolution for this application.
Op Amp Difference Amplifier DesignFigure 6 gives the schematic diagram of
a general difference amplifier.9 This circuit amplifies the difference between two input voltages, so it is useful for performing the analog signal processing necessary to inter-face the output of each sensor to one input channel of the data logger. The mathematical relationship between the output voltage, v0, as
Figure 8 — This schematic shows the final design of the difference amplifier that processes voltage from the pressure sensor.
Figure 9 — Here is the final design of the difference amplifier that processes voltage from the temperature sensor.
a function of the input voltages v1 and v2 and the resistors R1 – R4 is given by Equation 1.
12
2 2o 2 1
131
4
1
1
RR
R Rv v v
RRR
R
+
= × − × +
[Eq 1]
Under the constraint that 31
2 4
RR
R R= , then
Equation 1 becomes:
( )2o 2 1
1
Rv v v
R= − [Eq 2]
If the offset voltage is applied to v1, the sensor output voltage is applied to v2, and the ratio R2 / R1 selected properly, the difference amplifier is able to accomplish the level shift-ing and scaling necessary to interface each sensor to the data logger. Inverting Equation 2 yields Equation 3, which allows recovery of the original sensor voltage v2 from the digitized voltage vo.
12 o 1
2
Rv v v
R= + [Eq 3]
As discussed in the next section, R1 is actually a Thevenin equivalent resistance that may not be readily available as a stan-dard resistor value for R2. Thus, a more general result requires inverting Equation 1 to solve for the sensor voltage v2, given with Equation 4.
3
1 42 o 1
12
2
1
1
R
R Rv v v
RRR
+ = + +
[Eq 4]
Design of Offset Voltage SourcesVoltage sources are required to provide
the proper offset voltage (v1 in Figure 6) for each sensor, as discussed earlier. For this design a simple voltage divider was applied to reduce the +5 V provided by the voltage regulator. See the top circuit in Figure 7. Comparing the Thevenin equivalent circuit of the voltage divider (bottom circuit of Figure 7) with the series combination of the voltage source v1 and the resistance R1 in Figure 6 demonstrates that
B
1B A
5R
vR R
=+
[Eq 5]
Table 2List of standard resistor values RA, RB, R2, R3, and R4 for design of op amp analog signal processors along with the resulting voltage gain, AV, and offset voltage, v1, produced for each choice.
Case RA RB RA||RB=R1 R3 R2=R4 Av=R4/R3 v1=voffset
(kΩ) (kΩ) (kΩ) (kΩ) (kΩ) (V/V) (V)Pressure 47 3 2.82 2.7 2.4 0.889 0.3 Temperature 18 12 7.2 7.5 22 2.93 2.0 Voltage 10 10 5 10 10 1 5
Figure 7 — At the top is the schematic diagram of the offset voltage source, with its Thevenin equivalent circuit on the bottom. Comparing the Thevenin equivalent circuit
with v1 and R1 in Figure 6 shows the effects of Equations 5 and 6, which are also shown
on the right side of this diagram.
QEX – May/June 2012 7
and
R1 = RA D RB [Eq 6]
Since only standard resistor values were available, it is not possible to obtain the exact offset voltages and gains for each sensor derived previously. This situation is reflected in Table 2, which shows the offset voltage, v1, and scaling factor for the temperature, pressure, and voltage sensor as functions of the resistors RA, RB, R2, R3 and R4. Referring to this table, columns 2 and 3 give the values for resistors RA and RB, column 4 shows the equivalent value of RA || RB, while column 5 shows the nearest standard resistor value to the adjacent value shown in column 4. Continuing to refer to the table, column 6 gives the standard value for resistor R2, which equals resistor R4, while columns 7 and 8 give the scaling fac-tor and offset voltage that result from these design choices. It is important to note that even though the constraint R1/R2 = R3/R4 no longer applies, the sensor voltage is still recoverable uniquely through application of Equation 4. A slight loss of resolution does occur because the amplitude scaling factors of 0.889 and 2.93 V/V shown in Table 2 are somewhat smaller than the ideal scaling fac-tors of 0.974 and 3.75 derived in the previous section.
Difference Amplifier SimulationFigure 8 shows the difference amplifier
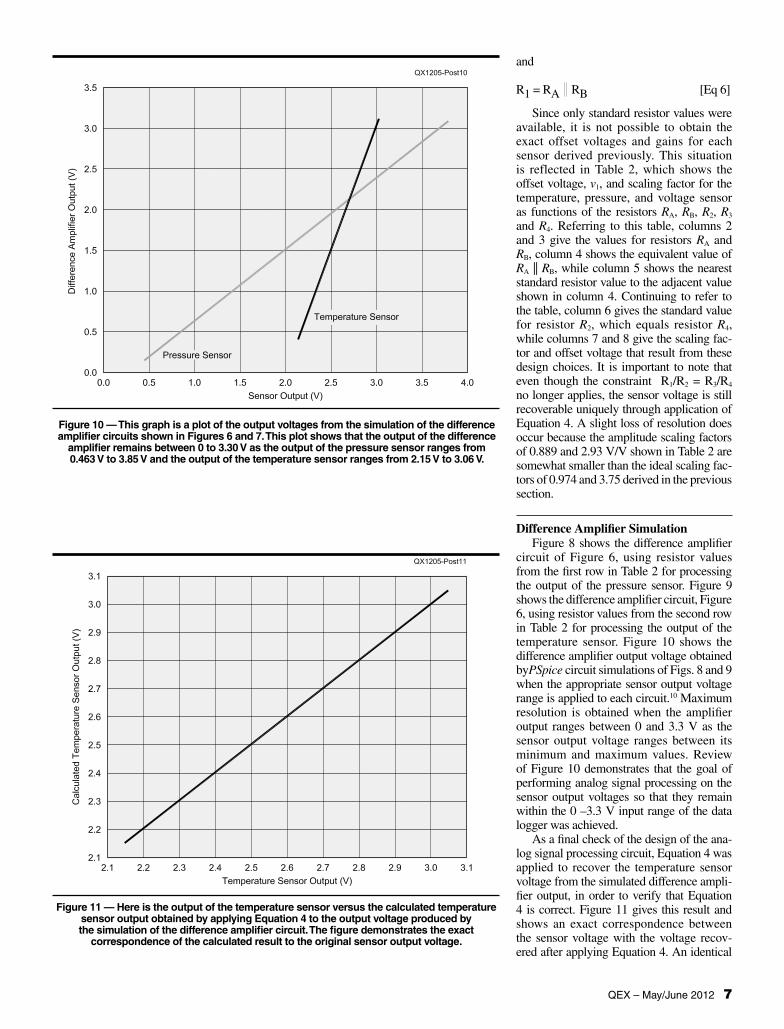
circuit of Figure 6, using resistor values from the first row in Table 2 for processing the output of the pressure sensor. Figure 9 shows the difference amplifier circuit, Figure 6, using resistor values from the second row in Table 2 for processing the output of the temperature sensor. Figure 10 shows the difference amplifier output voltage obtained byPSpice circuit simulations of Figs. 8 and 9 when the appropriate sensor output voltage range is applied to each circuit.10 Maximum resolution is obtained when the amplifier output ranges between 0 and 3.3 V as the sensor output voltage ranges between its minimum and maximum values. Review of Figure 10 demonstrates that the goal of performing analog signal processing on the sensor output voltages so that they remain within the 0 –3.3 V input range of the data logger was achieved.
As a final check of the design of the ana-log signal processing circuit, Equation 4 was applied to recover the temperature sensor voltage from the simulated difference ampli-fier output, in order to verify that Equation 4 is correct. Figure 11 gives this result and shows an exact correspondence between the sensor voltage with the voltage recov-ered after applying Equation 4. An identical
Figure 10 — This graph is a plot of the output voltages from the simulation of the difference amplifier circuits shown in Figures 6 and 7. This plot shows that the output of the difference
amplifier remains between 0 to 3.30 V as the output of the pressure sensor ranges from 0.463 V to 3.85 V and the output of the temperature sensor ranges from 2.15 V to 3.06 V.
Figure 11 — Here is the output of the temperature sensor versus the calculated temperature sensor output obtained by applying Equation 4 to the output voltage produced by the simulation of the difference amplifier circuit. The figure demonstrates the exact
correspondence of the calculated result to the original sensor output voltage.
8 QEX – May/June 2012
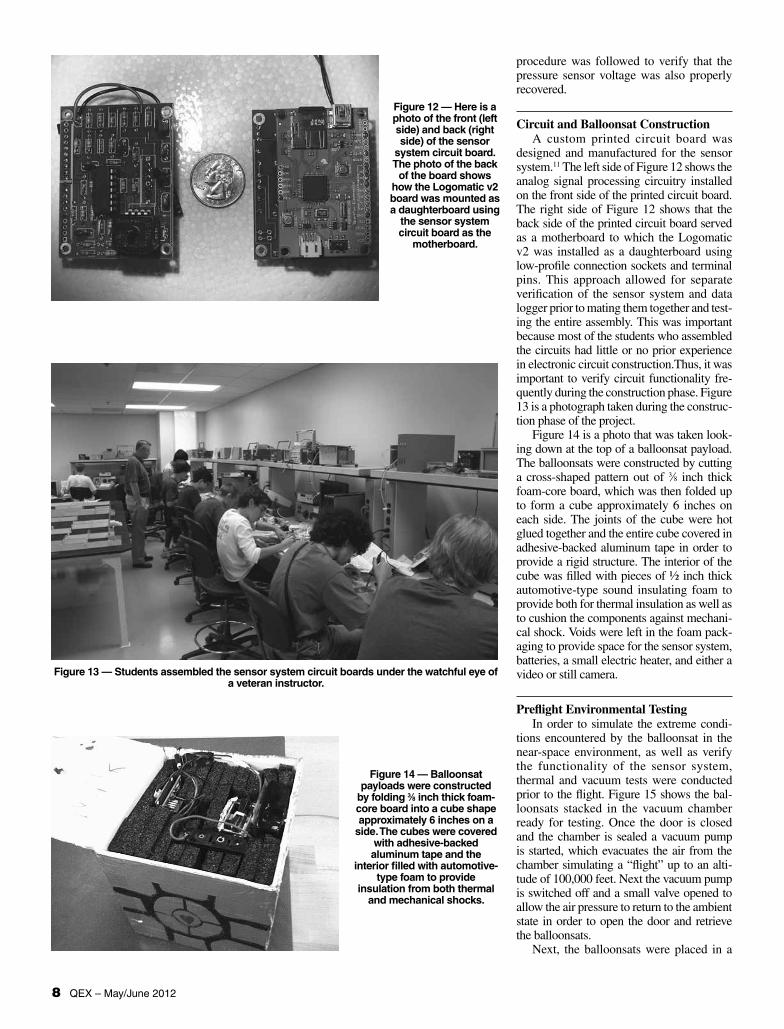
Figure 12 — Here is a photo of the front (left side) and back (right side) of the sensor
system circuit board. The photo of the back
of the board shows how the Logomatic v2 board was mounted as a daughterboard using
the sensor system circuit board as the
motherboard.
Figure 13 — Students assembled the sensor system circuit boards under the watchful eye of a veteran instructor.
Figure 14 — Balloonsat payloads were constructed
by folding 3⁄8 inch thick foam-core board into a cube shape approximately 6 inches on a
side. The cubes were covered with adhesive-backed aluminum tape and the
interior filled with automotive-type foam to provide
insulation from both thermal and mechanical shocks.
procedure was followed to verify that the pressure sensor voltage was also properly recovered.
Circuit and Balloonsat ConstructionA custom printed circuit board was
designed and manufactured for the sensor system.11 The left side of Figure 12 shows the analog signal processing circuitry installed on the front side of the printed circuit board. The right side of Figure 12 shows that the back side of the printed circuit board served as a motherboard to which the Logomatic v2 was installed as a daughterboard using low-profile connection sockets and terminal pins. This approach allowed for separate verification of the sensor system and data logger prior to mating them together and test-ing the entire assembly. This was important because most of the students who assembled the circuits had little or no prior experience in electronic circuit construction.Thus, it was important to verify circuit functionality fre-quently during the construction phase. Figure 13 is a photograph taken during the construc-tion phase of the project.
Figure 14 is a photo that was taken look-ing down at the top of a balloonsat payload. The balloonsats were constructed by cutting a cross-shaped pattern out of 3⁄8 inch thick foam-core board, which was then folded up to form a cube approximately 6 inches on each side. The joints of the cube were hot glued together and the entire cube covered in adhesive-backed aluminum tape in order to provide a rigid structure. The interior of the cube was filled with pieces of ½ inch thick automotive-type sound insulating foam to provide both for thermal insulation as well as to cushion the components against mechani-cal shock. Voids were left in the foam pack-aging to provide space for the sensor system, batteries, a small electric heater, and either a video or still camera.
Preflight Environmental TestingIn order to simulate the extreme condi-
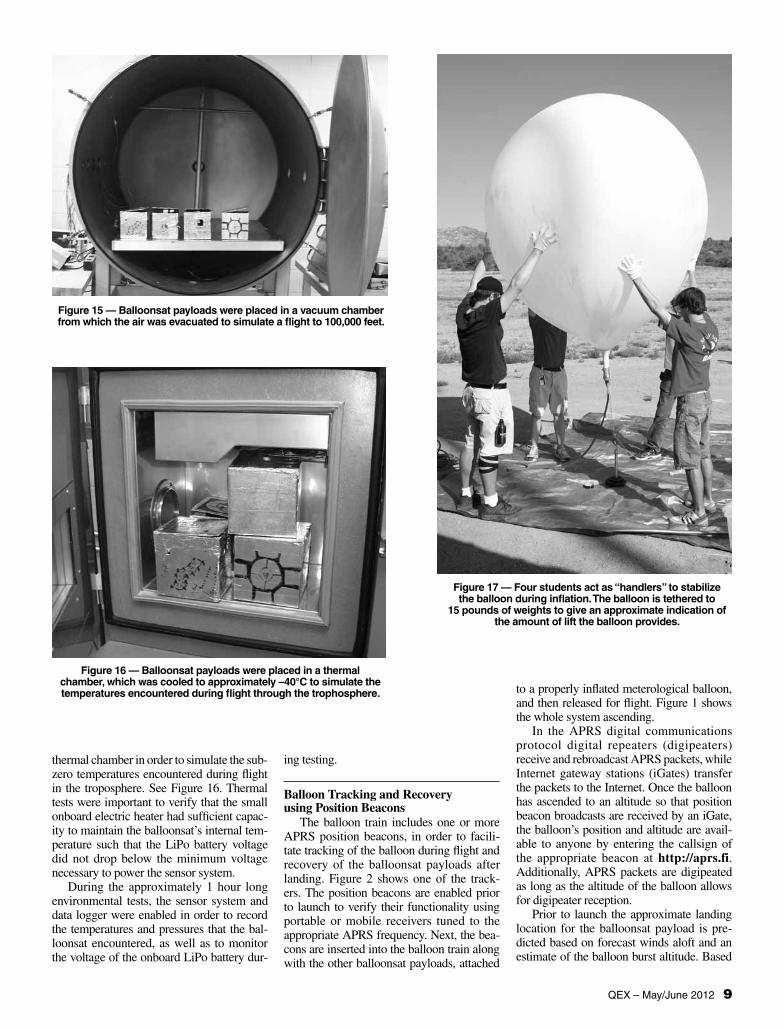
tions encountered by the balloonsat in the near-space environment, as well as verify the functionality of the sensor system, thermal and vacuum tests were conducted prior to the flight. Figure 15 shows the bal-loonsats stacked in the vacuum chamber ready for testing. Once the door is closed and the chamber is sealed a vacuum pump is started, which evacuates the air from the chamber simulating a “flight” up to an alti-tude of 100,000 feet. Next the vacuum pump is switched off and a small valve opened to allow the air pressure to return to the ambient state in order to open the door and retrieve the balloonsats.
Next, the balloonsats were placed in a
QEX – May/June 2012 9
Figure 17 — Four students act as “handlers” to stabilize the balloon during inflation. The balloon is tethered to
15 pounds of weights to give an approximate indication of the amount of lift the balloon provides.
Figure 16 — Balloonsat payloads were placed in a thermal chamber, which was cooled to approximately –40°C to simulate the temperatures encountered during flight through the trophosphere.
Figure 15 — Balloonsat payloads were placed in a vacuum chamber from which the air was evacuated to simulate a flight to 100,000 feet.
thermal chamber in order to simulate the sub-zero temperatures encountered during flight in the troposphere. See Figure 16. Thermal tests were important to verify that the small onboard electric heater had sufficient capac-ity to maintain the balloonsat’s internal tem-perature such that the LiPo battery voltage did not drop below the minimum voltage necessary to power the sensor system.
During the approximately 1 hour long environmental tests, the sensor system and data logger were enabled in order to record the temperatures and pressures that the bal-loonsat encountered, as well as to monitor the voltage of the onboard LiPo battery dur-
ing testing.
Balloon Tracking and Recovery using Position Beacons
The balloon train includes one or more APRS position beacons, in order to facili-tate tracking of the balloon during flight and recovery of the balloonsat payloads after landing. Figure 2 shows one of the track-ers. The position beacons are enabled prior to launch to verify their functionality using portable or mobile receivers tuned to the appropriate APRS frequency. Next, the bea-cons are inserted into the balloon train along with the other balloonsat payloads, attached
to a properly inflated meterological balloon, and then released for flight. Figure 1 shows the whole system ascending.
In the APRS digital communications protocol digital repeaters (digipeaters) receive and rebroadcast APRS packets, while Internet gateway stations (iGates) transfer the packets to the Internet. Once the balloon has ascended to an altitude so that position beacon broadcasts are received by an iGate, the balloon’s position and altitude are avail-able to anyone by entering the callsign of the appropriate beacon at http://aprs.fi. Additionally, APRS packets are digipeated as long as the altitude of the balloon allows for digipeater reception.
Prior to launch the approximate landing location for the balloonsat payload is pre-dicted based on forecast winds aloft and an estimate of the balloon burst altitude. Based

10 QEX – May/June 2012
on this position estimate, one or more mobile recovery teams equipped with GPS enabled APRS receivers are stationed on high terrain in the recovery area as the balloonsat pay-loads return to the surface under parachute. This is necessary because the final position beacon broadcasts prior to landing are nor-mally terrain masked from the digipeater and are not retransmitted. The goal of the recovery team is to position themselves so that they receive the final position beacon transmissions before landing. This will mini-mize the search area if the position beacons are disabled by a hard landing or rough ter-rain or inclement weather prohibits immedi-ate recovery of the payloads before beacon power is exhausted.
Once the payload has landed the recovery teams follow distance and direction informa-tion provided by a GPS enabled APRS por-table receiver to the final location transmitted by the position beacon. The best-case sce-nario is that one or more position beacons are still in operation at the landing location and the recovery team is within range to receive these packets containing the actual location of the payload. Payload recovery is easy in this case since the recovery team can literally walk or drive to within a few meters of the actual location of the payloads.
The situation quickly becomes more complicated and recovery of the payload is problematic if one or more of the following occurs: Failure to capture the final position beacon packets by the recovery team, failure of the beacons during flight or after land-ing, landing in rough terrain or inclement weather, inaccurate forecast of surface winds or winds aloft, separation of one or more of the balloonsats from the balloon train during flight, and many other difficulties that space constraints preclude listing.
Sample Flight Images and DataWednesday morning, June 29, 2011 a
high altitude balloon designated ERAU-06 (Embry-Riddle Aeronautical University-06) was launched from the Embry-Riddle cam-pus in Prescott, AZ, shortly after 8:30 AM local time. The balloon payload consisted of the four student-constructed balloonsats, along with three position beacons that peri-odically transmitted position information using APRS. Figure 17 shows the balloon during inflation while Figure 18 shows an image taken at an altitude of approximately 1000 feet by an onboard camera carried by one of the balloonsats shortly after launch. Figure 19 shows an image of the cloud layer recorded by a camera as the balloon ascends through the stratosphere. Figure 20 shows an image taken by a camera immediately following the “post burst chaos” that ensues after the balloon bursts.
Figure 18 — This is one of the first images captured after launch. It shows a panoramic view of the Embry-Riddle Prescott campus as well as Willow Lake just east of campus.
Figure 19 — Here is a photo taken from high in the stratosphere of clouds over northern Arizona.
Figure 20 — This near-space image was captured shortly after the balloon burst at an altitude of approximately
86,000 feet. The curvature of the earth as well as the blackness of space are
clearly visible in this image.
QEX – May/June 2012 11
DescentPhase
Balloon Burst at85,568 feet
Ascent Phase
Launch at5,184 feet
QX1205-Post22
Landing at6,519 feet
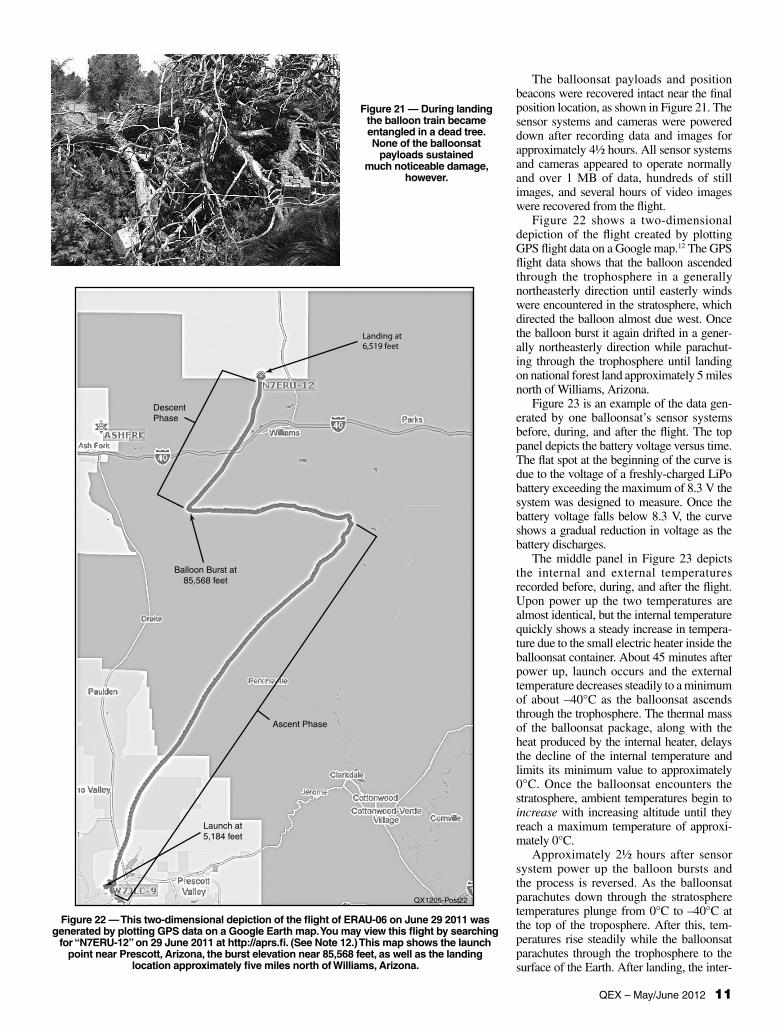
The balloonsat payloads and position beacons were recovered intact near the final position location, as shown in Figure 21. The sensor systems and cameras were powered down after recording data and images for approximately 4½ hours. All sensor systems and cameras appeared to operate normally and over 1 MB of data, hundreds of still images, and several hours of video images were recovered from the flight.
Figure 22 shows a two-dimensional depiction of the flight created by plotting GPS flight data on a Google map.12 The GPS flight data shows that the balloon ascended through the trophosphere in a generally northeasterly direction until easterly winds were encountered in the stratosphere, which directed the balloon almost due west. Once the balloon burst it again drifted in a gener-ally northeasterly direction while parachut-ing through the trophosphere until landing on national forest land approximately 5 miles north of Williams, Arizona.
Figure 23 is an example of the data gen-erated by one balloonsat’s sensor systems before, during, and after the flight. The top panel depicts the battery voltage versus time. The flat spot at the beginning of the curve is due to the voltage of a freshly-charged LiPo battery exceeding the maximum of 8.3 V the system was designed to measure. Once the battery voltage falls below 8.3 V, the curve shows a gradual reduction in voltage as the battery discharges.
The middle panel in Figure 23 depicts the internal and external temperatures recorded before, during, and after the flight. Upon power up the two temperatures are almost identical, but the internal temperature quickly shows a steady increase in tempera-ture due to the small electric heater inside the balloonsat container. About 45 minutes after power up, launch occurs and the external temperature decreases steadily to a minimum of about –40°C as the balloonsat ascends through the trophosphere. The thermal mass of the balloonsat package, along with the heat produced by the internal heater, delays the decline of the internal temperature and limits its minimum value to approximately 0°C. Once the balloonsat encounters the stratosphere, ambient temperatures begin to increase with increasing altitude until they reach a maximum temperature of approxi-mately 0°C.
Approximately 2½ hours after sensor system power up the balloon bursts and the process is reversed. As the balloonsat parachutes down through the stratosphere temperatures plunge from 0°C to –40°C at the top of the troposphere. After this, tem-peratures rise steadily while the balloonsat parachutes through the trophosphere to the surface of the Earth. After landing, the inter-
Figure 22 — This two-dimensional depiction of the flight of ERAU-06 on June 29 2011 was generated by plotting GPS data on a Google Earth map. You may view this flight by searching
for “N7ERU-12” on 29 June 2011 at http://aprs.fi. (See Note 12.) This map shows the launch point near Prescott, Arizona, the burst elevation near 85,568 feet, as well as the landing
location approximately five miles north of Williams, Arizona.
Figure 21 — During landing the balloon train became entangled in a dead tree. None of the balloonsat
payloads sustained much noticeable damage,
however.

12 QEX – May/June 2012
Figure 23 — These three graphs represent data recovered from one of the balloonsats during the flight of ERAU-06 on 29 June 2011. The top panel depicts battery voltage versus flight
time. The middle panel shows internal and external temperature versus flight time. The bottom panel shows altitude computed from air pressure readings versus flight time. Results from
the other three balloonsats were similar to those presented in this figure.
nal heater, along with the afternoon Arizona sun, overcomes the thermal mass of the balloonsat payload and increases the inter-nal temperature well above the maximum value of approximately 38°C the system was designed to record. This limitation produces the flat spot on the internal temperature curve that is clearly visible after landing.
The bottom panel in Figure 23 shows the altitudes recorded before, during, and after the flight. The launch site elevation was approximately 5000 feet, so this value was used to calibrate the altitudes computed from the measurements that followed. The altitude curve clearly depicts balloon launch at approximately 48 minutes after sensor sys-tem power up. After that the balloon ascends at a relatively constant rate of approximately 900 ft/min until burst at a measured alti-tude of approximately 90,000 feet, about 2½ hours after power-up (compared with a maximum altitude of 85,568 feet reported by the position beacon). The curve then depicts the decrease in altitude as the balloonsat returns by parachute at an average descent rate of 2000 ft/min. The balloonsat payloads landed on the Earth’s surface at a measured altitude of approximately 6300 feet (com-pared with an altitude of 6519 feet reported by the position beacon). In this case, the
altitude measurements taken at burst and landing were within 5% or better of the GPS positions, which seems satisfactory for such a simple system. The results from the other three balloonsats were similar to those pre-sented here.
Conclusion and Future OpportunitiesThe data returned from the flight of
ERAU-06 validated the sensor system design methodology. Given the modest size and weight requirements for the balloonsat payloads, a low-power, light-weight sensor system with a very small form factor was required. The approach described in this article successfully met these constraints.
Finally, many opportunities exist for fur-ther expansion of the sensor system. One of the most interesting possibilities is to incor-porate a low-power packet-radio transmitter that would broadcast sensor system measure-ments periodically during flight. This would provide students with real-time snapshots of the atmospheric conditions and system status during the flight. Successfully introducing a more complex system will require rethinking how to go about the construction and testing phases in order to keep the project within the capability of high school students, the patience of the instructors, as well as within the time constraints of the program.
AcknowledgementThe author gratefully acknowledges
many helpful discussions with Mr. Jack Crabtree, W7JLC, concerning the topics covered in this article. Jack is the founder of two high-altitude balloon groups, Edge of Space Sciences (EOSS) in Denver, Colorado and Arizona Near Space Research (ANSR).
John E. Post, KA5GSQ, is an assistant pro-fessor of electrical and computer engineering with Embry-Riddle Aeronautical University in Prescott, AZ. He holds an Amateur Extra class license and has BS, MS, and PhD degrees in electrical engineering.
Notes1For information about the parachute recovery
system used, see: www.the-rocketman.com/recovery.html.
2Scientific Sales is one source for weather balloons. See www.scientificsales.com/8244-Weather-Balloon-1200-Grams-Natural-p/8244.htm.
3Sparkfun Electronics has many electronics experimentation projects. For the datalogger board, see: www.sparkfun.com/prod-ucts/10216.
4The data sheet for the LM324 series of op amps is available on the National Semiconductor website. www.national.com/mpf/LM/LM324.html#Overview.
5Information about the Honeywell pressure sensor is available at: http://sensing.honeywell.com/index.php/ci_id/45330/la_id/1/document/1/re_id/0.
6You can find information about the Texas Instruments temperature sensors at: www.ti.com/lit/ds/symlink/lm135.pdf.
7Lithium ion polymer batteries provide a very lightweight power source for the balloonsat electronics. For one source of battery packs, see www.electrifly.com/batteries/batteries-lipo.html.
8You can find more information about the voltage regulator used with the sensor electronics package at: www.onsemi.com/pub_link/Collateral/MC78L00A-D.PDF.
9Charles K. Alexander and Matthew N.O. Sadiku, FundamentalsofElectricCircuits,4th Edition, McGraw Hill, Boston, Massachusetts, 2009.
10You can download a student version of PSpice at www.electronics-lab.com/downloads/schematic/013/.
11ExpressPCB is a convenient way for electronics experimenters to design and purchase circuit boards. See www.express-pcb.com.
12See http://aprs.fi/?call=N7ERU-12. There are tracks available on the map for N7ERU-11, N7ERU-12 and N7ERU-13, which are all APRS beacons used on balloon flights. Along the right side of the screen, select the 2011 tab, then select the 2011/6 date and that will bring you to the track for the June 29th balloon flight.