A simple model to interpret the ultraviolet, optical and ...08_SEDs-SINGS.pdffar-infrared SEDs of...
23
Mon. Not. R. Astron. Soc. 388, 1595–1617 (2008) doi:10.1111/j.1365-2966.2008.13535.x A simple model to interpret the ultraviolet, optical and infrared emission from galaxies Elisabete da Cunha, 1 St´ ephane Charlot 1 and David Elbaz 2 1 Institut d’Astrophysique de Paris, CNRS, Universit´ e Pierre & Marie Curie, 98 bis Boulevard Arago, 75014 Paris, France 2 Laboratoire AIM, CEA/DSM-CNRS-Universit´ e Paris Diderot, DAPNIA/Service d’Astrophysique, CEA Saclay, Orme des Merisiers, 91191 Gif-sur-Yvette Cedex, France Accepted 2008 June 4. Received 2008 May 30; in original form 2007 December 18 ABSTRACT We present a simple, largely empirical but physically motivated model to interpret the mid- and far-infrared spectral energy distributions of galaxies consistently with the emission at ultravi- olet, optical and near-infrared wavelengths. Our model relies on an existing angle-averaged prescription to compute the absorption of starlight by dust in stellar birth clouds and in the ambient interstellar medium (ISM) in galaxies. We compute the spectral energy distribution of the power reradiated by dust in stellar birth clouds as the sum of three components: a com- ponent of polycyclic aromatic hydrocarbons (PAHs); a mid-infrared continuum characterizing the emission from hot grains at temperatures in the range 130–250 K; and a component of grains in thermal equilibrium with adjustable temperature in the range 30–60 K. In the ambient ISM, we fix for simplicity the relative proportions of these three components to reproduce the spectral shape of diffuse cirrus emission in the Milky Way, and we include a component of cold grains in thermal equilibrium with adjustable temperature in the range 15–25 K. Our model is both simple and versatile enough that it can be used to derive statistical constraints on the star formation histories and dust contents of large samples of galaxies using a wide range of ultraviolet, optical and infrared observations. We illustrate this by deriving median likelihood estimates of the star formation rates, stellar masses, effective dust optical depths, dust masses and relative strengths of different dust components of 66 well-studied nearby star-forming galaxies from the Spitzer Infrared Nearby Galaxy Survey (SINGS). We explore how the constraints derived in this way depend on the available spectral information. From our analysis of the SINGS sample, we conclude that the mid- and far-infrared colours of galaxies correlate strongly with the specific star formation rate, as well as with other galaxy- wide quantities connected to this parameter, such as the ratio of infrared luminosity between stellar birth clouds and the ambient ISM, the contributions by PAHs and grains in thermal equilibrium to the total infrared emission, and the ratio of dust mass to stellar mass. Our model can be straightforwardly applied to interpret ultraviolet, optical and infrared spectral energy distributions from any galaxy sample. Key words: dust, extinction – galaxies: ISM – galaxies: stellar content – infrared: galaxies. 1 INTRODUCTION The spectral energy distributions (SEDs) of galaxies contain valu- able information about their contents in stars, gas and dust. Direct ultraviolet (UV), optical and near-infrared radiation from stars pro- vides clues on the past star formation history, chemical enrichment and attenuation by dust. Nebular emission lines produced by the gas heated by young stars provide further clues on the current star E-mail: [email protected] formation activity and the physical conditions of the star-forming gas. At wavelengths λ 3 μm, the mid- and far-infrared emission reflects the heating of dust in different components of the interstellar medium (ISM) by stars of all ages. Observations at UV, optical and infrared wavelengths are now becoming available for large samples of galaxies. These include data collected in the UV by the Galaxy Evolution Explorer (GALEX; Martin et al. 2005), in the optical by the Two-degree Field Galaxy Redshift Survey (Colless et al. 2001) and the Sloan Digital Sky Survey (SDSS; Stoughton et al. 2002), in the near-infrared by the Two Micron All Sky Survey (2MASS; Skrutskie et al. 1997), in the mid- and far-infrared by the Infrared C 2008 The Authors. Journal compilation C 2008 RAS at University of Hawaii - Manoa on October 26, 2015 http://mnras.oxfordjournals.org/ Downloaded from
Transcript of A simple model to interpret the ultraviolet, optical and ...08_SEDs-SINGS.pdffar-infrared SEDs of...

Mon. Not. R. Astron. Soc. 388, 1595–1617 (2008) doi:10.1111/j.1365-2966.2008.13535.x
A simple model to interpret the ultraviolet, optical and infrared emission
from galaxies
Elisabete da Cunha,1� Stephane Charlot1 and David Elbaz2
1Institut d’Astrophysique de Paris, CNRS, Universite Pierre & Marie Curie, 98 bis Boulevard Arago, 75014 Paris, France2Laboratoire AIM, CEA/DSM-CNRS-Universite Paris Diderot, DAPNIA/Service d’Astrophysique,CEA Saclay, Orme des Merisiers, 91191 Gif-sur-Yvette Cedex, France
Accepted 2008 June 4. Received 2008 May 30; in original form 2007 December 18
ABSTRACT
We present a simple, largely empirical but physically motivated model to interpret the mid- andfar-infrared spectral energy distributions of galaxies consistently with the emission at ultravi-olet, optical and near-infrared wavelengths. Our model relies on an existing angle-averagedprescription to compute the absorption of starlight by dust in stellar birth clouds and in theambient interstellar medium (ISM) in galaxies. We compute the spectral energy distributionof the power reradiated by dust in stellar birth clouds as the sum of three components: a com-ponent of polycyclic aromatic hydrocarbons (PAHs); a mid-infrared continuum characterizingthe emission from hot grains at temperatures in the range 130–250 K; and a component ofgrains in thermal equilibrium with adjustable temperature in the range 30–60 K. In the ambientISM, we fix for simplicity the relative proportions of these three components to reproducethe spectral shape of diffuse cirrus emission in the Milky Way, and we include a componentof cold grains in thermal equilibrium with adjustable temperature in the range 15–25 K. Ourmodel is both simple and versatile enough that it can be used to derive statistical constraintson the star formation histories and dust contents of large samples of galaxies using a widerange of ultraviolet, optical and infrared observations. We illustrate this by deriving medianlikelihood estimates of the star formation rates, stellar masses, effective dust optical depths,dust masses and relative strengths of different dust components of 66 well-studied nearbystar-forming galaxies from the Spitzer Infrared Nearby Galaxy Survey (SINGS). We explorehow the constraints derived in this way depend on the available spectral information. Fromour analysis of the SINGS sample, we conclude that the mid- and far-infrared colours ofgalaxies correlate strongly with the specific star formation rate, as well as with other galaxy-wide quantities connected to this parameter, such as the ratio of infrared luminosity betweenstellar birth clouds and the ambient ISM, the contributions by PAHs and grains in thermalequilibrium to the total infrared emission, and the ratio of dust mass to stellar mass. Our modelcan be straightforwardly applied to interpret ultraviolet, optical and infrared spectral energydistributions from any galaxy sample.
Key words: dust, extinction – galaxies: ISM – galaxies: stellar content – infrared: galaxies.
1 IN T RO D U C T I O N
The spectral energy distributions (SEDs) of galaxies contain valu-able information about their contents in stars, gas and dust. Directultraviolet (UV), optical and near-infrared radiation from stars pro-vides clues on the past star formation history, chemical enrichmentand attenuation by dust. Nebular emission lines produced by thegas heated by young stars provide further clues on the current star
�E-mail: [email protected]
formation activity and the physical conditions of the star-forminggas. At wavelengths λ � 3 μm, the mid- and far-infrared emissionreflects the heating of dust in different components of the interstellarmedium (ISM) by stars of all ages. Observations at UV, optical andinfrared wavelengths are now becoming available for large samplesof galaxies. These include data collected in the UV by the GalaxyEvolution Explorer (GALEX; Martin et al. 2005), in the optical bythe Two-degree Field Galaxy Redshift Survey (Colless et al. 2001)and the Sloan Digital Sky Survey (SDSS; Stoughton et al. 2002),in the near-infrared by the Two Micron All Sky Survey (2MASS;Skrutskie et al. 1997), in the mid- and far-infrared by the Infrared
C© 2008 The Authors. Journal compilation C© 2008 RAS
at University of H
awaii - M
anoa on October 26, 2015
http://mnras.oxfordjournals.org/
Dow
nloaded from
1596 E. da Cunha, S. Charlot and D. Elbaz
Astronomical Satellite (IRAS; Beichman et al. 1988), the InfraredSpace Observatory (ISO; Kessler et al. 1996) and the Spitzer SpaceTelescope (Werner et al. 2004), and in the submillimetre by the Sub-millimetre Common User Bolometer Array (SCUBA) on the JamesClerk Maxwell Telescope (Holland et al. 1999). Extracting con-straints on the stellar populations and ISM of galaxies from thesemultiwavelength observations requires the consistent modelling ofthe emission by stars, gas and dust.
A standard approach to model consistently the emission fromstars and dust in galaxies has been to solve the radiative trans-fer equation for idealized (bulge + disc) spatial distributions ofstars and dust (e.g. Rowan-Robinson 1980; Efstathiou & Rowan-Robinson 1990; Popescu et al. 2000; Gordon et al. 2001; Misiriotiset al. 2001; Misselt et al. 2001). Early models of this type did notinclude the evolution of stellar populations. Silva et al. (1998) werethe first to couple radiative transfer through a dusty ISM and thespectral (and even chemical) evolution of stellar populations. Theirmodel also accounts for the fact that stars are born in dense molec-ular clouds, which dissipate after some time, and hence, that newlyborn stars are more attenuated than older stars (see also, e.g. Charlot& Fall 2000; Tuffs et al. 2004). This type of sophisticated modelis useful to interpret in detail the emission from individual galaxiesin terms of constraints on stellar populations and the spatial distri-bution and physical properties of the dust. However, because of thecomplexity of radiative transfer computations, it is not optimized toderive statistical constraints from observations of large samples ofgalaxies.
A more recent model of starburst galaxies by Dopita et al. (2005,see also Groves et al. 2007) incorporates the consistent treatment ofthe spectral evolution of stellar populations, the dynamic expansionof H II regions and radiative transfer of starlight through gas anddust. The authors of this model provide a simple parametrization ofthe UV, optical and infrared spectra of starburst galaxies by addingthe spectra of different types of compact H II regions and their sur-rounding photodissociation regions (PDRs). This model provides afast and flexible tool to interpret starburst galaxy spectra in termsof the physical parameters of star-forming regions. However, it isnot designed to be applicable to more quiescent galaxies, in whicholder stellar populations dominate the emission.
In parallel to these theoretical studies, observations by IRAS andISO have motivated the development of simple, empirically cal-ibrated spectral libraries to interpret the infrared emission fromgalaxies at wavelengths between 3 and 1000 μm. For example,Chary & Elbaz (2001) and Dale & Helou (2002) both present single-parameter families of infrared spectra to relate an observed SED toeither the total infrared luminosity of a galaxy or the intensity ofthe interstellar radiation field heating the dust. These libraries canbe applied easily to the interpretation of large galaxy samples. Theyhave proved useful to characterize the infrared emission from ob-served galaxies and to investigate the origin of the cosmic infraredbackground (e.g. Chary & Elbaz 2001; Franceschini et al. 2001;Elbaz et al. 2002; Lagache, Dole & Puget 2003; Lagache et al.2004; Dale et al. 2005; Marcillac et al. 2006). A disadvantage ofthis approach is that it does not relate consistently the infrared emis-sion of the dust to the emission from stellar populations. Anotherpotential limitation is that most existing spectral libraries were cal-ibrated using local galaxy samples, and hence, they may not beapplicable to studies of the infrared emission from galaxies at allredshifts (e.g. Pope et al. 2006; Zheng et al. 2007).
In this paper, we present a simple, largely empirical but physi-cally motivated model to interpret the mid- and far-infrared SEDsof galaxies consistently with the emission at UV, optical and near-
infrared wavelengths. We compute the spectral evolution of stellarpopulations using the Bruzual & Charlot (2003) population syn-thesis code. To describe the attenuation of starlight by dust, weappeal to the two-component model of Charlot & Fall (2000).This has been shown to account for the observed relations be-tween the UV and optical (line and continuum) spectra and thetotal infrared luminosities of galaxies in wide ranges of star for-mation activity and dust content (Brinchmann et al. 2004; Konget al. 2004). We use this model to compute the luminosity absorbedand re-emitted by dust in stellar birth clouds (i.e. giant molecu-lar clouds) and in the ambient (i.e. diffuse) ISM in galaxies. Wethen distribute this luminosity in wavelength to compute infraredspectral energy distributions. We describe the infrared emissionfrom stellar birth clouds as the sum of three components: a compo-nent of polycyclic aromatic hydrocarbons (PAHs); a mid-infraredcontinuum characterizing the emission from hot grains at tem-peratures in the range 130–250 K; and a component of grains inthermal equilibrium with adjustable temperature in the range 30–60 K. In the ambient ISM, we fix for simplicity the relative pro-portions of these three components to reproduce the spectral shapeof diffuse cirrus emission in the Milky Way, and we include acomponent of cold grains in thermal equilibrium with adjustabletemperature in the range 15–25 K.
This simple but versatile model allows us to derive statisticalestimates of physical parameters such as star formation rate, stellarmass, dust content and dust properties, from combined UV, opticaland infrared galaxy spectra. To achieve this, we adopt a Bayesianapproach similar to that successfully employed by e.g. Kauffmannet al. (2003), Brinchmann et al. (2004), Gallazzi et al. (2005) andSalim et al. (2007) to interpret UV, optical and near-infrared galaxyspectra using only the Bruzual & Charlot (2003) and Charlot &Fall (2000) models. As an example, we derive median likelihoodestimates of a set of physical parameters describing the stellar anddust contents of 66 star-forming galaxies from the Spitzer InfraredNearby Galaxy Survey (SINGS; Kennicutt et al. 2003). Our modelreproduces well the observed SEDs of these galaxies across theentire wavelength range from the far-UV (FUV) to the far-infrared,and the star formation histories and dust contents of the galaxiesare well constrained. We explore how the constraints derived inthis way depend on the available spectral information. From ouranalysis of the SINGS sample, we conclude that the mid- and far-infrared colours of galaxies are tightly related to the specific starformation rate and to other galaxy-wide properties connected to thisparameter.
We present our model of the combined UV, optical and infraredSEDs of galaxies in Section 2. In Section 3, we first describe ourapproach to derive statistical constraints on galaxy physical parame-ters from multiwavelength observations. Then, we use this approachto interpret observations of the SINGS galaxy sample taken withGALEX, 2MASS, Spitzer, ISO, IRAS and SCUBA. We compare ourresults to those that would be obtained using previous prescriptionsof the infrared emission from galaxies. We also discuss potentialsources of systematic errors. Section 4 summarizes our conclusions.
2 TH E MO D EL
In this section, we describe our model to compute the mid- andfar-infrared SEDs of galaxies consistently with the emission at UV,optical and near-infrared wavelengths. In Section 2.1, we first brieflyreview the stellar population synthesis code and the two-componentdust model used to compute the emission of starlight and its trans-fer through the ISM in galaxies. Then, in Section 2.2, we present
C© 2008 The Authors. Journal compilation C© 2008 RAS, MNRAS 388, 1595–1617
at University of H
awaii - M
anoa on October 26, 2015
http://mnras.oxfordjournals.org/
Dow
nloaded from

A simple model to interpret galaxy spectra 1597
our model to compute the SED of the infrared emission from dust.We calibrate this model using a sample of 107 nearby star-forminggalaxies observed by IRAS and ISO. In Section 2.3, we show exam-ples of combined UV, optical and infrared SEDs of different typesof star-forming galaxies.
2.1 Stellar emission and attenuation by dust
We use the latest version of the Bruzual & Charlot (2003) stellarpopulation synthesis code to compute the light produced by stars ingalaxies. This code predicts the spectral evolution of stellar popu-lations at wavelengths from 91 Å to 160 μm and at ages between1 × 105 and 2 × 10¹⁰ yr, for different metallicities, initial massfunctions (IMFs) and star formation histories. We use the most re-cent version of the code, which incorporates a new prescription byMarigo & Girardi (2007) for the thermally pulsating asymptoticgiant branch (TP-AGB) evolution of low- and intermediate-massstars. The main effect of this prescription is to improve the pre-dicted near-infrared colours of intermediate-age stellar populations(Bruzual 2007; see also Charlot & Bruzual, in preparation). In allapplications throughout this paper, we adopt the Galactic disc IMFof Chabrier (2003).
We compute the attenuation of starlight by dust using the simple,angle-averaged model of Charlot & Fall (2000). This accounts forthe fact that stars are born in dense molecular clouds, which dissipatetypically on a time-scale t0 ∼ 107 yr. Thus the emission fromstars younger than t0 is more attenuated than that from older stars.Following Charlot & Fall (2000), we express the luminosity per unitwavelength emerging at time t from a galaxy as
Lλ(t) =∫ t
0dt ′ψ(t − t ′) Sλ(t ′) e−τλ(t ′), (1)
where ψ(t − t′) is the star formation rate at time t − t′, Sλ(t′) is theluminosity per unit wavelength per unit mass emitted by a stellargeneration of age t′ and τλ(t ′) is the ‘effective’ absorption opticaldepth of the dust seen by stars of age t′ (i.e. averaged over photonsemitted in all directions by stars in all locations within the galaxy).The time dependence of τλ reflects the different attenuation affectingyoung and old stars in galaxies:
τλ(t ′) ={
τ BCλ + τ ISM
λ for t ′ ≤ t0,
τ ISMλ for t ′ > t0.
(2)
Here τ BCλ is the effective absorption optical depth of the dust in
stellar birth clouds and τ ISMλ is that in the ambient ISM. We also
adopt the prescription of Charlot & Fall (2000) to compute theemergent luminosities LHα(t) and LHβ (t) of the Hα (λ = 6563 Å)and Hβ (λ = 4861 Å) Balmer lines of hydrogen produced by stars inthe birth clouds. This assumes case B recombination and includesthe possible absorption of ionizing photons by dust before theyionize hydrogen.
The shape of the effective absorption curve depends on the com-bination of the optical properties and spatial distribution of the dust.We adopt the following dependence of τ BC
λ and τ ISMλ on wavelength:
τ BCλ = (1 − μ)τV (λ/5500 Å)−1.3, (3)
τ ISMλ = μτV (λ/5500 Å)−0.7, (4)
where τV is the total effective V-band absorption optical depthof the dust seen by young stars inside birth clouds, and μ =τ ISMV /(τ BC
V + τ ISMV ) is the fraction of this contributed by dust in the
ambient ISM. The dependence of τ ISMλ on λ−0.7 is well constrained
by the observed relation between ratio of far-infrared to UV lu-minosity and UV spectral slope for nearby starburst galaxies (seeCharlot & Fall 2000). The dependence of τ BC
λ on wavelength is lessconstrained by these observations, because stellar birth clouds tendto be optically thick, and hence, stars in these clouds contribute verylittle to the emergent radiation (except in the emission lines). Forsimplicity, Charlot & Fall (2000) adopt τ BC
λ ∝ λ−0.7 by analogy withτ ISMλ . We adopt here a slightly steeper dependence, τ BC
λ ∝ λ−1.3
(equation 3), which corresponds to the middle range of the opticalproperties of dust grains between the Milky Way, the Large and theSmall Magellanic Clouds (see section 4 of Charlot & Fall 2000).This choice is motivated by the fact that giant molecular clouds canbe assimilated to foreground shells when attenuating the light fromnewly born stars. In this case, the effective absorption curve shouldreflect the actual optical properties of dust grains. We emphasizethat the dependence of τ BC
λ on wavelength has a negligible influenceon the emergent UV and optical continuum radiation. It affectsmainly the attenuation of emission lines in galaxies with largeτ BCV /τ ISM
V and hence small μ (Section 3.4.2 below; see also Wildet al. 2007).
The fraction of stellar radiation absorbed by dust in the stellarbirth clouds and in the ambient ISM is reradiated in the infrared.We write the total luminosity absorbed and reradiated by dust as thesum
L totd (t) = LBC
d (t) + L ISMd (t), (5)
where
LBCd (t) =
∫ ∞
0dλ
(1 − e−τBC
λ
) ∫ t0
0dt ′ψ(t − t ′)Sλ(t ′) (6)
is the total infrared luminosity contributed by dust in the birthclouds, and
L ISMd (t) =
∫ ∞
0dλ
(1 − e−τ ISM
λ
) ∫ t
t0
dt ′ψ(t − t ′)Sλ(t ′) (7)
is the total infrared luminosity contributed by dust in the ambientISM. For some purposes, it is also convenient to define the fractionof the total infrared luminosity contributed by the dust in the ambientISM:
fμ(t) ≡ L ISMd (t)/L tot
d (t). (8)
This depends on the total effective V-band absorption optical depthof the dust, τV , the fraction μ of this contributed by dust in theambient ISM, and the star formation history (and IMF) determiningthe relative proportion of young and old stars in the galaxy.
2.2 Infrared emission of the dust
We now present a simple but physically motivated prescriptionto compute the spectral distribution of the energy reradiated bydust in the infrared (i.e. the distribution in wavelength of L BC
d andL ISM
d ). By construction, the infrared emission computed in thisway can be related to the emission at shorter wavelengths usingequations (1)–(7) above.
2.2.1 Components of infrared emission
The infrared emission from galaxies is generally attributed to threemain constituents of interstellar dust: PAHs, which produce strongemission features at wavelengths between 3 and 20 μm; ‘very smallgrains’ (with sizes typically less than 0.01 μm), which are stochas-tically heated to high temperatures by the absorption of single UV
C© 2008 The Authors. Journal compilation C© 2008 RAS, MNRAS 388, 1595–1617
at University of H
awaii - M
anoa on October 26, 2015
http://mnras.oxfordjournals.org/
Dow
nloaded from

1598 E. da Cunha, S. Charlot and D. Elbaz
photons; and ‘big grains’ (with sizes typically between 0.01 and0.25 μm), which are in thermal equilibrium with the radiation field.This picture arises from detailed models of the sizes and opticalproperties of dust grains and PAH molecules in the ISM of theMilky Way and other nearby galaxies (e.g. Mathis, Rumpl & Nord-sieck 1977; Draine & Lee 1984; Leger & Puget 1984). Here, webuild on the results from these studies to describe the different com-ponents of infrared emission in galaxies, without modelling in detailthe physical properties of dust grains. As mentioned in Section 1,the motivation for this approach is to build a model simple enoughto derive statistical constraints on the star formation and dust prop-erties of large samples of observed galaxies, based on consistent fitsof the UV, optical and infrared emission. We describe the differentcomponents of infrared emission in our model as follows.
(i) PAH and near-infrared continuum emission. The mid-infraredspectra of most normal star-forming galaxies are dominated bystrong emission features at 3.3, 6.2, 7.7, 8.6, 11.3 and 12.7 μm.Although still uncertain, the carriers of these features are gen-erally accepted to be PAH molecules transiently excited to highinternal energy levels after the absorption of single UV pho-tons (Leger & Puget 1984; Allamandola, Tielens & Barker 1985;Leger, D’Hendecourt & Defourneau 1989; Allamandola, Hudgins &Sandford 1999). PAH emission tends to peak in the ‘photodissoci-ation regions’ at the interface between ionized and molecular gasin the outskirts of H II regions, where PAH molecules can surviveand transient heating is most efficient (e.g. Cesarsky et al. 1996;Verstraete et al. 1996; Rapacioli, Joblin & Boissel 2005). In theseenvironments, the non-ionizing UV radiation from young stars dom-inates the energy balance and can dissociate molecules such as H2
and CO (see Hollenbach & Tielens 1997 for a review).Observations with ISO/ISOPHOT of the mid-infrared spectra of
45 nearby, normal star-forming galaxies do not reveal any strongvariation of the PAH emission spectrum with galaxy properties suchas infrared colours and infrared-to-blue luminosity ratio (Helouet al. 2000). For simplicity, we adopt a fixed template spectrum todescribe PAH emission in our model.1 We use the mid-infrared spec-trum of the PDR in the prototypical Galactic star-forming regionM17 SW extracted from the ISO/ISOCAM observations of Cesarskyet al. (1996) by Madden et al. (2006). The observed spectrum doesnot extend blueward of 5 μm. We extend it to include the 3.3-μmPAH emission feature using the Lorentzian profile parametrized byVerstraete et al. (2001), FLorentz
ν = f 0 [1 + (x − x0)2/σ 2]−1, wherex = 1/λ is the wavenumber, x0 = 3039.1 cm−1 the central wavenum-ber of the feature and σ = 19.4 cm−1 half the FWHM. We set theamplitude f0 so that the luminosity of the 3.3-μm emission feature is10 per cent of that of the 11.3-μm feature (the relative ratio found byLi & Draine 2001 for neutral PAHs). We write the spectral energydistribution of PAHs in our model as
lPAHλ = LM17
λ
(∫ ∞
0dλ LM17
λ
)−1
, (9)
where LM17λ is the adopted M17 spectral template, and lPAH
λ is nor-malized to unit total energy.
The above ISO/ISOPHOT observations of a sample of 45 nor-mal star-forming galaxies also reveal a component of near-infrared
1 In reality, changes in PAH molecule size and ionization state, variationsin metallicity and contamination by an active galactic nucleus (AGN) couldcause variations of up to 40 per cent in the relative strengths of some PAHemission features (Helou et al. 2000; Brandl et al. 2006; Galliano, Dwek &Chanial 2008; Smith et al. 2007). We ignore this refinement here.
continuum emission characterized by a very high colour tem-perature (∼1000 K) at wavelengths between 3 and 5 μm (Luet al. 2003). This component accounts typically for at most a fewper cent of the total infrared luminosity, but it contributes sig-nificantly to the observed Spitzer/IRAC band fluxes at 3.6 and4.5 μm. It is also present in the spectra of reflection nebulae(Sellgren, Werner & Dinerstein 1983) and in the diffuse cirrusemission of the Milky Way (Dwek et al. 1997; Flagey et al. 2006).The origin of this emission is still uncertain, and it could be re-lated to the stochastic heating of PAH molecules or carbon grains(e.g. Flagey et al. 2006). Lu et al. (2003) find that the strengthof this emission correlates well with that of PAH features in thespectra of the galaxies in their sample. In particular, the ratio ofthe continuum flux density at 4 μm to the mean flux density of the7.7-μm PAH feature has a roughly constant value of 0.11.
To implement this component of near-infrared continuum emis-sion associated to PAH emission in our model, we use a greybody(i.e. modified blackbody) function of the form (e.g. Hildebrand1983)
lTdλ = κλ Bλ(Td)
[∫ ∞
0dλ κλ Bλ(Td)
]−1
, (10)
where Bλ(Td) is the Planck function of temperature Td, κλ is the dustmass absorption coefficient and l
Tdλ is normalized to unit total energy.
The dust mass absorption coefficient is usually approximated by asingle power law of the form
κλ ∝ λ−β, (11)
where β is the dust emissivity index. Models and observations ofinfrared to submillimetre dust emission and laboratory studies ofcarbonaceous and amorphous silicate grains suggest values of β
in the range 1 � β � 2, with some dependence on grain sizeand temperature (Andriesse 1974; Hildebrand 1983; Draine & Lee1984; Reach et al. 1995; Agladze et al. 1996; Boulanger et al.1996; Mennella et al. 1998; see also section 3.4 of Dunne & Eales2001 and section 4 of Dale & Helou 2002 for discussions on theconstraints on β). Typically, these studies favour β ≈ 1 for smallcarbonaceous grains, which radiate most of their energy at mid-infrared wavelengths, and β ≈ 1.5–2 for big silicate grains, whichreach lower temperatures and radiate most of their energy at far-infrared and submillimetre wavelengths. We therefore adopt β =1 in equation (11) to compute the near-infrared continuum emis-sion in our model. We scale this emission so that the continuumflux density at 4 μm be 0.11 times the mean flux density of the7.7-μm PAH feature (see above). We find that a temperature Td =850 K provides optimal fits to the observed SEDs of galaxies atwavelengths between 3 and 5 μm (see e.g. Fig. 1).
(ii) Mid-infrared continuum emission from hot dust. In additionto PAH features, the mid-infrared spectra of star-forming galax-ies (out to wavelengths λ ∼ 40 μm) also include a component ofsmooth continuum emission. This component is generally attributedto a continuous distribution of small grains with very low heat ca-pacity, which are stochastically heated to high temperatures by theabsorption of single UV photons (e.g. Sellgren 1984). The accuratemodelling of this emission would require the computation of tem-perature fluctuations of grains of different sizes and optical proper-ties caused by the absorption of UV photons in different interstellarradiation fields (e.g. Purcell 1976; Aannestad & Kenyon 1979). Forsimplicity, in our model, we describe the ‘hot’ mid-infrared con-tinuum emission as the sum of two greybodies (equation 10) oftemperatures Td = 130 and 250 K, with equal contributions to the
C© 2008 The Authors. Journal compilation C© 2008 RAS, MNRAS 388, 1595–1617
at University of H
awaii - M
anoa on October 26, 2015
http://mnras.oxfordjournals.org/
Dow
nloaded from

A simple model to interpret galaxy spectra 1599
Figure 1. Best model fit (in black) to the observed mean spectral energy distribution of the Galactic cirrus emission. The model was computed usingequation (15) and the parameters listed in equation (17). The red filled squares are the COBE/DIRBE observations of Dwek et al. (1997). Also shown forreference are the Spitzer/IRAC observations of Flagey et al. (2006, red open squares) and the COBE/FIRAS observations of Dwek et al. (1997, green line).The blue lines show the decomposition of the model in its different components (see Section 2.2): near-infrared continuum (dotted); PAHs (short-dashed); hotmid-infrared continuum (long-dashed) and warm and cold grains in thermal equilibrium (solid). The fit residuals (Lobs
λ − Lmodλ )/Lobs
λ , where Lobsλ and Lmod
λ arethe observed and model fluxes in a given photometric band, are shown at the bottom.
total infrared luminosity,
l MIRλ = (
l250λ + l130
λ
) [∫ ∞
0dλ
(l250λ + l130
λ
)]−1
. (12)
We find that these two temperatures reproduce in an optimal way therange of infrared colours of star-forming galaxies (see Section 2.2.2below).
(iii) Emission from grains in thermal equilibrium. At far-infraredwavelengths, the emission from galaxies is generally dominated bydust grains in thermal equilibrium at low temperatures. The graintemperatures depend sensitively on the intensity of the interstellarradiation field. This is why the peak of the far-infrared SED of agalaxy is a good indicator of dust heating in the ISM.
We consider two types of grains in thermal equilibrium in ourmodel: warm grains, which can reside both in stellar birth cloudsand in the ambient ISM, with characteristic temperatures T BC
W andT ISM
W , respectively; and cold grains, which can reside only in theambient ISM, with characteristic temperature T ISM
C . To account forthe observed dispersion in the peak of the far-infrared emissionof galaxies with different star formation activities, we allow thewarm-grain temperature to vary between 30 and 60 K and the cold-grain temperature to vary between 15 and 25 K. We describe theemission from grains in thermal equilibrium using greybody spectra(equation 10) with emissivity index β = 1.5 for warm dust andβ = 2.0 for cold dust (equation 11).
In summary, the infrared SED of stellar birth clouds in our modelcan be written as
LBCλ,d =
(ξ BC
PAH lPAHλ + ξ BC
MIR l MIRλ + ξ BC
W lT BC
Wλ
)(1 − fμ)L tot
d , (13)
where L totd is the total infrared luminosity reradiated by dust (equa-
tion 5), f μ is the fraction of this contributed by the ambient ISM
(equation 8), lPAHλ , l MIR
λ and lT BC
Wλ are computed using equations (9),
(12) and (10), and ξ BCPAH, ξ BC
MIR and ξ BCW are the relative contributions
by PAHs, the hot mid-infrared continuum and grains in thermalequilibrium to the total infrared luminosity of the birth clouds.These satisfy the condition
ξ BCPAH + ξ BC
MIR + ξ BCW = 1. (14)
Similarly, the infrared SED of the ambient ISM can be written as
L ISMλ,d =
(ξ ISM
PAH l PAHλ + ξ ISM
MIR l MIRλ + ξ ISM
W lT ISM
Wλ
+ ξ ISMC l
T ISMC
λ
)fμL tot
d , (15)
where l PAHλ , l MIR
λ , lT ISM
Wλ and l
T ISMC
λ are computed using equations (9),(12) and (10), and ξ ISM
PAH, ξ ISMMIR, ξ ISM
W and ξ ISMC are the relative con-
tributions by PAHs, the hot mid-infrared continuum and warm andcold grains in thermal equilibrium to the total infrared luminosityof the ISM. These satisfy the condition
ξ ISMPAH + ξ ISM
MIR + ξ ISMW + ξ ISM
C = 1. (16)
In practice, we can fix the shape of the mid-infrared SED ofthe ambient ISM in our model to keep the number of adjustableparameters as small as possible. This is justified by the fact thatthe intensity of the average radiation field heating dust in the dif-fuse ISM of normal galaxies is roughly constant (e.g. Helou 1986).Moreover, sophisticated models of dust emission by Li & Draine(2001) and Draine & Li (2007) suggest that even large variations
C© 2008 The Authors. Journal compilation C© 2008 RAS, MNRAS 388, 1595–1617
at University of H
awaii - M
anoa on October 26, 2015
http://mnras.oxfordjournals.org/
Dow
nloaded from

1600 E. da Cunha, S. Charlot and D. Elbaz
of the intensity of the interstellar radiation field have only a smallinfluence on the overall shape of the diffuse mid-infrared SED.In these conditions, we can appeal for example to observations ofhigh Galactic latitude (cirrus) dust emission in the Milky Way toconstrain the mid-infrared SED of the ambient ISM in our model.In Fig. 1, we show the model spectral energy distribution L ISM
λ,d
(in black) computed using equation (15) that best fits the meanGalactic cirrus emission observed by the Cosmic Background Ex-plorer/Diffuse Infrared Background Experiment (COBE/DIRBE) atwavelengths between 3.5 and 240 μm (Dwek et al. 1997). The bluelines show the different components of the best-fitting model, withparameters
ξ ISMPAH = 0.22,
ξ ISMMIR = 0.11,
ξ ISMW = 0.07,
ξ ISMC = 0.60,
T ISMW = 45 K,
T ISMC = 18 K. (17)
For reference, we include in Fig. 1 additional observations of themean Galactic cirrus emission obtained with Spitzer/IRAC at wave-lengths 3.6, 4.5, 5.8 and 8.0 μm (Flagey et al. 2006) and with theCOBE/Far-Infrared Absolute Spectrophotometer (FIRAS) at wave-lengths between 140 and 1000 μm (Dwek et al. 1997). The modelreproduces these observations remarkably well, even though theywere not included in the fit.
We use the constraints of Fig. 1 to fix the mid-infrared SED of theambient ISM and reduce the number of adjustable parameters in ourmodel. Specifically, we fix the relative contributions by PAHs, thehot mid-infrared continuum and warm grains in thermal equilibriumto the total infrared luminosity of the ambient ISM (i.e. the relativeratios of ξ ISM
PAH, ξ ISMMIR and ξ ISM
W ) to their values of equation (17),and we keep ξ ISM
C and T ISMC as adjustable parameters. Thus, for a
given contribution ξ ISMC by cold grains in thermal equilibrium to the
total infrared luminosity of the ambient ISM, the contributions byPAHs, the hot mid-infrared continuum and warm grains in thermalequilibrium are ξ ISM
PAH = 0.550(1 − ξ ISMC ), ξ ISM
MIR = 0.275 (1 − ξ ISMC )
and ξ ISMW = 0.175(1 − ξ ISM
C ), respectively.The total spectral energy distribution of a galaxy in our model is
computed as the sum
L totλ,d = LBC
λ,d + L ISMλ,d , (18)
where L BCλ,d and L ISM
λ,d are given by equations (13) and (15). For somepurposes, it is also convenient to define the global contribution bya specific dust component, including stellar birth clouds and theambient ISM, to the total infrared luminosity of a galaxy. This canbe written as
ξ totPAH = ξ BC
PAH (1 − fμ) + 0.550(1 − ξ ISM
C
)fμ, (19)
ξ totMIR = ξ BC
MIR (1 − fμ) + 0.275(1 − ξ ISM
C
)fμ, (20)
ξ totW = ξ BC
W (1 − fμ) + 0.175(1 − ξ ISM
C
)fμ, (21)
ξ totC = ξ ISM
C fμ, (22)
for PAHs, the hot mid-infrared continuum and warm and cold dustin thermal equilibrium, respectively.
We compute luminosity densities in any filter from L totλ,d using the
general formula
Lλ0ν = Cν0
∫dν ν−1 Lν Rν∫dν ν−1 Cν Rν
= λ20
cCλ0
∫dλ Lλ λ Rλ∫dλ Cλ λ Rλ
, (23)
where
λ0 =∫
dλ λ Rλ∫dλ Rλ
(24)
is the effective wavelength of the filter of response Rλ(Rν), and thecalibration spectrum Cλ(Cν) depends on the photometric system.For the AB system, Cν is fixed at 3631 Jy, implying Cλ ∝ λ−2 (Oke& Gunn 1983). For the IRAS, ISO/ISOCAM and Spitzer/IRAC pho-tometric systems, the convention is to use νCν = λCλ = constant,and hence, Cλ ∝ λ−1 (see Beichman et al. 1988; Blommaert et al.2003; Reach et al. 2005, and also the IRAC Data Handbook2). TheSpitzer/MIPS system was calibrated using a blackbody spectrum oftemperature 10 000 K, such that Cλ = Bλ(10 000 K) (MIPS DataHandbook3). In Fig. 2, we show an example of infrared spectralenergy distribution L tot
λ,d computed using our model, for parametervalues typical of normal star-forming galaxies (equation 25 below).As we shall see in Section 2.2.2, this parametrization of infraredgalaxy spectra allows us to account for the full range of observedcolours of star-forming galaxies.
2.2.2 Comparison with observed infrared colours
To test how well our model can reproduce the observed infraredcolours of galaxies in a wide range of star formation histories,we appeal to a sample of 157 nearby galaxies compiled by Elbazet al. (2002), for which IRAS and ISO/ISOCAM observations areavailable from Boselli et al. (1998), Roussel et al. (2001), Laurentet al. (2000) and Dale et al. (2000). The galaxies in this samplespan wide ranges of morphologies, absolute infrared luminosities,infrared-to-blue luminosity ratios and infrared colours (see Elbazet al. 2002 for more detail). For nearby galaxies, the flux densitycollected by the ISOCAM LW2 (6.75 μm) filter, F6.75
ν tends to bedominated by the PAH emission features at 6.2, 7.7 and 8.6 μm. TheIRAS 12-μm flux density F12
ν captures the PAH emission at 11.3 and12.7 μm and the mid-infrared continuum emission from hot dust.The ISOCAM LW3 (15 μm) and the IRAS 25-μm flux densities,F15
ν and F25ν , reflect primarily the mid-infrared continuum emission
from hot dust. At longer wavelengths, the IRAS 60-μm flux densityF60
ν samples the emission from warm grains in thermal equilibriumin star-forming clouds, and the IRAS 100-μm flux density F100
ν thatfrom colder grains in thermal equilibrium in the ambient ISM. Totest our model, we require photometric observations in all thesefilters. This reduces the sample to 107 galaxies. For the purposeof comparisons between our (angle-averaged) model and observa-tions, we neglect possible anisotropies and equate flux ratios at allwavelengths to the corresponding luminosity ratios.
In Figs 3 and 4, we show the locations of these galaxies in vari-ous infrared colour–colour diagrams (black crosses). Fig. 3 showsL60
ν /L100ν as a function of L12
ν /L25ν (IRAS colours), while Fig. 4 shows
L15ν /L60
ν as a function of L6.75ν /L15
ν (ISO colours). The well-knowncorrelations between the different infrared colours of galaxies illus-trated by Figs 3 and 4 suggest that the different contributors to thetotal infrared emission are related to one another. These relations aregenerally interpreted as sequences in the overall star formation ac-tivity and dust heating (e.g. Helou 1986; Dale et al. 2001). Quiescentstar-forming galaxies with strong PAH emission and cool ambientISM dust tend to have high L12
ν /L25ν , L6.75
ν /L15ν and L15
ν /L60ν and low
L60ν /L100
ν . In contrast, actively star-forming galaxies, in which the
2 http://ssc.spitzer.caltech.edu/irac/dh/.3 http://ssc.spitzer.caltech.edu/mips/dh/.
C© 2008 The Authors. Journal compilation C© 2008 RAS, MNRAS 388, 1595–1617
at University of H
awaii - M
anoa on October 26, 2015
http://mnras.oxfordjournals.org/
Dow
nloaded from

A simple model to interpret galaxy spectra 1601
Figure 2. Example of infrared spectral energy distribution computed using the model presented in Section 2.2.1, for ‘standard’ values of the parameters(equation 25): f μ = 0.6, ξ BC
PAH = 0.05, ξ BCMIR = 0.15, ξ BC
W = 0.80, T BCW = 48 K, ξ ISM
C = 0.8 and T ISMC = 22 K. The black curve shows the total infrared spectrum.
The green solid curve shows the contribution by dust in the stellar birth clouds, and the green dashed curves the breakdown of this contribution in differentcomponents: PAHs, hot mid-infrared continuum and warm dust in thermal equilibrium. The red curve shows the contribution by dust in the ambient ISM. Thetotal luminosity is L tot
d = 1010 L (equations 13, 15 and 18).
mid-infrared emission is dominated by continuum radiation by hotdust and the far-infrared emission by warm dust in star-formingregions, tend to have low L12
ν /L25ν , L6.75
ν /L15ν and L15
ν /L60ν and high
L60ν /L100
ν .We now use these observations to explore the influence of each
parameter of our model on the various infrared colours. We explorethe effect of varying a single parameter at a time, keeping all theother parameters fixed at ‘standard’ values. After some experimenta-tion, we adopted the following standard parameters (correspondingto the model shown in Fig. 2):
fμ = 0.60,
ξ BCPAH = 0.05,
ξ BCMIR = 0.15,
ξ BCW = 0.80,
ξ ISMC = 0.80,
T BCW = 48 K,
T ISMC = 22 K. (25)
These values allow the standard model to match roughly the ob-served typical (i.e. median) infrared colours of nearby star-forminggalaxies in Figs 3 and 4 (green circle). Each panel of Figs 3 and4 shows the effect of varying one parameter of the model, withthe other parameters held fixed at their standard values.4 We cansummarize the role of each parameter as follows.
Fraction of total infrared luminosity contributed by dust in theambient ISM. The dominant effect of increasing f μ is to increase the
4 In practice, an increase in any of ξ BCPAH, ξ BC
MIR and ξ BCW will be accompa-
nied by a drop in the other two fractions by virtue of equation (14). Like-wise, an increase in ξ ISM
C implies a drop in the sum ξ ISMPAH + ξ ISM
MIR + ξ ISMW
(equation 16). When exploring such variations, we keep the relative ratiosof the unexplored fractions fixed.
contribution to the total infrared luminosity by cold dust. This raisesthe infrared luminosity around 100 μm (Fig. 2), causing L60
ν /L100ν
and even L15ν /L60
ν to decrease (Figs 3a and 4a). In addition, a largerf μ leads to an increase in L12
ν /L25ν and L6.75
ν /L15ν , due to the increased
contribution by PAH emission features (which dominate the mid-infrared emission of the ISM) to the total mid-infrared emission.
Contribution by cold dust in thermal equilibrium to the infraredemission from the ambient ISM. Increasing ξ ISM
C causes L12ν /L25
ν
and L6.75ν /L15
ν to decrease in Figs 3(b) and 4(b), because of thecorresponding drop in PAH emission from the ambient ISM (seefootnote 4). Also, both L15
ν /L60ν and L60
ν /L100ν decrease because of
the larger contribution by cold dust to the 60-μm flux, and evenmore so to the 100-μm flux.
Contribution by PAHs to the infrared emission from stellar birthclouds. Increasing ξ BC
PAH raises the contribution by PAH featuresto L6.75
ν and L12ν , and to a lesser extent L15
ν (Fig. 2). This leads toa marked increase in L6.75
ν /L15ν and L12
ν /L25ν and a milder one in
L15ν /L60
ν in Figs 3(c) and 4(c). The slight decrease in L60ν /L100
ν whenξ BC
PAH increases in Fig. 3(c) is caused by the associated drop in ξ BCBG
(footnote 4).Contribution by the hot mid-infrared continuum to the infrared
emission from stellar birth clouds. The main effect of increasingξ BC
MIR is to make L15ν and L25
ν larger (Fig. 2). This causes a drop inL12
ν /L25ν and L6.75
ν /L15ν , while L15
ν /L60ν increases (Figs 3d and 4d).
The slight decrease in L60ν /L100
ν when ξ BCMIR increases in Fig. 3(c) is
again caused by the associated drop in ξ BCBG (footnote 4).
Contribution by warm dust in thermal equilibrium to the infraredemission from stellar birth clouds. Increasing ξ BC
W makes L60ν larger,
and to a lesser extent also L25ν and L100
ν (Fig. 2). Remarkably, thiscauses L12
ν /L25ν to drop and L60
ν /L100ν to rise in Fig. 3(e), almost along
the observational relation. In Fig. 4(e), an increase in ξ BCW makes
L15ν smaller (because of the associated drop in ξ BC
MIR; see footnote 4),and hence, L15
ν /L60ν smaller and L6.75
ν /L15ν larger.
Equilibrium temperature of warm dust in stellar birth clouds.Increasing T BC
W across the range from 30 to 60 K moves the
C© 2008 The Authors. Journal compilation C© 2008 RAS, MNRAS 388, 1595–1617
at University of H
awaii - M
anoa on October 26, 2015
http://mnras.oxfordjournals.org/
Dow
nloaded from

1602 E. da Cunha, S. Charlot and D. Elbaz
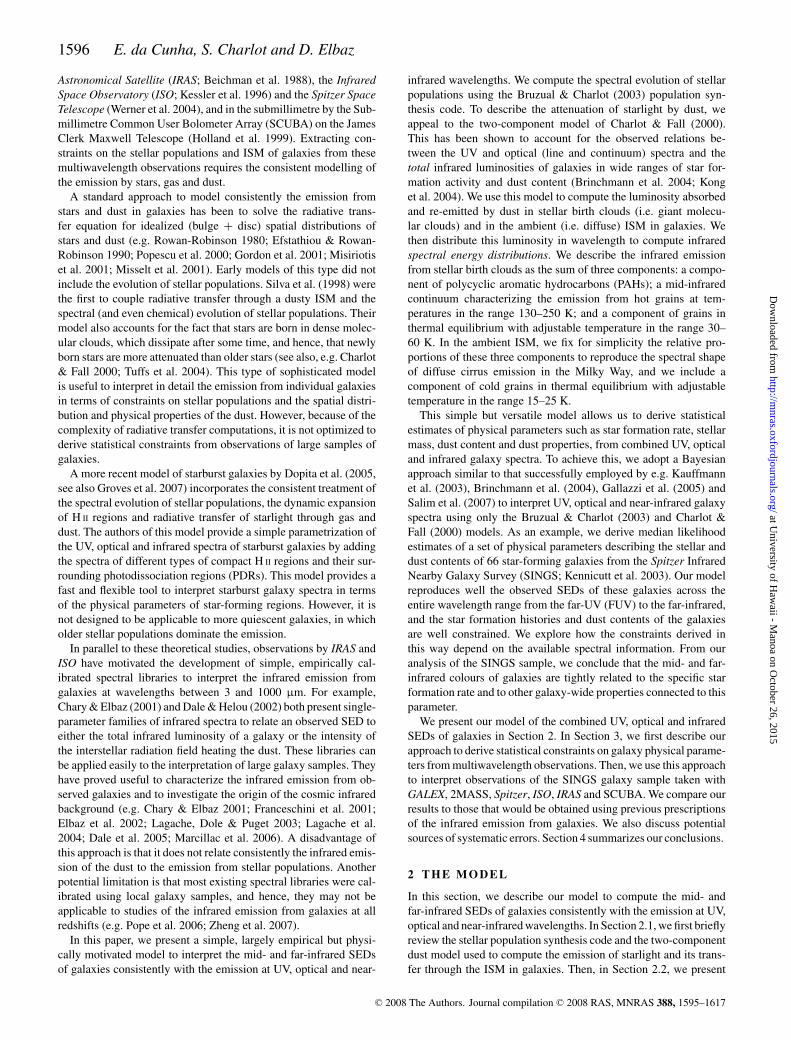
Figure 3. Ratio of 60- to 100-μm IRAS luminosity density plotted against ratio of 12- to 25-μm IRAS luminosity density. The data points in all panels (blackcrosses) are from the Elbaz et al. (2002) sample discussed in Section 2.2 (typical measurement errors are indicated in the upper left-hand panel). In each panel,the green line shows the effect of varying one parameter of the model from the lower end of the range (square) to the standard value (green circle) to the upperend of the range (triangle), with all other parameters fixed at their standard values: (a) fraction of total infrared luminosity contributed by dust in the ambientISM, f μ = 0.05, 0.50 and 0.95; (b) contribution by cold dust in thermal equilibrium to the infrared luminosity of the ambient ISM, ξ ISM
C = 0.50, 0.80, 1.0;(c) contribution by PAHs to the infrared luminosity of stellar birth clouds, ξ BC
PAH = 0.00, 0.05 and 0.50; (d) contribution by the hot mid-infrared continuum tothe infrared luminosity of stellar birth clouds, ξ BC
MIR = 0.00, 0.15 and 0.50; (e) contribution by warm dust in thermal equilibrium to the infrared luminosity ofstellar birth clouds, ξ BC
W = 0.15, 0.80 and 0.95; (f) equilibrium temperature of warm dust in stellar birth clouds, T BCW = 30, 48 and 60 K. In all panels, the red
circle corresponds to the same quiescent model galaxy dominated by cold dust emission, while the blue circle corresponds to an actively star-forming galaxydominated hot dust emission (see Table 1 and Section 2.2 for a description of these models).
wavelength of peak luminosity of dust in thermal equilibrium inthe stellar birth clouds roughly from 70 to 40 μm. This causesL12
ν /L25ν to drop and L60
ν /L100ν to rise in Fig. 3(f). In Fig. 4(f), the
effects on L6.75ν /L15
ν and L15ν /L60
ν are negligible.Equilibrium temperature of cold dust in the ambient ISM (not
shown). The most significant effect of increasing T ISMC at fixed ξ ISM
C
in Figs 3 and 4 is a small rise in L60ν /L100
ν caused by a blue shift ofthe peak infrared luminosity of cold dust in the ambient ISM (fromabout 140 to 80 μm as T ISM
C increases from 15 to 25 K). Variationsin T ISM
C also have a significant influence on the emission redwardof 100 μm.
The green lines in Figs 3 and 4 show that the extremities ofthe observational relations between the different infrared coloursof galaxies cannot be reached by varying a single model parameterat a time. This suggests that variations in the different dust com-ponents of galaxies are related to each other. However, we havechecked that the properties of every galaxy in Figs 3 and 4 couldbe reproduced with at least one combination of parameters of ourmodel. We illustrate this by showing two models lying at the ends ofthe observational relations: a ‘cold’ infrared spectrum characteristicof a quiescent galaxy with little star formation (red circle); and a‘hot’ infrared spectrum characteristic of an actively star-forming,starburst galaxy (blue circle). The parameters of these models are
Table 1. Parameters of the ‘standard’, ‘cold’ and ‘hot’ models plotted inFigs 3 and 4.
Model ‘Cold’ ‘Standard’ ‘Hot’
f μ 0.75 0.60 0.20
ξ ISMC 0.75 0.80 0.90
ξ BCPAH 0.45 0.05 0.01
ξ BCMIR 0.15 0.15 0.09
ξ BCW 0.40 0.80 0.95
T BCW (K) 40 48 55
T ISMC (K) 18 22 25
listed in Table 1. We emphasize that these are not unique sets ofparameters optimized to fit specific galaxy SEDs. Rather, they areexamples of how the colours in those regions of the diagrams canbe reproduced using our model.
Figs 3 and 4 allow us to draw some general conclusions about theinfluence of the various parameters of our model on the observed in-frared colours of galaxies. For example, as expected from Fig. 2, the
C© 2008 The Authors. Journal compilation C© 2008 RAS, MNRAS 388, 1595–1617
at University of H
awaii - M
anoa on October 26, 2015
http://mnras.oxfordjournals.org/
Dow
nloaded from

A simple model to interpret galaxy spectra 1603
Figure 4. Ratio of 15- to 60-μm ISO and IRAS luminosity density plotted against ratio of 6.75- to 15-μm ISO luminosity density. The data points in all panels(black crosses) are from the Elbaz et al. (2002) sample discussed in Section 2.2. In each panel, the green line shows the effect of varying one parameter of themodel from the lower end of the range (square) to the standard value (green circle) to the upper end of the range (triangle), with all other parameters fixed attheir standard values. The models are the same as in Fig. 3. In all panels, the red circle corresponds to the same quiescent model galaxy dominated by colddust emission, while the blue circle corresponds to an actively star-forming galaxy dominated hot dust emission (see Table 1 and Section 2.2 for a descriptionof these models).
L60ν /L100
ν colour appears to be controlled primarily by the fraction f μ
of total infrared luminosity contributed by dust in the ambient ISMand the properties of dust in thermal equilibrium: the relative con-tribution ξ ISM
C by cold dust to the infrared luminosity of the ambientISM (and the temperature T ISM
C of this dust) and the relative contri-bution ξ BC
W by warm dust to the infrared luminosity of stellar birthclouds (and the temperature T BC
W of this dust). These parameters alsohave distinct effects on the mid-infrared colours L12
ν /L25ν , L6.75
ν /L15ν
and L15ν /L60
ν , indicating that they can be constrained independentlyfrom fits of extended infrared spectral energy distributions. Themid-infrared colours are primarily controlled by the different com-ponents of hot dust: the relative contributions ξ BC
PAH and ξ BCMIR of PAHs
and the hot mid-infrared continuum to the infrared luminosity ofstellar birth clouds, and the contribution by PAHs to the infraredluminosity of the ambient ISM, which is controlled indirectly byξ ISM
C . In Section 3 below, we show how well these various modelparameters can be constrained in galaxies with observed infraredSEDs.
2.2.3 Constraints on dust mass
It is also of interest to derive constraints on the dust mass in galax-ies. The mass Md(Td) in dust grains in thermal equilibrium at thetemperature Td can be estimated from the far-infrared radiation L
Tdλ
of these grains using the formula (Hildebrand 1983)
LTdλ = 4π Md(Td) κλ Bλ(Td), (26)
where κλ and Bλ have been defined before (equation 10). We adoptthis formula to estimate the mass contributed by dust in thermalequilibrium in stellar birth clouds (with temperature Td = T BC
W )and in the ambient ISM (with temperatures Td = T ISM
W and Td =T ISM
C ) in our model. We adopt as before a dust emissivity indexβ = 1.5 for warm dust and β = 2 for cold dust and normalize κλ
at 850 μm assuming κ850 μm = 0.77 g−1 cm2 (Dunne et al. 2000).Using equations (10), (13), (15) and (26), we compute the masscontributed by warm dust in stellar birth clouds and in the ambientISM as
M BCW = ξ BC
W (1 − fμ) L totd
[4π
∫ ∞
0dλ κλ Bλ
(T BC
W
)]−1
(27)
and
M ISMW = ξ ISM
W fμ L totd
[4π
∫ ∞
0dλ κλ Bλ
(T ISM
W
)]−1
, (28)
and that contributed by cold dust in the ambient ISM as
M ISMC = ξ ISM
C fμ L totd
[4π
∫ ∞
0dλ κλ Bλ
(T ISM
C
)]−1
. (29)
To include the contribution by stochastically heated dust grains(not in thermal equilibrium; see Section 2.2.1), we adopt a standardMathis et al. (1977) distribution of grain sizes N(a) ∝ a−3.5 overthe range 0.005 ≤ a ≤ 0.25 μm. We assume that the stochasticallyheated dust grains are very small (a ≤ 0.01 μm) and have massdensities typical of graphite, ρ ≈ 2.26 g cm−3, while bigger grains
C© 2008 The Authors. Journal compilation C© 2008 RAS, MNRAS 388, 1595–1617
at University of H
awaii - M
anoa on October 26, 2015
http://mnras.oxfordjournals.org/
Dow
nloaded from

1604 E. da Cunha, S. Charlot and D. Elbaz
in thermal equilibrium have mass densities typical of silicates, ρ ≈3.30 g cm−3 (Draine & Lee 1984). For these assumptions, the masscontributed by grains of all sizes is about 5 per cent larger than thatcontributed by big grains alone (a > 0.01 μm). The contribution byPAHs to the overall dust mass is also very small, of the order of afew per cent (Draine et al. 2007). We therefore estimate the totaldust mass of a galaxy as
Md ≈ 1.1(M BC
W + M ISMW + M ISM
C
), (30)
where M BCW , M ISM
W and M ISMC are given by equations (27), (28) and
(29).
2.3 Combined ultraviolet, optical and infrared spectral energy
distributions
A main feature of our model is the consistent modelling of UV, op-tical and infrared spectral energy distributions of galaxies. This isachieved by first computing the total energy absorbed by dust in stel-lar birth clouds and in the ambient ISM, L BC
d and L ISMd (Section 2.1),
and then redistributing it at infrared wavelengths (Section 2.2). Themain assumptions are the conservation of the energy absorbed andreradiated by dust, and that the dust in the ISM of galaxies is heatedonly by starlight (in particular, we ignore the possible influence of anAGN). Different combinations of star formation histories, metallic-ities and dust contents can lead to the same absorbed energies L BC
d
and L ISMd in a model galaxy. Furthermore, these energies can be
distributed in wavelength using different combinations of dust pa-rameters in the stellar birth clouds (ξ BC
PAH, ξ BCMIR, ξ BC
W and T BCW ) and
the ambient ISM (ξ ISMC and T ISM
C ). In our model, therefore, a widerange of UV and optical SEDs can be associated to a wide range ofinfrared SEDs, at fixed L BC
d and L ISMd (or equivalently, at fixed f μ
and L totd ; see equations 5 and 8). In Section 3 below, we show how
combined observations at UV, optical and infrared wavelengths canbe used to uniquely constrain the star formation histories and dustproperties of galaxies using this model.
To illustrate the combination of UV, optical and infrared spectralenergy distributions with our model, we compute examples of atten-uated stellar population spectra consistent with the f μ parameters ofthe cold, standard and hot infrared models of Table 1 (Section 2.2.2).For simplicity, we assume solar metallicity and select models withexponentially declining star formation rates
ψ(t) ∝ exp(−γ t), (31)
where γ is the star formation time-scale parameter. We choose mod-els with γ = 0, 0.07 and 0.25 Gyr−1 at the ages t = 1.4, 10 and10 Gyr, respectively, to represent a starburst, a normal star-formingand a quiescent star-forming galaxy (e.g. Kauffmann & Charlot1998). For the attenuation of starlight by dust (equations 3 and 4),we adopt effective dust absorption optical depths τV = 2.0, 1.5and 1.0, for the starburst, normal star-forming and quiescent star-forming models, respectively. These values are consistent with theexpectation that more actively star-forming galaxies are more ob-scured (e.g. Wang & Heckman 1996; Hopkins et al. 2001; Sullivanet al. 2001). We adopt fractions μ = 0.1, 0.3 and 0.5 of τV arisingfrom dust in the ambient ISM. The resulting model galaxies havef μ ≈ 0.2, 0.6 and 0.75, respectively, consistent with the parametersof the hot, standard and cold infrared models of Table 1.
In Fig. 5, we show the combined SEDs of the starburst + hotinfrared, normal star-forming + standard infrared, and quiescentstar-forming + cold infrared models, after scaling in each casethe infrared luminosity to the total luminosity L tot
d absorbed bydust. As we shall see in the next section, the ability to compute
such combined UV, optical and infrared SEDs for wide rangesof physical parameters of galaxies has important implications forstatistical estimates of star formation histories and dust properties.
3 C ONSTRAI NTS O N PHYSI CAL
PA R A M E T E R S FRO M M U LT I WAV E L E N G T H
G A L A X Y O B S E RVAT I O N S
In this section, we show how the simple model described in Sec-tion 2 can be used to extract star formation histories and dust prop-erties from UV, optical and infrared observations of galaxies. InSection 3.1, we first describe our methodology to derive statisticalconstraints on galaxy physical parameters from multiwavelengthobservations. Then, in Section 3.2, we use this methodology toconstrain the physical parameters of star-forming galaxies in theSINGS sample. We compare our results to those that would be ob-tained using previous models in Section 3.3. Finally, we discusspossible sources of systematic errors associated with our approachin Section 3.4 and summarize the applicability of this model inSection 3.5.
3.1 Methodology
The model of Section 2 allows one to compute the UV, optical andinfrared emission from galaxies. This model contains a minimumnumber of adjustable parameters required to account for the ob-served relations between various integrated spectral properties ofgalaxies: age, star formation history, stellar metallicity, two com-ponents for the attenuation by dust and four contributors to theinfrared emission (PAHs, hot mid-infrared continuum, warm andcold dust in thermal equilibrium). The large number of observablequantities to which the model can be compared insures that thesedifferent adjustable parameters can be constrained in a meaningfulway (see below). A usual limitation of this type of study is thatseveral different combinations of physical parameters can lead tosimilar SEDs of galaxies. For example, age, metallicity and dustattenuation have similar effects on the UV and optical spectra ofgalaxies. An efficient way to derive statistical constraints on the var-ious parameters in these conditions is to consider a wide library ofmodels encompassing all plausible parameter combinations. Givenan observed galaxy, we can build the likelihood distribution of anyphysical parameter by evaluating how well each model in the librarycan account for the observed properties of the galaxy. This Bayesianapproach is similar to that used, for example, by Kauffmann et al.(2003) to interpret the optical spectra of SDSS galaxies. The un-derlying assumption is that the library of models is the distributionfrom which the data were randomly drawn. Thus, the prior distri-bution of models must be such that the entire observational space isreasonably well sampled, and that no a priori implausible corner ofparameter space accounts for a large fraction of the models.
3.1.1 Model library
We build a comprehensive library of models by generating sepa-rately a random library of stellar population models, for wide rangesof star formation histories, metallicities and dust contents, and a ran-dom library of infrared spectra, for wide ranges of dust temperaturesand fractional contributions by the different dust components to thetotal infrared luminosity. We then combine these libraries followingthe procedure outlined in Section 2.3.
For simplicity, we follow Kauffmann et al. (2003) andparametrize each star formation history in the stellar population li-brary in terms of two components: an underlying continuous model,
C© 2008 The Authors. Journal compilation C© 2008 RAS, MNRAS 388, 1595–1617
at University of H
awaii - M
anoa on October 26, 2015
http://mnras.oxfordjournals.org/
Dow
nloaded from

A simple model to interpret galaxy spectra 1605
Figure 5. Examples of spectral energy distributions obtained by combining the infrared models of Table 1 with attenuated stellar population spectracorresponding to the same contributions by dust in stellar birth clouds (1 − f μ) and in the ambient ISM (f μ) to the total energy L tot
d absorbed and reradiated bydust (Section 2.3). (a) Quiescent star-forming galaxy spectrum combined with the ‘cold’ infrared model of Table 1; (b) normal star-forming galaxy spectrumcombined with the ‘standard’ infrared model of Table 1; (c) starburst galaxy spectrum combined with the ‘hot’ infrared model of Table 1 (see text for detailsabout the parameters of the stellar population models). Each panel shows the unattenuated stellar spectrum (blue line), the emission by dust in stellar birthclouds (green line), the emission by dust in the ambient ISM (red line) and the total emission from the galaxy, corresponding to the sum of the attenuated stellarspectrum and the total infrared emission (black line).
characterized by an age tg and a star formation time-scale parameterγ (equation 31), and random bursts superimposed on this continu-ous model. We take tg to be uniformly distributed over the intervalfrom 0.1 to 13.5 Gyr. To avoid oversampling galaxies with negli-gible current star formation, we distribute γ using the probabilitydensity function p(γ ) = 1 − tanh (8 γ − 6), which is approximatelyuniform over the interval from 0 to 0.6 Gyr−1 and drops expo-nentially to zero around γ = 1 Gyr−1. Random bursts occur withequal probability at all times until tg. We set the probability so that50 per cent of the galaxies in the library have experienced a burstin the past 2 Gyr. We parametrize the amplitude of each burst asA = Mburst/Mcont, where Mburst is the mass of stars formed in theburst and Mcont is the total mass of stars formed by the continuousmodel over the time tg. This ratio is distributed logarithmically be-tween 0.03 and 4.0. During a burst, stars form at a constant rateover the time tburst, which we distribute uniformly between 3 × 10⁷
and 3 × 10⁸ yr. We distribute the models uniformly in metallicitybetween 0.02 and 2 times solar.
We sample attenuation by dust in the library by randomly drawingthe total effective V-band absorption optical depth, τV , and thefraction of this contributed by dust in the ambient ISM, μ (equations3 and 4). We distribute τV according to the probability densityfunction p(τV ) = 1 − tanh(1.5 τV − 6.7), which is approximatelyuniform over the interval from 0 to 4 and drops exponentially tozero around τV = 6. For μ, we adopt the same probability densityfunction as for γ above, i.e. p(μ) = 1 − tanh (8 μ − 6). We note that
these priors for attenuation encompass the dust properties of SDSSgalaxies, for which τV and μ peak around 1.0 and 0.3, respectively,with broad scatter (Brinchmann et al. 2004; Kong et al. 2004). Ourfinal stellar population library consists of 50 000 different models.
In parallel, we generate a random library of infrared spectra asfollows. We take the fraction f μ of the total infrared luminositycontributed by dust in the ambient ISM to be uniformly distributedover the interval from 0 to 1. We adopt a similar distribution forthe fractional contribution by warm dust in thermal equilibriumto the infrared luminosity of stellar birth clouds, ξ BC
W . For eachrandom drawing of ξ BC
W , we successively draw the contributions bythe other dust components to the infrared luminosity of stellar birthclouds (i.e. hot mid-infrared continuum and PAHs) to satisfy thecondition in equation (14): we draw ξ BC
MIR from a uniform distributionbetween 0 and 1 − ξ BC
W , and we set ξ BCPAH = 1 − ξ BC
W − ξ BCMIR. While
this procedure does not exclude values of ξ BCMIR and ξ BC
PAH close tounity, it does favour small values of these parameters, and hence,it avoids oversampling physically implausible models. We take theequilibrium temperature T BC
W of warm dust in the stellar birth cloudsto be uniformly distributed between 30 and 60 K, and that T ISM
C ofcold dust in the ambient ISM to be uniformly distributed between 15and 25 K. We draw the fractional contribution ξ ISM
C by cold dust inthermal equilibrium to the infrared luminosity of the ambient ISMfrom a uniform distribution between 0.5 and 1 (this also defines thecontributions ξ ISM
PAH, ξ ISMMIR and ξ ISM
W by PAHs, the hot mid-infraredcontinuum and warm dust to the infrared luminosity of the ambient
C© 2008 The Authors. Journal compilation C© 2008 RAS, MNRAS 388, 1595–1617
at University of H
awaii - M
anoa on October 26, 2015
http://mnras.oxfordjournals.org/
Dow
nloaded from

1606 E. da Cunha, S. Charlot and D. Elbaz
ISM, as described in Section 2.2.1). Our final library of infraredspectra consists of 50 000 different models.
We combine the library of stellar population models and thatof infrared spectra by associating together models with similar f μ,which we scale according to the total infrared luminosity L tot
d , asoutlined in Section 2.3. In practice, we associate each model in thestellar population library to all the models in the infrared spectrallibrary that have similar f μ to within some error interval δf μ.5 Thatis, we associate each stellar population spectrum, characterized byf μ
SFH, to all the infrared spectra characterized by f μIR, such that
f μIR = f SFH
μ ± δf μ. Each spectral combination satisfying this con-dition is included in the final model library and is assigned a valuef μ = (f μ
SFH + f μIR)/2. We adopt δf μ = 0.15, which allows good
reproductions of combined UV, optical and infrared observations ofgalaxies (Section 3.2).
Our final library of combined UV, optical and infrared SEDsconsists of about 661 million models. It is important to note thatsuch a large number of models are required to properly sample themultidimensional observational space.
3.1.2 Statistical constraints on physical parameters
We now investigate the accuracy to which the model library de-scribed in the previous section can help us constrain the star forma-tion histories and dust properties of galaxies for which multiwave-length observations are available. To assess this, we evaluate howwell we can recover the parameters of a random set of models withknown properties, based on spectral fits. We consider the follow-ing observable quantities: the GALEX FUV (1520 Å) and near-UV(NUV, 2310 Å) luminosities; the optical UBV luminosities; the2MASS near-infrared JHKs (1.25, 1.65 and 2.17 μm) luminosi-ties; the Spitzer/IRAC 3.6-, 4.5-, 5.8- and 8.0-μm luminosities; theISO/ISOCAM 6.75- and 15-μm luminosities; the IRAS 12-, 25-, 60-and 100-μm luminosities; the Spitzer/MIPS (Rieke et al. 2004) 24-,70- and 160-μm luminosities and the SCUBA 850-μm luminosity.We also include the hydrogen Hα and Hβ recombination-lineluminosities.
We compute these observable quantities from the spectra of all661 million models in the library and randomly select a subsetof 100 models. To mimic observational conditions, we perturb theluminosities of this subset of models assuming a fixed uncertainty of10 per cent. We then perform spectral fits to recover the likelihooddistributions of the physical parameters of these ‘mock galaxies’as follows. We first compare the luminosities of each mock galaxyin the sample to the luminosities of every model j in the libraryto measure the χ 2 goodness of fit of that model (e.g. Bevington &Robinson 2003)
χ 2j =
∑i
(Li
ν − wjLiν,j
σi
)2
, (32)
where Liν and Li
ν,j are the luminosities in the i th band of the mockgalaxy and the j th model, respectively, σi is the (10 per cent)uncertainty in Li
ν , and
wj =(∑
i
LiνL
iν,j
σ 2i
) ⎡⎣∑
i
(Li
ν,j
σi
)2⎤⎦
−1
(33)
5 This allows us to include the uncertainties that could arise, for example,from orientation effects, in the connection between the stellar and dustemission.
is the model scaling factor that minimizes χ 2j . Then, we build the
probability density function of any physical parameter of the mockgalaxy by weighting the value of that parameter in the j th modelby the probability exp(−χ 2
j /2). We take our ‘best estimate’ of theparameter to be the median of the resulting probability densityfunction and the associated confidence interval to be the 16th–84thpercentile range (this would be equivalent to the ±1σ range in thecase of a Gaussian distribution).
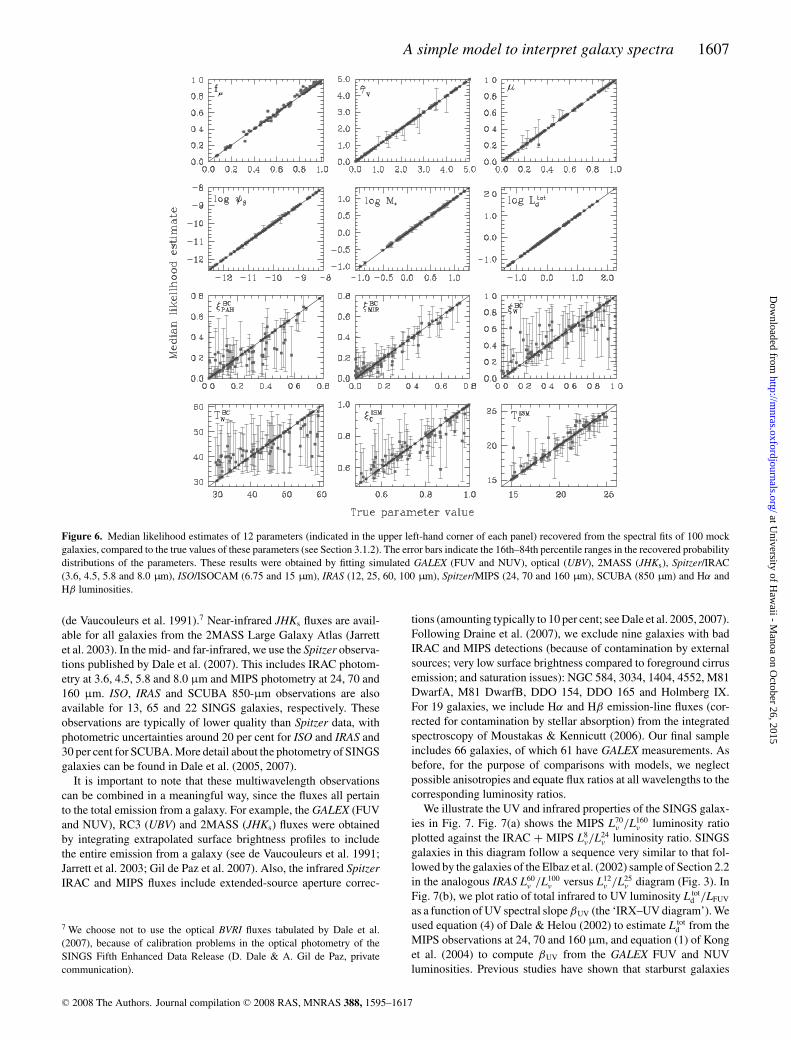
In Fig. 6, we compare the median likelihood estimates to the truevalues of 12 parameters recovered in this way for the 100 mockgalaxies in our sample. These parameters are: the fraction of totalinfrared luminosity contributed by dust in the ambient ISM, f μ;the total effective V-band absorption optical depth of the dust, τ V ;the fraction of this contributed by dust in the ambient ISM, μ; thespecific star formation rate, ψS, defined as the ratio
ψS(t) =∫ t
t−t8dt ′ ψ(t ′)
t8 M∗(34)
of the star formation rate averaged over the past t8 = 108 yr to thecurrent stellar mass M∗ of the galaxy; the stellar mass, M∗ (this ac-counts for the mass returned to the ISM by evolved stars); the totalinfrared luminosity, L tot
d ; the fractional contributions by PAHs, thehot mid-infrared continuum and warm dust in thermal equilibriumto the infrared luminosity of stellar birth clouds, ξ BC
PAH, ξ BCMIR and ξ BC
W ;the equilibrium temperature of warm grains in stellar birth clouds,T BC
W ; the contribution by cold dust to the total infrared luminosityof the ambient ISM, ξ ISM
C and the equilibrium temperature of thisdust, T ISM
C . Most of these parameters are recovered remarkably wellby our model. In particular, fμ, τV , μ, ψS, M∗, L tot
d , ξ BCMIR, ξ ISM
C
and T ISMC are recovered to very high accuracy. The most uncertain
parameters are ξ BCPAH, ξ BC
W and T BCW , for which the typical confi-
dence intervals reach almost 0.14, 0.18 and 11 K, respectively. Weconclude that our model is a valuable tool for deriving statisticalconstraints on the star formation histories and dust properties ofgalaxies for which multiwavelength (UV, optical and infrared) ob-servations are available.
3.2 Application to an observational sample
3.2.1 The sample
Here, we exploit our model to interpret a wide range of UV, opticaland infrared observations of a sample of well-studied nearby galax-ies: the Spitzer Infrared Nearby Galaxy Survey (Kennicutt et al.2003). This sample contains 75 galaxies at a median distance of9.5 Mpc (we adopt a Hubble constant H0 = 70 km s−1 Mpc−1). Thegalaxies span wide ranges in morphology (from E–S0 to Im–I0) andstar formation activity (from quiescent to starburst). Some galaxiesinclude low-luminosity AGN.6 We note that this sample extendsout to lower total infrared luminosities than the Elbaz et al. (2002)sample used to calibrate the infrared properties of our model inSection 2.2.2 (L tot
d � 1011 L instead of L totd � 1012 L), but it
includes observations across a much wider range of wavelengths.Observations at UV, optical and infrared wavelengths are avail-
able for most galaxies in this sample. GALEX ultraviolet (NUV andFUV) observations are available for 70 galaxies (Dale et al. 2007).In the optical, we adopt UBV fluxes from the RC3 for 65 galaxies
6 The low-luminosity AGN should have a negligible impact on the integratedbroad-band fluxes of the galaxies. We distinguish galaxies hosting low-luminosity AGN from normal star-forming galaxies in the spectral analysespresented later in this paper.
C© 2008 The Authors. Journal compilation C© 2008 RAS, MNRAS 388, 1595–1617
at University of H
awaii - M
anoa on October 26, 2015
http://mnras.oxfordjournals.org/
Dow
nloaded from
A simple model to interpret galaxy spectra 1607
Figure 6. Median likelihood estimates of 12 parameters (indicated in the upper left-hand corner of each panel) recovered from the spectral fits of 100 mockgalaxies, compared to the true values of these parameters (see Section 3.1.2). The error bars indicate the 16th–84th percentile ranges in the recovered probabilitydistributions of the parameters. These results were obtained by fitting simulated GALEX (FUV and NUV), optical (UBV), 2MASS (JHKs), Spitzer/IRAC(3.6, 4.5, 5.8 and 8.0 μm), ISO/ISOCAM (6.75 and 15 μm), IRAS (12, 25, 60, 100 μm), Spitzer/MIPS (24, 70 and 160 μm), SCUBA (850 μm) and Hα andHβ luminosities.
(de Vaucouleurs et al. 1991).7 Near-infrared JHKs fluxes are avail-able for all galaxies from the 2MASS Large Galaxy Atlas (Jarrettet al. 2003). In the mid- and far-infrared, we use the Spitzer observa-tions published by Dale et al. (2007). This includes IRAC photom-etry at 3.6, 4.5, 5.8 and 8.0 μm and MIPS photometry at 24, 70 and160 μm. ISO, IRAS and SCUBA 850-μm observations are alsoavailable for 13, 65 and 22 SINGS galaxies, respectively. Theseobservations are typically of lower quality than Spitzer data, withphotometric uncertainties around 20 per cent for ISO and IRAS and30 per cent for SCUBA. More detail about the photometry of SINGSgalaxies can be found in Dale et al. (2005, 2007).
It is important to note that these multiwavelength observationscan be combined in a meaningful way, since the fluxes all pertainto the total emission from a galaxy. For example, the GALEX (FUVand NUV), RC3 (UBV) and 2MASS (JHKs) fluxes were obtainedby integrating extrapolated surface brightness profiles to includethe entire emission from a galaxy (see de Vaucouleurs et al. 1991;Jarrett et al. 2003; Gil de Paz et al. 2007). Also, the infrared SpitzerIRAC and MIPS fluxes include extended-source aperture correc-
7 We choose not to use the optical BVRI fluxes tabulated by Dale et al.(2007), because of calibration problems in the optical photometry of theSINGS Fifth Enhanced Data Release (D. Dale & A. Gil de Paz, privatecommunication).
tions (amounting typically to 10 per cent; see Dale et al. 2005, 2007).Following Draine et al. (2007), we exclude nine galaxies with badIRAC and MIPS detections (because of contamination by externalsources; very low surface brightness compared to foreground cirrusemission; and saturation issues): NGC 584, 3034, 1404, 4552, M81DwarfA, M81 DwarfB, DDO 154, DDO 165 and Holmberg IX.For 19 galaxies, we include Hα and Hβ emission-line fluxes (cor-rected for contamination by stellar absorption) from the integratedspectroscopy of Moustakas & Kennicutt (2006). Our final sampleincludes 66 galaxies, of which 61 have GALEX measurements. Asbefore, for the purpose of comparisons with models, we neglectpossible anisotropies and equate flux ratios at all wavelengths to thecorresponding luminosity ratios.
We illustrate the UV and infrared properties of the SINGS galax-ies in Fig. 7. Fig. 7(a) shows the MIPS L70
ν /L160ν luminosity ratio
plotted against the IRAC + MIPS L8ν/L24
ν luminosity ratio. SINGSgalaxies in this diagram follow a sequence very similar to that fol-lowed by the galaxies of the Elbaz et al. (2002) sample of Section 2.2in the analogous IRAS L60
ν /L100ν versus L12
ν /L25ν diagram (Fig. 3). In
Fig. 7(b), we plot ratio of total infrared to UV luminosity L totd /LFUV
as a function of UV spectral slope βUV (the ‘IRX–UV diagram’). Weused equation (4) of Dale & Helou (2002) to estimate L tot
d from theMIPS observations at 24, 70 and 160 μm, and equation (1) of Konget al. (2004) to compute βUV from the GALEX FUV and NUVluminosities. Previous studies have shown that starburst galaxies
C© 2008 The Authors. Journal compilation C© 2008 RAS, MNRAS 388, 1595–1617
at University of H
awaii - M
anoa on October 26, 2015
http://mnras.oxfordjournals.org/
Dow
nloaded from

1608 E. da Cunha, S. Charlot and D. Elbaz
Figure 7. Selected properties of the SINGS galaxy sample discussed inSection 3.2. (a) Ratio of 70- to 160-μm luminosity plotted against ratioof 8- to 24-μm luminosity. (b) Ratio of total-infrared to UV luminosity asa function of UV spectral slope (the IRX–UV diagram). The dotted linein this diagram shows a fit by Kong et al. (2004) to the relation followedby starburst galaxies (Meurer et al. 1999). In both panels, crosses refer togalaxies with no AGN activity according to Kennicutt et al. (2003), whileopen squares refer to galaxies hosting low-luminosity AGN (LINER andSeyfert). Filled circled indicate three galaxies selected along the L70
ν /L160ν
versus L8ν/L24
ν relation, for which a wide set of observations are available(Section 3.2.2). Typical measurement errors are indicated in each diagram.
follow a tight sequence in this diagram (indicated by the dottedline in Fig. 7b), while more quiescent star-forming galaxies tend toexhibit redder UV spectra (i.e. larger βUV) than starburst galaxiesat fixed L tot
d /LFUV (Meurer, Heckman & Calzetti 1999; Bell 2002;Kong et al. 2004). Fig. 7 confirms that the SINGS galaxies are rep-resentative of the UV and infrared properties of nearby galaxies.
3.2.2 Example of constraints on physical parameters
We now use the methodology outlined in Section 3.1 to constrainthe star formation histories and dust properties of the SINGS galax-ies. We first assess how well our model can reproduce the observedmultiwavelength observations of these galaxies. For each observedgalaxy, we select the model of the library presented in Section 3.1that minimizes χ 2
j (equation 32), as computed by including as manyluminosities as available in the following bands: GALEX (FUVand NUV), optical (UBV), 2MASS (JHKs), Spitzer/IRAC (3.6, 4.5,5.8 and 8.0 μm), ISO/ISOCAM (6.75 and 15 μm), IRAS (12, 25,60 and 100 μm), Spitzer/MIPS (24, 70 and 160 μm), SCUBA(850 μm) and Hα and Hβ. Fig. 8 shows the resulting distribu-tion of the difference between the observed luminosity Lobs
ν andthe best-fitting model luminosity Lmod
ν , in units of the observationalerror σ obs, for the 66 galaxies in the sample (plain histograms).Each panel shows the result for a different photometric band. Forreference, the shaded histograms show the results obtained when
excluding the 22 galaxies identified as hosts of low-luminosity AGNby Kennicutt et al. (2003).
Fig. 8 shows that our model can reproduce simultaneously theUV, optical and near-, mid- and far-infrared observations of all buta few SINGS galaxies to within the observational errors. This isremarkable, considering the relative simplicity of the model. Wefind that the galaxies the least well fitted at UV and optical wave-lengths tend to be low-metallicity dwarf galaxies, such as the bluecompact dwarf galaxy NGC 2915 (e.g. Lee, Grebel & Hodge 2003)and the diffuse dwarf irregular galaxy Holmberg II (e.g. Hoessel,Saha & Danielson 1998). The difficulty in reproducing these obser-vations may arise either from a limitation of the spectral synthesiscode, or of the simple dust prescription, or from an underestimate ofobservational errors. The three galaxies for which the models sig-nificantly underestimate the 3.6-μm emission in Fig. 8 are also low-metallicity dwarf galaxies (NGC 4236, IC4710 and NGC 6822).For these galaxies, our simple scaling of the near-infrared contin-uum strength around 4 μm with the flux density of the 7.7-μm PAHfeature may not be appropriate (see Section 2.2.1). Fig. 8 furthershows that the galaxies with 8-μm mid-infrared luminosities leastwell reproduced by the model tend to be hosts of low-luminosityAGN. In these galaxies, the contribution to the infrared emissionby dust heated by the AGN may be significant. Despite these fewoutliers, we conclude from Fig. 8 that our model is adequate toinvestigate the constraints set on the physical properties of SINGSgalaxies by their UV, optical and infrared SEDs.
To investigate the implications of these fits for the determi-nation of physical parameters, we focus on three galaxies span-ning different dust properties along the L70
ν /L160ν versus L8
ν/L24ν
colour–colour relation in Fig. 7(a), for which a wide set of ob-servations are available: NGC 3521, a spiral (SABbc) galaxy at adistance of 9 Mpc; NGC 337, a spiral (SBd) galaxy at a distance of24.7 Mpc and Mrk 33, a dwarf irregular (Im) starburst galaxyat a distance of 21.7 Mpc. For all three galaxies, observationsfrom GALEX (FUV and NUV), 2MASS (JHKs), Spitzer (IRACand MIPS), IRAS and SCUBA are available, along with integratedHα and Hβ spectroscopy from Moustakas & Kennicutt (2006). ForNGC 3521 and 337, additional constraints are available from RC3(UBV) and ISO (ISOCAM 6.75 and 15 μm) photometry.
Fig. 9 shows the models (in black) providing the best fits to theobserved UV, optical, Hα and Hβ, and infrared SEDs of these threegalaxies (in red). The quality of the fits is remarkable, as quantifiedby the residuals shown at the bottom of each spectrum. We notethat, according to the best-fitting models, the sequence of increas-ing F70
ν /F160ν and decreasing F8
ν/F15ν colours from NGC 3521 to
NGC 337 to Mrk 33, which reflects a drop in the relative intensityof PAHs and a blueshift of the peak infrared luminosity (i.e. a risein the overall dust temperature), is associated to an increase in starformation activity. This is apparent from the relative strengthen-ing of the unattenuated UV and optical spectrum (in blue) fromNGC 3521 to NGC 337 to Mrk 33 in Fig. 9. We investigate thistrend further in Section 3.2.3 below.
We can study in more detail the constraints set on the starformation histories and dust properties of the galaxies by look-ing at the probability distributions of the corresponding modelparameters. In Figs 10 and 11, we show the likelihood distri-butions of 14 quantities constrained by the observed SEDs ofNGC 3521, NGC 337 and Mrk 33. These distributions were derivedusing the model library of Section 3.1.1, following the procedureoutlined in Section 3.1.2. Fig. 10 shows the likelihood distribu-tions of parameters pertaining to the star formation history and dustcontent: fraction of the total infrared luminosity contributed by dust
C© 2008 The Authors. Journal compilation C© 2008 RAS, MNRAS 388, 1595–1617
at University of H
awaii - M
anoa on October 26, 2015
http://mnras.oxfordjournals.org/
Dow
nloaded from

A simple model to interpret galaxy spectra 1609
Figure 8. Distribution of the difference between observed luminosity Lobsν and best-fitting model luminosity Lmod
ν , in units of the observational error σ obs, forthe 66 galaxies of the SINGS sample studied in Section 3.2. Each panel refers to a different photometric band (as indicated). The best-fitting model for eachgalaxy was selected by fitting as many luminosities as available in the following bands: GALEX (FUV and NUV), optical (UBV), 2MASS (JHKs), Spitzer/IRAC(3.6, 4.5, 5.8 and 8.0 μm), ISO/ISOCAM (6.75 and 15 μm), IRAS (12, 25, 60 and 100 μm), Spitzer/MIPS (24, 70 and 160 μm), SCUBA (850 μm) and Hα andHβ. In each panel, the plain histogram shows the result for the full sample of 66 SINGS galaxies, while the shaded histogram shows the result for the subsampleof 44 galaxies with no AGN activity according to Kennicutt et al. (2003). The dotted curve shows a Gaussian distribution with unit standard deviation, forreference.
in the ambient ISM (f μ); fraction of the total effective V-band ab-sorption optical depth of the dust contributed by the ambient ISM(μ); effective V-band absorption optical depth of the dust (τV ); ef-fective V-band absorption optical depth of the dust in the ambientISM (μτV ); specific star formation rate (ψS; equation 34); stellarmass (M∗); and dust mass (Md; equation 30). Fig. 11 shows the like-lihood distributions of parameters pertaining to the dust emission:total infrared luminosity (L tot
d ); global contributions (i.e. includingstellar birth clouds and the ambient ISM) by PAHs (ξ tot
PAH), the hotmid-infrared continuum (ξ tot
MIR) and warm dust in thermal equilib-rium (ξ tot
W ) to the total infrared luminosity (equations 19, 20 and 21);equilibrium temperature of warm dust in stellar birth clouds (T BC
W );contribution by cold dust in thermal equilibrium to the total infraredluminosity (ξ tot
C , equation 22); and equilibrium temperature of colddust in the ambient ISM (T ISM
C ).The different histograms in Figs 10 and 11 refer to different as-
sumptions about the available set of observations. The grey shadedhistograms show the results obtained when using all the observa-tional measurements from Fig. 9. In this case, all the parameters arewell constrained by the observed UV, optical and infrared SEDs ofthe galaxies, except for the equilibrium temperature T BC
W of warmdust in stellar birth clouds in NGC 3521. This is not surprising, sincethe total infrared emission from this galaxy is largely dominated bydust in the ambient ISM (as can be appreciated, for example, fromthe analogous spectrum of the quiescent star-forming galaxy ofFig. 5a). We find that, as anticipated from Fig. 9, the transition
from NGC 3521 to NGC 337 to Mrk 33 corresponds to a combinedrise in specific star formation rate (ψS) and dust temperature (T BC
W
and T ISMC ), a larger contribution to the total infrared luminosity by
warm dust (ξ totW ) relative to cold dust (ξ tot
C ), and by stellar birthclouds relative to the ambient ISM (f μ), and a weakening of PAHfeatures (ξ tot
PAH). These results are consistent with the finding byDraine et al. (2007), on the basis of a more sophisticated physicaldust model, that the intensity of the dust-heating starlight increases,and the fraction of dust mass contributed by PAHs decreases, fromNGC 3521 to NGC 337 to Mrk 33. We emphasize the importanceof finding tight constraints on all the adjustable model parametersin Figs 10 and 11. This confirms that the problem is well definedand that our model can be used to derive meaningful constraintson the star formation histories and dust properties of galaxies frommultiwavelength observations.
In many situations, observations may not be available across thefull range from UV to far-infrared wavelengths to constrain thephysical parameters of galaxies. It is useful, therefore, to explorethe constraints that can be derived on the physical parameters ofFigs 10 and 11 when reducing the set of available observations. Weillustrate this by considering three potentially common situations.
(i) Case I (red histograms in Figs 10 and 11). We relax the con-straints on the Hα and Hβ, ISO/ISOCAM (6.75 and 15 μm), IRAS(12, 25, 60 and 100 μm), Spitzer/MIPS (160 μm) and SCUBA(850 μm) luminosities. This leaves constraints from GALEX (FUV
C© 2008 The Authors. Journal compilation C© 2008 RAS, MNRAS 388, 1595–1617
at University of H
awaii - M
anoa on October 26, 2015
http://mnras.oxfordjournals.org/
Dow
nloaded from
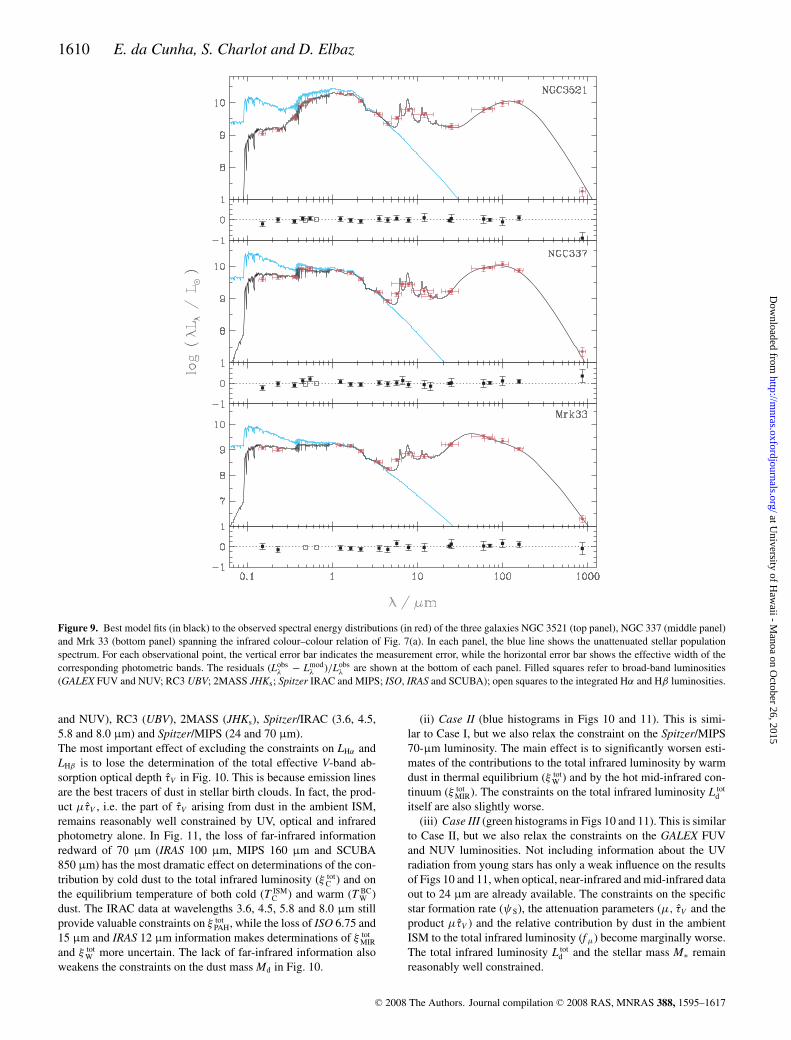
1610 E. da Cunha, S. Charlot and D. Elbaz
Figure 9. Best model fits (in black) to the observed spectral energy distributions (in red) of the three galaxies NGC 3521 (top panel), NGC 337 (middle panel)and Mrk 33 (bottom panel) spanning the infrared colour–colour relation of Fig. 7(a). In each panel, the blue line shows the unattenuated stellar populationspectrum. For each observational point, the vertical error bar indicates the measurement error, while the horizontal error bar shows the effective width of thecorresponding photometric bands. The residuals (Lobs
λ − Lmodλ )/Lobs
λ are shown at the bottom of each panel. Filled squares refer to broad-band luminosities(GALEX FUV and NUV; RC3 UBV; 2MASS JHKs; Spitzer IRAC and MIPS; ISO, IRAS and SCUBA); open squares to the integrated Hα and Hβ luminosities.
and NUV), RC3 (UBV), 2MASS (JHKs), Spitzer/IRAC (3.6, 4.5,5.8 and 8.0 μm) and Spitzer/MIPS (24 and 70 μm).The most important effect of excluding the constraints on LHα andLHβ is to lose the determination of the total effective V-band ab-sorption optical depth τV in Fig. 10. This is because emission linesare the best tracers of dust in stellar birth clouds. In fact, the prod-uct μτV , i.e. the part of τV arising from dust in the ambient ISM,remains reasonably well constrained by UV, optical and infraredphotometry alone. In Fig. 11, the loss of far-infrared informationredward of 70 μm (IRAS 100 μm, MIPS 160 μm and SCUBA850 μm) has the most dramatic effect on determinations of the con-tribution by cold dust to the total infrared luminosity (ξ tot
C ) and onthe equilibrium temperature of both cold (T ISM
C ) and warm (T BCW )
dust. The IRAC data at wavelengths 3.6, 4.5, 5.8 and 8.0 μm stillprovide valuable constraints on ξ tot
PAH, while the loss of ISO 6.75 and15 μm and IRAS 12 μm information makes determinations of ξ tot
MIR
and ξ totW more uncertain. The lack of far-infrared information also
weakens the constraints on the dust mass Md in Fig. 10.
(ii) Case II (blue histograms in Figs 10 and 11). This is simi-lar to Case I, but we also relax the constraint on the Spitzer/MIPS70-μm luminosity. The main effect is to significantly worsen esti-mates of the contributions to the total infrared luminosity by warmdust in thermal equilibrium (ξ tot
W ) and by the hot mid-infrared con-tinuum (ξ tot
MIR). The constraints on the total infrared luminosity L totd
itself are also slightly worse.(iii) Case III (green histograms in Figs 10 and 11). This is similar
to Case II, but we also relax the constraints on the GALEX FUVand NUV luminosities. Not including information about the UVradiation from young stars has only a weak influence on the resultsof Figs 10 and 11, when optical, near-infrared and mid-infrared dataout to 24 μm are already available. The constraints on the specificstar formation rate (ψS), the attenuation parameters (μ, τV and theproduct μτV ) and the relative contribution by dust in the ambientISM to the total infrared luminosity (f μ) become marginally worse.The total infrared luminosity L tot
d and the stellar mass M∗ remainreasonably well constrained.
C© 2008 The Authors. Journal compilation C© 2008 RAS, MNRAS 388, 1595–1617
at University of H
awaii - M
anoa on October 26, 2015
http://mnras.oxfordjournals.org/
Dow
nloaded from
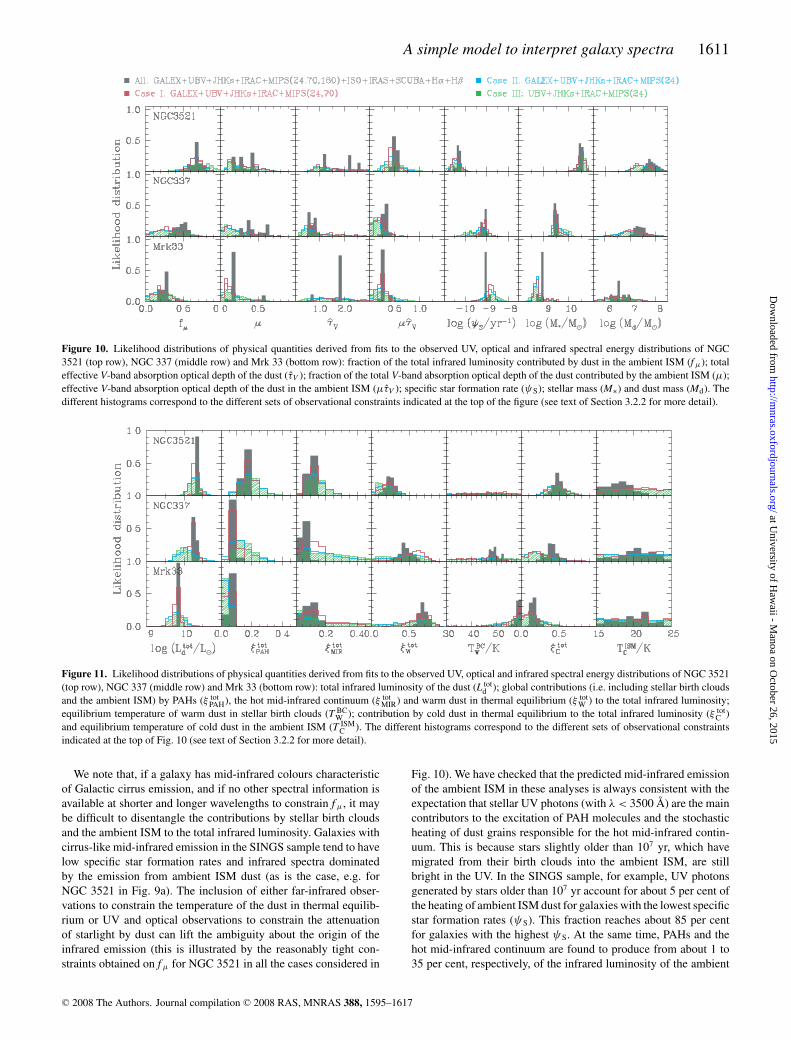
A simple model to interpret galaxy spectra 1611
Figure 10. Likelihood distributions of physical quantities derived from fits to the observed UV, optical and infrared spectral energy distributions of NGC3521 (top row), NGC 337 (middle row) and Mrk 33 (bottom row): fraction of the total infrared luminosity contributed by dust in the ambient ISM (f μ); totaleffective V-band absorption optical depth of the dust (τV ); fraction of the total V-band absorption optical depth of the dust contributed by the ambient ISM (μ);effective V-band absorption optical depth of the dust in the ambient ISM (μτV ); specific star formation rate (ψS); stellar mass (M∗) and dust mass (Md). Thedifferent histograms correspond to the different sets of observational constraints indicated at the top of the figure (see text of Section 3.2.2 for more detail).
Figure 11. Likelihood distributions of physical quantities derived from fits to the observed UV, optical and infrared spectral energy distributions of NGC 3521(top row), NGC 337 (middle row) and Mrk 33 (bottom row): total infrared luminosity of the dust (L tot
d ); global contributions (i.e. including stellar birth cloudsand the ambient ISM) by PAHs (ξ tot
PAH), the hot mid-infrared continuum (ξ totMIR) and warm dust in thermal equilibrium (ξ tot
W ) to the total infrared luminosity;equilibrium temperature of warm dust in stellar birth clouds (T BC
W ); contribution by cold dust in thermal equilibrium to the total infrared luminosity (ξ totC )
and equilibrium temperature of cold dust in the ambient ISM (T ISMC ). The different histograms correspond to the different sets of observational constraints
indicated at the top of Fig. 10 (see text of Section 3.2.2 for more detail).
We note that, if a galaxy has mid-infrared colours characteristicof Galactic cirrus emission, and if no other spectral information isavailable at shorter and longer wavelengths to constrain f μ, it maybe difficult to disentangle the contributions by stellar birth cloudsand the ambient ISM to the total infrared luminosity. Galaxies withcirrus-like mid-infrared emission in the SINGS sample tend to havelow specific star formation rates and infrared spectra dominatedby the emission from ambient ISM dust (as is the case, e.g. forNGC 3521 in Fig. 9a). The inclusion of either far-infrared obser-vations to constrain the temperature of the dust in thermal equilib-rium or UV and optical observations to constrain the attenuationof starlight by dust can lift the ambiguity about the origin of theinfrared emission (this is illustrated by the reasonably tight con-straints obtained on f μ for NGC 3521 in all the cases considered in
Fig. 10). We have checked that the predicted mid-infrared emissionof the ambient ISM in these analyses is always consistent with theexpectation that stellar UV photons (with λ < 3500 Å) are the maincontributors to the excitation of PAH molecules and the stochasticheating of dust grains responsible for the hot mid-infrared contin-uum. This is because stars slightly older than 107 yr, which havemigrated from their birth clouds into the ambient ISM, are stillbright in the UV. In the SINGS sample, for example, UV photonsgenerated by stars older than 107 yr account for about 5 per cent ofthe heating of ambient ISM dust for galaxies with the lowest specificstar formation rates (ψS). This fraction reaches about 85 per centfor galaxies with the highest ψS. At the same time, PAHs and thehot mid-infrared continuum are found to produce from about 1 to35 per cent, respectively, of the infrared luminosity of the ambient
C© 2008 The Authors. Journal compilation C© 2008 RAS, MNRAS 388, 1595–1617
at University of H
awaii - M
anoa on October 26, 2015
http://mnras.oxfordjournals.org/
Dow
nloaded from
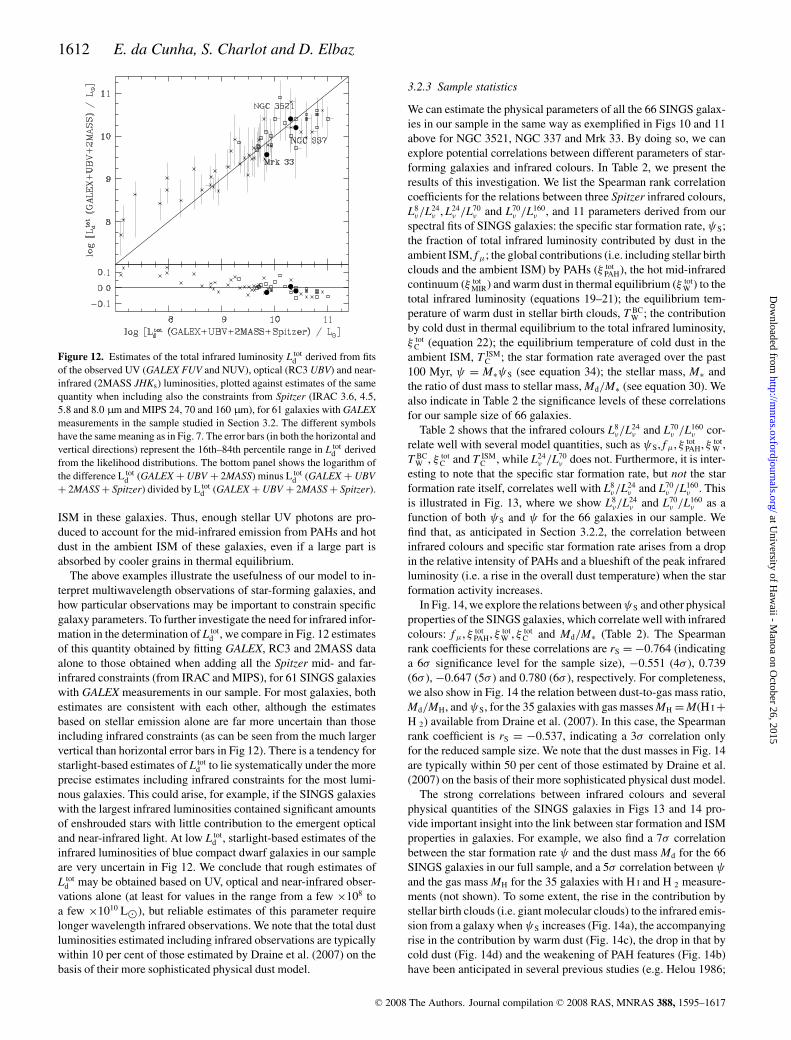
1612 E. da Cunha, S. Charlot and D. Elbaz
Figure 12. Estimates of the total infrared luminosity L totd derived from fits
of the observed UV (GALEX FUV and NUV), optical (RC3 UBV) and near-infrared (2MASS JHKs) luminosities, plotted against estimates of the samequantity when including also the constraints from Spitzer (IRAC 3.6, 4.5,5.8 and 8.0 μm and MIPS 24, 70 and 160 μm), for 61 galaxies with GALEXmeasurements in the sample studied in Section 3.2. The different symbolshave the same meaning as in Fig. 7. The error bars (in both the horizontal andvertical directions) represent the 16th–84th percentile range in L tot
d derivedfrom the likelihood distributions. The bottom panel shows the logarithm ofthe difference L tot
d (GALEX + UBV + 2MASS) minus L totd (GALEX + UBV
+ 2MASS + Spitzer) divided by L totd (GALEX + UBV + 2MASS + Spitzer).
ISM in these galaxies. Thus, enough stellar UV photons are pro-duced to account for the mid-infrared emission from PAHs and hotdust in the ambient ISM of these galaxies, even if a large part isabsorbed by cooler grains in thermal equilibrium.
The above examples illustrate the usefulness of our model to in-terpret multiwavelength observations of star-forming galaxies, andhow particular observations may be important to constrain specificgalaxy parameters. To further investigate the need for infrared infor-mation in the determination of L tot
d , we compare in Fig. 12 estimatesof this quantity obtained by fitting GALEX, RC3 and 2MASS dataalone to those obtained when adding all the Spitzer mid- and far-infrared constraints (from IRAC and MIPS), for 61 SINGS galaxieswith GALEX measurements in our sample. For most galaxies, bothestimates are consistent with each other, although the estimatesbased on stellar emission alone are far more uncertain than thoseincluding infrared constraints (as can be seen from the much largervertical than horizontal error bars in Fig 12). There is a tendency forstarlight-based estimates of L tot
d to lie systematically under the moreprecise estimates including infrared constraints for the most lumi-nous galaxies. This could arise, for example, if the SINGS galaxieswith the largest infrared luminosities contained significant amountsof enshrouded stars with little contribution to the emergent opticaland near-infrared light. At low L tot
d , starlight-based estimates of theinfrared luminosities of blue compact dwarf galaxies in our sampleare very uncertain in Fig 12. We conclude that rough estimates ofL tot
d may be obtained based on UV, optical and near-infrared obser-vations alone (at least for values in the range from a few ×108 toa few ×1010 L), but reliable estimates of this parameter requirelonger wavelength infrared observations. We note that the total dustluminosities estimated including infrared observations are typicallywithin 10 per cent of those estimated by Draine et al. (2007) on thebasis of their more sophisticated physical dust model.
3.2.3 Sample statistics
We can estimate the physical parameters of all the 66 SINGS galax-ies in our sample in the same way as exemplified in Figs 10 and 11above for NGC 3521, NGC 337 and Mrk 33. By doing so, we canexplore potential correlations between different parameters of star-forming galaxies and infrared colours. In Table 2, we present theresults of this investigation. We list the Spearman rank correlationcoefficients for the relations between three Spitzer infrared colours,L8
ν/L24ν , L24
ν /L70ν and L70
ν /L160ν , and 11 parameters derived from our
spectral fits of SINGS galaxies: the specific star formation rate, ψS;the fraction of total infrared luminosity contributed by dust in theambient ISM, f μ; the global contributions (i.e. including stellar birthclouds and the ambient ISM) by PAHs (ξ tot
PAH), the hot mid-infraredcontinuum (ξ tot
MIR) and warm dust in thermal equilibrium (ξ totW ) to the
total infrared luminosity (equations 19–21); the equilibrium tem-perature of warm dust in stellar birth clouds, T BC
W ; the contributionby cold dust in thermal equilibrium to the total infrared luminosity,ξ tot
C (equation 22); the equilibrium temperature of cold dust in theambient ISM, T ISM
C ; the star formation rate averaged over the past100 Myr, ψ = M∗ψS (see equation 34); the stellar mass, M∗ andthe ratio of dust mass to stellar mass, Md/M∗ (see equation 30). Wealso indicate in Table 2 the significance levels of these correlationsfor our sample size of 66 galaxies.
Table 2 shows that the infrared colours L8ν/L24
ν and L70ν /L160
ν cor-relate well with several model quantities, such as ψS, f μ, ξ tot
PAH, ξ totW ,
T BCW , ξ tot
C and T ISMC , while L24
ν /L70ν does not. Furthermore, it is inter-
esting to note that the specific star formation rate, but not the starformation rate itself, correlates well with L8
ν/L24ν and L70
ν /L160ν . This
is illustrated in Fig. 13, where we show L8ν/L24
ν and L70ν /L160
ν as afunction of both ψS and ψ for the 66 galaxies in our sample. Wefind that, as anticipated in Section 3.2.2, the correlation betweeninfrared colours and specific star formation rate arises from a dropin the relative intensity of PAHs and a blueshift of the peak infraredluminosity (i.e. a rise in the overall dust temperature) when the starformation activity increases.
In Fig. 14, we explore the relations between ψS and other physicalproperties of the SINGS galaxies, which correlate well with infraredcolours: f μ, ξ tot
PAH, ξ totW , ξ tot
C and Md/M∗ (Table 2). The Spearmanrank coefficients for these correlations are rS = −0.764 (indicatinga 6σ significance level for the sample size), −0.551 (4σ ), 0.739(6σ ), −0.647 (5σ ) and 0.780 (6σ ), respectively. For completeness,we also show in Fig. 14 the relation between dust-to-gas mass ratio,Md/MH, and ψS, for the 35 galaxies with gas masses MH = M(H I +H 2) available from Draine et al. (2007). In this case, the Spearmanrank coefficient is rS = −0.537, indicating a 3σ correlation onlyfor the reduced sample size. We note that the dust masses in Fig. 14are typically within 50 per cent of those estimated by Draine et al.(2007) on the basis of their more sophisticated physical dust model.
The strong correlations between infrared colours and severalphysical quantities of the SINGS galaxies in Figs 13 and 14 pro-vide important insight into the link between star formation and ISMproperties in galaxies. For example, we also find a 7σ correlationbetween the star formation rate ψ and the dust mass Md for the 66SINGS galaxies in our full sample, and a 5σ correlation between ψ
and the gas mass MH for the 35 galaxies with H I and H 2 measure-ments (not shown). To some extent, the rise in the contribution bystellar birth clouds (i.e. giant molecular clouds) to the infrared emis-sion from a galaxy when ψS increases (Fig. 14a), the accompanyingrise in the contribution by warm dust (Fig. 14c), the drop in that bycold dust (Fig. 14d) and the weakening of PAH features (Fig. 14b)have been anticipated in several previous studies (e.g. Helou 1986;
C© 2008 The Authors. Journal compilation C© 2008 RAS, MNRAS 388, 1595–1617
at University of H
awaii - M
anoa on October 26, 2015
http://mnras.oxfordjournals.org/
Dow
nloaded from

A simple model to interpret galaxy spectra 1613
Table 2. Correlations between three Spitzer infrared colours L8ν/L24
ν , L24ν /L70
ν and L70ν /L160
ν and the median likelihood estimates of several physical parametersconstrained using our model, for the 66 SINGS galaxies in our sample. For each combination of infrared colour and parameter, the first row indicates theSpearman rank correlation coefficient rS of the relation between the two quantities, while the second row indicates the significance level of the correlation forthe sample size.
ψS f μ ξ totPAH ξ tot
MIR ξ totW T BC
W ξ totC T ISM
C ψ M∗ Md/M∗
L8ν/L24
ν −0.723 0.679 0.715 0.108 −0.858 −0.437 0.663 −0.318 −0.007 0.634 −0.3776σ 5σ 6σ 1σ 7σ 4σ 5σ 3σ <1σ 5σ 3σ
L24ν /L70
ν 0.018 −0.201 0.182 0.253 0.212 0.423 −0.390 −0.081 0.503 0.243 0.133<1σ 2σ 1σ 2σ 2σ 3σ 3σ <1σ 4σ 2σ 1σ
L70ν /L160
ν 0.466 −0.464 −0.556 −0.162 0.741 0.509 0.577 0.692 −0.123 −0.450 0.0404σ 4σ 4σ 1σ 6σ 4σ 5σ 6σ 1σ 4σ <1σ
Figure 13. Spitzer infrared colours plotted against median likelihood estimates of the star formation rate, for the 66 SINGS galaxies of the sample discussedin Section 3.2. (a) Ratio of 8- to 24-μm luminosity plotted against star formation rate averaged over the past 100 Myr, ψ = M∗ψS (see equation 34). (b) Ratioof 70- to 160-μm luminosity plotted against ψ . (c) Ratio of 8- to 24-μm luminosity plotted against specific star formation rate ψS. (d) Ratio of 70- to 160-μmluminosity plotted against ψS. The different symbols have the same meaning as in Fig. 7. For each point, the vertical error bars represent the ±1σ observationaluncertainties, while the horizontal error bars represent the 16th–84th percentile range derived from the likelihood distribution of the quantity on the x-axis.
Cesarsky et al. 1996; Silva et al. 1998; Dale et al. 2001, 2007). Theoriginality of our approach is to quantify these effects by meansof a simple but versatile model, which allows statistical studies ofthe star formation and dust properties of large samples of galaxies.It is worth emphasizing that our method does not introduce theserelations a priori and that they arise from our consistent treatmentof stellar populations and dust in galaxies.
3.3 Comparison with previous models
The model we have developed allows one to interpret the infraredSEDs of galaxies consistently with the UV and optical emission,in terms of combined constraints on the star formation and dustproperties. At the same time, the model is versatile enough that itcan be used to statistically derive such properties for large samplesof observed galaxies. So far, the tools most widely used to extract
minimum physical quantities from infrared spectra of large samplesof observed galaxies are the spectral libraries of Chary & Elbaz(2001) and Dale & Helou (2002). As an illustration, we comparehere the constraints derived from our model to those that would beobtained using these libraries for the three galaxies studied in detailin Section 3.2.2 (Fig. 9).
Chary & Elbaz (2001) propose a library of template spectra toreproduce the observed correlations between the total infrared lumi-nosity L tot
d (LIR in their notation) and the luminosities in individualISO and IRAS bands, for local galaxies. This leads them to assign aunique luminosity to a given infrared spectral shape. In Fig. 15,we compare the best-fitting SEDs inferred from our model forNGC 3521, NGC 337 and Mrk 33 (in black, from Fig. 9) withtemplate spectra from Chary & Elbaz (2001, in green). Since thethree galaxies have similar infrared luminosities (Fig. 11), they areassigned similar infrared spectra in the prescription of Chary &
C© 2008 The Authors. Journal compilation C© 2008 RAS, MNRAS 388, 1595–1617
at University of H
awaii - M
anoa on October 26, 2015
http://mnras.oxfordjournals.org/
Dow
nloaded from

1614 E. da Cunha, S. Charlot and D. Elbaz
Figure 14. Median likelihood estimates of galaxy properties plotted against specific star formation rate, for the 66 SINGS galaxies of the sample discussed inSection 3.2. (a) Fraction of total infrared luminosity contributed by dust in the ambient ISM, f μ. (b) Global contribution (i.e. including stellar birth clouds andthe ambient ISM) by PAHs to the total infrared luminosity, ξ tot
PAH. (c) Global contribution by warm dust in thermal equilibrium to the total infrared luminosityξ tot
W . (d) Contribution by cold dust in thermal equilibrium to the total infrared luminosity, ξ totC . (e) Ratio of dust mass to stellar mass, Md/M∗. (f) Ratio of dust
mass to gas mass, Md/MH, for the 35 galaxies with gas masses MH = M(H I + H2) available from Draine et al. (2007). The different symbols have the samemeaning as in Fig. 7. The error bars represent the 16th–84th percentile ranges derived from the likelihood distributions of the estimated parameters.
Elbaz (2001, shown as dotted green lines in Fig. 15). However, asFigs 7 and 9 show, NGC 3521, NGC 337 and Mrk 33 have differentinfrared colours. As a result, the Chary & Elbaz (2001) templatespectra that best fit the ISO and IRAS colours of these galaxies(plotted as solid green lines in Fig. 15) correspond to widely differ-ent infrared luminosities. For example, the Chary & Elbaz (2001)template that best fits the observed colours of the dwarf starburstgalaxy Mrk 33 corresponds to a SED typical of an ultraluminousinfrared galaxy (ULIRG, with LIR ≥ 1012 L). This inconsistencyillustrates the impossibility with the Chary & Elbaz (2001) libraryto account for the intrinsic dispersion of infrared colours amonggalaxies of comparable infrared luminosity.
Dale & Helou (2002) parametrize the SEDs of normal star-forming galaxies in terms of a single parameter αSED, which isinversely proportional to the intensity of the interstellar radiationfield heating dust grains. Variations in αSED can account for theobserved range of F60/F100 colours of normal star-forming galax-ies. Dale et al. (2007) find that the Dale & Helou (2002) modelsthat best fit the MIPS colours of NGC 3521, 337 and Mrk 33 haveαSED = 3.32, 2.23 and 1.44, respectively (these models are shownas blue lines in Fig. 15). This sequence in αSED is consistent withthat in the specific star formation rate ψS inferred from our analysisof these galaxies (see Fig. 10). As mentioned above, our model canprovide greater insight into the star formation histories and dustproperties of galaxies.
3.4 Potential sources of systematic errors
3.4.1 Star formation prior
We have checked the sensitivity of our results to the prior distribu-tions of star formation histories in the model library of Section 3.1.We have repeated our results using continuous star formations his-tories (i.e. omitting superimposed stochastic starbursts). We findthat, in this case, the overall quality of the fits to the UV, opticaland infrared SEDs of SINGS galaxies decreases, and that the starformation rates of the galaxies are systematically lower by up to40 per cent. We have also tested the influence of the IMF. Adoptinga Salpeter (1955) IMF instead of the Chabrier IMF would lead tostellar mass estimates about 1.4 times larger.
3.4.2 Attenuation law
In this study, we have assumed that the effective dust absorptionoptical depth in stellar birth clouds scales with wavelength as τBC
λ ∝λ−1.3 (see Section 2.1). Adopting instead τBC
λ ∝ λ−0.7 (i.e. thesame wavelength dependence as the attenuation law in the ambientISM; see Charlot & Fall 2000) does not change significantly theoverall quality of the fits to the broad-band SEDs of the SINGSgalaxies. However, for the galaxies with spectroscopic observations,the Hα/Hβ ratios predicted using τBC
λ ∝ λ−0.7 tend to be lower thanobserved by typically 15 per cent (see also Wild et al. 2007). This has
C© 2008 The Authors. Journal compilation C© 2008 RAS, MNRAS 388, 1595–1617
at University of H
awaii - M
anoa on October 26, 2015
http://mnras.oxfordjournals.org/
Dow
nloaded from

A simple model to interpret galaxy spectra 1615
Figure 15. Fits by various models to the observed infrared (Spitzer IRACand MIPS, ISO, IRAS and SCUBA) spectral energy distributions of thesame three galaxies as in Fig. 9 (in red). In each panel, the black line showsthe best-fitting model from Fig. 9; the dotted green line is the Chary &Elbaz (2001) template spectrum corresponding to the same total infraredluminosity as the black line; the solid green line is the Chary & Elbaz(2001) template that best fits the IRAS and ISO observations of the galaxy;and the blue line is the Dale & Helou (2002) model that best fits the MIPSobservations of the galaxy (see text for detail).
negligible implications for the constraints on the dust parameters μ
and τV derived for the SINGS galaxies.
3.4.3 Inclination
The predictions of our model are averaged over viewing angles. Inpractice, however, because of the non-uniform spatial distribution ofdust, observed fluxes at UV, optical and infrared wavelengths maydepend on the angle under which a star-forming galaxy is seen. Weaccount to some extent for this effect in our model when introducingthe uncertainty δf μ in the connection between stellar and dust emis-sion (see Section 3.1). Also, we do not find any systematic trend inthe quality of spectral fits with the inclination of the SINGS galax-ies. In the future, we plan to investigate the effect of orientationfurther by applying our model to larger samples of galaxies span-ning wide ranges in physical properties and inclinations.
3.5 Applicability of the model
Our model is designed primarily to interpret UV, optical and infraredobservations of large samples of (randomly oriented) galaxies interms of effective (i.e. galaxy-wide) physical parameters, such asstar formation rate, stellar mass, dust mass, total infrared luminosity,breakdown of this luminosity between different dust componentsand between star-forming clouds and the diffuse ISM (Section 3.2).Constraints on these quantities for statistical samples of galaxiesat various redshifts are expected to provide useful insight into the
processes that were important in the evolution of the galaxies wesee today.
Our model is not optimized to interpret in detail multiwavelengthobservations of individual galaxies, for which the consideration ofgeometrical factors becomes important. Studies of this type gen-erally require complex radiative transfer calculations for specificoptical properties of dust grains and specific spatial distributions ofstars and dust. We refer the reader to the more sophisticated modelsof, for example, Silva et al. (1998) and Popescu et al. (2000) for suchpurposes. Also, for detailed investigations of the ambient physicalconditions of gas and dust in starburst galaxies, where orientationeffects are expected to be less crucial, the model of Dopita et al.(2005, see also Groves et al. 2007), which includes radiative transferin expanding H II regions, represents a suitable alternative.
4 SU M M A RY A N D C O N C L U S I O N
We have developed a simple but versatile model to interpret the mid-and far-infrared SEDs of galaxies consistently with the emission atUV, optical and near-infrared wavelengths. Our model relies on theBruzual & Charlot (2003) population synthesis code to compute thespectral evolution of stellar populations, and on the two-componentmodel of Charlot & Fall (2000) to compute the total infrared lu-minosity absorbed and reradiated by dust in stellar birth cloudsand in the ambient ISM. We distribute this total infrared energyin wavelength over the range from 3 to 1000 μm by consider-ing the contributions by four main dust components: PAH emis-sion, mid-infrared continuum emission from hot dust, warm dustwith adjustable equilibrium temperature in the range 30–60 K andcold dust with adjustable equilibrium temperature in the range 15–25 K. We keep as adjustable parameters the relative contributions byPAHs, the hot mid-infrared continuum and warm dust to the infraredluminosity of stellar birth clouds. Cold dust resides (in an adjustableamount) only in the ambient ISM, where the relative ratios of theother three components are fixed to the values reproducing the ob-served mid-infrared cirrus emission of the Milky Way. We find thatthis minimum number of components is required to account for theinfrared SEDs of galaxies in wide ranges of star formation histories.
We have generated a comprehensive library of model galaxy spec-tra by combining a library of attenuated stellar population spectra(built from stochastic star formation histories and dust contents)with a library of infrared emission spectra. As Fig. 9 illustrates,these models provide appropriate fits to the observed UV, opticaland infrared SEDs of nearby galaxies in the SINGS sample, forwhich data are available from GALEX, RC3, 2MASS, Spitzer, ISO,IRAS and SCUBA (Kennicutt et al. 2003). We have used this modellibrary to derive median likelihood estimates of the star formationrate, stellar mass, dust attenuation, dust mass and relative contribu-tions by different dust components to the total infrared luminosity ofevery SINGS galaxy in our sample. The accuracy of these estimatesdepends on the available spectral information. We find that, for ex-ample, although the total infrared luminosity L tot
d of a galaxy can beroughly estimated using UV, optical and near-infrared data alone (atleast for values in the range from a few ×108 to a few ×1010 L),reliable estimates of this parameter require infrared observations atlonger wavelengths.
A main advantage provided by our model is the capacity tostudy the relation between different physical parameters of observedgalaxies in a quantitative and statistically meaningful way. We findthat, for example, the specific star formation rate of SINGS galaxiescorrelates strongly not only with observed infrared colours, but also
C© 2008 The Authors. Journal compilation C© 2008 RAS, MNRAS 388, 1595–1617
at University of H
awaii - M
anoa on October 26, 2015
http://mnras.oxfordjournals.org/
Dow
nloaded from

1616 E. da Cunha, S. Charlot and D. Elbaz
with several other properties of the galaxies, such as the fraction oftotal infrared luminosity contributed by dust in the ambient ISM,the contributions by PAHs, warm dust and cold dust to the totalinfrared luminosity and the ratio of dust mass to stellar mass. Thesecorrelations provide important insight into the link between star for-mation and ISM properties in galaxies. In particular, they allow oneto quantify the relations between star formation rate, gas mass, dustmass, stellar mass, dust temperature and distribution of the dust be-tween giant molecular clouds and the diffuse ISM. Studies of theserelations at different redshifts will have important implications forour understanding of the physical processes that dominate galaxyevolution.
Our model should be useful for interpreting data from any moderngalaxy survey at UV, optical and infrared wavelengths. It can also beused to design new observations by optimizing the set of observablesrequired to constrain specific physical parameters of galaxies. Thismodel is meant to be used by the astronomical community and weintend to make it publicly available.
AC K N OW L E D G M E N T S
We thank the anonymous referee for important suggestions, whichhelped improve the quality of this paper. We also thank BrentGroves, Jarle Brinchmann and Tim Heckman for comments onthe manuscript, and Jakob Walcher, Armando Gil de Paz, HerveAussel and Helene Roussel for helpful discussions. We are grate-ful to Eli Dwek for providing us with an electronic version of theCOBE/FIRAS spectrum of the diffuse cirrus emission of the MilkyWay. EdC is financed by the EU Marie Curie Research TrainingNetwork MAGPOP. This research made use of the NASA/IPACExtragalactic Database (NED) which is operated by the Jet Propul-sion Laboratory, California Institute of Technology, under contractwith the National Aeronautics and Space Administration.
REFERENCES
Aannestad P. A., Kenyon S. J., 1979, ApJ, 230, 771Agladze N. I., Sievers A. J., Jones S. A., Burlitch J. M., Beckwith S. V. W.,
1996, ApJ, 462, 1026Allamandola L. J., Tielens A. G. G. M., Barker J. R., 1985, ApJ, 290, L25Allamandola L. J., Hudgins D. M., Sandford S. A., 1999, ApJ, 511, L115Andriesse C. D., 1974, A&A, 37, 257Beichman C. A., Neugebauer G., Habing H. J., Clegg P. E., Chester T. J.,
eds, 1988, Infrared Astronomical Satellite (IRAS) Catalogs and Atlases,Vol. 1 Explanatory Supplement
Bell E. F., 2002, ApJ, 577, 150Bevington P. R., Robinson D. K., 2003, in Bevington P. R., Robinson K. D.,
eds, Data Reduction and Error Analysis for the Physical Sciences, 3rdedn. McGraw-Hill, Boston, MA
Blommaert J. A. D. L. et al., 2003, in Mueller T. G., Blommaert J. A. D. L.,Garcia-Lario P., eds, ESA SP-1262, The ISO Handbook Vol. II, CAM –The ISO Camera. ESA Publications Division, Noordwijk
Boselli A. et al., 1998, A&A, 335, 53Boulanger F., Abergel A., Bernard J.-P., Burton W. B., Desert F.-X.,
Hartmann D., Lagache G., Puget J.-L., 1996, A&A, 312, 256Brandl B. R. et al., 2006, ApJ, 653, 1129Brinchmann J., Charlot S., White S. D. M., Tremonti C., Kauffmann G.,
Heckman T., Brinkmann J., 2004, MNRAS, 351, 1151Bruzual A. G., 2007, in Vazdekis A., Peletier R. F., eds, IAU Symp. Vol. 241,
On TP-AGB Stars and the Mass of Galaxies. Cambridge Univ. Press,Cambridge, p. 125
Bruzual G., Charlot S., 2003, MNRAS, 344, 1000Cesarsky D., Lequeux J., Abergel A., Perault M., Palazzi E., Madden S.,
Tran D., 1996, A&A, 315, L305
Chabrier G., 2003, PASP, 115, 763Charlot S., Fall S. M., 2000, ApJ, 539, 718Chary R., Elbaz D., 2001, ApJ, 556, 562Colless M. et al., 2001, MNRAS, 328, 1039Dale D. A., Helou G., 2002, ApJ, 576, 159Dale D. A., Helou G., Contursi A., Silbermann N. A., Kolhatkar S., 2001,
ApJ, 549, 215Dale D. A. et al., 2005, ApJ, 633, 857Dale D. A. et al., 2007, ApJ, 655, 863Dale D. A. et al., 2000, AJ, 120, 583de Vaucouleurs G., de Vaucouleurs A., Corwin H. G., Jr, Buta R. J., Paturel
G., Fouque P., 1991, Third Reference Catalogue of Bright Galaxies,Vols 1–3. Springer-Verlag, Berlin
Dopita M. A. et al., 2005, ApJ, 619, 755Draine B. T., Lee H. M., 1984, ApJ, 285, 89Draine B. T., Li A., 2007, ApJ, 657, 810Draine B. T. et al., 2007, ApJ, 663, 866Dunne L., Eales S. A., 2001, MNRAS, 327, 697Dunne L., Eales S., Edmunds M., Ivison R., Alexander P., Clements D. L.,
2000, MNRAS, 315, 115Dwek E. et al., 1997, ApJ, 475, 565Efstathiou A., Rowan-Robinson M., 1990, MNRAS, 245, 275Elbaz D., Cesarsky C. J., Chanial P., Aussel H., Franceschini A., Fadda D.,
Chary R. R., 2002, A&A, 384, 848Flagey N., Boulanger F., Verstraete L., Miville Deschenes M. A., Noriega
Crespo A., Reach W. T., 2006, A&A, 453, 969Franceschini A., Aussel H., Cesarsky C. J., Elbaz D., Fadda D., 2001, A&A,
378, 1Gallazzi A., Charlot S., Brinchmann J., White S. D. M., Tremonti C. A.,
2005, MNRAS, 362, 41Galliano F., Dwek E., Chanial P., 2008, ApJ, 679, 310Gil de Paz A. et al., 2007, ApJS, 173, 185Gordon K. D., Misselt K. A., Witt A. N., Clayton G. C., 2001, ApJ, 551,
269Groves B., Dopita M., Sutherland R., Kewley L., Fischera J., Leitherer C.,
Brandl B., van Breugal W., 2008, ApJ, 176, 438Helou G., 1986, ApJ, 311, L33Helou G., Lu N. Y., Werner M. W., Malhotra S., Silbermann N., 2000, ApJ,
532, L21Hildebrand R. H., 1983, QJRAS, 24, 267Hoessel J. G., Saha A., Danielson G. E., 1998, AJ, 115, 573Holland W. S. et al., 1999, MNRAS, 303, 659Hollenbach D. J., Tielens A. G. G. M., 1997, ARA&A, 35, 179Hopkins A. M., Connolly A. J., Haarsma D. B., Cram L. E., 2001, AJ, 122,
288Jarrett T. H., Chester T., Cutri R., Schneider S. E., Huchra J. P., 2003, AJ,
125, 525Kauffmann G., Charlot S., 1998, MNRAS, 297, L23Kauffmann G. et al., 2003, MNRAS, 341, 33Kennicutt R. C., Jr, et al., 2003, PASP, 115, 928Kessler M. F. et al., 1996, A&A, 315, L27Kong X., Charlot S., Brinchmann J., Fall S. M., 2004, MNRAS, 349,
769Lagache G., Dole H., Puget J.-L., 2003, MNRAS, 338, 555Lagache G. et al., 2004, ApJS, 154, 112Laurent O., Mirabel I. F., Charmandaris V., Gallais P., Madden S. C., Sauvage
M., Vigroux L., Cesarsky C., 2000, A&A, 359, 887Lee H., Grebel E. K., Hodge P. W., 2003, A&A, 401, 141Leger A., Puget J. L., 1984, A&A, 137, L5Leger A., D’Hendecourt L., Defourneau D., 1989, A&A, 216, 148Li A., Draine B. T., 2001, ApJ, 554, 778Lu N. et al., 2003, ApJ, 588, 199Madden S. C., Galliano F., Jones A. P., Sauvage M., 2006, A&A, 446, 877Marcillac D., Elbaz D., Chary R. R., Dickinson M., Galliano F., Morrison
G., 2006, A&A, 451, 57Marigo P., Girardi L., 2007, A&A, 469, 239Martin D. C. et al., 2005, ApJ, 619, L1Mathis J. S., Rumpl W., Nordsieck K. H., 1977, ApJ, 217, 425
C© 2008 The Authors. Journal compilation C© 2008 RAS, MNRAS 388, 1595–1617
at University of H
awaii - M
anoa on October 26, 2015
http://mnras.oxfordjournals.org/
Dow
nloaded from

A simple model to interpret galaxy spectra 1617
Mennella V., Brucato J. R., Colangeli L., Palumbo P., Rotundi A., BussolettiE., 1998, ApJ, 496, 1058
Meurer G. R., Heckman T. M., Calzetti D., 1999, ApJ, 521, 64Misiriotis A., Popescu C. C., Tuffs R., Kylafis N. D., 2001, A&A, 372, 775Misselt K. A., Gordon K. D., Clayton G. C., Wolff M. J., 2001, ApJ, 551,
277Moustakas J., Kennicutt R. C., Jr, 2006, ApJS, 164, 81Oke J. B., Gunn J. E., 1983, ApJ, 266, 713Pope A. et al., 2006, MNRAS, 370, 1185Popescu C. C., Misiriotis A., Kylafis N. D., Tuffs R. J., Fischera J., 2000,
A&A, 362, 138Purcell E. M., 1976, ApJ, 206, 685Rapacioli M., Joblin C., Boissel P., 2005, A&A, 429, 193Reach W. T. et al., 1995, ApJ, 451, 188Reach W. T. et al., 2005, PASP, 117, 978Rieke G. H. et al., 2004, ApJS, 154, 25Roussel H. et al., 2001, A&A, 369, 473Rowan-Robinson M., 1980, ApJS, 44, 403Salim S. et al., 2007, ApJS, 173, 267Salpeter E. E., 1955, ApJ, 121, 161Sellgren K., 1984, ApJ, 277, 623Sellgren K., Werner M. W., Dinerstein H. L., 1983, ApJ, 271, L13Silva L., Granato G. L., Bressan A., Danese L., 1998, ApJ, 509, 103
Skrutskie M. F. et al., 1997, in Garzon F., Epchtein N., Omont A., BurtonB., Persi P., eds, Astrophysics and Space Science Library Vol. 210, TheTwo Micron All Sky Survey (2MASS): Overview and Status. Springer,Berlin, p. 25
Smith J. D. T. et al., 2007, ApJ, 656, 770Stoughton C. et al., 2002, AJ, 123, 485Sullivan M., Mobasher B., Chan B., Cram L., Ellis R., Treyer M., Hopkins
A., 2001, ApJ, 558, 72Tuffs R. J., Popescu C. C., Volk H. J., Kylafis N. D., Dopita M. A., 2004,
A&A, 419, 821Verstraete L., Puget J. L., Falgarone E., Drapatz S., Wright C. M., Timmer-
mann R., 1996, A&A, 315, L337Verstraete L. et al., 2001, A&A, 372, 981Wang B., Heckman T. M., 1996, ApJ, 457, 645Werner M. W. et al., 2004, ApJS, 154, 1Wild V., Kauffmann G., Heckman T., Charlot S., Lemson G., Brinchmann
J., Reichard T., Pasquali A., 2007, MNRAS, 381, 543Zheng X. Z., Dole H., Bell E. F., Le Floc’h E., Rieke G. H., Rix H.-W.,
Schiminovich D., 2007, ApJ, 670, 301
This paper has been typeset from a TEX/LATEX file prepared by the author.
C© 2008 The Authors. Journal compilation C© 2008 RAS, MNRAS 388, 1595–1617
at University of H
awaii - M
anoa on October 26, 2015
http://mnras.oxfordjournals.org/
Dow
nloaded from