A simple hybrid method for segmenting vessel structures in...
15
Turk J Elec Eng & Comp Sci (2016) 24: 1446 – 1460 c ⃝ T ¨ UB ˙ ITAK doi:10.3906/elk-1310-61 Turkish Journal of Electrical Engineering & Computer Sciences http://journals.tubitak.gov.tr/elektrik/ Research Article A simple hybrid method for segmenting vessel structures in retinal fundus images Cemal K ¨ OSE * Department of Computer Engineering, Faculty of Engineering, Karadeniz Technical University, Trabzon, Turkey Received: 07.10.2013 • Accepted/Published Online: 31.03.2014 • Final Version: 23.03.2016 Abstract: In this paper, a simple, fast, and efficient hybrid segmentation method is presented for extracting vessel structures in retinal fundus images. Basically, this hybrid approach combines circular and naive Bayes classifiers to extract blood vessels in retinal fundus images. The circular method samples pixels along the enlarging circles centered at the current pixel and classifies the current pixel as vessel or nonvessel. An elimination technique is then employed to eliminate the nonvessel fragments from the processed image. The naive Bayes method as a supervised technique uses a very small set of features to segment retinal vessels in retinal images. The designed hybrid method exploits the circular and Bayesian segmentation results together to achieve the best performance. The achieved performance of the segmentation methods are tested on DRIVE and STARE databases for evaluation. The proposed methods segment a retinal image within 1 s and achieve about 95% accuracy. The results also indicate that the proposed hybrid method is one of the simplest and efficient segmentation methods among the unsupervised and supervised methods in the literature. Key words: Medical image processing, retinal vessel segmentation, circular segmentation, Bayesian segmentation, hybrid segmentation, automatic segmentation 1. Introduction Automatic segmentation and measurement of vessel structures are main research areas in retinal image analysis, which are extremely important in detecting and monitoring eye illnesses and taking early precautions for their effective treatment. Automatic systems are required to perform labor and computationally intensive tasks including extraction, measurement, visualization, and evaluation of retinal blood vessels. A standard grading system is used in manual assessment of retinal images. Manual assessment also requires ophthalmologists or professionally trained graders to analyze large numbers of retinal fundus images. In manual evaluation, segmentation and measurement accuracy also varies depending on the quality of the retinal images and graders’ ability and experience. Furthermore, manual segmentation and measurement processes can take up to 1 h for evaluation of only a single eye. Thus, a fully automated computer system extracting and measuring the vessel structures in retinal images could definitely reduce the workload of eye clinicians. Visual properties of retinal blood vessels are exploited in the diagnosis of many retinal diseases such as glaucoma, arteriosclerosis, hypertension, and diabetic retinopathy. To give an example, retinal blood vessels are used as landmarks for locating the optic disk, macula, and lesions [1]. In order to monitor the progress of a retinal disease such as diabetic retinopathy, the retinal fundus images are taken and analyzed periodically (e.g., every 6 or more months). Early detection of retinal diseases based on changes in blood vessels may prevent * Correspondence: [email protected] 1446
Transcript of A simple hybrid method for segmenting vessel structures in...

Turk J Elec Eng & Comp Sci
(2016) 24: 1446 – 1460
c⃝ TUBITAK
doi:10.3906/elk-1310-61
Turkish Journal of Electrical Engineering & Computer Sciences
http :// journa l s . tub i tak .gov . t r/e lektr ik/
Research Article
A simple hybrid method for segmenting vessel structures in retinal
fundus images
Cemal KOSE∗
Department of Computer Engineering, Faculty of Engineering, Karadeniz Technical University, Trabzon, Turkey
Received: 07.10.2013 • Accepted/Published Online: 31.03.2014 • Final Version: 23.03.2016
Abstract: In this paper, a simple, fast, and efficient hybrid segmentation method is presented for extracting vessel
structures in retinal fundus images. Basically, this hybrid approach combines circular and naive Bayes classifiers to
extract blood vessels in retinal fundus images. The circular method samples pixels along the enlarging circles centered
at the current pixel and classifies the current pixel as vessel or nonvessel. An elimination technique is then employed
to eliminate the nonvessel fragments from the processed image. The naive Bayes method as a supervised technique
uses a very small set of features to segment retinal vessels in retinal images. The designed hybrid method exploits the
circular and Bayesian segmentation results together to achieve the best performance. The achieved performance of the
segmentation methods are tested on DRIVE and STARE databases for evaluation. The proposed methods segment a
retinal image within 1 s and achieve about 95% accuracy. The results also indicate that the proposed hybrid method is
one of the simplest and efficient segmentation methods among the unsupervised and supervised methods in the literature.
Key words: Medical image processing, retinal vessel segmentation, circular segmentation, Bayesian segmentation,
hybrid segmentation, automatic segmentation
1. Introduction
Automatic segmentation and measurement of vessel structures are main research areas in retinal image analysis,
which are extremely important in detecting and monitoring eye illnesses and taking early precautions for their
effective treatment. Automatic systems are required to perform labor and computationally intensive tasks
including extraction, measurement, visualization, and evaluation of retinal blood vessels. A standard grading
system is used in manual assessment of retinal images. Manual assessment also requires ophthalmologists
or professionally trained graders to analyze large numbers of retinal fundus images. In manual evaluation,
segmentation and measurement accuracy also varies depending on the quality of the retinal images and graders’
ability and experience. Furthermore, manual segmentation and measurement processes can take up to 1 h for
evaluation of only a single eye. Thus, a fully automated computer system extracting and measuring the vessel
structures in retinal images could definitely reduce the workload of eye clinicians.
Visual properties of retinal blood vessels are exploited in the diagnosis of many retinal diseases such as
glaucoma, arteriosclerosis, hypertension, and diabetic retinopathy. To give an example, retinal blood vessels
are used as landmarks for locating the optic disk, macula, and lesions [1]. In order to monitor the progress of a
retinal disease such as diabetic retinopathy, the retinal fundus images are taken and analyzed periodically (e.g.,
every 6 or more months). Early detection of retinal diseases based on changes in blood vessels may prevent
∗Correspondence: [email protected]
1446

KOSE/Turk J Elec Eng & Comp Sci
visual loss [2]. Hence, to reduce the burden on medical professionals, changes in blood vessels are automatically
analyzed to create an opportunity for early diagnosis of retinal diseases.
Retinal vessels also have many observable characteristics, including opacity or reflectivity, tortuosity or
relative curvature, normal or abnormal branching, color, and size. Measurements of these characteristics are
important for diagnosis and treatment of many retinal diseases as well as clinical research studies [3–6]. The
structure and position of retinal vessels can also be exploited in monitoring retinal diseases such as age-related
macular degeneration and diabetic retinopathy. They are also used in finding the location of the optic disk and
fovea, and in reducing the number of false positives in detection of microaneurysms [7,8].
In general, automatic evaluation of blood vessel anomalies in retinal fundus images requires segmentation
of vessels. Even though many methods have been proposed for vessel segmentation in previous studies, there is
still room for improvement of existing methods in the area. In addition, the employed segmentation algorithm
has to be fast. The proposed method should also not be completely dependent on some configuration parameters.
Therefore, the motivation in this study is to develop a simple, efficient, fast, and easily usable vessel segmentation
method that only depends on a few tunable threshold values.
As indicated above, existing methods need to be improved in terms of at least one of the following
drawbacks. First, lack of adaptive capabilities under varying image conditions may result in poor quality of
segmentation, such as under- and oversegmentation. Second, for extracting vessel structures in the retinal
images, the methods involve complex preprocessing and postprocessing operations, which results in increased
computational cost. Third, user involvement is needed to select the region of interest, which shows that the
methods are not completely automatic. Finally, segmentation and evaluation processes themselves require too
much computational effort. In this paper, three simple, fast, and quite efficient approaches are introduced for
segmenting retinal vessels. These are circular, Bayesian, and hybrid segmentations approaches. The circular
segmentations method with a few easily adjustable thresholds is algorithmically and computationally quite
simple. The Bayesian method with selective sampling can easily be trained for efficient segmentation. The
hybrid segmentation method combines circular and naive Bayes approaches for the best performance .
The rest of this paper is organized as follows. A summary of other segmentation approaches is given in
Section 2. Implementation details of the proposed system with employed basic techniques and the segmentation
techniques of the circular, Bayesian, and hybrid approaches are given in Section 3. Measurement and evaluation
methods are presented in Section 4. The results are discussed in Section 5. Finally, the conclusions and future
works are presented in Section 6.
1.1. Previous approaches for segmenting blood vessels in retinal fundus images
Many retinal vessel segmentation techniques are employed to extract vessel structures in retinal fundus images
[9–11]. These techniques may be classified as model-based, tracking, propagation, neural network, pattern
recognition, and intelligent techniques [12–16]. Another classification approach groups the methods as window-
based (unsupervised methods), classification-based (supervised methods), and tracking-based (unsupervised
methods), as described in [17]. Therefore, the existing segmentation methods can be classified as supervised
and unsupervised methods that are also called rule-based methods [18,19]. Another algorithm employs the
cellular neural network models for classifying the pixels in the retinal images.
The rule-based and vessel tracking algorithms include the matched filter response and model-based locally
adaptive thresholding methods, adaptive snake, and morphological methods. Tracking methods use a model
to incrementally proceed along the vessels. Many different vessel tracking approaches are used to obtain and
1447

KOSE/Turk J Elec Eng & Comp Sci
evaluate vessel structures, vessel diameters, and branching points. These approaches include vessel tracking,
adaptive or deformable models, and morphology-based techniques [20–22]. The matched filter response and
piecewise threshold probing methods are employed for segmenting retinal vessels. Setting the rules for different
vessels’ structures is also difficult, which increases the computational complexity.
Another group of algorithms including supervised methods need labeled images for training. In the
application of supervised methods, the segmentation criteria are obtained from the ground truth data based on
known features. Therefore, labeling a single retinal image may take up to 1 or 2 h of processing. Features such
as width of the vessels, edge strength, and intensity were used for segmentation by Staal et al. [23]. In another
study, the Gabor wavelet transform was employed for segmentation by Soares et al. [24]. A supervised method
using gray level and moment invariants-based features was introduced by Marin et al. [25] and a semisupervised
method based on the radial projection was proposed by You et al. [26]. Performance of the supervised methods
exploiting the preclassified data is usually better than that of unsupervised methods, and they usually generate
very good segmentation results for retinal images without degenerations.
In the application, an unsupervised method evaluates and assigns pixels to a vessel according to some
predefined criteria. An adaptive local thresholding method for retinal vessel segmentation was proposed in
[27]. Another method for extracting vessels in pathological retinal images was suggested in [28]. This method
extracts the vessel-like structures by employing the Laplacian operator.
The matched filters were used in detection of vessels in retinal images. The method first calculates
the matched filter response image from the original retinal image [29]. Setting the matched filter for all
vessel structures is difficult and increases computational complexity. The 2-D Gabor wavelet and supervised
classification methods use a feature vector with different scales obtained from Gabor wavelet transform for eachpixel. The features are exploited in the classification of each pixel as either vessel or nonvessel. A Bayesian
method using class-conditional probability density functions is exploited in the classification. Some of the
drawbacks of the method are the computational needs in the training phase, the need for manual labeling of
the training data, and the lack of adaptation ability of the method for different data. The ridge-based vessel
segmentation method, using image primitives to compute a probability of a line element as the feature of vessels,
exploits the essential properties such as elongated structures of the vessels. One of the major disadvantages of
the method is the need for manual labeling of the training data.
In this study, a simple and fast method is given for segmenting vessels, which produces a full segmentation
of vessel structure in the retinal images without any user involvement. The method also handles complex
structures such as sharp curved and branched vessels with varying lengths on images with a broad range of
quality.
2. Description of proposed segmentation methods
The proposed retinal vessel segmentation method takes advantages of the rule-based unsupervised and super-
vised methods. The circular segmentation method uses neighboring pixels around the current pixel that is being
processed to extract spatial consistency available in the image. For circular segmentation, color retinal images
are transformed into grayscale images and then inverse images of the grayscale images are generated. Then a
simple approach with circular sampling is employed in segmentation of the retinal vessels. On the other hand,
the naive Bayes method as a supervised technique exploits a very small set of features to segment retinal vessels
in retinal images. Finally, the proposed hybrid method combines the results generated by circular and Bayesian
segmentation to achieve a better segmentation performance.
1448

KOSE/Turk J Elec Eng & Comp Sci
Basic steps in the proposed automatic retinal vessel segmentation and measurement system are classified
into three groups. Steps in the first group are (1) generating a monochrome image and taking its inverse form,
(2) applying the circular segmentation method, and (3) eliminating the mis-segmented fragments to obtain final
circular segmentation results. Following steps in the second group are (4) collecting features from the color
input image and (5) applying the Bayesian segmentation method. The last steps classified in the final group
are (6) applying the hybrid segmentation approach and (7) evaluating segmentation results. A block diagram
of the system is given in Figure 1.
Applying the Circular
Segmentation
Input Retinal Image
Applying the Hybrid Segmentation
Generating the Inverse of Monochrome Image
Eliminating Small
Mis-segmented Fragments
Collecting the Features
from Color Fundus Image
Applying the Bayesian
Segmentation
Evaluating Results
Ic(x,y)
Current Pixel
Retinal Image
Vessels
Rl
Largest
Sampling Circle
High Intensity Pixels
Low Intensity
Pixels
After Circular
Segmentation
j=0
j=Cl
i=1
i=4
A sampled pixel
in the circular
scan line
j=1
i=2
Iij(x,y)
Figure 1. Block diagram of the vessel segmentation and
measurement system.
Figure 2. An illustration of circular sampling and seg-
mentation of blood vessels.
2.1. Circular segmentation method
In segmentation, the circular sampling method is used for segmenting retinal vessels, as illustrated in Figure
2. Here, pixels around the currently processed pixel are sampled at a certain depth relative to the intensity
value of the current pixel by using the circular sampling technique. The center of the sampling area is set as
the current pixel. For example, if the current pixel’s intensity is 150 and the threshold depth is set to 5, the
threshold value for the current pixel is calculated to be 145 (150 – 5). Then the pixels in the circular scan lines
around the current pixel are evaluated related to the current threshold value. The high-intensity pixels in the
current circular sampling area are determined by using Eq. (1).
Ci,j(x, y) =
{1 if Ii,j(x, y) > Ic(x, y)−D0 Otherwise
, (1)
where Ci,j(x, y), Ii,j(x, y) , Ic(x, y), and D represent the high-intensity pixels in the current area, the intensity
of pixels in circular scan lines in the current area, the intensity value of the current pixel, and the threshold
depth, respectively. The threshold depth value is experimentally set to 4 for the pixels with standard deviations
bigger than 0.1 and 3 for the other pixels, respectively.
As illustrated in the figure, the pixels around the current pixel or in the circular scan lines are sampled
by using a circular sampling method, and then they are compared with the threshold value by using Eq. (1).
The interval for the radius of the circles is experimentally calculated to be between 1 and 10 pixels. In other
1449

KOSE/Turk J Elec Eng & Comp Sci
words, the radius of the circles varies from 1 to 10 pixels to cover the vessels with the largest width. After the
sampling process, the low- and high-intensity pixels shown as white and black areas are determined as part of
the vessel and nonvessel areas, respectively. The total number of high-intensity pixels along the circular scan
lines is calculated according to Eq. (2). The ratio of number of high-intensity pixels to total number of pixels
is determined by using Eq. (3). If the rate of the high-intensity pixels (Rt(x, y)) is in the expected interval
(T1 < Rt(x, y) < T2), the current pixel is set as a vessel; otherwise, the current pixel is set as a nonvessel.
Finally, the yielding image is represented by ICSI(x, y) after circular segmentation. The threshold values (T1
and T2) are experientially set to 0.025 and 0.55, respectively. These threshold values are set to the fixed values
to achieve the best segmentation performance. An original retinal image and its segmentation result are given
in Figures 3a–3c.
Tnp(x, y) =
Rl∑i=1
Ci∑j=0
Cij(x, y), (2)
where Tnp(x, y), Rl , and Ci represent the total number of high-intensity pixels around the current pixel in the
circular sampling area, the largest sampling circle’s diameter, and the number of sampled pixels in the scan line
of the sampling circle with diameter ias illustrated in Figure 2.
Rt(x, y) = Tnp(x, y)/Tp, (3)
where Rt(x, y) is the rate of the number of high-intensity pixels to the total number of processed pixels in the
current circular sampling area (Tp). Simply, the circular segmentation method consists of two stages, which are
called circular segmentation and fragment elimination phases. In the application, a look-up table for circular
sampling is determined only once and then the look-up table is used in classification of all of the pixels in the
image in the circular segmentation.
Table 1. An example look-up table.
Indices 1 3 4 4 5 6 7 8i 2 2 0 –2 –2 –2 0 2j 0 2 2 2 0 –2 –2 –2
An example look-up table for the small sampling circle in Figure 2 is given in Table 1 for the current
pixel {Ic (x,y)} .
Figure 3. Original image (a); circular segmentation result before elimination of the fragment (b) and after the elimination
of the nonvessel fragments (c).
1450

KOSE/Turk J Elec Eng & Comp Sci
2.1.1. Elimination of non-Vessel Fragments
The circular segmentation method produces small nonvessel fragments along with segmented vessel structures, as
given in Figure 3b. These fragments should be removed from the final image to achieve a better segmentation
result. An elimination method searches for small nonvessel areas such as square fragments. Therefore, the
geometric form of fragments is used as an elimination criterion. Unfortunately, vessel structures are mostly
in irregular geometric structures, which cause difficulties in differentiation of vessels from other structures. A
practical approach is presented to estimate the fragment type, and to make some quantitative assessments of
the fragments based on their shapes. Two methods are employed to estimate the shape and quantification of the
fragments in the retinal images. First, a seed fill algorithm is used to measure the size and dimension of grains
[30]. Here, each fragment in the image is filled by using seed fill algorithm, and then the areas of fragments are
measured in pixels based on the number of pixel filled in each fragment.
By using the results of the seed fill algorithm, the maximum and minimum coordinates values along the
x and y axes are calculated to decide whether the fragment is in a square-like structure or not. Consequently,
the seed-filled fragment is checked to see whether it is in a thin-long fragment-like vessel structure or not by
using Eq. (4). If the size of the fragment (SoF ) is smaller than 14 pixels or the ratio (Rs) is bigger than 0.22,
the fragment can be classified as a nonvessel-like structure and therefore eliminated excluding close fragments
forming a line. Otherwise, the fragment is not eliminated. Here, the fragment is eliminated for larger values of
the ratio, which is close to 1, since it does not depict a vessel-like structure. After elimination of the fragments,
the segmentation result is shown in Figure 3c. The circular segmentation result is represented by ICS(x, y)
after the fragment elimination process. In addition to this, some pixels with unexpected colors and intensity
values such as bright lesions are also eliminated by using the Bayesian classifier given in the next section.
Rs = 100 ∗ SoF/(1 +Mw ∗Mw), (4)
where Rs , SoF , and Mw stand for the similarity rate, size of fragment in number of pixels, and maximum
width of the fragment along the x or y axis, respectively. The similarity rate is the measure of how similar
a fragment is to a square geometric form. If the similarity value is close to 0, the fragment is depicted as
a vessel-like structure. Conversely, if the value is greater than 22, the fragment is depicted as a square-like
structure. The maximum width (Mw) is set to the maximum width of the fragment along the x or y axis.
2.2. Bayesian segmentation method
In this section, the naive Bayes method as a supervised approach is introduced for segmentation of the retinal
vessels. The naive Bayes classifier, introduced in this paper, uses a very small set of features to segment the
retinal vessels efficiently. These features are colors (R,G,B) and intensity values; color ratios of pixels such
as G/(R + G),B/(R + B), and B/(G + B); and Rt and Rs values. The proposed Bayesian classification
approach uses only nine features to segment retinal vessels efficiently [31]. The mean, standard deviation (SD),
and P-values of the features used in this application are given in Table 2 for vessel and nonvessel areas. In
segmentation, the classifier given in Eq. (5) is used to extract vessel structures in retinal fundus images. In the
application, an independent probability distribution is determined for each of these features and then pixels are
classified by employing the equation. Here, the Bayesian segmentation method is applied in two stages, which
are training and classification. After the training, the classifier is applied to each pixel of the input image to
1451

KOSE/Turk J Elec Eng & Comp Sci
generate the Bayesian segmentation result (IBS(x, y)).
Classify (f1, ..., fn) = maxk
{p(Ck)
n∏i=1
p(fi|Ck)
}, (5)
where C ,n , k,f , andistand for classes, number of features, class variables, features, and feature indices, respec-
tively. p(fi|Ck) and p(Ck) represent the independent probability distributions and class priority, respectively
[32].
Table 2. The mean, SD, and P-values of the features used in the application.
FeaturesVessel NonvesselMean SD P-value Mean SD P-value
Red (R) 183.49 19.37 0.5150 196.10 11.85 0.2873Green (G) 82.35 15.38 0.1547 104,24 9.61 0.0228Blue (B) 45.37 5.55 0.0308 57.37 4.34 0.0058Intensity 108.77 12.03 0.1052 128.76 7.28 0.0061G/(R+G)× 100 35.53 8.01 0.2543 44.67 5,57 0.1031B/(R+B)× 100 18.81 4.634 0.2597 24.03 3.75 0.1645B/(G+B)× 100 38.85 5.75 0.2526 32.27 3.34 0.488Rt× 100 48.51 11.59 0.0004 71.25 17,80 0.0209Rs 17.83 4.49 0.0257 27.76 6.78 0.1397
The proposed method uses a very small set of features to train the naive Bayes classifier under Gaussian
distribution and to segment retinal vessels. For each feature, a probability and probability distribution are
computed from the training set for the vessels and other areas in the images. For each class, the probability
distributions of features are calculated, and then the class probability and the probabilities of features for each
class are multiplied to classify the pixel with maximum value. Results show that the proposed Bayesian classifier
quite successfully segments the vessels in retinal fundus images.
2.2.1. Selective sampling
In the training of the naive Bayes classifier, choosing correct training samples is important to perform an
efficient segmentation process. In most of the applications, manual segmentation results are used to select
training samples. Here, manual over- and undersegmentation, especially in the case of narrow and small vessels,
causes wrong training samples to be chosen. In this application, training samples are selected by just clicking on
the image as given in Figure 4. In addition to this, a selective sampling technique is employed to choose correct
training samples. Thus, the selective sampling technique eliminates the false samples that are not representing
its class based on the intensity and color values of the sample that should be in an expected interval. For
example, the value of feature Rt should be in between 0.025 and 0.55. Hence, false samples are eliminated from
the training samples by using the selective sampling method. As a result, the naive Bayes classifier is trained
using only correct samples to achieve a better segmentation. In addition, the training process of the naive Bayes
classifier is also reduced to a few minutes by using the selective sampling technique. For further improvement, the
user may also click on more (good) samples if necessary. This reshapes the independent probability distribution
positively. An experimental result of the selective sampling method is given in Figure 4.
1452
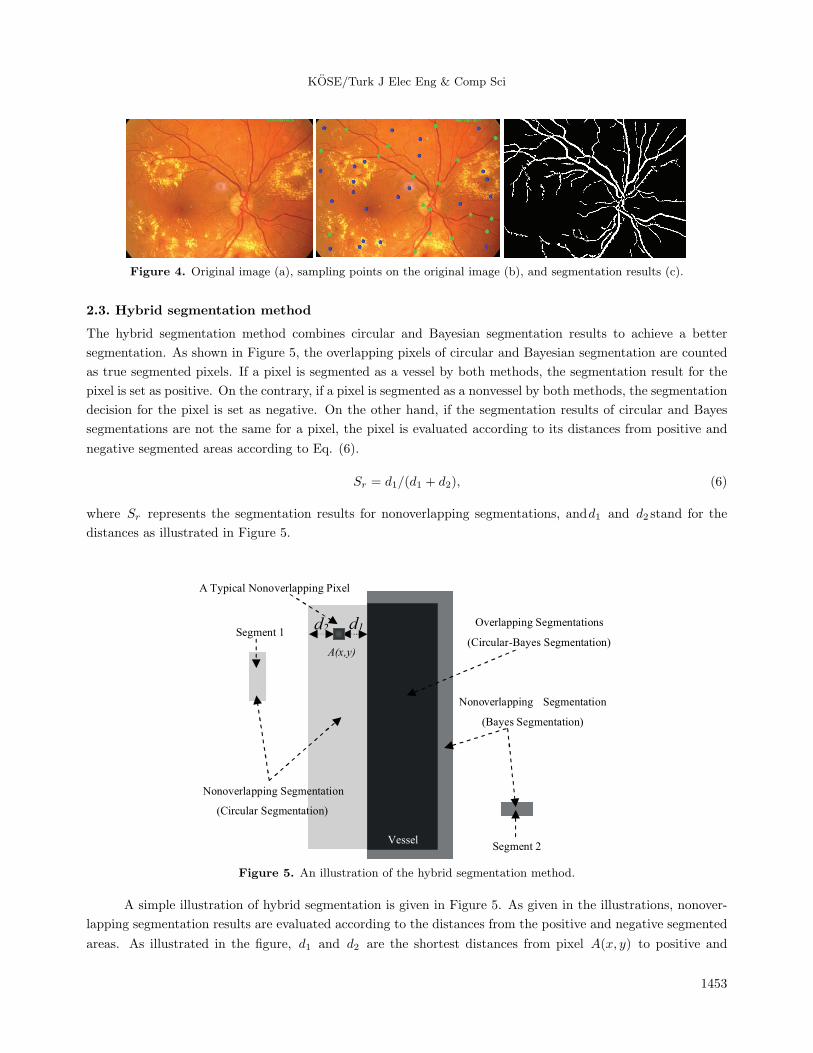
KOSE/Turk J Elec Eng & Comp Sci
Figure 4. Original image (a), sampling points on the original image (b), and segmentation results (c).
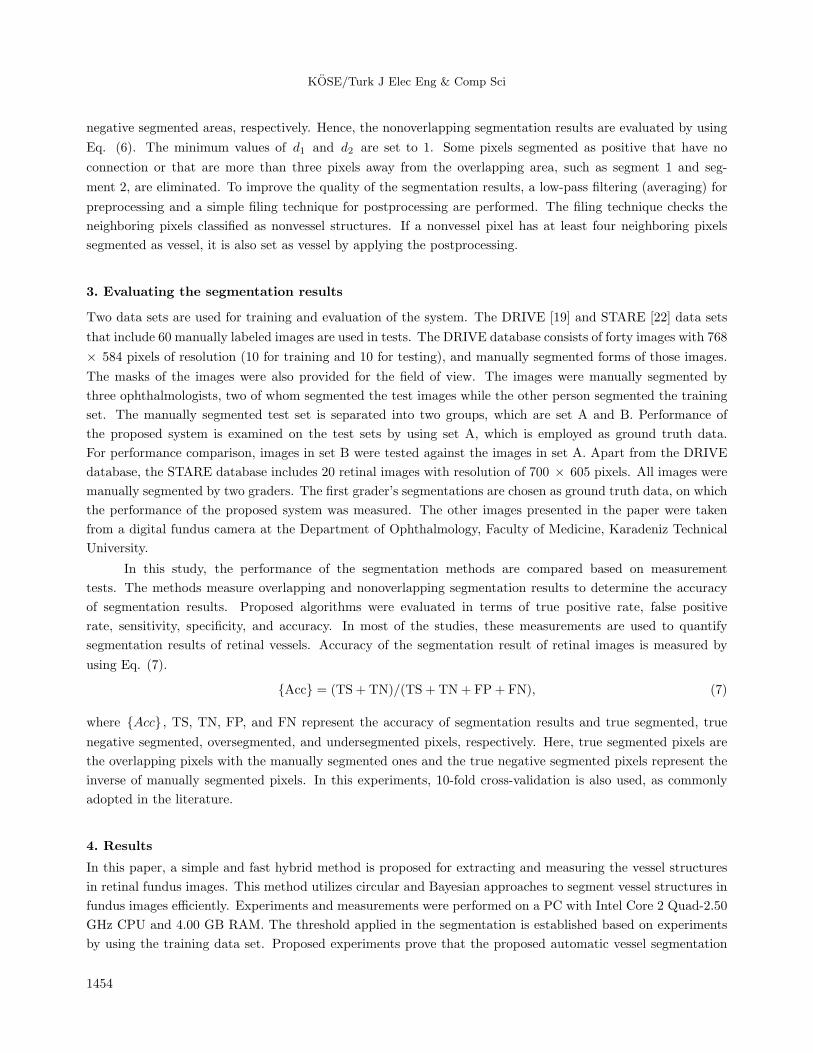
2.3. Hybrid segmentation method
The hybrid segmentation method combines circular and Bayesian segmentation results to achieve a better
segmentation. As shown in Figure 5, the overlapping pixels of circular and Bayesian segmentation are counted
as true segmented pixels. If a pixel is segmented as a vessel by both methods, the segmentation result for the
pixel is set as positive. On the contrary, if a pixel is segmented as a nonvessel by both methods, the segmentation
decision for the pixel is set as negative. On the other hand, if the segmentation results of circular and Bayes
segmentations are not the same for a pixel, the pixel is evaluated according to its distances from positive and
negative segmented areas according to Eq. (6).
Sr = d1/(d1 + d2), (6)
where Sr represents the segmentation results for nonoverlapping segmentations, andd1 and d2 stand for the
distances as illustrated in Figure 5.
Segment 1
Nonoverlapping Segmentation
(Circular Segmentation)
Segment 2
A Typical Nonoverlapping Pixel
A(x,y)
d2 d1 Overlapping Segmentations
(Circular-Bayes Segmentation)
Nonoverlapping Segmentation
(Bayes Segmentation)
Vessel
Figure 5. An illustration of the hybrid segmentation method.
A simple illustration of hybrid segmentation is given in Figure 5. As given in the illustrations, nonover-
lapping segmentation results are evaluated according to the distances from the positive and negative segmented
areas. As illustrated in the figure, d1 and d2 are the shortest distances from pixel A(x, y) to positive and
1453
KOSE/Turk J Elec Eng & Comp Sci
negative segmented areas, respectively. Hence, the nonoverlapping segmentation results are evaluated by using
Eq. (6). The minimum values of d1 and d2 are set to 1. Some pixels segmented as positive that have no
connection or that are more than three pixels away from the overlapping area, such as segment 1 and seg-
ment 2, are eliminated. To improve the quality of the segmentation results, a low-pass filtering (averaging) for
preprocessing and a simple filing technique for postprocessing are performed. The filing technique checks the
neighboring pixels classified as nonvessel structures. If a nonvessel pixel has at least four neighboring pixels
segmented as vessel, it is also set as vessel by applying the postprocessing.
3. Evaluating the segmentation results
Two data sets are used for training and evaluation of the system. The DRIVE [19] and STARE [22] data sets
that include 60 manually labeled images are used in tests. The DRIVE database consists of forty images with 768
× 584 pixels of resolution (10 for training and 10 for testing), and manually segmented forms of those images.
The masks of the images were also provided for the field of view. The images were manually segmented by
three ophthalmologists, two of whom segmented the test images while the other person segmented the training
set. The manually segmented test set is separated into two groups, which are set A and B. Performance of
the proposed system is examined on the test sets by using set A, which is employed as ground truth data.
For performance comparison, images in set B were tested against the images in set A. Apart from the DRIVE
database, the STARE database includes 20 retinal images with resolution of 700 × 605 pixels. All images were
manually segmented by two graders. The first grader’s segmentations are chosen as ground truth data, on which
the performance of the proposed system was measured. The other images presented in the paper were taken
from a digital fundus camera at the Department of Ophthalmology, Faculty of Medicine, Karadeniz Technical
University.
In this study, the performance of the segmentation methods are compared based on measurement
tests. The methods measure overlapping and nonoverlapping segmentation results to determine the accuracy
of segmentation results. Proposed algorithms were evaluated in terms of true positive rate, false positive
rate, sensitivity, specificity, and accuracy. In most of the studies, these measurements are used to quantify
segmentation results of retinal vessels. Accuracy of the segmentation result of retinal images is measured by
using Eq. (7).
{Acc} = (TS + TN)/(TS + TN+ FP + FN), (7)
where {Acc} , TS, TN, FP, and FN represent the accuracy of segmentation results and true segmented, true
negative segmented, oversegmented, and undersegmented pixels, respectively. Here, true segmented pixels are
the overlapping pixels with the manually segmented ones and the true negative segmented pixels represent the
inverse of manually segmented pixels. In this experiments, 10-fold cross-validation is also used, as commonly
adopted in the literature.
4. Results
In this paper, a simple and fast hybrid method is proposed for extracting and measuring the vessel structures
in retinal fundus images. This method utilizes circular and Bayesian approaches to segment vessel structures in
fundus images efficiently. Experiments and measurements were performed on a PC with Intel Core 2 Quad-2.50
GHz CPU and 4.00 GB RAM. The threshold applied in the segmentation is established based on experiments
by using the training data set. Proposed experiments prove that the proposed automatic vessel segmentation
1454

KOSE/Turk J Elec Eng & Comp Sci
methods work fine and the system needs little adjustment to set the threshold values; it is also easily trained
to achieve an efficient segmentation process.
Figure 6. Original retinal image (a); circular (b), Bayesian (c), and hybrid segmentation results (d); and manual
segmentation of the images from set A taken from the DRIVE data set (e).
Figure 6 presents some segmentation results generated by using circular, Bayesian, and hybrid segmen-
tation approaches on images obtained from the DRIVE database. In the figure, along with the original image,
its segmented forms by circular, Bayesian, and hybrid approaches are given, as well as manual segmentation
results. Segmentation accuracies of the images at first, second, and third lines for hybrid approach are 0.962,
0.964, and 0.963, respectively.
Figure 7 presents some segmentation results generated by using the circular, Bayesian, and hybrid
segmentation approaches on images obtained from the STARE database. In the figure, the original images; their
segmented forms by circular, Bayesian, and hybrid segmentation approaches; and their manually segmented
forms are presented. Segmentation accuracies of the images at first, second, and third lines for the hybrid
approach are 0.959, 0.957, and 0.965, respectively. The middle image includes some degeneration or pathologicalcases.
Segmentation performances of proposed methods were compared with some previously developed vessel
segmentation methods. The ROC curves, generated for images obtained from DRIVE and STARE databases
using the proposed hybrid segmentation, ridge-based vessel segmentation [23], two-dimensional Gabor wavelet
and supervised classification [24], two-dimensional matched filter methods [29], and human observations, are
shown in Figures 8 and 9. These figures present the ROC curves for varying thresholds. The manual segmen-
tation results of set B and the second grader’s results are shown as marked points in the corresponding images.
In this application, true and false positive fractions are calculated over all test images.
1455

KOSE/Turk J Elec Eng & Comp Sci
Figure 7. Original retinal image (a); circular (b), Bayesian (c), and hybrid segmentation results (d); and manually
segmented forms of images from first observer’s data set obtained from STARE database (e).
0.0
0.1
0.2
0.3
0.4
0.5
0.6
0.7
0.8
0.9
1.0
0.0 0.1 0.2 0.3 0.4 0.5 0.6 0.7 0.8 0.9 1.0
False positive fraction
Proposed Hybrid Method
Chaudhuri et al. [29]
Soares et al. [24]
Staal et al. [23]
Set B
Tru
e p
osi
tive
fra
ctio
n
0.0
0.1
0.2
0.3
0.4
0.5
0.6
0.7
0.8
0.9
1.0
0.0 0.1 0.2 0.3 0.4 0.5 0.6 0.7 0.8 0.9 1.0
Tru
e p
osi
tive
fra
ctio
n
False positive fraction
Proposed Hybrid MethodChaudhuri et al. [29]Soares et al. [24]
Staal et al. [23]Second observer
Figure 8. A comparison of performances of the seg-
mentation methods applied to images from the DRIVE
database.
Figure 9. A comparison of performances of the segmen-
tation methods on the STARE database.
The proposed methods for the automatic segmentation of the retinal vasculature in retinal images were
examined on the images obtained from the DRIVE and STARE databases. Comparison of the proposed method
and the other methods given in Table 3 presents the average accuracy of the proposed method for the test sets of
the DRIVE and STARE databases. Two results are given in the table as R1 and R2. The first accuracy result in
the table (R1) shows the performance of the proposed method against the first grader’s manual segmentations.
The second accuracy result (R2) is obtained considering the manual segmentations of both graders.
1456

KOSE/Turk J Elec Eng & Comp Sci
Table 3. Performances of vessel segmentation methods on DRIVE and STARE data sets.
Methods
Average accuracyData sets
General averageDRIVE STARE
Circular segmentation 0.9461 0.9440 0.9451Bayesian segmentation 0.9453 0.9441 0.9446Hybrid (R1) 0.9550 0.9542 0.9549Hybrid (R2) 0.9634 0.9576 0.9605Chaudhuri et al. [29] 0.8773 - 0.8773Hoover et al. [22] - 0.9267 0.9267Jiang et al. [27] 0.8911 0.9001 0.8956Marın et al. [25] 0.9452 0.9526 0.9589Mendonca et al. [9] 0.9452 0.9440 0.9446Niemeijer [19] 0.9417 - 0.9417Ricci et al. [13] 0.9563 0.9584 0.9573Soares et al. [24] 0.9466 0.9480 0.9473Staal et al. [23] 0.9441 0.9516 0.9479You et al. [26] 0.9434 0.9497 0.9466Zhang et al. [11] 0.9640 0.9087 0.9364Second human observer 0.9473 0.9354 0.9414
Segmentation performances of proposed methods (circular, Bayesian, hybrid-(R1) and hybrid-(R2) seg-
mentations) are given in the first four rows of the table. These results show that the proposed method is one
of most efficient methods among the unsupervised and supervised methods. The average accuracy reported for
some other methods, especially for supervised methods, are relatively higher, but those methods are more com-
plex and costly in terms of computational complexity. They also require sensitive and difficult adjustments, and
training to achieve the best performance. In terms of general average accuracy on both data sets, the proposed
hybrid approach shows the best performance among all unsupervised and supervised methods as given in the
table.
0.6
0.65
0.7
0.75
0.8
0.85
0.9
0.95
1
0.5 0.52 0.54 0.56 0.58 0.6R
t
Sen
siti
vity
Depth=1 (DRIVE)Depth=2 (DRIVE)Depth=3 (DRIVE)Depth=1 (STARE)Depth=2 (STARE)Depth=3 (STARE)
Figure 10. Sensitivity results of the proposed method for the threshold depths and various R t values.
According to our experiments, automatic processing of an image takes less than 1 s, which takes up to 1
h in the case of manual segmentation. The proposed method shows a quite consistent and effective performance
for the images with some degeneration or pathologies. The proposed methods are not complex or expensive and
1457

KOSE/Turk J Elec Eng & Comp Sci
they do not require very sensitive or difficult adjustments. The proposed methods can also easily be trained
to achieve the best performance. Sensitivity and specificity values of the hybrid method for the DRIVE and
STARE data sets are 0.782 and 0.977, and 0.758 and 0.978, respectively. To present the performance of the
method, sensitivity results for the DRIVE and STARE data sets for various threshold depths and various R t
values are presented in the Figure 10. These results show that the threshold depth and R t value may be chosen
by the user for a better sensitivity value if necessary.
5. Conclusion and future work
The proposed segmentation approaches are the simplest, fastest, and most efficient methods among the unsu-
pervised and supervised segmentation methods. Using the proposed methods, the complete segmentation of
vessel structure in a retinal image can be performed in less than 1 s without any user involvement. As the
results show, a large number of retinal fundus images with varying qualities are successfully segmented by the
proposed techniques.
Previous segmentation methods are more complex, and they require more computational effort than the
proposed methods because the proposed methods use only a few easily tunable threshold values. They can
easily be trained for efficient segmentation of varying quality of retinal images. Other existing methods show
various performances in detection and segmentation of blood vessels. These methods show over 90% detection
and segmentation accuracy [9,11,23–24,29]. The segmentation accuracies of the proposed hybrid methods are
about 95% on the same data sets.
The methods proposed for segmentation of retinal vessel structures in retinal images may also be used
to segment other kinds of blood vessels in the detection of other diseases such as cardiovascular disease, which
could be undertaken as future work. The test results also show that thin vessel structures cannot be fully
detected in some cases. To improve the performance of the proposed methods, more efficient preprocessing and
postprocessing operations may also be applied. Therefore, more efficient vessel segmentation techniques may
be developed for further improvement.
Acknowledgments
The author would like thank A Hoover and JJ Staal and colleagues for making their databases publicly available.
The author also thanks a faculty member of the Medical School at Karadeniz Technical University for providing
the digital color fundus images used in the study.
References
[1] Kose C, Ikibas C. A personal identification system using retinal vasculature in retinal fundus images. Expert Syst
Appl 2011; 38: 13670–13681.
[2] Lowell JA, Hunter A, Steel D, Basu A, Ryder R, Kennedy RL. Measurement of retinal vessel widths from fundus
images based on 2-D modeling. IEEE T Med Imaging 2004; 23: 1196–1204.
[3] Kose C, Sevik U, Ikibas C, Erdol H. Simple methods for segmentation and measurement of diabetic retinopathy
lesions in retinal fundus images. Comput Meth Prog Bio 2011; 107: 274–293.
[4] Gang L, Chutatape O, Krishnan SM. Detection and measurement of retinal vessels in fundus images using amplitude
modified second-order Gaussian filter. IEEE T Bio-Med Eng 2002; 49: 168–172.
[5] Kayıkcıoglu T, Gangal A, Turhal M, Kose C. A surface-based method for detection of coronary vessel boundaries
in poor quality X-ray angiogram images. Pattern Recogn Lett 2002; 23: 783–802.
1458

KOSE/Turk J Elec Eng & Comp Sci
[6] Yavuz Z, Ikibas C, Kose C. A simple analytic approach for tracking retinal vessel and measuring their diameters.
In: International Conference on Bioinformatics; 20–23 January 2010; Valencia, Spain.
[7] Cosatto VF, Liew G, Rochtchina E, Wainwright A, Zhang Y, Hsu W, Lee ML, Lau QP, Hamzah HH, Mitchell
P et al. Retinal vascular fractal dimension measurement and its influence from imaging variation: results of two
segmentation methods. Curr Eye Res 2010; 35: 850–856.
[8] Zhou H, Schaefer G, Liu T, Lin F. Segmentation of optic disc in retinal images using an improved gradient vector
flow algorithm. Multimed Tools Appl 2010; 49: 447–462.
[9] Mendonca AM, Campilho A. Segmentation of retinal blood vessels by combining the detection of centerlines and
morphological reconstruction. IEEE T Med Imaging 2006; 25: 1200–1213.
[10] Marwan DS, Eswaran C, Mueen A. An automated blood vessel segmentation algorithm using histogram equalization
and automatic threshold selection. J Digit Imaging 2011; 24: 564–572.
[11] Zhang Y, Hsu W, Lee ML. Segmentation of retinal vessels using nonlinear projections. In: IEEE International
Conference on Image Processing; 16–19 September 2007; San Antonio, TX, USA. New York, NY, USA: IEEE. pp.
541–544.
[12] Bhuiyan A, Nath B, Chua J, Kotagiri R. Blood vessel segmentation from color retinal images using unsupervised
texture classification. In: IEEE International Conference on Image Processing; 16–19 September 2007; San Antonio,
TX, USA. New York, NY, USA: IEEE. pp. 521–524.
[13] Ricci E, Perfetti R. Retinal blood vessel segmentation using line operators and support vector classification. IEEE
T Med Imaging 2007; 26: 1357–1365.
[14] Vermeer KA, Vos FM, Lemij HG, Vossepoel AM. A model based method for retinal blood vessel detection. Comput
Biol Med 2004; 34: 209–219.
[15] Ghaderi R, Hassanpour H, Shahiri M. Retinal vessel segmentation using the 2-D Morlet wavelet and neural network.
In: International Conference on Intelligent and Advanced Systems; 25–28 November 2007; Kuala Lumpur, Malaysia.
New York, NY, USA: IEEE. pp. 1251–1255.
[16] Perfetti R, Ricci E, Casali D, Costantini G. Cellular neural networks with virtual template expansion for retinal
vessel segmentation. IEEE T Circuits-II 2007; 54: 141–145.
[17] Chutatape O, Zheng L, Krishman S. Retinal blood vessel detection and tracking by matched Gaussian and Kalman
filters. In: Proceedings of the 20th Annual International Conference of the IEEE Engineering in Medicine and
Biology Society; 1998; Hong Kong. New York, NY, USA: IEEE. pp. 3144–3149.
[18] Marın D, Aquino A, Gegundez-Arias ME, Bravo JM. A new supervised method for blood vessel segmentation in
retinal images by using gray-level and moment invariants-based features. IEEE T Med Imaging 2011; 30: 146–158.
[19] Niemeijer M, Staal J, van Ginneken B, Loog M, Abramoff MD. Comparative study of retinal vessel segmentation
methods on a new publicly available database. SPIE Med Imag 2004; 5370: 648–656.
[20] Kose C, Ikibas C. Segmentation of coronary vessel structures in X-ray angiogram images by using spatial pattern
matching method. In: 23rd International Symposium on Computer and Information Sciences; 27–29 October 2009;
Istanbul, Turkey. New York, NY, USA: IEEE. pp. 1–6.
[21] Zana F, Klein JC. Segmentation of vessel-like patterns using mathematical morphology and curvature evaluation.
IEEE T Image Process 2001; 10: 1010–1019.
[22] Hoover A, Kouznetsova V, Goldbaum M. Locating blood vessels in retinal images by piecewise threshold probing
of a matched filter response. IEEE T Med Imaging 2000; 19: 203–210.
[23] Staal J, Abramoff MD, Niemeijer M, Viergever MA, Ginneken BV. Ridge-based vessel segmentation in color images
of the retina. IEEE T Med Imaging 2004; 23: 501–509.
[24] Soares JVB, Leandro JJG, Cesar RM Jr, Jelinek HF, Cree MJ. Retinal vessel segmentation using the 2-D Gabor
wavelet and supervised classification. IEEE T Med Imaging 2006; 25: 1214–1222.
1459

KOSE/Turk J Elec Eng & Comp Sci
[25] Marın D, Aquino A, Gegundez-Arias ME, Bravo JM. A new supervised method for blood vessel segmentation in
retinal images by using gray-level and moment invariants-based features. IEEE T Med Imaging 2011; 30: 146–158.
[26] You X, Peng Q, Yuan Y, Cheung Y, Lei J. Segmentation of retinal blood vessels using the radial projection and
semi-supervised approach. Pattern Recogn 2011; 44: 2314–2324.
[27] Jiang X, Mojon D. Adaptive local thresholding by verification-based multithreshold probing with application to
vessel detection in retinal images. IEEE T Pattern Anal 2003; 25: 131–137.
[28] Lam BSY, Yan H. A novel vessel segmentation algorithm for pathological retina images based on the divergence of
vector fields. IEEE T Med Imaging 2008; 27: 237–246.
[29] Chaudhuri S, Chatterjee S, Katz N, Nelson M, Goldbaum M. Detection of blood vessels in retinal images using
two-dimensional matched filters. IEEE T Med Imaging 1989; 8: 263–269.
[30] Rogers DF. Procedural Elements for Computer Graphics. New York, NY, USA: McGraw-Hill, 1988.
[31] Duda RO, Hart PE, Stork DG. Pattern Classification. Chichester, UK: John Wiley & Sons, 2001.
[32] Peng F, Schuurmans D. Combining naive Bayes and n-gram language models for text classification. Lect Notes
Comp Sci 2003; 2633: 335–350.
1460