A simple approach for THE DETERMINATION AND CHARACTERI ...
9
A simple approach for THE DETERMINATION AND CHARACTERI- ZATION OF TERNARY PHASE DIAGRAMS of aqueous two-phase systems composed of water, poly(ethylene) glycol and sodium carbonate EMANUEL V. CAPELA, JOÃO H.P.M. SANTOS, ISABEL BOAL-PALHEIROS, PEDRO J. CARVALHO, JOÃO A.P. COUTINHO, SÓNIA P.M. VENTURA, AND MARA G. FREIRE University of Aveiro • Aveiro, Portugal Emanuel V. Capela is a Ph.D. student in Chemical Engineering at the University of Aveiro, Portugal. He received his Biochemistry M.S. degree in 2016 from the University of Aveiro, Portugal. His research interests cover the development of new platforms for the purification of biopharmaceuticals using ionic liquids. © Copyright ChE Division of ASEE 2019 112 ChE laboratory João H.P.M. Santos is a Ph.D. student in Chemical Engineering at the University of Aveiro, Portugal, in collaboration with São Paulo Universi- ty, Brazil. He received his M.S. degree in Industrial and Environmental Biotechnology from the University of Aveiro. His research interests are focused on PEGylation strategies for the production of therapeutic proteins. Isabel Boal-Palheiros is a lecturer in the Department of Chemistry, University of Aveiro, Portugal. She received her Ph.D. degree in 1997 in Inorganic Chemistry from the University of Aveiro, and she has taught mainly Physical Chemistry subjects. Her current research inter- ests comprise the properties and applications of ionic liquids. Pedro J. Carvalho is an Assistant Researcher at CICECO, Univer- sity of Aveiro, Portugal. He received his Ph.D. degree in Chemical Engineering from University of Aveiro in 2011, and from 2012 to 2016 he was a post-doctoral researcher at the same institution. His research focuses on the development of efficient recovery processes in petro- chemical refineries, and their modeling. João A.P. Coutinho is a Full Professor in the Chemistry Department of University of Aveiro, Portugal. He graduated in Chemical Engineer- ing from the University of Porto, Portugal, and received his Ph.D. in Chemical Engineering in 1995 by the Technical University of Denmark. He is active on the development of sustainable purification processes to be applied in biorefinery. Sónia P.M. Ventura is an Assistant Researcher at CICECO, University of Aveiro, Portugal. She received her Ph.D. degree in Chemical Engi- neering from the University of Aveiro in 2011, and was a post-doctoral fellow at the same institution from 2012 to 2014. She works on the Blue Biorefinery concept, developing alternative processes to recover bioactive compounds from marine biomass. Mara G. Freire is a Coordinator Researcher at CICECO, in the Chemistry Department of University of Aveiro, Portugal, and principal investigator of a European Research Council Grant. She received her Ph.D. degree in Chemical Engineering from the University of Aveiro in 2007. From 2008 to 2013 she was a post-doctoral researcher at ITQB2, New University of Lisbon, Portugal. Her main interests cover the development of sustainable and integrated purification strategies for biopharmaceuticals. A n important chapter of physical chemistry courses is based on the study of physical transitions that mixtures undergo upon temperature or composi- tion changes. Phase diagrams are an efficient tool to rep- resent this type of information, enabling one to grasp at a glance whether two or more substances are mutually misci- ble, or how pressure or temperature can be tuned to achieve a particular set of equilibrium conditions. The phase diagrams may be developed using the phase rule, which is, according to Peter Atkins, “the most elegant result of the whole chem- ical thermodynamics.” [1] However mathematically simple, the Gibbs’ formulation, i.e. the meaning and the definition of phase and component, may not always be straightforward; for instance, when one or more species undergo a chemical reaction, the number of components may be difficult to es- tablish. Also, the interpretation of phase diagrams, particu- larly the most complex ones, is not always easy to grasp by students. Beyond their conceptual pedagogical value, phase diagrams bear also a practical interest in the design of sepa- ration processes, with wide industrial use. Hence, phase di- agrams are an important subject to study and have a crucial role in the academic laboratories and in industry, in the fields of chemical engineering, chemistry and biotechnology. Aqueous Two-Phase Systems (ATPS) are ternary systems formed when two hydrophilic compounds are dissolved in water above certain concentrations, spontaneously separat- ing into two liquid phases. These systems were proposed by Albertsson [2] and can be formed by polymer/polymer, polymer/salt or salt/salt combinations, dissolved in aque- ous media. [3] ATPS have emerged as prominent purification platforms due to the water-richness of the phases, simplici- ty of preparation, high resolution capacity and ability to be scaled-up. [3] Among the different polymers, poly(ethylene) glycol (PEG) has been widely used in ATPS formulations Chemical Engineering Education
Transcript of A simple approach for THE DETERMINATION AND CHARACTERI ...

A simple approach for THE DETERMINATION AND CHARACTERI-ZATION OF TERNARY PHASE DIAGRAMS
of aqueous two-phase systems composed of water, poly(ethylene) glycol and sodium carbonate
EmanuEl V. CapEla, João H.p.m. SantoS, ISabEl boal-palHEIroS, pEdro J. CarValHo, João a.p. CoutInHo, SónIa p.m. VEntura, and mara G. FrEIrE
University of Aveiro • Aveiro, Portugal
Emanuel V. Capela is a Ph.D. student in Chemical Engineering at the University of Aveiro, Portugal. He received his Biochemistry M.S. degree in 2016 from the University of Aveiro, Portugal. His research interests cover the development of new platforms for the purification of biopharmaceuticals using ionic liquids.
© Copyright ChE Division of ASEE 2019
112
ChE laboratory
João H.P.M. Santos is a Ph.D. student in Chemical Engineering at the University of Aveiro, Portugal, in collaboration with São Paulo Universi-ty, Brazil. He received his M.S. degree in Industrial and Environmental Biotechnology from the University of Aveiro. His research interests are focused on PEGylation strategies for the production of therapeutic proteins.
Isabel Boal-Palheiros is a lecturer in the Department of Chemistry, University of Aveiro, Portugal. She received her Ph.D. degree in 1997 in Inorganic Chemistry from the University of Aveiro, and she has taught mainly Physical Chemistry subjects. Her current research inter-ests comprise the properties and applications of ionic liquids.
Pedro J. Carvalho is an Assistant Researcher at CICECO, Univer-sity of Aveiro, Portugal. He received his Ph.D. degree in Chemical Engineering from University of Aveiro in 2011, and from 2012 to 2016 he was a post-doctoral researcher at the same institution. His research focuses on the development of efficient recovery processes in petro-chemical refineries, and their modeling.
João A.P. Coutinho is a Full Professor in the Chemistry Department of University of Aveiro, Portugal. He graduated in Chemical Engineer-ing from the University of Porto, Portugal, and received his Ph.D. in Chemical Engineering in 1995 by the Technical University of Denmark. He is active on the development of sustainable purification processes to be applied in biorefinery.
Sónia P.M. Ventura is an Assistant Researcher at CICECO, University of Aveiro, Portugal. She received her Ph.D. degree in Chemical Engi-neering from the University of Aveiro in 2011, and was a post-doctoral fellow at the same institution from 2012 to 2014. She works on the Blue Biorefinery concept, developing alternative processes to recover bioactive compounds from marine biomass.
Mara G. Freire is a Coordinator Researcher at CICECO, in the Chemistry Department of University of Aveiro, Portugal, and principal investigator of a European Research Council Grant. She received her Ph.D. degree in Chemical Engineering from the University of Aveiro in 2007. From 2008 to 2013 she was a post-doctoral researcher at ITQB2, New University of Lisbon, Portugal. Her main interests cover the development of sustainable and integrated purification strategies for biopharmaceuticals.
An important chapter of physical chemistry courses is based on the study of physical transitions that mixtures undergo upon temperature or composi-
tion changes. Phase diagrams are an efficient tool to rep-resent this type of information, enabling one to grasp at a glance whether two or more substances are mutually misci-ble, or how pressure or temperature can be tuned to achieve a particular set of equilibrium conditions. The phase diagrams may be developed using the phase rule, which is, according to Peter Atkins, “the most elegant result of the whole chem-ical thermodynamics.”[1] However mathematically simple, the Gibbs’ formulation, i.e. the meaning and the definition of phase and component, may not always be straightforward; for instance, when one or more species undergo a chemical reaction, the number of components may be difficult to es-tablish. Also, the interpretation of phase diagrams, particu-larly the most complex ones, is not always easy to grasp by students. Beyond their conceptual pedagogical value, phase diagrams bear also a practical interest in the design of sepa-ration processes, with wide industrial use. Hence, phase di-agrams are an important subject to study and have a crucial role in the academic laboratories and in industry, in the fields of chemical engineering, chemistry and biotechnology.
Aqueous Two-Phase Systems (ATPS) are ternary systems formed when two hydrophilic compounds are dissolved in water above certain concentrations, spontaneously separat-ing into two liquid phases. These systems were proposed by Albertsson[2] and can be formed by polymer/polymer, polymer/salt or salt/salt combinations, dissolved in aque-ous media.[3] ATPS have emerged as prominent purification platforms due to the water-richness of the phases, simplici-ty of preparation, high resolution capacity and ability to be scaled-up.[3] Among the different polymers, poly(ethylene) glycol (PEG) has been widely used in ATPS formulations
Chemical Engineering Education

113
combined with salts, since it is nontoxic, inexpensive, and biodegradable.[4] Moreover, tuning of ATPS phase diagrams and their characteristics may be achieved by varying the mo-lecular weight of PEG over a considerable range. It is gen-erally observed that the higher the molecular weight of the polymer, the stronger its capability to promote phase sepa-ration.[2] On the other hand, and amongst the various salts that can be selected to form ATPS with polymers, sodium carbonate has a strong salting-out capacity and a high abili-ty to promote phase separation. Furthermore, this salt has a diversity of uses, from food additive and acidity regulator to the manufacture of glass, detergents and paper, as well as in brine treatment, water hardness removal and wastewater pH adjustment.[5, 6]
In this experimental work the necessary tools are provid-ed for the application of this concept in chemical engineer-ing courses. The determination of ternary phase diagrams of ATPS composed of water, sodium carbonate and PEG of different molecular weights is proposed. Several laborato-ry experiments aimed at teaching liquid-liquid extraction have been reported,[7-14] yet few involve the determination of the ternary liquid-liquid phase diagrams.[15-19] Since ATPS are here proposed, this work also provides the opportuni-ty to discuss the environmental advantages associated to water-rich systems. Furthermore, the determination of the ternary phase diagrams in this experiment is achieved by simple and inexpensive procedures, that are, nonetheless, the most commonly used methods in the literature for the determination of the solubility (binodal) curves, tie-lines (TLs), tie-line lengths (TLLs), and critical points for these systems.[3]
The composition of the system in the saturation curve is
gravimetrically determined by weighing the components corresponding to the two-phase formation that is visually detected. A curve is then fitted to those experimental solu-bility points, which can be used to extrapolate data beyond the experimental range. To determine the tie-lines, a method combining experimental data, mass balance equations and computed data is used.[22] The students need to perform a non-linear regression analysis to solve a series of equations based on the lever rule. Depending on the goals of the course and on the purpose of the lab experiments, the software used by the students to build the phase diagrams may demand no or little programming, or else may challenge their ability to write a program to perform the correlation of the binodal curve and the determination of the tie-lines. For a more ad-vanced training, the liquid-liquid equilibrium data may be modelled by a local composition activity model, such as the NRTL (Non-Random Two Liquid) model.[20] This set of ex-periments is highly versatile and particularly adequate to be carried out by 3rd or 4th year students in chemical engineer-ing, and also by students in chemistry and biotechnology degrees programs.
The experimentally obtained binodal curve for the ATPS formed by water, Na2CO3 and PEG with a molecular weight of 600 g/mol (PEG 600) may be represented in a triangular ternary phase diagram, in weight fraction or weight fraction percentages (Figure 1.a). However, to define a ternary sys-tem only the amount of two components is needed, the third being dependent; since one of the components is water, the composition of the system may also be represented on an orthogonal diagram (Figure 1.b) highlighting the concen-tration of the other two components, while the amount of water is omitted. In fact, the use of triangular coordinates
Figure 1. Phase diagrams for the ternary system composed of PEG 600 + Na2CO3 + H2O at 293 K: (a) ternary representation (spanning only the composition range of interest) and (b) orthogonal representation. CP represents the critical point of the diagram, M is a random mixture point in the biphasic region of the system, and XT and XB represent the compositions of top and bottom phases of the system, respec-tively. The labels 100wH2O, 100wNa2CO3 and 100wPEG 600 represent the weight fraction percentage of H2O, Na2CO3 and PEG 600, respectively.
Vol. 53, No. 2, Spring 2019

LABORATORY DESCRIPTIONThis laboratory work is divided in two parts: experiment
1 - determination of binodal curves of ternary systems con-stituted by water, PEGs with molecular weights of 200, 400 and 600 g/mol (PEG 200, PEG 400 and PEG 600, respec-tively) and sodium carbonate (Na2CO3); and experiment 2 – determination of tie-lines, tie-line lengths and critical points of each ATPS and application of the NRTL model to the tie-line data. The students work in groups of two, and a different molecular weight PEG (200, 400 and 600 g/mol) can be assigned to each group. Two 3-hour periods (classes)
is not straightforward, and “it may be difficult to estimate the composition represented by a specific point, simply by taking a quick glance at the diagram.”[21] The orthogonal representation is the most used approach by researchers in the field of ATPS extractions[3, 22, 23]; thus, it is also important for students to become acquainted with it. It must be re-marked that, for high concentration values, the solubility limit of one of the solutes may be reached. In this case, other lines, corresponding to precipitation or solid-liquid or solid-liquid-liquid equilibrium, should be taken into ac-count, but three-phase regions are outside of the scope of this work.
In the phase diagram represented in Figure 1, the bipha-sic region is localized in the region where the PEG and salt contents are higher, i.e. below the solubility curve in Fig-ure 1.a, and above the solubility curve in Figure 1.b. Each experimental point of the binodal curve corresponds to the phase-forming components concentrations, considering the amount of PEG/salt (whether the direct/indirect method is considered, respectively) in the system (when the cloudy solution appears) and the concentration of all components in the clear system (after water addition). For a given total mix-ture composition in the biphasic region (M), the mixture un-dergoes phase separation and forms two coexisting phases, each being represented by the points XT and XB (composi-tions of top and bottom phases of the system, respective-ly), which are the end-points (nodes) of a specific tie-line (TL). Mixtures with total compositions along this specific tie-line have mass or volume ratios that differ in the coexist-ing phases; yet, the composition of each phase remains the same. The composition difference between these two phases is expressed by the tie-line length (TLL). The length of the tie-lines decreases as they approach the binodal curve and, ultimately, the tie-line length equals zero (TLL=0). At this point, i.e. at the critical point of the ternary system (point CP), the compositions of the two coexisting phases become equal - the biphasic system ceases to exist.[24] The TLL is a numerical indicator of how further apart the nodes are and, hence, is a valuable parameter in separation procedures since it correlates trends in the partitioning of solutes be-tween the two phases.
are needed. The first period/class dedicates 30 minutes to discuss/explain the details of the experiment; then, approxi-mately 60 minutes are required to collect experimental data for the first part; a computational period for each group to compute and represent the phase diagram follows; finally, the results obtained for all systems are analyzed and com-pared. The second period/class comprises 60-70 minutes for the preparation of the several mixtures (at least 5) by each group and the rest of the time is devoted to computational work: determination of mixture compositions, TLs, TLLs and critical points, and application of the NRTL model. The lab equipment requirements for the work are two or more balances (±0.1 mg) (if more than two groups share the same equipment, the time for the experiment to be accomplished increases) and one or two centrifuges (>3000 rpm; 20-50 glass vials). Experiment 1: Determination of the binodal curves of terna-ry systems constituted by PEG + Na2CO3 + H2O
The ternary phase diagrams are determined at ambient temperature and pressure by cloud point titration. Stock solutions of sodium carbonate, slightly below the salt sol-ubility saturation in water (100wsalt = 21 wt%), should have been previously prepared to use in the determination of the phase diagrams. Repetitive drop-wise addition of the salt aqueous solution to a PEG aqueous solution (100wPEG = 80 wt%) previously prepared is carried out until the detection of a cloudy solution, followed by the drop-wise addition of distilled water until the detection of a monophasic region (clear and limpid solution), as illustrated in Figure 2.
To complete the binodal curve, an indirect method is at-tempted: the repetitive drop-wise addition of the PEG aque-ous solution to the salt aqueous solution until the detection of a cloudy solution, followed by the drop-wise addition of distilled water until the detection of a monophasic region (clear and limpid solution). All of these additions are carried out under continuous stirring. The ternary system compo-sitions are determined by weight quantification of all com-ponents sequentially added, with the samples always being weighed after identifying each change from cloudy to limpid solution and vice versa.
After the experimental procedure of this first experiment, the students correlate the experimental points of the binodal curve obtained with an equation proposed by Merchuk et al.[25] which is largely used by researchers in the separations/extractions field.[3]
Figure 2. Illustration of the cloud point titration method.
Chemical Engineering Education114
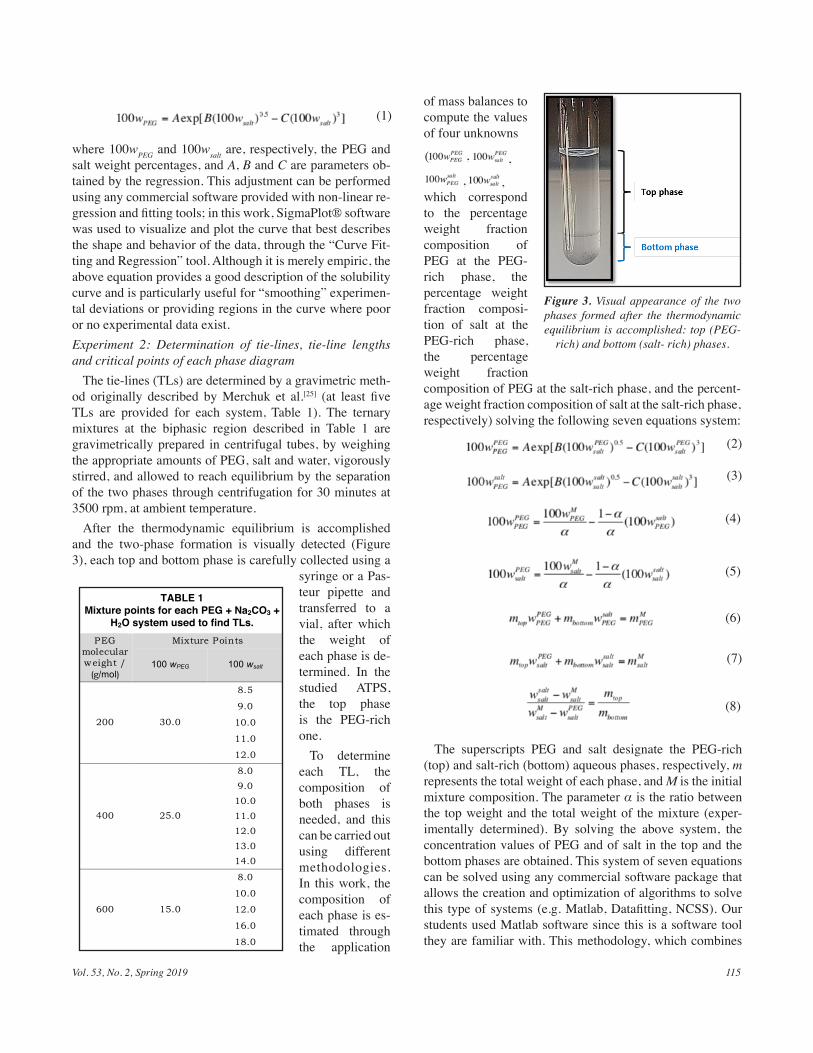
(1)
where 100wPEG and 100wsalt are, respectively, the PEG and salt weight percentages, and A, B and C are parameters ob-tained by the regression. This adjustment can be performed using any commercial software provided with non-linear re-gression and fitting tools; in this work, SigmaPlot® software was used to visualize and plot the curve that best describes the shape and behavior of the data, through the “Curve Fit-ting and Regression” tool. Although it is merely empiric, the above equation provides a good description of the solubility curve and is particularly useful for “smoothing” experimen-tal deviations or providing regions in the curve where poor or no experimental data exist. Experiment 2: Determination of tie-lines, tie-line lengths and critical points of each phase diagram
The tie-lines (TLs) are determined by a gravimetric meth-od originally described by Merchuk et al.[25] (at least five TLs are provided for each system, Table 1). The ternary mixtures at the biphasic region described in Table 1 are gravimetrically prepared in centrifugal tubes, by weighing the appropriate amounts of PEG, salt and water, vigorously stirred, and allowed to reach equilibrium by the separation of the two phases through centrifugation for 30 minutes at 3500 rpm, at ambient temperature.
After the thermodynamic equilibrium is accomplished and the two-phase formation is visually detected (Figure 3), each top and bottom phase is carefully collected using a
syringe or a Pas-teur pipette and transferred to a vial, after which the weight of each phase is de-termined. In the studied ATPS, the top phase is the PEG-rich one.
To determine each TL, the composition of both phases is needed, and this can be carried out using different methodologies. In this work, the composition of each phase is es-timated through the application
Figure 3. Visual appearance of the two phases formed after the thermodynamic equilibrium is accomplished: top (PEG-
rich) and bottom (salt- rich) phases.
of mass balances to compute the values of four unknowns
(2)
(3)
(4)
(5)
(6)
(7)
(8)
The superscripts PEG and salt designate the PEG-rich (top) and salt-rich (bottom) aqueous phases, respectively, m represents the total weight of each phase, and M is the initial mixture composition. The parameter α is the ratio between the top weight and the total weight of the mixture (exper-imentally determined). By solving the above system, the concentration values of PEG and of salt in the top and the bottom phases are obtained. This system of seven equations can be solved using any commercial software package that allows the creation and optimization of algorithms to solve this type of systems (e.g. Matlab, Datafitting, NCSS). Our students used Matlab software since this is a software tool they are familiar with. This methodology, which combines
which correspond to the percentage weight fraction composition of PEG at the PEG-rich phase, the percentage weight fraction composi-tion of salt at the PEG-rich phase, the percentage weight fraction composition of PEG at the salt-rich phase, and the percent-age weight fraction composition of salt at the salt-rich phase, respectively) solving the following seven equations system:
, ,, ,
(
TABLE 1
Mixture points for each PEG + Na2CO3 + H2O system used to find TLs.
Mixture Points PEG molecular weight /
(g/mol) 100 wPEG 100 wsalt
8.5
9.0
10.0
11.0
200 30.0
12.0
8.0 9.0
10.0 11.0 12.0 13.0
400 25.0
14.0
8.0
10.0
12.0
16.0
600 15.0
18.0
Vol. 53, No. 2, Spring 2019 115
experimental and computed data, greatly reduces the time to determine the composition of both phases of the tie-lines and has proved to provide reliable results in many ATPS.[3] The other alternative is to analytically determine the compo-sition of each phase for each mixture point.
Once a TL is determined, the calculation of the tie-line length (TLL) is a straightforward procedure, using the equa-tion shown below:
(9)
As mentioned before, several tie-lines are obtained for each system. Also, the compositions of the two phases be-come equal at the critical point. Consequently, the critical point of each ternary system may be estimated by extrapola-tion from the compositions of the TLs, using the following linear equation:
(10)
where and represent the percentage weight fraction compositions of PEG in the PEG-rich phase and Na-2CO3 in the salt-rich phase, respectively, of each determined TL, and f and g are fitting parameters that may be obtained using simple software of calculus and statistics (e.g. Micro-soft Excel, SigmaPlot, MatLab).
To provide a thorough understanding of the phase dia-gram, each group should determine several TLs, the respec-tive TLLs, and the critical point for the selected system, us-ing the experimentally determined binodal data, weight of each phase and the set of equations described above.
In a chemical engineering course, the liquid-liquid equi-librium data determined above can be further modelled us-ing a local composition model, like NRTL (Non-Random Two Liquid).[20] This is an activity coefficient model that correlates activity coefficients in the concerned liquid phase with its mole (or mass) fractions; it accounts for the differ-ence in the interaction energy of a central molecule with molecules of its own kind and that with the molecules of the other kind. This energy difference introduces non-random-ness at the local molecular level. Many works have shown the adequacy of using the NRTL model to describe poly-mer-salt ATPS.[26-28] Although the NRTL model is known to be robust and flexible enough for modeling both the ternary liquid-liquid equilibrium data and the binary subsystems us-ing a common set of parameters, determining this parameter set by fitting the model to ternary experimental tie-lines may lead to wrong descriptions of the binary subsystems (with the sign of the deviation of the ideal mixtures not matching). Thus, in the absence of LLE data for the binary subsystems, the use of the NRTL model relies on reported parameters sets. In this work, the NRTL parameters reported by Sade-ghi[29] were adopted, allowing the students to estimate the
(11)
(12)
(13)
(14)
where τij is the i-j interaction parameters, αij is related to the non-randomness of the mixture, where the common value of 0.3 is here taken as a default value for all systems.
This set of equations can be solved using any commercial software package that allows the creation and optimization of algorithms (e.g. Matlab, Maple, Mathematica). Our stu-dents used Matlab software, since this is a software they are familiar with.
HAZARDSBoth PEG 200, 400, 600 and sodium carbonate are
non-toxic and only slightly hazardous compounds in case of skin contact (irritant, permeator), eye contact (irritant), or inhalation. However, since students always wear laboratory coats, gloves and goggles, risks are minimal.
Chemical Engineering Education116
compositions at each phase through the following equations and objective function (OF),
DATA ANALYSISThe systems investigated in this work are formed by wa-
ter, Na2CO3 and PEG with three different molecular weights: 200, 400 and 600 g/mol. The binodal curves for all studied systems are presented below in the conventional triangular form (Figure 4) and orthogonal based form (Figure 5). The experimental weight fraction data of each solubility curve are given in the Supporting Information (available at http://path.web.ua.pt/publications/SICEE.pdf, Tables SI.1 – SI.3).
When the orthogonal representation is considered (Fig-ure 5), it may be appreciated that the closer the solubility (binodal) curve is to the axes, the larger is the region above the curve and thus the higher is the ability of PEG to suffer a salting-out effect and undergo liquid-liquid demixing in presence of Na2CO3 in aqueous media. As expected, the in-fluence of the length of the polymer’s chains on the phase diagram is notorious. For lower molecular weight polymers, the phase separation occurs at higher concentrations of both the polymer and the salt. In general, the ability of PEG to form ATPS in presence of the salt decreases in the follow-

Figure 4. Ternary phase diagram for the systems composed of PEG + Na2CO3 + H2O at 293 (± 1) K: (●) PEG 200; (▼) PEG 400; (■) PEG 600; (a) whole ternary phase diagram and (b) zoom of the phase diagram by changing the axis grade (span-
ning only part of the composition space of interest).
Figure 5. Orthogonal representation of phase diagram for the systems composed of PEG + Na2CO3 + H2O at 293 K:
(●) PEG 200; (▼) PEG 400; (■) PEG 600
Vol. 53, No. 2, Spring 2019 117
ing order: PEG 600 > PEG 400 > PEG 200. This behavior is a consequence of the higher hydrophobicity displayed by PEGs of higher molecular weight because they present a lower affinity for water, being thus more easily salted-out by sodium carbonate. Similar trends have been observed in other ATPS composed of polymers and salts described in the literature.[30, 31] Salting-out (or salting-in) effects are of high relevance in solution chemistry and have paramount impor-tance in ATPS, and this is a subject that students should be familiarized with.
The experimental binodal data for the studied systems were correlated by the empirical relationship described by Equation 1. The regression parameters were estimated by the least-squares regression method, and their values and the corresponding standard deviations are provided in Table SI.4 in the Supporting Information. In general, good correlation coefficients were obtained for all systems, indicating that these fittings can be used to predict data in a region of the phase diagrams where no experimental results are available.
The experimental TLs, along with their respective length (TLL), were determined through the application of Equa-tions 2-9, and are reported in Table SI.5 in the Supporting Information, as well as the TLs compositions correlated by the NRTL model that are reported in Table SI.6. The parame-ters f and g of Equation 10 were determined for each ternary system and are presented in Table SI.7, as well as the critical point (100wPEG and 100wsalt) of each system, resulting from the interception of the linear equation (a result of the extrap-olation from the TLs composition) with the binodal curve depicted in Figure 6. The representation of the experimen-tal solubility data, adjusted binodal curve through Equation 1, TLs and critical point obtained for the system composed of PEG 200 + Na2CO3 + H2O are shown in Figure 6. The equivalent data for the systems composed of PEG 400 and PEG 600 are presented in the Supporting Information (Fig-ure SI.1 and Figure SI.2, respectively).
STUDENT LEARNING AND FEEDBACKThis laboratory work was accomplished by 14 students
in the 2nd semester of the 3rd year of chemical engineering and biotechnology degrees, as a pilot study before its in-corporation in regular classes. The students were given the hand-outs a week before to allow for the necessary prepa-ration, so as to ensure a reasonable understanding of both the experimental tasks and data treatment. Two instructors supervised the lab work to better recognize and identify any difficulties along the way. The students were advised to write down the data in a logbook, but also in the spreadsheet previously prepared by them. Upon completion of both ex-perimental work and data analysis, the students were asked to fill a questionnaire about the experimental work and re-lated concepts. In general, the students were able to carry out both the experimental work and the data treatment with

Figure 6. Phase diagram for the ternary system composed of PEG 200 + Na2CO3 + H2O at 293 K, with the binodal curve data adjusted through Equation 1, TLs data (▲), critical point (•), and NRTL calculated TLs (■).
just a few doubts. The global performance of the students according to the evaluated skills is summarized in Table SI.8 in the Supporting Information.
Overall, the students’ performance on this laboratory experiment was good or satisfactory in every item under evaluation (> 50%). All students understood the concept of ternary liquid-liquid phase diagrams, and the experimental determination of the respective binodal curve. They correct-ly identified the omission of water as the main difference between the orthogonal and the ternary representations of ternary phase diagrams. Although the students were all able to correctly represent the binodal curve data using the or-thogonal phase diagrams representation and could identify the mono- and biphasic regions, only 64% did it correctly for the ternary representation of the phase diagrams. The orthogonal representation turns out to be simpler and more intuitive for non-graduated students. Regarding the molec-ular mechanisms and salting-out effects associated with the ability to form ATPS, 60% of the students correlated the ef-fect of the molecular weight of the polymer with its ability to form ATPS, while 80% had correctly identified the chemical structure of the polymer under study and were aware that it may present different molecular weights.
All students were able to apply Equation (1) to the ex-perimental data, and 80% pointed out that the main inter-est of this fitting was the capability of the fitted curve to predict regions of the binodal curve where no experimental data were acquired. This fact reveals that the students felt comfortable with computational tools and understood their relevance. In fact, fitting a curve to experimental data using non-linear regression analysis is not too different from the use of least-squares method to adjust data to a straight line, a procedure they routinely perform. However, when higher order learning skills were at stake, the performance of the students slightly decreases, but is still satisfactory. As data in Table SI.8 in the Supporting Information show, the concept of tie-line length appears to be less clear for the students, since only 64% of them were able to correctly define and ex-
Chemical Engineering Education118
plain it; the concept of critical point caused also some confusion, as some students stat-ed in their feedback. Those are more “ab-stract” concepts that can be defined but not straightforward visu-alized. Henceforth, it is important that a discussion/explana-tion takes place be-fore carrying out the experimental tasks, mainly to ensure that
the students understand the principles behind liquid-liquid equilibrium of ternary systems and associated parameters. More than half of the students (57%) were able to correct-ly determine the tie-lines, the respective tie-line lengths and the critical points of each phase diagram. Some students felt practical difficulties in the effective separation of the top and the bottom phases, which is probably the major cause for the deviations in their final results. However, this difficulty did not prevent the work to be completed since each group cor-rectly determined at least three TLs. An ineffective separa-tion of top and bottom phases leads to errors on their weight ratio, which may result in crossed TLs; when no parallel TLs are obtained the determination of the critical point of the phase diagrams may be compromised.
DISCUSSION AND CONCLUSIONSThis laboratory experiment comprises two main sets of ex-
periments: the determination of binodal (solubility) curves of ternary systems constituted by water, PEG (200, 400 and 600 g/mol) and sodium carbonate (Na2CO3), and the deter-mination of tie-lines, tie-line lengths and critical points for each ternary ATPS. The first task is entirely experimental, while the second requires the combination of experimental data with computer approaches. The experimental procedure used for determining the binodal curves was based on the cloud point titration method, in which the successive end-points correspond to the appearance and disappearance of turbidity when the system changes from one phase to two phases (or vice versa). The determination of the tie-lines by the combination of experimental and calculated data, thus not requiring the analytical quantification of each compo-nent in each phase, allows a substantial reduction in labo-ratory time and allows the students to get familiarized with the lever rule.
Upon the practical realization of these experiments, stu-dents become acquainted with the principles behind ternary liquid-liquid systems and/or ATPS, and their characterization
by the determination of the binodal curve, tie-lines, tie-line lengths and critical point, as well as in applying the NRTL activity coefficient model to ternary liquid-liquid equilibri-um data. They also have the opportunity to understand the influence of using different polymers as phase-forming com-ponents and to better address the salting-out effect displayed by inorganic salts.
A relevant feature of this set of experiments is the employ-ment of complementary computational tools to effectively characterize the ternary phase diagrams. The relatively in-tense use of computational resources, both for calculations and parameters estimation, is a distinct feature from previ-ously proposed experiments and a most valuable one in to-day’s laboratories, both in academic and in industrial envi-ronments. The students are encouraged to use commercial spreadsheets that have advanced numerical tools packages, which allow sophisticated calculations in multivariate statis-tics, as well as linear and nonlinear optimizations that are es-sential tools in laboratory techniques and scientific research. Non-linear curve fitting is a commonly used tool in chemis-try, from deconvolutions of overlapping bands in vibrational or electronic spectra to the analysis of chemical kinetics, and thus it is important for students to become acquainted with these procedures.
Overall, the results showed that this set of lab experiments is a very successful approach in enabling the students to characterize ternary liquid-liquid phase diagrams, as well as to perform the data acquisition and analysis needed. Ac-cording to the students’ preparation and needs, help with the use of software for data treatment may be provided before or along the class; the students’ previous acquaintance with the required software is a significant advantage that should be considered.
The students’ global overview of the work was posi-tive; they considered the lab class useful in helping them to better understand theoretical concepts related to ternary liquid-liquid phase diagrams. They recognized that putting into practice previously learnt concepts allowed them to ful-ly understand the main parameters needed to establish and characterize a chemical engineering process.
This work may be part of a chemical engineering course
SUPPORTING INFORMATIONAdditional information is given in the Supporting Informa-
tion, namely the experimental weight fraction data of each phase diagram; experimental TLs and TLL data; TLs com-positions correlated by the NRTL model; fitting parameters and critical points composition; performance and outputs of the students; and individual graphical representation of each phase diagram with the whole characterization. Available at: http://path.web.ua.pt/publications/SICEE.pdf.
ACKNOWLEDGEMENTSThis work was developed within the scope of the project
CICECO-Aveiro Institute of Materials, POCI-01-0145-FED-ER-007679 (FCT Ref. UID/CTM/50011/2013), financed by national funds through the FCT/MEC and when appropri-ate co-financed by FEDER under the PT2020 Partnership Agreement. E.V. Capela, J.H.P.M. Santos, S.P.M. Ventu-ra and P.J. Carvalho acknowledge FCT for the PhD grants SFRH/BD/126202/2016 and SFRH/BD/102915/2014, and the IF contracts IF/00402/2015 and IF/00758/2015, respec-tively. M.G. Freire acknowledges the European Research Council (ERC) for the Starting Grant ERC-2013- StG-337753.
Vol. 53, No. 2, Spring 2019 119
(e.g. 3rd year) or similarly oriented courses where liquid-liq-uid equilibrium data and separation processes are important. It was designed to be accomplished in two practical laborato-ry sessions and requires only common laboratory equipment along with modern computational methods to characterize and describe the phase diagrams. Students are encouraged to relate theoretical aspects of phase diagrams and experi-mental determination and characterization alongside using software to help solving chemical engineering challenges.
This lab work was also meant to update the curriculum to reflect environmental issues for chemical engineering, bio-technology, chemistry and biochemistry students at an inter-mediate level. The ATPS presented herein will familiarize students with water-rich liquid-liquid systems, which may be used in extraction and separation processes, while avoid-ing the use of volatile organic solvents.
REFERENCES 1. Atkins P and de Paula J (2002) Atkins’ Physical Chemistry, Oxford
University Press. 2. Albertsson P-Å (1986) Partition of Cell Particles and Macromole-
cules: Separation and Purification of Biomolecules, Cell Organelles, Membranes, and Cells in Aqueous Polymer Two-Phase Systems and Their Use in Biochemical Analysis and Biotechnology. John Wiley and Sons, Chichester, UK.
3. Freire MG, Cláudio AFM, Araújo JM, Coutinho JAP, Marrucho IM, Lopes JNC and Rebelo LPN (2012) Aqueous biphasic systems: a boost brought about by using ionic liquids. Chemical Society Reviews, 41 (14): 4966-4995.
4. Chen J, Spear SK, Huddleston JG and Rogers RD (2005) Polyethylene
glycol and solutions of polyethylene glycol as green reaction media. Green Chemistry, 7 (2): 64-82.
5. Marques CF, Mourão T, Neves CM, Lima ÁS, Boal-Palheiros I, Coutin-ho JAP and Freire MG (2013) Aqueous biphasic systems composed of ionic liquids and sodium carbonate as enhanced routes for the extraction of tetracycline. Biotechnology Progress, 29 (3): 645-654.
6. Block C (2003) Human and environmental risk assessment on ingre-dients of household cleaning products. Jornadas - Comite Espanol de la Detergencia, 33: 39-44.
7. Turner DE (1994) An experiment to demonstrate the effect of pH on partition coefficients in liquid-liquid extraction. Journal of Chemical Education, 71 (2): 173.

8. Loyo-Rosales JE, Torrents A, Rosales-Rivera GC and Rice CP (2006) Linking laboratory experiences to the real world: the extraction of octylphenoxyacetic acid from water. Journal of Chemical Education, 83 (2): 248.
9. Horowitz G (2003) A discovery approach to three organic laboratory techniques: extraction, recrystallization, and distillation. Journal of Chemical Education, 80 (9): 1039.
10. Jones MM and Champion GR (1978) Simple liquid-liquid extraction experiment for freshmen. Journal of Chemical Education, 55 (2): 119.
11. Radford SA, Hunter Jr RE, Barr DB and Ryan PB (2013) Liquid–liquid extraction of insecticides from juice: an analytical chemistry laboratory experiment. Journal of Chemical Education, 90 (4): 483-486.
12. Revell KD (2011) Separation of the components of a commercial analgesic tablet: a two-week sequence comparing purification by two-base extraction and column chromatography. Journal of Chemical Education, 88 (10): 1413-1415.
13. Wigman LS and Kelsch CT (1992) Separation science and chroma-tography. A colorful introduction. Journal of Chemical Education, 69 (12): 991.
14. Gordon P, Pezhathinal AJ, Rocke K, Susanto L, Handke D, Chan-Yu-King R, Losey EN and Keiter RL (2006) Colorful chemical demon-strations on the extraction of anionic species from water into ether mediated by tricaprylylmethylammonium chloride (Aliquat 336), a liquid–liquid phase-transfer agent. Journal of Chemical Education, 83 (8): 1161.
15. Clarke J (1974) Tie lines in phase diagrams for ternary liquid systems. Journal of Chemical Education, 51 (4): 255.
16. Clare B, Hefter G and Kloeden P (1985) The representation of ternary liquid composition diagrams. Journal of Chemical Education, 62 (8): 680.
17. Stead RJ and Stead K (1990) Phase diagrams for ternary liquid systems. Journal of Chemical Education, 67 (5): 385.
18. Udale BA and Wells JD (1995) A ternary phase diagram for a less hazardous system. Journal of Chemical Education, 72 (12): 1106.
19. Francis AW and Smith NO (1969) Ternary liquid systems. Journal of Chemical Education, 46 (12): 815.
20. Renon H and Prausnitz J (1969) Estimation of parameters for the NRTL equation for excess Gibbs energies of strongly nonideal liquid mixtures. Industrial & Engineering Chemistry Process Design and Development, 8 (3): 413-419.
Chemical Engineering Education120
21. MacCarthy P (1983) Ternary and quaternary composition diagrams: an overview of the subject. Journal of Chemical Education, 60 (11): 922.
22. Capela EV, Quental MV, Domingues P, Coutinho JAP and Freire MG (2017) Effective separation of aromatic and aliphatic amino acid mixtures using ionic-liquid-based aqueous biphasic systems. Green Chemistry, 19 (8): 1850-1854.
23. Taha M, Quental MV, e Silva FA, Capela EV, Freire MG, Ventura SP and Coutinho JAP (2017) Good’s buffer ionic liquids as relevant phase-forming components of self-buffered aqueous biphasic systems. Journal of Chemical Technology & Biotechnology, 92 (9): 2287-2299.
24. Kaul A (2000) The phase diagram, in Aqueous Two-Phase Systems: Methods and Protocols. Hatti-Kaul R (Ed.), Springer, Totowa, New Jersey, 11-21.
25. Merchuk JC, Andrews BA and Asenjo JA (1998) Aqueous two-phase systems for protein separation: Studies on phase inversion. Journal of Chromatography B: Biomedical Sciences and Applications, 711 (1): 285-293.
26. Zafarani-Moattar MT and Sadeghi R (2002) Measurement and cor-relation of liquid–liquid equilibria of the aqueous two-phase system polyvinylpyrrolidone–sodium dihydrogen phosphate. Fluid Phase Equilibria, 203 (1-2): 177-191.
27. Zafarani-Moattar MT and Hamzehzadeh S (2005) Liquid–liquid equi-libria of aqueous two-phase systems containing polyethylene glycol and sodium succinate or sodium formate. Calphad, 29 (1): 1-6.
28. Sadeghi R (2005) Measurement and correlation of phase equilibria for several PVP+ salt aqueous two-phase systems at 303.15 K. Fluid Phase Equilibria, 237 (1-2): 40-47.
29. Sadeghi R (2006) A modified segment-based nonrandom two-liquid model for the calculation of vapor–liquid equilibrium of aqueous poly-mer–salt solutions. Chemical Engineering Science, 61 (23): 7786-7794.
30. Azevedo AM, Gomes AG, Rosa PA, Ferreira IF, Pisco AM and Ai-res-Barros MR (2009) Partitioning of human antibodies in polyethylene glycol–sodium citrate aqueous two-phase systems. Separation and Purification Technology, 65 (1): 14-21.
31. de Souza RL, Campos VC, Ventura SP, Soares CM, Coutinho JAP and Lima ÁS (2014) Effect of ionic liquids as adjuvants on PEG-based ABS formation and the extraction of two probe dyes. Fluid Phase Equilibria, 375: 30-36. p