A Shortage of Affordable Homes - NCSHA
28
MARCH 2019 A Shortage of Affordable Homes MADE POSSIBLE BY THE GENEROSITY OF:
Transcript of A Shortage of Affordable Homes - NCSHA

MARCH 2019
A Shortage of Affordable Homes
MADE POSSIBLE BY THE GENEROSITY OF:
The National Low Income Housing Coalition 1000 Vermont Avenue, NW • Suite 500 Washington, DC 20005 202-662-1530 • https://nlihc.org © 2019 National Low Income Housing Coalition
ANDREW AURAND, Ph.D., MSW Vice President for Research
DAN EMMANUEL, MSW Senior Research Analyst
ELLEN ERRICO Creative Services Manager
DINA PINSKY Research Intern
DIANE YENTEL President and CEO
ABOUT NLIHCThe National Low Income Housing Coalition is dedicated solely to achieving socially just public policy that assures people with the lowest incomes in the United States have affordable and decent homes.
Founded in 1974 by Cushing N. Dolbeare, NLIHC educates, organizes and advocates to ensure decent, affordable housing for everyone.
Our goals are to preserve existing federally assisted homes and housing resources, expand the supply of low income housing, and establish housing stability as the primary purpose of federal low income housing policy.
A Shortage of Affordable Homes
NLIHC BOARD OF DIRECTORSGreg Payne, Chair, Portland, MEDara Baldwin, Washington, DCRussell “Rusty” Bennett, Birmingham, ALDelorise Calhoun, Cincinnati, OHEmma “Pinky” Clifford, Pine Ridge, SDYanira Cortes, Toms River, NJLot Diaz, Washington, DCChris Estes, Washington, DCDaisy Franklin, Norwalk, CTDora Leong Gallo, Los Angeles, CADeirdre “DeeDee” Gilmore, Charlottesville, VAAaron Gornstein, Boston, MAMoises Loza, Alexandria, VARachael Myers, Seattle, WAMarla Newman, Winston-Salem, NCKarlo Ng, San Francisco, CAAnn O’Hara, Boston, MACrishelle Palay, Houston, TXBob Palmer, Chicago, IL Eric Price, Washington, DCNan Roman, Washington, DCShauna Sorrells, Kensington, MDMichael Steele, New York, NYMartha Weatherspoon, Clarksville, TNSim Wimbush, Richmond, VA
NLIHC STAFFSonya Acosta, Policy Analyst Andrew Aurand, Vice President for ResearchVictoria Bourret, Housing Advocacy OrganizerJosephine Clarke, Executive AssistantDan Emmanuel, Senior Research AnalystEllen Errico, Creative Services ManagerEd Gramlich, Senior AdvisorPaul Kealey, Chief Operating Officer Mike Koprowski, Director, Multisector Housing
CampaignJoseph Lindstrom, Manager of Field OrganizingLisa Marlow, Communications CoordinatorSarah Mickelson, Senior Director of Public PolicyKhara Norris, Director of AdministrationCatherine Reeves, Development CoordinatorBrooke Schipporeit, Housing Advocacy OrganizerElayne Weiss, Senior Housing Policy AnalystChantelle Wilkinson, Multisector Housing Campaign
CoordinatorRenee Willis, Vice President for Field and
CommunicationsDiane Yentel, President and CEO
MARCH 2019

NATIONAL LOW INCOME HOUSING COALITION i
TABLE OF CONTENTSIntroduction . . . . . . . . . . . . . . . . . . . . . . . . . . . . . . . . . . . . . . . . . . . . . . 1
Shortage of Affordable Rental Homes . . . . . . . . . . . . . . . . . . . . . . . 2
Affordable, but Not Available . . . . . . . . . . . . . . . . . . . . . . . . . . . . . . 3
Cost Burdens . . . . . . . . . . . . . . . . . . . . . . . . . . . . . . . . . . . . . . . . . . . . . 5
The Housing Shortage for Extremely Low-Income Renters by State . . . . . . . . . . . . . . . . . . . . . . . . . . . . . . . 7
The Housing Shortage for Extremely Low-Income Renters in the 50 Largest Metros . . . . . . . . . . . . . . . . 8
Who Are Extremely Low-Income Renters? . . . . . . . . . . . . . . . . . . . . . . . . . . . . . . . . . . . . . . 9
Racial Disparities and Extremely Low-Income Renters . . . . . . . . 10
A Systemic National Shortage of Rental Housing for Extremely Low-Income Households . . . . . . . . . . . . . 11
Federal Policy Solutions for the Lowest Income People . . . . . . . 13
The Case for Affordable Homes . . . . . . . . . . . . . . . . . . . . . . . . . . . . 15
Conclusion . . . . . . . . . . . . . . . . . . . . . . . . . . . . . . . . . . . . . . . . . . . . . . 16
About the Data . . . . . . . . . . . . . . . . . . . . . . . . . . . . . . . . . . . . . . . . . . 16
For More Information . . . . . . . . . . . . . . . . . . . . . . . . . . . . . . . . . . . . . 17
References . . . . . . . . . . . . . . . . . . . . . . . . . . . . . . . . . . . . . . . . . . . . . . 18
Appendix A: State Comparisons . . . . . . . . . . . . . . . . . . . . . . . . . . . 20
Appendix B: Metropolitan Comparisons . . . . . . . . . . . . . . . . . . . . 21

Made Possible By The Generous Support Of

THE GAP A SHORTAGE OF AFFORDABLE HOMES, 2019
NATIONAL LOW INCOME HOUSING COALITION 1
Affordable, decent, and accessible housing is of critical importance to our well-being, providing a stable foundation for child and
parental health, childhood cognitive development, educational achievement, and employment (Brennan, Reed, & Sturtevant, 2014; Desmond & Gershenson, 2016; Newman & Holupka, 2015; Sandel et al., 2016). Yet the supply of affordable homes in America is woefully inadequate, especially for the nation’s lowest-income families and individuals.
Each year, NLIHC examines the American Community Survey (ACS) to determine the availability of rental homes affordable to extremely low-income households – those with incomes at or below the poverty line or 30% of the area median income (AMI), whichever is greater - and other income groups (Box 1). The annual report provides a picture for the nation, each state plus the District of Columbia (DC), and the largest metropolitan areas. This year’s key findings include:• Extremely low-income renters in the U.S. face a
shortage of seven million affordable and available rental homes. Only 37 affordable and available homes exist for every 100 extremely low-income renter households.
• Seventy-one percent (7.8 million) of the nation’s 11 million extremely low-income renter households are severely housing cost-burdened, spending more than half of their incomes on rent and utilities. They account for 73% of all severely cost-burdened renters in the U.S.
1 We use renters and renter households interchangeably to refer to renter households throughout this report.
• Extremely low-income renters are much more likely to be severely housing cost-burdened than other income groups. Thirty-two percent of very low-income, eight percent of low-income, and two percent of middle-income renters are severely cost-burdened.1
• Forty-eight percent of extremely low-income renter households are seniors or disabled, and another 44% are in the labor force or in school, or are single-adult caregivers.
• Native American, black, and Hispanic renters are more likely than white renters to have extremely low incomes. Among renters, 38% of American Indian or Alaskan Native households, 35% of black households, 28% of Hispanic households, and 22% of white non-Hispanic households have extremely low incomes.
• No state has an adequate supply of affordable and available homes for extremely low-income renters. The current relative supply ranges from 19 affordable and available homes for every 100 extremely low-income renter households in Nevada to 66 in Wyoming.
• The shortage of affordable homes ranges from 5,800 in Wyoming to one million in California.
The private market provides too few homes affordable to the lowest-income renters. What extremely low-income renters can afford to pay for rent does not cover the development and operating costs of new housing, and it often is not sufficient to provide an incentive for landlords to maintain older housing. On average, the most an extremely low-income family
INTRODUCTION
DEFINITIONSAREA MEDIAN INCOME (AMI): The median family income in the metropolitan or nonmetropolitan areaEXTREMELY LOW-INCOME (ELI): Households with income at or below the Poverty Guideline or 30% of AMI, whichever is higherVERY LOW-INCOME (VLI): Households with income between ELI and 50% of AMILOW-INCOME (LI): Households with income between 51% and 80% of AMIMIDDLE-INCOME (MI): Households with income between 81% and 100% of AMIABOVE MEDIAN INCOME: Households with income above 100% of AMICOST BURDENED: Spending more than 30% of household income on housing costsSEVERELY COST BURDENED: Spending more than 50% of household income on housing costs

2 NATIONAL LOW INCOME HOUSING COALITION
THE GAP A SHORTAGE OF AFFORDABLE HOMES, 2019
of four could afford, without housing assistance, in monthly rent was $660 in 2018; the average cost of a modest two-bedroom rental home at the fair market rent was $1,149 (NLIHC, 2018d). Meanwhile, three out of four low-income households in need of federal housing assistance do not receive it because of insufficient funding (Fischer & Sard, 2017).
We must build the political will for a large-scale and sustained commitment to affordable housing programs designed to serve the lowest-income families, those with the greatest and clearest need. These programs include the national Housing Trust Fund (HTF), Housing Choice Vouchers (HCVs), and public housing. We also should expand and improve other programs, like the Low Income Housing Tax Credit, to better serve the lowest income renters with the greatest need for assistance.
2 Affordability is based on the common standard that households should not spend more than 30% of their income on housing.
SHORTAGE OF AFFORDABLE RENTAL HOMESEleven million of the nation’s 43.3 million renter households have extremely low incomes, but only 7.4 million rental homes are affordable to them, leaving an absolute shortage of 3.6 million affordable rental homes.2 Extremely low-income renters are the only income group to face this absolute shortage of affordable homes.
The shortage of affordable homes for extremely low-income renters becomes a surplus for households with higher incomes (Figure 1). Nine million rental homes are affordable specifically to the 6.6 million very low-income renter households with incomes higher than the extremely low-income threshold (poverty level or
FIGURE 1: RENTERS AND RENTAL UNITS IN THE US, MATCHED BY INCOME CATEGORIES AND AFFORDABILITY, 2017 (IN MILLIONS)
Source: NLIHC tabulations of 2017 ACS PUMS data.
Extremely Low-Income Very Low-Income Low-Income Middle-Income Above Median Income
Households(By Income Category)
11.0 Households
6.6 Households
9.0 Households
4.5 Households
12.2 HouseholdsAFFORDABLE
AFFORDABLE
AFFORDABLE
AFFORDABLE
AFFORDABLE
Cumulative Units(By Affordability Category)
45.6 units40.9 + 4.7=
40.9 Units35.3 + 5.6 =
35.3 Units16.4 + 18.9 =
16.4 Units 7.4 + 9.0 =
7.4 Units
THE GAP A SHORTAGE OF AFFORDABLE HOMES, 2019
NATIONAL LOW INCOME HOUSING COALITION 3
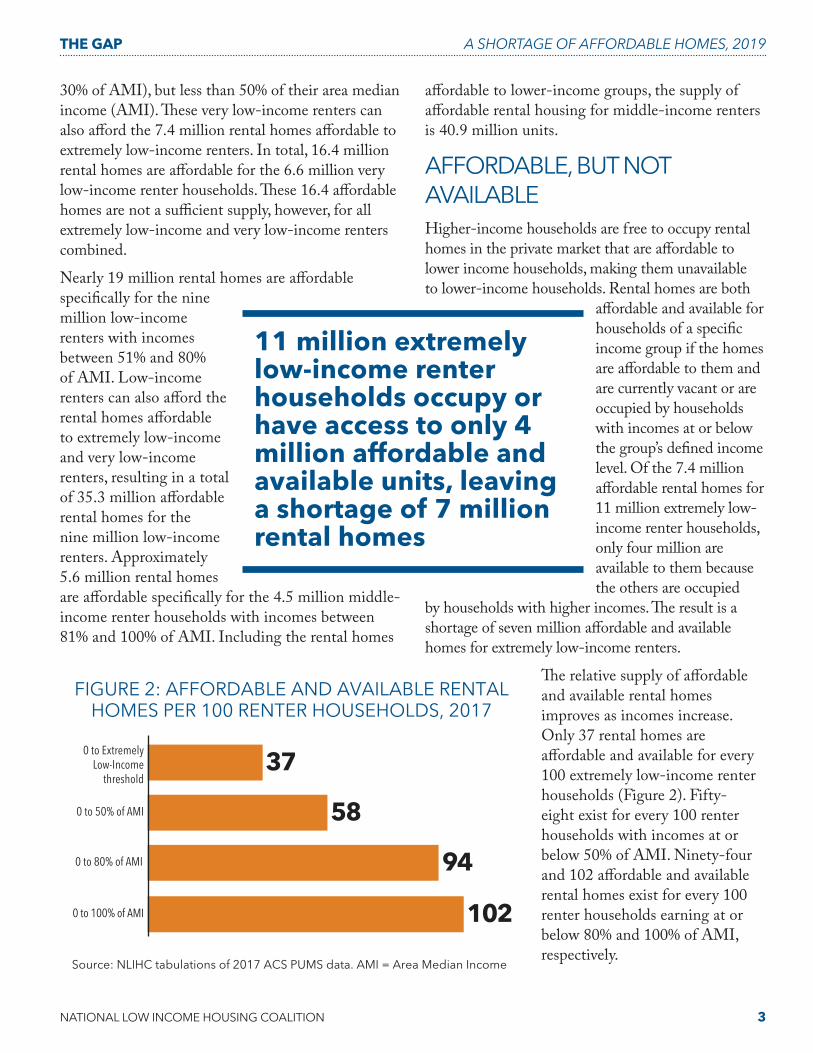
30% of AMI), but less than 50% of their area median income (AMI). These very low-income renters can also afford the 7.4 million rental homes affordable to extremely low-income renters. In total, 16.4 million rental homes are affordable for the 6.6 million very low-income renter households. These 16.4 affordable homes are not a sufficient supply, however, for all extremely low-income and very low-income renters combined.
Nearly 19 million rental homes are affordable specifically for the nine million low-income renters with incomes between 51% and 80% of AMI. Low-income renters can also afford the rental homes affordable to extremely low-income and very low-income renters, resulting in a total of 35.3 million affordable rental homes for the nine million low-income renters. Approximately 5.6 million rental homes are affordable specifically for the 4.5 million middle-income renter households with incomes between 81% and 100% of AMI. Including the rental homes
affordable to lower-income groups, the supply of affordable rental housing for middle-income renters is 40.9 million units.
AFFORDABLE, BUT NOT AVAILABLEHigher-income households are free to occupy rental homes in the private market that are affordable to lower income households, making them unavailable to lower-income households. Rental homes are both
affordable and available for households of a specific income group if the homes are affordable to them and are currently vacant or are occupied by households with incomes at or below the group’s defined income level. Of the 7.4 million affordable rental homes for 11 million extremely low-income renter households, only four million are available to them because the others are occupied
by households with higher incomes. The result is a shortage of seven million affordable and available homes for extremely low-income renters.
The relative supply of affordable and available rental homes improves as incomes increase. Only 37 rental homes are affordable and available for every 100 extremely low-income renter households (Figure 2). Fifty-eight exist for every 100 renter households with incomes at or below 50% of AMI. Ninety-four and 102 affordable and available rental homes exist for every 100 renter households earning at or below 80% and 100% of AMI, respectively.
FIGURE 2: AFFORDABLE AND AVAILABLE RENTAL HOMES PER 100 RENTER HOUSEHOLDS, 2017
Source: NLIHC tabulations of 2017 ACS PUMS data. AMI = Area Median Income
102
94
58
37
0 to 100% of AMI
0 to 80% of AMI
0 to 50% of AMI
0 to ExtremelyLow-Income
threshold
11 million extremely low-income renter households occupy or have access to only 4 million affordable and available units, leaving a shortage of 7 million rental homes
4 NATIONAL LOW INCOME HOUSING COALITION
THE GAP A SHORTAGE OF AFFORDABLE HOMES, 2019
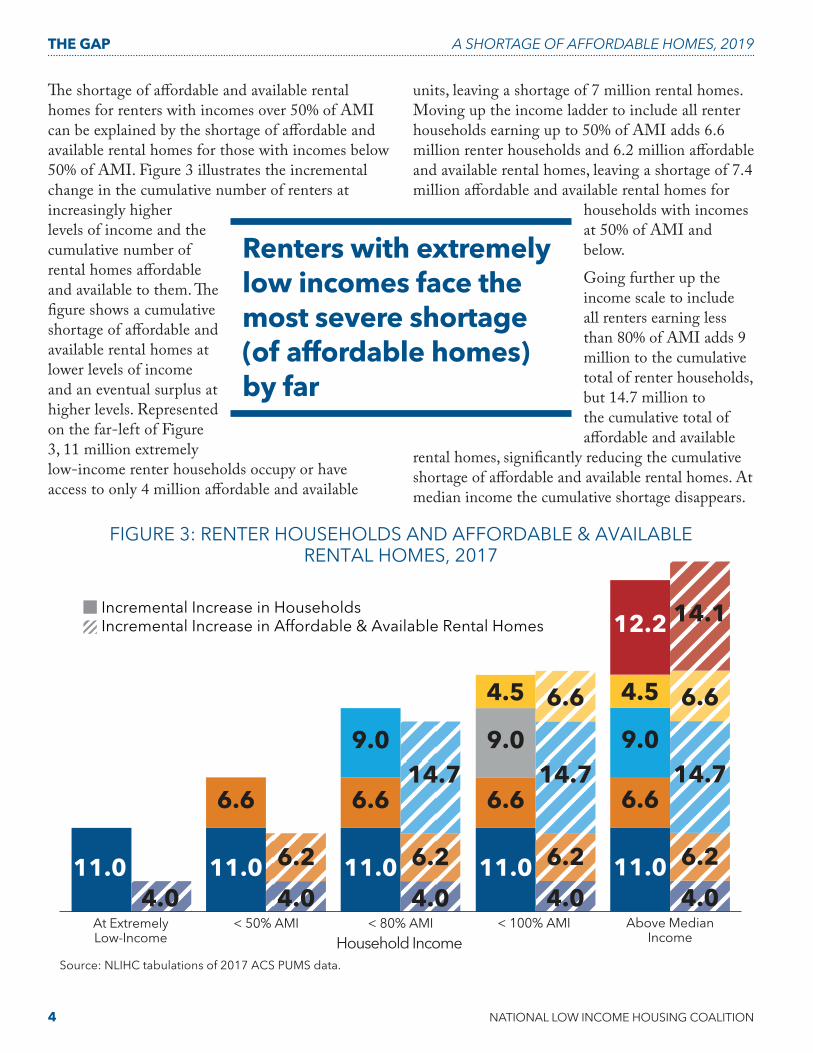
The shortage of affordable and available rental homes for renters with incomes over 50% of AMI can be explained by the shortage of affordable and available rental homes for those with incomes below 50% of AMI. Figure 3 illustrates the incremental change in the cumulative number of renters at increasingly higher levels of income and the cumulative number of rental homes affordable and available to them. The figure shows a cumulative shortage of affordable and available rental homes at lower levels of income and an eventual surplus at higher levels. Represented on the far-left of Figure 3, 11 million extremely low-income renter households occupy or have access to only 4 million affordable and available
units, leaving a shortage of 7 million rental homes. Moving up the income ladder to include all renter households earning up to 50% of AMI adds 6.6 million renter households and 6.2 million affordable and available rental homes, leaving a shortage of 7.4 million affordable and available rental homes for
households with incomes at 50% of AMI and below.
Going further up the income scale to include all renters earning less than 80% of AMI adds 9 million to the cumulative total of renter households, but 14.7 million to the cumulative total of affordable and available
rental homes, significantly reducing the cumulative shortage of affordable and available rental homes. At median income the cumulative shortage disappears.
FIGURE 3: RENTER HOUSEHOLDS AND AFFORDABLE & AVAILABLERENTAL HOMES, 2017
Source: NLIHC tabulations of 2017 ACS PUMS data.
Incremental Increase in Households Incremental Increase in Affordable & Available Rental Homes
Household Income
11.04.0
6.6
6.2
9.014.7
< 80% AMI
11.04.0
6.6
6.2
< 50% AMI
11.04.0
6.6
6.2
9.014.7
4.5 6.6
< 100% AMI
11.04.0
6.6
6.2
9.014.7
4.5 6.6
12.2 14.1
Above MedianIncome
11.04.0
At ExtremelyLow-Income
Renters with extremely low incomes face the most severe shortage (of affordable homes) by far

THE GAP A SHORTAGE OF AFFORDABLE HOMES, 2019
NATIONAL LOW INCOME HOUSING COALITION 5
Figure 4 illustrates the incremental change in the cumulative deficit and eventual surplus of affordable and available rental homes with each step-up in income. Renters with extremely low incomes face the most severe shortage by far, and the cumulative shortages of homes available and affordable for households with higher incomes are largely attributable to the shortage for the lowest income renters.
COST BURDENSHouseholds are considered housing cost-burdened when they spend more than 30% of their incomes on rent and utilities. They are considered severely cost-burdened when they spend more than half of their incomes on their housing. More than 9 million extremely low-income renters, 5 million very low-income renters, and 4 million low-income renters are cost-burdened (Figure 5). Combined, extremely low-, very low-, and low-income renters with incomes below 80% of AMI account for 92% of all cost-burdened renters.
Of the 10.7 million severely housing cost-burdened renter households, approximately 7.8 million are extremely low-income, 2.1 million are very low-income, and 684,000 are low-income. Extremely low-income renters account for nearly 73% of all severely cost-burdened renters in the U.S (Figure 6). Combined, extreme low-, very low-, and low-income households account for more than 98% of all severely cost-burdened renters.
3 The weighted average of 30% of HUD Median Family Income for Fair Market Rent (FMR) areas (NLIHC, 2018d).
Extremely low-income renters have little, if any, money remaining for other necessities after paying their rent. A severely cost-burdened extremely low-income family of four with monthly income of $1,8393, for example, has $690 remaining for all other non-housing expenses after renting an average two-bedroom apartment at the fair market rent
FIGURE 4: INCREMENTAL CHANGE TO SURPLUS (DEFICIT) OF AFFORDABLE AND AVAILABLE
RENTALS, 2017 (IN MILLIONS)
-8.0
-6.0
-4.0
-2.0
0.0
2.0
4.0
6.0
8.0
-7.0Extremely
Low-Income (ELI)
-0.4
> ELI to 50%of AMI
5.7
51% to 80%of AMI
2.1
81% to 100%of AMI
1.9
Abovemedian
FIGURE 5: RENTER HOUSEHOLDS WITH COST BURDEN BY INCOME GROUP, 2017
Source: NLIHC tabulations of 2017 ACS
9,425,712
7,761,502
ExtremelyLow-Income
5,064,746
2,115,593
VeryLow-Income
4,080,235
684,343
Low-Income
892,56788,416
Middle-Income
714,82554,115
AboveMedian Income
Cost Burden
Severe Cost Burden

6 NATIONAL LOW INCOME HOUSING COALITION
THE GAP A SHORTAGE OF AFFORDABLE HOMES, 2019
of $1,149.4 The U.S. Department of Agriculture’s (2018) thrifty food budget for a family of four (two adults and two school-aged children) is $640 per month, leaving only $50 for transportation, child care, and other necessities.
Severely housing cost-burdened and poor renters make significant sacrifices to pay for housing. Poor families with children who are severely cost-burdened spend 46%, or $354 per month, less on food, transportation, and healthcare than poor families who are not housing cost-burdened ( Joint Center for Housing Studies, 2018). Even with these sacrifices, severe housing cost burdens make it difficult for poor renters to keep up with their rent. The 2013 American Housing Survey (AHS) indicates severely cost-burdened poor renters are more than twice as likely to fall behind on their rent, and be threatened with eviction, than poor renters with no cost burden.
4 The weighted average of two-bedroom FMRs by FMR area (NLIHC, 2018d).
Financial hardships and housing instability caused by the lack of affordable housing have significant consequences for the health and well-being of poor families. Cost-burdened adults are more likely to cut-back on needed prescription medications or healthcare treatments (Maqbool, Viveiros, & Ault, 2015). A recent study of more than 22,000 families with children found that those who were behind on paying their rent were at higher risk of fair or poor health for both the children and their caregivers (Sandel, et al., 2018). These families were also at higher risk of other hardships like food insecurity and foregone healthcare.
Children’s cognitive development and academic achievement also suffer from the lack of affordable housing. A national study found
that children of cost-burdened families perform worse on cognitive development tests than children of families in affordable housing, likely due to lower expenditures on child enrichment (Newman & Holupka, 2015; Newman & Holupka, 2014). Families who cannot keep up with their rent may be more likely to experience forced moves because of eviction or fear of eviction. This housing instability disrupts learning and negatively impacts academic achievement, especially among elementary and middle-school students (Brennan, Reed, Sturtevant, 2014; Herbers et al., 2012; Voight, Shinn, & Nation, 2012).
Housing instability and homelessness can cause significant disruptions to critical health services, especially for chronically ill individuals, and increase adverse mental health outcomes related to stress (Maqbool, Viveiros, & Ault 2015). And a study of
FIGURE 6: SEVERELY HOUSING COST-BURDENED RENTERS BY INCOME, 2017
Source: NLIHC tabulations of 2017 ACS
ExtremelyLow-Income
72.5%
Very Low-Income
19.8%
Low-Income
6.4%
Middle-Income
0.8% AboveMedian Income
0.5%

THE GAP A SHORTAGE OF AFFORDABLE HOMES, 2019
NATIONAL LOW INCOME HOUSING COALITION 7
almost 10,000 mothers found that the infants of mothers who were homeless during pregnancy were at higher risk of low birth weight and pre-term delivery than babies of mothers stably housed (Cutts et al., 2014).
THE HOUSING SHORTAGE FOR EXTREMELY LOW-INCOME RENTERS BY STATENo state has an adequate supply of rental housing affordable and available for extremely low-income households (Figure 7 and Appendix A). The shortage ranges from 5,799 rental homes in Wyoming to more than one million in California.
The states where extremely low-income renters face the greatest challenges finding affordable homes are Nevada, with only 19 affordable and available rental homes for every 100 extremely low-income renter households, California (22 for every 100 extremely low-income renter households), Arizona (25/100), Florida (26/100), and Oregon (28/100). The states with the greatest relative supply of affordable and available rental homes for extremely low-income renters still have significant shortages. The five top states are Wyoming, with 66 affordable and available rental homes for every 100 extremely low-income renter households, Mississippi (64/100), Alabama (62/100), West Virginia (61/100), and Arkansas (56/100).
FIGURE 7: RENTAL HOMES AFFORDABLE AND AVAILABLEPER 100 EXTREMELY LOW INCOME RENTER HOUSEHOLDS BY STATE
Note: Extremely low income (ELI) renter households have incomes at or below the poverty level or 30% of the area median income. Source: NLIHC tabulations of 2017 ACS PUMS Data.
ME52
NH31
MA–46
CT–38
NY37
PA42 NJ–33
DE–38
MD–33VA40
WV61
OH43IN
37
MI37
IL35
WI37
MN39
IA44
MO42
AR56
LA44TX
29
OK47
KS43
NE39
ND53
SD48
MT45
ID48
WA29
OR28
CA22
AK37
HI39
WY66
CO28
UT36
NV19
AZ25 NM
41
NC43TN
46
KY53
SC48GA
39AL62
MS64
FL26
RI–54
VT35
DC–40
30 or Fewer
Between 31 and 40
Between 41 and 45
More than 45

8 NATIONAL LOW INCOME HOUSING COALITION
THE GAP A SHORTAGE OF AFFORDABLE HOMES, 2019
A majority of extremely low-income renters are severely housing cost-burdened in every state. The states with the greatest percentage of extremely low-income renter households with severe cost burdens are Florida (80%), Nevada (79%), Arizona (78%), California (76%), and Colorado (76%). Maine has the smallest, but still significant, percentage of extremely low-income renters with severe cost burdens (53%).
The state shortages of affordable and available rental homes declines for households higher up the income ladder. Forty-eight states and DC have a cumulative shortage of affordable and available rental homes for renters with household incomes below 50% of AMI. Fourteen states and DC have a cumulative shortage for all renters with household incomes below 80% of AMI, and nine states have a cumulative shortage for all renters with household incomes up to the median income. These states, which include California, Hawaii, New York, Oregon, Florida, Washington, and Massachusetts, tend to be home to high-cost metropolitan regions.
THE HOUSING SHORTAGE FOR EXTREMELY LOW-INCOME RENTERS IN THE 50 LARGEST METROSEvery major metropolitan area in the U.S. has a shortage of affordable and available rental homes for extremely low-income renters (Table 1 and Appendix B). Of the 50 largest metropolitan areas, extremely low-income renters face the most severe shortages in Orlando, FL, with 13 affordable and available rental homes for every 100 extremely low-income renter households, Las Vegas, NV (14/100), Riverside, CA (17/100), Los Angeles, CA (18/100), and Houston, TX (19/100).
Of the 50 largest metropolitan areas, those with the least severe shortages of rental homes affordable and available to extremely low-income renters are Pittsburgh with 51 for every 100 extremely low-income renter households, Providence, RI (49/100), Boston, MA (46/100), Cincinnati, OH (44/100), and Louisville, KY (43/100).
TABLE 1: LARGE METROPOLIAN AREAS WITH THE LEAST AND MOST SEVERE SHORTAGES OF RENTAL HOMES AFFORDABLE TO EXTREMELY LOW INCOME
HOUSEHOLDS
LEAST SEVERE MOST SEVERE
Metropolitan Area
Affordable and Available Rental Homes per 100
Renter Households
Metropolitan Area
Affordable and Available Rental Homes per 100
Renter Households
Pittsburgh, PA 51 Orlando-Kissimmee-Sanford, FL 13Providence-Warwick, RI-MA 49 Las Vegas-Henderson-Paradise, NV 14Boston-Cambridge-Newton, MA-NH 46 Riverside-San Bernardino-Ontario, CA 17Cincinnati, OH-KY-IN 44 Los Angeles-Long Beach-Anaheim, CA 18Louisville/Jefferson County, KY-IN 43 Houston-The Woodlands-Sugar Land, TX 19Cleveland-Elyria, OH 41 San Diego-Carlsbad, CA 20Buffalo-Cheektowaga-Niagara Falls, NY 40 Dallas-Fort Worth-Arlington, TX 20Virginia Beach-Norfolk-Newport News, VA-NC 39 Austin-Round Rock, TX 21Baltimore-Columbia-Towson, MD 38 Tampa-St. Petersburg-Clearwater, FL 21Jacksonville, FL 37 Phoenix-Mesa-Scottsdale, AZ 21
Source: NLIHC tabulations of 2017 ACS PUMS data.

THE GAP A SHORTAGE OF AFFORDABLE HOMES, 2019
NATIONAL LOW INCOME HOUSING COALITION 9
Each of the 50 largest metropolitan areas has a shortage of rental homes affordable and available for renters with household incomes below 50% of AMI. The shortages begin to disappear at higher incomes. Twenty-six of the 50 largest metropolitan areas have a cumulative shortage of affordable and available rental homes for all renters with household incomes up to 80% of AMI. Only 11 of them have a cumulative shortage for all renters with household incomes up to the median income.
WHO ARE EXTREMELY LOW-INCOME RENTERS?Renters with special needs and seniors are more likely than other renters to have extremely low incomes. Twenty-five percent of all renter households have extremely low incomes, but 45% of
5 A disabled household is one whose householder and householder’s spouse (if applicable) are younger than 62 and at least one of them has a disability. A senior household is one whose householder or householder’s spouse (if applicable) is at least 62 years of age.
renter households who are disabled and 33% who are senior households have extremely low incomes.5
The Trump Administration proposes higher rents, ineffective work requirements, and other rent reforms to encourage work among low-income recipients of housing assistance. The vast majority of extremely low-income renters, however, already work in low-wage jobs or they are unable to work. Thirty-nine percent of extremely low-income renter households are in the labor force, while 26% are seniors, 22% have a disability, and another 5% are not in the labor force, but are students or single-adult caregivers to a young child or household member with a disability (Figure 8).
More than three-quarters of extremely low-income households in the labor force work more than 20 hours per week, but low-wage employment does not
FIGURE 8: EXTREMELY LOW INCOME RENTER HOUSEHOLDS
Note: Mutually exclusive categories applied in the following order: senior, disabled, in labor force, enrolled in school, single adult caregiver of a child under 7 or of a household member with a disability, and other. Senior means householder or householder’s spouse (if applicable) is at least 62 years of age. Disabled means householder and householder’s spouse (if applicable) are younger than 62 and at least one of them has a disability. Unemployed means household and householder's spouse (if applicable) are younger than 62 and both are unemployed. Working hours is usual number of hours worked by householder and householder's spouse (if applicable). Enrolled in school means householder and householder's spouse (if applicable) are enrolled in school. Fifteen percent of extremely low-income renter households include a single adult caregiver, more than half of whom usually work more than 20 hours per week and 2% of whom are in school. Source: 2017 ACS PUMS.
Single non-disabled non-elderly caregiverof person w/ disability or young child
2%School
3%
40+ hours / week
20 to 39 hours / week
< 20 hours / week
Unemployed
Other
8%
Disabled
22%
Senior
26%
In Labor Force
39%34%
43%
10%12%

10 NATIONAL LOW INCOME HOUSING COALITION
THE GAP A SHORTAGE OF AFFORDABLE HOMES, 2019
provide them adequate income to afford housing. The national average of what a full-time worker, working 40 hours per week for 52 weeks of the year, needs to earn to afford a modest one-bedroom or two-bedroom apartment is $17.90 or $22.10 per hour, respectively (NLIHC, 2018d). Low-wage employment will continue to grow. Seven of the ten occupations projected to add the most jobs over the next decade, including medical assistants, home health aides, janitors, and food servers, provide a lower median wage than what is needed to afford modest rental housing (NLIHC, 2018d).
Fifteen percent of extremely low-income renters are single-adult caregivers of a young child or of a household member with a disability. More than half (53%) of these caregivers also participate in the labor market. More than one-quarter of these caregivers work full-time and another one-quarter usually work between 20 and 39 hours per week. Without housing assistance or an increase in their hourly wage, they cannot rely on their work hours to afford their homes.
RACIAL DISPARITIES AND EXTREMELY LOW-INCOME RENTERSBlack, Native American, and Hispanic households are more likely than white households to be extremely low-income renters. Twenty percent of black households, 18% of American Indian or Alaska Native (AIAN) households, and 16% of Hispanic households are extremely low-income renters. Six percent of white non-Hispanic households are extremely low-income renters.
This racial disparity is the result of higher homeownership rates and higher incomes among white households. Decades of racial discrimination in real estate, lending practices, and federal housing policy have made homeownership difficult to obtain for minorities (Rice & Swesnik, 2012). While overt discrimination was outlawed by the Fair Housing Act, today’s credit scoring system and lending practices continue as barriers to minority homeownership (Rice & Swesnik, 2012; Bartlett,
Morse, Stanton, & Wallace, 2018). Racial disparities in income are the result of historical and current discrimination, and differences in educational attainment and wage and employment rates, among other factors. Blacks continue to have lower rates of upward mobility than whites (Chetty, Hendren, Jones, and Porter, 2018). In 2016, the median black and Hispanic worker earned 65% and 63% of the median white worker, respectively. The lowest-income black and Hispanic workers earned 54% and 66% of the lowest-income white workers, respectively (Kochhar & Cilluffo, 2018).
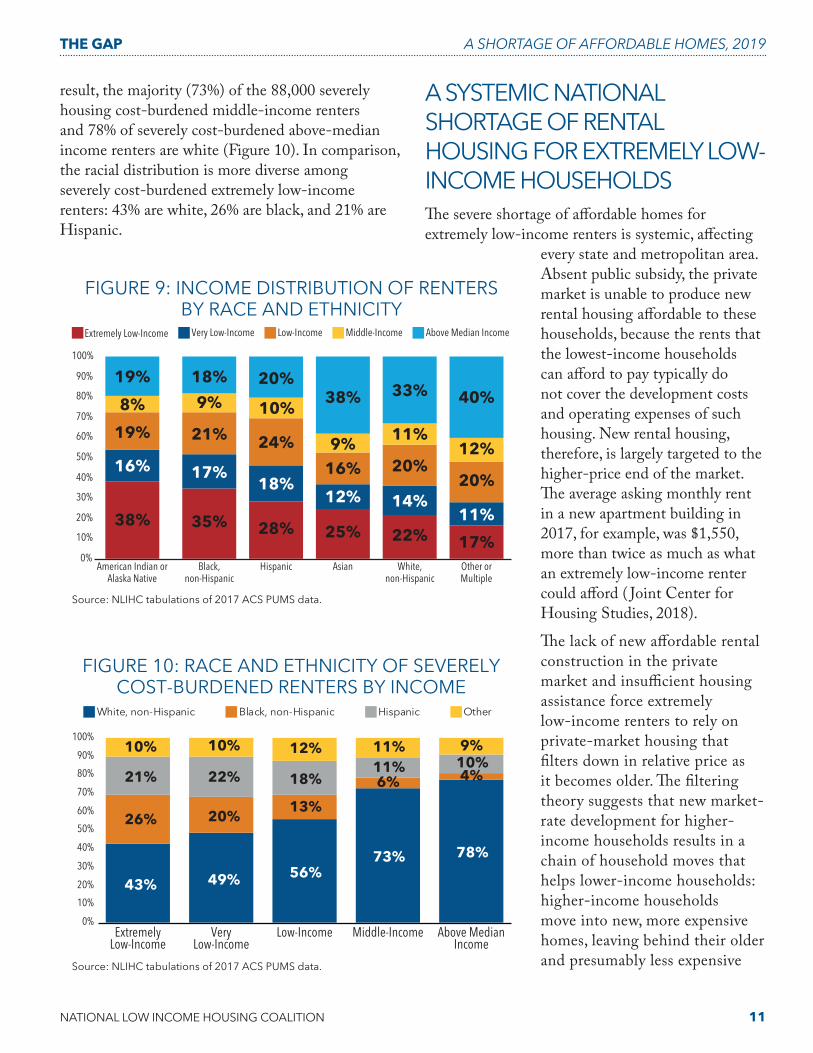
Racial disparities also exist among renters alone. Thirty-eight percent of AIAN renter households, 35% of black renter households, and 28% of Hispanic renter households have extremely low incomes, compared to 22% of white non-Hispanic households (Figure 9). Regardless of race, the majority of extremely low-income renters are severely housing cost-burdened: 71.5% of Hispanic, 70.9% of non-Hispanic black, and 69.6% of non-Hispanic white extremely low-income renters are severely cost-burdened. Sixty-three percent of AIAN extremely low-income renters are severely housing cost-burdened, but poor housing conditions like low quality and overcrowding are also significant concerns in tribal areas (Pindus et al., 2017).
White renters are more likely than non-Hispanic black, Hispanic, and AIAN renters to have household incomes greater than 80% of AMI. At the same time, white renters (1.1%) with these higher incomes are more likely to be severely housing cost-burdened than Hispanic renters (0.6%), non-Hispanic black renters (0.3%) and AIAN renters (0.1%) with similar incomes. As a
Black, Native American, and Hispanic households are more likely than white households to be extremely low-income renters
THE GAP A SHORTAGE OF AFFORDABLE HOMES, 2019
NATIONAL LOW INCOME HOUSING COALITION 11
result, the majority (73%) of the 88,000 severely housing cost-burdened middle-income renters and 78% of severely cost-burdened above-median income renters are white (Figure 10). In comparison, the racial distribution is more diverse among severely cost-burdened extremely low-income renters: 43% are white, 26% are black, and 21% are Hispanic.
A SYSTEMIC NATIONAL SHORTAGE OF RENTAL HOUSING FOR EXTREMELY LOW-INCOME HOUSEHOLDSThe severe shortage of affordable homes for extremely low-income renters is systemic, affecting
every state and metropolitan area. Absent public subsidy, the private market is unable to produce new rental housing affordable to these households, because the rents that the lowest-income households can afford to pay typically do not cover the development costs and operating expenses of such housing. New rental housing, therefore, is largely targeted to the higher-price end of the market. The average asking monthly rent in a new apartment building in 2017, for example, was $1,550, more than twice as much as what an extremely low-income renter could afford ( Joint Center for Housing Studies, 2018).
The lack of new affordable rental construction in the private market and insufficient housing assistance force extremely low-income renters to rely on private-market housing that filters down in relative price as it becomes older. The filtering theory suggests that new market-rate development for higher-income households results in a chain of household moves that helps lower-income households: higher-income households move into new, more expensive homes, leaving behind their older and presumably less expensive
FIGURE 9: INCOME DISTRIBUTION OF RENTERS BY RACE AND ETHNICITY
Source: NLIHC tabulations of 2017 ACS PUMS data.
Extremely Low-Income Very Low-Income Low-Income Middle-Income Above Median Income
0%
10%
20%
30%
40%
50%
60%
70%
80%
90%
100%
38%
16%
19%
8%
19%
American Indian orAlaska Native
35%
17%
21%
9%
18%
Black,non-Hispanic
28%
18%
24%
10%
20%
Hispanic
25%
12%
16%9%
38%
Asian
22%
14%
20%
11%
33%
White,non-Hispanic
17%
11%
20%
12%
40%
Other orMultiple
FIGURE 10: RACE AND ETHNICITY OF SEVERELY COST-BURDENED RENTERS BY INCOME
Source: NLIHC tabulations of 2017 ACS PUMS data.
White, non-Hispanic Black, non-Hispanic Hispanic Other
0%
10%
20%
30%
40%
50%
60%
70%
80%
90%
100%
43%
26%
21%
10%
ExtremelyLow-Income
49%
20%
22%
10%
VeryLow-Income
56%
13%
18%
12%
Low-Income
73%
6%11%11%
Middle-Income
78%
4%10%9%
Above MedianIncome

12 NATIONAL LOW INCOME HOUSING COALITION
THE GAP A SHORTAGE OF AFFORDABLE HOMES, 2019
housing, which is then occupied by other households who leave even older housing behind, and so on. This process is assumed to increase the availability of older and lower-priced housing for low-income renters.
The filtering process, however, fails to produce a sufficient supply of rental homes inexpensive enough for the lowest-income renters to afford. In strong markets, owners have an incentive to redevelop their properties to receive higher rents from higher-income households. In weak markets, owners have an incentive to abandon their rental properties or convert them to other uses when rental income is too low to cover basic operating costs and maintenance. Approximately 60% of low-cost rental units in 1985 were lost by 2013 through permanent removal (27%), conversions to other uses (18%), or upgrading to higher rents (12%) ( Joint Center for Housing Studies, 2018). The years between 1990 and 2016 saw a net loss of 2.5 million occupied rental units priced below $800 per month, but a gain of 2.6 million occupied rental units priced above $2,000 per month ( Joint Center for Housing Studies, 2018).
The systemic, national shortage of affordable housing for extremely low-income renters is evidence of the need for deeply income-targeted federal housing subsidies to serve them. Public subsidies are needed both to subsidize the production and operation of affordable homes for the lowest-income renters and to provide rental assistance that low-income families can utilize to afford rental housing in the private market.
Unlike those of extremely low-income renters, the housing needs of middle-income renters are largely met in most areas of the country. The shortages of affordable and available rental housing for middle-income renters with
incomes above 80% of AMI are predominantly found in high-cost pockets of the country where new housing development has not kept pace with the growth in demand. Eleven of the 50 largest metropolitan areas (25 of the largest 100) have a shortage of homes affordable and available to renters with household incomes up to the median income.
Even in these housing markets, however, the cumulative shortage of affordable and available rental homes is largely attributable to the significant unmet housing needs of people with the lowest incomes who must occupy rental homes in the private market that would otherwise be affordable and available to higher-income renters. More than 750,000 extremely low-income households occupy rental homes they cannot afford that would otherwise be affordable and available to middle-income renters (Figure 11).
Housing advocates and scholars across the ideological spectrum agree that local zoning and other requirements of the development approval process can artificially constrain housing development and, in turn, limit the ability of the
FIGURE 11: EXTREMELY LOW-INCOME RENTER HOUSEHOLDS OCCUPYING UNITS AFFORDABLE
TO HIGHER INCOME GROUPS
Source: NLIHC tabulations of 2017 ACS PUMS data. AMI = Area Median Income
2,525,209
Affordable toVery Low-Income Renters
(30.1% to 50% of AMI)
3,660,373
Affordable toLow-Income Renters
(50.1% to 80% of AMI)
759,196
Affordable toMiddle-Income Renters (80.1 to 100% of AMI)
478,494
Affordable to AboveMedian Income Renters
(Over 100% of AMI)

THE GAP A SHORTAGE OF AFFORDABLE HOMES, 2019
NATIONAL LOW INCOME HOUSING COALITION 13
private market to serve middle-income renters (Axel-Lute, 2017; Jacobus, 2017). Reducing the local barriers to the production of multifamily housing through reform of local zoning and upscale design standards could result in a greater supply of housing and alleviate rent pressures in the market for households with moderate incomes. These reforms alone, however, will not sufficiently improve the ability of extremely low-income renters to afford the rents landlords need to operate and adequately maintain housing.
FEDERAL POLICY SOLUTIONS FOR THE LOWEST INCOME PEOPLEA significant and sustained federal commitment to affordable housing programs targeted to meet the affordability needs of the lowest-income families is necessary, including a large investment in the national Housing Trust Fund (HTF). First funded in 2016, the HTF is an annual block grant to states for the creation, preservation, or rehabilitation of rental housing for the lowest-income renters. The distribution of HTF funds is determined by the shortage of rental housing affordable and available to extremely low-income and very low-income renters and the extent to which these renters are severely housing cost-burdened. At least 90% of HTF funds must be used for rental housing and at least 75% of the funds for rental housing must benefit extremely low-income households; 100% of HTF funds must benefit extremely low-income households while the HTF is capitalized under $1 billion per year. A review of the first projects awarded HTF money indicate that the new program provides homes for some of the most vulnerable people, including people experiencing homelessness, people with disabilities, and seniors (NLIHC, 2018c).
Expanded rental assistance like the Housing Choice Voucher (HCV) program is a substantial component of any strategy to address the severe housing shortage and instability faced by extremely low-income renters. Seventy-three percent of current HCV recipients are extremely low-income (HUD, 2018). Voucher recipients find rental housing in the private-market and contribute 30% of their adjusted gross incomes toward housing costs. The voucher pays the remaining costs up to the local housing agency’s payment standard. Vouchers typically cost less than new production, making them an efficient and effective form of housing assistance in markets with an abundant supply of vacant, physically adequate housing that the lowest-income
renters cannot afford without help. A ban on discrimination against voucher holders by landlords would improve the effectiveness of this rental assistance.
We must also protect the existing supply of affordable homes for the poorest renters. Significant capital investment is needed
for the rehabilitation and preservation of public housing, which provides a stable home to some of the country’s most vulnerable renters. Seventy-one percent of households living in public housing are extremely low-income. The average annual household income of public housing residents is $14,753 (HUD, 2018). Public housing provides a deep subsidy to these households: their contributions toward rent are 30% of their adjusted gross incomes with a congressionally appropriated Public Housing Operating Fund covering the remaining operating costs. A Public Housing Capital fund is appropriated for capital improvements, but, due to decades of declining Capital funds, the public housing stock faces a backlog of capital repair needs of as much as $53 billion, threatening the quality and even the existence of these homes (NLIHC, 2018e).
A significant and sustained federal commitment to affordable housing programs targeted to meet the affordability needs of the lowest-income families is necessary

14 NATIONAL LOW INCOME HOUSING COALITION
THE GAP A SHORTAGE OF AFFORDABLE HOMES, 2019
Project-Based Rental Assistance (PBRA) must also be adequately funded for preservation. PBRA consists of rental contracts between HUD and private-property owners who provide subsidized housing for low-income renters. Tenants contribute 30% of their adjusted gross incomes toward the rent, and HUD’s contribution covers the rest. The average annual income of households living in housing supported by PBRA is $12,505 (HUD, 2018). Without adequate and timely appropriations to renew expiring contracts, some of these rental homes could be lost from the affordable housing stock. Sufficient funds should also be appropriated to preserve the affordable housing stock supported by the USDA’s Section 515 loan program, whose rural tenants have an average annual household income of $12,588 (Housing Assistance Council, 2018).
Reforms to the federal tax code could also improve our nation’s ability to stably house the most financially vulnerable renters. A deeply income-targeted fully refundable renters’ tax credit for housing cost-burdened renters would help address the gap between housing costs and the incomes of the poorest renters. The credits could be based on the difference between 30% of a renter’s household income and their actual housing costs up to a modest price.
Congress should also expand and reform the Low Income Housing Tax Credit (LIHTC) program to better target the housing needs of extremely low-income households. LIHTC is the largest production subsidy for affordable housing in the U.S. LIHTC rents, however, are not typically affordable to extremely low-income renters without additional rental assistance. NLIHC supports reforms to better serve people with the lowest incomes, including a 50% basis boost in tax credits for developments that set aside at least 20% of their housing for extremely low-income renters.
Congress should also create a National Housing Stabilization Fund to provide emergency assistance to poor households facing housing instability or homelessness after an economic shock. Temporary assistance can help households stay in their homes after a short-term job loss or unexpected emergency expense, which reduces the long-term negative impact of these events.
The political will for significant investments in solutions like these is expanding. NLIHC co-leads the Opportunity Starts at Home campaign, a diverse coalition of nearly 100 national organizations from
a wide range of fields, including education, health, mental health, food policy, faith-based, social work, civil rights, and housing, that calls for bold investments in deeply affordable housing supply, in rental assistance, and
in emergency assistance for housing stability and homelessness prevention (NLIHC, 2019).
Growing Congressional support for these investments is evident. In the last Congress, the “American Housing and Economic Mobility Act” was introduced in the Senate by Senator Elizabeth Warren (D-MA) and in the House by Representatives Cedric Richmond (D-LA), Gwen Moore (D-WI), Barbara Lee (D-CA), and Elijah Cummings (D-MD) to invest $445 billion over 10 years in the national HTF, implement a federal ban on source-of-income discrimination against voucher holders, and increase funds in existing affordable housing programs serving tribal lands and rural areas, among other provisions (NLIHC, 2018a). The “Ending Homelessness Act of 2017” was introduced by Representative Maxine Waters (D-CA) to invest $13.27 billion over five years to address the shortage of affordable housing and to combat homelessness. The bill included permanent funding of $1 billion annually to the national HTF and $50 million each year for rental assistance to be
The political will for significant investments in solutions like these is expanding

THE GAP A SHORTAGE OF AFFORDABLE HOMES, 2019
NATIONAL LOW INCOME HOUSING COALITION 15
used in conjunction with HTF housing (U.S. House Committee on Financial Services, 2017). The “Rent Relief Act” introduced by Senator Kamala Harris (D-CA) and the “Housing, Opportunity, Mobility and Equity Act” introduced by Senator Cory Booker (D-NJ) proposed fully refundable renters’ tax credits for housing cost-burdened renters (NLIHC, 2018b). These proposals would help millions of extremely low-income renters afford their homes.
THE CASE FOR AFFORDABLE HOMESInvesting in affordable housing solutions, like the national HTF, the HCV program, public housing, and other deeply income-targeted programs, is inextricably linked to an array of positive outcomes beyond housing. Low-income children in affordable homes perform better on cognitive development tests than those in unaffordable homes, because their parents can spend more money on enrichment activities (Newman & Holupka, 2014, 2015). Affordable housing also prevents housing instability that disrupts learning and negatively impacts academic achievement (Brennan, Reed, Sturtevant, 2014; Herbers et al., 2012; Voight, Shinn, & Nation, 2012). Affordable housing options located in high-opportunity areas with low poverty and economically-diverse schools can raise the academic performance of low-income students and narrow the achievement gap between them and their more affluent peers (Schwartz, 2010).
Decent, stable, and affordable homes are a major social determinant of health. Families with children who are behind on paying their rent are at higher risk of fair or poor health for both the children
and their caregivers (Sandel, et al., 2018). Previous studies by Children’s HealthWatch found that children who experienced pre-natal homelessness were 20% more likely to be hospitalized since birth. Children who experienced post-natal homelessness as an infant or toddler were 22% more likely to hospitalized since birth (Sandel et. al., 2016). Children’s HealthWatch estimates that the cost of hospitalizations attributable to homelessness among children younger than five is more than $230 million per year (Sandel et. al., 2016). A study in Oregon found that when people obtained subsidized affordable housing, their primary care visits increased by 20%, emergency room visits decreased by 18%, and Medicaid expenditures decreased by 12% (Wright, Li, Vartanian, & Weller, M., 2016).
Affordable homes can also help children climb the economic ladder as adults. Economist Raj Chetty and his team found that children of families who used housing vouchers to access affordable homes in lower-poverty neighborhoods were more likely to attend college, less likely to become single parents, and likely to earn more as adults. Younger poor children who moved to lower-poverty neighborhoods with a housing choice
voucher will earn an average of $302,000 more in lifetime earnings than their peers who didn’t (Chetty, Hendren, & Katz, 2015).
Affordable homes are critical to the criminal justice system, as well. Individuals transitioning out of the criminal justice system face significant housing obstacles. Formerly incarcerated people are nearly ten times more likely to be homeless than the general public, partially due to the shortage of affordable housing, discrimination, and large security deposit requirements (Couloute, 2018). A study in
Decent, stable, and affordable homes are a major social determinant of health. Families with children who are behind on paying their rent are at higher risk of fair or poor health for both the children and their caregivers

16 NATIONAL LOW INCOME HOUSING COALITION
THE GAP A SHORTAGE OF AFFORDABLE HOMES, 2019
New York City found that criminal defendants who were homeless were more likely to be re-arrested than those who were not homeless, indicating that permanent housing is associated with lower rates of re-arrest (Peterson, 2016).
CONCLUSIONThe shortage of seven million rental homes affordable and available to households with the lowest-incomes is a national problem affecting nearly every community. As a result, families lack the foundation of a stable, secure home from which to achieve better health, educational advancement, and economic mobility. The private market cannot and will not, on its own, build and operate homes these families can afford. We need a sustained public commitment to ensure the lowest-income and most vulnerable households in America have decent, stable, accessible, and affordable homes.
ABOUT THE DATAThis report is based on data from the 2017 American Community Survey (ACS) Public Use Microdata Sample (PUMS). The ACS is an annual nationwide survey of approximately 3.5 million addresses. It provides timely data on the social, economic, demographic, and housing characteristics of the U.S. population. PUMS contains individual ACS questionnaire records for a subsample of housing units and their occupants.
PUMS data are available for geographic areas called Public Use Microdata Sample Areas (PUMAs). Individual PUMS records were matched to their appropriate metropolitan area or given nonmetropolitan status using the Missouri Census
Data Center’s MABLE/Geocorr 2014 Geographic Correspondence Engine. If at least 50% of a PUMA was in a Core Based Statistical Area (CBSA), we assigned it to the CBSA. Otherwise, the PUMA was given nonmetropolitan status.
Households were categorized by their incomes (as extremely low-income, very low-income, low-income, middle-income, or above median income) relative to their metropolitan area’s median family income or state’s nonmetropolitan median family income, adjusted for household size. Housing units were categorized according to the income
needed to afford the rent and utilities without spending more than 30% of income. The categorization of units was done without regard to the incomes of the current tenants. Housing units without complete kitchen or plumbing facilities were not included in the housing supply.
After households and units were categorized, we analyzed the extent to which households in each income category resided in housing units categorized as affordable for that income level. For example, we estimated the number of units affordable for extremely low-income households that were occupied by extremely low-income households and by other income groups.
We categorized households into mutually exclusive household types in the following order: (1) householder or householder’s spouse were at least 62 years of age (seniors); (2) householder and householder’s spouse (if applicable) were younger than 62 and at least one of them had a disability (disabled); (3) non-senior non-disabled household. We also categorized households into more detailed mutually exclusive categories in the following order: (1) elderly; (2) disabled; (3) householder and
Children of families who used housing vouchers to access affordable homes in lower-poverty neighborhoods were more likely to attend college, less likely to become single parents, and likely to earn more as adults

THE GAP A SHORTAGE OF AFFORDABLE HOMES, 2019
NATIONAL LOW INCOME HOUSING COALITION 17
householder’s spouse (if applicable) were younger than 62 and unemployed; (4) non-senior non-disabled householder and/or householder’s spouse (if applicable) were working; (5) householder and householder’s spouse (if applicable) were enrolled in school; (6) non-senior non-disabled single adult was living with a young child under seven years of age or person with disability.
More information about the ACS PUMS files is
available at https://www.census.gov/programs-surveys/acs/technical-documentation/pums/about.html
FOR MORE INFORMATIONFor further information regarding this report and the methodology, please contact Andrew Aurand, NLIHC Vice President for Research, at [email protected] or 202-662-1530 x245.

18 NATIONAL LOW INCOME HOUSING COALITION
THE GAP A SHORTAGE OF AFFORDABLE HOMES, 2019
Axel-Lute, M. (2017). Regulation and housing supply: Where the left & right agree (sort of ). Shelterforce, 186. Retrieved from https://shelterforce.org/2017/03/30/a-shelterforce-roundtable-on-regulation-and-housing-supply-where-the-left-a/
Bartlett, R., Morse, A., Stanton, R. & Wallace, N. (2018). Consumer-lending discrimination in the era of fintech. Berkeley, CA: University of California Berkeley.
Brennan, M., Reed, P., Sturtevant, L. (2014). The impacts of affordable housing on education: A research summary. Washington, DC: National Housing Conference.
Chetty, R., Hendren, N. & Katz, L. (2015). The effects of exposure to better neighborhoods on children: New evidence from the Moving to Opportunity experiment. American Economic Review, 106(4), 855-902.
Chetty, R., Hendren, N., Jones, M., Porter, S. (2018). Race and economic opportunity in the United States: An intergenerational perspective. Working paper.
Couloute, L. (2018). Nowhere to go: Homelessness among formerly incarcerated people. Northampton, MA: Prison Policy Initiative.
Cutts, D., Coleman, S., Black, M., Chilton, M., Cook, J.T., Ettinger de Cuba, S., . . . Frank, D.A. (2014). Homelessness during pregnancy: A unique, time-dependent risk factor of birth outcomes. Maternal and Child Health Journal, 19(6), 1276–1283.
Desmond, M. & Gershenson, C. (2016). Housing and employment instability among the working poor. Social Problems, 63(1), 46-67.
Fischer, W. & Sard, B. (2017). Chart book: Federal housing spending is poorly matched to need. Washington, DC: Center on Budget and Policy Priorities.
Herbers, J.E., Cutuli, J.J., Supkoff, L.M., Heistad, D., Chan, C., Hinz, E., Masten, A. (2012). Early reading skills and academic achievement trajectories of students facing poverty, homelessness, and high residential mobility. Educational Researcher, 41(9), 366-374.
Housing Assistance Council. (2018). Rental housing for a 21st century rural America: A platform for preservation. Washington, DC: Author.
Jacobus, R. (2017). Why aren’t we building middle income housing? Shelterforce. Retrieved from https://shelterforce.org/2017/02/22/housing-regulations-are-for-neighbors-not-residents/
Joint Center for Housing Studies of Harvard University. (2018). The state of the nation’s housing. Cambridge, MA: Author.
Kochhar, R. & Cilluffo, A. (2018). Key findings on the rise in income inequality within America’s racial and ethnic groups. Washington, DC: Pew Research Center.
Maqbool, N., Viveiros, J., & Ault, M. (2015). The impacts of affordable housing on health: A research summary. Washington, DC: National Housing Conference, Center for Housing Policy.
National Low Income Housing Coalition. (2018a). American Housing and Economic Mobility Act. Washington, DC: Author.
National Low Income Housing Coalition. (2018b). Bold proposals for renters’ tax credits. Washington, DC: Author.
National Low Income Housing Coalition. (2018c). Getting started: First homes being built with 2016 national Housing Trust Fund awards. Washington, DC: Author.
National Low Income Housing Coalition. (2018d). Out of reach: The high cost of housing. Washington, DC: Author.
National Low Income Housing Coalition. (2018e). Public housing. Advocate’s Guide 2018. Washington, DC: Author.
National Low Income Housing Coalition. (2019). Within reach: Ambitious federal solutions to meet the housing needs of the most vulnerable people. Washington, DC: Author.
REFERENCES

THE GAP A SHORTAGE OF AFFORDABLE HOMES, 2019
NATIONAL LOW INCOME HOUSING COALITION 19
Newman, S.J. & Holupka, C.S. (2014). Housing affordability and investments in children. Journal of Housing Economics, 24( June), 89-100.
Newman, S.J. & Holupka, C.S. (2015). Housing affordability and child well-being. Housing Policy Debate, 25(1), 116-151.
Peterson, R. (2016). Re-arrests of homeless defendants in New York City. Research brief #39. New York, NY: New York City Criminal Justice Agency Research Brief.
Pindus, N., Kingsley, G.T., Biess, J., Levy, D., Simington, J., Hayes, C. (2017). Housing needs of American Indians and Alaska Natives in tribal areas. Washington, DC: U.S. Department of Housing and Urban Development.
Rice, L. & Swesnik, D. (2012). Discriminatory effects of credit scoring on communities of color. Washington, DC: National Fair Housing Alliance.
Sandel, M., Cook, J., Poblacion, A., Sheward, R., Coleman, S., Viveiros, J., & Sturtevant, L. (2016). Housing as a health care investment: Affordable housing supports children’s health. Washington, DC: National Housing Conference & Children’s HealthWatch.
Sandel, M., Sheward, R., Ettinger de Cuba, S., Coleman, S., Frank, D.A., Chilton, M., . . . Cutts, D. (2018). Unstable housing and caregiver and child health in renter families. Pediatrics, 141(2).
Schwartz, H. (2010). Housing policy is school policy: Economically integrative housing promotes academic success in Montgomery County, MD. Washington, DC: The Century Foundation.
U.S. Department of Agriculture. (2018). Official USDA food plans: Cost of food at home at four levels, U.S. average, November 2018. Washington, DC: Author.
U.S. Department of Housing and Urban Development. (2018). A picture of subsidized households [Data file]. Retrieved from https://www.huduser.gov/portal/datasets/assthsg.html#2009-2017
U.S. House Committee on Financial Services. (2017). Waters continues to fight to end homelessness in America [press release]. Retrieved from https://financialservices.house.gov/news/documentsingle.aspx?DocumentID=400380
Voight, A., Shinn, M., & Nation, M. (2012). The longitudinal effects of residential mobility on the academic achievement of urban elementary and middle school students. Educational Researcher, 41(9), 385-392.
Wright, B., Li, G., Vartanian, K., & Weller, M. (2016). Health in housing: Exploring the intersection between housing & health care. Portland, OR: Center for Outcomes Research & Evalution.

APPENDIX A: STATE COMPARISONSStates in RED have less than the national level of affordable and available units per 100 households at or below the extremely low income (ELI) threshold
Surplus (Deficit) of Affordable and Available Units
Affordable and Available Units per 100 Households at or below Threshold
% Within Each Income Category with Severe Housing Cost Burden
State At or below ELI At or below 50% AMI
At or below ELI
At or below 50% AMI
At or below 80% AMI
At or below 100% AMI
At or below ELI
> ELI to 50% AMI
51% to 80% AMI
81% to 100% AMI
Alabama (69,411) (42,967) 62 84 111 113 65% 19% 4% 0%Alaska (10,912) (14,092) 37 54 94 105 70% 40% 5% 1%Arizona (153,331) (167,050) 25 48 97 105 78% 38% 7% 2%Arkansas (48,146) (39,685) 56 76 107 109 61% 18% 2% 1%California (1,019,190) (1,452,839) 22 31 67 86 76% 50% 17% 4%Colorado (114,071) (148,264) 28 48 93 102 76% 35% 8% 1%Connecticut (79,172) (84,050) 38 62 102 107 67% 28% 6% 1%Delaware (17,114) (17,055) 38 63 102 108 70% 27% 8% 5%District of Columbia (30,438) (25,733) 40 65 92 101 67% 25% 8% 3%Florida (428,622) (599,544) 26 36 78 97 80% 53% 19% 4%Georgia (204,083) (218,093) 39 59 101 107 73% 35% 5% 1%Hawaii (24,816) (39,592) 39 41 74 90 63% 48% 24% 4%Idaho (23,348) (22,128) 48 70 104 106 66% 21% 3% 1%Illinois (295,271) (252,301) 35 65 100 104 72% 25% 5% 1%Indiana (134,485) (80,189) 37 77 107 108 73% 19% 3% 1%Iowa (51,141) (7,446) 44 95 108 108 63% 12% 2% 0%Kansas (51,084) (31,743) 43 79 107 107 71% 20% 2% 0%Kentucky (85,225) (58,250) 53 77 104 105 60% 16% 3% 1%Louisiana (110,614) (116,825) 44 58 101 107 68% 31% 6% 2%Maine (20,086) (13,578) 52 79 106 106 53% 16% 4% 0%Maryland (118,810) (137,602) 33 57 100 106 72% 29% 5% 0%Massachusetts (169,809) (186,775) 46 61 92 99 59% 30% 6% 2%Michigan (203,384) (158,899) 37 68 100 103 70% 24% 5% 1%Minnesota (107,382) (73,997) 39 74 100 102 62% 22% 3% 1%Mississippi (41,450) (39,719) 64 74 109 112 61% 29% 3% 1%Missouri (113,015) (86,010) 42 74 105 106 69% 21% 3% 1%Montana (17,420) (12,214) 45 78 101 105 62% 29% 5% 3%Nebraska (35,362) (15,200) 39 84 105 105 66% 13% 3% 1%Nevada (73,158) (94,688) 19 38 93 104 79% 43% 10% 2%New Hampshire (27,347) (25,672) 31 65 101 103 68% 22% 3% 0%New Jersey (200,619) (267,147) 33 45 89 99 72% 38% 7% 0%New Mexico (41,159) (38,271) 41 59 102 109 71% 31% 9% 1%New York (605,313) (696,791) 37 53 84 96 70% 38% 9% 4%North Carolina (196,231) (181,718) 43 67 103 107 70% 26% 6% 1%North Dakota (12,966) 6,482 53 113 125 120 66% 13% 0% 0%Ohio (248,709) (143,741) 43 80 103 104 67% 18% 3% 1%Oklahoma (66,967) (54,888) 47 72 106 109 65% 24% 5% 1%Oregon (98,406) (130,289) 28 42 88 97 75% 42% 10% 2%Pennsylvania (279,009) (206,695) 42 73 100 103 71% 24% 4% 1%Rhode Island (22,806) (19,050) 54 76 101 105 54% 23% 3% 0%South Carolina (84,056) (89,438) 48 64 102 107 70% 30% 6% 1%South Dakota (14,287) (7,342) 48 85 106 107 66% 17% 2% 0%Tennessee (126,745) (115,406) 46 68 102 106 65% 25% 4% 2%Texas (594,631) (675,254) 29 51 101 108 74% 30% 6% 1%Utah (41,266) (41,354) 36 64 101 105 71% 25% 4% 2%Vermont (11,876) (13,853) 35 55 95 99 68% 27% 4% 0%Virginia (140,992) (148,249) 40 62 102 107 69% 32% 4% 1%Washington (165,345) (200,357) 29 50 91 99 71% 34% 5% 1%West Virginia (26,414) (21,578) 61 77 108 110 62% 19% 2% 1%Wisconsin (121,412) (74,255) 37 78 101 103 65% 20% 2% 2%Wyoming (5,799) 2,188 66 107 120 121 65% 10% 2% 2%USA Totals (6,982,705) (7,379,206) 37 58 94 102 71% 32% 8% 2%
Source: NLIHC Tabulations of 2017 ACS PUMS data

APPENDIX B: METROPOLITAN COMPARISONSMetropolitan Areas in RED have less than the national level of affordable and available units per 100 households at or below the extremely low income threshold
Surplus (Deficit) of Affordable and
Available Units
Affordable and Available Units per 100 Households at or below
Threshold
% Within Each Income Category with Severe Housing Cost Burden
Metro Area At or below ELI
At or below 50% AMI
At or below ELI
At or below 50% AMI
At or below 80% AMI
At or below 100% AMI
At or below ELI
31% to 50% AMI
51% to 80% AMI
81% to 100% AMI
Atlanta-Sandy Springs-Roswell, GA (118,559) (129,938) 25 53 99 106 76% 35% 5% 1%Austin-Round Rock, TX (44,902) (57,967) 21 49 103 109 84% 34% 5% 2%Baltimore-Columbia-Towson, MD (57,997) (61,914) 38 62 99 106 70% 31% 6% 0%Boston-Cambridge-Newton, MA-NH (118,579) (137,489) 46 59 90 98 58% 32% 7% 2%Buffalo-Cheektowaga-Niagara Falls, NY (29,879) (17,304) 40 79 100 102 68% 23% 3% 2%Charlotte-Concord-Gastonia, NC-SC (46,484) (45,290) 32 62 103 107 74% 25% 5% 0%Chicago-Naperville-Elgin, IL-IN-WI (234,266) (237,590) 28 56 97 103 76% 29% 6% 1%Cincinnati, OH-KY-IN (45,000) (15,313) 44 88 104 104 65% 14% 1% 0%Cleveland-Elyria, OH (54,321) (32,819) 41 77 103 105 69% 20% 4% 1%Columbus, OH (46,889) (28,718) 33 76 104 106 69% 19% 2% 1%Dallas-Fort Worth-Arlington, TX (157,476) (181,978) 20 49 100 107 79% 30% 6% 1%Denver-Aurora-Lakewood, CO (59,158) (88,395) 26 42 92 103 78% 37% 10% 2%Detroit-Warren-Dearborn, MI (103,557) (73,323) 32 69 99 103 73% 26% 4% 2%Hartford-West Hartford-East Hartford, CT (28,158) (26,537) 36 66 104 107 71% 26% 4% 3%Houston-The Woodlands-Sugar Land, TX (165,058) (183,200) 19 47 103 110 80% 30% 6% 2%Indianapolis-Carmel-Anderson, IN (48,821) (29,868) 24 73 105 107 78% 24% 3% 0%Jacksonville, FL (26,996) (31,336) 37 56 99 109 73% 31% 8% 3%Kansas City, MO-KS (44,589) (31,789) 33 73 104 105 67% 18% 2% 0%Las Vegas-Henderson-Paradise, NV (59,370) (78,112) 14 31 92 105 83% 50% 12% 3%Los Angeles-Long Beach-Anaheim, CA (399,164) (606,680) 18 23 56 77 80% 58% 21% 7%Louisville/Jefferson County, KY-IN (26,893) (14,895) 43 78 106 106 60% 19% 2% 2%Memphis, TN-MS-AR (32,126) (33,823) 33 53 104 109 77% 38% 7% 1%Miami-Fort Lauderdale-West Palm Beach, FL (142,600) (224,469) 24 25 52 81 80% 68% 29% 7%Milwaukee-Waukesha-West Allis, WI (47,697) (29,501) 32 75 100 103 68% 24% 5% 3%Minneapolis-St. Paul-Bloomington, MN-WI (73,054) (50,983) 36 73 100 102 62% 20% 3% 2%Nashville-Davidson-Murfreesboro-Franklin, TN (40,705) (37,561) 31 63 99 103 70% 26% 4% 2%New Orleans-Metairie, LA (39,749) (46,889) 27 41 96 107 78% 40% 9% 4%New York-Newark-Jersey City, NY-NJ-PA (603,836) (809,788) 35 45 80 95 71% 42% 10% 4%Oklahoma City, OK (31,121) (18,960) 34 75 107 109 69% 23% 5% 1%Orlando-Kissimmee-Sanford, FL (60,742) (91,029) 13 20 74 100 89% 60% 19% 2%Philadelphia-Camden-Wilmington, PA-NJ-DE-MD (175,364) (131,138) 34 67 99 103 78% 27% 4% 2%Phoenix-Mesa-Scottsdale, AZ (101,293) (114,878) 21 45 98 104 81% 37% 8% 2%Pittsburgh, PA (41,938) (22,840) 51 83 101 105 63% 23% 5% 1%Portland-Vancouver-Hillsboro, OR-WA (57,002) (78,256) 25 41 90 98 76% 42% 7% 2%Providence-Warwick, RI-MA (38,792) (29,218) 49 76 101 104 57% 21% 2% 0%Raleigh, NC (23,065) (17,559) 26 70 108 109 71% 21% 1% 1%Richmond, VA (25,013) (22,870) 33 66 103 107 70% 24% 3% 0%Riverside-San Bernardino-Ontario, CA (98,832) (129,834) 17 31 69 87 80% 44% 18% 5%Rochester, NY (30,359) (26,606) 30 63 101 103 76% 30% 7% 5%Sacramento--Roseville--Arden-Arcade, CA (57,494) (80,698) 22 37 83 97 78% 41% 11% 2%San Antonio-New Braunfels, TX (48,725) (65,089) 31 41 99 108 71% 37% 5% 0%San Diego-Carlsbad, CA (79,876) (136,631) 20 25 65 86 77% 57% 20% 4%San Francisco-Oakland-Hayward, CA (118,818) (148,658) 31 47 76 90 68% 39% 12% 2%San Jose-Sunnyvale-Santa Clara, CA (38,689) (53,699) 30 43 79 96 73% 41% 11% 1%Seattle-Tacoma-Bellevue, WA (89,022) (112,678) 30 48 88 98 72% 36% 6% 0%St. Louis, MO-IL (60,020) (41,736) 34 73 106 106 73% 21% 2% 1%Tampa-St. Petersburg-Clearwater, FL (71,865) (98,359) 21 33 86 101 83% 47% 15% 4%Tucson, AZ (32,378) (30,310) 24 51 99 106 78% 39% 4% 3%Virginia Beach-Norfolk-Newport News, VA-NC (35,919) (37,480) 39 60 103 109 66% 37% 7% 2%Washington-Arlington-Alexandria, DC-VA-MD-WV (120,607) (149,254) 29 49 98 104 74% 31% 5% 1%USA Totals (6,982,705) (7,379,206) 37 58 94 102 71% 32% 8% 2%
Source: NLIHC Tabulations of 2017 ACS PUMS data

TO FIND OUT MORE INFORMATION AND STATE-SPECIFIC INFORMATION FOR
VISIT HTTPS://NLIHC.ORG/GAP


1000 Vermont Avenue, NW Suite 500 Washington, DC 20005 202-662-1530 https://nlihc.org