A Shifting ESG Materiality Matrix: What Has Mattered, What...
12
A Shifting ESG Materiality Matrix: What Has Mattered, What May Matter A More Nuanced View. As we continue our research on sustainability factors that play a role in market outcomes, we embrace a more nuanced view. ESG factors that impact different sectors are not static, and are determined by a wide range of lifecycles. An ESG Materiality Matrix. In a recent report, ESG in Sector Strategy: What’s Material?, we plotted the likelihood of material sustainability issues against the potential financial impact of ESG events, creating a “Materiality Matrix.” We now expand on that analysis. An ESG Lifecycle. Another Cornerstone report, The Networked Corporation, introduced the concept of sustainability-related lifecycles. For most sectors, the likelihood of adverse ESG events and their potential financial impacts evolve through a lifecycle. ESG lifecycles determine the time it takes for a sustainability issue to become relevant to a sector as well as the magnitude of the financial impact. A Shifting ESG Materiality Matrix. Reflecting various ESG lifecycles, sectors move around the Materiality Matrix over time, which can draw attention to sustainability issues with investment significance, e.g., Financials prior to 2007-08 crisis. Sector Strategy Implications. Today, the risk is that the majority of sectors shift to, or remain at, unfavorable positions in the Materiality Matrix. Our Overweight of the Financials sector is reinforced by its current relatively favorable position in the Matrix. © Black233/Crystal Graphics Michael Geraghty Global Markets Strategist Figure 1: A Stylized Shifting ESG Materiality Matrix Source: Cornerstone Capital Group Global Markets Strategy October 21, 2015
Transcript of A Shifting ESG Materiality Matrix: What Has Mattered, What...

A Shifting ESG Materiality Matrix: What Has Mattered, What May Matter A More Nuanced View. As we continue our research on sustainability factors that play a
role in market outcomes, we embrace a more nuanced view. ESG factors that impact different sectors are not static, and are determined by a wide range of lifecycles.
An ESG Materiality Matrix. In a recent report, ESG in Sector Strategy: What’s Material?, we plotted the likelihood of material sustainability issues against the potential financial impact of ESG events, creating a “Materiality Matrix.” We now expand on that analysis.
An ESG Lifecycle. Another Cornerstone report, The Networked Corporation, introduced the concept of sustainability-related lifecycles. For most sectors, the likelihood of adverse ESG events and their potential financial impacts evolve through a lifecycle. ESG lifecycles determine the time it takes for a sustainability issue to become relevant to a sector as well as the magnitude of the financial impact.
A Shifting ESG Materiality Matrix. Reflecting various ESG lifecycles, sectors move around the Materiality Matrix over time, which can draw attention to sustainability issues with investment significance, e.g., Financials prior to 2007-08 crisis.
Sector Strategy Implications. Today, the risk is that the majority of sectors shift to, or remain at, unfavorable positions in the Materiality Matrix. Our Overweight of the Financials sector is reinforced by its current relatively favorable position in the Matrix.
© Black233/Crystal Graphics
Michael Geraghty Global Markets Strategist
Figure 1: A Stylized Shifting ESG Materiality Matrix
Source: Cornerstone Capital Group
Global Markets Strategy October 21, 2015
2
Please see important disclosures at the back of this report.
ESG in Sector Strategy: What’s Material?
When we introduced the Cornerstone Capital Sector Strategy Model in the
May 2014 edition of The Journal of Sustainable Finance and Banking, we included
a number of basic environmental, social and governance (ESG) metrics. We also
highlighted the dynamic nature of the model, and emphasized that factors and
factor weightings would be reviewed frequently.
Subsequently we developed an “ESG Materiality Matrix” for the majority of the
MSCI GICS (see ESG in Sector Strategy: What’s Material?, June 23, 2015):
The Sustainability Accounting Standards Board (SASB) has been steadily
creating sustainability accounting standards on an industry-by-industry basis
for the entire U.S. economy. SASB creates unique “Materiality Maps”™ for
dozens of industries. In these maps, sustainability issues are assigned scores
based on a number of factors, including evidence of financial impact.
Separately, RobecoSAM adopted a two-step approach to help identify the
financial materiality of sustainability issues in 59 different industries. In the
first step, the most important intangible factors were identified for each
industry. In the second step, the factors were prioritized according to
(i) their expected magnitude (i.e. degree of impact) and (ii) the likelihood of
their impact.
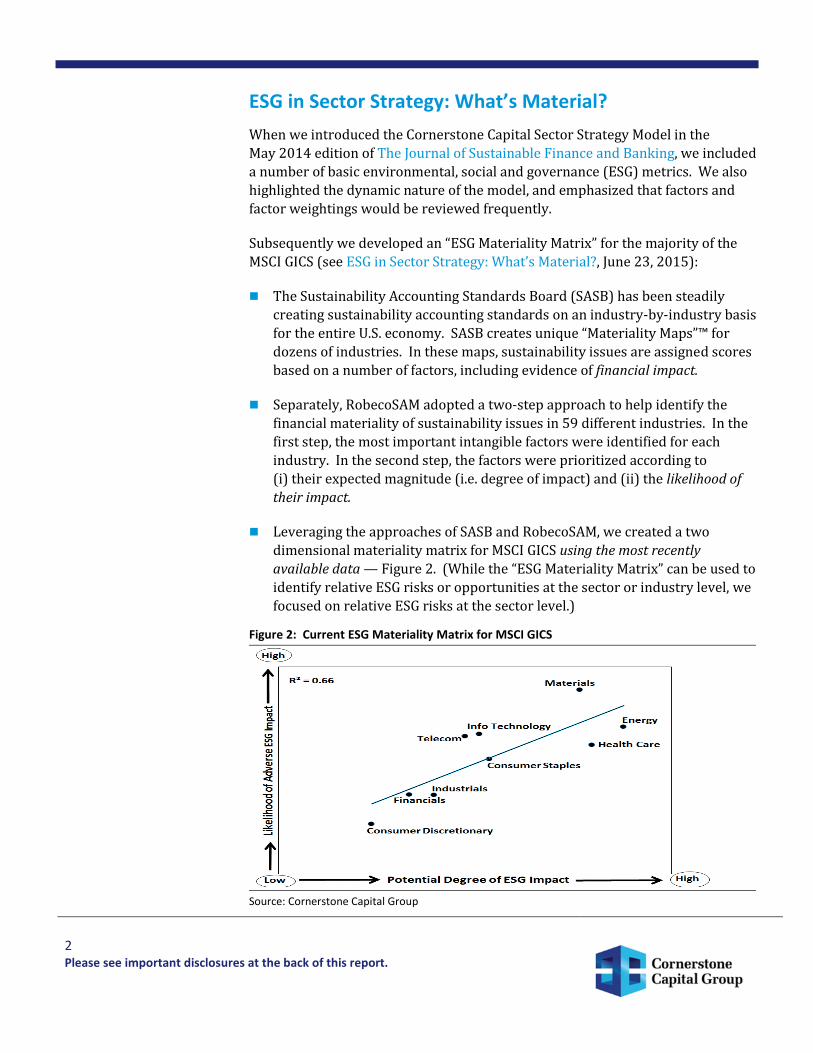
Leveraging the approaches of SASB and RobecoSAM, we created a two
dimensional materiality matrix for MSCI GICS using the most recently
available data — Figure 2. (While the “ESG Materiality Matrix” can be used to
identify relative ESG risks or opportunities at the sector or industry level, we
focused on relative ESG risks at the sector level.)
Figure 2: Current ESG Materiality Matrix for MSCI GICS
Source: Cornerstone Capital Group

3
Please see important disclosures at the back of this report.
Figure 2 suggests that the relationship between the probability of an ESG event
and its financial impact is linear — an R-squared of 0.66. In other words, the
higher the likelihood of an adverse ESG event in a sector, the greater the
potential financial impact of that event on the sector.
Recurring ESG “Lifecycles”
As noted, the ESG Materiality Matrix illustrated in Figure 2 is based on the most
recently available data. However, as John Wilson, Cornerstone Capital’s Head of
Corporate Governance, Engagement & Research, recently pointed out:1
Social and environmental issues evolve through a “lifecycle” as awareness of
the issue grows and social norms emerge…
We originally introduced the concept of sustainability-related lifecycles in our
July 29, 2015 report The Networked Corporation. Just as the awareness of ESG
issues is not static and evolves through a lifecycle, so too does the impact of
adverse ESG events in different sectors.
In the emerging, or “pre-financial” phase of an ESG lifecycle, a shift (subtle or
overt) commences that ultimately has environmental, social and / or
governance consequences for a sector.
In the “transitional” phase, the ESG shift becomes increasingly visible, but
neither its timing nor its ultimate financial impact are particularly clear.
In the ultimate phase of the lifecycle — the “financial” phase — the full
financial impacts of the ESG event are felt.
By way of example, even as the seeds of the 2007-08 financial crisis were being
sown by lax governance (the “emerging” phase), in 2006 the IMF stated2 that:
There is growing recognition that the dispersion of credit risk by banks to a
broader and more diverse group of investors, rather than warehousing such
risk on their balance sheets, has helped make the banking and overall
financial system more resilient…Consequently the commercial banks may be
less vulnerable today to credit or economic shocks.
In a 2009 post mortem after the “ultimate” phase, Nobel laureate Joseph Stiglitz
observed3 that:
Clearly, the most important blame [was] with the financial institutions that
didn’t manage risk and the regulators who didn’t ensure that the banks did
what they were supposed to.
The 2007-08 crisis wasn’t the first to be caused by lax governance and surely
won’t be the last, which underscores the concept of recurring ESG lifecycles.
1 Volkswagen: A Case Study in Failed Governance — 25 Sep 2015 2IMF Global Financial Stability Report, April 2006 3 “The Future of Capitalism,” Financial Times, May 12, 2009

4
Please see important disclosures at the back of this report.
A Shifting ESG Materiality Matrix
To help understand ESG lifecycles — and better incorporate an ESG Materiality
Matrix into sector strategy — we have attempted to recreate a “shifting” ESG
Materiality Matrix for MSCI GICS (Figure 3).
Figure 3: A Stylized Shifting ESG Materiality Matrix
Source: Cornerstone Capital Group
To be sure, Figure 3 is not an illustration of what actually happened in recent
years. That said, the key purpose of Figure 3 is to highlight that ESG factors
which impact the different sectors are not static, and are determined by a wide
range of lifecycles.
The methodology behind the plot points in Figure 3 is outlined in our June 23,
2015 report ESG in Sector Strategy: What’s Material? The Utilities and
Consumer Discretionary sectors are the two GICs not included in Figure 3.
SASB plans to complete its analysis of the Utilities sector by March 2016,
which will then enable us to incorporate that sector into the Materiality
Matrix. As for the Consumer Discretionary sector, it is the most diverse of the
ten GICS — SASB includes the GICS’ three largest industries (Automobiles,
Retailers, Media) in three separate sectors (Transportation, Consumption,
Services). It’s because of this heterogeneity that it’s not possible to make
broad generalizations about the sector’s ESG lifecycle. By contrast, the
Industrials sector (discussed below) is relatively homogenous, with SASB
including all its major industries in the “Resource Transformation” sector.
For historical comparisons we examined the period 2006-14 and, for each
sector, we highlighted the year with the estimated plot point that differed the
most from the current plot point. Our rationale for doing this was to highlight
the degree to which ESG risk can evolve over time.

5
Please see important disclosures at the back of this report.
For each sector we identified the key variables that determine the current
plot points and then quantified those factors historically in order to generate
a time series of plot points. So, for example, greenhouse gas (GHG) emissions
and water consumption are currently key ESG variables in the Materials
sector. Therefore, we calculated the sector’s emissions / consumption trends annually since 2006, and then utilized the linear relationship between ESG
factors and financial impact outlined above.
The curved lines linking prior years to the current plot points are intended to
convey that movements of sectors in the matrix over time are not necessarily
linear, reflecting unique ESG lifecycles. So, while the plot point of the Energy
sector is lower today than it was in 2009, it is possible that, in the intervening
years, a plot point was either higher than in 2009 or lower than it is today.
That said, we pointed out above that ESG lifecycles in most sectors seem to
follow the same pattern of (i) an “emerging” phase, (ii) a “transitional” phase
and, ultimately, (iii) a “financial” phase.
As we discuss below, there are three exceptions to the ESG lifecycle
hypothesis. First, the ESG risk profiles of the Materials and Industrials
sectors are fairly consistent, with variance being driven by macroeconomic
conditions. Second, the position of the Information Technology sector in the
ESG Materiality Matrix seems to be relatively stable.
6
Please see important disclosures at the back of this report.
Factors Behind a Shifting Materiality Matrix
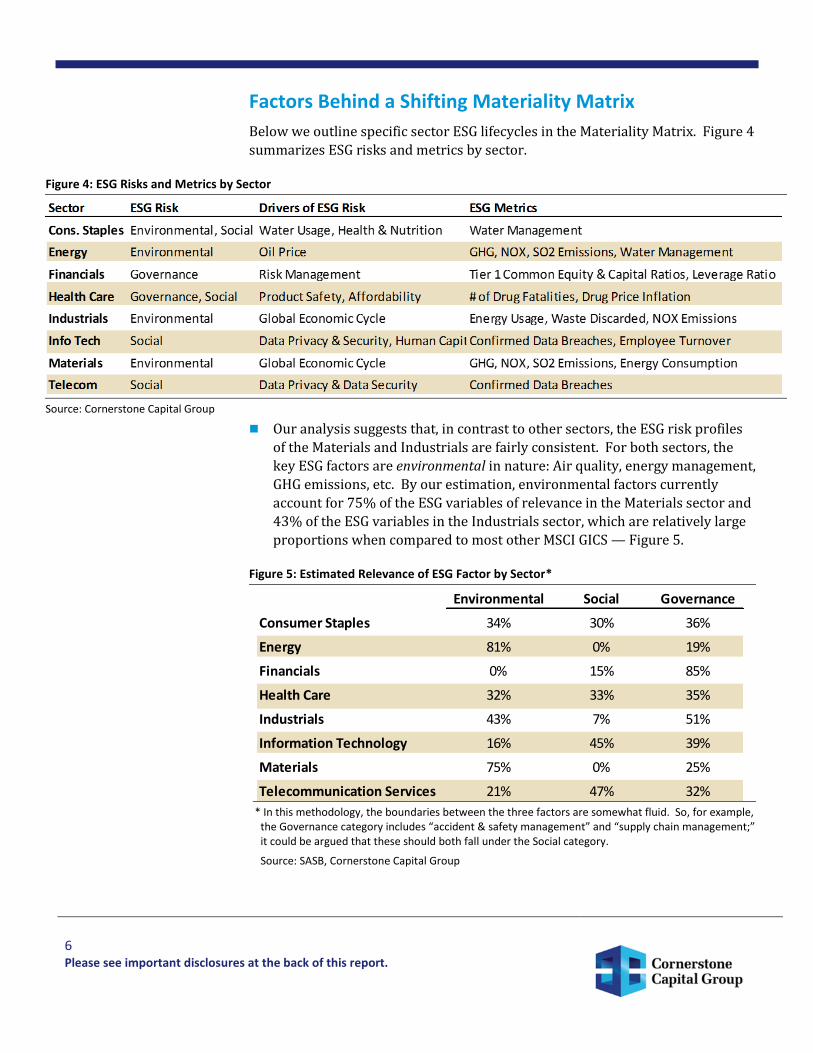
Below we outline specific sector ESG lifecycles in the Materiality Matrix. Figure 4
summarizes ESG risks and metrics by sector.
Figure 4: ESG Risks and Metrics by Sector
Source: Cornerstone Capital Group
Our analysis suggests that, in contrast to other sectors, the ESG risk profiles
of the Materials and Industrials are fairly consistent. For both sectors, the
key ESG factors are environmental in nature: Air quality, energy management,
GHG emissions, etc. By our estimation, environmental factors currently
account for 75% of the ESG variables of relevance in the Materials sector and
43% of the ESG variables in the Industrials sector, which are relatively large
proportions when compared to most other MSCI GICS — Figure 5.
Figure 5: Estimated Relevance of ESG Factor by Sector*
* In this methodology, the boundaries between the three factors are somewhat fluid. So, for example,
the Governance category includes “accident & safety management” and “supply chain management;” it could be argued that these should both fall under the Social category.
Source: SASB, Cornerstone Capital Group
Environmental Social Governance
Consumer Staples 34% 30% 36%
Energy 81% 0% 19%
Financials 0% 15% 85%
Health Care 32% 33% 35%
Industrials 43% 7% 51%
Information Technology 16% 45% 39%
Materials 75% 0% 25%
Telecommunication Services 21% 47% 32%

7
Please see important disclosures at the back of this report.
Of course, the Materials and Industrials sectors are highly cyclical in nature,
so that their emissions of pollutants and consumption of environmental
materials rise and fall with the global economy. It would seem, therefore,
that the likelihood of an adverse and costly ESG event in the two sectors
increases when the global economy is expanding rapidly and companies in the sectors are racing to increase output.
In the Energy sector, by contrast, Figure 3 illustrates that the likelihood of an
adverse and costly ESG event is estimated to be lower today than was the
case in 2009 (noting, once again, that we are not assuming the movements of
sectors are linear over time). We calculate that, of all the sectors, Energy has
the greatest sensitivity to various environmental factors (Figure 5), including
water management, GHG emissions and air quality.
Of course, for the Energy sector the biggest difference between 2009 and
today is the price of oil. Figure 6 illustrates that, whereas oil prices are low
today after falling precipitously since the summer of 2014, in 2009 and
thereafter they were rising steadily (apart from a period of decline around
the time of the environmentally catastrophic BP Deepwater Horizon oil spill
in 2010). The implication here is that rising oil prices (e.g., in 2009) prompt
incremental exploration and production activities that may significantly
increase the likelihood of an adverse environmental event (e.g., in 2010). A
report4 commissioned by the Bureau of Ocean and Energy Management
supports this hypothesis, as it found a linear relationship between the volume
of crude oil production and the number of oil spills.
Figure 6: West Texas Intermediate Cushing Crude Oil Spot Price
Source: Bloomberg
4 Robertson, T.L., Campbell, L. K., Pearson, L., and Higman, B. (2013). Oil spill occurrence rates for Alaska North Slope crude and refined oil spills. Report to Bureau
of Ocean and Energy Management. OCS Study BOEM 2013-205

8
Please see important disclosures at the back of this report.
In the Consumer Staples sector, environmental (e.g., water usage) and social
(e.g., health and nutrition issues) factors are estimated to have almost equal
importance. As outlined below, ESG risks in the sector seem to have declined
in recent years.
While the Consumer Staples sector covers a range of industries — including Household and Personal Products, Processed Foods and Beverages — most
of them consume water as part of their production processes. Against a
background of global water scarcity, the sector’s consumption of water has
declined steadily. Separately, a heightened consumer focus on health and
nutrition issues has been driven by concerns about obesity, ingredient safety,
and nutritional value, among other factors. In this context it would seem that
the sector has taken steps to develop “healthier” products (with less sugar,
fats, etc.) to address some of these issues.
The Telecommunication Services sector's ESG risk has likely increased
materially since 2008. We estimate that, of all the sectors, Telecom has the
greatest sensitivity to social factors (Figure 5), with data privacy and data
security being two key issues for this sector.
The explosive growth of the internet in recent years has solidified the
position of the Telecom sector as a crucial provider of voice and data
services. At the same time, however, hacking, cyber-attacks and other forms
of internet crime have also increased; indeed, in 2011, the Securities
Exchange Commission issued guidance to U.S. companies to disclose any
material information on cyber-attacks or risks. Given these trends, a failure
by the sector to protect the privacy and security of its customers’ information
could potentially have a material financial impact.
After Telecom, the Information Technology sector has the second largest
sensitivity to social factors. While data privacy and data security are also
important for this sector, so, too, are human capital issues, most notably
employee recruitment and retention.
In the stylized shifting Materiality Matrix illustrated in Figure 3, the current
plot point of the Information Technology sector is slightly lower than its plot
point in 2008 and is in close proximity to the current plot point for the
Telecom sector. The implication here is that, for the Information Technology
sector — and the large Software industry in particular — data privacy and
data security have been critical issues for many years, as have factors
pertaining to employee recruitment and retention. In sum then, the position
of the Information Technology sector in the ESG Materiality Matrix seems to
have been relatively stable.

9
Please see important disclosures at the back of this report.
In Health Care — where governance (product safety and quality) and social
(product affordability and access) factors are estimated to have almost equal
importance — ESG risks have likely increased in recent years.
With regard to product safety and quality issues, the number of fatalities
associated with pharmaceutical products reported by the U.S. Food and Drug Administration doubled in the most recent five-year period. Separately,
Interpol estimates that, in some areas of Asia, Africa and Latin America,
counterfeit medical goods can form up to 30% of the market. As for product
affordability and access, in many developed economies the rate of increase in
the price of prescription drugs has exceeded the general inflation level,
thereby increasing the risk of price regulation.
By contrast, the ESG risk of the Financials sector has likely declined in recent
years. (Obviously, with the benefit of hindsight, the 2006 plot point for the
Financials sector would have been in the top right quadrant of Figure 3.) As
we noted above — and as Figure 5 illustrates — governance is by far the most
significant ESG factor in the sector.
Following the financial crisis of 2007-08, regulatory scrutiny of the Financials
sector globally has been ratcheted up considerably. The sector has had to
adapt to much more stringent capital adequacy, stress testing and market
liquidity risk standards. On top of this, in recent years major global banks
have had to pay significant fines for various misdeeds, including
inappropriate sales of mortgage bonds prior to the crisis, manipulating
benchmark interest rates and lax money laundering controls. While financial
and economic crises will continue to occur periodically, in the near term the
development and implementation of regulations related to systemic risk
management have likely improved the ability of the sector to absorb shocks.
10
Please see important disclosures at the back of this report.
Implications for Sector Strategy
Based on the analysis above, we draw four broad conclusions for sector strategy.
In the near term, the Materials sector is vulnerable to potential ESG issues
and their associated financial impacts, as is the Industrials sector, albeit to a
lesser extent.
As noted above, both sectors are highly cyclical in nature, so the likelihood of
adverse and costly ESG events increases when the global economy is
expanding rapidly. Today it would seem that most large developed
economies continue to grow, while some emerging economies have been
under pressure due to weakness in commodity prices. Going forward, if a
rebound in commodity prices drives expansion in certain emerging
economies, that could well contribute to an environment of synchronized
global growth.
There is a risk that the Energy sector shifts back to an unfavorable position in
the Materiality Matrix.
We pointed out that it seems that the price of oil is a key factor in the Energy
sector’s ESG lifecycle. Some forecasters are calling for a rebound in oil prices
from current levels in the near future.
Reflecting burgeoning data privacy and data security issues, ESG risks / costs
could become even more material for the Telecom and Information
Technology sectors.
ESG risks / costs could also increase for the Health Care sector albeit for
different reasons, namely those pertaining to product safety / quality and
product affordability / access.

11
Please see important disclosures at the back of this report.
Michael Geraghty is the Global Markets Strategist for Cornerstone Capital Group. He has over three decades of experience in the financial services industry including working as an investment strategist at UBS and Citi.

12
Please see important disclosures at the back of this report.
Cornerstone Capital Inc. doing business as Cornerstone Capital Group (“Cornerstone”) is a Delaware corporation with headquarters in New York, NY. The Cornerstone Flagship Report (“Report”) is a service mark of Cornerstone Capital Inc. All other marks referenced are the property of their respective owners. The Report is licensed for use by named individual Authorized Users, and may not be reproduced, distributed, forwarded, posted, published, transmitted, uploaded or otherwise made available to others for commercial purposes, including to individuals within an Institutional Subscriber without written authorization from Cornerstone. The views expressed herein are the views of the individual authors and may not reflect the views of Cornerstone or any institution with which an author is affiliated. Such authors do not have any actual, implied or apparent authority to act on behalf of any issuer mentioned in this publication. This publication does not take into account the investment objectives, financial situation, restrictions, particular needs or financial, legal or tax situation of any particular person and should not be viewed as addressing the recipients’ particular investment needs. Recipients should consider the information contained in this publication as only a single factor in making an investment decision and should not rely solely on investment recommendations contained herein, if any, as a substitution for the exercise of independent judgment of the merits and risks of investments. This is not an offer or solicitation for the purchase or sale of any security, investment, or other product and should not be construed as such. References to specific securities and issuers are for illustrative purposes only and are not intended to be, and should not be interpreted as recommendations to purchase or sell such securities. Investing in securities and other financial products entails certain risks, including the possible loss of the entire principal amount invested. You should obtain advice from your tax, financial, legal, and other advisors and only make investment decisions on the basis of your own objectives, experience, and resources. Information contained herein is current as of the date appearing herein and has been obtained from sources believed to be reliable, but accuracy and completeness are not guaranteed and should not be relied upon as such. Cornerstone has no duty to update the information contained herein, and the opinions, estimates, projections, assessments and other views expressed in this publication (collectively “Statements”) may change without notice due to many factors including but not limited to fluctuating market conditions and economic factors. The Statements contained herein are based on a number of assumptions. Cornerstone makes no representations as to the reasonableness of such assumptions or the likelihood that such assumptions will coincide with actual events and this information should not be relied upon for that purpose. Changes in such assumptions could produce materially different results. Past performance is not a guarantee or indication of future results, and no representation or warranty, express or implied, is made regarding future performance of any security mentioned in this publication. Cornerstone accepts no liability for any loss (whether direct, indirect or consequential) occasioned to any person acting or refraining from action as a result of any material contained in or derived from this publication, except to the extent (but only to the extent) that such liability may not be waived, modified or limited under applicable law. This publication may provide addresses of, or contain hyperlinks to, Internet websites. Cornerstone has not reviewed the linked Internet website of any third party and takes no responsibility for the contents thereof. Each such address or hyperlink is provided for your convenience and information, and the content of linked third party websites is not in any way incorporated herein. Recipients who choose to access such third-party websites or follow such hyperlinks do so at their own risk.