A semi-automatic analysis tool for the determination of ...
17
HAL Id: hal-01877516 https://hal.archives-ouvertes.fr/hal-01877516 Submitted on 19 Sep 2018 HAL is a multi-disciplinary open access archive for the deposit and dissemination of sci- entific research documents, whether they are pub- lished or not. The documents may come from teaching and research institutions in France or abroad, or from public or private research centers. L’archive ouverte pluridisciplinaire HAL, est destinée au dépôt et à la diffusion de documents scientifiques de niveau recherche, publiés ou non, émanant des établissements d’enseignement et de recherche français ou étrangers, des laboratoires publics ou privés. A semi-automatic analysis tool for the determination of primary particle size, overlap coeffcient and specific surface area of nanoparticles aggregates Soleiman Bourrous, Quentin Ribeyre, Laura Lintis, Jérôme Yon, Sébastien Bau, Dominique Thomas, Cécile Vallières, François-Xavier Ouf To cite this version: Soleiman Bourrous, Quentin Ribeyre, Laura Lintis, Jérôme Yon, Sébastien Bau, et al.. A semi- automatic analysis tool for the determination of primary particle size, overlap coeffcient and specific surface area of nanoparticles aggregates. Journal of Aerosol Science, Elsevier, 2018, 126, pp.122 - 132. 10.1016/j.jaerosci.2018.09.001. hal-01877516
Transcript of A semi-automatic analysis tool for the determination of ...

HAL Id: hal-01877516https://hal.archives-ouvertes.fr/hal-01877516
Submitted on 19 Sep 2018
HAL is a multi-disciplinary open accessarchive for the deposit and dissemination of sci-entific research documents, whether they are pub-lished or not. The documents may come fromteaching and research institutions in France orabroad, or from public or private research centers.
L’archive ouverte pluridisciplinaire HAL, estdestinée au dépôt et à la diffusion de documentsscientifiques de niveau recherche, publiés ou non,émanant des établissements d’enseignement et derecherche français ou étrangers, des laboratoirespublics ou privés.
A semi-automatic analysis tool for the determination ofprimary particle size, overlap coefficient and specific
surface area of nanoparticles aggregatesSoleiman Bourrous, Quentin Ribeyre, Laura Lintis, Jérôme Yon, Sébastien
Bau, Dominique Thomas, Cécile Vallières, François-Xavier Ouf
To cite this version:Soleiman Bourrous, Quentin Ribeyre, Laura Lintis, Jérôme Yon, Sébastien Bau, et al.. A semi-automatic analysis tool for the determination of primary particle size, overlap coefficient and specificsurface area of nanoparticles aggregates. Journal of Aerosol Science, Elsevier, 2018, 126, pp.122 - 132.�10.1016/j.jaerosci.2018.09.001�. �hal-01877516�

1
A semi-automatic analysis tool for the determination of primary particle size,
overlap coefficient and specific surface area of nanoparticles aggregates
S. Bourrous1, Q. Ribeyre
2, L. Lintis
1,2, J. Yon
3, S. Bau
4, D. Thomas
2, C. Vallières
2, F.-X. Ouf
1
1Institut de Radioprotection et de Sûreté Nucléaire (IRSN), PSN-RES, SCA, Gif-Sur-Yvette, 91192, France.
2Université de Lorraine, Laboratoire Réactions et Génie des Procédés (LRGP), UMR 7274, F-54000, Nancy,
France.
3Normandie Univ, INSA Rouen, UNIROUEN, CNRS, CORIA, 76000 Rouen, France.
4Institut National de Recherche et de Sécurité, INRS, Laboratoire de Métrologie des Aérosols, Rue du Morvan
CS 60027, 54519 Vandoeuvre Cedex, France
Abstract
The high reactivity of nanostructured materials makes their use very attractive for various industrial
applications. However, these materials may also have an important impact on health / environment / climate
and on the performances of protective devices (i.e. high efficiency particulate air filters, electrostatic
precipitators). Those properties are mainly due to their high specific surface area, which is directly related to
the size of the non-porous primary nanoparticles and to the nature of the bridging between them (from point
contact for agglomerates to partial fusion for aggregates).
In this paper, a straightforward image processing has been developed to measure, assuming a log-normal size
distribution, the primary particle diameter (Dpp), the geometric standard deviation GSD (or σg), the projected
overlap coefficient (Cov, p) and the specific surface area (SS) directly from TEM images according to the approach
introduced by Bau et al. (2010). Measurements have been performed from TEM images obtained for 22
different kinds of nanoparticles, from simple spheres to soot particles and virtual aggregates. The results show
a good agreement (within +/- 20 %) between automatic and manual analysis of Dpp, σg and SS while the overlap
coefficient has been compared to the manual analysis showing a reasonable agreement (within +/- 40 %).
Keywords: electronic microscopy, image processing, nanoparticles aggregates / agglomerates, specific surface
area.
Introduction
The study of environmental pollution caused by soot particles is an active research field. Recently, it has been
shown that the morphological structure and the overlap coefficient between primary particles composing soot
are directly correlated to their optical/radiative properties (Liu et al , 2015; Yon et al., 2014).
Beyond their climate impact, toxicity of those particles is now commonly assumed to have serious public health
implications. Several authors have reported that exposure to diesel particulates increases the risk of mortality
from lung cancer (Attfield et al., 2012) and that their toxicity is mainly correlated to their specific surface area
(Schmid & Stoeger, 2016; Steiner et al., 2016). The reference method for measuring this specific surface area is
based on inert gas adsorption analysis (BET method, Sing, 1985), but as a minimal quantity of powder (at least
100 mg for nanostructured powders from Karg et al., 2008, which represents 10 m² for SBET = 100 m²/g) is
needed for such techniques, in certain cases it becomes necessary to derived the specific surface area from
TEM images. Usually, determination of the morphological parameters (diameter of the primary particles and
overlapping coefficient) from TEM pictures is made manually, which introduces a bias induced by the operator
subjectivity and involves a limited number of analyzed images, about 100 depending on the dispersion of the
measured parameter. Numerical image processing is a good compromise to improve the quality of those

2
measurements and avoid the uncertainty related to subjectivity of the operator. If recent developments have
mainly focused on the determination of the size of primary particles and the fractal dimension of the
agglomerates/aggregates (Bescond et al., 2014; Dastanpour et al. 2016; Mirzaei & Rafsanjani, 2017), limited
work has been performed regarding the overlap coefficient between primary particles (De Temmerman et al.,
2014). To our best knowledge, there is no recent study dealing specifically with the issue of the automated
determination of the specific surface area based on TEM image analysis.
Because of the potential health effects of such particles, it is necessary to develop suitable reduction devices
such as High Efficiency Particulate Air Filters (HEPA), electrostatic precipitators or scrubbers. All these devices
require the efficiency to be as high as possible in order to avoid any release of NOAA (NanoObjects, their
Agglomerates and Aggregates) nanostructured particles in the atmosphere or human exposure. Nevertheless,
for such situations, the pressure drop induced by the formation of a soot cake at the filtration medium surface
represents a significant economic cost. Furthermore, for safety application and especially in the nuclear
industry, containment of hazardous particulate materials must be maintained despite the situation. Prediction
of airflow behavior of containment elements such as HEPA filters in case of fire directly depends on the
properties of the particulate pollutants (Ishibashi et al., 2014; Ouf et al., 2014). In the currently used
phenomenological models of filter clogging (Bourrous et al., 2016; Kim et al., 2009; Thomas et al., 2014), the
pressure drop of a filter clogged by soot particles can only be estimated from the primary particles size and the
overlap fraction of particles between them. Nevertheless, most of the commercially available online
measurements (Scanning Mobility Particle Sizer (SMPS), Aerodynamic Particle Sizer (APS), Electrical Low
Pressure Impactor (ELPI)) only provide/report an equivalent diameter relative to the physical behavior of
aggregates (settling velocity, electrical mobility...). None of them is able to determine in a direct way the
primary particle size distribution and their overlap coefficient.
In most cases, Transmission Electron Microscopy is the reference method (Brasil et al., 1999; Köylü et al., 1995)
for measuring the morphological properties of fractal aggregates formed during combustion processes. Since
the application of Mandelbrot’s fractal theory by Jullien & Botet (1987) for describing the shape of
nanoparticles aggregates/agglomerates formed by diffusion limited cluster aggregation (DLCA), many authors
have proposed automatic tools for measuring the diameter of primary particles. Such developments were
motivated by the need to reduce the time of analysis, to increase the statistics and finally to avoid as much as
possible any human operator subjectivity. The latter effect has been investigated in the present work from TEM
images of soot particles produced by an ethylene diffusion burner and sampled on TEM grids (Ouf et al., 2010).
Manual analysis by two separate human operators was carried out for the same samples and the
corresponding mean primary particle diameters are compared in figure 1a. The agreement between each
operator appears to be reasonable within a confidence interval of +/- 20 %. Other authors (Anderson et al.
2017; Kondo et al. 2013) reported similar fluctuations for flame spray soot (respectively +/- 14 % and +/- 17 %
from these sources). Then, +/- 20 % will be considered as the maximum acceptable discrepancy between the
proposed automatic analysis and a manual one of primary particle diameter. Similar comparison has been
conducted for the overlap coefficient and the results are presented in figure 1b. For this parameter, the
discrepancy between the results obtained by two operators can reach nearly 35 %. This bias can be problematic
for predictive computations based on this value and for any application that (would) require(s) a fine
knowledge of the particles properties/reactivity or toxicity (Schmid & Stoeger, 2016; Steiner et al., 2016).

3
Figure 1: Comparison between count median primary spheres diameters (a) and projected overlap coefficients
(b) measured by two human operators for soot particles produced by an ethylene diffusion flame (adapted from Ouf et al., 2010). Bars represent standard deviations.
Manual analysis of the determination of primary particle size and overlap coefficient also remains problematic
in terms of statistical validity of the data. Moreover, the duration of the measurement does not allow a high
numbers of analyses, typically less than 20. This can influence the statistical representativeness of the
measured values. To investigate the influence of the number of measurements required to carry out an
accurate statistical analysis of the primary particle, mean diameter has been determined for several sets of
data with a wide range of primary particle diameters. This analysis has been carried out for synthetic TEM
images of Diffusion Limited Cluster Aggregates and real TEM micrographs of ethylene and gloves box soot
particles (see Materials and Methods for more details). Figure 2 shows the evolution, as a function of the
number of primary particles diameters considered, of the absolute deviation (Dev(Npp analyzed)) between mean
diameter obtained for a specific number of analyses of primary particles Npp analyzed and the mean diameter
obtained from the entire set of images (relation I) .
-
(I)
With Npp analyzed, the number of primary particles considered, the mean primary particle size.
The numerical DLCA aggregates with a perfectly known diameter distribution (nearly 400 aggregates
containing from 1 to 1000 primary particles) are used as a reference. For each Npp analyzed, one hundred random
sets of Npp analyzed primary particles are generated and the absolute deviation is computed. Mean value is then
determined and reported in figure 2. For the worst case and similarly to the results reported by Bau et al.
(2010), a minimum number of 100 primary particles is needed to reach less than 5 % deviation. Nevertheless,
the geometric standard deviation has a significant influence on the limiting Npp analyzed and, as GSD decreases
from 1.7 to 1.3 (for DLCA), this limiting value decreases by a factor of 5. In order to check the validity of this
numerical approach, those are compared with two different kinds of aggregates with various sample sizes
denoting a limited number of aggregates (14 glove box soot aggregates) and a reasonable one (81 fresh
ethylene soot aggregates). As demonstrated by Dastanpour & Rogak (2014), the amount of aggregates plays a
rule in the statistical representativity of the primary particle size distribution. In our case, for the glove box
sample, 14 aggregates (associated to 50 primary particles) are enough to reach a statically satisfying
distribution, even for a GSD of 1.5. Without any prior knowledge on the GSD of primary particle size
distribution, a minimum number of 100 measurements of primary particle diameter is needed (assuming that
GSD does not exceed 1.7).

4
Figure 2: Evolution of mean primary particle diameter of ethylene soot particles (adapted from Ouf et al., 2010) as a function of number of primary particle diameters considered
Beyond the definition of aggregate and agglomerates of nanoparticles, it can be helpful to introduce a relevant
metric for describing the bridging between nanoparticles and moreover for describing their physical and
chemical behavior. For this purpose, Brasil et al. (1999) have introduced the overlap coefficient Cov as a
function of the mean primary particle diameter and the distance between the centers of mass of two
contiguous nanoparticles. Beyond the description of the bridging between soot or nanoparticles
aggregates/agglomerates, several recent studies have demonstrated that this property could have an indirect
influence on soot optical properties through modification of their morphological properties (Yon et al., 2015),
pressure drop associated with soot or nanoparticles cake (Thomas et al., 2014) as well as their specific surface
area (De Temmerman et al., 2014).
According to Brasil et al.’s relationship between three-dimensional and projected properties and using primary
particle diameter, overlap coefficient and assuming the soot bulk density, Gwaze et al. (2006) were the first
authors to apply the specific surface determination from TEM pictures for soot particles. More recently, Bau et
al. (2010) have validated this approach (see relation III) by comparing TEM-based analysis with specific surface
area measurements according to the reference BET method (Brunauer et al., 1938; Sing, 1985). Nevertheless,
such analysis, generally operated manually, suffers a lack of statistics, is extremely time consuming and
denotes high level of uncertainty.
To overcome those difficulties, some authors have developed image processing algorithms in order to analyze a
statistically relevant number of primary particles (more than 100 to reach less than 5% deviation according to
fig. 2). Several methods have been recently proposed to measure the primary particle diameter (Kook et al.,
2015; Mirzaei & Rafsanjani, 2017), the geometric standard deviation of their size distribution (Bescond et al.,
2014; Dastanpour et al., 2016), the aggregates/agglomerates fractal dimension (Wang et al., 2016) and even
the overlap coefficient of primary particles (De Temmerman et al., 2014). It is worth noting that none of those
methods allows the measurement of the specific surface area.
In the present work, a new semi-automatic measurement process of DPP, σg, COV and SS is proposed, based on
the Hough transform (Matlab©, Grishin et al., 2012). Automatic analysis of DPP, σg, COV has been validated using
a wide range of real and model nanoparticles (Bescond et al., 2013) on the basis of manual measurement of
these morphological parameters. Application of this automatic method to the determination of the specific
surface area has been finally validated according to BET measurements.

5
Materials and methods
The presented program aims to analyze raw TEM images without prior processing. To do so, raw images are
pretreated using classical binarization and opening process. This aims to reduce the noise and to ensure the
proper selection of the particles. Various automatic binarization methods exist to ensure the selection of the
optimal threshold. Our program uses the simple and fast method proposed by Otsu (Otsu, 1979). It is based on
the assumption that only the background and the particle are present on the picture. When images contrast is
too low to ensure the analyzability, a manual thresholding can also be used. The criterion for this step is to be
able to distinguish the primary particles constituting the aggregate.
In a second step, circular structures are found using the Hough transform preprogrammed function and their
diameter and position are used to identify overlapping particles. To do so, the input parameters are the
sensitivity, the maximal and minimal radius of each mode visually identified (in order to reduce the processing
time and to make the measurement more accurate). Furthermore, a visual control is performed by the
operator consecutively to the analysis of each processed image, in order to avoid any artefact. Figure 3 shows
an illustration of the analysis performed on a fractal soot aggregate.
Figure 3: Illustration of the primary particle diameter and overlap coefficient measurement process
Recognized particles are identified by blue circles on the right image (after treatment). It is worth noting that all
of the particles are not systematically detected. Due to the low quality of the input image and the intrinsic
principle of the Hough transform, an exhaustive automatic detection of the particles cannot be performed. The
representativeness of the statistical analysis is based on the fact that a high number of images can be analyzed
successively since analyses are performed within a few seconds. Projected overlap coefficient (Cov,p) is
measured on the TEM images according to the respective positions of the centers of mass and diameters of
each overlapping primary particles and the empirical correlation of (Brasil et al., 1999) is used to convert the 2D
Cov, p into a 3D Cov.
- (II)
In the present software, for each couple of circles detected, the distance between the centers is compared to
the sum of the radius. If this distance is lower, then one COV, p value is considered. This process is repeated for
all particles detected in the image. One must noticed that present relationship is purely empirical and, as
reported by Brasil et al. (1999), has been developed for soot aggregates with a fractal dimension of 1.78 and a
projected overlap coefficient Cov, p ranging from 0 to 0.33.
From this value, using the relation firstly introduced by Brasil et al. (1999) and modified by Bau et al. (2010), the
specific surface area, defined as the ratio between particle geometric surface area and mass, has been deduced
by knowing or assuming the bulk density of the material composing nanoparticles ρpp.

6
- -
(III)
With Ф an empirical constant equal to 1.3 according to Brasil et al. (1999). As mentioned by Bau et al. (2010),
this method of specific surface area analysis has been validated on non-porous nanoparticles aggregates with
different primary particle diameters ranging from 7 nm to 47 nm and projected overlap coefficient between 0
(agglomerates) and 0.24 (SiO2 aggregates). The corresponding specific surface area covered a range from 36.9
to 198.3 m²/g and the main assumption in this previous study was to consider that the specific surface area
measured on an aerosol sample (after dispersion in the airborne phase of a nanostructured powder) is similar
to the one of the bulk powder as measured by the BET method.
In this work, the validation protocol has been performed in 3 steps by 3 independent human operators:
1. First of all, ideal 3D aggregates have been simulated using a DLCA code; this method allows
the control of the particle size distribution, fractal dimension and overlap coefficient. This
validation step performed on ideal objects aims to validate the choice of the method,
statistical representativeness and correlations (Brasil et al., 1999; Bau et al., 2010) which are
used in the program.
2. Secondly, evaluation of the robustness of the measurement has been performed on non-
aggregated nanoparticles. In this step, the TEM images considered have been produced in the
frame of a metrological work (Motzkus et al., 2013) and the geometric properties have been
manually measured by different laboratories. Those images will be used as a reference for the
validation of the number size distribution of primary particle diameter to evaluate the impact
of image noise, background and contrast.
3. Finally TEM images of aggregates found in the literature or produced for this work have been
manually analyzed for validating the automatic analysis of Dpp, σg and Cov while the specific
surface area of the particles was compared to reference BET values obtained on powder
samples. The robustness of the program with realistic fire particulate emissions was
evaluated on soot aggregates produced by laboratory scale burners as well as soot particles
emitted in real fire conditions. All validations have been performed on more than 100 primary
particles according to the results presented in figure 2 and allowing a good statistical
representativeness (less than 5 % relative deviation on primary particle diameter).
Morphological properties and examples of images (TEM based or numerical) of the different samples
considered are summarized in Tables 1 and 2. Reference values of bulk density and BET specific surface area
are also reported in these tables with the corresponding reference when coming from literature. Sampling of
these particles has been carried according to thermophoretic particle sampler (TPS, Ouf et al., 2010), filtration
on nuclepore membrane of colloidal suspension dispersed according to a pneumatic generator (mentioned as
filtration in table 1, Motzkus et al., 2013), deposition of a droplet of colloidal suspension directly on TEM grids
(mentioned as droplet in table 1, Ribeyre, Grévillot, Charvet, Vallières, & Thomas, 2014) mini particle sampler
(MPS, R’mili, Le Bihan, Dutouquet, Aguerre-Charriol, & Frejafon, 2013) and corresponding methods are
summarized in table 1. TEM analyses have been carried out using several transmission electron microscope, i.e.
120 kV Zeiss, EM 910 model (Aerosil 200 and Black carbon samples) and 100kV JEOL, 100CXII model (others
samples).
Validation of the automatic measurement tool
Automatic analysis of primary particle size distribution
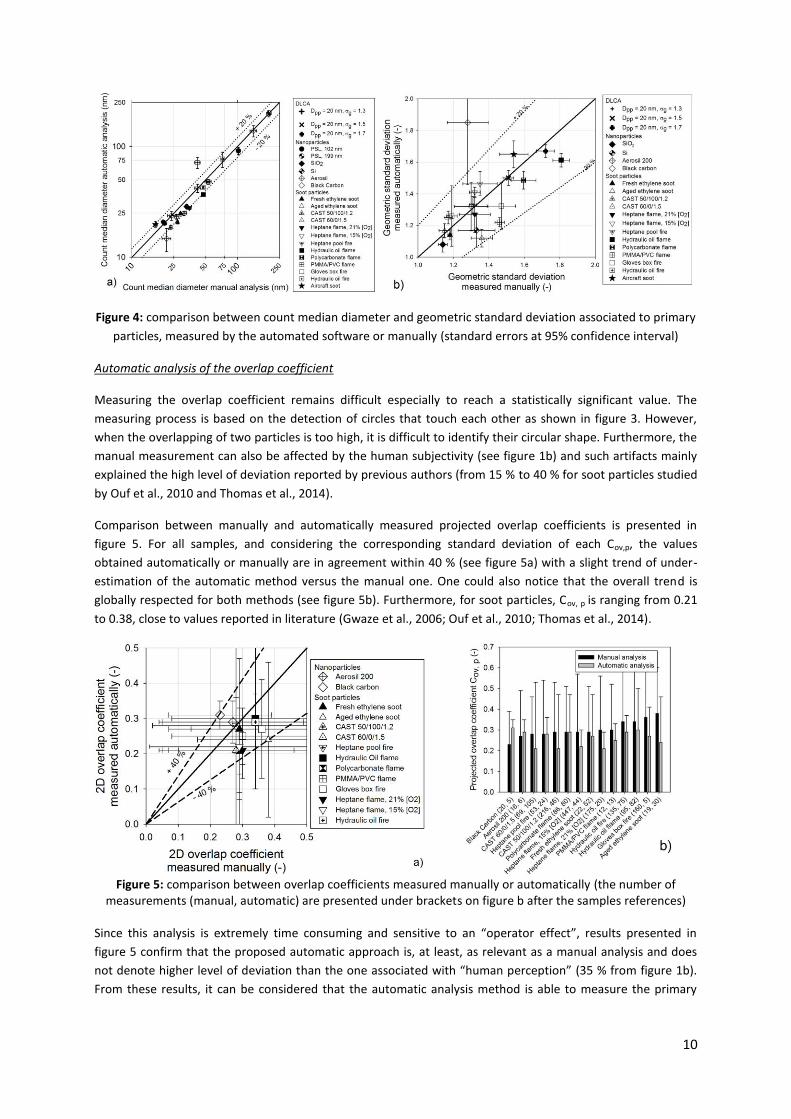
The comparison between the count median diameter measured manually and by the automated software for
all samples described in Tables 1 and 2 is presented in figure 4. For the 3 different synthetic aggregates

7
obtained with the DLCA code, the agreement is almost perfect, with a mean discrepancy of 2% or 0.4 nm
(corresponding to 2 pixels according to the resolution of the numerical images of 0.2 nm per pixel). As for TEM
images obtained for real samples, no significant difference has been noticed between manual and automatic
analysis. Among the 21 samples tested, the deviation exceeds 20% for only 3 samples (commercial Aerosil 200
and soot particles sampled during Gloves box and Hydraulic oil fires). This might be due to an excessive noise or
possible limited resolution of those TEM images. Nevertheless, this order of magnitude of deviation is similar to
the bias expected for manual analysis between two separated human operators, as shown in figure 1. The
automated approach developed in the present study is then considered suitable for analyzing real
nanoparticles and soot samples with high level of confidence. According to Motzkus et al. (2013) and Bescond
et al. (2014), a log-normal function has been considered for describing the primary particle size distribution of
respectively nanoparticles (excepted for PSL which is a mono-disperse size standard) and soot samples. Figure 4
also presents the comparison between the geometric standard deviation determined from the automatic size
distribution analysis and the one measured manually. For the reference images (i.e. generated using the DLCA
code), the geometric standard deviation obtained manually is almost perfectly corresponding to the expected
value. Small discrepancies are doubtless due to the resolution of the image. For the real TEM images, except
for the Aerosil 200, the correspondence is within 20% which is lower than the uncertainty and bias inherent to
the human subjectivity during the manual analysis (20 % from figure 1). This validates the concept of the
measurement and its statistical representativeness.

8
Table 1: Properties of reference samples considered for validation of the automated measurement process
Type Name Source Manual TEM analysis
SBET (m²/g) Density (kg/m3) Reference
(sampling method)
Examples of TEM or numerical images 𝐃𝐩𝐩 (nm) σg (-) Cov,p (-)
DLCA DLCA1 Diffusion limited cluster aggregation code
20.3 1.31 - - - DLCA code from Bescond et al. (2013)
DLCA2 20.4 1.51 - - -
DLCA3 19.8 1.72 - - -
Nanoparticles PSL, 102 nm
Polystyrene latex sphere
102 - - - - Duke scientific
(filtration)
PSL, 199 nm
199 - - - -
SiO2
LUDOX 33.0 1.14 - 1401 14001 1Manufacturer datasheet
(filtration)
Si
IRAMIS 23.7 1.33 - 87 2327 2Manufacturer datasheet
(filtration)
Aerosil 200
DEGUSSA 21.3 1.28 196 +/- 1 25802 2Manufacturer datasheet
(droplet)
Black Carbon
PROLABO 142 1.30 - 30.3 +/- 1 18693 3Manufacturer datasheet
(droplet)
𝐃𝐩𝐩: count median diameter of primary particle (nm), σg: geometric standard deviation (-), Cov,p: projected overlap coefficient (-), SBET: specific surface area measured by BET (m²/g)

9
Table 2: Properties of soot samples considered for validation of the automated measurement process
Type Name Source Manual TEM analysis
SBET (m²/g) Density (kg/m3) Reference
(sampling method)
Examples of TEM or numerical images 𝐃𝐩𝐩 (nm) σg (-) Cov,p (-)
Soot particles Fresh ethylene soot Ethylene diffusion burner
28.8 1.18 0.13 +/- 0.12 - - Ouf et al. (2010)
(TPS)
Fresh soot Aged soot
Aged ethylene soot 27.1 1.17 0.21 +/- 0.12 - -
CAST 50/100/1.2 Propane diffusion burner miniCAST
23.3 1.15 0.29 +/- 0.12 - 1745 Thomas et al. (2014) (TPS)
CAST 50/100/1.2 CAST 60/0/1.5
CAST 60/0/1.5 26.5 1.36 0.28 +/- 0.09 137.2 +/- 0.54 15435 4Monge et al. (2010) 5Yon et al. (2015)
(TPS)
Heptane flame, 21% [O2]
Medium scale heptane pool fire
35.1 1.31 0.30 +/- 0.13 - - Present paper (TPS)
Heptane 21 %
Heptane flame, 15% [O2]
31.2 1.32 0.29 +/- 0.14 - - Present paper
(TPS)
Heptane pool fire Medium scale pool fire, confined
42.0 1.35 0.28 +/- 0.13 - - Present paper
(MPS)
Hydraulic oil flame Small scale, over-
ventilated 47.7 1.81 0.34 +/- 0.11 - - 6Ouf et al. (2014)
(MPS)
Polycarbonate flame
52.77 1.60 0.29 +/- 0.11 - - 6Ouf et al. (2014)
(MPS)
PMMA/PVC flame Medium scale, under-ventilated
72.0 1.19 0.30 +/- 0.11 57.2 +/- 5.0 1260 Present paper
(filtration)
Gloves box fire Large scale, over-
ventilated 41.8 1.47 0.36 +/- 0.11 43.8 +/- 0.1 1660 Present paper
(MPS)
Hydraulic oil fire Large scale, over-
ventilated 47.3 1.46 0.34 +/- 0.15 77.1 +/- 1.3 1614 Present paper
(MPS)
Aircraft soot SAM146 engine, 85% thrust
16.7 1.54 - - - 7Bescond et al. (2014)
(MPS)
𝐃𝐩𝐩: count median diameter of primary particle (nm), σg: geometric standard deviation (-), Cov,p: projected overlap coefficient (-), SBET: specific surface area measured by BET (m²/g)
10
Figure 4: comparison between count median diameter and geometric standard deviation associated to primary
particles, measured by the automated software or manually (standard errors at 95% confidence interval)
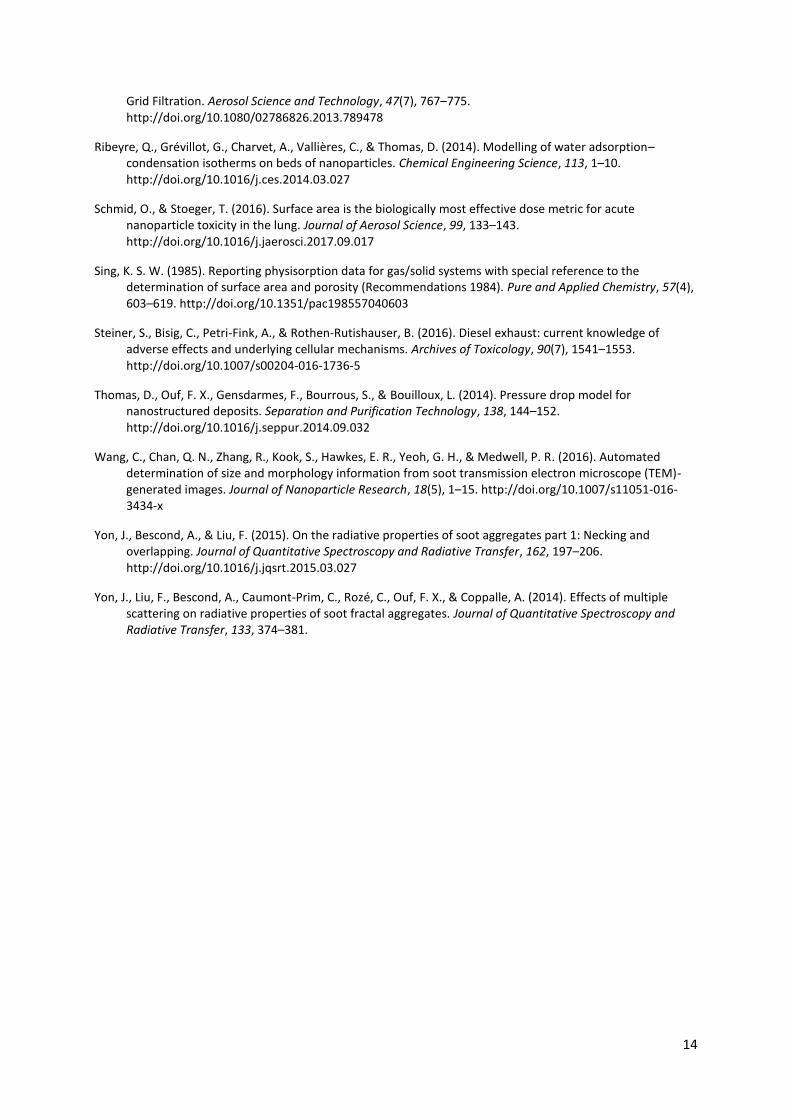
Automatic analysis of the overlap coefficient
Measuring the overlap coefficient remains difficult especially to reach a statistically significant value. The
measuring process is based on the detection of circles that touch each other as shown in figure 3. However,
when the overlapping of two particles is too high, it is difficult to identify their circular shape. Furthermore, the
manual measurement can also be affected by the human subjectivity (see figure 1b) and such artifacts mainly
explained the high level of deviation reported by previous authors (from 15 % to 40 % for soot particles studied
by Ouf et al., 2010 and Thomas et al., 2014).
Comparison between manually and automatically measured projected overlap coefficients is presented in
figure 5. For all samples, and considering the corresponding standard deviation of each Cov,p, the values
obtained automatically or manually are in agreement within 40 % (see figure 5a) with a slight trend of under-
estimation of the automatic method versus the manual one. One could also notice that the overall trend is
globally respected for both methods (see figure 5b). Furthermore, for soot particles, Cov, p is ranging from 0.21
to 0.38, close to values reported in literature (Gwaze et al., 2006; Ouf et al., 2010; Thomas et al., 2014).
Figure 5: comparison between overlap coefficients measured manually or automatically (the number of
measurements (manual, automatic) are presented under brackets on figure b after the samples references)
Since this analysis is extremely time consuming and sensitive to an “operator effect”, results presented in
figure 5 confirm that the proposed automatic approach is, at least, as relevant as a manual analysis and does
not denote higher level of deviation than the one associated with “human perception” (35 % from figure 1b).
From these results, it can be considered that the automatic analysis method is able to measure the primary

11
particle diameter, the geometric standard deviation and the overlap coefficient with satisfying accuracy
(respectively 20 % for Dpp and σg and 40 % for Cov, p).
Automatic analysis of the specific surface area
Implementing Bau et al.’s (2010) relationship in our analysis software allows the specific surface area to be
determined automatically. Comparison between TEM-based method and BET values (reported in the literature
or supplied by the powder manufacturer) is presented in figure 6. Sensitivity analysis has been also performed
for each influencing parameters (ρpp, Cov, Dpp, Npp) and is reported in Supplementary Material. This analysis
shows minor influence of Cov and ρpp compared to Dpp for all considered Npp (from 10 to 10 000).
A good agreement (+/- 20 %) between the proposed method and BET analysis is reported for BET specific
surface areas ranging from 30 to 200 m²/g. BET analysis presents the lowest standard deviation, typically less
than 10 % (see Tables 1 and 2), and remains the reference method. Nevertheless, in most cases, and especially
for soot particles and more generally aerosols, it is generally tricky to retrieve enough mass of sample (for
nanoparticles with SBET = 100 m²/g, a total surface of 10 m² represents 100 mg which is minimum amount
recommended by Karg et al., 2008) to perform a BET analysis. Therefore, developing TEM-based analysis tools
to determine the specific surface area of aerosols is of great interest. Such results also confirm the recent
findings of Dazon et al. (2017) for nanostructured samples with BET specific surface area within the range 30-
500 m²/g. They reported a good agreement between the specific surface area of the powder (SSPowder) and the
one of the aerosol (SSAerosol) after aerosolization, both specific surface areas being obtained by the BET method.
Figure 6: comparison between automatic specific surface area analysis and BET analysis
Conclusions
Nowadays, most of the aerosol measurement device constructors propose easy to use and cost effective
sampling systems that allow airborne particle to be directly collected on TEM grids. Electron microscopy
remains the most robust and reference method to characterize nanoparticles at several scales (morphology,
size, microstructure ….). Nevertheless, the analysis of TEM images is time consuming and the use of human
interface for images analysis involves a lot of questions regarding human subjectivity and measurement
reproducibility. The proposed method, based on preprogrammed functions (Hough transform), allows the
quantification of the relevant morphological parameters. Then, primary particles diameter, geometric standard
deviation and overlap coefficient measured using this automatic tool have been successfully compared to
reference manual analysis within a confidence interval similar to the bias induced by human subjectivity (+/- 20
% for the two firsts and 40 % for Cov, p). These data have been used to determine the specific surface area, for

12
which no convincing comparison has been found in the literature between an automatic analysis tool and
reference BET measurements. The present method is, as far as we are concerned, the first automatic method
providing reliable values of specific surface area in close agreement to the BET reference method (within an
interval of +/- 20%). It is worth noting that the present method is limited to non-porous primary particles with
known bulk density, which is an acceptable hypothesis for soot particles and most of manufactured
nanoparticles.
Acknowledgement
This work is a part of the LIMA joint research program (The Interactions Media-Aerosol Laboratory) between
the Institut de Radioprotection et de Sûreté Nucléaire (IRSN) and the Reactions and Chemical Engineering
Laboratory (LRGP) of the French National Centre for Scientific Research (CNRS).
References
Anderson, P. M., Guo, H., & Sunderland, P. B. (2017). Repeatability and reproducibility of TEM soot primary particle size measurements and comparison of automated methods. Journal of Aerosol Science, 114(October), 317–326. http://doi.org/10.1016/j.jaerosci.2017.10.002
Attfield, M. D., Schleiff, P. L., Lubin, J. H., Blair, A., Stewart, P. A., Vermeulen, R., … Silverman, D. T. (2012). The diesel exhaust in miners study: A cohort mortality study with emphasis on lung cancer. Journal of the National Cancer Institute, 104(11), 869–883. http://doi.org/10.1093/jnci/djs035
Bau, S., Witschger, O., Gensdarmes, F., Rastoix, O., & Thomas, D. (2010). A TEM-based method as an alternative to the BET method for measuring off-line the specific surface area of nanoaerosols. Powder Technology, 200(3), 190–201. http://doi.org/10.1016/j.powtec.2010.02.023
Bescond, A., Yon, J., Girasole, T., Jouen, C., Rozé, C., & Coppalle, A. (2013). Numerical investigation of the possibility to determine the primary particle size of fractal aggregates by measuring light depolarization. Journal of Quantitative Spectroscopy and Radiative Transfer, 126, 130–139. http://doi.org/10.1016/j.jqsrt.2012.10.011
Bescond, A., Yon, J., Ouf, F. X., Ferry, D., Delhaye, D., Gaffié, D., … Rozé, C. (2014). Automated Determination of Aggregate Primary Particle Size Distribution by TEM Image Analysis: Application to Soot. Aerosol Science and Technology, 48(8), 831–841. http://doi.org/10.1080/02786826.2014.932896
Bourrous, S., Bouilloux, L., Ouf, F.-X., Lemaitre, P., Nerisson, P., Thomas, D., & Appert-Collin, J. C. (2016). Measurement and modeling of pressure drop of HEPA filters clogged with ultrafine particles. Powder Technology, 289, 109–117. http://doi.org/10.1016/j.powtec.2015.11.020
Brasil, A. M., Farias, T. L., & Carvalho, M. G. (1999). A recipe for image characterization of fractal-like aggregates. Journal of Aerosol Science, 30(10), 1379–1389. http://doi.org/10.1016/S0021-8502(99)00026-9
Brunauer, S., Emmett, P. H., & Teller, E. (1938). Adsorption of Gases in Multimolecular Layers. Journal of the American Chemical Society, 60(2), 309–319. http://doi.org/10.1021/ja01269a023
Dastanpour, R., Boone, J. M., & Rogak, S. N. (2016). Automated primary particle sizing of nanoparticle aggregates by TEM image analysis. Powder Technology, 295, 218–224. http://doi.org/10.1016/j.powtec.2016.03.027
Dastanpour, R., & Rogak, S. N. (2014). Observations of a Correlation Between Primary Particle and Aggregate Size for Soot Particles. Aerosol Science and Technology, 48(10), 1043–1049. http://doi.org/10.1080/02786826.2014.955565
Dazon, C., Witschger, O., Bau, S., Payet, R., Fierro, V., & Jensen, K. A. (2017). On the equivalence between mass-specific surface area of powders and their aerosols and proposal of a new dustiness index for bulk nanomaterials Prediction and quantification of emissions and workers exposure during ceramic industrial

13
processes. In European Aerosol Conference (p. 2017). Zurich,.
De Temmerman, P. J., Verleysen, E., Lammertyn, J., & Mast, J. (2014). Semi-automatic size measurement of primary particles in aggregated nanomaterials by transmission electron microscopy. Powder Technology, 261, 191–200. http://doi.org/10.1016/j.powtec.2014.04.040
Grishin, I., Thomson, K., Migliorini, F., & Sloan, J. J. (2012). Application of the Hough transform for the automatic determination of soot aggregate morphology. Applied Optics, 51(5), 610–20. http://doi.org/10.1364/AO.51.000610
Gwaze, P., Schmid, O., Annegarn, H. J., Andreae, M. O., Huth, J., & Helas, G. (2006). Comparison of three methods of fractal analysis applied to soot aggregates from wood combustion. Journal of Aerosol Science, 37(7), 820–838. http://doi.org/10.1016/j.jaerosci.2005.06.007
Ishibashi, T., Tsuchino, S., Matsumoto, S., & Kasahara, F. (2014). Clogging of HEPA filters by soot during fire events in nuclear fuel cycle facilities. Nuclear Te, 187, 57–68.
Jullien, R., & Botet, R. (1987). Aggregation and Fractal aggregates. World Scientific Publishing Co Pte Ltd.
Karg, E., Ferron, G. A., Schumann, G., & Schmid, O. (2008). Specific BET Surface Area Measurement of Low-Mass-Samples. In 12th ETH Conference on Combustion Generated Nanoparticles.
Kim, S. C., Wang, J., Shin, W. G., Scheckman, J. H., & Pui, D. Y. H. (2009). Structural Properties and Filter Loading Characteristics of Soot Agglomerates. Aerosol Science and Technology, 43(10), 1033–1041. http://doi.org/10.1080/02786820903131081
Kondo, K., Aizawa, T., Kook, S., & Pickett, L. (2013). Uncertainty in Sampling and TEM Analysis of Soot Particles in Diesel Spray Flame. http://doi.org/10.4271/2013-01-0908
Kook, S., Zhang, R., Chan, Q. N., Pickett, L. M., Cenker, E., Bruneaux, G., … Nordin, E. Z. (2015). Automated Detection of Primary Particles from Transmission Electron Microscope ( TEM ) Images of Soot Aggregates in Diesel Engine Environments. SAE International, accepted. http://doi.org/10.4271/2015-01-1991
Köylü, Ü. Ö., Faeth, G. M., Farias, T. L., & Carvalho, M. G. (1995). Fractal and projected structure properties of soot aggregates. Combustion and Flame, 100(4), 621–633. http://doi.org/10.1016/0010-2180(94)00147-K
Liu, F., Yon, J., & Bescond, A. (2015). On the radiative properties of soot aggregates – Part 2: Effects of coating. Journal of Quantitative Spectroscopy and Radiative Transfer. http://doi.org/10.1016/j.jqsrt.2015.08.005
Mirzaei, M., & Rafsanjani, H. K. (2017). An automatic algorithm for determination of the nanoparticles from TEM images using circular hough transform. Micron, 96, 86–95. http://doi.org/10.1016/j.micron.2017.02.008
Motzkus, C., Macé, T., Gaie-Levrel, F., Ducourtieux, S., Delvallee, A., Dirscherl, K., … Vaslin-Reimann, S. (2013). Size characterization of airborne SiO2 nanoparticles with on-line and off-line measurement techniques: An interlaboratory comparison study. Journal of Nanoparticle Research (Vol. 15). http://doi.org/10.1007/s11051-013-1919-4
Otsu, N. (1979). A Threshold Selection Method from Gray-Level Histograms. IEEE Transactions on Systems, Man, and Cybernetics, 9(1), 62–66. http://doi.org/10.1109/TSMC.1979.4310076
Ouf, F.-X., Mocho, V.-M., Pontreau, S., Wang, Z., Ferry, D., & Yon, J. (2014). Clogging of Industrial High Efficiency Particulate Air (HEPA) Filters in Case of Fire: From Analytical to Large-Scale Experiments. Aerosol Science and Technology, 48(9), 939–947. http://doi.org/10.1080/02786826.2014.947022
Ouf, F. X., Yon, J., Ausset, P., Coppalle, A., & Maillé, M. (2010). Influence of Sampling and Storage Protocol on Fractal Morphology of Soot Studied by Transmission Electron Microscopy. Aerosol Science and Technology, 44(11), 1005–1017. http://doi.org/10.1080/02786826.2010.507228
R’mili, B., Le Bihan, O. L. C., Dutouquet, C., Aguerre-Charriol, O., & Frejafon, E. (2013). Particle Sampling by TEM
14
Grid Filtration. Aerosol Science and Technology, 47(7), 767–775. http://doi.org/10.1080/02786826.2013.789478
Ribeyre, Q., Grévillot, G., Charvet, A., Vallières, C., & Thomas, D. (2014). Modelling of water adsorption–condensation isotherms on beds of nanoparticles. Chemical Engineering Science, 113, 1–10. http://doi.org/10.1016/j.ces.2014.03.027
Schmid, O., & Stoeger, T. (2016). Surface area is the biologically most effective dose metric for acute nanoparticle toxicity in the lung. Journal of Aerosol Science, 99, 133–143. http://doi.org/10.1016/j.jaerosci.2017.09.017
Sing, K. S. W. (1985). Reporting physisorption data for gas/solid systems with special reference to the determination of surface area and porosity (Recommendations 1984). Pure and Applied Chemistry, 57(4), 603–619. http://doi.org/10.1351/pac198557040603
Steiner, S., Bisig, C., Petri-Fink, A., & Rothen-Rutishauser, B. (2016). Diesel exhaust: current knowledge of adverse effects and underlying cellular mechanisms. Archives of Toxicology, 90(7), 1541–1553. http://doi.org/10.1007/s00204-016-1736-5
Thomas, D., Ouf, F. X., Gensdarmes, F., Bourrous, S., & Bouilloux, L. (2014). Pressure drop model for nanostructured deposits. Separation and Purification Technology, 138, 144–152. http://doi.org/10.1016/j.seppur.2014.09.032
Wang, C., Chan, Q. N., Zhang, R., Kook, S., Hawkes, E. R., Yeoh, G. H., & Medwell, P. R. (2016). Automated determination of size and morphology information from soot transmission electron microscope (TEM)-generated images. Journal of Nanoparticle Research, 18(5), 1–15. http://doi.org/10.1007/s11051-016-3434-x
Yon, J., Bescond, A., & Liu, F. (2015). On the radiative properties of soot aggregates part 1: Necking and overlapping. Journal of Quantitative Spectroscopy and Radiative Transfer, 162, 197–206. http://doi.org/10.1016/j.jqsrt.2015.03.027
Yon, J., Liu, F., Bescond, A., Caumont-Prim, C., Rozé, C., Ouf, F. X., & Coppalle, A. (2014). Effects of multiple scattering on radiative properties of soot fractal aggregates. Journal of Quantitative Spectroscopy and Radiative Transfer, 133, 374–381.

15
Supplementary material: sensitivity of specific surface area to primary
particle diameter, overlap coefficient and density
The sensitivity of the relation (III) used to determine the surface specific area regarding the different
input parameters has been proofed using a random normal distribution for each influent parameter.
The study has been performed in two steps:
1. Each parameters have been tested separately on 10 000 random values following a
normal distribution (the others have been fixed at their respective mean value).
2. All parameters have been tested on a 10 000 random values following a normal
distribution.
The standard deviation has been computed for each of the cases and details of these tests are
reported in table S1.
Table S2: Test matrix for sensitivity analysis
Case Dpp ρpp Cov
1 26.5 nm 1543 kg/m3 10 000 random values following a normal
distribution (mean=0.11, coefficient of variation 40%)
2 26.5 nm 10 000 random values following a normal
distribution (mean=1543 kg/m3, coefficient of variation 5%)
0.11
3 10 000 random values following a normal distribution (mean=26.5 nm, coefficient of
variation 20%) 1543 kg/m3 0.11
4 10 000 random values following a normal distribution (mean=26.5 nm, coefficient of
variation 20%)
10 000 random values following a normal distribution (mean=1543 kg/m3, coefficient
of variation 5%)
10 000 random values following a normal distribution (mean=0.11, coefficient of
variation 40%)
Results are presented in figure S1 for 10, 100, 1000 and 10 000 primary particles (Npp). According to
figure S1, the standard deviation associated to the primary particle diameter has the highest
influence on the relative deviation of the specific surface area while density, as expected, has the
lowest influence. On the other hand and surprisingly, the overlap coefficient, denoting a standard
deviation of 40%, has similar influence than density (with estimated standard deviation close to 5%).
Such poor influence of the overlap coefficient explains why, even with 40% of uncertainty on this
parameter, the SSA values obtained according to our automatic analysis software are in close
agreement with those measured by BET.

16
Figure S3: Evolution of the relative deviation from mean specific surface area value as a function of
number of primary particles associated to separate uncertainty of density, overlap coefficient and
primary particle diameter. “All” corresponds to the relative deviation when all uncertainties are
considered in the same time.