A SCRUTINY STUDY OF VARIOUS UNIFIED MODELING …INTRODUCTION TO UNIFIED MODELING LANGUAGE (UML)...
9
© 2018 JETIR June 2018, Volume 5, Issue 6 www.jetir.org (ISSN-2349-5162) JETIRC006044 Journal of Emerging Technologies and Innovative Research (JETIR) www.jetir.org 254 A SCRUTINY STUDY OF VARIOUS UNIFIED MODELING LANGUAGE (UML) DIAGRAMS, SOFTWARE METRICS TOOL AND PROGRAM SLICING TECHNIQUE Er. Daljeet Singh Department of Computer Science and Engineering, Guru Nanak Dev Engineering College, Ludhiana, Punjab, India. Dr. Harmaninder Jit Singh Sidhu Department of Computer Applications, Desh Bhagat University, Mandi Gobindgarh, Punjab, India. ABSTRACT—In this paper, we have proposed an optimal scrutiny study of unified modelling language (UML), the importance of software metrics tool and need and benefits of program slicing techniques. These components are used to measure the internal quality of attributes and functions of unified modelling language (UML) diagrams. The SD Metrics TOOL collect the information after parsing the XML format generated by UML tool. Earlier the measurement of metrics will lead to good quality of the software from the previous step during the coding, but if we use the program slicing techniques at the time of designing of software The whole process is implemented with help of taking various examples of unified modelling language (UML) diagrams. Keywords: UML diagrams, Object-oriented design, Metrics, Model-driven metrics. 1. INTRODUCTION TO UNIFIED MODELING LANGUAGE (UML) DIAGRAMS In the field of Object-Oriented Software Engineering, Unified Modeling Language (UML) is a general-purpose modeling language. The standard is created and managed by the Object Management Group. It was first added to the list of Object Management Group adopted technologies in 1997 and has since become the industry standard. UML can be used to develop many diagrams and provide users with ready to use for expressive modeling examples. Various applications of UML like embedded systems, web applications, commercial applications etc. There are some A Unified Modeling Language (UML) tools which generate program language code from Unified Modeling Language (UML) and makes bug free, deployable applications that run quickly if the code generator incorporates best practice scalable patterns. A Unified Modeling Language (UML) can be used for modeling the whole system independent of platform language. A Unified Modeling Language (UML) is a graphical language for visualizing, specifying, constructing, and documenting information about software-intensive system. Figure 1 Classification of UML diagrams.
Transcript of A SCRUTINY STUDY OF VARIOUS UNIFIED MODELING …INTRODUCTION TO UNIFIED MODELING LANGUAGE (UML)...

© 2018 JETIR June 2018, Volume 5, Issue 6 www.jetir.org (ISSN-2349-5162)
JETIRC006044 Journal of Emerging Technologies and Innovative Research (JETIR) www.jetir.org 254
A SCRUTINY STUDY OF VARIOUS UNIFIED
MODELING LANGUAGE (UML) DIAGRAMS,
SOFTWARE METRICS TOOL AND PROGRAM
SLICING TECHNIQUE
Er. Daljeet Singh Department of Computer Science and Engineering,
Guru Nanak Dev Engineering College, Ludhiana, Punjab, India.
Dr. Harmaninder Jit Singh Sidhu Department of Computer Applications,
Desh Bhagat University, Mandi Gobindgarh, Punjab, India.
ABSTRACT—In this paper, we have proposed an optimal scrutiny study of unified modelling language (UML), the importance
of software metrics tool and need and benefits of program slicing techniques. These components are used to measure the internal
quality of attributes and functions of unified modelling language (UML) diagrams. The SD Metrics TOOL collect the information
after parsing the XML format generated by UML tool. Earlier the measurement of metrics will lead to good quality of the software
from the previous step during the coding, but if we use the program slicing techniques at the time of designing of software The
whole process is implemented with help of taking various examples of unified modelling language (UML) diagrams.
Keywords: UML diagrams, Object-oriented design, Metrics, Model-driven metrics.
1. INTRODUCTION TO UNIFIED MODELING LANGUAGE (UML) DIAGRAMS
In the field of Object-Oriented Software Engineering, Unified Modeling Language (UML) is a general-purpose modeling language.
The standard is created and managed by the Object Management Group. It was first added to the list of Object Management Group
adopted technologies in 1997 and has since become the industry standard. UML can be used to develop many diagrams and provide
users with ready to use for expressive modeling examples. Various applications of UML like embedded systems, web applications,
commercial applications etc. There are some A Unified Modeling Language (UML) tools which generate program language code
from Unified Modeling Language (UML) and makes bug free, deployable applications that run quickly if the code generator
incorporates best practice scalable patterns. A Unified Modeling Language (UML) can be used for modeling the whole system
independent of platform language. A Unified Modeling Language (UML) is a graphical language for visualizing, specifying,
constructing, and documenting information about software-intensive system.
Figure 1 Classification of UML diagrams.

© 2018 JETIR June 2018, Volume 5, Issue 6 www.jetir.org (ISSN-2349-5162)
JETIRC006044 Journal of Emerging Technologies and Innovative Research (JETIR) www.jetir.org 255
A Unified Modeling Language (UML) makes the less maintenance, reusability of code, the real world modeling; improve the
reliability and flexibility to develop the software. A Unified Modeling Language (UML) diagram is a graphical representation of a
model of a system which partially signifies the design and implementation. UML diagrams contain the elements: UML nodes that
are connected with edges and also known as paths. The UML model might also contain other documentation like use cases.
The diagram is defined by the graphical symbols represented on the diagram. A diagram where the primary symbols in the contents
area are classes is a class diagram. A diagram which shows use cases and actors is use case diagram.
A diagram shows the sequence of message exchanges between objects is called sequence diagram. UML
specification classified different kinds of diagrams, e.g. the combination of structural and behavioural elements helps to show a
state machine nested inside a use case diagram. At the same time, some UML Tools do restrict set of available graphical elements
which could be used when working on a specific type of diagram. Consequently, the boundaries between the varieties of diagrams
are not strictly enforced.
The UML diagrams could be categorized hierarchically as shown in figure 1, Classification of UML diagrams. Some classifiers
of the system, components or subsystem, different relationships between their attributes, classifiers, operations and constraints.
The UML gives us a standard way to write a system's view, covering conceptual things such as business processes and system
functions, as well as things like classes written in a specific programming language, database schemas, and reusable software
component. Any system can have two aspects, static and dynamic. So a model is considered as complete when both the aspects are
covered fully. Before going to the detailed description of UML, it is important to know about the various static and dynamic
categories of the diagrams are as follows:
(a) Structural Diagrams: The static aspect is represented by the structural diagrams. These static aspects represent those parts of a diagram which forms
the main structure. These static parts are represented by classes, interfaces, objects, components and nodes. The two structural
diagrams are: Class diagram and Object diagram. Structural diagrams show the static structure of the system and its parts on
different abstraction and implementation levels and show us how they are related to each other.
(b) Behavioural Diagrams: Behavioural diagrams basically capture the dynamic aspect of a system. Dynamic aspect can be further described as the changing
or moving parts of a system. Behavioural diagrams show the dynamic behaviour of the objects in a system, which is used to
represent as a series of changes to the system over the time. Use cases diagrams and behavioural diagrams are used to describe a
set of use cases or actions that some system should perform in collaboration with one or more external users of the system or to
provide some observable and valuable results to the actors.
A number of changes to the system over the time implemented according to the need.
2. VARIOUS UNIFIED MODELING LANGUAGE DIAGRAMS
Now will discuss the A Unified Modeling Language (UML) diagrams are as follows:
(a) Class Diagram
Class Diagrams show the different classes that make up a system and how they relate to each other. Class Diagrams are said to
be ‘static’ diagrams because they show the classes, along with their methods and attributes as well as the static relationships between
them: which classes ‘know’ about which classes or which classes ‘are part’ of another class, but do not show the method calls
between them. The purpose of a class diagram is to depict the classes within a model. In an object-oriented application, classes have
attributes (member variables), operations (member functions) and relationships with other classes. The UML class diagram can
depict all these things quite easily. The fundamental element of the class diagram is an icon the represents a class.
A class icon is simply a rectangle divided into three compartments. The topmost compartment contains the name of the class.
The middle compartment contains a list of attributes (member variables), and the bottom compartment contains a list of operations
(member functions). In many diagrams, the bottom two compartments are omitted. Even when they are present, they typically do
not show every attribute and operations. The goal is to show only those attributes and operations that are useful for the particular
diagram. The Class Diagram is used to represent the static view of an application. The Class Diagram describes the attributes and
operations of a class and also the constraints imposed on the system.
A sample of the Class Diagram of an Order Management System showed in figure 1.1 in which there are four classes Customer,
Order, Special Order, Normal Order. These classes having attributes name, location for Customer class, date and number for Order
class, Special Order is having a name, date attributes, Normal Order is having a name, date attributes. Operations for this Class
diagram are sent Order, receive Order, stop, confirm, close, dispatch.

© 2018 JETIR June 2018, Volume 5, Issue 6 www.jetir.org (ISSN-2349-5162)
JETIRC006044 Journal of Emerging Technologies and Innovative Research (JETIR) www.jetir.org 256
Figure 1.1: Class Diagram of an Order Management System.
(b) Use case Diagram
The dynamic behaviour is an important aspect of the system, Use case diagram is used to represent the dynamic behaviour static
behaviour is not sufficient to model a system. Use case diagrams model the functionality of a system using actors and use case. Use
cases are services or functions provided by the system to its users. The internal and external agents are known as actors. Use case
diagrams basically represent the relationship between actors, use cases.
Figure 2: Use case diagram for an Order Management System.
A sample use case diagram representing the order management system shown in figure 1.2, in which there are three use cases
(Order, Special Order and Normal Order) and one actor which is a customer. The Special Order and Normal Order use cases are
extended from order use case. So they have extends the relationship. Another important point is to identify the system boundary
which is shown in figure 2. The actor as a Customer lies outside the system as it is an external user of the system. Now, we will
discuss the notations which are used for the Use case diagram are as follow:
1. Use Case: Use cases are represented by ovals. Label with ovals with verbs that represent the system's functions. According to
figure 1.2, there are various use cases: Order, Normal Order, and Special Order.
2. Actors: Actors are basically the users of a system. According to figure 1.2, there is an actor which is a customer.
3. System: System boundary is represented using a rectangle that contains use cases. Actors are placed outside the system's
boundaries.
(c) Object Diagram
The Object-Oriented diagram used to represent the static view of a system and represent an instance of a class diagram. They
are formed from class diagrams so object diagrams are dependent upon class diagrams. The basic concepts of object diagram are
similar to class diagrams. Object diagrams are used to render a set of objects and their relationships as an instance. The difference
between Class Diagram and Object Diagram is that a Class Diagram represents an abstract model consisting of classes and their
relationships, but an Object diagram represents an instance at a particular moment which is concrete in nature. It means the Object
Diagram is very close to the actual system behaviour.
Special
Order
date:Date
number:St
ring
Normal
Order
date:Date
number:St
ring
Order
date:Date
number:St
ring
Customer
Name:Stri
ng
loaction:St
ring
Normal
Orde
Special
O3: Order
O2: Order
O1: Order
C: Customer

© 2018 JETIR June 2018, Volume 5, Issue 6 www.jetir.org (ISSN-2349-5162)
JETIRC006044 Journal of Emerging Technologies and Innovative Research (JETIR) www.jetir.org 257
Figure 3: Object Diagram of an Order Management System.
A sample of the Use case Diagram of an Order Management System is shown in Figure 3, in which there is a customer object
(C) which is associated with three order objects (O1, O2 and O3). These order objects are associated with Special Order and Normal
Order objects (S1, S2 and N1). The customer is having the following three orders with different numbers (12, 32 and 40) for the
particular time considered. For orders, the values are 12, 32, and 40 which implies that
the objects are having these values for the particular moment when the instance is captured. The same is for special order and
normal order objects which are having a number of orders as 20, 30 and 60. If a different time of purchase is considered then these
values will change accordingly.
(d) Sequence Diagram
In a Unified Modeling Language (UML), a Sequence Diagram is a kind of an interaction diagram which shows how processes
communicate and in what order they communicate with each other.
This diagram is a Message Sequence Chart because in this objects interact with each other through messages, so that is why this
diagram is just like a Message Sequence Chart. In this diagram, object interactions arranged in time sequence and objects interact
with the exchange of messages which is needed to carry out the functionality of the system. Under the notation of Sequence
Diagram, dashed lines represent the lifetime of an object and the rectangles represent the activation of an object in its lifetime. If
the lifeline of an object is active, it indicates the life existence of an object. The horizontal arrows with message name are used to
display an interaction between objects. Activation boxes are opaque rectangles drawn on top of lifelines to represent that processes
are being performed in response to the message.
Figure 4: Sequence Diagram of a College Management System.
A sample of a Sequence Diagram of College Management System is shown in Figure 4, in which there are three objects of the
classes, which interact with each other through messages like enroll student, isStudentEligible, getSeminarHistory, SeminarHistory,
eligibility status, enrollment status etc. First, Student object interacts with the object of the Seminar through the passage of a message
enrollStudent(), then Object of Seminar interacts with an Object of Course for checking an eligibility of a student by passing
isStudentEligible(), if that student is eligible then a message of getSeminarHistory() is passed from Course to Student Class, then
Student class again interact with Course class for getting history of seminars by passing through seminarHistory, then
eligibiltyStatus message is passed from Course to Seminar class, at last Message of enrollmentStatus is passed from Seminar to
Student class for sending the status of an enrollment of the student.
(e) Collaboration Diagram
This diagram represents both the static & dynamic behaviour of the system, because it is having a combination of information
of Class, Sequence and Use case diagrams. A Collaboration diagram discusses the interactions among objects in terms of sequenced
messages that the message which is exchanged between the objects is having a sequence number. Now, it is important to know
about the notations of the Collaboration diagram, which are as follow:
1. Class roles
Class roles show how objects behave. UML object symbol is used to illustrate class roles but doesn’t list object attributes.
2. Association roles
Association roles describe, when a particular situation is given, how an association will behave. Simple lines labelled with
stereotypes are used to draw association roles.

© 2018 JETIR June 2018, Volume 5, Issue 6 www.jetir.org (ISSN-2349-5162)
JETIRC006044 Journal of Emerging Technologies and Innovative Research (JETIR) www.jetir.org 258
3. Messages
Collaboration diagrams do not have any way to denote time and messages number in order of execution. Using the Dewey
decimal system, sequence numbering can become nested. For example, under the first message, the nested messages are labelled
1.1, 1.2, 1.3, and so on. Immediately after the sequence number, a condition for a message is placed in square brackets.
Figure 5: Collaboration Diagram of an Order Management System
A sample of the Collaboration diagram of an Order Management System is shown in Figure 5, in which the interactions among
objects in terms of sequenced messages. Firstly, at the start, an interaction among the objects Initialization and the Customer is
through the sendOrder(), which is having sequence number 1.1, then second interaction among the objects Customer and Order is
through confirm() message, which is having sequence number 1.2, third message is dispatch(), having sequence number 1.3, which
is used for the process of dispatch of an order.
(f) Activity Diagram
To describe the dynamic behaviour of the system, an Activity diagram is another important diagram of UML. It is just like a
flowchart used to represent the flow from one activity to another activity. The activity can be described as an operation of the
system. So the control flow flows from one operation to another. This control flow can be branched sequential or concurrent.
Activity diagrams also use the fork and join operations to show all type of control flows.
1. Fork: fork operation splits a flow into multiple concurrent flows. A fork node has one incoming edge and multiple
outgoing edges.
2. Join: A join node operation synchronizes multiple flows. A join node has multiple incoming edges and one outgoing edge.
Figure 6: Activity Diagram of an Order Management System.
A sample of an Activity Diagram of an Order Management System is shown in figure 6, in which, there are six activities Receive
Order, Assign Goods to Item, Reorder Goods, Authorize Payment Cancel Order, Dispatch Order. After receiving an order under
“Receive Order” an object goes to the next activity “Assign Goods to Item” which assigns goods to each item, then if goods are not
available then needs to be reorder under next activity “Reorder Goods”, if goods are available, then a payment for an order is made
under an activity “Authorize Payment”, then if payment is received successfully then an order is dispatched under an “Dispatched
Order” activity, else, due to the failure of payment, an or1der is cancelled under the “Cancel Order” activity.
(g) Statechart Diagram
A Statechart diagram is used to describe a state machine. The state machine is defined as a machine which describes different
states of an object. The states of this state machine are controlled by external or internal events. Statechart diagram is one type of
Reorder
Good
Cancel
Orde
Authorize
PaymAssign
Good
Receive
Orde
Dispatch
Orde
Stock
su
a
or
ne
Initialization
Customer
Order
Special Order
End of Process
1.1:sendOrder()
1.2:confirm()
1.3:dispatch()
© 2018 JETIR June 2018, Volume 5, Issue 6 www.jetir.org (ISSN-2349-5162)
JETIRC006044 Journal of Emerging Technologies and Innovative Research (JETIR) www.jetir.org 259
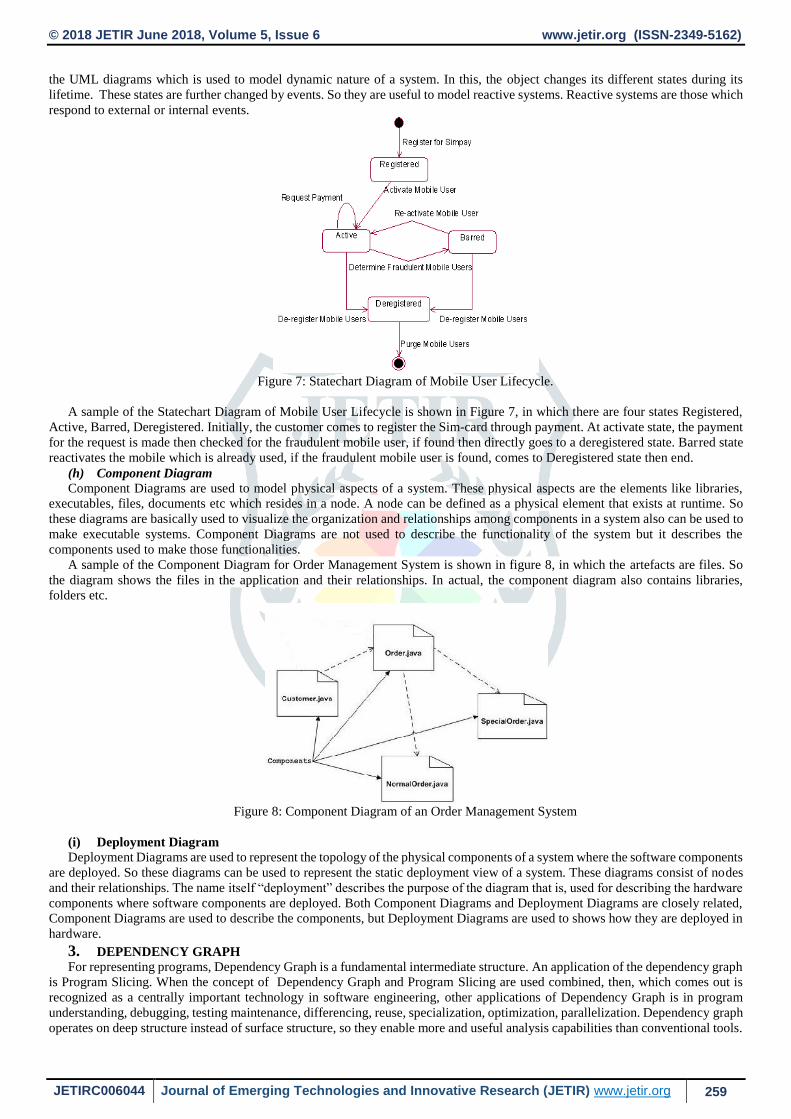
the UML diagrams which is used to model dynamic nature of a system. In this, the object changes its different states during its
lifetime. These states are further changed by events. So they are useful to model reactive systems. Reactive systems are those which
respond to external or internal events.
Figure 7: Statechart Diagram of Mobile User Lifecycle.
A sample of the Statechart Diagram of Mobile User Lifecycle is shown in Figure 7, in which there are four states Registered,
Active, Barred, Deregistered. Initially, the customer comes to register the Sim-card through payment. At activate state, the payment
for the request is made then checked for the fraudulent mobile user, if found then directly goes to a deregistered state. Barred state
reactivates the mobile which is already used, if the fraudulent mobile user is found, comes to Deregistered state then end.
(h) Component Diagram
Component Diagrams are used to model physical aspects of a system. These physical aspects are the elements like libraries,
executables, files, documents etc which resides in a node. A node can be defined as a physical element that exists at runtime. So
these diagrams are basically used to visualize the organization and relationships among components in a system also can be used to
make executable systems. Component Diagrams are not used to describe the functionality of the system but it describes the
components used to make those functionalities.
A sample of the Component Diagram for Order Management System is shown in figure 8, in which the artefacts are files. So
the diagram shows the files in the application and their relationships. In actual, the component diagram also contains libraries,
folders etc.
Figure 8: Component Diagram of an Order Management System
(i) Deployment Diagram
Deployment Diagrams are used to represent the topology of the physical components of a system where the software components
are deployed. So these diagrams can be used to represent the static deployment view of a system. These diagrams consist of nodes
and their relationships. The name itself “deployment” describes the purpose of the diagram that is, used for describing the hardware
components where software components are deployed. Both Component Diagrams and Deployment Diagrams are closely related,
Component Diagrams are used to describe the components, but Deployment Diagrams are used to shows how they are deployed in
hardware.
3. DEPENDENCY GRAPH
For representing programs, Dependency Graph is a fundamental intermediate structure. An application of the dependency graph
is Program Slicing. When the concept of Dependency Graph and Program Slicing are used combined, then, which comes out is
recognized as a centrally important technology in software engineering, other applications of Dependency Graph is in program
understanding, debugging, testing maintenance, differencing, reuse, specialization, optimization, parallelization. Dependency graph
operates on deep structure instead of surface structure, so they enable more and useful analysis capabilities than conventional tools.

© 2018 JETIR June 2018, Volume 5, Issue 6 www.jetir.org (ISSN-2349-5162)
JETIRC006044 Journal of Emerging Technologies and Innovative Research (JETIR) www.jetir.org 260
In Computer Science, mathematics and digital electronics, a Dependency Graph is a Directed Graph which is used to represent
the dependencies of the several objects upon each other. A sample of Dependency Graph is shown in Figure 9, there are four states
S1, S2, S3, and S4. State S4, S3, S2 are dependent upon the State S1, also State S3 depends upon State S2.
Figure 9: Dependency Graph
3.1 Cohesion, coupling and cohesiveness
Cohesion is a measure of the functional strength of a module. In other words, cohesion is a measure of how strongly-related
each piece of functionality expressed by the source code of a software module is. Cohesion is usually expressed as “high cohesion”
or “low cohesion”. Modules with high cohesion is more preferable because high cohesion is associated with several desirable
features of software including robustness, reliability, reusability, and understandability, on the other hand, low cohesion is
associated with undesirable features, which results in certain difficulties like difficulty in maintain, difficulty in testing, difficulty
in reusability, and even difficulty in understanding.
Similarly, in contrast to Cohesion, the coupling between two modules indicates the degree of interdependence between them. If
two modules interchange a large amount of data, then they are highly interdependent. The degree of coupling between two modules
depends on their interface complexity. The interface complexity is basically determined by the number of types of parameters that
are interchanged while invoking the functions of the module. Coupling can be low/loose/weak or high/tight/strong.
(a) Tight Cohesion and Lose Coupling: For an effective Understanding of a system, a system should be simple means there
should be fewer dependencies between the modules and each module should have a self-contained functionality. In Software
Engineering, the system should have high cohesiveness and Low coupling. If these two features are available in a system, then it is
very easy to maintain the system, easy to reuse the modules of the system. If a system having low cohesion and more coupling, then
it is very difficult to maintain the system.
High Cohesion and no Coupling, which means the system is highly understandable some dependencies between the modules
means medium cohesion and medium Coupling. Dependency between the modules, means, low Cohesion and high Coupling,
which means the system, is less understandable. So for the good Understandability of the system, it is very necessary to have more
cohesion and low Coupling. So similarly this concept is applied to the Statechart Diagram, so, each state of Statechart Diagram
should have high functional strength and should have less interaction between the states of the Statechart Diagram. Now, we will
discuss about the benefits of the tight Cohesion and loose Coupling. This concept of Cohesion and Coupling can be applied to the
Statechart Diagram, like, each state of Statechart Diagram should have high functional strength and there should be the less
interaction between the states of the Statechart Diagram.
(b) Benefit of Tight Cohesion and Loose Coupling:
A System having tight Cohesion and loose Coupling, contains the following features
(i) Easy Testing and Debugging: Because of the less interaction among the states of a system, the testing and debugging of
system becomes easy.
(ii) More Understandability: System having tight Cohesion and loose Coupling is simpler, so there will be the more
understandability.
(iii) Easy Maintainability: Because of the less interaction among the states of a system, maintenance of the system is easy.
(iv) More Reusability: States of a system have less interaction with each other, so the reusability of the states of a system will
be increased.
Figure 1.17: Concept of Tight Cohesion and Loose Coupling
4. INTRODUCTION TO PROGRAM SLICING
Program slicing is the computation of the set of programs or program statements, the program slice that may affect the values
at some point of interest, referred to as a slicing of that program criterion. Program slicing can be used in debugging to locate the
source of bugs more easily as compared to the find the bugs in full program. Other applications of slicing include software
optimization, maintenance and program analysis.
(a) Static slicing
Static slicing is based on the original definition of Weiser, formally, a “static program slice” S consists of all statements in
program “p” that may affect the value of variable “v” at some point “p”. The slice is defined for a slicing criterion “C=(x, V)”,
S
1
S
2
S
3
S
4

© 2018 JETIR June 2018, Volume 5, Issue 6 www.jetir.org (ISSN-2349-5162)
JETIRC006044 Journal of Emerging Technologies and Innovative Research (JETIR) www.jetir.org 261
where “x” is a statement in program “p” and “v” is a subset of variables in “p”. A static slice includes all the statements that affect
variable v for a set of all possible inputs at the point of interest (i.e., at statement x). Static slices are computed by finding consecutive
sets of indirectly relevant statements, according to data and control dependencies.
(b) Dynamic Slicing
To make the use of information about a particular execution of a program. A dynamic slice contains all statements that actually
affect the value “v” of a variable at a program point “p” for a particular execution of the program rather than all statements that may
have affected the value “v” of a variable at a program point “p” for any arbitrary execution of the program.
An example which explains the difference between static and dynamic slicing. Consider a small piece of a program unit, in
which there is an iteration block containing an if-else block. There are a few statements in both if and else blocks that have an effect
on a variable. In the case of static slicing, since the whole program unit is looked at irrespective of a particular execution of the
program, the affected statements in both blocks would be included in the slice. But, in the case of dynamic slicing, we consider a
particular execution of the program, wherein the if block gets executed and the affected statements in the else block do not get
executed. So, in this particular execution case, the dynamic slice would contain only the statements in the, if block.
(c) Benefits of Program Slicing
The following advantages of Program Slicing.
I. The measurements of Software Metrics can be easily obtained from the Slices of STDG of Statechart Diagram, instead of
calculating Software Metrics directly from the Statechart diagram.
II. The results of the Software metrics obtained using the concept of Program Slicing are more accurate than the previous
approach which is followed in the previous research, for calculating the values of Software Metrics.
III. Program Slicing of the STDG gives us the different possibilities of reaching the End state from Start state. So simplifies
the structure of STDG in the form of Slices, then computations can be applied on the different Slices.
5. INTRODUCTION TO SD METRICS A TOOL
Software design metrics analyze the structural properties of your UML Model. Use of object-oriented measures of design size,
coupling and complexity to increase system quality and quality assurance effectiveness, find more faults earlier and save
development cost and time. The purpose of this paper is to evaluate the class metrics to determine the object-oriented design quality
of a software system. The Metrics are the well known quantifiable approach to express any attribute. A class is a template from
which objects can be created. This set of objects share a common structure and a common behaviour manifested by the set of
methods. Three class metrics described here measure the complexity of a class using class metrics (number, numops, numpubops,
noc etc).
Software design metrics work on java and c# source code or XMI file generated from a UML case Tool in order to extract
elementary metric information such as an attribute of a class, operations, functions, parameters etc. the working of Software design
metrics. Software design tool (Import XMI XMI parse interface with is depicted Software design metrics Work following steps:-
Step 1:- Parsing project source code or UML models in XMI format.
Step 2:- After you specified your project files select project and calculate metrics.
Step 3:- Viewing the metrics results in tabular and graphical formats using Histogram and Kiviat Diagram.
Step 4:- Exporting the metric results and reporting in a number of formats.
6. CONCLUSION AND FUTURE SCOPE
According to the concept of Software Engineering, a system will be successful, if the Cohesion of the system is high, means the
high self-contained functionality of the system is high and Coupling of the system is low, means less interaction between the
subparts of the system is low. If a system has high Cohesion and Low Coupling, then that system is an ideal system.
REFERENCES
[1] S.V. Kumar, Santosh, “Impact of coupling and cohesion in object-oriented technology,” Journal of software engineering and
applications, vol. 5, pp. 671-676, 2012.

© 2018 JETIR June 2018, Volume 5, Issue 6 www.jetir.org (ISSN-2349-5162)
JETIRC006044 Journal of Emerging Technologies and Innovative Research (JETIR) www.jetir.org 262
[2] L. Kambow, D. Singh, “Visualizing the software metrics of state chart diagram using program slicing,” International Journal
of applied information system (IJAIS), ISSN: 2249-0868, the foundation of computer science, New York, USA, Vol. 2, pp. 9,
2013.
[3] T. Rani, M. Sanyal and S. Garg, “Measuring Software Design Class Metrics:- A Tool Approach,” International Journal of
engineering research & Technology (IJERT), ISSN: 2278-0181, vol. 1, Issue 7, September 2012.
[4] Virtual Machinery, "Object-Oriented Software Metrics - Introduction and overview", Virtual Machinery, Link:
http://www.virtualmachinery.com/jhawkmetrics.htm
[5] A. Kumar, S.K. Khalsa, “Determining cohesion and coupling for class diagram through slicing techniques”, IJACE, Vol. 4,
No.1, pp. 19-24, Jan-June 2012.
[6] D. Singh, A. Kamra, “Measuring Software design metrics of UML Structural and Behavioural Diagrams,” International Journal
of Computer & Mathematical Sciences (IJCMS), ISSN: 2347-8527, Vol. 6, Issue.5, May 2017.
[7] M. Genero,“ Defining and validating metrics for conceptual models,” [PhD thesis]. University of Castilla-La Mancha, 2002.
[8] Weyuker, “Evaluating software complexity measures,” IEEE Transactions on Software Engineering, 14(9), pp.1357-
1365,1998,.
[9] S. Chidamber, “A metrics suite for object-oriented design”, IEEE Transactions on Software Engineering, June 1994.
[10] M. Seyyed, “Object-Oriented Metrics”, Sharif University of Technology, International journal of science and research,
Department of Computer Engineering, January 2006.
[11] T. Mythili, “Quality Metrics Tool for Object-Oriented Programming”, International Journal of computer theory and
engineering, vol. 2, No. 5, October 2010.
[12] P. Verma, “Effect of different UML diagrams to evaluate the size metrics for different software projects”, Global Journal of
computer science and technology software and engineering, vol. 15, issue. 8, version 1.0, February. 2015.
[13] N. Ana, “Evolution of Object-Oriented Coupling Metrics: A Sampling of 25 Years of Research,” RWTH Aachen Univ.,
Aachen, Germany Horst Lichter ; Yi Xu, pp. 16-18, May 2015.
[14] Alshammari, “A Hierarchical Security Assessment Model for Object-Oriented Programs,” Fac. of Science & Technol.,
Queensland Univ. of Technol., Brisbane, QLD, Australia, Colin Fidge, Diane Corney, pp. 13-14, July 2011.
[15] S. Garg, K.S. Kahlon, P.K. Bansal, “How to Measure Coupling in AOP from UML Diagram” International Journal of Computer
Science and Telecommunications, Volume 2, Issue 8, November 2011.
[16] Jaiprakash, T. Lallchandani, R. Mall: Static Slicing of UML Architectural Models, in Journal of Object Technology, vol. 8, no.
1, pages 159–188, January– February 2009.
[17] P. Sikka, K. Kaur, “Mingling of Program Slicing to Designing Phase” Indian Journal of Science and Technology, Vol 9(44),
DOI: 10.17485/ijst/2016/v9i44/105091, November 2016.
[18] Genero, M. (2002): Defining and validating metrics for conceptual models [PhD thesis]. University of Castilla-La Mancha,
2002.
[19] Genero, M., Jiménez, L., Piattini, M. (2002): A controlled experiment for validating class diagram structural complexity
metrics. In Proceedings of the 8th International Conference on object-oriented Information Systems (OOIS 2002), Montpellier,
France, , pp.372-383, September 2002.
[20] Rufai, R: New structure similarity metrics for UML models [Master Thesis]. Computer Science, King Fahd University of
Petroleum & Minerals,2003.
Authors Profile
Daljeet Singh received his B-Tech degree in Computer Science and Engineering from Punjab
Technical University, Jalandhar College, B.C.E.T, Ludhiana, Punjab, India, in 2008, the M-Tech, degree
in Computer Science and Engineering from Punjab Technical University, Jalandhar, College, Guru
Nanak Dev Engineering College, Ludhiana, Punjab, India in year 2012. He is an Assistant Professor at
present, with Department of Computer Science and Engineering, in Guru Nanak Dev Engineering
College. His research interests include Software Engineering, Software Metrics, UML, Object Oriented
Paradigm, Object-Oriented Metrics. At present, He is engaged in Research f UML diagrams
simplifications.
Authors Profile
Dr Harmaninder Jit Singh Sidhu is serving as Assistant Professor in Department of Computer Science and
Applications, Desh Bhagat University, Mandi Gobindgarh Pin 147301, Punjab, India. He is involved in academic
activities form last 10 (Ten) years. His interest areas include Open Source Software and Algorithm Analysis. At
present, He is engaged in Research UML diagrams simplifications and networking. He is also guiding the PhD
students to make the research as be a significant original and independent contribution for knowledgeable to choose
the field of study and also guiding them to for value as for merit publications. He help the scholars for ability to select
an important problem and deal with it completely including an ability to effectively communicate and must achieve
through the research activity.