A Scoring Method for the Veri cation of Con guration ...
13
A Scoring Method for the Verification of Configuration Changes in Self-Organizing Networks Szabolcs Nov´ aczki 1 , Tsvetko Tsvetkov 2 , Henning Sanneck 3 , and Stephen S. Mwanje 3 1 Nokia, Budapest, Hungary [email protected] 2 Department of Computer Science, Technische Universit¨ at M¨ unchen [email protected] 3 Nokia, Munich, Germany {henning.sanneck,stephen.mwanje}@nokia.com Abstract. In today’s mobile communication networks the increasing re- liance on Self-Organizing Network (SON) features to perform the correct optimization tasks adds a new set of challenges. In a SON-enabled net- work, the impact of each function’s action on the environment depends upon the actions of other functions as well. Therefore, the concept of pre-action coordination has been introduced to detect and resolve known conflicts between SON function instances. Furthermore, the idea of post- action SON verification has been proposed which is often understood as a special type of anomaly detection. It computes statistical measures on performance indicators at a relevant spatial and temporal aggrega- tion level to assess the impact of a set of (SON-evoked) Configuration Management (CM) changes. In this paper, we present such a verification technique, which utilizes Key Performance Indicator (KPI) normalization, aggregation and statistical processing for dynamically changing areas of the network. In addition, the introduced approach rewards or punishes CM changes based on their impact on the network and generates a recommendation to accept or undo them. A Coverage and Capacity Optimization (CCO) case study based on real Performance Management (PM) and CM data from an operator’s Wideband Code Division Multiple Access (WCDMA) network is presented. 1 Introduction Mobile SONs contain a potentially large number of concurrently operating SON function instances that need to be managed in order to achieve system-level operational goals [1]. Typically, this task is delegated to pre-action SON coor- dination, which defines rules used to prevent known conflicts [2, 3]. One type of conflicts includes such that occur when instances of SON functions operate on shared CM parameters. Another type consists of those where the activity of one
Transcript of A Scoring Method for the Veri cation of Con guration ...

A Scoring Method for the Verification ofConfiguration Changes inSelf-Organizing Networks
Szabolcs Novaczki1, Tsvetko Tsvetkov2,Henning Sanneck3, and Stephen S. Mwanje3
1 Nokia, Budapest, [email protected]
2 Department of Computer Science, Technische Universitat [email protected] Nokia, Munich, Germany
{henning.sanneck,stephen.mwanje}@nokia.com
Abstract. In today’s mobile communication networks the increasing re-liance on Self-Organizing Network (SON) features to perform the correctoptimization tasks adds a new set of challenges. In a SON-enabled net-work, the impact of each function’s action on the environment dependsupon the actions of other functions as well. Therefore, the concept ofpre-action coordination has been introduced to detect and resolve knownconflicts between SON function instances. Furthermore, the idea of post-action SON verification has been proposed which is often understood asa special type of anomaly detection. It computes statistical measureson performance indicators at a relevant spatial and temporal aggrega-tion level to assess the impact of a set of (SON-evoked) ConfigurationManagement (CM) changes.In this paper, we present such a verification technique, which utilizes KeyPerformance Indicator (KPI) normalization, aggregation and statisticalprocessing for dynamically changing areas of the network. In addition,the introduced approach rewards or punishes CM changes based on theirimpact on the network and generates a recommendation to accept orundo them. A Coverage and Capacity Optimization (CCO) case studybased on real Performance Management (PM) and CM data from anoperator’s Wideband Code Division Multiple Access (WCDMA) networkis presented.
1 Introduction
Mobile SONs contain a potentially large number of concurrently operating SONfunction instances that need to be managed in order to achieve system-leveloperational goals [1]. Typically, this task is delegated to pre-action SON coor-dination, which defines rules used to prevent known conflicts [2, 3]. One type ofconflicts includes such that occur when instances of SON functions operate onshared CM parameters. Another type consists of those where the activity of one
2 Szabolcs Novaczki et al.
SON function instance affects the input measurements of another one. In addi-tion to that, we can face situations where two function instances are in a directconflict, e.g., both try to change the cell coverage area of two neighboring cells,or in a logical dependency, e.g., one changes the coverage area and the other oneadjusts the handover parameters for that area.
In addition to using existing engineering knowledge to manage and coordi-nate SON function instances, it has been proposed to also verify the automatedoperation of the set of SON function instances [4]. This type of verification can beconsidered as a special type of anomaly detection that allows detecting previouslyunknown problems. The verification process itself comprises of three steps [5]:(1) defining the verification area, (2) running an anomaly detection algorithm,and (3) performing diagnosis on the impacted network elements. During the firststep the network is partitioned in sets of cells, also sometimes called observationareas or scopes of verification, that are being under assessment. During the sec-ond step several KPIs are aggregated for each of those network regions and ananomaly detector is triggered to assess them. During the third step the decisionis made to either accept the given changes or rollback bad performing areas tosome previous network configuration.
In this paper we present verification method that follows those three steps.First of all, it divides the network in verification areas based on the CM changesthat are occurring over a certain time span. Then, it starts an assessment intervalduring which it continuously monitors the performance impact of those changesand either rewards or punishes them based on whether they had a positiveor negative influence on the network. As an outcome, our method generates arecommendation to either accept or reject the given CM change(s).
Our work is structured as follows. Section 2 describes how we assess CMchanges occurring in the network and how our verification method works. InSection 3 we explain how we gather the performance data and how we computethe statistics that allow us to detect an anomalous network behavior. Section 4outlines the results after using our method on real network data. Our paperconcludes with the related work and a summary.
2 Assessment of CM changes
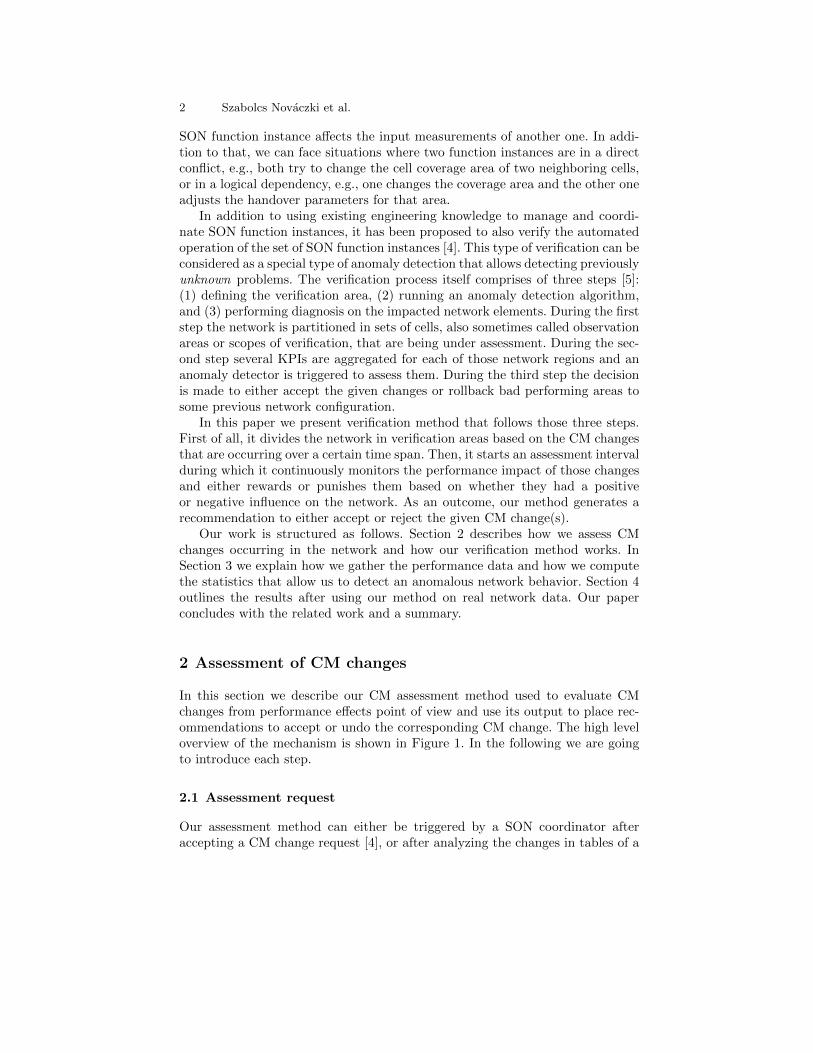
In this section we describe our CM assessment method used to evaluate CMchanges from performance effects point of view and use its output to place rec-ommendations to accept or undo the corresponding CM change. The high leveloverview of the mechanism is shown in Figure 1. In the following we are goingto introduce each step.
2.1 Assessment request
Our assessment method can either be triggered by a SON coordinator afteraccepting a CM change request [4], or after analyzing the changes in tables of a

A Scoring Method for the Verification of Configuration Changes in SON 3
Scope
Generation
Assessment
Interval
Assessment
Request
Passed
Failed
“CM change(s)
accepted”
“CM recommended
for undo”
CM change(s)
Score collection
Assessment decision
a
b
Assessment
Cycles
1. 4.a`
1.
4.
2. 3.
Weighted and normalized sum of scores2.
Cumulative score3.
Fig. 1. Overview of the CM assessment method
CM history database. In the latter case we expect that there is no direct interfacebetween the assessment function and the initiator of the CM change. Typically,this happens when we perform manual CM changes or when we allow functionsthat are out of the scope of the coordinator to get active.
2.2 Scope generation
The scope of a CM change is the set of cells that might be affected by thecorresponding parameter adjustment. In research, several approaches of how toselect the scope of verification (also called verification or observation area) havebeen introduced. A common technique is to compute a verification area by takingthe impact area of the SON function instance whose activity is being underassessment [4]. Furthermore, areas of dense traffic, difficult environments andknown trouble spots can be considered during the selection process as well [6].Another possible solution is to consider the cell neighbor relations, e.g., by takingthe first degree neighbors of the reconfigured cell [7]. In a mobile network twocells are neighbors when they have a common coverage area so that a handoverof User Equipments (UEs) can be made.
After selecting the scope of a CM change, we observe the scopes of other CMchanges and try to determine whether they can be combined. CM changes thatare generating the same scope (or scopes with significant overlap) and within thesame KPI granularity interval are merged. For example, if we have KPIs withhourly granularity the CM changes that have been generated within the samehour belong to the same scope. The resulting merges are handled as one entityduring the rest of the process.
2.3 Assessment interval preparation
The first thing we do during the assessment interval preparation is the speci-fication of the number of assessment cycles. It should be noted, however, thatthe interval does not have a fixed length for each set of CM changes, also calleda CM change group. Instead, it depends on two CM parameter properties: (1)

4 Szabolcs Novaczki et al.
the time and (2) the type of the CM change. The first parameter allows us tomake sure that only relevant system operation time is part of the assessmentinterval. For instance, we may have the desire to not only measure during theday but also at night. The second parameter, gives us the propagation time ofthe change.
Furthermore, the selection may depend on CM pattern knowledge. For exam-ple, if we know that a CM pattern is usually rejected, we may already recommendit for an undo before even starting the assessment interval. In this way, we caninform the SON coordinator or the human operator that a harmful CM patternis planned to be applied.
The second thing that we (optionally) do is to calculate a baseline cell level ofthe cells included in a scope. Note that the cell level is a high level performanceindicator for the given cell, as described in Section 3. This particular cell levelis used as a reference point to measure relative performance effects of the CMchange group compared to the performance before the CM change was applied.Different methods of how this can be achieved have been described in [4, 7, 8].
2.4 Assessment strategy selection
The input of the scope generation step is the CM change group, and a set of cellscomposing the scope of the CM assessment. Since multiple parallel CM changegroups can enter the assessment interval, we have decided to allow each CMchange group to have its own assessment interval.
The assessment interval itself consists of assessment cycles which are drivenby the selected assessment strategy. The goal of the assessment strategy is tocollect and derive information about the performance impacts of the CM changeso that the assessment can come to a decision. The output of the assessmentcycle can either be that the CM change is recommended to be accepted, or to beundone. The CM change is accepted if it passes all the assessment cycles andrejected when it fails a single one.
2.5 Scoring of CM changes
CM change(s) or change groups collect positive or negative scores based on theperformance changes of cells in the scope. On the one hand we reward CMchanges with positive scores that improve the performance of bad performingcells and/or do not impair the well performing ones. On the other hand wepunish CM changes with negative scores that impair the performance of wellperforming cells and/or do not improve the performance of bad performing ones.CM changes accumulating significant negative scores are recommended for undowhile CM changes accumulating positive scores are recommended to be accepted.In order to compute those scores, we need to perform the following steps:
– Preparation: calculate the baseline cell level Bcl, which is used as a perfor-mance reference point during the assessment.

A Scoring Method for the Verification of Configuration Changes in SON 5
– Score collection: each cell in the scope of a CM change is eligible to giveassessment scores, which reflect the relative performance change of the cellsince the CM change was applied.
– Weighted average score computation.– Cumulative scores: the average score is added to the cumulative assessment
score of the CM change.– Assessment decision: the cumulative score is used to decide if the CM change
passed or failed the actual assessment cycle.
During the preparation phase, Bcl is computed for all cells in the scope bytaking the average cell level that has been reported during the last 24 hours.The score collection phase is based on a scoring function used by each cell inthe scope to provide feedback about the change of performance compared to theperformance before the CM change was applied. The output of the function isthe assessment score, which is defined as the function of the relative and signeddifference of the actual cell level and the baseline cell level. In this paper we callthis score the delta cell level Dcl.
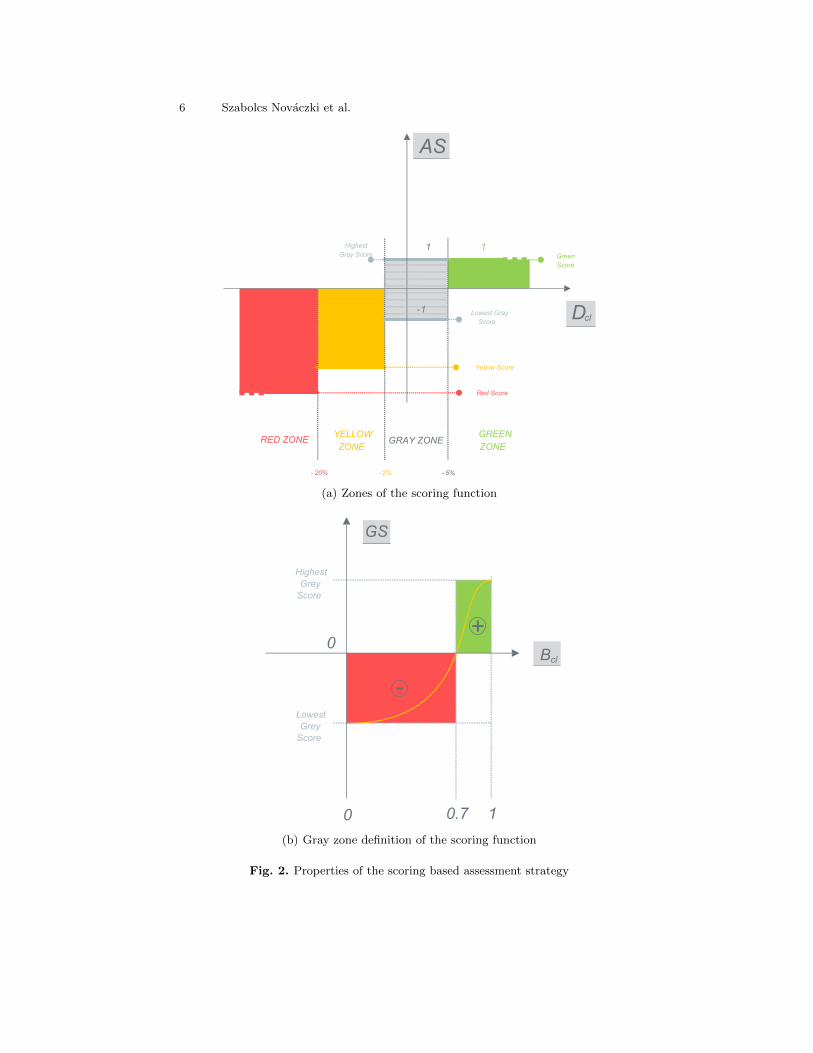
As shown in Figure 2(a), our scoring function has four zones: green, yellow,red, and gray zones. The green zone defines the score if the cell experiencessignificant performance improvements while the yellow and red zones define thescore if it shows moderate or significant degradation. Furthermore, the scoresdefined by green, yellow, and red zones are the same for all cells in the scope.This, however, does not apply for gray zone scores which may differ for eachcell in the scope. The main purpose why we have designed the function to havean additional zone is to observe changes when there is no significant change inperformance. Contrary to the most common assumption, which tells that nochange in performance is a ”good thing” and we should reward or at least notpunish it, we have a rather different opinion. If a cell shows good performancebefore the CM change is applied and the performance remains the same afterthe CM change, the scoring function should take this into account and award theCM change with positive scores. However, if a cell shows poor performance andthe CM change that was applied does not improve the performance, it should belabeled as an ineffective and unnecessary change, and be punished by receivingnegative scores. The reasons why we need to limit the number of unnecessarychanges have been outlined in [4] and [5].
In Figure 2(b) we show how scores are actually given. As long as Bcl isin the acceptable range between 0.7 and 1 (greed domain), positive scores arereturned. However, if the cell shows poor performance and Bcl drops below 0.7(red domain), we punish the CM change with negative scores.
3 Assessment of Cell Performance
The conceptual diagram of the performance assessment is shown in Figure 3.This can be considered as an aggregation pyramid with low level, cell wise KPIson the left and the cell level in the middle and the accumulate score value on the
6 Szabolcs Novaczki et al.
AS
Dcl
RED ZONEYELLOW
ZONEGRAY ZONE
GREEN
ZONE
Green
Score
Yellow Score
Red Score
-4
-8
Highest
Gray Score
Lowest Gray
Score
1 1
-1
- 20% - 2% - 5%
(a) Zones of the scoring function
GS
Highest
Grey
Score
Lowest
Grey
Score
Bcl
10
0
0.7
+
-
(b) Gray zone definition of the scoring function
Fig. 2. Properties of the scoring based assessment strategy

A Scoring Method for the Verification of Configuration Changes in SON 7
right. Note that in this paper we use the term KPI, however, we do not wantto limit the proposed method only to KPIs but to any data source that reflectssome aspect of the system’s performance.
The raw KPI values are converted to KPI level values, which show how farindividual cell KPIs are actually from the expectations when we compare themto the corresponding profiles. More precisely, the profiles determine the accepteddomain of the raw KPI values, while the KPI level measures the distance of theactual raw KPI values from the profiles. The cell level is the aggregation of KPIlevels and represent a cell’s overall performance that reflects the overall behaviorof the individual KPI level values. The more KPI levels are getting degraded, i.e.,moving out of the acceptable domain, the more the cell level is getting degraded.
3.1 Profiling and KPI level
The profile of a KPI is a mathematical model, which determines the acceptabledomain of the KPI’s values. Typical KPIs are the number of radio link failures,Call Setup Success Rate (CSSR), the Handover Success Rate (HOSR), theChannel Quality Indicator (CQI) and so on.
The profile is required to compute the KPI level, a value that depicts thedeviation of a KPI from its expectation. To do so, the profile includes a trainingphase during which we collect samples X1 . . . Xt for each KPI (t marks a train-ing period). During this particular phase the network has to show an expectedbehavior. Furthermore, the duration of a training period depends on the granu-larity for gathering PM data from the network. For instance, it can correspondto an hour if KPIs are exported on hourly basis as presented in [7].
Then, we standardize the gathered data by computing the z-score of eachdata point X1 . . . Xt, Xt+1. Here, Xt+1 corresponds to the current sample thatwe are going to observe. The level of a KPI corresponds to the z-score of Xt+1. Itshould be noted here that the KPI level can be considered as an anomaly valueas well.
Let us give an example of how this may look like when we observe the CSSRfor a given cell. Suppose that a cell has reported a success rate of 99.9 %, 99.9 %,99.1 %, 99.7 %, 99.8 %, and 99.6 % during the training phase. Moreover, let usassume 90.2 % is the result from the current sampling period. The normalizedresult of all four samples would be 0.44, 0.44, 0.21, 0.38, 0.41, 0.35, and −2.26.The CSSR level equals to −2.26, which is the z-score of the current samplingperiod.
3.2 Cell level
The cell level function creates an overall performance metric of individual cells.The output is the sum of the weighted KPI levels which we have named the celllevel. The ability to change those weighting factors allows us to test a cell fordifferent anomaly types. For example, we may take only handover related KPIlevels into consideration when we assess the adjustments made by the MobilityLoad Balancing (MLB) function.

8 Szabolcs Novaczki et al.
To assessment
decision ...
Fo
r a
ll ce
lls in
th
e s
co
pe
…
...
...
Ce
ll1
KPI
Level
calc.
Cell
Level1
Cell
Level
calc.
KPI1
...
CellnCell
Leveln...
Cell2Cell
Level2...
KPI2
KPIn
...
KPI
Level1
KPI
Level2
KPI
Leveln
Accum.
Score
calc.
Fig. 3. Performance data aggregation overview
The cell level has to fall within an acceptable range defined by two constants:cmin and cmax. Typical values for those two constants are -2.0 and 2.0, respec-tively. Any data-point that has a z-score higher than 2.0 or lower than -2.0 is anoutlier, and likely to be an anomaly.
In addition to that, a detector is attached to this output to generate alarms ifthe cell levels get below a threshold. Moreover, a diagnosis module is activated bythe detector and is used to generate detailed reports about the detected degrada-tion. A report contains information about the worst performing cells (e.g., thosehaving the lowest 10% cell level values), the worst performing KPIs (i.e., the KPIlevels aggregated in the observed scope, or among the worst performing cells),degradation patterns among the worst performing cells (i.e., identify groups ofcells with a significantly different set of degraded KPIs).
4 Evaluation
As the next step of SON verification research work the assessment algorithm hasbeen put in action to automatically verify the performance effect of antenna tiltoptimizations in a WCDMA network.
4.1 Context and environment
The main objective was to test the performance of the CCO capabilities of thenetwork. Based on KPI analysis results the CCO algorithm identified some cellsto be optimized by either increasing or decreasing the tilt angle of the serving an-tenna, i.e., down-tilting or up-tilting respectively. The recommended tilt changeshave been accepted and deployed in the network by the network operations per-sonnel on 4th of September 2014 between 09:00 and 09:15. The optimizationimpacted 21 WCDMA cells, 11 of which were down-tilted and 10 up-tilted. Inorder to be able to study the effects of these tilt changes on the performance ofthe corresponding part of the network (referred to as optimization area), a per-formance measurement dataset was created. The dataset contained the hourly

A Scoring Method for the Verification of Configuration Changes in SON 9
The scores gained by each verification area during their assessment interval
Cu
mu
late
d
Ass
ess
ment
Sco
re
Most of the verification
areas gained high positive
scores during the
assessment interval.
Some verification areas
behave significantly
different than the rest –
however none of the
related CM changes are
suggested for rollback.
b a
(a) The CM assessment result
Sat SunThu Fri
(b) The block error rate in the HSUPA MAC layer of cell W43072
Fig. 4. Impact of the CCO changes and their verification
resolution values of 90 KPIs (covering the most important performance aspectsof a WCDMA network) collected in the optimized cells as well as in their neigh-bors (400 cells in total) between 5th of August 2014 and 7th of September, 2014.Note that the indicated time period contains data, which shows performance ofthe optimization area before as well as after the tilt changes were applied. Thisdataset was used as the input of the verification study.
The tilt changes are deployed by using Remote Electrical Tilt (RET) mod-ules connected to antennas. However, there are usually more than one antennaconnected to a single RET module, also called a shared RET module. In case

10 Szabolcs Novaczki et al.
of shared RET modules it is not possible to change the tilt angle of the con-nected cells independently. Consequently, in the scope of this study if the CCOalgorithm suggested to change the tilt angle of a cell, which shares a single RETmodule with other cells, the tilt angel of all the other cells connected to thesame RET module is changed. As a result we had to take 11 addition cells intoaccount and verify the performance effects of the corresponding ”forced” tiltchanges. Finally, 32 tilt change events were taken into account during the study:21 suggested by the CCO algorithm and 11 forced by the shared RET constraint.
4.2 Profiling setup
In this study, a profile is set up to capture the usual daily fluctuation of a KPI ofevery cell with hourly granularity. More precisely, one profile records the meanand standard deviation of the values of the associated KPI in the correspondingcell. In addition, we distinguish between weekdays and weekends, which as aconsequence leads each KPI to have two profiles. The first represents a typicalweekday and other one describes the behavior of the KPI during the weekend.Furthermore, the profiles are computed on the part of the KPI dataset, whichwas collected before the tilt changes were applied (between 5th of August 2014and 3rd of September 2014), thus, capturing the non-optimized performance ofthe optimization area.
4.3 Cell level computation
KPI levels are directly fed into the scoring algorithm, i.e., cell levels are notcomputed. This enables the system to drill down to the lowest possible levelwhen explaining CM assessment decisions, e.g., a certain CM change is rejectedby the algorithm due assessment scores crossing a certain negative threshold.
4.4 Results
In line with the post-action performance observations the automatic CM changeassessment algorithm accepted all changes as no major PM degradation wasobserved directly after that the tilt changes were applied. However, as visiblein Figure 4(a), there were two verification areas (signified with letter a and b),gaining slightly lower scores than the others. The detailed investigation showedthat while in case a the degradation started before the tilt changes were applied,thus not interesting from the verification point of view, case b turned out tobe an interesting case study. Here we give some details about this, as shown inFigure 4(b). The corresponding verification area was generated by cell W29598,which was up-tilted by two degrees (from 4 to 2). Looking one level deeper theanalysis showed that the assessment scores of the verification area were pulleddown by degradation of performance in one cell (W43072), which is the handoverneighbor of W29598. We have analyzed the KPIs of this cell and observed thatW43072 shows increased values of KPI measuring the block error rate in the

A Scoring Method for the Verification of Configuration Changes in SON 11
HSUPA MAC layer (HSUPA_MAC_es_BLER) after cell W28598 was up-tilted asshown on the bottom left of Figure 4(b). W28598’s up-tilting was, however, notsuggested by the CCO algorithm but was forced as W28598 is on the same RETmodule as cell W13107, which was selected by the CCO algorithm as candidate fora 2 degree up-tilt. Consequently, the CM assessment algorithm could reveal thehidden effect of an unintended tilt modification due to shared RET constraint,which was not taken into account by the CCO algorithm.
5 Related Work
While this paper is focused on applying our CM scoring method, SON verificationitself is relevant from a broader use case point of view. One example is networkacceptance [6] where typically fixed performance thresholds, fixed scopes (thearea around a network element), and simple actions like an alarm to the networkoperator can be generated.
Another example is the deployment of CM undo actions. In [5], the problemof scheduling of conflicting CM undo actions has been introduced. According tothe authors, a SON coordinator does not have the knowledge to resolve themand may, therefore, prevent them from being deployed. The presented approachof scheduling such undo actions makes use of minimum graph coloring in or-der to identify the sets of cells whose configuration can be safely rolled back.The network is partitioned in verification areas which are used as nodes duringthe coloring process. An edge between two nodes is added only when the tworepresented areas share anomalous cells that have not been reconfigured, alsocalled a verification collision. The nodes getting the most frequently used colorare marked for a CM undo.
Within the SOCRATES project [9] an idea has been introduced of how un-desired network behavior can be potentially detected and resolved in a SON.The presented approach is realized by two functions: a Guard and an Alignmentfunction. The purpose of the first one is to detect unusual network behavior likeCM parameter oscillations or unexpected KPI combinations like a high RandomAccess Channel (RACH) rate and a low amount of carried traffic. The secondone is responsible for taking countermeasures like undoing configuration changesassembled by a SON function and even suggesting SON function parameter ad-justment.
In literature, several approaches have been presented of how to apply anomalydetection in mobile communication networks. In [10] topic modeling is applied tothe PM data from all cells within the scope leading to the computation of topicmodel clusters that can be seen as indicators of the network state. Dependingon the semantic interpretation, those clusters are classified as either normalor abnormal. In [11] a technique is presented that is based on an extendedversion of the incremental clustering algorithm Growing Neural Gas (GNG).This algorithm is known as Merge Growing Neural Gas (MGNG) and is focusedon the capturing of input data behavior by taking the history data into account.

12 Szabolcs Novaczki et al.
Furthermore, it allows the learning of common sequences of input data and theprediction of their future values.
6 Conclusion
The existing pre-action Self-Organizing Network (SON) coordination schemecan be seen as a pessimistic approach where existing engineering knowledgeis encoded into simple rules to avoid known issues in concurrently executingSON function instances. The trade-off is here that using a rule-based pro-activeapproach is relatively simple to implement into legacy systems, yet the knowledgeimplemented in the rules is rather simple. Therefore, the system may miss somerelevant conditions and may enforce some coordination actions which may notbe required for the specific condition. In a complementary way, SON verificationis an optimistic (i.e., post-action) approach which evaluates the performanceafter each ”round” of SON-induced actions being deployed to the network. Thetechnical approach to realize SON verification is a type of anomaly detectionand diagnosis tailored to the specific requirements. The trade-off is here that theverification is only getting active for really relevant conditions and can react alsoto previously unknown conditions which deviate significantly from the normalstate. However, identifying those conditions reactively and even diagnosing theirroot causes is significantly more complex than just executing a set of rules.
In this paper, we addressed the problem of identifying such unknown condi-tions and finding at the same time the cause for them to occur. Our approachobserves deployed Configuration Management (CM) changes, either computedby a SON function or manually set by the human operator. At first, we partitionthe network in so-called verification areas, also referred to as observation areasor scopes of verification. Then, we create an overall performance metric for eachcell within a given scope, which we have named the cell level. This particularvalue is computed by aggregating a cell’s Key Performance Indicator (KPI) lev-els which depict how far the KPI values actually are from their optimal domains.The computed values are used during the CM assessment interval which consistsof one or more assessment cycles. During those cycles we reward or punish CMchanges by giving them positive or negative scores. A key feature here, however,is the accumulation of the scores over time and punish unnecessary CM changesthat did improve the network performance in case of a low cell level. The outputof our approach is a recommendation to either accept or reject, i.e., undo thegiven configuration changes. We managed to evaluate it on real Wideband CodeDivision Multiple Access (WCDMA) data and outline a Coverage and CapacityOptimization (CCO) change that has led a certain part of the network to expe-rience an anomalous behavior. This could not be foreseen by the CCO algorithmdue to the shared Remote Electrical Tilt (RET) module.

A Scoring Method for the Verification of Configuration Changes in SON 13
References
1. Hamalainen, S., Sanneck, H., Sartori, C., eds.: LTE Self-Organising Networks(SON): Network Management Automation for Operational Efficiency. John Wiley& Sons, Chichester, UK (December 2011)
2. Bandh, T.: Coordination of autonomic function execution in Self-Organizing Net-works. Phd thesis, Technische Universitat Munchen (April 2013)
3. Romeikat, R., Sanneck, H., Bandh, T.: Efficient , Dynamic Coordination of RequestBatches in C-SON Systems. In: IEEE Veh. Technol. Conf. (VTC Spring 2013),Dresden, Germany (June 2013)
4. Tsvetkov, T., Novaczki, S., Sanneck, H., Carle, G.: A Post-Action Verification Ap-proach for Automatic Configuration Parameter Changes in Self-Organizing Net-works. In: 6th International Conference on Mobile Networks and Management(MONAMI 2014), Wurzburg, Germany (September 2014)
5. Tsvetkov, T., Sanneck, H., Carle, G.: A Graph Coloring Approach for SchedulingUndo Actions in Self-Organizing Networks. In: IFIP/IEEE International Sympo-sium on Integrated Network Management (IM 2015), Ottawa, Canada (May 2015)
6. Ericsson: Transparent Network-Performance Verification For LTE Rollouts. WhitePaper, 284 23-3179 Uen (September 2012)
7. Tsvetkov, T., Novaczki, S., Sanneck, H., Carle, G.: A Configuration ManagementAssessment Method for SON Verification. In: International Workshop on Self-Organizing Networks (IWSON 2014), Barcelona, Spain (August 2014)
8. Ciocarlie, G., Lindqvist, U., Nitz, K., Novaczki, S., Sanneck, H.: On the Fea-sibility of Deploying Cell Anomaly Detection in Operational Cellular Networks.In: IEEE/IFIP Network Operations and Management Symposium (NOMS 2014),Krakow, Poland (May 2014)
9. Kurner, T., Amirijoo, M., Balan, I., van den Berg, H., Eisenblatter, A., et al.: FinalReport on Self-Organisation and its Implications in Wireless Access Networks.Deliverable d5.9, Self-Optimisation and self-ConfiguRATion in wirelEss networkS(SOCRATES) (January 2010)
10. Ciocarlie, G., Connolly, C., Cheng, C.C., Lindqvist, U., Novaczki, S., et al.:Anomaly Detection and Diagnosis for Automatic Radio Network Verification. In:6th International Conference on Mobile Networks and Management (MONAMI2014), Wurzburg, Germany (September 2014)
11. Gajic, B., Novaczki, S., Mwanje, S.: An Improved Anomaly Detection in MobileNetworks by Using Incremental Time-aware Clustering. In: IFIP/IEEE Workshopon Cognitive Network and Service Management (CogMan 2015), Ottawa, Canada(May 2015)