(A Saudi Joint Stock Company) - Alawwal Bank€¦ · To the Shareholders of Alawwal bank (A Saudi...
57
. . (A Saudi Joint Stock Company) CONSOLIDATED FINANCIAL STATEMENTS December 31, 2017 For the year ended
Transcript of (A Saudi Joint Stock Company) - Alawwal Bank€¦ · To the Shareholders of Alawwal bank (A Saudi...

.
.
(A Saudi Joint Stock Company)
CONSOLIDATED FINANCIAL
STATEMENTS
December 31, 2017
For the year ended

1
KPMG Al Fozan & Partners Certified Public Accountants
Independent Auditors’ Report on the Audit of the Consolidated Financial Statements
To the Shareholders of Alawwal bank (A Saudi Joint Stock Company)
Opinion
We have audited the consolidated financial statements of Alawwal bank (the “Bank”) and its
subsidiaries (collectively referred to as the “Group”), which comprise the consolidated statement of
financial position as at December 31, 2017, and the consolidated statement of income, consolidated
statement of comprehensive income, consolidated statement of changes in equity and consolidated
statement of cash flows for the year then ended, and the summary of significant accounting policies and
other explanatory notes from 1 to 40.
In our opinion, the accompanying consolidated financial statements present fairly, in all material
respects, the consolidated financial position of the Group as at December 31, 2017, and its consolidated
financial performance and its consolidated cash flows for the year then ended in accordance with
International Financial Reporting Standards (“IFRSs”) as modified by Saudi Arabian Monetary
Authority (“SAMA”) for the accounting of zakat and income tax.
Basis for Opinion
We conducted our audit in accordance with International Standards on Auditing as endorsed in the
Kingdom of Saudi Arabia. Our responsibilities under those standards are further described in the
Auditors’ Responsibilities for the Audit of the Consolidated Financial Statements section of our report.
We are independent of the Group in accordance with the professional code of conduct and ethics, as
endorsed in the Kingdom of Saudi Arabia, that are relevant to our audit of the consolidated financial
statements, and we have fulfilled our other ethical responsibilities in accordance with these
requirements. We believe that the audit evidence we have obtained is sufficient and appropriate to
provide a basis for our opinion.

Independent Auditors’ Report on the Audit of the Consolidated Financial Statements
To the Shareholders of Alawwal bank (A Saudi Joint Stock Company) (continued)
2
KPMG Al Fozan & Partners Certified Public Accountants
Key Audit Matters
Key audit matters are those matters that, in our professional judgement, were of most significance in
our audit of the consolidated financial statements of the current period. These matters were addressed
in the context of our audit of the consolidated financial statements as a whole, and in forming our
opinion thereon, and we do not provide a separate opinion on these matters. For each matter below, a
description of how our audit addressed the matter is provided in that context:
Key audit matter How our audit addressed the key audit matter
Impairment of loans and advances
At December 31, 2017, the gross loans and advances
were Saudi Riyals 66,412 million; against which an
impairment provision of Saudi Riyals 2,773 million
was maintained. This includes impairment against
specific loans and collective impairment recorded on a
portfolio basis.
We considered this as a key audit matter as the Group
makes complex and subjective judgements and makes
assumptions to determine the amount of impairment
and the timing of recognition of such impairment.
In particular the determination of impairment against
loans and advances includes:
o The identification of impairment events and
judgments used to calculate the impairment
against specific corporate loans and advances;
and
o The use of assumptions underlying the
calculation of collective impairment for
portfolios of loans and advances, and the use
of models to make those calculations.
o An assessment of the Group’s exposure to
certain industries affected by current
economic conditions.
Refer to the significant accounting policies note 3 l(i)
to the consolidated financial statements for the
significant accounting policy relating to impairment of
loans and advances, note 2d(i) which contains the
disclosure of significant accounting estimates relating to impairment against loans and advances and note
7(b) which contains the disclosure of impairment against loans and advances.
We assessed the design and implementation, and
tested the operating effectiveness of the key
controls over the following:
identification of impaired loans and
advances; and
management’s processes for establishing
and monitoring both specific and
collective impairment.
We tested a sample of loans and advances to form
our own assessment as to whether impairment
events had occurred and to assess whether
impairment had been identified and recorded in a
timely manner.
Where impairment was individually calculated, we
tested, on a sample basis, the calculation of
impairment including forecasted future cash flows,
discount rates and estimated recovery from any
underlying collateral etc. The sample of loans and
advances tested by us also included exposures in
sectors adversely affected by the current economic
conditions.
For collective impairment model used by the Group
we tested:
On a sample basis, the extracts of historical
data to the underlying systems.
Management’s assumptions including loss
rates and delinquency days analysis in the
models.
On a sample basis, the calculations within
the models.

Independent Auditors’ Report on the Audit of the Consolidated Financial Statements
To the Shareholders of Alawwal bank (A Saudi Joint Stock Company) (continued)
3
KPMG Al Fozan & Partners Certified Public Accountants
Key Audit Matters (continued)
Key audit matter How our audit addressed the key audit matter
Zakat
The Group files its zakat return with the General
Authority of Zakat and Tax (“GAZT”) on an annual
basis. The GAZT has issued assessment orders for the
years from 2005 up to 2013, which resulted in
additional demand of Saudi Riyals 282.1 million. The
additional exposure is mainly related to zakat arising
due to disallowance of certain long-term investments
and the addition of long term financing to the zakat
base by the GAZT. The interpretation of the GAZT is
being challenged by the Group and the appeal
proceedings are underway at various levels of
available appellate forums. Management expects a
favourable outcome on the appeals, however, the
Group has recorded appropriate provision against the
additional exposure.
Assessments for the years 2014 onwards are yet to be
raised. However, in line with the assessments finalized
by the GAZT for the years 2005 to 2013, if long-term
investments are disallowed and long-term financing is
added to the zakat base this would result in additional
exposure. The amount of the potential additional
exposure is not disclosed in the consolidated financial
statements as management believes that this might
affect the Bank’s position in this matter.
Management makes judgments about the incidence
and quantum of zakat liability (which is subject to the
future outcome of assessments by the GAZT) and
based on such judgments, management is confident of
a favourable outcome of the appeal process.
We considered this as a key audit matter as it involves
significant management judgment and the additional
assessments by the GAZT are material to the
consolidated financial statements.
Refer to note 3(y) for the accounting policy relating to zakat and note 26(c) for the related disclosures for
zakat.
In order to assess the status and likely outcome of
the matter, we obtained correspondence between
the Group, GAZT and the Group’s zakat
consultants to determine the amount of the
additional demand made by the GAZT.
We held meetings with those charged with
governance and senior management of the Group to
obtain an update on the zakat matter and the results
of their interactions with the relevant appellate
forums.
We also used our internal specialist to assess the
adequacy of the exposures disclosed for the years
assessed by the GAZT and the appropriateness of
management’s judgments relating to the zakat
matter in light of the facts and circumstances of the
Group.
We also assessed the appropriateness of the
disclosures included in the consolidated financial
statements of the Group.
Independent Auditors’ Report on the Audit of the Consolidated Financial Statements
To the Shareholders of Alawwal bank (A Saudi Joint Stock Company) (continued)
4
KPMG Al Fozan & Partners Certified Public Accountants
Key Audit Matters (continued)
Key audit matter How our audit addressed the key audit matter
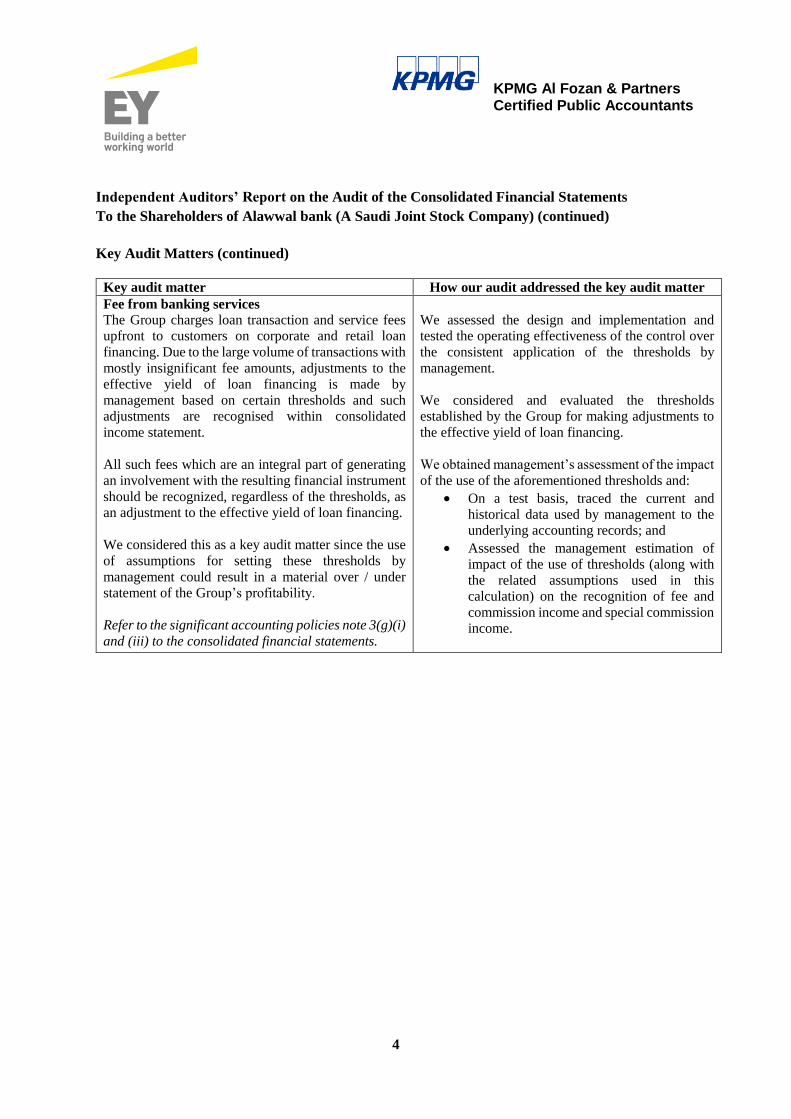
Fee from banking services
The Group charges loan transaction and service fees
upfront to customers on corporate and retail loan
financing. Due to the large volume of transactions with
mostly insignificant fee amounts, adjustments to the
effective yield of loan financing is made by
management based on certain thresholds and such
adjustments are recognised within consolidated
income statement.
All such fees which are an integral part of generating
an involvement with the resulting financial instrument
should be recognized, regardless of the thresholds, as
an adjustment to the effective yield of loan financing.
We considered this as a key audit matter since the use
of assumptions for setting these thresholds by
management could result in a material over / under
statement of the Group’s profitability.
Refer to the significant accounting policies note 3(g)(i)
and (iii) to the consolidated financial statements.
We assessed the design and implementation and
tested the operating effectiveness of the control over
the consistent application of the thresholds by
management.
We considered and evaluated the thresholds
established by the Group for making adjustments to
the effective yield of loan financing.
We obtained management’s assessment of the impact
of the use of the aforementioned thresholds and:
On a test basis, traced the current and
historical data used by management to the
underlying accounting records; and
Assessed the management estimation of
impact of the use of thresholds (along with
the related assumptions used in this
calculation) on the recognition of fee and
commission income and special commission
income.

Independent Auditors’ Report on the Audit of the Consolidated Financial Statements
To the Shareholders of Alawwal bank (A Saudi Joint Stock Company) (continued)
5
KPMG Al Fozan & Partners Certified Public Accountants
Key Audit Matters (continued)
Key audit matter How our audit addressed the key audit matter
Other assets As at 31 December 2017, other assets of the Group
included an amount of Saudi Riyals 437.15 million.
This amount was originally disbursed to a third party
who defaulted on payment and the management
expects to recover this balance from a related party.
The Group has reached a settlement agreement with
the related party for recovery of this amount.
The Group maintains an impairment allowance of
Saudi Riyals 149.91 million as at 31 December 2017
against the outstanding balance due to uncertainty
around the timing of recoverability of this balance.
This is considered a key audit matter due to uncertainty
around the timing of the recovery of the amount and
conditions attached to the settlement agreement that
may impact the recoverability of the balance.
Refer to note 10 to the consolidated financial
statements for disclosure of the aforementioned
receivable.
We performed the following procedures:
Read the settlement agreement reached with
the related party to assess the terms and
conditions attached to the settlement
agreement.
Held meetings with those charged with
governance and senior management of the
Group to obtain an update on this matter and
the results of their interactions with the
related party.
Held meetings with the representative of the
related party to discuss the progress on the
settlement.
Evaluated the basis used by management to
assess the adequacy of the impairment
allowance against the receivable.
Assessed the appropriateness of the
disclosures included in the consolidated
financial statements of the Group.

Independent Auditors’ Report on the Audit of the Consolidated Financial Statements
To the Shareholders of Alawwal bank (A Saudi Joint Stock Company) (continued)
6
KPMG Al Fozan & Partners Certified Public Accountants
Other Information included in the Bank’s 2017 Annual Report
The Board of Directors of the Bank (the Directors) are responsible for the other information. The other
information consists of the information included in the Bank’s 2017 annual report, other than the
consolidated financial statements and our auditors’ report thereon. The annual report is expected to be
made available to us after the date of this auditors’ report.
Our opinion on the consolidated financial statements does not cover the other information and we do
not and will not express any form of assurance conclusion thereon.
In connection with our audit of the consolidated financial statements, our responsibility is to read the
other information identified above when it becomes available and, in doing so, consider whether the
other information is materially inconsistent with the consolidated financial statements or our knowledge
obtained in the audit, or otherwise appears to be materially misstated.
When we read the other information, if we conclude that there is a material misstatement therein, we
are required to communicate the matter to those charged with governance.
Responsibilities of the Directors and Those Charged with Governance for the Consolidated
Financial Statements
The Directors are responsible for the preparation and fair presentation of the consolidated financial
statements in accordance with IFRSs as modified by SAMA for the accounting of zakat and income
tax, the Regulation for Companies, the Banking Control Law in the Kingdom of Saudi Arabia and the
Bank’s By-laws, and for such internal control as the Directors determine is necessary to enable the
preparation of consolidated financial statements that are free from material misstatement, whether due
to fraud or error.
In preparing the consolidated financial statements, the Directors are responsible for assessing the
Group’s ability to continue as a going concern, disclosing, as applicable, matters related to going
concern and using the going concern basis of accounting unless the Directors either intends to liquidate
the Group or to cease operations, or has no realistic alternative but to do so.
Those charged with governance are responsible for overseeing the Group’s financial reporting process.
Auditors’ Responsibilities for the Audit of the Consolidated Financial Statements
Our objectives are to obtain reasonable assurance about whether the consolidated financial statements
as a whole are free from material misstatement, whether due to fraud or error, and to issue an auditors’
report that includes our opinion. Reasonable assurance is a high level of assurance, but is not a guarantee
that an audit conducted in accordance with International Standards on Auditing as endorsed in the
Kingdom of Saudi Arabia will always detect a material misstatement when it exists. Misstatements can
arise from fraud or error and are considered material if, individually or in the aggregate, they could
reasonably be expected to influence the economic decisions of users taken on the basis of these
consolidated financial statements.

Independent Auditors’ Report on the Audit of the Consolidated Financial Statements
To the Shareholders of Alawwal bank (A Saudi Joint Stock Company) (continued)
7
KPMG Al Fozan & Partners Certified Public Accountants
Auditors’ Responsibilities for the Audit of the Consolidated Financial Statements (continued)
As part of an audit in accordance with International Standards on Auditing as endorsed in the Kingdom
of Saudi Arabia, we exercise professional judgment and maintain professional skepticism throughout
the audit. We also:
Identify and assess the risks of material misstatement of the consolidated financial statements,
whether due to fraud or error, design and perform audit procedures responsive to those risks, and
obtain audit evidence that is sufficient and appropriate to provide a basis for our opinion. The risk
of not detecting a material misstatement resulting from fraud is higher than for one resulting from
error, as fraud may involve collusion, forgery, intentional omissions, misrepresentations, or the
override of internal control.
Obtain an understanding of internal control relevant to the audit in order to design audit procedures
that are appropriate in the circumstances, but not for the purpose of expressing an opinion on the
effectiveness of the Group’s internal control.
Evaluate the appropriateness of accounting policies used and the reasonableness of accounting
estimates and related disclosures made by the Directors.
Conclude on the appropriateness of the Directors’ use of the going concern basis of accounting and,
based on the audit evidence obtained, whether a material uncertainty exists related to events or
conditions that may cast significant doubt on the Group’s ability to continue as a going concern. If
we conclude that a material uncertainty exists, we are required to draw attention in our auditors’
report to the related disclosures in the consolidated financial statements or, if such disclosures are
inadequate, to modify our opinion. Our conclusions are based on the audit evidence obtained up to
the date of our auditors’ report. However, future events or conditions may cause the Group to cease
to continue as a going concern.
Evaluate the overall presentation, structure and content of the consolidated financial statements,
including the disclosures, and whether the consolidated financial statements represent the
underlying transactions and events in a manner that achieves fair presentation.
Obtain sufficient appropriate audit evidence regarding the financial information of the entities or
business activities within the Group to express an opinion on the consolidated financial statements.
We are responsible for the direction, supervision and performance of the group audit. We remain
solely responsible for our audit opinion.
We communicate with those charged with governance regarding, among other matters, the planned
scope and timing of the audit and significant audit findings, including any significant deficiencies in
internal control that we identify during our audit.


CONSOLIDATED STATEMENT OF FINANCIAL POSITIONAs at December 31,
Amounts in SAR’000
Notes 2017 2016
(Restated)
ASSETS
Cash and balances with SAMA 4 15,137,005 7,487,379
Due from banks and other financial institutions 5 2,115,271 1,024,369
Positive fair value derivatives 11 212,218 393,779
Investments, net 6 16,688,747 21,258,498
Loans and advances, net 7 63,639,483 72,743,097
Investment in an associate 8 45,507 35,697
Property and equipment, net 9 1,347,009 1,281,023
Other assets, net 10 684,590 766,212 ───────── ─────────
Total assets 99,869,830 104,990,054═════════ ═════════
LIABILITIES AND SHAREHOLDERS’ EQUITY
Liabilities
Due to banks and other financial institutions 12 3,344,671 1,347,732
Negative fair value derivatives 11 91,679 270,793
Customers’ deposits 13 78,274,963 85,358,788
Subordinated debt 14 2,505,026 3,909,905
Other liabilities 15 2,053,795 1,440,111 ──────── ────────
Total liabilities 86,270,134 92,327,329 ──────── ────────
Shareholders’ equity
Share capital 16 11,430,720 11,430,720
Statutory reserve 17 600,062 266,183
General reserve 130,000 130,000
Other reserves 18 13,129 41,147
Retained earnings 1,297,728 854,003
Proposed dividends 26 171,461 -
Share based plan reserve 37 (43,404) (59,328) ──────── ────────
Total shareholders’ equity 13,599,696 12,662,725 ──────── ────────
Total liabilities and shareholders’ equity 99,869,830 104,990,054═════════ ═════════
The accompanying notes 1 to 40 form an integral part of these consolidated financial statements.
1

CONSOLIDATED INCOME STATEMENTFor the year ended December 31,
Amounts in SAR’000
Special commission income 20 3,903,289 4,082,624
Special commission expense 20 1,137,527 1,575,307 ──────── ────────
Net special commission income 2,765,762 2,507,317
Fee and commission income, net 21 689,799 784,741
Exchange income, net 129,885 160,848
Trading income, net 22 95,916 129,787
Dividend income from available for sale investments - 11,446
Gain on non-trading investments 23 30,260 90,658 ──────── ────────
Total operating income 3,711,622 3,684,797 ──────── ────────
Salaries and employee-related expenses 24 670,845 693,225
Rent and premises-related expenses 140,230 142,169
Depreciation and amortisation 9 165,191 122,039
General and administrative expenses 289,349 378,133
Impairment charge for available for sale investments - 120,246
Impairment charge for credit losses, net 7b (ii) 1,120,299 1,167,389 ──────── ────────
Total operating expenses 2,385,914 2,623,201 ──────── ────────
Operating income 1,325,708 1,061,596
Share in earnings of an associate 8 9,810 3,130 ──────── ────────
Net income for the year 1,335,518 1,064,726 ═════════ ═════════
Basic and diluted earnings per share (Expressed in SAR per share) 25 1.17 0.93 ═════════ ═════════
The accompanying notes 1 to 40 form an integral part of these consolidated financial statements.
Notes 2017 2016
2

CONSOLIDATED STATEMENT OF COMPREHENSIVE INCOMEFor the year ended December 31,
Amounts in SAR’000
2017 2016
Net income for the year 1,335,518 1,064,726
Other comprehensive income:
Items that are or may be reclassified to consolidated income statement in subsequent periods:
Available for sale investments:
- Net changes in fair values 18 (4,060) (4,457)
- Impairment charge for available for sale investments - 120,246
- Net amounts transferred to consolidated income statement (24,360) (37,230)
(24,360) 83,016
──────── ────────
Total available for sale investments (28,420) 78,559
──────── ────────
Cash flow hedge:
- Net changes in fair values 18 402 279 ──────── ────────
Total other comprehensive income (28,018) 78,838
──────── ────────
──────── ────────
Total comprehensive income for the year 1,307,500 1,143,564
═══════ ═══════
Notes
The accompanying notes 1 to 40 form an integral part of these consolidated financial statements.
3

CONSOLIDATED STATEMENT OF CHANGES IN SHAREHOLDERS’ EQUITYFor the year ended December 31,
Amounts in SAR’000
Notes
Share
capital
Statutory
Reserve
General
reserve
Available
for sale
Cash flow
hedges
Reserve
for bonus
shares
Retained
earnings
Proposed
dividends
Share based
plan reserve
Total
shareholders'
equity
2017
Balance at beginning of the year - as reported 11,430,720 266,183 130,000 40,868 279 - 1,054,072 - (59,328) 12,862,794
Effect of restatement – provision for Zakat and income tax 26 - - - - - - (200,069) - - (200,069)
Balance at beginning of the period - restated 11,430,720 266,183 130,000 40,868 279 - 854,003 - (59,328) 12,662,725
Net income for the year - - - - - - 1,335,518 - - 1,335,518
Net changes in fair values 18 - - - (4,060) 402 - - - - (3,658)
Net amounts transferred to the consolidated income statement 18 - - - (24,360) - - - - - (24,360)
Total comprehensive income for the year - - - (28,420) 402 - 1,335,518 - - 1,307,500
Transfer to statutory reserve 17 - 333,879 - - - - (333,879) - - -
Proposed dividends 26 - - - - - - (171,461) 171,461 - -
Provision for Zakat for the year 26 - - - - - - (26,884) - - (26,884)
Provision for income tax for the year 26 - - - - - - (102,188) - - (102,188)
Provision for Zakat and income tax for prior years 26 - - - - - - (257,381) - - (257,381)
Share based plan transactions 37 - - - - - - - - 15,924 15,924 ─────── ─────── ────── ─────── ─────── ────── ────── ────── ────── ────────
Balance at the end of the year 11,430,720 600,062 130,000 12,448 681 - 1,297,728 171,461 (43,404) 13,599,696 ═══════ ═══════ ══════ ═══════ ═══════ ══════ ═══════ ══════ ══════ ════════
2016
Balance at beginning of the year - as reported 5,715,360 1 130,000 (37,691) - 5,715,360 255,528 297,199 (48,563) 12,027,194
Effect of restatement – provision for Zakat and income tax 26 - - - - - - (80,446) (159,341) - (239,787)
Balance at beginning of the year - restated 5,715,360 1 130,000 (37,691) - 5,715,360 175,082 137,858 (48,563) 11,787,407
Net income for the year - - - - - - 1,064,726 - - 1,064,726
Net changes in fair values 18 - - - (4,457) 279 - - - - (4,178)
Net amounts transferred to the consolidated income statement 18 - - - 83,016 - - - - - 83,016
Total comprehensive income for the year - - - 78,559 279 - 1,064,726 - - 1,143,564
Transfer to statutory reserve 17 - 266,182 - - - - (266,182) - - -
Bonus shares issued 5,715,360 - - - - (5,715,360) - - - -
Dividends paid - - - - - - - (137,858) - (137,858)
Provision for Zakat for the year – restated 26 - - - - - - (25,106) - - (25,106)
Provision for income tax for the year – restated 26 - - - - - - (94,517) - - (94,517)
Share based plan transactions 37 - - - - - - - - (10,765) (10,765)
─────── ─────── ────── ─────── ─────── ─────── ─────── ────── ────── ───────
Balance at the end of the year - restated 11,430,720 266,183 130,000 40,868 279 - 854,003 - (59,328) 12,662,725
═══════ ═══════ ══════ ═══════ ═══════ ═══════ ═══════ ══════ ══════ ═══════
The accompanying notes 1 to 40 form an integral part of these consolidated financial statements.
4
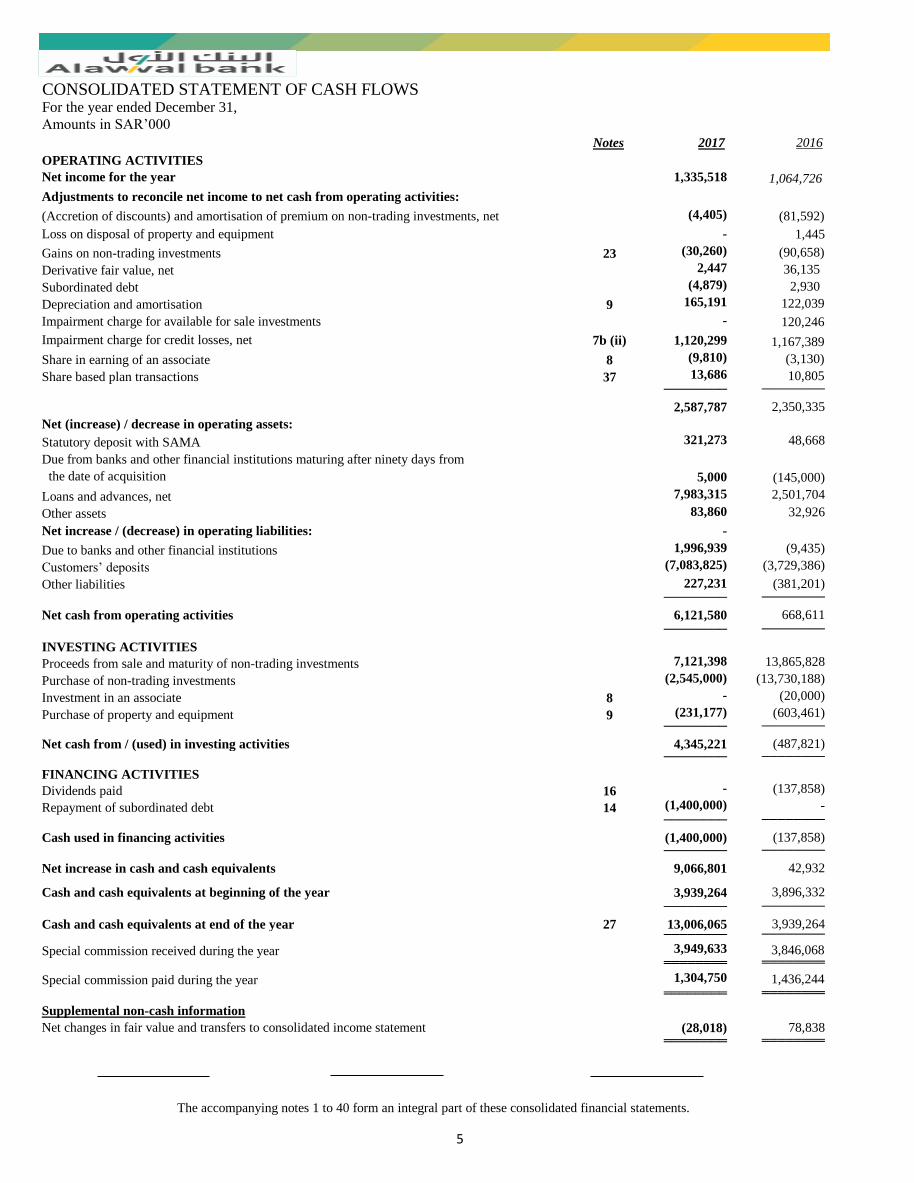
CONSOLIDATED STATEMENT OF CASH FLOWSFor the year ended December 31,
Amounts in SAR’000
Notes 2017 2016
OPERATING ACTIVITIES
Net income for the year 1,335,518 1,064,726
(4,405) (81,592)
Loss on disposal of property and equipment - 1,445
Gains on non-trading investments 23 (30,260) (90,658)
Derivative fair value, net 2,447 36,135
Subordinated debt (4,879) 2,930
Depreciation and amortisation 9 165,191 122,039
Impairment charge for available for sale investments - 120,246
Impairment charge for credit losses, net 7b (ii) 1,120,299 1,167,389
Share in earning of an associate 8 (9,810) (3,130)
Share based plan transactions 37 13,686 10,805 ──────── ────────
2,587,787 2,350,335
Net (increase) / decrease in operating assets:
Statutory deposit with SAMA 321,273 48,668
5,000 (145,000)
Loans and advances, net 7,983,315 2,501,704
Other assets 83,860 32,926
Net increase / (decrease) in operating liabilities: -
Due to banks and other financial institutions 1,996,939 (9,435)
Customers’ deposits (7,083,825) (3,729,386)
Other liabilities 227,231 (381,201) ──────── ────────
Net cash from operating activities 6,121,580 668,611 ──────── ────────
INVESTING ACTIVITIES
Proceeds from sale and maturity of non-trading investments 7,121,398 13,865,828
Purchase of non-trading investments (2,545,000) (13,730,188)
Investment in an associate 8 - (20,000)
Purchase of property and equipment 9 (231,177) (603,461) ──────── ────────
Net cash from / (used) in investing activities 4,345,221 (487,821) ──────── ────────
FINANCING ACTIVITIES
Dividends paid 16 - (137,858)
Repayment of subordinated debt 14 (1,400,000) - ──────── ────────
Cash used in financing activities (1,400,000) (137,858) ──────── ────────
Net increase in cash and cash equivalents 9,066,801 42,932
Cash and cash equivalents at beginning of the year 3,939,264 3,896,332 ──────── ────────
Cash and cash equivalents at end of the year 27 13,006,065 3,939,264 ════════ ════════
Special commission received during the year 3,949,633 3,846,068 ════════ ════════
Special commission paid during the year 1,304,750 1,436,244 ════════ ════════
Supplemental non-cash information
Net changes in fair value and transfers to consolidated income statement (28,018) 78,838 ════════ ════════
The accompanying notes 1 to 40 form an integral part of these consolidated financial statements.
Adjustments to reconcile net income to net cash from operating activities:
(Accretion of discounts) and amortisation of premium on non-trading investments, net
Due from banks and other financial institutions maturing after ninety days from
the date of acquisition
5

NOTES TO THE CONSOLIDATED FINANCIAL STATEMENTSFor the year ended December 31, 2017
1 GENERAL
Alawwal Invest (AI)
Alawwal Real Estate Company (AREC)
Alawwal Insurance Agency Company (AIAC)
2 BASIS OF PREPARATION
a) Statement of compliance
-
AIAC, a limited liability company incorporated in the Kingdom of Saudi Arabia, a wholly owned subsidiary of the Bank through direct
ownership was established under commercial registration number 1010300250 dated 29 Muharram 1432H (corresponding to January 4, 2011)
with the approval of SAMA. The Company was formed to act as an agent for Wataniya Insurance Company (WIC), an associate, for selling its
insurance products.
In addition to the subsidiaries stated above, during the current year, the Bank established a Special Purpose Vehicle (the "SPV") Alawwal
Financial Markets Limited, a wholly owned subsidiary of the Bank, which is formed with the approval of SAMA solely to facilitate trading of
certain derivative financial instruments. Being a subsidiary, the SPV is consolidated in these consolidated financial statements as the Bank
controls the SPV.
In accordance with ‘International Financial Reporting Standards (IFRS) as modified by the Saudi Arabian Monetary Authority
(“SAMA”) for the accounting of zakat and tax’, which requires, adoption of all IFRSs as issued by the International Accounting
Standards Board (“IASB”) except for the application of International Accounting Standard (IAS) 12 - “Income Taxes” and IFRIC 21 -
“Levies” so far as these relate to zakat and tax. As per the SAMA Circular no. 381000074519 dated April 11, 2017 and subsequent
amendments through certain clarifications relating to the accounting for zakat tax (“SAMA Circular”), the Zakat and tax are to be
accrued on a quarterly basis through shareholders equity under retained earnings.
The consolidated financial statements have been prepared;
Alawwal bank (the "Bank"), is a Saudi Joint Stock Company incorporated in the Kingdom of Saudi Arabia and was formed pursuant to Royal
Decree No. M/85 dated 29 Dhul Hijjah 1396H (corresponding to December 21, 1976). The Bank commenced business on 17 Shaaban 1397H
(corresponding to August 2, 1977) when it took over the operations of Algemene Bank Nederland N.V. in the Kingdom of Saudi Arabia. The
Bank operates under commercial registration No. 1010064925 dated 6 Jumada II 1407H (corresponding to February 5, 1987) through its 67
branches (2016: 65 branches) in the Kingdom of Saudi Arabia. The registered address of the Bank’s head office is:
Alawwal bank
P O Box 1467
Riyadh 11431, Kingdom of Saudi Arabia.
The objective of the Bank and its subsidiaries (collectively referred to as "the Group") is to provide a full range of banking and investment
services. The Group also provides to its customers Islamic (non commission based) banking products which are approved and supervised by an
independent Shariah Board established by the Bank.
The consolidated financial statements comprise of the financial statements of the Bank and its subsidiaries. The details of these subsidiaries
are set out below:
Alawwal Invest, is a Saudi Closed Joint Stock Company incorporated in the Kingdom of Saudi Arabia, a wholly owned subsidiary of the
Bank, was formed in accordance with the Capital Market Authority's (CMA) Resolution number 1-39-2007 under commercial registration
number 1010242378 dated 30 Dhul Hijjah 1428H (corresponding to January 9, 2008) to take over and manage the Group's Investment
Services and Asset Management activities regulated by CMA related to dealing, managing, arranging, advising and taking custody of
securities. Alawwal Invest commenced its operations effective on 2 Rabi’II 1429H (corresponding to April 8, 2008). Alawwal Invest was
converted from a Limited Liability Company to a Closed Joint Stock Company during the year.
AREC, a limited liability company incorporated in the Kingdom of Saudi Arabia, a wholly owned subsidiary of the Bank through direct
ownership was established under commercial registration number 1010250772 dated 21 Jumada I 1429H (corresponding to May 26, 2008)
with the approval of the Saudi Arabian Monetary Agency (SAMA). The Company was formed to register real estate assets under its name
which are received by the Bank from its borrowers as collaterals.
Head Office
Al-Dhabab Street
During the current year, the board of directors of the Bank, in its meeting dated 25 April 2017, resolved to enter into preliminary discussions
with The Saudi British Bank (SABB), a bank listed in Kingdom of Saudi Arabia, to study the possibility of merging the two banks. The entry
into these discussions does not mean that the merger will happen between the two banks. If a merger is agreed, it will be subject to various
conditions including, without limitation, approval at the extra ordinary general assembly of each bank and approval of the Saudi Arabian
regulatory authorities.
6

NOTES TO THE CONSOLIDATED FINANCIAL STATEMENTSFor the year ended December 31, 2017
-
-
-
b) Basis of measurement and presentation
-
-
-
c) Functional and presentation currency
d) Critical accounting judgements, estimates and assumptions
(i) Impairment for losses on loans and advances
(ii) Fair value measurement
-
-
Further, the above SAMA Circular has also repealed the existing Accounting Standards for Commercial Banks, as promulgated by
SAMA, and are no longer applicable from January 1, 2017.
In compliance with the provisions of Banking Control Law, the Regulations for Companies in the Kingdom of Saudi Arabia and the
Article of Association of the Bank.
Refer note 3 (i) and 3 (y) for the accounting policy of zakat and income tax and note 26 for the impact of change in the accounting
policy resulting from the SAMA Circular.
Level 3 — Valuation techniques for which the lowest level input that is significant to the fair value measurement is unobservable
Fair value is the price that would be received to sell an asset or paid to transfer a liability in an orderly transaction between market participants
at the measurement date. The fair value measurement is based on the presumption that the transaction to sell the asset or transfer the liability
takes place either:
The principal or the most advantageous market must be accessible by the Group. The fair value of an asset or a liability is measured using the
assumptions that market participants would use when pricing the asset or liability, assuming that market participants act in their economic best
interest. The Group uses valuation techniques that are appropriate in the circumstances and for which sufficient data are available to measure
fair value, maximising the use of relevant observable inputs and minimising the use of unobservable inputs. All assets and liabilities for which
fair value is measured or disclosed in the annual consolidated financial statements are categorized within the fair value hierarchy, described as
follows, based on the lowest level input that is significant to the fair value measurement as a whole:
Level 1 — Quoted (unadjusted) market prices in active primary markets
Level 2 — Adjusted market prices in active markets for identical assets or liabilities using valuation techniques for which the lowest level
input that is significant to the fair value measurement is directly or indirectly observable.
In the absence of a principal market, in the most advantageous market for the asset or liability
The consolidated financial statements are prepared under the historical cost convention except for the following items measured at fair value:
The preparation of the consolidated financial statements in conformity with IFRSs, as modified by the SAMA for the accounting of zakat and
income tax, requires the use of certain critical accounting judgments, estimates and assumptions that affect the reported amounts of assets and
liabilities. It also requires management to exercise its judgement in the process of applying the Group’s accounting policies. Such judgments,
estimates, and assumptions are continually evaluated and are based on historical experience and other factors, including expectations of future
events that are believed to be reasonable under the circumstances and obtaining professional advices. Significant areas where management has
used estimates, assumptions or exercised judgments are as follows:
These consolidated financial statements are presented in Saudi Arabian Riyals (SAR), which is the Bank's functional currency. Financial
information has been rounded off to the nearest thousand, except where otherwise indicated.
available for sale investments;
recognised financial assets designated as hedged items in qualifying fair value hedge relationships which are adjusted for changes in
fair value attributable to the risk being hedged.
In the principal market for the asset or liability, or
Management reviews its loan portfolio to assess specific and collective impairment on a monthly basis. In determining whether an impairment
loss should be recorded, management applies judgement when assessing whether there is any observable data indicating that there is a
measurable decrease in the estimated future cash flows. This evidence may include observable data indicating that there has been an adverse
change in the payment status of borrowers in a group. Management uses estimates based on historical loss experience for loans with similar
credit risk characteristics where objective evidence of impairment exists. The methodology and assumptions used for estimating both the
amount and the timing of future cash flows are reviewed regularly to reduce any differences between loss estimates and actual loss experience
(See note 7).
derivatives;
The Group measures financial instruments, such as, derivatives and available for sale investments at fair value at each reporting date. Fair
values of investments held at amortised cost and held to maturity are disclosed in note 6(d).
7

NOTES TO THE CONSOLIDATED FINANCIAL STATEMENTSFor the year ended December 31, 2017
(iii) Impairment of available-for-sale equity and debt securities
(iv) Classification of held-to-maturity investments
(v) Determination of control over investees
Investment funds
(vi) Provisions for liabilities and charges
vii) Going concern
viii) Defined benefit plan
In assessing objective evidence of impairment of available for sale debt investments at the reporting date, the Group considers all available
evidence, including observable data or information about events specifically relating to the securities which may result in a shortfall in
recovery of future cash flows. Financial difficulties of the issuer, as well as other factors such as information about the issuers' liquidity,
business and financial risk exposures, levels of and trends in default for similar financial assets, national and local economic trends and
conditions, and the fair value of collateral and guarantees may be considered individually, or in combination, to determine if there is objective
evidence of impairment.
The Group exercises judgement to consider impairment on the available-for-sale equity and debt investments at each reporting date. This
includes determination of a significant or prolonged decline in the fair value below its cost. In assessing whether it is significant, the decline in
fair value is evaluated against the original cost of the asset at initial recognition of equity instruments. In assessing whether it is prolonged, the
decline is evaluated against the period in which the fair value of the asset has been below its original cost at initial recognition.
The determination of what is "significant" requires judgement. In making this judgement, the Group evaluates among other factors, the normal
volatility in instrument price, deterioration in the financial health of the investee, industry and sector performance, changes in technology, and
operational and financing cash flows.
In certain cases external valuers are involved for valuation of significant assets, such as properties and AFS financial assets, and significant
liabilities, such as contingent consideration. Involvement of external valuers is decided upon annually by the valuation committee after
discussion with and approval by the Bank’s audit committee. Selection criteria includes market knowledge, reputation, independence and
whether professional standards are maintained.
For assets and liabilities that are recognised in the annual consolidated financial statements on a recurring basis, the Group determines whether
transfers have occurred between levels in the hierarchy by re-assessing categorization (based on the lowest level input that is significant to the
fair value measurement as a whole) at the end of each reporting period. .
Management has made an assessment of the Group's ability to continue as a going concern and is satisfied that the Group has the resources to
continue in business for the foreseeable future. Furthermore, management is not aware of any material uncertainties that may cast significant
doubt upon the Group’s ability to continue as a going concern. Therefore, the annual consolidated financial statements continue to be prepared
on a going concern basis.
The Group follows the guidance of IAS 39 in classifying non-derivative financial assets with fixed or determinable payments and fixed
maturity as held-to-maturity. In making this judgement, Management evaluates its intention and ability to hold such investments to maturity. If
the Group fails to keep these investments to maturity other than in certain specific circumstances – for example, selling close to maturity or an
insignificant amount, it will be required to reclassify the entire class as available-for-sale investments.
The control indicators as set out in note 3 (a) are subject to management’s judgement that can have a significant effect in the case of the
Group’s interests in investments funds.
The Group acts as Fund Manager to a number of investment funds. Determining whether the Group controls such an investment fund usually
focuses on the assessment of the aggregate economic interests of the Group in the Fund (comprising any carried interests and expected
management fees) and the investors rights to remove the Fund Manager. The Group has conducted a detailed assessment and as a result the
Group has concluded that it acts as an agent for the investors in all cases, and therefore has not consolidated any of these funds. See notes 6
and 36.
The Group receives legal claims in the normal course of business. Management has made judgments, as to the likelihood of any claim
succeeding, in making provisions. The time of concluding legal claims is uncertain, as is the amount of possible outflow of economic benefits.
Timing and cost ultimately depends on the due process being followed as per law.
Group operates an end of service benefit scheme for its employees based on the prevailing Saudi Labor laws. The liability is being accrued
based on projected unit credit method in accordance with the periodic actuarial valuation.
8

NOTES TO THE CONSOLIDATED FINANCIAL STATEMENTSFor the year ended December 31, 2017
3
-
-
-
a) Basis of consolidation
All intra-group assets and liabilities, equity, income, expenses and cash flows relating to transactions between members of the Group are
eliminated in full on consolidation.
The Group manages and administers assets held in unit trusts and other investment vehicles on behalf of investors. The financial statements of
these entities are not included in these consolidated financial statements except when the Group controls the entity.
The consolidated financial statements comprise the financial statements of Alawwal bank and its subsidiaries drawn up to December 31 of
each year. The financial statements of the subsidiaries are prepared for the same reporting period as that of the Bank and changes have been
made to their accounting policies where necessary to align them with the accounting policies of the Bank.
Subsidiaries are investees controlled by the Group. The Group controls an investee when it is exposed to, or has rights to, variable returns from
its involvement with the investee and has the ability to affect those returns through its power over the investee. The financial statements of
subsidiaries are included in the consolidated financial statements from the date that control commences until the date that control ceases. The
results of subsidiaries acquired or disposed of during the year, if any, are included in the consolidated income statement from the date of the
acquisition or up to the date of disposal, as appropriate. The consolidated financial statements have been prepared using uniform accounting
policies and valuation methods for like transactions and other events in similar circumstances.
Specifically, the Group controls an investee if and only if the Group has:
- Power over the investee (i.e. existing rights that give it the current ability to direct the relevant activities of the investee);
- Exposure, or rights, to variable returns from its involvement with the investee, and
- The ability to use its power over the investee to affect its returns
- When the Group has less than a majority of the voting or similar rights of an investee, the Group considers all relevant facts and
circumstances in assessing whether it has power over an investee, including:
- The contractual arrangement with the other vote holders of the investee
- Rights arising from other contractual arrangements
- The Group’s voting rights and potential voting rights granted by equity instruments such as shares
The Group re-assesses whether or not it controls an investee if facts and circumstances indicate that there are changes to one or more of the
three elements of control. Consolidation of a subsidiary commences when the Group obtains control over the subsidiary and ceases when the
Group loses control of the subsidiary. Assets, liabilities, income and expenses of a subsidiary acquired or disposed of during the year are
included in the consolidated statement of comprehensive income from the date the Group gains control until the date the Group ceases to
control the subsidiary.
The Group has chosen not to early adopt the amendments and revisions to the IFRSs which have been published and are mandatory for
compliance for the accounting years beginning on or after January 1, 2018.
These amendments introduce an additional disclosure that will enable users of financial statements to evaluate changes in liabilities
arising from financing activities. This amendment is part of the IASB’s Disclosure Initiative, which continues to explore how financial
statement disclosure can be improved.
This adoption has no material impact on the consolidated financial statements other than certain additional disclosures.
Amendments to IAS 7, Statement of cash flows on disclosure initiative: Applicable for annual periods beginning on or after January
1, 2017.
ii) Amendments to following existing standard have no significant financial impact on the consolidated financial statements of the Group
on the current or prior periods and is expected to have no significant effect in future periods:
The Group has amended its accounting policy relating to Zakat and income tax and has started to accrue Zakat and income tax on a quarterly
basis and charge it to consolidated statement of changes in shareholders' equity in accordance with SAMA guidance, as mentioned above, on
accounting for Zakat and income tax. Previously, Zakat and income tax were deducted from dividends upon payment to the shareholders. In
case no dividends were paid, Zakat and income tax were accounted for on a payment basis. The effect of this change has been accounted for
retrospectively and is disclosed in note 26.
i) Change in the accounting policy in relation to accounting for Zakat and income tax.
SUMMARY OF SIGNIFICANT ACCOUNTING POLICIES
The significant accounting policies adopted in the preparation of these consolidated financial statements are set out below.
The accounting policies used in the preparation of the consolidated financial statements are consistent with those followed in the preparation
of the consolidated financial statements for the year ended December 31, 2016, except for:
Change in accounting policies
9
NOTES TO THE CONSOLIDATED FINANCIAL STATEMENTSFor the year ended December 31, 2017
b) Investments in associates
c) Trade date accounting
d) Derivative financial instruments and hedge accounting
i) Derivatives held for trading
A change in the ownership interest of a subsidiary, without a loss of control, is accounted for as an equity transaction. If the Group loses
control over a subsidiary, it:
- Derecognises the assets (including goodwill, if any) and liabilities of the subsidiary
- Derecognises the carrying amount of any non-controlling interests
- Derecognises the cumulative translation differences recorded in equity
- Recognises the fair value of the consideration received
- Recognises the fair value of any investment retained
- Recognises any surplus or deficit in profit or loss
- Reclassifies the parent’s share of components previously recognised in the consolidated comprehensive income to consolidated income
statement or retained earnings, as appropriate, as would be required if the Group had directly disposed of the related assets or liabilities.
All derivatives are carried at their fair value and classified as assets where the fair value is positive and as liabilities where the fair value is
negative. Fair values are derived by applying discounted cash flow models or pricing models as appropriate. The treatment of changes in their
fair value depends on their classification into the following categories:
The Group’s share of profit / loss of an associate is shown on the face of the consolidated income statement. This is the earnings / (losses)
attributable to equity holders of the associate and, therefore, is earnings / (losses) after tax and non-controlling interests in the subsidiaries of
the associate. After application of the equity method, the Group determines whether it is necessary to recognise an additional impairment loss
on its investment in its associate. The Group determines at each reporting date whether there is any objective evidence that the investment in
the associate is impaired. If this is the case, the Group calculates the amount of impairment as the difference between the recoverable amount
of the associate and its carrying value and recognises the amount in the ‘share of earning of an associate’ in the consolidated income statement.
Derivative financial instruments, including foreign exchange contracts, foreign exchange and commodity forward contracts, commission rate
swaps, commodity options, futures and forward rate agreements, currency and commission rate swaps, currency and commission rate options
(both written and purchased) are initially recognised at fair value on the date on which the derivative contract is entered into and are
subsequently re-measured at fair value in the consolidated statement of financial position with transaction costs recognised in the consolidated
income statement.
Any changes in the fair value of derivatives held for trading are taken directly to the consolidated income statement and disclosed in net
trading income. Derivatives held for trading include all those derivatives which do not qualify for hedge accounting including embedded
derivatives.
A contract that requires or permits net settlement of the change in the value of the contract is not a regular way contract. Instead, such a
contract is accounted for as a derivative in the period between the trade date and the settlement date.
Investments in associates are initially recognised at cost and subsequently accounted for under the equity method of accounting based on
annual audited or latest available financial statements. An associate is an entity in which the Group has significant influence (but not control),
over financial and operating policies and which is neither a subsidiary nor a joint venture. Investments in associates are carried in the
consolidated statement of financial position at cost plus post-acquisition changes in the Group's share of net assets, less any impairment in the
value of individual investments. The Group’s share of its associates’ post-acquisition profits or losses is recognised in the consolidated income
statement, and its share of post-acquisition movements in statement of comprehensive income is recognised in the consolidated statement of
comprehensive income. The cumulative post-acquisition movements are adjusted against the carrying amount of the investment. When the
Group’s share of losses in an associate equals or exceeds its interest in the associate, including any other unsecured receivables, the Group does
not recognise further losses, unless it has incurred obligations or made payments on behalf of the associate. Unrealized gains and losses on
transactions between the Group and its associates are eliminated to the extent of the Group’s interest in the associates.
All 'regular-way' purchases and sales of financial assets are initially recognised and derecognised on trade date, i.e. the date that the Group
becomes a party to the contractual provisions of the instrument. 'Regular-way' purchases or sales are purchases or sales of financial assets that
require delivery of assets within the time frame generally established by regulation or convention in the market place.
10

NOTES TO THE CONSOLIDATED FINANCIAL STATEMENTSFor the year ended December 31, 2017
ii) Embedded derivatives
iii) Hedge accounting
Fair Value Hedges
Cash Flow Hedges
The Group designates certain derivatives as hedging instruments in qualifying hedging relationships to manage exposures to interest rate,
foreign currency, and credit risks, including exposures arising from highly probable forecast transactions and firm commitments. In order to
manage particular risk, the Group applies hedge accounting for transactions that meet specific criteria.
When a derivative is designated as a hedging instrument in a fair value hedge relationship, any gain or loss from re-measuring the hedging
instruments to fair value is recognised in the consolidated income statement together with the change in the fair value of the hedged item
attributable to the hedged risk.
For the purpose of hedge accounting, hedges are classified into two categories: (a) fair value hedges that hedge the exposure to changes in the
fair value of a recognised asset or liability (or assets or liabilities in case of portfolio hedging) or an unrecognised firm commitment or an
identified portion of such an asset, liability or firm commitment, that is attributable to a particular risk and could affect the reported net gain or
losses; and (b) cash flow hedges which hedge exposure to variability in cash flows that is either attributable to a particular risk associated with
a recognised asset or liability or to a highly probable forecasted transaction that affects the reported net gains or loss.
In order to qualify for hedge accounting, hedge should be expected to be highly effective, i.e. changes in the fair value or cash flows of the
hedging instruments should effectively offset corresponding changes in the hedged items, and should be reliably measurable. At inception of
the hedge, the risk management objective and strategy is documented including the identification of the hedging instrument, the related hedged
item, the nature of risk being hedged, and how management will assess the effectiveness of the hedging relationship. Subsequently hedges are
assessed for effectiveness on an on-going basis.
For designated and qualifying cash flow hedging, derivative instruments are used in a hedge of a variability in cash flows attributable to a
particular risk associated with recognised asset or a liability or a highly probable forecast transaction that could affect the consolidated
income statement. The portion of the gain or loss on the hedging instrument that is determined to be an effective portion is recognised directly
in other comprehensive income and the ineffective portion, if any, is recognised in the consolidated income statement. For cash flow hedges
affecting future transactions, the gains or losses recognised in other reserves, are transferred to the consolidated income statement in the same
period in which the hedged item affects the consolidated income statement. However, if the Group expects that all or a portion of a loss
recognized in other comprehensive income will not be recovered in one or more future periods, it shall reclassify into the consolidated income
statement as a reclassification adjustment the amount that is not to be recognized.
Where the fair value hedge of a commission bearing hedged item measured at amortized cost ceases to meet the criteria for hedge accounting
or is sold, exercised or terminated, the difference between the carrying value of the hedged item on termination and the face value is amortised
over the remaining term of the original hedge using the effective commission rate. If the hedged item is derecognised, the unamortised fair
value adjustment is recognised immediately in the consolidated income statement.
At each hedge effectiveness assessment date, a hedge relationship must be expected to be highly effective on a prospective basis and
demonstrable that it was effective (retrospective effectiveness) for the designated period in order to qualify for hedge accounting. A formal
assessment is undertaken by comparing the hedging instrument’s effectiveness in offsetting the changes in fair value or cash flows attributable
to the hedged risk in the hedged item, both at inception and at each quarter end on an ongoing basis. A hedge is expected to be highly effective
if the changes in fair value or cash flows attributable to the hedged risk during the period for which the hedge is designated were offset by the
hedging instrument in a range of 80% to 125% and were expected to achieve such offset in future periods. Hedge ineffectiveness is recognized
in the consolidated income statement in ‘Net trading income’. For situations where the hedged item is a forecast transaction, the Group also
assesses whether the transaction is highly probable and presents an exposure to variations in cash flows that could ultimately affect the
consolidated income statement.
Derivatives embedded in other financial instruments are treated as separate derivatives and recorded at fair value if their economic
characteristics and risks are not closely related to those of the host contract, and the host contract is not itself held for trading or designated at
fair value through income statement (FVIS). Embedded derivatives separated from the host contracts are carried at fair value in the trading
portfolio with changes in fair value recognised in the consolidated income statement.
11

NOTES TO THE CONSOLIDATED FINANCIAL STATEMENTSFor the year ended December 31, 2017
e) Foreign currencies
f) Offsetting financial instruments
g) Revenue / expense recognition
i) Special commission income and expenses
ii) Exchange income / (loss)
The carrying amount of the financial asset or financial liability is adjusted if the Group revises its estimates of payments or receipts. The
adjusted carrying amount is calculated based on the original effective special commission rate and the change in carrying amount is recorded
as special commission income or expense. Subsequent to the recognition of an impairment loss on a financial asset or a group of financial
assets, special commission income continues to be accounted for in consolidated statement of financial position on the effective special
commission rate basis, on the asset’s carrying value. The calculation of the effective special commission rate takes into account all contractual
terms of the financial instruments (prepayment, options etc.) and includes all fees paid or received, transaction costs, and discounts or
premiums that are an integral part of the effective special commission rate. Transaction costs are incremental costs that are directly attributable
to the acquisition, issue or disposal of a financial asset or a liability.
Where the hedged forecasted transaction results in the recognition of a non- financial asset or a non-financial liability, then at the time such
asset or liability is recognised the associated gains or losses that had previously been recognised directly in other comprehensive income are
included in the initial measurement of the acquisition cost or other carrying amount of such asset or liability. When the hedging instrument is
expired or sold, terminated or exercised, or no longer qualifies for hedge accounting, or the forecast transaction is no longer expected to occur
or the Group revokes the designation then hedge accounting is discontinued prospectively. At that point of time, any cumulative gain or loss on
the cash flow hedging instrument that was recognised in other comprehensive income from the period when the hedge was effective is
transferred from equity to consolidated income statement when the forecasted transaction occurs. Where the hedged forecasted transaction is
no longer expected to occur and affects the consolidated income statement, the net cumulative gain or loss recognised in “other comprehensive
income” is transferred immediately to the consolidated income statement for the year.
Income and expenses are not offset in the consolidated income statement unless required or permitted by any accounting standard or
interpretation, and as specifically disclosed in the accounting policies of the Group.
Financial assets and liabilities are offset and reported net in the consolidated statement of financial position when there is a legally enforceable
right to set off the recognised amounts and when the Group intends to settle on a net basis, or to realise the asset and settle the liability
simultaneously.
Exchange income / (loss) is recognised when earned / incurred, as discussed in the foreign currencies policy earlier.
Special commission income and expenses for all financial instruments, except for those classified as held for trading or at fair value through
income statement (FVIS), are recognised in the consolidated income statement using effective special commission rate.
The effective special commission rate is the rate that exactly discounts the estimated future cash payments and receipts through the expected
life of the financial asset or liability (or, where appropriate, a shorter period) to the carrying amount of the financial asset or liability. When
calculating the effective special commission rate, the Group estimates future cash flows considering all contractual terms of the financial
instrument but excluding future credit losses.
The Group’s consolidated financial statements are presented in Saudi Arabian Riyals, which is also the Bank's functional currency. Each entity
in the Group determines its own functional currency and items included in the financial statements of each entity are measured using that
functional currency. Transactions in foreign currencies are translated into Saudi Arabian Riyals at the spot rates prevailing at transaction dates.
Monetary assets and liabilities at year-end (other than monetary items that form part of the net investment in a foreign operation), denominated
in foreign currencies, are translated into Saudi Arabian Riyals at rates of exchange prevailing at the reporting date. The foreign currency gain
or loss on monetary items is the difference between amortised cost in the functional currency at the beginning of the year adjusted for the
effective interest rate and payments during the year, and the amortised cost in foreign currency translated at the exchange rate at the end of the
year. All differences arising on non-trading activities are taken to other non-operating income in the consolidated income statement, with the
exception of differences on foreign currency borrowings that provide an effective hedge against a net investment in foreign entity.
Foreign exchange gains or losses from settlement of transactions and translation of period end monetary assets and liabilities denominated in
foreign currencies are recognised in the consolidated income statement, except for differences that are deferred in other comprehensive income
relating to qualifying cash flow hedges and qualifying net investment hedges to the extent hedges are effective. Translation gains or losses on
non-monetary items carried at fair value are included as part of the fair value adjustment, unless the non-monetary items have an effective
hedging strategy. Non-monetary items that are measured in terms of historical cost in a foreign currency are translated using the exchange rates
as at the dates of the initial transactions. Non-monetary items measured at fair value in a foreign currency are translated using the exchange
rates at the date when the fair value is determined.
12

NOTES TO THE CONSOLIDATED FINANCIAL STATEMENTSFor the year ended December 31, 2017
iii) Fee and commission income
-
-
-
-
iv) Dividend income
v) Gains / (loss) from FVIS (Fair value through Income Statement) financial instruments
vi) Trading income / (loss), net
h) Day one profit or loss
i) Sale and repurchase agreements
j) Investments
Fee received on asset management, wealth management, financial planning, custody services and other similar services that are
provided over an extended period of time, are recognised over the period when the services are being provided.
Loan commitment fees for loans that are likely to be drawn down and other credit related fees are deferred (together with any
incremental costs) and recognised as an adjustment to the effective special commission rate on the loan. When a loan commitment is
not expected to result in the draw-down of a loan, loan commitment fees are recognised on a straight-line basis over the commitment
period.
Other fee and commission expense relate mainly to transaction and service fees and are expensed as the services are received and are
disclosed net of the related fee and commission income.
Assets sold with a simultaneous commitment to repurchase at a specified future date (repos) continue to be recognised in the consolidated
statement of financial position as the Group retains substantially all the risks and rewards of ownership. These assets are continued to be
measured in accordance with related accounting policies for investments held as FVIS, available for sale, held to maturity and other
investments held at amortized cost. The transactions are treated as collateralised borrowing and counter-party liability for amounts received
under these agreements is included in “Due to banks and other financial institutions” or “Customer deposits”, as appropriate.
The difference between sale and repurchase price is treated as special commission expense and accrued over the life of the repo agreement on
an effective special commission rate basis. Assets purchased with a corresponding commitment to resell at a specified future date (reverse
repo) are not recognised in the consolidated statement of financial position, as the Group does not obtain control over the assets. Amounts paid
under these agreements are included in “Cash and balances with SAMA”, “Due from banks and other financial institutions” or “Loans and
advances”, as appropriate. The difference between purchase and resale price is treated as special commission income and accrued over the life
of the reverse repo agreement on an effective special commission rate basis.
All investment securities are initially recognised at fair value plus incremental direct transaction costs except for FVIS instruments where
incremental direct transaction costs are charged to the consolidated income statement. These are subsequently accounted for depending on their
classification as either held to maturity, FVIS, available for sale or other investments held at amortised cost. Premiums are amortised and
discounts accreted using the effective special commission rate basis and are taken to special commission income.
Fee and commission income that are integral to the effective special commission rate are included in the measurement of the relevant assets.
Fee and commission income that are not integral part of the effective special commission rate calculation on a financial asset or liability are
recognised when the related service is provided as follows:
Dividend income is recognised when the Group's right to receive dividend is established. Dividends are reflected as a component of net trading
income, net income from FVIS financial instruments or other operating income based on the classification of the related equity instrument.
Results arising from trading activities include all realised and unrealised gains and losses from changes in fair value and related special
commission income or expense, dividends for financial assets and financial liabilities held for trading and foreign exchange differences. This
includes any ineffectiveness recorded in hedging transactions.
Where the transaction price differs from the fair value of other observable current market transactions in the same instrument or based on a
valuation technique whose variables include only data from observable markets, the Group immediately recognises the difference between the
transaction price and fair value (a ‘Day one’ profit or loss) in the consolidated income statement in ‘Net trading income’. In cases where use is
made of data which is not observable, the difference between the transaction price and model value is only recognised in the consolidated
income statement when the inputs become observable, or when the instrument is derecognised.
Initial recognition
Portfolio and other management advisory and service fees are recognised over the period of applicable service contracts usually on a
time proportionate basis.
Net income from FVIS financial instruments relates to financial assets and liabilities designated as FVIS and include all realised and
unrealised fair value changes, special commission, dividends and foreign exchange differences.
13

NOTES TO THE CONSOLIDATED FINANCIAL STATEMENTSFor the year ended December 31, 2017
Determination of fair value
Reclassification
-
-
i) Held as FVIS
ii) Available for sale
iii) Held to maturity
A security held as available for sale may be reclassified to “Other investments held at amortised cost” if it otherwise would have met the
definition of “Other investments held at amortised cost” and if the Group has the intention and ability to hold that financial asset for the
foreseeable future or until maturity.
If the investments would have met the definition of "held at amortised cost” and had not been required to be classified as held for
trading at initial recognition, these may be reclassified if the Group has the intention and ability to hold the investments for the
foreseeable future or until maturity.
If the investments would not have met the definition of held at amortised cost, and then it is reclassified out of the trading category
only in ‘rare circumstances’.
Investments at FVIS are recorded in the consolidated statement of financial position at fair value. Changes in the fair value are recognised in
the consolidated income statement for the year in which it arises. Special commission income and dividend income on financial assets held as
FVIS are reflected as either trading income or income from FVIS financial instruments in the consolidated income statement.
Investments in this category are classified if they are held for trading or designated by management as FVIS on initial recognition. Investments
classified as trading are acquired principally for the purpose of selling or repurchasing in the short term and are recorded in the consolidated
statement of financial position at fair value. Changes in fair value are recognized in net trading income / (loss).
An investment may be designated at FVIS by the management, at initial recognition if doing so significantly reduces measurement
inconsistencies which would otherwise arise except for equity instruments that do not have a quoted price in an active market and whose fair
values cannot be reliably measured.
For securities traded in organised financial markets, fair value is determined by reference to quoted market average bid / ask prices at the close
of business. Fair value of managed assets and investments in mutual funds are determined by reference to declared net asset values which
approximate the fair value.
For securities where there is no quoted market price, a reasonable estimate of the fair value is determined by reference to the current market
value of another instrument which is substantially the same, or is based on the expected cash flows or the underlying net asset base of the
security. Where the fair values cannot be derived from active markets, they are determined using a variety of valuation techniques that include
the use of mathematical models.
Investments at FVIS are not reclassified subsequent to their initial recognition, except for non-derivative FVIS instrument, other than those
designated as FVIS upon initial recognition (i.e. trading investments) which may be reclassified out of the FVIS category if they are no longer
held for the purpose of being sold or repurchased in the near term, and the following conditions are met:
Subsequent measurement
Investments with fixed or determinable payments and fixed maturity that the Group has the positive intention and ability to hold to maturity
are classified as held to maturity (HTM). Held to maturity investments are initially recognised at fair value including direct and incremental
transaction costs and subsequently measured at amortised cost, less provision for impairment in value. Amortised cost is calculated by taking
into account any discount or premium on acquisition using an effective special commission rate method. Any gain or loss on such investments
is recognised in the consolidated income statement when the investment is derecognised or impaired.
The investments under each class are accounted for and presented using the basis set out in the following paragraphs:
Available-for-sale investments (AFS) are those non-derivative equity and debt securities which are neither classified as held to maturity
(HTM) investments, other investments held at amortized cost (OI) nor designated as FVIS, that are intended to be held for an unspecified
period of time, which may be sold in response to needs for liquidity or changes in special commission rates, exchange rates or equity prices.
Investments which are classified as AFS are initially recognised at fair value plus direct and incremental transaction costs and subsequently
measured at fair value except for certain unquoted equity securities whose fair value cannot be reliably measured and are carried at cost.
Unrealised gains or losses arising from a change in its fair value is recognised in other comprehensive income until the investment is de-
recognised or impaired whereupon any cumulative gain or loss previously recognized in other comprehensive income is reclassified to
consolidated income statement.
14

NOTES TO THE CONSOLIDATED FINANCIAL STATEMENTSFor the year ended December 31, 2017
iv) Other investments held at amortised cost
k) Loans and advances
l) Impairment of financial assets
(i) Impairment of financial assets held at amortised cost
Investments classified as held to maturity cannot ordinarily be sold or reclassified without impacting the Group’s ability to use this
classification and cannot be designated as a hedged item with respect to special commission rate or prepayment risk, reflecting the longer-term
nature of these investments. However, sales and reclassifications in any of the following circumstances would not impact the Group's ability to
use this classification;
• Sales or reclassifications that are so close to maturity that the changes in market rate of special commission would not have a
significant effect on the fair value;
• Sales or reclassifications after the Group has collected substantially all the assets’ original principal; and
• Sales or reclassifications attributable to non recurring isolated events beyond the Group’s control that could not have been
reasonably anticipated.
An assessment is made at each reporting date to determine whether there is an objective evidence that a financial asset or group of financial
assets may be impaired.
If such evidence exists, the net present value of future anticipated cash flows from that asset is determined and any impairment loss, is
recognised for changes in its carrying amounts. The Group considers evidence of impairment for loans and advances and held to maturity
investments at both a specific asset and collective level.
Investment securities with fixed or determinable payments that are not quoted in an active market are classified as Other investments held at
amortised cost (OI). Such investments whose fair values have not been hedged are stated at amortised cost using effective special commission
rate method basis, less provision for impairment. Any gain or loss is recognised in the consolidated income statement when the investment is
derecognised or impaired.
When a financial asset is uncollectible, it is either written off against the related allowances for impairment or is charged directly to the
consolidated income statement. Financial assets are written off only in circumstances where effectively all possible means of recovery have
been exhausted, and the amount of the loss has been determined.
Loans and advances are non-derivative financial assets originated or acquired by the Group with fixed or determinable payments. Loans and
advances are recognised when cash is advanced to borrowers. They are derecognised when either the borrower repays the obligations, the loans
are written off or substantially all the risks and rewards of ownership are transferred. All loans and advances are initially measured at fair
value, including acquisition charges associated with the loans and advances.
If, in a subsequent period, the amount of the impairment loss decreases and the decrease can be related objectively to an event occurring after
the impairment was recognised (such as an improvement in the debtor's credit rating), the previously recognised impairment loss is reversed by
adjusting the allowance account. The amount of the reversal is recognised in the consolidated income statement in impairment charge for
credit losses.
Subsequently loans and advances that are not quoted in an active market and for which fair value has not been hedged, are stated at amortised
cost less any amount written off and impairment for credit losses. For loans and advances which are hedged, the related portion of the hedged
fair value is adjusted against the carrying amount.
A financial asset or group of financial assets is classified as impaired when there is objective evidence of impairment as a result of one or more
events that occurred after the initial recognition of the financial asset or group of financial assets and that a loss event has an impact on the
estimated future cash flows of the financial asset or group of financial assets that can be reliably estimated.
A specific allowance for credit losses due to impairment of a loan or any other financial asset held at amortised cost is established if there is
objective evidence that the Group will not be able to collect all amounts due. The amount of the specific allowances is the difference between
the carrying amount and the estimated recoverable amount. The estimated recoverable amount is the present value of expected future cash
flows, including amounts estimated to be recoverable from guarantees and collateral, discounted based on the original effective special
commission rate.
15

NOTES TO THE CONSOLIDATED FINANCIAL STATEMENTSFor the year ended December 31, 2017
(ii) Impairment of available-for-sale financial assets
m) Other real estate
n) Impairment of non–financial assets
The Group assesses at each reporting date whether there is an indication that an asset may be impaired. If any indication exists, or when annual
impairment testing for an asset is required, the Group estimates the asset’s recoverable amount. An asset’s recoverable amount is the higher of
an asset’s or cash–generating units (CGU) fair value less costs to sell and its value in use. Where the carrying amount of an asset or CGU
exceeds its recoverable amount, the asset is considered impaired and is written down to its recoverable amount. In assessing value in use, the
estimated future cash flows are discounted to their present value using a discount rate that reflects current market assessments of the time value
of money and the risks specific to the asset. In determining fair value less costs to sell, an appropriate valuation model is used. These
calculations are corroborated by valuation multiples, quoted share prices for publicly traded entities or other available fair value indicators.
Consumer loans are considered to be impaired when a payment is overdue for specified number of days as per related product programs. Since
the risk metrics for consumer loans are based on a collective “pool” basis, rather than on individual loans, the provisions for consumer loans
are also computed on a “pool basis” using the ‘flow rate” methodology. The provision coverage is 70% for the non-performing loans (other
than home finance), which are overdue by 90 days whereas the loans are considered as a total write off once overdue by 180 days. In case of
home finance, exposure is downgraded to non-performing loans and special commission income is suspended once the loan is overdue by 90
days. Specific provision is raised for non performing loans overdue by 180 days and above and are written off once overdue by 720 days.
In addition to specific provision for credit losses, provision for collective impairment is made on a portfolio basis for credit losses where there
is objective evidence that unidentified losses exist at the reporting date. These are based on any deterioration in the risk rating (i.e. downward
migration of risk ratings) of the financial assets since it was originally granted. This provision is estimated based on various factors including
credit ratings allocated to a borrower or group of borrowers, the current economic conditions, the experience that the Group has had in dealing
with a borrower or group of borrowers and available historical default information.
If, in a subsequent period, the fair value of a debt instrument increases and the increase can be objectively related to a credit event occurring
after the impairment loss was recognised in the consolidated income statement, the impairment loss is reversed through the consolidated
income statement.
For equity investments held as available for sale, a significant or prolonged decline in fair value below its cost represents objective evidence of
impairment. The impairment loss cannot be reversed through the consolidated income statement as long as the asset continues to be recognised
i.e. any increase in fair value after impairment has been recorded can only be recognised in the consolidated statement of changes in
shareholders’ equity. On derecognition, any cumulative gain or loss previously recognised in the consolidated statement of changes in
shareholders’ equity is included in the consolidated income statement for the year.
Loans whose terms have been renegotiated are no longer considered to be past due but are treated as new loans. Restructuring policies and
practices are based on indicators or criteria, which indicate that payment will most likely continue. The loans continue to be subject to an
individual or collective impairment assessment, calculated using the loan’s original effective special commission rate.
Loans and advances are generally renegotiated either as part of an ongoing customer relationship or in response to an adverse change in the
circumstances of the borrower. In the latter case, renegotiation can result in an extension of the due date of payment or repayment plans under
which the Group offers a revised rate of special commission to genuinely distressed borrowers. This results in the asset continuing to be
overdue and individually impaired as the renegotiated payments of special commission and principal do not recover the original carrying
amount of the loan. In other cases, renegotiation lead to a new agreement, this is treated as a new loan. Restructuring policies and practices are
based on indicators or criteria which, indicate that payment will most likely continue. The loans continue to be subject to an individual or
collective impairment assessment, calculated using the loan’s original effective special commission rate.
In the case of debt instruments classified as available for sale, Management assesses individually whether there is objective evidence of
impairment based on the same criteria as financial assets carried at amortised cost. However, the amount recorded for impairment is the
cumulative loss measured as the difference between the amortised cost and the current fair value, less any impairment loss on that investment
previously recognised in the consolidated income statement.
The Group, in the ordinary course of business, acquires certain real estate against settlement of due loans and advances. Such real estate assets
are considered as assets held for sale and are initially stated at the lower of net realisable value of due loans and advances and the current fair
value of the related properties, less any costs to sell (if material). No depreciation is charged on such real estate assets. Rental income from
other real estate is recognised in the consolidated income statement. Subsequent to initial recognition, any subsequent write down to fair value,
less costs to sell, are charged to the consolidated income statement. Any subsequent revaluation gain in the fair value less costs to sell these
assets to the extent this does not exceed the cumulative write down is recognised in the consolidated income statement. Gains or losses on
disposal are recognised in the consolidated income statement.
16
NOTES TO THE CONSOLIDATED FINANCIAL STATEMENTSFor the year ended December 31, 2017
o) Property and equipment
Buildings 33 years
Leasehold improvements Over the shorter of lease period or economic useful life i.e 5 years
3 to 10 years
p) Financial Liabilities
q) Financial guarantees and loan commitments
r) Provisions
s) Accounting for leases
All assets are reviewed for impairment whenever events or changes in circumstances indicate that the carrying amount may not be recoverable.
Any carrying amount is written down immediately to its recoverable amount if the asset’s carrying amount is greater than its estimated
recoverable amount.
Furniture and fixtures, computer hardware and
software and motor vehicles
Gains and losses on disposals are determined by comparing proceeds with carrying amount. These are included in the consolidated income
statement.
All money market deposits, customer deposits, subordinated debts and other debt securities in issue are initially recognised at fair value less
transaction costs. Financial liabilities classified as FVIS are recognised initially at fair value and transaction costs are taken directly to the
consolidated income statement. Subsequently all financial liabilities other than those held at FVIS or where fair values have been hedged are
measured at amortised cost. Amortised cost is calculated by taking into account any discount or premium. Premiums are amortised and
discounts accreted on an effective special commission rate method to maturity and taken to special commission expense.
Financial liabilities in an effective fair value hedge relationship are adjusted for fair value changes to the extent of the risk being hedged. The
resultant gain or loss is recognised in the consolidated income statement. For financial liabilities carried at amortised cost, any gain or loss is
recognised in the consolidated income statement when derecognised.
Leases entered into by the Group as a lessee are all operating leases. A lease is classified as a finance lease if it transfers substantially all the
risks and rewards incidental to ownership of an underlying asset. Otherwise a lease is classified as an operating lease. A lessor recognises
operating lease payments as income on a straight-line basis or, if more representative of the pattern in which benefit from use of the underlying
asset is diminished, another systematic basis.
In the ordinary course of business, the Group issues financial guarantees, letters of credit and acceptances. A financial guarantee contract is a
contract that requires the issuer to make specified payments to reimburse the holder for the loss it incurs because a specified debtor fails to
make payment when due in accordance with the original or modified terms of a debt arrangement. Financial guarantees are initially recognised
in the consolidated financial statements at fair value in other liabilities, being the value of the premium received. Subsequent to the initial
recognition, the Group's liability under each guarantee is measured at the higher of the unamortised premium and the best estimate of
expenditure required to settle any financial obligations arising as a result of guarantees. Any increase in the liability relating to the financial
guarantee is taken to the consolidated income statement in ''impairment charge for credit losses, net''. The premium received is recognised in
the consolidated income statement in ''fees and commission income, net'' on a straight line basis over the life of the guarantee. Loan
commitments are firm commitments to provide credit under pre-specified terms and conditions.
For assets excluding goodwill, an assessment is made at each reporting date as to whether there is any indication that previously recognised
impairment losses may no longer exist or may have decreased. If such indication exists, the Group estimates the asset’s or CGU’s recoverable
amount. A previously recognised impairment loss is reversed only if there has been a change in the assumptions used to determine the asset’s
recoverable amount since the last impairment loss was recognised. The reversal is limited so that the carrying amount of the asset does not
exceed its recoverable amount, nor exceeds the carrying amount that would have been determined, net of depreciation, had no impairment loss
been recognised for the asset in prior years. Such reversal is recognised in the consolidated income statement. Impairment loss recognized
against the goodwill is not reversed subsequently.
Provisions are recognised when management can reliably estimate a present legal or constructive obligation as a result of past events and it is
more likely than not that an outflow of resources will be required to settle the obligation.
Financial liabilities are designated as FVIS on initial recognition if doing so significantly reduces measurement inconsistencies which would
otherwise arise. After initial recognition these liabilities are measured at fair value and the resulting gain or loss is included in the consolidated
income statement.
Property and equipment are measured at cost less accumulated depreciation and accumulated impairment loss. Freehold land is not
depreciated. Changes in the expected useful life are accounted for by changing the period or method, as appropriate, and treated as changes in
accounting estimates. The residual values and useful lives of assets are reviewed, and adjusted if appropriate, at each reporting date. The cost
of other items property and equipment is depreciated / amortised on the straight-line method over the estimated useful lives of the assets as
follows:
17

NOTES TO THE CONSOLIDATED FINANCIAL STATEMENTSFor the year ended December 31, 2017
t) Cash and cash equivalents
u) Derecognition of financial instruments
v) Share based plan transactions
w) End of service benefits
x) Short term employee benefits
y) Zakat and income tax
z) Investment management services
aa) Non-special commission based banking products
The Group's share plan is classified as an equity settled plan. The fair value of shares which the Group expects will eventually vest is
determined at the grant date and is expensed on a straight line basis over the vesting period with corresponding increase in share based plan
reserve. Details regarding the plan and determination of the fair value are set out in note 37.
When an operating lease is terminated before the lease period has expired, any penalty required to be paid to the lessor is recognised as an
expense in the period in which termination takes place.
A financial asset (or a part of a financial asset, or a part of a group of similar financial assets) is derecognised, when contractual rights to
receive the cash flows from the financial asset expire or the asset is transferred and the transfer qualifies for de-recognition. In instances where
the Group is assessed to have transferred a financial asset, the asset is derecognised if the Group has transferred substantially all the risks and
rewards of ownership. Where the Group has neither transferred nor retained substantially all the risks and rewards of ownership, the financial
asset is derecognised only if the Group has not retained control of the financial asset. The Group recognises separately as assets or liabilities
any rights and obligations created or retained in the process.
At each reporting date, management revises its estimates of the number of equity instruments expected to vest. The impact of the revision of
the original estimates, if any, is recognised in the consolidated income statement over the remaining vesting period, with a corresponding
adjustment to the share base plan reserve.
For the purpose of the consolidated statement of cash flows, “cash and cash equivalents” include notes and coins on hand, balances with
SAMA excluding statutory deposit, and due from banks and other financial institutions with original maturity of three months or less which
are subject to insignificant risk of changes in their fair value.
A financial liability or a part of a financial liability can only be derecognised when it is extinguished, that is when the obligation specified in
the contract is either discharged, cancelled or expires.
Benefits payable to the employees of the Group at the end of their services are accrued based on actuarial valuation in accordance with Saudi
Arabian Labor laws. These are included in other liabilities in the consolidated statement of financial position.
Zakat is computed on the Saudi shareholders’ share of Zakat base or adjusted net income using the basis defined under the Zakat regulations.
Income taxes are computed on the foreign shareholders' share of adjusted net income for the year. Zakat and income tax are accrued on a
quarterly basis and charged to consolidated statement of changes in shareholders' equity with a corresponding liability to be recognized in
consolidated statement of financial position.
The Group offers investment services to its customers through its subsidiary AI. The services include the management of certain investment
funds in consultation with professional investment advisors. The Group’s share of these funds is included in available-for-sale investments and
fees earned are disclosed under related parties' transactions.
Assets held in trust or in a fiduciary capacity are not treated as assets of the Group and accordingly are not included in the consolidated
financial statements.
Short term employee benefits are measured on a undiscounted basis and is expensed as the related service is provided. A liability is recognized
for the amount expected to be paid under short term cash bonus or profit sharing plans if the Group has a present legal or constructive
obligation to pay this amount as a result of past service provided by the employee and the obligation can be estimated reliably.
All non-special commission based banking products are included in loans and advances, customers' deposits and due from and to banks and
other financial institutions and are in conformity with the related accounting policies described in these consolidated financial statements.
In addition to conventional banking, the Group also offers its customers certain non-special commission based banking products, which are
approved by its independent Shariah Board, as follows:
18
NOTES TO THE CONSOLIDATED FINANCIAL STATEMENTSFor the year ended December 31, 2017
High level definitions of non-special commission based products:
(ii) Ijarah is an agreement whereby the Group, acting as a lessor, purchases or constructs an asset for lease according to the customer request
(lessee), based on his promise to lease the asset for an agreed rent and specific period that could end by transferring the ownership of the leased
asset to the lessee.
(iii) Musharaka is an agreement between the Group and a customer to contribute to a certain investment enterprise or the ownership of a
certain property ending up with the acquisition by the customer of the full ownership. The profit or loss is shared as per the terms of the
agreement.
(iv) Tawaruq is a form of Murabaha transactions where the Group purchases a commodity and sells it to the customer. The customer sells the
underlying commodity at spot and uses the proceeds for his financing requirements.
(i) Murabaha is an agreement whereby the Group sells to a customer a commodity or an asset, which the Group has purchased and acquired
based on a promise received from the customer to buy. The selling price comprises the cost plus an agreed profit margin.
19

Amounts in SAR’000
4
2017 2016
876,270 767,363
145,524 123,532
Balances with SAMA:
4,106,211 4,427,484
10,009,000 2,169,000 ─────── ───────
Total 15,137,005 7,487,379
═══════ ═══════
5 DUE FROM BANKS AND OTHER FINANCIAL INSTITUTIONS
2017 2016
914,899 428,893
1,200,372 595,476 ─────── ───────
Total 2,115,271 1,024,369
═══════ ═══════
2017 2016
2,103,319 1,015,728
11,952 8,641 ─────── ───────
Total 2,115,271 1,024,369 ═══════ ═══════
6 INVESTMENTS, NET
a) Investments are classified as follows:
2017 2016 2017 2016 2017 2016
169,795 169,352 - - 169,795 169,352
4,330 142,410 - - 4,330 142,410
153,347 151,227 - - 153,347 151,227 ─────── ─────── ─────── ─────── ─────── ───────
Total available-for-sale, net 327,472 462,989 - - 327,472 462,989 ─────── ─────── ─────── ─────── ─────── ───────
2017 2016 2017 2016 2017 2016
ii) Other investments held at amortised cost
8,000,584 12,936,357 38,223 342,751 8,038,807 13,279,108
7,697,028 7,011,349 565,289 443,261 8,262,317 7,454,610 ──────── ─────── ──────── ─────── ──────── ───────
Total other investments held at amortised cost 15,697,612 19,947,706 603,512 786,012 16,301,124 20,733,718 ──────── ─────── ──────── ─────── ──────── ───────
iii) Held to maturity 2017 2016 2017 2016 2017 2016
- 1,640 - - - 1,640
- - 60,151 60,151 60,151 60,151 ─────── ─────── ─────── ─────── ─────── ───────
Total held to maturity - 1,640 60,151 60,151 60,151 61,791 ─────── ─────── ─────── ─────── ─────── ───────
Total investments, net 16,025,084 20,412,335 663,663 846,163 16,688,747 21,258,498 ════════ ════════ ════════ ════════ ════════ ════════
i) Available- for- sale, net
International
Floating rate securities
Equities reported under available for sale investments include unquoted shares of SAR 4.3 million (2016: SAR 3.4 million) that are carried at cost which approximates the
fair value of these investments.
Floating rate securities
Mutual funds
Domestic
Fixed rate securities
Total
Fixed rate securities
Floating rate securities
Equities
CASH AND BALANCES WITH SAMA
In accordance with the requirements of the Banking Control Law and Regulations issued by SAMA, the Group is required to maintain a statutory deposit with SAMA at
stipulated percentages of its demand, savings, time and other deposits, calculated at the end of each month. The statutory deposit with SAMA is not available to finance the
Group’s day-to-day operations and therefore does not form part of cash and cash equivalents (note-27).
International Total
Current accounts
Money market placements
Cash in hand
- Statutory deposit
- Reverse repo with SAMA
Domestic
Current accounts
The credit quality of due from banks and other financial institutions is managed using credit ratings from reputable external credit rating agencies. The table below shows
the credit quality of balances due from banks and other financial institutions.
Investment grade (credit rating AAA to BBB-)
Unrated
Domestic International Total
NOTES TO THE CONSOLIDATED FINANCIAL STATEMENTSFor the year ended December 31, 2017
20

Amounts in SAR’000
NOTES TO THE CONSOLIDATED FINANCIAL STATEMENTSFor the year ended December 31, 2017
b) Investments reclassification
Carrying
value Fair value
Carrying
value Fair value
- - 65,725 64,860 ═══════ ═══════ ═══════ ═══════
c) The composition of investments is as follows:
Quoted Unquoted Total Quoted Unquoted Total
242,306 7,796,501 8,038,807 344,335 12,936,413 13,280,748
325,189 8,167,074 8,492,263 756,511 6,927,602 7,684,113
- 4,330 4,330 138,972 3,438 142,410
153,347 - 153,347 151,227 - 151,227 ──────── ──────── ──────── ──────── ──────── ────────
Total investments, net 720,842 15,967,905 16,688,747 1,391,045 19,867,453 21,258,498 ════════ ════════ ════════ ════════ ════════ ════════
Carrying
value
Gross
unrealised
gains
Gross
unrealised
losses
Fair
value
Carrying
value
Gross
unrealised
gains
Gross unrealised
losses
Fair
value
Fixed-rate securities 8,038,807 8,423 (89,232) 7,957,998 13,279,108 14,302 (74,743) 13,218,667
Floating rate securities 8,262,317 22,510 (17,944) 8,266,883 7,454,610 26,219 (866) 7,479,963 ──────── ──────── ──────── ──────── ──────── ──────── ──────── ────────
Total 16,301,124 30,933 (107,176) 16,224,881 20,733,718 40,521 (75,609) 20,698,630 ════════ ════════ ════════ ════════ ════════ ════════ ════════ ════════
Carrying
value
Gross
unrealised
gains
Gross
unrealised
losses
Fair
value
Carrying
value
Gross
unrealised
gains
Gross unrealised
losses
Fair
value
ii) Held to maturity
Fixed-rate securities - - - - 1,640 12 - 1,652
Floating rate securities 60,151 - (99) 60,052 60,151 - (1,730) 58,421 ─────── ─────── ─────── ─────── ─────── ─────── ─────── ───────
Total 60,151 - (99) 60,052 61,791 12 (1,730) 60,073 ═══════ ═══════ ═══════ ═══════ ═══════ ═══════ ═══════ ═══════
e) The analysis of investments by counter-party is as follows:
2017 2016
13,552,992 18,108,293
1,907,080 1,719,768
1,070,998 1,275,772
157,677 154,665 ──────── ───────
Total investments, net 16,688,747 21,258,498 ════════ ═══════
i) Other investments
held at amortised cost
2017
Management identified certain AFS investments, for which at July 1, 2008, it had a clear intention to hold the instruments for the foreseeable future rather than to exit or
trade in the short term. As a result those instruments were reclassified at that date from AFS to other investments held at amortised cost at fair value. The investments were
fully matured during the year and a loss of SAR 0.43 million (2016: SAR 1.15 Million) was transferred to the consolidated income statement being the amortization of AFS
reserve created at the time of reclassification. The following table shows carrying values and fair values of the reclassified investments for the comparative period.
2016
2017 2016
Available for sale securities reclassified to other investments held at amortised cost
──────────────── ────────────────
Unquoted securities principally comprise of Saudi Government Bonds and floating rate notes. Such securities are traded in the inter-bank market within Saudi Arabia and
values are determined according to an appropriate pricing model.
Fixed rate securities
Floating rate securities
Equities
Others
Other investments held at amortized cost amounting to SAR 8 million (2016: SAR 638 million) are pledged under repurchase agreements with customers. The market value
of these investments is SAR 8 million (2016: SAR 638 million).
Mutual funds
d) The analysis of unrealised gains and losses and fair values of other investments held at amortised cost and held to maturity are as follows:
Government and quasi-government
Corporates
Banks and other financial institutions
2017 2016 ───────────────────────────────────── ─────────────────────────────────────
──────────────────────────── ────────────────────────────
21
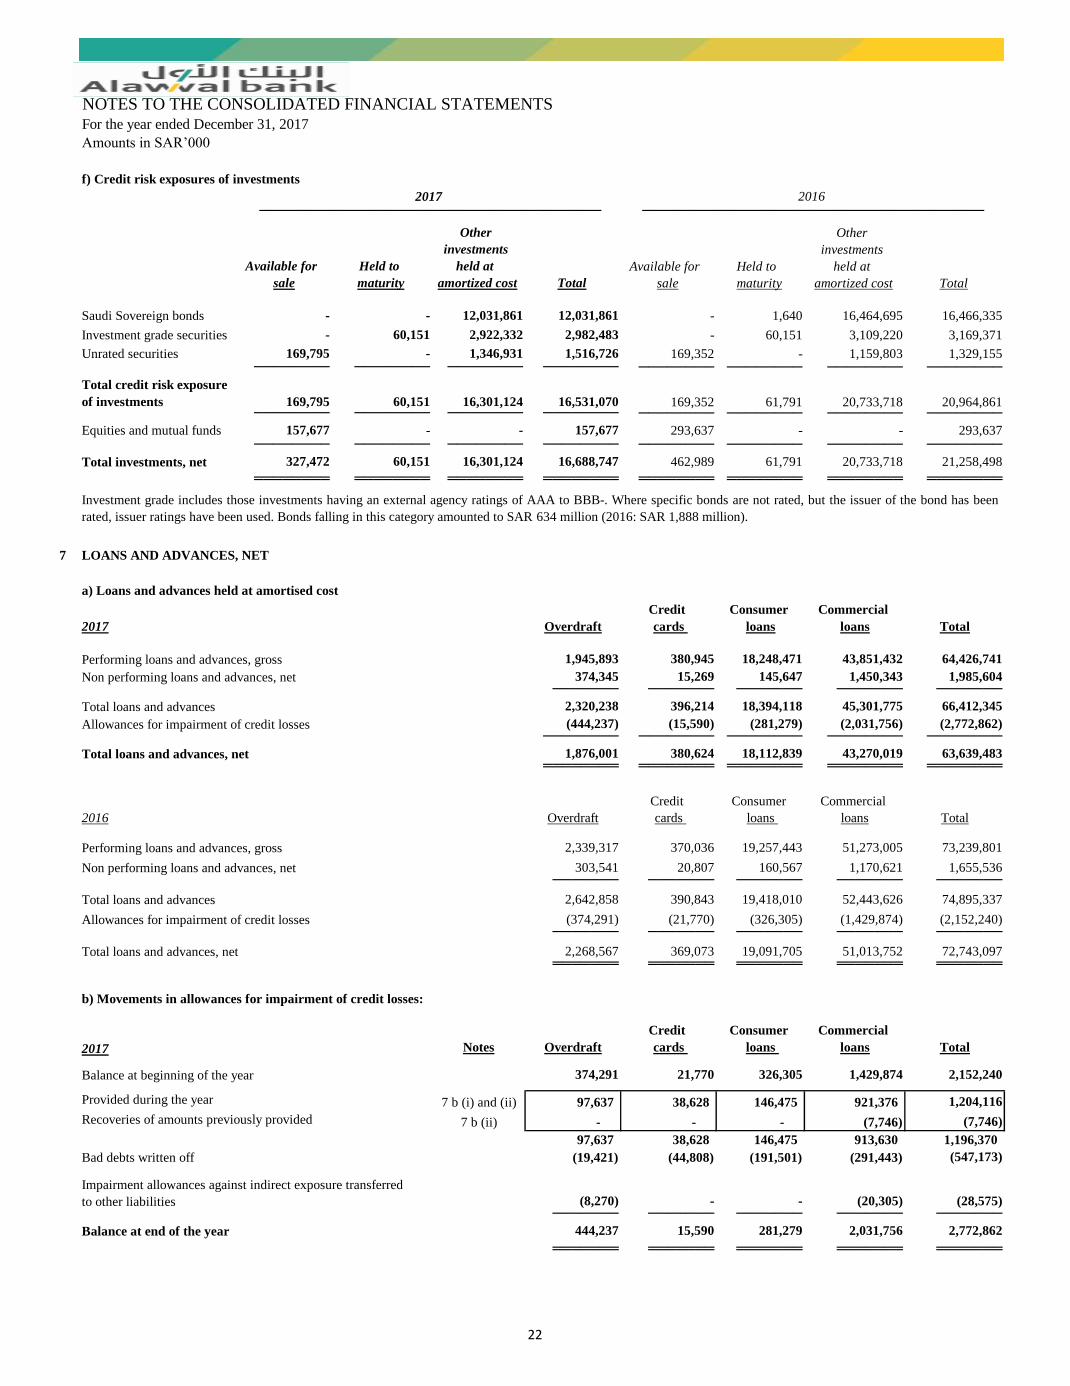
Amounts in SAR’000
NOTES TO THE CONSOLIDATED FINANCIAL STATEMENTSFor the year ended December 31, 2017
Available for
sale
Held to
maturity
Other
investments
held at
amortized cost Total
Available for
sale
Held to
maturity
Other
investments
held at
amortized cost Total
Saudi Sovereign bonds - - 12,031,861 12,031,861 - 1,640 16,464,695 16,466,335
Investment grade securities - 60,151 2,922,332 2,982,483 - 60,151 3,109,220 3,169,371
Unrated securities 169,795 - 1,346,931 1,516,726 169,352 - 1,159,803 1,329,155 ──────── ──────── ──────── ──────── ──────── ──────── ──────── ────────
Total credit risk exposure
of investments 169,795 60,151 16,301,124 16,531,070 169,352 61,791 20,733,718 20,964,861 ──────── ──────── ──────── ──────── ──────── ──────── ──────── ────────
Equities and mutual funds 157,677 - - 157,677 293,637 - - 293,637 ──────── ──────── ──────── ──────── ──────── ──────── ──────── ────────
Total investments, net 327,472 60,151 16,301,124 16,688,747 462,989 61,791 20,733,718 21,258,498
════════ ════════ ════════ ════════ ════════ ════════ ════════ ════════
7
a) Loans and advances held at amortised cost
2017 Overdraft
Credit
cards
Consumer
loans
Commercial
loans Total
1,945,893 380,945 18,248,471 43,851,432 64,426,741
374,345 15,269 145,647 1,450,343 1,985,604 ─────── ─────── ─────── ─────── ───────
2,320,238 396,214 18,394,118 45,301,775 66,412,345
(444,237) (15,590) (281,279) (2,031,756) (2,772,862) ──────── ──────── ──────── ──────── ────────
1,876,001 380,624 18,112,839 43,270,019 63,639,483 ════════ ════════ ════════ ════════ ════════
2016 Overdraft
Credit
cards
Consumer
loans
Commercial
loans Total
2,339,317 370,036 19,257,443 51,273,005 73,239,801
303,541 20,807 160,567 1,170,621 1,655,536 ─────── ─────── ─────── ─────── ───────
2,642,858 390,843 19,418,010 52,443,626 74,895,337
(374,291) (21,770) (326,305) (1,429,874) (2,152,240) ─────── ─────── ─────── ─────── ───────
2,268,567 369,073 19,091,705 51,013,752 72,743,097 ═══════ ═══════ ═══════ ═══════ ═══════
b) Movements in allowances for impairment of credit losses:
2017 Notes Overdraft
Credit
cards
Consumer
loans
Commercial
loans Total
374,291 21,770 326,305 1,429,874 2,152,240
7 b (i) and (ii) 97,637 38,628 146,475 921,376 1,204,116
7 b (ii) - - - (7,746) (7,746)
97,637 38,628 146,475 913,630 1,196,370
(19,421) (44,808) (191,501) (291,443) (547,173)
(8,270) - - (20,305) (28,575) ─────── ─────── ─────── ─────── ───────
444,237 15,590 281,279 2,031,756 2,772,862
═══════ ═══════ ═══════ ═══════ ═══════
2016 ───────────────────────────────────── ─────────────────────────────────────
Impairment allowances against indirect exposure transferred
to other liabilities
2017
Investment grade includes those investments having an external agency ratings of AAA to BBB-. Where specific bonds are not rated, but the issuer of the bond has been
rated, issuer ratings have been used. Bonds falling in this category amounted to SAR 634 million (2016: SAR 1,888 million).
Non performing loans and advances, net
f) Credit risk exposures of investments
LOANS AND ADVANCES, NET
Performing loans and advances, gross
Total loans and advances
Allowances for impairment of credit losses
Total loans and advances, net
Balance at beginning of the year
Provided during the year
Bad debts written off
Recoveries of amounts previously provided
Balance at end of the year
Performing loans and advances, gross
Non performing loans and advances, net
Total loans and advances
Allowances for impairment of credit losses
Total loans and advances, net
22

Amounts in SAR’000
NOTES TO THE CONSOLIDATED FINANCIAL STATEMENTSFor the year ended December 31, 2017
2016 Notes Overdraft
Credit
cards
Consumer
loans
Commercial
loans Total
332,538 7,889 178,627 855,986 1,375,040
7 b (i) and (ii) 110,137 31,500 294,206 833,293 1,269,136
7 b (ii) (3,478) - - (28,706) (32,184)
106,659 31,500 294,206 804,587 1,236,952
(64,906) (17,619) (146,528) (162,819) (391,872)
- - - (67,880) (67,880)
─────── ─────── ─────── ─────── ───────
374,291 21,770 326,305 1,429,874 2,152,240 ═══════ ═══════ ═══════ ═══════ ═══════
7 b (ii) Impairment charge for credit losses, net 2017 2016
Impairment charge for credit losses 1,204,116 1,269,136
Less: Recoveries of amounts previously provided (7,746) (32,184)
Recoveries of amounts previously written-off (76,071) (69,563) ─────── ───────
1,120,299 1,167,389 ═══════ ═══════
c) Credit quality of loans and advances
i) Loans and advances neither past due nor impaired
2017 Overdraft
Credit
cards
Consumer
loans
Commercial
loans Total
Strong 9,800 - - 6,894,234 6,904,034
Satisfactory 1,758,940 346,320 17,598,009 34,986,344 54,689,613
Watch 171,556 - - 1,786,844 1,958,400 ─────── ─────── ─────── ─────── ───────
1,940,296 346,320 17,598,009 43,667,422 63,552,047
═══════ ═══════ ═══════ ═══════ ═══════
2016
Strong 69,141 - - 7,842,235 7,911,376
Satisfactory 2,061,727 330,652 18,485,875 42,078,834 62,957,088
Watch 145,559 - - 666,992 812,551 ─────── ─────── ─────── ─────── ───────
2,276,427 330,652 18,485,875 50,588,061 71,681,015 ═══════ ═══════ ═══════ ═══════ ═══════
ii) Ageing of past due but not impaired loans and advances
2017 Overdraft
Credit
cards
Consumer
loans
Commercial
loans Total
Up to 30 days 4,979 25,323 506,958 88,470 625,730
19 9,302 143,504 18,402 171,227
599 - - 77,138 77,737 ─────── ─────── ─────── ─────── ───────
Total 5,597 34,625 650,462 184,010 874,694 ═══════ ═══════ ═══════ ═══════ ═══════
Above 90 days
Recoveries of amounts previously provided
Balance at beginning of the year
Provided during the year
Loans and advances under the strong category are performing, have sound fundamental characteristics and include those that exhibit characteristics that are expected to
allow them to weather adverse business, financial or economic conditions without materially impairing the obligor’s ability to meet its commitments.
Loans and advances under the satisfactory category are loans where borrowers are capable to meet their financial obligations and are expected to remain able to do so in the
medium term. However, unexpected adverse business, financial or economic conditions could impair the obligor’s ability to meet its commitments in future.
The watch category includes loans and advances that are performing, current and up-to date in terms of principal and special commission payments. However, the obligors
require close management attention as their ability to meet their financial commitments has deteriorated and currently exhibits vulnerability to default or non-payment.
Such borrowers may be dependent upon more favorable business, financial, and economic conditions to meet their financial commitments in full and on time.
From 31 days to 90 days
Total
Total
Bad debts written-off
Balance at end of the year
7 b (i) Impairment charge for the year includes charge for collective impairment amounting to SAR 185 million (2016: SAR 302 million).
Total impairment charge for credit losses, net
Impairment allowances against indirect exposure transferred
to other liabilities
The Group has categorised the loans and advances portfolio that is neither past due nor impaired into three sub categories according to its internal rating system, i.e. strong,
satisfactory and watch.
23

Amounts in SAR’000
NOTES TO THE CONSOLIDATED FINANCIAL STATEMENTSFor the year ended December 31, 2017
2016 Overdraft
Credit
cards
Consumer
loans
Commercial
loans Total
Up to 30 days 29,187 26,411 615,314 265,941 936,853
From 31 days to 90 days 20,875 12,973 156,254 164,628 354,730
12,828 - - 254,375 267,203 ─────── ─────── ─────── ─────── ───────
Total 62,890 39,384 771,568 684,944 1,558,786 ═══════ ═══════ ═══════ ═══════ ═══════
Performing
Non
performing
Allowances
for impairment
of credit losses
Loans and
advances, net
1,003,218 - - 1,003,218
1,125,709 - - 1,125,709
751,622 304 (304) 751,622
10,401,382 374,748 (374,748) 10,401,382
1,406,932 7,193 (7,193) 1,406,932
8,943,814 909,639 (709,607) 9,143,846
13,330,292 454,562 (432,245) 13,352,609
2,475,835 7,654 (7,654) 2,475,835
3,404,209 68,413 (68,413) 3,404,209
18,629,416 160,916 (104,276) 18,686,056
2,954,312 2,175 (2,175) 2,954,312 ──────── ──────── ──────── ────────
64,426,741 1,985,604 (1,706,615) 64,705,730
- - (1,066,247) (1,066,247) ──────── ──────── ──────── ────────
Total 64,426,741 1,985,604 (2,772,862) 63,639,483 ═══════ ═══════ ═══════ ═══════
Performing
Non
performing
Allowances
for impairment
of credit losses
Loans and
advances, net
1,149,699 - - 1,149,699
2,044,140 - - 2,044,140
722,426 654 (654) 722,426
12,282,007 285,590 (270,590) 12,297,007
1,973,663 92,957 (92,957) 1,973,663
9,724,878 709,891 (411,709) 10,023,060
16,253,841 308,781 (308,781) 16,253,841
2,765,637 6,737 (6,737) 2,765,637
3,610,316 69,552 (69,552) 3,610,316
19,627,479 181,374 (110,323) 19,698,530
3,085,715 - - 3,085,715 ─────── ─────── ─────── ───────
73,239,801 1,655,536 (1,271,303) 73,624,034
- - (880,937) (880,937) ─────── ─────── ─────── ───────
Total 73,239,801 1,655,536 (2,152,240) 72,743,097 ═══════ ═══════ ═══════ ═══════
e) Collateral
Past due but not impaired loans and advances provided above comprise of total loan values except for overdraft and commercial loans which comprise overdue instalment
amounts. Overdraft and commercial total loans and advances past due but not impaired at December 31, 2017 amounted to SAR 1,655.98 million (2016: SAR 2,913.40
million).
2017
d) Economic sector risk concentration for loans and advances and allowances for impairment of credit losses are as follows:
Above 90 days
Government and quasi-government
Banks and other financial institutions
Loans and advances, include Islamic products amounting to SAR 43 billion (2016: SAR 50 billion).
Electricity, water, gas and health services
Commerce
Transportation and communication
Services
The Group, in the ordinary course of its lending activities holds collaterals to mitigate the associated credit risk. These mostly consists of time, demand and other cash
deposits, financial guarantees, local and international equities, real estate and other fixed assets. Collaterals are mainly held against commercial and consumer loans and are
managed against relevant exposures at their net realisable value. Total collateral fair value at December 31, 2017 amounted to SAR 26.2 billion (2016: SAR 30.68 billion).
2016
Consumer loans and credit cards
Building and construction
Commerce
Transportation and communication
Services
Portfolio impairment allowance
Government and quasi-government
Banks and other financial institutions
Others
Agriculture and fishing
Manufacturing
Electricity, water, gas and health services
Building and construction
Agriculture and fishing
Manufacturing
Portfolio impairment allowance
Others
Consumer loans and credit cards
24

Amounts in SAR’000
NOTES TO THE CONSOLIDATED FINANCIAL STATEMENTSFor the year ended December 31, 2017
8
2017 2016
35,697 12,567
Additional investment made during the year - 20,000
9,810 3,130 ─────── ───────
Balance at end of the year 45,507 35,697═══════ ═══════
9
2017
Land and
buildings
Leasehold
improvements Softwares
Computer
hardware
Furniture /
fixtures
Motor
vehicles
Capital work
in progress
(CWIP) Total
Cost:
Balance at beginning of the
year 783,825 317,715 635,707 422,406 282,304 5,351 244,989 2,692,297
Additions during the year - - - - - - 231,177 231,177
Transfers from CWIP
during the year 21,546 90,869 102,706 78,036 59,537 - (352,694) - ─────── ─────── ─────── ─────── ─────── ─────── ─────── ───────
Balance at end of the year 805,371 408,584 738,413 500,442 341,841 5,351 123,472 2,923,474 ─────── ─────── ─────── ─────── ─────── ─────── ─────── ───────
Balance at beginning of the
year 59,861 291,441 448,564 413,696 193,357 4,355 - 1,411,274
Charge for the year 11,992 15,328 78,862 26,960 31,659 390 - 165,191 ─────── ─────── ─────── ─────── ─────── ─────── ─────── ───────
Balance at end of the year 71,853 306,769 527,426 440,656 225,016 4,745 - 1,576,465 ─────── ─────── ─────── ─────── ─────── ─────── ─────── ───────
Net book value as
at December 31, 2017 733,518 101,815 210,987 59,786 116,825 606 123,472 1,347,009 ═══════ ═══════ ═══════ ═══════ ═══════ ═══════ ═══════ ═══════
2016
Land and
buildings
Leasehold
improvements Softwares
Computer
hardware
Furniture /
fixtures
Motor
vehicles
Capital work
in progress
(CWIP) Total
Cost:Balance at beginning of the
year 396,715 317,715 563,737 408,746 226,405 5,533 172,335 2,091,186
Additions during the year 387,110 - - - - - 216,351 603,461
Disposal during the year - - - (2,162) (6) (182) - (2,350)
Transfers from CWIP
during the year - - 71,970 15,822 55,905 - (143,697) - ─────── ─────── ─────── ─────── ─────── ─────── ─────── ───────
Balance at end of the year 783,825 317,715 635,707 422,406 282,304 5,351 244,989 2,692,297 ─────── ─────── ─────── ─────── ─────── ─────── ─────── ───────
Accumulated depreciation / amortisation:
Balance at beginning of the
year 57,185 279,587 372,292 397,081 180,009 3,986 - 1,290,140
Charge for the year 2,676 11,854 76,272 17,337 13,349 551 - 122,039
Disposal during the year - - - (722) (1) (182) - (905) ─────── ─────── ─────── ─────── ─────── ─────── ─────── ───────
Balance at end of the year 59,861 291,441 448,564 413,696 193,357 4,355 - 1,411,274 ─────── ─────── ─────── ─────── ─────── ─────── ─────── ───────
Net book value as at
December 31, 2016 723,964 26,274 187,143 8,710 88,947 996 244,989 1,281,023 ═══════ ═══════ ═══════ ═══════ ═══════ ═══════ ═══════ ═══════
PROPERTY AND EQUIPMENT, NET
Share in earning of an associate
Balance at beginning of the year
INVESTMENT IN AN ASSOCIATE
Investment in an associate represents a 20% (2016: 20%) shareholding in Wataniya Insurance Company (WIC) formed in the Kingdom of Saudi Arabia, pursuant to Royal
Decree No. M/53 dated Shawwal 21, 1430H (corresponding to October 10, 2009). During the year 2016, one-for-one right issue was made by WIC which was fully
subscribed by the Bank and resulted in total cost of the investments to reach SAR 40 million.
Property and equipment details are as follows:
Accumulated depreciation / amortisation:
25

Amounts in SAR’000
NOTES TO THE CONSOLIDATED FINANCIAL STATEMENTSFor the year ended December 31, 2017
10 OTHER ASSETS, NET
2017 2016
(Restated)
612,665 646,787
Others 71,925 119,425 ─────── ───────
Total 684,590 766,212═══════ ═══════
11 DERIVATIVES
a) Swaps
d) Options
c) Forward-rate agreements
Forward-rate agreements are individually negotiated commission rate contracts that call for a cash settlement of the difference between a contracted commission rate and
the market rate on a specified future date on a notional principal for an agreed period of time.
Options are contractual agreements under which the seller (writer) grants the purchaser (holder) the right, but not the obligation, to either buy or sell at a fixed future date or
at any time during a specified period a specified amount of a currency, commodity or financial instrument at a pre-determined price.
Most of the Group’s derivative trading activities relate to sales, positioning and arbitrage. Sales activities involve offering products to customers and banks in order to inter
alia, enable them to transfer, modify or reduce current and future risks. Positioning involves managing market risk positions with the expectation of profiting from
favourable movements in prices, rates or indices. Arbitrage involves identifying price differentials between markets or products with the expectation of profiting.
Accounts receivables, net
As at 31 December 2017, other assets of the Group included an amount of SAR 437.15 million (2016: SAR 437.15 million). This amount was originally disbursed to a
third party who defaulted on payment and the Management expects to recover this balance from a related party. The Group has reached a settlement agreement with the
related party for recovery of this amount. The Group has maintained an impairment allowance of SAR 149.91 million as at December 31, 2017 (2016: SAR 149.91 million)
against the outstanding balance due to uncertainty around the timing of recoverability of this balance.
In the ordinary course of business, the Group utilises the following derivative financial instruments for both trading and hedging purposes:
Swaps are commitments to exchange one set of cash flows for another. For commission rate swaps, counterparties generally exchange fixed and floating rate commission
payments in a single currency without exchanging principal. For cross-currency commission rate swaps, principal and fixed and floating commission payments are
exchanged in different currencies.
Forwards and futures are contractual agreements to either buy or sell a specified currency, commodity or financial instrument at a specified price and date in the future.
Forwards are customised contracts transacted in the over-the-counter market. Foreign currency and commission rate futures are transacted in standardised amounts on
regulated exchanges and changes in futures contract values are settled daily.
The Group uses commission rate swaps to hedge against the commission rate risk arising from specifically identified fixed commission rate exposures. The Group also uses
commission rate swaps to hedge against the cash flow risk arising on certain floating-rate exposures. In all such cases, the hedging relationship and objective, including
details of the hedged items and hedging instrument, are formally documented and the transactions are accounted for as fair value or cash flow hedges.
Derivatives held for trading purposes
Derivatives held for hedging purposes
The Group has adopted a comprehensive process for the measurement and management of risk. Part of the risk management process involves managing the Group’s
exposure to fluctuations in foreign exchange and special commission rates to acceptable levels as determined by the Board of Directors and management.
The Board of Directors has established risk appetite for market risks including currency and special commission rate risk. Management, through the Bank’s Asset and
Liability Committee, have established a framework of limits to ensure that risk is maintained within the appetite set by the Board. As part of its asset and liability
management process, positions are monitored regularly and the Group uses derivatives for hedging purposes in order to adjust its exposure to currency and special
commission rate risks. This is generally achieved by hedging specific transactions.
Cash flow hedges
b) Forwards and futures
The Group is exposed to variability in future commission cash flows on non-trading assets and liabilities which bear commission at a variable rate. The Group uses
commission rate swaps as cash flow hedges of these commission rate risks. Also, as a result of firm commitments in foreign currencies, such as its issued foreign currency
debt, the Group is exposed to foreign exchange and commission rate risks which are hedged with cross currency commission rate swaps. Below is the schedule indicating
as at 31 December, the periods when the hedged cash flows are expected to occur and when they are expected to affect the consolidated income statement:
26

Amounts in SAR’000
NOTES TO THE CONSOLIDATED FINANCIAL STATEMENTSFor the year ended December 31, 2017
2017 2017 2016
Cash inflows (assets) 8,366 7,062
Cash out flows (liabilities) (14,569) (7,071) ─────── ───────
Net cash out flows (6,203) (9)═══════ ═══════
Derivative financial
instruments 2017
Positive
fair value
Negative
fair value
Notional
amount
total
Within
three
months
3-12
months
1-5
years
Over 5
years
Monthly
average
Special commission rate
swaps 125,130 53,192 31,843,039 864,120 3,791,360 24,713,833 2,473,726 29,836,618
Foreign exchange and
commodity forward
contracts 59,419 29,916 11,062,273 7,146,516 3,560,189 355,568 - 14,372,492
Currency and commodity
options 20,208 3,765 6,179,525 2,854,363 3,230,053 95,109 - 12,848,144
Special commission rate
options 7,461 3,871 2,121,768 - - - 2,121,768 2,242,809
-
Special commission rate
swaps - 366 37,500 - - 37,500 - 37,502
Special commission rate
swaps - 569 4,196,137 4,196,137 - - - 2,598,801
─────── ─────── ──────── ──────── ──────── ──────── ────────
Total 212,218 91,679 55,440,242 15,061,136 10,581,602 25,202,010 4,595,494 ═══════ ═══════ ═══════ ═══════ ═══════
Fair values of netting
arrangements 843,727 843,727 ─────── ───────
Fair values before netting 1,055,945 935,406 ═══════ ═══════
Special commission rate
swaps 116,100 50,653 25,076,726 410,841 2,802,459 19,319,854 2,543,572 28,269,978
Foreign exchange and
commodity forward
contracts 96,914 45,370 17,856,697 7,369,207 6,150,260 4,337,230 - 26,826,551
Currency and commodity
options 175,345 167,044 24,792,586 6,034,674 13,414,469 5,343,443 - 36,104,810
Special commission rate
options 5,420 3,638 1,021,720 - - - 1,021,720 898,710
Held as fair value hedges:
Special commission rate
swaps - 928 37,519 - - 37,519 - 37,510
Special commission rate
swaps - 3,160 5,103,617 5,103,617 - - - 2,870,892 ────── ────── ────── ────── ────── ────── ──────
Total 393,779 270,793 73,888,865 18,918,339 22,367,188 29,038,046 3,565,292 ═══════ ═══════ ═══════ ═══════ ═══════
Fair values of netting
arrangements 1,414,441 1,414,441 ─────── ───────
Fair values before netting 1,808,220 1,685,234 ═══════ ═══════
The net fair value of the derivatives is SAR 120.54 million (2016: SAR 122.99 million).
The schedule reflects special commission income cash flows expected to arise on the hedged items in cash flow hedges based on the repricing profile of the hedged assets
and liabilities.
Derivative financial instruments 2016
Held as cash flow hedges:
Notional amounts by maturity
Held as fair value hedges:
Within 1 year
Held as cash flow hedges:
Held for trading:
Held for trading:
27

Amounts in SAR’000
NOTES TO THE CONSOLIDATED FINANCIAL STATEMENTSFor the year ended December 31, 2017
Fair
value
Hedge
inception value Risk
Hedging
instruments
Positive
fair value
Negative
fair value
2017
40,249 37,504 Fair value
Special
commission
rate swaps - 366
3,035,372 3,026,186 Cash flow
Special
commission
rate swaps - 569
Fair
value
Hedge
inception value Risk
Hedging
instruments
Positive
fair value
Negative
fair value
2016
42,185 37,504 Fair value
Special
commission
rate swaps - 928
2,555,877 2,552,438 Cash flow
Special
commission
rate swaps - 3,160
12 DUE TO BANKS AND OTHER FINANCIAL INSTITUTIONS
2017 2016
Current accounts 422,838 638,336
2,921,833 709,396 ──────── ────────
Total 3,344,671 1,347,732═══════ ═══════
13 CUSTOMERS’ DEPOSITS 2017 2016
Time 47,387,509 51,208,243
Demand 29,370,600 31,752,853
Saving 403,046 463,904
Others 1,113,808 1,933,788 ──────── ────────
Total 78,274,963 85,358,788═══════ ═══════
Time deposits include:
8,000 638,000
ii) Islamic deposits 28,177,231 24,686,222
2017 2016
Time 5,331,353 3,985,231
Demand 2,494,703 3,218,274
Saving 26,877 34,833
Others 79,640 71,129 ──────── ────────
Total 7,932,573 7,309,467═══════ ═══════
Fixed special commission rate investments
Hedged items Hedging instruments
Description
The tables below shows a summary of hedged items, the nature of the risk being hedged, the hedging instrument and its fair value:
Fixed special commission rate deposits
The net gains on the hedging instruments held for fair value hedge are SAR 0.56 million (2016: SAR 0.54 million).
Description
Fixed special commission rate investments
Fixed special commission rate deposits
Money market deposits
Hedged items Hedging instruments
i) Deposits against repurchase agreements with customers
Customers' deposits include SAR 815 million (2016: SAR 1,665 million) of margins held for irrevocable commitments and other non-special commission based deposits
amounting to SAR 30 billion (2016: SAR 32 billion). Foreign currency deposits at December 31 are as follows:
Approximately 26.42% (2016: 19.2%) of the positive fair value of the Group’s derivatives are entered into with financial institutions and less than 9% (2016: 21.5%) of the
total positive fair value of the derivatives are with any single counterparty at the reporting date. Derivative activities are carried out by the Group’s treasury segment.
Margins placed with and received from counter parties for derivative instruments at December 31, 2017 amounted to SAR 38.06 million and SAR 23.21 million (2016:
SAR 62.51 million and SAR 74.64 million), respectively.
28

Amounts in SAR’000
NOTES TO THE CONSOLIDATED FINANCIAL STATEMENTSFor the year ended December 31, 2017
14
15
2017 2016
(Restated)
1,100,330 779,391
386,453 119,623
567,012 541,097 ──────── ────────
Total 2,053,795 1,440,111 ════════ ════════
16 SHARE CAPITAL
Percentage 2017 2016
60% 6,858,432 6,858,432
40% 4,572,288 4,572,288 ─────── ──────── ────────
Total 100% 11,430,720 11,430,720 ════════ ════════ ════════
17
18 OTHER RESERVES
2017 2016
41,147 (37,691)
(3,658) (4,178)
Net amounts transferred to consolidated income statement (24,360) 83,016 ─────── ───────
13,129 41,147 ═══════ ═══════
19
Issued on December 12, 2013:
Zakat and tax
As at December 31, 2017 and 2016, there were certain legal proceedings outstanding against the Group that arose in the normal course of business. No provision was raised
during the year (2016: Nil) as professional legal advice indicates that it is not probable that any further losses will arise with respect to these proceedings.
OTHER LIABILITIES
Saudi shareholders
The Group has capital commitments of SAR 40.6 million (2016: SAR 96.7 million) in respect of leasehold improvements and computer hardware and software purchases.
COMMITMENTS AND CONTINGENCIES
b) Capital commitments
Balance at end of the year
a) Legal proceedings
The authorised, issued and fully paid share capital consists of 1,143.07 million shares of SAR 10 each (2016: 1,143.07 million shares of SAR 10 each).
ABN AMRO Bank N.V
Net changes in fair value
The primary purpose of these instruments is to ensure that funds are available to customers as required.
Letters of guarantees and stand-by letters of credit, which represent irrevocable assurances that the Group will make payments in the event that a customer cannot meet its
obligations to third parties, carry the same credit risk as loans and advances. Cash requirements under guarantees and standby letters of credit are considerably less than the
amount of the commitment because the Group does not generally expect the third party to draw the full funds under the agreement.
c) Credit related commitments and contingencies
Others
Issued on November 26, 2012:
The Group issued SAR 1,400 million unsecured subordinated Tier II Sukuk which was due in 2019. The Group exercised the option of early redemption of these
certificates at their redemption amount in November 2017. The commission rate paid on the above averaged 6 months SIBOR plus 115 basis points (2016: 6 months
SIBOR plus 115 basis point). All the required approvals from regulatory authorities were obtained for the purpose of redemptions.
The ownership of the Bank’s share capital is as follows:
Balance at beginning of the year
In accordance with Saudi Arabian Banking Control Law and the Article of Association of the Bank, a minimum of 25% of the annual net income is required to be
transferred to a statutory reserve until this reserve equals the paid up share capital of the Bank. Accordingly, SAR 333.88 million (2016: SAR 266.18 million) has been
transferred from retained earnings to the statutory reserve.
Accrued expenses and accounts payable
STATUTORY RESERVE
The Group has not defaulted on any principal or commission repayments and there has been no breaches with regard to any of these liabilities during 2017 or 2016.
SUBORDINATED DEBT
Subordinated debt represents the following debt securities:
The Group issued SAR 2,500 million unsecured subordinated Tier II Sukuk which is due in 2023. The Group has the option, subject to the prior written approval of
SAMA, to redeem these Sukuk at their redemption amount in December 2018 or in the event of certain changes affecting the taxation and regulatory capital treatment of
these Sukuk. The commission rate paid on the above averaged 6 months SIBOR plus 155 basis points (2016: 6 months SIBOR plus 155 basis points).
29

Amounts in SAR’000
NOTES TO THE CONSOLIDATED FINANCIAL STATEMENTSFor the year ended December 31, 2017
3 to 12 1 to 5 Over 5
months Years Years Total
1,556,321 9,442,183 5,931,634 212,303 17,142,441
2,770,839 2,263,983 240,588 - 5,275,410
1,192,645 533,982 8,276 - 1,734,903
- 32,008 72,856 1,907,338 2,012,202 ─────── ─────── ─────── ─────── ───────
Total 5,519,805 12,272,156 6,253,354 2,119,641 26,164,956 ═══════ ═══════ ═══════ ═══════ ═══════
1,647,581 9,384,876 8,371,940 174,590 19,578,987
2,199,274 2,449,522 313,422 - 4,962,218
1,324,996 874,903 31,143 - 2,231,042
- - 176,934 1,952,475 2,129,409 ──────── ──────── ──────── ──────── ────────
Total 5,171,851 12,709,301 8,893,439 2,127,065 28,901,656 ═══════ ═══════ ═══════ ═══════ ═══════
ii) Commitments and contingencies by counterparty are as follows: 2017 2016
101,987 86,636
21,495,747 24,261,880
4,137,773 3,168,426
429,449 1,384,714 ──────── ────────
Total 26,164,956 28,901,656 ═══════ ═══════
d) Operating lease commitments
2017 2016
Less than 1 year 19,849 16,588
1 to 5 years 39,989 47,986
Over 5 years 5,459 7,086 ─────── ───────
Total 65,297 71,660 ═══════ ═══════
20 SPECIAL COMMISSION INCOME AND EXPENSE
Special commission income on:
Investments: 2017 2016
Available for sale 7,029 6,787
Held to maturity 1,763 2,043
349,710 381,659 ─────── ───────
358,502 390,489
82,114 15,401
Loans and advances 3,462,673 3,676,734 ─────── ───────
Total 3,903,289 4,082,624 ═══════ ═══════
Irrevocable commitments to extend credit represent the unused portion of authorisations to extend credit, principally in the form of loans and advances, guarantees and
letters of credit. With respect to credit risk on commitments to extend credit, the Group is potentially exposed to a loss of an amount equal to the total unused
commitments. However, the likely amount of loss, which cannot readily be quantified, is expected to be considerably less than the total unused commitment as most
commitments to extend credit are contingent upon customers maintaining specific credit standards. The total outstanding commitments to extend credit do not necessarily
represent future cash requirements as many of the commitments could expire or terminate without being funded.
The future minimum lease payments under non-cancellable operating leases where the Group is a lessee are as follows:
Acceptances
2016
Acceptances
Irrevocable commitments to extend credit
Other investments held at amortised cost
Acceptances comprise undertakings by the Group to pay bills of exchange drawn on customers. The Group expects most acceptances to be presented before being
reimbursed by the customers.
Letters of guarantee
i) The contractual maturities of the Group’s commitments and contingencies are as follows:
Letters of guarantee
Letters of credit
Due from banks and other financial institutions
Outstanding and unused portion of commitments that can be revoked unilaterally at any time by the Group amounts to SAR 28.6 billion (2016: SAR 38.06 billion).
Documentary letters of credit are written undertakings by the Group on behalf of a customer authorising a third party to draw drafts on the Group up to a stipulated amount
under specific terms and conditions and are generally collateralised by the underlying shipments of goods to which they relate and therefore, have significantly less risk.
Letters of credit
2017
Within 3
months
Government and quasi-government
Corporate
Banks and other financial institutions
Irrevocable commitments to extend credit
Other
30

Amounts in SAR’000
NOTES TO THE CONSOLIDATED FINANCIAL STATEMENTSFor the year ended December 31, 2017
2017 2016
16,144 40,137
Customers’ deposits 986,320 1,406,969
Subordinated debt 135,063 128,201 ─────── ───────
Total 1,137,527 1,575,307 ═══════ ═══════
21 FEE AND COMMISSION INCOME, NET
2017 2016
261,641 335,227
266,876 305,338
157,149 146,098
28,739 39,473
70,907 76,922 ─────── ───────
785,312 903,058 ─────── ───────
72,612 69,902
22,901 48,415 ─────── ───────
95,513 118,317 ─────── ───────
689,799 784,741 ═══════ ═══════
22 TRADING INCOME, NET 2017 2016
95,916 129,787 ─────── ───────
Total 95,916 129,787
═══════ ═══════
23 GAINS ON NON-TRADING INVESTMENTS
2017 2016
30,260 90,658 ─────── ───────
Total 30,260 90,658
═══════ ═══════
24 SALARIES AND EMPLOYEE-RELATED EXPENSES
2017
Cash Shares Total
15 23,969 6,838 3,574 34,381
137 40,091 5,180 1,046 46,317
643 141,333 15,672 4,558 161,563
1,683 258,741 22,429 2,678 283,848 ──────── ──────── ──────── ──────── ────────
Total 2,478 464,134 50,119 11,856 526,109 ──────── ──────── ──────── ────────
59,325
75,722
71,664 ────────
670,845 ═══════
Other employees
Realised gain on disposal of non- trading investments
Total salaries and employee related expenses
Total fee and commission expenses
Fixed
compensation
paid
Number of
employees
Corporate finance and advisory
Fee and commission income, net
Senior executives who require SAMA's no objection
Other employee related expenses paid during the year
Variable compensation paid
Employees engaged in control and risk management functions
The following table summarizes the Group’s employee categories defined in accordance with SAMA’s rules on compensation practices and includes the total amounts of
fixed and variable compensation paid to employees during the year ended December 31, 2017 and 2016, and the forms of such payments.
Card products
Fee and commission expenses on:
Others
Card products
Others
Fee and commission income from:
Due to banks and other financial institutions
Special commission expense on:
Total fee and commission income
Categories of employees
Variable compensation accrued during the year
Share brokerage and fund management
Derivatives and others, net
Employees engaged in risk taking activities
Other employee related expenses accrued during the year
Trade finance
31
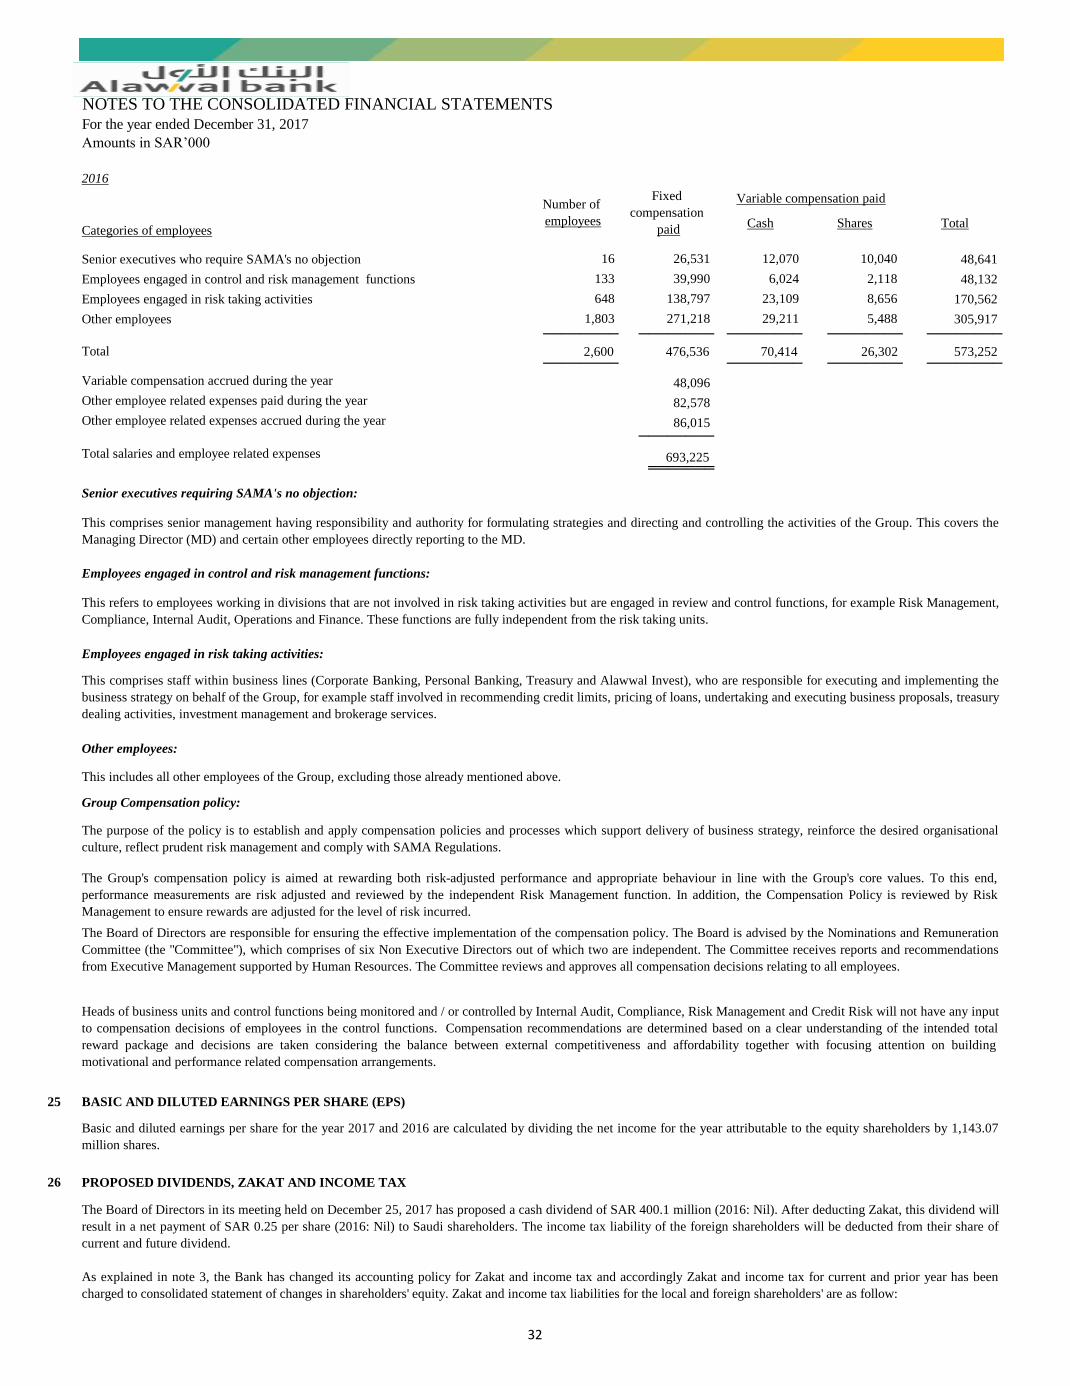
Amounts in SAR’000
NOTES TO THE CONSOLIDATED FINANCIAL STATEMENTSFor the year ended December 31, 2017
2016
Cash Shares Total
16 26,531 12,070 10,040 48,641
133 39,990 6,024 2,118 48,132
648 138,797 23,109 8,656 170,562
1,803 271,218 29,211 5,488 305,917 ──────── ──────── ──────── ──────── ────────
Total 2,600 476,536 70,414 26,302 573,252 ──────── ──────── ──────── ────────
48,096
82,578
86,015 ────────
693,225 ═══════
25 BASIC AND DILUTED EARNINGS PER SHARE (EPS)
26 PROPOSED DIVIDENDS, ZAKAT AND INCOME TAX
This includes all other employees of the Group, excluding those already mentioned above.
The Board of Directors in its meeting held on December 25, 2017 has proposed a cash dividend of SAR 400.1 million (2016: Nil). After deducting Zakat, this dividend will
result in a net payment of SAR 0.25 per share (2016: Nil) to Saudi shareholders. The income tax liability of the foreign shareholders will be deducted from their share of
current and future dividend.
As explained in note 3, the Bank has changed its accounting policy for Zakat and income tax and accordingly Zakat and income tax for current and prior year has been
charged to consolidated statement of changes in shareholders' equity. Zakat and income tax liabilities for the local and foreign shareholders' are as follow:
The purpose of the policy is to establish and apply compensation policies and processes which support delivery of business strategy, reinforce the desired organisational
culture, reflect prudent risk management and comply with SAMA Regulations.
Basic and diluted earnings per share for the year 2017 and 2016 are calculated by dividing the net income for the year attributable to the equity shareholders by 1,143.07
million shares.
Other employee related expenses accrued during the year
Number of
employees
This comprises staff within business lines (Corporate Banking, Personal Banking, Treasury and Alawwal Invest), who are responsible for executing and implementing the
business strategy on behalf of the Group, for example staff involved in recommending credit limits, pricing of loans, undertaking and executing business proposals, treasury
dealing activities, investment management and brokerage services.
Categories of employees
Senior executives requiring SAMA's no objection:
Senior executives who require SAMA's no objection
The Group's compensation policy is aimed at rewarding both risk-adjusted performance and appropriate behaviour in line with the Group's core values. To this end,
performance measurements are risk adjusted and reviewed by the independent Risk Management function. In addition, the Compensation Policy is reviewed by Risk
Management to ensure rewards are adjusted for the level of risk incurred.
This refers to employees working in divisions that are not involved in risk taking activities but are engaged in review and control functions, for example Risk Management,
Compliance, Internal Audit, Operations and Finance. These functions are fully independent from the risk taking units.
Group Compensation policy:
Heads of business units and control functions being monitored and / or controlled by Internal Audit, Compliance, Risk Management and Credit Risk will not have any input
to compensation decisions of employees in the control functions. Compensation recommendations are determined based on a clear understanding of the intended total
reward package and decisions are taken considering the balance between external competitiveness and affordability together with focusing attention on building
motivational and performance related compensation arrangements.
The Board of Directors are responsible for ensuring the effective implementation of the compensation policy. The Board is advised by the Nominations and Remuneration
Committee (the "Committee"), which comprises of six Non Executive Directors out of which two are independent. The Committee receives reports and recommendations
from Executive Management supported by Human Resources. The Committee reviews and approves all compensation decisions relating to all employees.
Other employees:
Other employee related expenses paid during the year
Fixed
compensation
paid
Variable compensation paid
Employees engaged in control and risk management functions
Employees engaged in risk taking activities
Other employees
Variable compensation accrued during the year
This comprises senior management having responsibility and authority for formulating strategies and directing and controlling the activities of the Group. This covers the
Managing Director (MD) and certain other employees directly reporting to the MD.
Employees engaged in risk taking activities:
Employees engaged in control and risk management functions:
Total salaries and employee related expenses
32

Amounts in SAR’000
NOTES TO THE CONSOLIDATED FINANCIAL STATEMENTSFor the year ended December 31, 2017
As reported
January 1,
2016 Restatement
Amounts as
restated
January 1,
2016
901,154 (80,446) 820,708 ═══════ ═══════ ═══════
1,542,348 159,341 1,701,689 ═══════ ═══════ ═══════
255,528 (80,446) 175,082 ═══════ ═══════ ═══════
297,199 (159,341) 137,858 ═══════ ═══════ ═══════
12,027,194 (239,787) 11,787,407 ═══════ ═══════ ═══════
As reported
December 31,
2016 Restatement
Amounts as
restated
December 31,
2016
846,658 (80,446) 766,212 ═══════ ═══════ ═══════
1,320,488 119,623 1,440,111 ═══════ ═══════ ═══════
1,054,072 (200,069) 854,003 ═══════ ═══════ ═══════
12,862,794 (200,069) 12,662,725 ═══════ ═══════ ═══════
c) Status of Zakat and Income Tax assessments
27
2017 2016
15,137,005 7,487,379
Statutory deposit (4,106,211) (4,427,484) ─────── ───────
11,030,794 3,059,895
1,975,271 879,369 ─────── ───────
Total 13,006,065 3,939,264═══════ ═══════
Other assets
The Bank has filed its Zakat and income tax returns for the financial years up-to and including the year 2016 with the General Authority of Zakat and Tax (“GAZT”). The
Bank has received Zakat and income tax assessments for the years 2005 to 2013 raising net additional demands aggregating to SAR 282.1 million. This additional exposure
is mainly relates to Zakat arising on account of disallowances of certain long term investments and addition of long term financing to Zakat base by the GAZT. The basis
for this additional liability is being contested by the Bank in conjunction with all the other banks in Saudi Arabia. The Bank has also formally contested these assessments
and is awaiting a response from GAZT. Management expects a favourable outcome on the aforementioned appeals, however, the Bank has recorded appropriate provisions
against the aforementioned exposure.
Assessments for the years 2014 to 2016 are yet to be raised. However, in line with the assessments raised by the GAZT for the years 2005 to 2013, if long-term investments
are disallowed and long-term financing is added to the Zakat base, this would result in an additional Zakat exposure which remains an industry wide issue and disclosure of
which might affect the Bank's position in this matter.
Other assets
Proposed dividends
The change in the accounting policy for Zakat and income tax, as explained above, has the following impacts on the line items of consolidated statements of financial
position and changes in shareholders' equity:
Zakat attributable to Saudi Shareholders for the year is estimated to be SAR 27 million (2016: SAR 25 million), which will be adjusted against their share of current and
future dividends.
a) Saudi shareholders:
Income tax payable on the current year’s share of income of foreign shareholders is estimated to be SAR 102 million (2016: SAR 95 million), which will be adjusted
against their share of current and future dividends.
b) Non-Saudi shareholders:
CASH AND CASH EQUIVALENTS
Due from banks and other financial institutions maturing within three months or less from the acquisition date
Other liabilities
Total retained earnings
Total shareholders’ equity
The above change in accounting policy did not have any impact on consolidated income statement, statements of comprehensive income and cash flows for the year or year
2016.
Other liabilities
Cash and cash equivalents included in the consolidated statement of cash flows comprise the following:
Cash and balances with SAMA (note 4)
Total shareholders’ equity
Total retained earnings
33

Amounts in SAR’000
NOTES TO THE CONSOLIDATED FINANCIAL STATEMENTSFor the year ended December 31, 2017
28
Central treasury and ALCO
2017
Corporate
banking
Personal
banking
Investments
banking and
investments
services
Central
treasury and
ALCO Total
Net special commission income 2,057,304 1,058,531 2,090 (352,163) 2,765,762
Fee and commission income, net 502,539 180,460 31,426 (24,626) 689,799
Trading income, net 51,988 2,349 1,552 40,027 95,916
Other revenue 78,631 51,254 - 30,260 160,145
Inter-segment (expense) / revenue (1,004,776) 235,483 9,254 760,039 - ─────── ─────── ─────── ─────── ───────
Total segment revenue 1,685,686 1,528,077 44,322 453,537 3,711,622 ─────── ─────── ─────── ─────── ───────
Corporate
banking
Personal
banking
Investments
banking and
investments
services
Central
treasury and
ALCO Total
Operating expenses 393,895 767,510 37,570 66,640 1,265,615
940,300 179,999 - - 1,120,299
Non-operating income - - - (9,810) (9,810)
─────── ─────── ─────── ─────── ───────
Segment profit 351,491 580,568 6,752 396,707 1,335,518 ─────── ─────── ─────── ─────── ───────
Segment assets 43,661,906 19,977,577 748,030 35,482,317 99,869,830 ═══════ ═══════ ═══════ ═══════ ═══════
22,392,629 27,180,681 208,884 36,487,940 86,270,134 ═══════ ═══════ ═══════ ═══════ ═══════
Operating segments are identified on the basis of internal reports about components of the Group that are regularly reviewed by the senior management responsible for
operational decision making in the Bank in order to allocate resources to the segments and to assess performance. Transactions between operating segments are on normal
commercial terms and conditions. Funds are ordinarily reallocated between operating segments, resulting in funding cost transfers. Special commission is charged to
operating segments based on a pool rate, which approximates the marginal cost of funds. The revenue from external parties reported to the senior management, is measured
in a manner consistent with that in the consolidated income statement. There have been no changes in the measurement basis for the segment profit or loss since December
31, 2016. Following are the reportable operating segments of the Group:
OPERATING SEGMENTS
Other material non-cash items: impairment charge for credit losses, net
External revenue / (expense):
Corporate banking
The personal banking group operates through a national network of branches and ATMs supported by a 24-hour phone banking centre. This segment accepts customers’
deposits in various savings and deposit accounts and provides retail banking products and services, including consumer loans, overdrafts and credit cards to individuals and
small-to-medium-sized enterprises.
Investment banking and investment services
Personal banking
The corporate banking segment offers a range of products and services to corporate and institutional customers. It accepts customer deposits and provides financing,
including term loans, overdrafts, syndicated loans and trade finance services. Services provided to customers include internet banking, global transaction services and a
centralised service that manages all customer transfers, electronic or otherwise.
Treasury transacts mainly in money market, foreign exchange, special commission rate and other derivatives for corporate and institutional customers as well as for the
Group’s own benefit. It is also responsible for managing the Group’s funding and centralized risk management and investment portfolio. ALCO include the group-wide
assets and liabilities other than the business and treasury's core activities maintaining Group-wide liquidity and managing its consolidated financial position. It also
includes the net interdepartmental revenues / charges on Funds Transfer Pricing as approved by ALCO and unallocated income and expenses relating to Head Office and
other departments.
The investment banking and investment services segment offers security dealing, managing, arranging, advising and maintaining custody services in relation to securities.
a) The following is an analysis of the Group's assets, revenues and results by operating segments for the years ended December 31:
Segment liabilities
34

Amounts in SAR’000
NOTES TO THE CONSOLIDATED FINANCIAL STATEMENTSFor the year ended December 31, 2017
2016
Corporate
banking
Personal
banking
Investments
banking and
investments
services
Central
treasury and
ALCO Total
Net special commission income 2,111,913 1,027,942 - (632,538) 2,507,317
Fee and commission income, net 597,207 183,579 47,172 (43,217) 784,741
Trading income, net 105,073 12,552 1,386 10,776 129,787
Other revenue 113,579 47,270 - 102,103 262,952
Inter-segment (expense) / revenue (912,290) 188,761 11,063 712,466 - ─────── ─────── ─────── ─────── ───────
Total segment revenue 2,015,482 1,460,104 59,621 149,590 3,684,797 ─────── ─────── ─────── ─────── ───────
Operating expenses 429,192 751,940 43,896 110,538 1,335,566
853,355 314,034 - - 1,167,389
- - - 120,246 120,246
Non-operating income - - - (3,130) (3,130) ─────── ─────── ─────── ─────── ───────
Segment profit / (losses) 732,935 394,130 15,725 (78,064) 1,064,726 ─────── ─────── ─────── ─────── ───────
Segment assets 51,273,700 21,469,397 554,329 31,692,628 104,990,054 ═══════ ═══════ ═══════ ═══════ ═══════
26,267,101 27,681,449 16,269 38,362,510 92,327,329
═══════ ═══════ ═══════ ═══════ ═══════
b) The Group’s maximum credit exposure by operating segments is as follows:
Corporate
banking
Personal
banking
Central
treasury and
ALCO Total
43,661,906 19,977,577 19,330,931 82,970,414
12,693,340 - - 12,693,340
438,691 - 462,360 901,051
2016
51,273,700 21,469,397 22,755,442 95,498,539
12,531,882 - - 12,531,882
822,104 - 805,370 1,627,474
29 CREDIT RISK
2017
Credit risk is the risk that one party to a financial instrument may fail to discharge an obligation and cause the other party to incur a financial loss. Credit exposures arise
principally in lending activities that lead to loans and advances, and investment activities. There is also a credit risk on credit related commitments, contingencies and
derivatives. The Group controls credit risk by monitoring credit exposures, limiting transactions with specific counterparties, and continually assessing the creditworthiness
of counterparties.
In addition to monitoring credit limits, the Group manages the credit exposure relating to its trading activities by entering into master netting agreements and collateral
arrangements with counterparties in appropriate circumstances, and by limiting the duration of exposure. In certain cases management may also close out transactions or
assign them to other counterparties to mitigate credit risk. The Group’s credit risk on derivatives represents the potential cost to replace the derivative contracts if
counterparties fail to fulfill their obligation. To control the level of credit risk taken, management assesses counterparties using the same techniques as for its lending
activities. Concentrations of credit risk arise when a number of counterparties are engaged in similar business activities or activities in the same geographic region, or have
similar economic features that would cause their ability to meet contractual obligations to be similarly affected by changes in economic, political or other conditions.
Concentrations of credit risk indicate the relative sensitivity of the Group’s performance to developments affecting a particular industry or geographical location.
Non derivative financial assets
Other material non-cash items: impairment charge for AFS investments
Segment liabilities
Commitments and contingencies stated at credit equivalents
Management seeks to manage concentration of credit risk within Board approved Risk Appetite and in line with SAMA guidelines, through a system of limits and
strategies designed to ensure appropriate diversification of lending activities and to prevent undue concentration of risks with individuals or groups of customers in specific
locations or businesses. The Group also takes security when appropriate. Management monitors on a regular basis the market value of collateral and requests additional
collateral in accordance with the underlying agreement, if required. In addition it also specifically monitors the market value of collateral during its review of the adequacy
of the allowances for impairment losses. Management regularly reviews its risk management policies and systems to reflect changes in markets products and emerging best
practice.
Other material non-cash items: impairment charge for
credit losses, net
Non derivative financial assets
Commitments and contingencies stated at credit equivalents
Credit exposure comprises the carrying value of non derivative financial assets, excluding cash and balances with SAMA, investments in equities, associate, mutual funds
and property and equipment. The credit equivalent value of commitments and contingencies and derivatives are also included in credit exposure.
External revenue / (expense):
Derivatives stated at credit equivalents
Derivatives stated at credit equivalents
35

Amounts in SAR’000
NOTES TO THE CONSOLIDATED FINANCIAL STATEMENTSFor the year ended December 31, 2017
2017 2016
(Restated)
2,115,271 1,024,369
16,531,070 20,964,861
63,639,483 72,743,097
Other assets, net 684,590 766,212
Derivatives 901,051 1,627,474
12,693,340 12,531,882
─────── ───────
Total 96,564,805 109,657,895 ═══════ ═══════
30 GEOGRAPHICAL CONCENTRATION
2017
Saudi
Arabia
GCC and
Middle East Europe Americas
South
East Asia
Other
countries Total
Assets
15,137,005 - - - - - 15,137,005
572,792 653,680 770,483 102,999 330 14,987 2,115,271
107,535 45,526 59,157 - - - 212,218
Investments, net 16,025,085 98,374 188,281 377,007 - - 16,688,747
Loans and advances, net 63,639,483 - - - - - 63,639,483
Investment in an associate 45,507 - - - - - 45,507
Property and equipment, net 1,347,009 - - - - - 1,347,009
Other assets, net 312,516 298,525 45,487 28,062 - - 684,590 ─────── ─────── ─────── ─────── ─────── ─────── ───────
Total 97,186,932 1,096,105 1,063,408 508,068 330 14,987 99,869,830 ═══════ ═══════ ═══════ ═══════ ═══════ ═══════ ═══════
Saudi
Arabia
GCC and
Middle East Europe Americas
South
East Asia
Other
countries Total
Liabilities
3,011,961 255,638 44,367 11,278 386 21,041 3,344,671
59,463 7,189 23,653 1,374 - - 91,679
Customers’ deposits 78,274,963 - - - - - 78,274,963
Subordinated debt 2,505,026 - - - - - 2,505,026
Other liabilities 1,987,050 21,712 42,898 2,135 - - 2,053,795 ─────── ─────── ─────── ─────── ─────── ─────── ───────
Total 85,838,463 284,539 110,918 14,787 386 21,041 86,270,134 ═══════ ═══════ ═══════ ═══════ ═══════ ═══════ ═══════
22,522,530 573,609 1,075,683 363,892 - 1,629,242 26,164,956
═══════ ═══════ ═══════ ═══════ ═══════ ═══════ ═══════
11,324,416 290,596 485,532 174,116 - 418,680 12,693,340 ═══════ ═══════ ═══════ ═══════ ═══════ ═══════ ═══════
Derivatives 461,616 190,555 248,405 475 - - 901,051 ═══════ ═══════ ═══════ ═══════ ═══════ ═══════ ═══════
Commitments and contingencies
Commitments and Contingencies
Credit related commitments and contingencies
The Group uses a credit classification system as a tool to assist in managing the quality of credit risk within the lending portfolio. In addition to the three categories
mentioned in note 7, management maintains further classification grades that differentiates between performing and impaired portfolios and allocates portfolio and specific
allowances respectively. Management determines each individual borrower’s grade based on specific financial ratios and other quantitative indicators and criteria such as
activity, cash flows, capital structure, security, quality of management and borrower’s character. A further quality classification is performed over existing borrowers and
the results of this exercise are validated by the independent risk management unit.
Due from banks and other financial
institutions
Positive fair value derivatives
Due from banks and other financial institutions
The Group's maximum exposure to credit risk computed as per SAMA guidelines as at December 31, 2017 and 2016, without taking into account any collateral held or
credit enhancements attached is reflected below:
Loans and advances, net
Investments, net
The distribution by geographical region for major categories of assets, liabilities, commitments and contingencies and credit exposure are as follows:
Maximum credit exposure (stated at credit equivalent amounts)
Cash and balances with SAMA
Due to banks and other financial institutions
The debt securities included in the investment portfolio are mainly sovereign risk. Analysis of investments by class of issuer is provided in note 6. For details of the
composition of loans and advances refer to note 7. Information on credit risk relating to derivative instruments and commitments and contingencies are provided in notes
11 and 19, respectively . Information on the Group's maximum credit exposure by operating segment is provided in note 28.
Negative fair value derivatives
36

Amounts in SAR’000
NOTES TO THE CONSOLIDATED FINANCIAL STATEMENTSFor the year ended December 31, 2017
2016
Saudi
Arabia
GCC and
Middle East Europe Americas
South
East Asia
Other
countries Total
Assets
7,487,379 - - - - - 7,487,379
497,576 34,632 290,913 182,616 177 18,455 1,024,369
283,446 28,759 81,574 - - - 393,779
Investments, net 20,412,335 281,034 187,593 377,536 - - 21,258,498
Loans and advances, net 72,395,210 - - 347,887 - - 72,743,097
Investment in an associate 35,697 - - - - - 35,697
Property and equipment, net 1,281,023 - - - - - 1,281,023
Other assets, net 365,633 309,654 74,650 16,229 2 44 766,212 ─────── ─────── ─────── ─────── ─────── ─────── ───────
Total 102,758,299 654,079 634,730 924,268 179 18,499 104,990,054 ═══════ ═══════ ═══════ ═══════ ═══════ ═══════ ═══════
Saudi
Arabia
GCC and
Middle East Europe Americas
South
East Asia
Other
countries Total
Liabilities
335,441 307,432 310,689 17,539 371 376,260 1,347,732
101,331 92,566 72,602 4,294 - - 270,793
Customers’ deposits 83,367,656 1,991,133 - - - - 85,358,789
Subordinated debt 3,909,905 - - - - - 3,909,905
Other liabilities 1,388,138 12,499 37,171 2,303 - - 1,440,111 ─────── ─────── ─────── ─────── ─────── ─────── ───────
Total 89,102,471 2,403,630 420,462 24,136 371 376,260 92,327,330 ═══════ ═══════ ═══════ ═══════ ═══════ ═══════ ═══════
25,011,402 1,509,198 1,218,389 607,401 11,005 544,261 28,901,656 ═══════ ═══════ ═══════ ═══════ ═══════ ═══════ ═══════
10,856,813 736,409 474,020 226,318 5,502 232,820 12,531,882 ═══════ ═══════ ═══════ ═══════ ═══════ ═══════ ═══════
Derivatives 963,606 256,368 407,031 469 - - 1,627,474 ═══════ ═══════ ═══════ ═══════ ═══════ ═══════ ═══════
31 MARKET RISK
a) MARKET RISK - TRADING BOOK
Commitments and contingencies
VaR that management uses is an estimate, using a confidence level of 99% of the potential loss that is not expected to be exceeded if the current market positions were to
be held unchanged for one day. The use of 99% confidence level depicts that within a one-day horizon, losses exceeding VaR figure should occur, on average, not more
than once every hundred days. The VaR represents the risk of portfolios at the close of a business day, and it does not account for any losses that may occur beyond the
defined confidence interval. The actual trading results may differ from the VaR calculations and, in particular, the calculation does not provide a meaningful indication of
profits and losses in stressed market conditions.
To overcome the VaR limitations mentioned above, management maintains a framework of non-modelled limits that show potential loss for a given change in a market
factor and makes no assumption about the behaviour of market factors. Furthermore, management employs stop loss limits on market risk positions and carries out stress
tests of its portfolio to simulate conditions outside normal confidence intervals. The potential losses occurring under stress test conditions are reported regularly to the Asset
and Liability Committee (ALCO) for review.
Positive fair value derivatives
Commitments and contingencies
Negative fair value derivatives
Maximum credit exposure (stated at credit equivalent amounts)
Due to banks and other financial institutions
Credit equivalent amounts reflect the amounts that result from translating the Group’s contingent liabilities and commitments and derivatives into the risk equivalents using
credit conversion factors prescribed by SAMA. The credit conversion factor is meant to capture the potential credit risk related to the exercise of that commitment.
Impaired loans and advances and allowances for credit losses are all within the Kingdom of Saudi Arabia.
The Board of Directors has set limits for the acceptable level of risk in managing the trading book. In order to manage market risk in the trading book, Management applies
a VaR methodology daily to assess the market risk positions held and also to estimate the potential economic loss based on a set of assumptions and changes in market
conditions.
A VaR methodology estimates the potential negative change in the market value of a portfolio at a given confidence level and over a specified time horizon. The Group
uses simulation models to assess the possible changes in the market value of the trading book based on historical data. VaR models are usually designed to measure the
market risk in a normal market environment and therefore the use of VaR has limitations because it is based on historical correlations and volatilities in market prices and
assumes that the future movements will follow a statistical distribution.
Market risk is the risk that the fair value of financial instruments will fluctuate due to changes in market variables such as special commission rates, foreign exchange rates,
and equity prices. Management classifies exposures to market risk into either trading book, or non-trading book (also referred to as banking book).
Cash and balances with SAMA
Due from banks and other financial
institutions
37

Amounts in SAR’000
NOTES TO THE CONSOLIDATED FINANCIAL STATEMENTSFor the year ended December 31, 2017
2017 (VaR)
Overall
risk
As at December 31 110
Average for the year 474
2016 (VaR)
Overall
risk
As at December 31 236
Average for the year 979
b) MARKET RISK – NON-TRADING OR BANKING BOOK
6 months or less 6 to12 months 1 to 5 years Over 5 years Total
- - - - - -
- - - - - -
35 (104) (3) - - (107)
(35) 104 3 - - 107
- - - - - -
- - - - - -
6 months or less 6 to12 months 1 to 5 years Over 5 years Total
4 - - - - -
(4) - - - - -
27 (105) (3) (12) - (120)
(27) 105 3 12 - 120
- - - - - -
- - - - - -Others
387
The exposure to the effect of various risks associated with fluctuations in the prevailing levels of market special commission rates on the Group's financial position and cash
flows is managed. The Board of Directors sets limits on the level of special commission rate risk to which the Group may be exposed. These limits are monitored by the
Group’s Asset and Liability Committee, Risk Management and Treasury departments. The Group is exposed to special commission rate risk as a result of mismatches or
gaps in the amounts of assets and liabilities and other financial instruments that mature or re-price in a given period. This risk is managed by matching the re-pricing of
financial assets and liabilities through risk management strategies. The table below summarises the Group’s exposure to special commission rate risks. Included in the table
are the Group’s financial assets and liabilities at carrying amounts, categorised by the earlier of the contractual re-pricing or the maturity dates.
51
Banking book exposures are monitored and analysed in currency concentrations and relevant sensitivities are disclosed below:
38
140
25
USD
Increase/ (decrease) in
basis points
(25)SAR
Sensitivity of
net special
commission
income
(25)
2016
Currency
Market risk on non-trading or banking positions mainly arises from special commission rate, foreign currency exposures and equity price changes.
i) SPECIAL COMMISSION RATE RISK
Sensitivity of equity
Sensitivity of equity
25
The Group’s VaR related information for the year ended December 31, 2017 and 2016 is as provided below.
USD
2017
Currency
(25)
The following table depicts the sensitivity to a reasonable possible change in special commission rates, with other variables held constant, on the Group’s consolidated
income statement or equity. The sensitivity of the income is the effect of the assumed changes in special commission rates on the net special commission income for one
year, based on the floating rate non-trading financial assets and financial liabilities held at year end including the effect of hedging instruments. The sensitivity of equity is
calculated by revaluing the fixed rate available for sale financial assets, including the effect of any associated hedges at year end for the effect of assumed changes in special
commission rates. The sensitivity of equity is analyzed by maturity of the asset or swap.
Increase/ (decrease) in
basis points
Special commission rate risk arises from the possibility that changes in special commission rates will affect either the fair values or the future cash flows of the financial
instruments. The Board of Directors has established special commission rate gap limits for stipulated periods. Management monitors positions daily and uses hedging
strategies to ensure maintenance of positions within established gap limits.
Sensitivity of
net special
commission
income
Others25
25
25
(25)
(25)
Special commission
rate risk
Foreign exchange
rate risk
Foreign exchange
forwards
Foreign exchange
rate risk
72
Special commission
rate risk
Foreign exchange
forwards
53
5
SAR(25)
25
67
262
512
132
80
38

Amounts in SAR’000
NOTES TO THE CONSOLIDATED FINANCIAL STATEMENTSFor the year ended December 31, 2017
Within 3
months
3 to 12
months
1 to 5
years
Over 5
years
Non-commission
bearing Total
Assets
10,009,000 - - - 5,128,005 15,137,005
Due from banks and other financial institutions 1,124,804 75,568 - - 914,899 2,115,271
Positive fair value derivatives 25,047 57,040 99,631 30,500 - 212,218
Investments, net 7,680,122 864,529 7,802,446 183,973 157,677 16,688,747
35,267,827 13,740,016 6,742,284 7,889,356 - 63,639,483
- - - - 45,507 45,507
Other assets, net 336,275 22,580 - - 325,735 684,590 ─────── ─────── ─────── ─────── ─────── ───────
Total 54,443,075 14,759,733 14,644,361 8,103,829 6,571,823 98,522,821 ═══════ ═══════ ═══════ ═══════ ═══════ ═══════
Liabilities
2,901,400 13,329 7,104 - 422,838 3,344,671
12,721 20,553 32,481 25,924 - 91,679
Customers’ deposits 37,840,687 10,155,394 124,127 - 30,154,755 78,274,963
Subordinated debt - 2,505,026 - - - 2,505,026
Other liabilities 44,916 24,438 - - 1,984,441 2,053,795
Shareholders’ equity - - - - 13,599,696 13,599,696 ─────── ─────── ─────── ─────── ─────── ───────
40,799,724 12,718,740 163,712 25,924 46,161,730 99,869,830 ═══════ ═══════ ═══════ ═══════ ═══════ ═══════
13,643,351 2,040,993 14,480,649 8,077,905
608,807 (32,565) (585,617) 9,375 ──────── ──────── ──────── ────────
Total special commission rate sensitivity gap 14,252,158 2,008,428 13,895,032 8,087,280 ──────── ──────── ──────── ────────
14,252,158 16,260,586 30,155,618 38,242,898 ═══════ ═══════ ═══════ ═══════
Within 3
months
3 to 12
months
1 to 5
years
Over 5
years
Non
commission
bearing Total
Assets
2,169,000 - - - 5,318,379 7,487,379
450,263 145,213 - - 428,893 1,024,369
Positive fair value derivatives 85,782 254,732 53,265 - - 393,779
Investments, net 12,757,008 1,628,376 4,676,217 1,903,260 293,637 21,258,498
38,939,978 16,535,735 8,658,697 8,608,687 - 72,743,097
Investment in an associate - - - - 35,697 35,697
Other assets, net 344,759 29,161 - - 392,292 766,212 ─────── ─────── ─────── ─────── ─────── ───────
Total 54,746,790 18,593,217 13,388,179 10,511,947 6,468,898 103,709,031 ═══════ ═══════ ═══════ ═══════ ═══════ ═══════
Liabilities
Within 3
months
3 to 12
months
1 to 5
years
Over 5
years
Non
commission
bearing Total
549,508 147,159 12,729 - 638,336 1,347,732
45,991 196,290 26,062 2,450 - 270,793
Customers’ deposits 39,337,817 13,533,729 171,106 - 32,316,136 85,358,788
Subordinated debt - 3,909,905 - - - 3,909,905
Other liabilities 58,292 31,945 - - 1,349,874 1,440,111
Shareholders’ equity - - - - 12,662,725 12,662,725 ─────── ─────── ─────── ─────── ─────── ───────
39,991,608 17,819,028 209,897 2,450 46,967,071 104,990,054 ═══════ ═══════ ═══════ ═══════ ═══════ ═══════
14,755,182 774,189 13,178,282 10,509,497
690,434 90,850 (671,514) (109,770) ──────── ──────── ──────── ────────
15,445,616 865,039 12,506,768 10,399,727 ──────── ──────── ──────── ────────
15,445,616 16,310,655 28,817,423 39,217,150 ═══════ ═══════ ═══════ ═══════
Total liabilities and shareholder's equity
Negative fair value derivatives
Special commission rate sensitivity - financial position gap
Due to banks and other financial institutions
Negative fair value derivatives
Cash and balances with SAMA
Special commission rate sensitivity on derivative financial instruments represents the net notional amounts that are used to manage special commission rate risk. The
effective yield of a monetary financial instrument is the yield that the Group earns from its clients taking into consideration the contractual special commission rate.
2016
Cumulative special commission rate sensitivity gap
Special commission rate sensitivity on derivative financial
instruments
Special commission rate sensitivity on derivative financial
instruments
Due to banks and other financial institutions
Total liabilities and shareholder's equity
Loans and advances, net
Cash and balances with SAMA
2017
Loans and advances, net
Special commission rate sensitivity - financial position gap
Cumulative special commission rate sensitivity gap
Due from banks and other financial institutions
Total special commission rate sensitivity gap
Investments in an associate
39

Amounts in SAR’000
NOTES TO THE CONSOLIDATED FINANCIAL STATEMENTSFor the year ended December 31, 2017
Currency position:
2017 2016
US Dollar 74,689 45,297
UAE Dirham (608) 1,270
Swiss Franc (203) 99
Euro (1,367) 113
Pound Sterling (640) 525
Japanese Yen 558 1,382
Others 2,642 2,740
At the end of the year, the Group had the following significant net exposures denominated in foreign currencies:
Equity price risk refers to the risk of a decrease in the fair values of equities in the Group’s non-trading investment portfolio as a result of reasonable possible changes in
levels of equity indices and the value of individual stocks. The effect on the Group’s equity investments held as available for sale due to reasonable possible change in
equity indices, with all other variables held constant is as follows:
(5)
Others
(69)
(137)
5
(5)
137
(2,265)
10
2,265
(5) (5)
6
(26)GBP
(6)
5
69
(30)
30
CHF
(3,734)
(5)
132
(132)
5
26
EUR
5
(64)
64
USD
JPY
2016
(5)
(5)
Others
(28)(5)
CHF5
(68)
68
Change in
Currency Rate (%)
Effect on
Net Income
ii) CURRENCY RISK
Currency risk represents the risk of change in the value of financial instruments due to changes in foreign exchange rates. The Board of Directors have set risk appetite for
market risks including currency risk and the Group’s Asset and Liability Committee have set a framework of limits on positions by currency and in aggregate, which are
monitored daily. Hedging strategies are also used to ensure that positions are maintained within these limits. The table below shows the currencies to which the Group has
a significant exposure as at year end on its non-trading monetary assets and liabilities and forecasted cash flows. The analysis calculates the effect on the consolidated
income statement (due to the fair value of the currency sensitive non-trading monetary assets and liabilities) of a potential movement in the foreign currency against SAR,
with all other variables held constant. A positive effect shows a potential increase in consolidated income statement or equity, whereas a negative effect shows a potential
net reduction in consolidated income statement or equity.
3,734
(5)
(5)
Currency exposure
2017
AED
USD5
EUR5
(5)
Currency exposure
Change in
Currency Rate (%)
Effect on
Net Income
Long / (short)
(5)
JPY5
5
AED5
(5)
iii) EQUITY PRICE RISK
(5)
(10)
GBP
5
(32)
32
28
5 5
(5)
5
5
40

Amounts in SAR’000
NOTES TO THE CONSOLIDATED FINANCIAL STATEMENTSFor the year ended December 31, 2017
Change in
equity prices%
Effect in
SAR '000
Change in
equity prices%
Effect in
SAR '000
+ 5 - + 5 6,949
- 5 - - 5 (6,949)
+ 10 - + 10 13,897
- 10 - - 10 (13,897)
32 LIQUIDITY RISK
ii) The maturity profile of assets and liabilities at year end is as follows:
Within 3 3 to 12 1 to 5 Over 5
months months years years Total
4,106,211 11,030,794 - - - 15,137,005
914,899 1,124,804 75,568 - - 2,115,271
- 25,047 57,040 99,631 30,500 212,218
157,677 63,382 239,372 9,335,992 6,892,324 16,688,747
1,154,544 23,205,228 12,114,187 15,629,529 11,535,995 63,639,483
45,507 - - - - 45,507
1,347,009 - - - - 1,347,009
612,976 49,034 22,580 - - 684,590 ──────── ──────── ──────── ──────── ──────── ────────
8,338,823 35,498,289 12,508,747 25,065,152 18,458,819 99,869,830
════════ ════════ ════════ ════════ ════════ ════════
422,838 2,901,400 13,329 7,104 - 3,344,671
- 12,721 20,553 32,481 25,924 91,679
30,154,755 37,840,687 10,155,394 124,127 - 78,274,963
- - 5,026 - 2,500,000 2,505,026
1,984,441 44,916 24,438 - - 2,053,795
Shareholders' equity 13,599,696 - - - - 13,599,696 ──────── ──────── ──────── ──────── ──────── ────────
46,161,730 40,799,724 10,218,740 163,712 2,525,924 99,869,830 ════════ ════════ ════════ ════════ ════════ ════════
4,427,484 3,059,895 - - - 7,487,379
428,893 450,263 145,213 - - 1,024,369
- 85,782 254,732 53,265 - 393,779
293,637 5,701,730 1,210,973 6,316,745 7,735,413 21,258,498
1,839,403 24,249,640 15,929,651 18,295,353 12,429,050 72,743,097
35,697 - - - - 35,697
1,281,023 - - - - 1,281,023
679,533 57,518 29,161 - - 766,212 ──────── ──────── ──────── ──────── ──────── ────────
8,985,670 33,604,828 17,569,730 24,665,363 20,164,463 104,990,054 ═══════ ═══════ ═══════ ═══════ ═══════ ═══════
Positive fair value derivatives
Other liabilities
2016
Liquidity risk is the risk that the Group may encounter difficulty in meeting obligations associated with its financial liabilities that are settled by delivering cash or other
financial assets. Liquidity risk can be caused by market disruptions or credit downgrades, which may cause certain sources of funding to dry up at short notice. To mitigate
this risk, management has diversified funding sources and assets are managed considering liquidity positions to maintain a healthy balance of cash and cash equivalents
and readily marketable securities.
Investments, net
Loans and advances, net
Negative fair value derivatives
Customers’ deposits
Total
Liabilities and shareholders' equity
Due from banks and other financial institutions
Assets
Subordinated debt
Positive fair value derivatives
Property and equipment, net
i) Maturity profile of assets and liabilities
Investments in an associate
Assets
2017
In accordance with the Banking Control Law and the regulations issued by SAMA, the Bank maintains a statutory deposit with SAMA equal to 7% (2016: 7%) of total
demand deposits and 4% (2016: 4 %) of savings and time deposits. In addition to the statutory deposit, the Bank also maintains liquid reserves of no less than 20% of its
deposits liabilities, in the form of cash, Saudi Government Development Bonds or assets which can be converted into cash within a period not exceeding 30 days or the
Bank may raise additional funds through repo facilities available with SAMA against securities issued by the Saudi Government up to 75% of the nominal value of bonds
held.
No fixed
maturity
Market Indices - Tadawul
2017
Other assets, net
Investments, net
Total
Investments in an associate
Cash and balances with SAMA
Other assets, net
The tables below summarise the maturity profile of the Group’s assets and liabilities. The contractual maturities of assets and liabilities have been determined on the basis
of the remaining period to contractual maturity date as at year end and do not take into account the effective maturities as indicated by the Group’s deposit retention
history. Management monitors the maturity profile to ensure that adequate liquidity is maintained. The daily liquidity position is monitored and regular liquidity stress
testing is conducted under a variety of scenarios covering both normal and more severe market conditions. All liquidity policies and procedures are subject to review and
approval by ALCO. Daily reports cover the liquidity position of both the Bank and other operating subsidiaries. A summary report, including any exceptions and remedial
action taken, is submitted regularly to ALCO and the Board and its Committees also receive regular reporting on key liquidity risk indicators.
2016
Loans and advances, net
Due to banks and other financial institutions
Total
Cash and balances with SAMA
Property and equipment, net
Due from banks and other financial institutions
41

Amounts in SAR’000
NOTES TO THE CONSOLIDATED FINANCIAL STATEMENTSFor the year ended December 31, 2017
Within 3 3 to 12 1 to 5 Over 5
months months years years Total
638,336 549,508 147,159 12,729 - 1,347,732
- 45,991 196,290 26,062 2,450 270,793
35,199,661 36,454,291 12,560,763 1,144,073 - 85,358,788
- - 9,905 1,400,000 2,500,000 3,909,905
1,349,874 58,292 31,945 - - 1,440,111
Shareholders' equity 12,662,725 - - - - 12,662,725 ──────── ──────── ──────── ──────── ──────── ────────
49,850,596 37,108,082 12,946,062 2,582,864 2,502,450 104,990,054 ═══════ ═══════ ═══════ ═══════ ═══════ ═══════
iii) Analysis of financial liabilities by remaining contractual maturities
Within 3 3 to 12 1 to 5 Over 5
months months years years Total
Financial Liabilities
422,838 2,902,089 13,590 7,529 - 3,346,046
Customers’ deposits 30,154,755 38,065,115 10,315,886 131,720 - 78,667,476
Subordinated debt - - 107,090 657,347 2,500,000 3,264,437
Derivatives
- (4,706,639) (2,774,667) (829,319) - (8,310,625)
- 4,730,577 2,822,553 865,801 - 8,418,931 ──────── ──────── ──────── ──────── ──────── ────────
30,577,593 40,991,142 10,484,452 833,078 2,500,000 85,386,265 ═══════ ═══════ ═══════ ═══════ ═══════ ═══════
2016
Financial Liabilities
638,336 549,566 149,929 13,348 - 1,351,179
Customers’ deposits 35,199,661 36,765,499 12,803,729 1,153,850 - 85,922,739
Subordinated debt - - 158,421 2,246,171 2,661,843 5,066,435
Derivatives
- (117,369) (332,165) (871,853) (112,322) (1,433,709)
- 123,910 354,898 905,860 112,959 1,497,627 ─────── ─────── ─────── ─────── ─────── ───────
35,837,997 37,321,606 13,134,812 3,447,376 2,662,480 92,404,271 ═══════ ═══════ ═══════ ═══════ ═══════ ═══════
33 FAIR VALUES OF FINANCIAL INSTRUMENTS
The cumulative maturity of commitments and contingencies and derivatives are given in note 19 (c) and note 11 of the consolidated financial statements respectively.
Negative fair value derivatives
Level 2 - Adjusted market prices in active markets for identical assets or liabilities using valuation techniques for which the lowest level input that is significant to the fair
value measurement is directly or indirectly observable.
Subordinated debt
Total
Contractual amounts payable
2017
No fixed
maturity
Other liabilities
Contractual amounts receivable
Total undiscounted financial liabilities
Determination of fair value and the fair value hierarchy
Management uses the following hierarchy for determining and disclosing the fair value of financial instruments:
Liabilities and shareholders' equity
No fixed
maturity
Customers’ deposits
Level 3 - Valuation techniques for which the lowest level input that is significant to the fair value measurement is unobservable
Due to banks and other financial institutions
Level 1 - Quoted (unadjusted) market prices in active primary markets
Total undiscounted financial liabilities
Due to banks and other financial institutions
Contractual amounts payable
Contractual amounts receivable
Due to banks and other financial institutions
The table below summarises the maturity profile of the Group's financial liabilities at year end based on contractual undiscounted repayment obligations. As special
commission payments upto contractual maturity are included in the table, totals do not match with the consolidated statement of financial position. The contractual
maturities of liabilities have been determined based on the remaining period at year end to the contractual maturity date and do not take into account the effective expected
maturities. The Group expects that many customers will not request repayment on the earliest date the Group could be required to pay and therefore the table does not
reflect the expected cash flows indicated by the Group's deposit retention history.
42

Amounts in SAR’000
NOTES TO THE CONSOLIDATED FINANCIAL STATEMENTSFor the year ended December 31, 2017
Carrying value Level 1 Level 2 Level 3 Total
212,218 - 212,218 - 212,218
327,472 153,347 169,795 4,330 327,472 ─────── ─────── ─────── ─────── ───────
539,690 153,347 382,013 4,330 539,690 ─────── ─────── ─────── ─────── ───────
2,115,271 - 2,115,271 - 2,115,271
60,151 - 60,052 - 60,052
16,301,124 - 16,224,881 - 16,224,881
63,639,483 - - 63,388,863 63,388,863 ─────── ─────── ─────── ─────── ───────
82,116,029 - 18,400,204 63,388,863 81,789,067 ═══════ ═══════ ═══════ ═══════ ═══════
91,679 - 91,679 - 91,679
3,344,671 - 3,344,671 - 3,344,671
78,274,963 - 78,274,963 - 78,274,963
2,505,026 - 2,505,026 - 2,505,026 ─────── ─────── ─────── ─────── ───────
84,124,660 - 84,124,660 - 84,124,660 ═══════ ═══════ ═══════ ═══════ ═══════
393,779 - 393,779 - 393,779
462,989 290,199 169,352 3,438 462,989 ─────── ─────── ─────── ─────── ───────
856,768 290,199 563,131 3,438 856,768 ─────── ─────── ─────── ─────── ───────
1,024,369 - 1,024,369 - 1,024,369
61,791 - 60,073 - 60,073
20,733,718 - 20,698,630 - 20,698,630
72,743,097 - - 72,614,833 72,614,833 ─────── ─────── ─────── ─────── ───────
94,562,975 - 21,783,072 72,614,833 94,397,905 ═══════ ═══════ ═══════ ═══════ ═══════
Carrying value Level 1 Level 2 Level 3 Total
270,793 - 270,793 - 270,793
1,347,732 - 1,347,732 - 1,347,732
85,358,788 - 85,358,788 - 85,358,788
3,909,905 - 3,909,905 - 3,909,905 ─────── ─────── ─────── ─────── ───────
90,616,425 - 90,616,425 - 90,616,425 ═══════ ═══════ ═══════ ═══════ ═══════
Loans and advances
Financial liabilities measured at fair value:
Financial investments available for sale
Due to banks and other financial institutions
Customers' deposits
Loans and advances
Other investments at amortised cost
Financial liabilities measured at fair value:
Due to banks and other financial institutions
Financial assets not measured at fair value:
Due from banks and other financial institutions
Total financial liabilities not measured at fair value:
Total financial assets not measured at fair value:
Total financial assets not measured at fair value:
Total financial liabilities not measured at fair value:
Derivative financial instruments
Held to maturity investments
Fair value
Total financial assets measured at fair value:
Financial investments available for sale
Financial assets not measured at fair value:
Due from banks and other financial institutions
Held to maturity investments
Other investments at amortised cost
Derivative financial instruments
Financial assets measured at fair value:
Derivative financial instruments
2017
Subordinated debt
Derivative financial instruments
Total financial assets measured at fair value:
Financial liabilities not measured at fair value:
Financial liabilities not measured at fair value:
2016
Financial assets measured at fair value:
Subordinated debt
The fair values of financial instruments included in the consolidated statement of financial position, except for those held to maturity, other investments held at amortised
cost and loans and advances that are carried at amortised cost, are not significantly different from the carrying values included in the consolidated financial statements. The
estimated fair values of other investments held at amortised cost and held-to-maturity investments are based on quoted market prices, when available, or pricing models in
the case of certain fixed rate bonds. The fair value of special commission-bearing customers’ deposits are not significantly different from their book values since the current
market special commission rates for similar financial liabilities are not significantly different from the contracted rates.
Customers' deposits
The fair values of cash and balances with SAMA, due from banks and other financial institutions and due to banks and other financial institutions, other assets and other
liabilities are not significantly different from the carrying values since the underlying amounts for these categories are for shorter durations which indicates that their
booking rates are not significantly different from the current market rates. The fair value of subordinated debt approximates carrying value since this is a floating rate
liability with special commission rates re-priced every six months.
43

Amounts in SAR’000
NOTES TO THE CONSOLIDATED FINANCIAL STATEMENTSFor the year ended December 31, 2017
Type
Available for sale
investments
Other investments held at
amortised cost
Loans and advances
34
2017 2016
189,337 243,509
1,990 3,129
239 (1,710)
45,769 81,256
Loans and advances 576,689 749,019
9,366 9,972
Investments - 40,028
Customers’ deposits 4,656,774 9,644,108
424,533 698,696
289,146 15,447
Investments 153,347 151,227
Subordinated debt 15,271 15,028
Customers’ deposits 167,453 259,574
311 3,210
Credit spreads
Due from banks and other financial institutions
ABN AMRO Bank N.V
Fair valued using discounted cash flow techniques that use observable
market data inputs for yield curves and credit spread
Inter- relationship between
significant unobservable inputs
and fair value measurement
The wider the movement in credit
spread, the higher the difference
between the carrying values and
fair values
Subordinated debt
None
Derivatives at fair value, net
Valuation techniques include net present value and discounted cash
flow models, comparison with similar instruments for which market
observable prices exist. Assumptions and inputs used in valuation
techniques include risk-free and benchmark interest rates, credit
spreads and other premium used in estimating discount rates, bond
and equity prices and foreign currency exchange rates.
NoneValuation techniques include net present value and discounted cash
flow models, comparison with similar instruments for which market
observable prices exist. Assumptions and inputs used in valuation
techniques include risk-free and benchmark interest rates, credit
spreads and other premium used in estimating discount rates, bond
and equity prices and foreign currency exchange rates.
Valuation technique
Not applicable
Derivatives at fair value, net
The objective of valuation techniques is to arrive at a fair value measurement that reflects the price that would be received to sell the asset or paid to transfer the liability in
an orderly transaction between market participants at the measurement date. The Group uses widely recognized valuation models for determining the fair value of common
and simpler financial instruments. Observable prices or model inputs are usually available in the market for listed debt and equity securities, exchange-traded derivatives
and simple over-the-counter derivatives such as interest rate swaps. Availability of observable market prices and model inputs reduces the need for management judgment
and estimation and also reduces the uncertainty associated with determining fair values. Availability of observable market prices and inputs varies depending on the
products and markets and is prone to changes based on specific events and general conditions in the financial markets.
Derivatives at fair value, net
The balances at reporting date, unless reported elsewhere in the financial statements, resulting from such transactions are as follows:
Associates & other major shareholders and their affiliate entities with significant influence:
Due to banks and other financial institutions
Not applicable
Commitments and contingencies
RELATED PARTY TRANSACTIONS
In the ordinary course of its activities, the Group transacts business with related parties. The related party transactions are performed on an arm’s length basis. Banking
transactions with related parties are governed by limits set by the Banking Control Law and regulations issued by SAMA.
Commitments and contingencies
Mutual funds managed by the Group:
The following table shows the valuation techniques used in measuring fair values at December 31, as well as the significant unobservable inputs used.
Significant unobservable
inputs
44
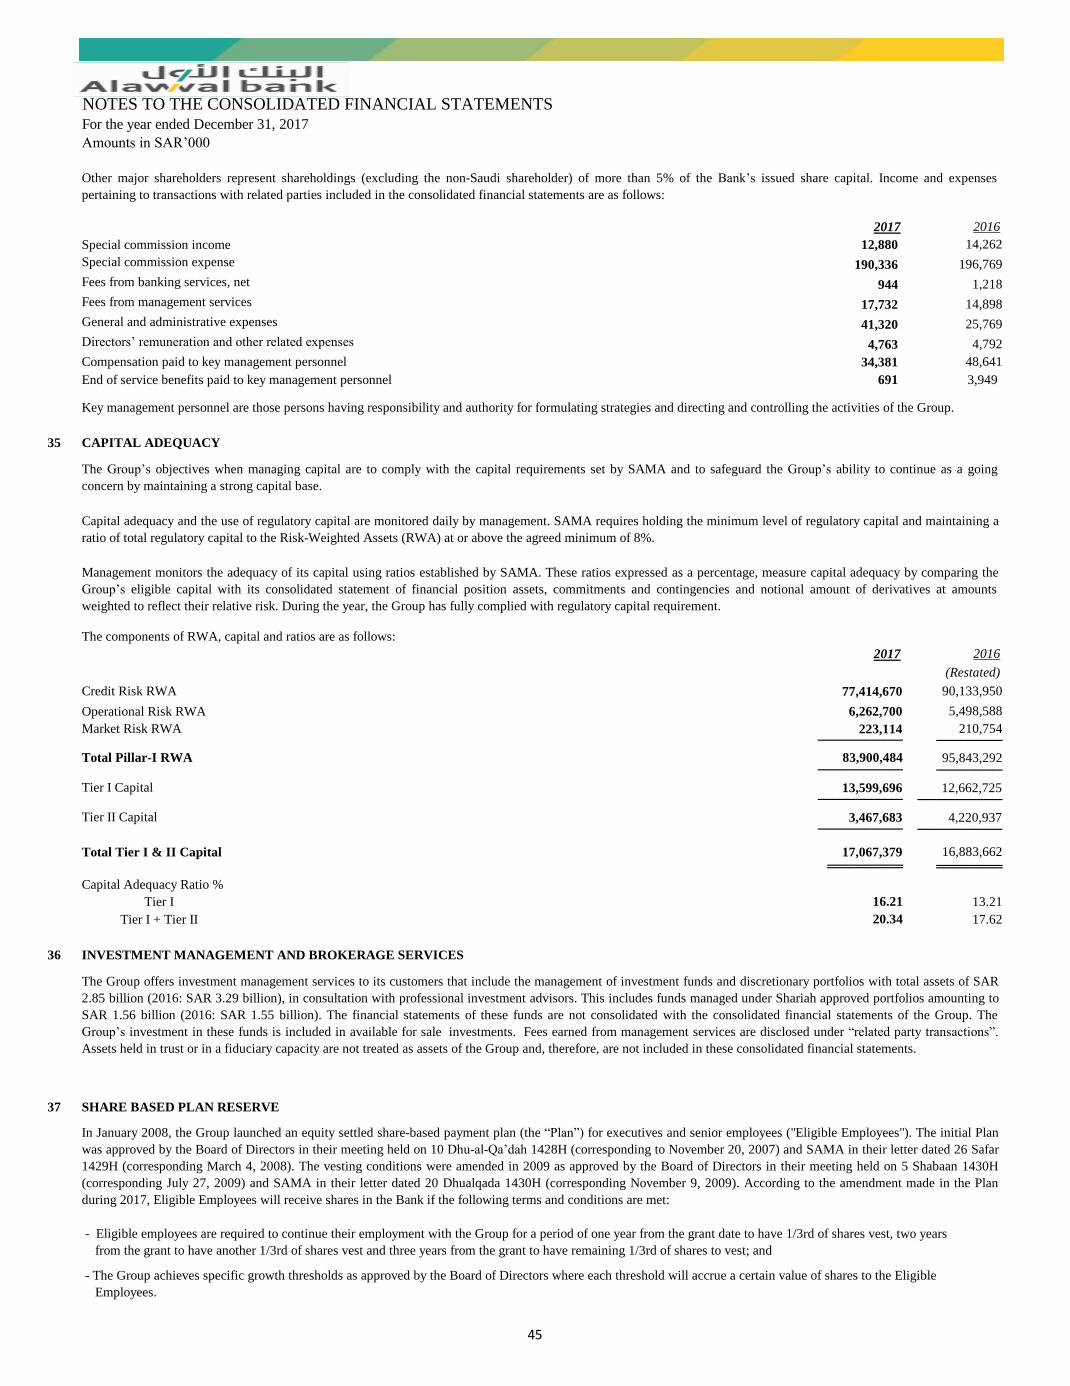
Amounts in SAR’000
NOTES TO THE CONSOLIDATED FINANCIAL STATEMENTSFor the year ended December 31, 2017
2017 2016
12,880 14,262
190,336 196,769
944 1,218
17,732 14,898
41,320 25,769
4,763 4,792
34,381 48,641
End of service benefits paid to key management personnel 691 3,949
35 CAPITAL ADEQUACY
2017 2016
(Restated)
Credit Risk RWA 77,414,670 90,133,950
6,262,700 5,498,588
Market Risk RWA 223,114 210,754 ───────── ───────
Total Pillar-I RWA 83,900,484 95,843,292 ───────── ───────
Tier I Capital 13,599,696 12,662,725 ───────── ─────────
Tier II Capital 3,467,683 4,220,937 ───────── ─────────
17,067,379 16,883,662 ════════ ═══════
Tier I 16.21 13.21
Tier I + Tier II 20.34 17.62
36
37
Total Tier I & II Capital
Operational Risk RWA
The Group offers investment management services to its customers that include the management of investment funds and discretionary portfolios with total assets of SAR
2.85 billion (2016: SAR 3.29 billion), in consultation with professional investment advisors. This includes funds managed under Shariah approved portfolios amounting to
SAR 1.56 billion (2016: SAR 1.55 billion). The financial statements of these funds are not consolidated with the consolidated financial statements of the Group. The
Group’s investment in these funds is included in available for sale investments. Fees earned from management services are disclosed under “related party transactions”.
Assets held in trust or in a fiduciary capacity are not treated as assets of the Group and, therefore, are not included in these consolidated financial statements.
Capital adequacy and the use of regulatory capital are monitored daily by management. SAMA requires holding the minimum level of regulatory capital and maintaining a
ratio of total regulatory capital to the Risk-Weighted Assets (RWA) at or above the agreed minimum of 8%.
Fees from management services
Fees from banking services, net
General and administrative expenses
INVESTMENT MANAGEMENT AND BROKERAGE SERVICES
Key management personnel are those persons having responsibility and authority for formulating strategies and directing and controlling the activities of the Group.
The Group’s objectives when managing capital are to comply with the capital requirements set by SAMA and to safeguard the Group’s ability to continue as a going
concern by maintaining a strong capital base.
- Eligible employees are required to continue their employment with the Group for a period of one year from the grant date to have 1/3rd of shares vest, two years
from the grant to have another 1/3rd of shares vest and three years from the grant to have remaining 1/3rd of shares to vest; and
In January 2008, the Group launched an equity settled share-based payment plan (the “Plan”) for executives and senior employees ("Eligible Employees"). The initial Plan
was approved by the Board of Directors in their meeting held on 10 Dhu-al-Qa’dah 1428H (corresponding to November 20, 2007) and SAMA in their letter dated 26 Safar
1429H (corresponding March 4, 2008). The vesting conditions were amended in 2009 as approved by the Board of Directors in their meeting held on 5 Shabaan 1430H
(corresponding July 27, 2009) and SAMA in their letter dated 20 Dhualqada 1430H (corresponding November 9, 2009). According to the amendment made in the Plan
during 2017, Eligible Employees will receive shares in the Bank if the following terms and conditions are met:
SHARE BASED PLAN RESERVE
Capital Adequacy Ratio %
Directors’ remuneration and other related expenses
Management monitors the adequacy of its capital using ratios established by SAMA. These ratios expressed as a percentage, measure capital adequacy by comparing the
Group’s eligible capital with its consolidated statement of financial position assets, commitments and contingencies and notional amount of derivatives at amounts
weighted to reflect their relative risk. During the year, the Group has fully complied with regulatory capital requirement.
The components of RWA, capital and ratios are as follows:
Special commission expense
Other major shareholders represent shareholdings (excluding the non-Saudi shareholder) of more than 5% of the Bank’s issued share capital. Income and expenses
pertaining to transactions with related parties included in the consolidated financial statements are as follows:
Compensation paid to key management personnel
Special commission income
- The Group achieves specific growth thresholds as approved by the Board of Directors where each threshold will accrue a certain value of shares to the Eligible
Employees.
45

Amounts in SAR’000
NOTES TO THE CONSOLIDATED FINANCIAL STATEMENTSFor the year ended December 31, 2017
Grant in 2017 Grant in 2016 Grant in 2015
March 2017 March 2016 March 2015
11,855,820 26,301,969 28,538,602
12 27 45.56
987,985 974,147 626,396
March 2018 - 2020
Bank’s shares Bank’s shares Bank’s shares
2017 2016
Beginning of the year 3,417,001 1,863,294
987,985 3,065,214
(1,116,845) (759,038)
(309,505) (752,469) ──────── ────────
2,978,636 3,417,001 ═══════ ═══════
38 PROSPECTIVE CHANGES IN THE INTERNATIONAL FINANCIAL REPORTING FRAMEWORK
-
Implementation and Impact Analysis of IFRS-9
Implementation strategy:
The classification and measurement of financial assets (except equity instruments) will depend on how these are managed (the entity’s business model) and their
contractual cash flow characteristics. These factors determine whether the financial assets are measured at amortised cost, fair value through other comprehensive income
(‘FVOCI’) or fair value through income statement (‘FVIS’). For equity instruments that are not held for trading, the Bank may irrevocably elect to designate them as
FVOCI, with no subsequent reclassification of gains or losses to the consolidated income statement. This election is made on an investment-by-investment basis. The
Bank’s debt instrument currently classified as available for sale (AFS) will satisfy the conditions for classification as at fair value through other comprehensive income
(FVOCI) and hence there will be no change in the accounting for these assets except for new impairment requirements.
The amendments made in the Plan during 2017, with respect to vesting period of the grant is applicable to 2017 grant only and the vesting period of the prior grants will be
subject to the policy applicable before the aforementioned amendment. Before the amendments, Eligible employees were required to continue their employment with the
Group for a period of 2 years from the grant date to have half of their shares vest and another year for the remainder to vest.
Classification and measurement:
Method of settlement
Forfeited during the year
The Group has chosen not to early adopt the following new standards and amendments which have been issued but not yet effective for the current accounting year.
Following is a brief on the new IFRSs and amendments to IFRSs and the related impact assessment, effective for annual periods beginning on or after January 01, 2018:
Number of shares granted
In accordance with the terms of the Plan, shares will be granted to eligible employees annually and will vest as described above. The first tranch was granted in 2008 and
was vested in year 2011. The second tranch was granted in March 2011 and vested in January 2013 and 2014. The Group granted further six tranches of the Plan in March
2012, 2013, 2014, 2015, 2016 and 2017, respectively. The Plans from 2015 to 2017 are currently under their vesting periods. The Plan details are as follows:-
Under the provisions of the Plan, the Group at no point becomes the legal owner of the underlying shares. Until such time as these shares vest they will not carry voting
rights. As per the plan, Alawwal Invest manages the Staff Share Plan Fund (the Fund) which will operate in accordance with the terms and conditions as approved by the
Board of Directors in their above referred meeting and by SAMA in their above referred letter. Any further modifications in the terms and conditions of the Plan require
prior approval of SAMA.
The following is the movement in number of shares in grant at December 31, 2017 and 2016.
Plan Commencement date
March 2018 - 2019 March 2017 - 2018
IFRS 9 Financial Instruments:
In July 2014, the IASB issued IFRS 9 Financial Instruments, the standard that replaces IAS 39 Financial Instruments: Recognition and Measurement effective from 1
January 2018, with early adoption permitted. The Bank has treated this as a significant project and set up a multidisciplinary implementation team to achieve a successful
and robust implementation. The project is overseen by a steering committee jointly chaired by the Chief Financial Officer and the Chief Risk Officer.
Grant / additions during the year
During the year Share Based Plan related charge to consolidated income statement amounted to SAR 13.69 million (2016: SAR 10.81 million).
Number of shares
Vesting period
Vested during the year
Fair value per share at grant date (SAR)
Value of shares granted on the grant date (SAR)
During 2008, the Fund purchased 2.15 million Bank’s shares for a total consideration of SR 114 million which are held by it in fiduciary capacity until the shares vest to
the eligible employees. The Fund purchased one million shares in 2012 and 999,063 shares in 2016 worth of SAR 27 million and 25 million, respectively. At the vesting
date the ownership of these shares will pass to the employees. The number of shares granted is calculated in accordance with the performance based formula approved by
the Board of Directors and is subject to approval of the Nomination and Remuneration Committee.
The majority of financial assets that are classified as loans and receivables and are measured at amortised cost under IAS 39 are expected to be measured at amortised cost
under IFRS 9 as well. Other instruments that are classified as AFS under IAS 39 may, under IFRS 9, be measured at FVOCI or FVIS, depending on particular
circumstances. Under IFRS 9, the accounting for financial liabilities will largely remain similar to IAS 39, except for the treatment of gains or losses arising from an
entity’s own credit risk relating to liabilities designated at FVIS. The de-recognition rules have not been changed. The Bank therefore does not expect any material impact
on its financial liabilities and the de-recognition accounting policy.
46

Amounts in SAR’000
NOTES TO THE CONSOLIDATED FINANCIAL STATEMENTSFor the year ended December 31, 2017
- IFRS 15 Revenue from Contracts with Customers:
Impairment:
Stage 1: Performing financial assets that have not significantly deteriorated in credit quality since origination. The impairment allowance will be recorded based on 12
months ECL.
Stage 2: Performing financial assets that have experienced one or more indicator of a significant increase in credit risk. The Bank considers a range of indicators to
assess whether there has been a significant increase in credit risk. These include both quantitative and qualitative measures including increased PD indicated through a
credit rating downgrade, past due amounts and other factors. The impairment allowance will be recorded based on lifetime ECL.
Stage 3: Impaired assets: For Financial assets that are impaired, the Bank will recognise the impairment allowance based on lifetime ECL.
The Bank will consider forward looking information in its calculation of ECLs. The forward looking information to be used will include elements such as macroeconomic
factors (e.g., oil price, unemployment, GDP growth, inflation, profit rates and house prices) and economic forecasts obtained through internal and external sources. To
evaluate a range of possible outcomes, the Bank intends to formulate various scenarios. For each scenario, the Bank will derive an ECL and apply a probability weighted
approach to determine the impairment allowance in accordance with IFRS 9 requirements. The Bank is now in the final phase of implementation; whereby a parallel run
exercise is underway together with various validations of approaches and methods.
Hedge accounting:
The general hedge accounting requirements aim to simplify hedge accounting, creating a stronger link with risk management strategy and permitting hedge accounting to
be applied to a greater variety of hedging instruments and risks. However, they do not explicitly address macro hedging strategies, which are particularly important for
banks. As a result, IFRS 9 allows an accounting policy choice to continue to apply hedge accounting requirements of IAS 39 instead of the requirements of IFRS 9. Based
on the analysis performed to date, the Bank expects to exercise the accounting policy choice to continue IAS 39 hedge accounting requirements.
Overall expected impact
The Bank has reviewed its financial assets and liabilities and is expecting the following impact from the adoption of IFRS 9 on January 1, 2018:
Governance and controls
The Bank has developed a governance framework for IFRS 9 processes. This includes policies requiring Board-level approval as well as more detailed policies and
procedures.
IFRS 15 -- “Revenue from contracts with customers”, applicable for the annual periods beginning on or after 1 January 2018. The new standard presents a five-step model
to determine when to recognize revenue, and at what amount. The application of this standard may have an impact on how and when the revenue is recognised, with new
estimates and judgments, and the possibility of revenue recognition being accelerated or deferred.
Investment, amounting to SR 188 million, that do not meet the criteria to be classified either as at FVOCI or at amortized cost will have to be reclassified to
financial assets at FVIS. Related fair value loss of SAR 18 million will be recorded in the consolidated statement of changes in shareholders' equity on January 1,
2018.
Gains or losses realized on the sale of equity instruments classified as FVOCI will no longer be transferred to consolidated income statement, The value of
investments considered for such classification is not significant.
The new standard also introduces extended disclosure requirements and changes in presentation. These are expected to change the nature and extent of the Bank’s
disclosures about its financial instruments particularly in the year of the adoption of the new standard.
The following further aspects of the IFRS 9 implementation are highlighted:
The Bank will recognize impairment allowances based on a forward looking Expected Credit Loss (ECL) approach on financial assets that are not measured as FVIS. This
mainly includes financing and investments that are measured at amortised cost or at FVOCI (other than equity investments), due from banks and financial institutions,
financial guarantees, lease receivables and credit commitments. No impairment loss will be recognised on equity investments. The key inputs into the measurement of ECL
are the term structure of the following variables:
- Probability of default (PD)
- Loss given default (LGD)
- Exposure at default (EAD)
The above parameters are derived from statistical models, historical data and expert judgement and are adjusted where appropriate to take account of forward looking
information. The Bank will categorize its financial assets into following three stages in accordance with IFRS 9 methodology:
According to transitional provisions for initial application of IFRS 9, the Bank is allowed to recognize any difference between previous carrying amount under IAS 39 and
the carrying amount at the beginning of the annual reporting period that includes the date of initial application in opening consolidated statement of changes in
shareholders' equity. Accordingly, the overall impact on equity and total assets is estimated to be in the range of 0.47% to 1.12% and 0.06% to 0.15%, respectively on the
date of initial application mainly arising due to application of ECL model as against incurred loss model.
Based on the balances as at 31 December 2017, the day 1 impact of IFRS 9 (applicable from 1 January 2018), applying the amortization permitted, would be an
estimated reduction of approximately 0.2% in the Total Capital Adequacy Ratio.
The estimated decrease in shareholders’ equity and total assets includes the impact of both balance sheet classification and measurement changes and the increase to
credit impairment provisions compared to those applied at December 31, 2017 under IAS 39. The assessment above is a point in time estimate and is not a forecast. The
actual effect of the implementation of IFRS 9 on the Bank could vary significantly from this estimate. The Bank continues to refine models, methodologies and controls,
and monitors developments in regulatory rule-making in advance of IFRS 9 adoption on January 1, 2018.
47

Amounts in SAR’000
NOTES TO THE CONSOLIDATED FINANCIAL STATEMENTSFor the year ended December 31, 2017
-
-
39 COMPARATIVE FIGURES
40 BOARD OF DIRECTORS' APPROVAL
IFRS 16 – “Leases”, applicable for the period beginning on or after 1 January 2019. The new standard eliminates the current dual accounting model for lessees under IAS
17, which distinguishes between on-balance sheet finance leases and off-balance sheet operating leases. Instead, IFRS 16 proposes on-balance sheet accounting model.
Amendments to IFRS 2 -- “Share-based Payment”, applicable for the period beginning on or after 1 January 2018. The amendments cover classification and measurement
of three accounting areas, first, measurement of cash-settled share-based payments, second, classification of share-based payments settled net of tax withholdings, and third,
accounting for a modification of a share-based payment from cash-settled to equity-settled.
The consolidated financial statements were authorised for issue by the Board of Directors on 29 Jumada I , 1439H (corresponding to February 15, 2018).
In addition to the restatement set out in note 26, certain other prior period figures have been reclassified to conform to the current period's presentation.
IFRS 16 Leases:
Amendments to IFRS 2:
48