A. Ross, N. Diller, and D. Hastings Massachusetts...
14
41 st Aerospace Sciences Meeting and Exhibit 6 – 9 January 2003 Reno, Nevada AIAA 2003-1328 Multi-Attribute Tradespace Exploration with Concurrent Design for Space System Conceptual Design A. Ross, N. Diller, and D. Hastings Massachusetts Institute of Technology Cambridge, MA For permission to copy or republish, contact the copyright owner named on the first page. For AIAA-held copyright, write to AIAA Permissions Department, 1801 Alexander Bell Drive, Suite 500, Reston, VA, 20191-4344.
Transcript of A. Ross, N. Diller, and D. Hastings Massachusetts...

41st Aerospace Sciences Meeting and Exhibit 6 – 9 January 2003
Reno, Nevada
AIAA 2003-1328 Multi-Attribute Tradespace Exploration with Concurrent Design for Space System Conceptual Design
A. Ross, N. Diller, and D. Hastings Massachusetts Institute of Technology Cambridge, MA
For permission to copy or republish, contact the copyright owner named on the first page. For AIAA-held copyright, write to AIAA Permissions Department,
1801 Alexander Bell Drive, Suite 500, Reston, VA, 20191-4344.

American Institute of Aeronautics and Astronautics
1
MULTI-ATTRIBUTE TRADESPACE EXPLORATION WITH CONCURRENT DESIGN FOR SPACE SYSTEM CONCEPTUAL
DESIGN
Adam M. Ross*, Nathan P. Diller†, Daniel E. Hastings± Massachusetts Institute of Technology, Cambridge, Massachusetts 02139
The complexity inherent in space systems necessarily requires intense expenditures of resources both
human and monetary. The high level of ambiguity present in the early design phases of these systems causes long, highly iterative, and costly design cycles, especially due to the need to create robust systems that are inaccessible after deployment. This paper looks at incorporating decision theory methods into the early design processes to streamline communication of wants and needs among stakeholders and between levels of design. Communication channeled through formal utility interviews and analysis enables engineers to better understand the key drivers for the system and allows a more thorough exploration of the design tradespace. Multi-Attribute Tradespace Exploration (MATE), an evolving process incorporating decision theory into model and simulation-based design, has been applied to several space system projects. Preliminary results indicate that this process can improve the quality of communication to more quickly resolve project ambiguity, and enable the engineer to discover better value designs for multiple stakeholders. MATE is also being integrated into a concurrent design environment to facilitate the transfer knowledge of important drivers into higher fidelity design phases. Formal utility theory provides a mechanism to bridge the language barrier between experts of different backgrounds and differing needs (e.g. scientists, engineers, managers, etc). MATE with Concurrent Design (MATE-CON) couples decision makers more closely to the design, and most importantly, maintains their presence between formal reviews. In addition to the development of the process itself, Dependency Structure Matrix (DSM) analysis is used to compare the structure of the MATE-CON process to that of the NASA systems engineering process to gain insights into their relative time performance.
NOMENCLATURE
K multi-attribute utility normalization constant
ki multi-attribute utility scaling factor for attribute i
N number of attributes U(X) multi-attribute utility function Ui(Xi) single attribute utility function i Xi single attribute i
INTRODUCTION
In order to address the need for developing the right system in addition to developing the system right, a new approach to space system design is proposed. This process explicitly incorporates the preferences of key decision makers into the design process in order to empower engineers to make more informed design trades. Simulation and model-based concurrent design enable designers to rapidly assess a large number of potential designs. Decision maker
preferences, replacing traditional notions of requirements, in addition to rapid, large tradespace exploration form the basis of the proposed Multi-Attribute Tradespace Exploration with Concurrent Design (MATE-CON) process. The first half of this paper describes the process.
Development of a process is not sufficient to justify changing system design methods. The structure and dependencies of the process itself is investigated using Design Structure Matrix (DSM) analysis. DSM analysis enables a formal evaluation of the duration and iterative nature of a process. The structure of the MATE-CON process is compared to the published NASA systems engineering process in the second half of this paper.
MOTIVATION
Cost committal at the beginning of the design process makes early attention a high leverage point for improving system cost. The additional need for getting the project right due to the fact that space
Copyright © 2002 by Adam Ross and Daniel Hastings. Published by the American Institute of Aeronautics and Astronautics, Inc., with permission. *Graduate Research Assistant, Department of Aeronautics and Astronautics, Student Member AIAA ([email protected]) †1st Lieutenant, US Air Force/Wichita Falls, TX, Student Member AIAA ±Professor, Department of Aeronautics and Astronautics, Fellow AIAA

American Institute of Aeronautics and Astronautics
2
systems usually cannot be repaired or upgraded adds significant cost as well. (The Hubble Space telescope is a notably exception, though the servicing cost would make this option infeasible for almost any space system).
Long iteration times and communication bottlenecks extend project duration longer than they need to be, resulting in higher costs. Advances in academic research on product development processes suggest methods for improving and streamlining development processes.
Counter to the past tendency for engineers to specialize, there is growing demand for systems engineers to manage the growing complexity of space systems. The general lack of “systems thinking” in industry results in shortsighted decisions that may result in increased system rework. Stakeholder analysis and inclusion into system design and development should force systems-level thinking and direct engineers to focus on the more important regions of the complex tradespace with a broader perspective.
TAXONOMY
Architecture is the level of segmentation for analysis that represents overall project form and function. It is also used to describe design alternatives that are identified by a particular design vector.
Attribute is a decision maker-perceived metric that measures how well a decision maker-defined objective is met.
Concurrent Design refers to techniques of design that utilize information technology for real-time interaction among specialists. This technique of design, conceived in the early 1990s, entails teaming experts in the various fields affected by a design and providing information technology to facilitate these experts in designing the system for development, production, operation, maintenance, and retirement. The addition of concurrent design to the MATE-CON process ensures that the various stakeholders and experts are being driven by a common goal—utility. Providing a clear, common metric creates motivation and cohesion among the stakeholders without relying on the variable experience of a particular manager.
Decision Maker is a person that makes decisions that impact a system at any stage of its lifecycle. In particular, the decision maker is a person that has significant influence over the allocation of resources for the project.
Design variable is a designer-controlled quantitative parameter that reflects an aspect of a concept. Typically these variables represent physical aspects of a design, such as orbital parameters, or power subsystem type. Design variables are those
that will be explicitly traded in the MATE-CON analysis.
Design vector is a set of design variables that, taken together, uniquely define a design or architecture. The vector provides a concise representation of a single architecture, or design.
Exploration is the utility-guided search for better solutions within a tradespace. This approach is not an optimization technique, but is instead a means for investigating a multitude of options, thus deriving information that will become the basis of decision-making. The “action of examining; investigation, or scrutiny” is where the designer begins to creatively consider the various possibilities contained in the tradespace, and how that tradespace might be broadened.1 Many times this requires human interaction that is simply not conducive to optimization techniques in the strict sense. The exploration of a multitude of design combinations with respect to a common metric is fundamental to MATE-CON.
Pareto Frontier is the set of efficient allocations of resources forming a surface in metric-space. Movement along the frontier requires making one metric worse off in order to improve another.
Tradespace is the space spanned by completely enumerated design variables. It is the potential solution space. The expansion of this tradespace is the essence of innovation—a creative recombination of current resources or systems to create a new system, which never before existed. Building upon the Generalized Information Network Analysis (GINA) technique developed at the Space System Laboratory at MIT, MATE-CON takes advantage of advances in computation to enumerate a set of design variables for cross-design comparisons.2 The enumeration of a large tradespace helps prevent designers from starting with point designs, and allows them to recognize better design solutions.3
Utility is a dimensionless parameter that reflects the “perceived value under uncertainty” of an attribute.4 Often used in economic analysis, utility is the intangible personal goal that each individual strives to increase through the allocation of resources.
PROCESS
The MATE-CON process overlaps the first few phases of product development: Concept Development and System-Level Design.5 As practiced, MATE-CON output will result in system requirements for the Detail Design phase to follow. The MATE-CON process is described through application to the example mission Project X-Terrestrial Observer Swarm (X-TOS) in Ross et al. (2002).6

American Institute of Aeronautics and Astronautics
3
Decision makers
In order to formalize inclusion of various upstream stakeholders typically not considered by the design engineer, several classifications of decision makers, or roles, have been identified based upon their impact type on the space system product. Figure 1 shows the roles and their notional relationship to the product.
Level 0 decision makers are classified as External Stakeholders. These stakeholders have little stake in the system and typically have control over policies or budgets that affect many systems. An example of an External Stakeholder for a space system is Congress or the American people. Level 1 decision makers include the Firm and the Customer. The Firm role includes those who have organizational stakes in the project and manage the Designers. This decision maker may have stakes in multiple projects, but has specific preferences for the system in question. An example of a Firm is an aerospace company. The Customer role includes those who control the money for financing the project. This decision maker typically contracts to the Firm in order to build the system and provides requirements to the Designer. Level 2 decision makers include the Designer and the User. The User role has direct preferences for the system and typically is the originator of need for the system. (Need can originate within an organization, such as the Firm, as well. See Ulrich and Eppinger (2000) for discussions on firm strategies and enterprise opportunities.) An example of a User is a scientist or war fighter. The Customer typically has
preferences that balance product performance meeting User needs, cost of the system, and political considerations. The Designer role has direct interaction with the creation of the system and tries to create a product that meets the preferences of the Firm, Customer, and User roles. An example of a Designer is the system engineer within the aerospace company building the system.
Process Description
At a high level, MATE-CON has five phases: Need identification, Architecture Solution Exploration, Architecture Evaluation, Design Solution Exploration, and Design Evaluation, shown in Figure 2. The Need Identification phase motivates
Figure 1 Decision Maker Roles and Levels
Figure 2 MATE-CON Process
External Stakeholders
Firm Customer
Designer User
Level 0
Level 1
Level 2
Contracts
Requir
emen
ts
Polic
y, e
tc. Policy, etc.
Organizational Goals
Operational Strategy
designs uses
External Stakeholders
Firm Customer
Designer User
Level 0
Level 1
Level 2
Contracts
Requir
emen
ts
Polic
y, e
tc. Policy, etc.
Organizational Goals
Operational Strategy
designs uses
External Stakeholders
Firm Customer
Designer User
Level 0
Level 1
Level 2
Contracts
Requir
emen
ts
Polic
y, e
tc. Policy, etc.
Organizational Goals
Operational Strategy
designs uses
Architecture Exploration
Architecture Evaluation
Need Identification
Design Exploration
Design Evaluation
System Design(s)
Architecture Exploration
Architecture Evaluation
Need Identification
Design Exploration
Design Evaluation
System Design(s)
Architecture Exploration
Architecture Evaluation
Need Identification
Design Exploration
Design Evaluation
System Design(s)

American Institute of Aeronautics and Astronautics
4
the entire project, providing the needs, mission, and scope for the project. MATE-CON is the marriage of the architecture-level exploration and evaluation (MATE) with the design-level exploration and evaluation (CON). Architecture-level exploration and evaluation is accomplished using models and simulations to transform a large set of design vectors to attributes and then evaluating each set of attributes in utility-cost space. The set of modeled design vectors, or architectures, are analyzed in utility-cost space and the best architectures are selected for the design-level exploration and evaluation. Design-level work is done in a concurrent design environment using ICEMaker, a process and product from the Caltech Laboratory for Space Mission Design.7 Knowledge gained from the design-level analysis is flowed back to the architecture-level analysis to improve the fidelity of the models and architecture selection.
Need identification
MATE-CON begins with a set of decision makers with needs and preferences about a system. These decision makers can come from any one of the roles depicted in Figure 1, as needs can be motivated by market pull, technology push, or customized needs.8 Discussions with the Designer attempt to increase awareness of each roles’ knowledge and preferences. The driving preferences of the decision makers are captured through attributes using Multi-Attribute Utility Analysis and form the Preference-space through which potential systems will be evaluated.
Translating Preferences
Since the purpose of MATE-CON is to find the set of designs that will provide the best value for the decision makers, it is essential to understand how the decision makers trade the various attributes. One method that has been used with some success is Multi-Attribute Utility Theory (MAUT).9 Utility theory maps preferences for an attribute into a normalized value-under-uncertainty function, known as utility. MAUT combines single attribute utility functions into a single function that quantifies how a decision maker values different attributes relative to one another, taking into account the levels of each attribute. Having a single utility metric to reflect the decision maker preferences on a system helps to refine tradespace exploration. The utility value can be expanded back to both the values of each attribute and the single attribute utility values for a more detailed comparison. In this way no information is lost from the process, while maintaining manageability through a minimal number of decision metrics. One must understand the many underlying
assumptions of MAUT in order to correctly implement the theory.10 One such assumption, preferential independence, allows for segmenting the utility function into an aggregate of single attribute utility functions.
Among the MAUT assumptions, if both the preferential and utility independent assumptions hold, then the multi-attribute utility function for each decision maker can take the following form:
[ ]∏=
+=+N
iiii XUKkXKU
1
1)(1)( (1)
• K is the solution to [ ]∏=
+=+N
iiKkK
1
11 ,
and
0,1
;01,1
;0,1
==
<<−>
><
�
�
�
Kk
Kk
Kk
N
ii
N
ii
N
ii
(If these assumptions do not hold, MAUT can still be used, albeit with more time-consuming analysis.)
If there are no cross-term benefits for the attributes, then the simpler additive multi-attribute utility function can be used (this is the case where K=0). The simple weighted sum is the typical method for aggregating metrics in design.
�=
=N
iii XUkXU
1
)()( (2)
The process of constructing these utility functions
involves the determination of the single attribute utility curves and the ki multi-dimensional weighting factors. Performing this utility assessment is fundamental to successfully constructing these multi-attribute utility functions.
Utility Assessment (MIST)
Once the attribute definitions and ranges have been decided, the utility interview can be written. The entire interview is a collection of single attribute utility interviews and a corner point interview. The single attribute utility interviews use the lottery equivalent probability method and each question is dependent upon the interviewee’s responses. The utility function for each attribute can be derived from the indifference points from the lottery equivalent

American Institute of Aeronautics and Astronautics
5
questions. It is important to carefully craft the scenario for each attribute to place the interviewee in the proper mindset to answer lottery questions for the attributes. From the initial implementation one finds that thinking in terms of probabilities is difficult and is a major limitation of the process. Therefore, it is important to guide the interviewee until the person is comfortable with the question format.
Prior research has addressed the issue of utility assessment.11,12,13 Based on this research, the Space Systems, Policy, and Architecture Research Center at MIT (SSPARC) has developed its own Excel-based utility assessment tool in order to simplify, standardize, and expedite the interviewing process. The tool, the Multi-attribute Interview Software Tool (MIST), is deployable and has been shown to reduce by half the time required for an interview.14
Regarding Multiple Decision Makers
At this point it is necessary to make some comments regarding the assessment of multiple decision makers. While in many cases a single decision maker can be identified, there is nonetheless a strong possibility that other significant stakeholders will influence key decisions. Often this influence is implicit through the main decision maker having preferences regarding the satisfaction of other stakeholders. An example of such a relationship would be that of an acquisition customer wanting the end users to be satisfied, such as the Air Force wanting the scientists and war fighters satisfied by a particular satellite system. In an ideal world, the decision maker would have complete knowledge of the multifaceted preferences of each stakeholder, however in reality this knowledge is incomplete and obfuscated by politics. The role framework mentioned above helps the Designer explicitly incorporate the important sets of preferences that shape the needs for the space system.
The strength of Multi-Attribute Utility Theory lies in its ability to capture in a single metric the complex preferences of a single decision maker. The preferences of multiple decision makers, however, cannot be aggregated into a single metric.15 Instead of aggregation, the multiple utility functions are continuously assessed and can be used for negotiation among the decision makers. In addition, knowledge of these utility functions enables Designers to avoid exploring regions of the tradespace that are clearly dominated solutions, thereby finding better designs for all decision makers. A multidimensional Pareto efficient surface will define the best sets of architectures. Deciding which designs to pursue is a human process that combines negotiation, politics and other exogenous factors. MATE-CON enlightens participants by focusing on higher value solutions.
Architecture-level analysis
As preferences are being captured, the Designer is developing the Tradespace through the creation of design variables that will achieve the preferences expressed by the decision makers. No formal theory has been used to develop the design variables, but Quality Functional Deployment-like (QFD) methods have been used to organize and prioritize suggested variables. Engineering expertise and experience drives the creation of these variables.
Once the Tradespace and Preference space have been defined, the Analyst develops software models and simulations to map the design variables to the attributes. Once the models are verified, the Designer enumerates the design variables and evaluates hundreds or thousands of design vectors by calculating their attribute values and subsequently their utility values and costs. The Solution space contains the mapping of the design vectors to Utility-cost space. The Pareto frontier designs are selected as the Reduced solution space and are used to validate and perform sensitivity analysis on the tradespace and models. After analysis, a Reduced solution set of designs is presented to the decision makers for higher fidelity decision-making. Because MAUA only captures the driving preferences and not all preferences, it is necessary to use the actual decision makers for final evaluation, rather than their proxy preference functions. Selected designs are then flowed down to the design-level analysis.
Design-level analysis
The design-level analysis involves a concurrent design team analyzing the selected architectures at a higher fidelity in a real-time environment. Subsystem engineers each have their own set of design tools at a computer terminal and these chairs are linked to a central server. Representatives of downstream stakeholders, such as manufacturing and operations, take part in the concurrent design session to ensure that their expertise is incorporated into the design. The systems engineer maintains system-level information. Additionally, the MATE-CON chair incorporates all of the knowledge and models from the architecture-level analysis for real-time analysis of the designs. The baseline design provided from the architecture-level analysis is fed into ICEMaker and the team converges upon a feasible design through iteration and design trades. The MATE-CON chair directs the session by continuously monitoring the utility and cost of each design. Lessons learned during the concurrent sessions are incorporated into the MATE-CON chair by improving the models used in the architecture search. The appropriate level of fidelity for the architecture-level analysis is reached

American Institute of Aeronautics and Astronautics
6
when results do not conflict with the design-level analysis.
CASE STUDIES
Dependency Structure Matrices (DSM)
Any process can be represented by a directed graph. Each node of the graph represents a discrete step, or task, necessary in the process. Directed arcs show the direction of process execution and dependency among the tasks. The directed graph, or digraph, representation can become unwieldy for large processes. The matrix formulation of the digraph provides a compact notation that lends itself to ready manipulation. In a DSM, tasks are placed in order of execution and label the rows and corresponding columns of the matrix. Dependencies among the tasks are labeled by ones in the matrix, corresponding to the directed arcs in the digraph.
There are three types of relationships that can exist between two tasks. Table 1 shows the three types of dependencies and their corresponding representation in a DSM. The value of the DSM formulation lies in its ability to readily visualize and manipulate the structure of a process through simple matrix operations.
Dependency Structure Matrix (DSM) analysis has been used to analyze process structures and flows. Eppinger et al. (1994, 2001) have applied DSM analysis to various design and manufacturing processes, providing insights into process modification that resulted in both time and cost savings due to streamlined communications and less slack time.16, 17
Methodology
In order apply DSM analysis to the MATE-CON process, it was first necessary to partition the process into discrete tasks. Figure 3 shows the current MATE-CON activity list. The list was derived through a hierarchical decomposition process, starting from a high-level description of the process and breaking it down into smaller steps. Iterative discussions with other MATE-CON practitioners
resulted in the list of Figure 3. In their application to the automotive and aircraft industry, Eppinger (2001) utilized questionnaires to capture the activity listing for DSM analysis.18 Expert opinion and experience are the best sources for the activity information.19
The original MATE-CON DSM structure was then subjected to a DSM optimization routine that sought to minimize both the number and size of feedback loops in the process.20 The resulting DSM was labeled the “optimal” MATE-CON process and is shown in Figure 4. Inspection of the process revealed that there were no obvious nonsensical orderings of activities (such as presenting results before performing simulations).
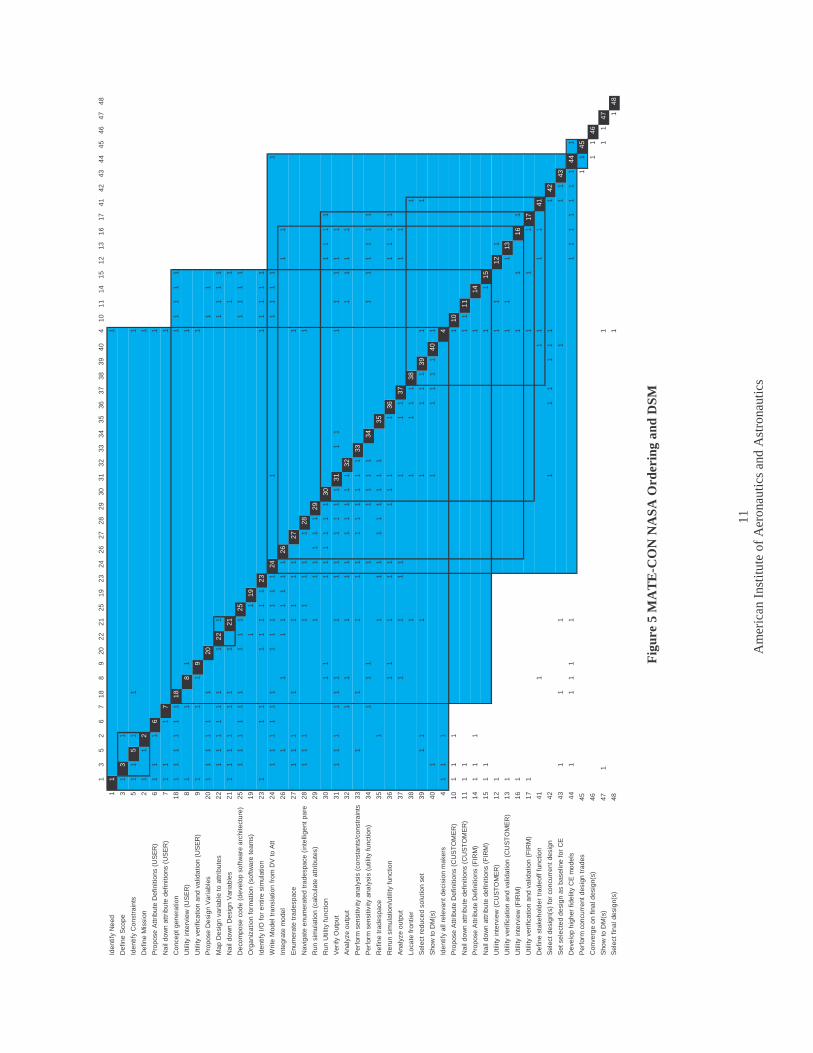
The NASA case study activity list ordering is based upon the official systems engineering process through Phase A product development as published and described in the NASA Systems Engineering Handbook.21 The published process, based upon official tasks descriptions, was mapped to the corresponding MATE-CON tasks. The resulting ordering is in Figure 5. The numbers correspond to the original MATE-CON process ordering.
Metrics
Typically space systems and projects are evaluated along four dimensions: cost, schedule, performance and risk. These metrics can be thought of as cost, time, quality, and risk. The quality aspect of the system is addressed through the value-centric philosophy of the MATE-CON process. The risk aspect of the system is addressed through uncertainty and sensitivity analysis. On-going research applying real options and portfolio theory to MATE-CON-derived solutions address the reduction of risk and increasing robustness.
In the design phase of a project, the principle cost driver is labor cost, which is a function of time and number of workers. For a fixed number of engineers, the cost scales directly with time, therefore these two aspects are really the same thing: time. Building off of the overview given in the proceeding section, in order to measure the effectiveness for the MATE-CON process in the cost/time dimensions, the following metrics were selected: Number of
Three Configurations that Characterize a System Relationship Parallel Sequential Coupled Graph
Representation
DSM
Representation A B
A B
A B A B X
A B A X B X
Table 1 The Three Dependency Types

American Institute of Aeronautics and Astronautics
7
Feedback blocks, the Mean Feedback block size, the Standard Deviation of Feedback block size, the Maximum Feedback block size, and the Number of Bands. Minimizing the value of these metrics will, in general, result in a shorter process. It is not provably true that minimizing these metrics will result in a better and faster process, however, it is true for most cases.
For a given activity list, the minimum time to complete the process is the sum of the individual activity durations. As feedbacks are added to the DSM, activities are repeated and the total time to completion increases. In order to minimize repetition of tasks, feedback blocks should be as small as possible. Additionally, banding the DSM will result in fewer total activities since some activities can be performed concurrently, however resource bottlenecks can occur when too many tasks are done in parallel. As a result of the preceding logic, the metrics are ordered in decreasing importance as in Table 2 DSM Metrics.
Table 2 DSM Metrics
Metric What it measures 1. Number of Feedback
Blocks (N) Iteration/rework
2. Mean Size of Feedback Blocks (Mean)
Number reworked
3. Standard Deviation of Feedback Blocks (Std Dev)
Risk of large rework
4. Maximum Size of Feedback Blocks
Worst feedback
5. Number of Bands Concurrency As a caveat to the above, it sometimes can be the
case that feedback blocks are both necessary and desirable. The concept of a “minimum time constant” for a process can limit strict optimization of the DSM. Time for learning, creativity, and ambiguity resolution in the design process can necessitate returning to prior activities in order to revise assumptions and make better design decisions. The “minimum time constant” will vary from project to project and team to team, as it encompasses the human aspects of design, as well as the uniqueness of new projects. This caveat must be kept in mind when following the next section’s recommended activity ordering.
Results
Table 3 DSM Study Metric Results
Study Metric
Optimal Original NASA
Number feedbacks
14 18 78
Mean blocksize
3.9 4.1 15.9
Std Dev blocksize
4.5 4.8 8.3
Max blocksize
19 20 31
Number bands
38 39 37
Sensitivities
The total number of possible permutations of the MATE-CON process is forty-eight factorial (48!), or approximately 1.24x1061. The approach taken in the sensitivity analysis is addressed in the following question: given an optimal ordering of the process, how much can the metric vary under subtle permutations in the ordering? Subtle permutations are defined as swapping two activities, or taking an activity and inserting it elsewhere in the process. These permutations are first order when done only once. A second order permutation could include two swaps, a swap and an insertion, or two insertions.
The two types of actions can be described as: swap(A,B) swap activity at location A
with activity at location B insert(A,B) place activity from
location A in location B and shift other activities The sensitivity results have only looked at first
order permutations of N, mean, std dev, and bands. Two types of inserts were defined: InsertsA (insert activity later in process) and InsertsB (insert activity earlier in process). Each of the swaps, insertsA, and insertsB looked at 1129 permutations for a total of 3387 permutations investigated. Figure 6 shows the results for these first order permutations plotted against the case study values.
For Swaps, 52 have mean greater than NASA. For InsertsA, 41 have mean greater than NASA. For InsertsB, zero have mean greater than NASA. No cases had number of feedbacks greater than NASA.

American Institute of Aeronautics and Astronautics
8
DISCUSSIONS
The results in Table 3 show that the NASA case has many more feedback loops (78) than the optimal MATE-CON case (14). Translating this result into time space, it means that for a given set of tasks, the process ordering with more feedbacks will necessarily take longer. Comparing Figure 4 with Figure 5 reveals that the majority of the extra feedback loops in the NASA case come from not discovering the Customer and Firm attributes and utility functions until late in the design process. This discovery coincides with design reviews that take place after initial concept development based upon User-only revealed preferences. In the context of the MATE-CON process, this late discovery of key decision maker preferences will necessarily result in rework and delays. The optimal MATE-CON process ordering avoids this rework by discovering important preferences early in the development process.
The mean block size for the NASA case (15.9 tasks) is also much larger than the optimal MATE-CON case (3.9 tasks). The large size of the feedback block is due to the extensive rework and redesign caused by discovery of new preferences of key decision makers late in the process. Revealed preferences of key decision makers can result in complete redesign of the system concept. Multiplying the mean blocksize by an average task length can translate the mean blocksize into units of time. An alternate interpretation is to consider that for a fixed task length, the mean blocksize for the NASA process is 15.9/3.9, or about 4, times longer than the optimal MATE-CON process mean block size.
The other metrics in Table 3 also show the MATE-CON process performing favorably as compared to the NASA process. Focusing on the User preferences, instead of all of the important decision makers, is a fundamental part of the NASA process philosophy and can account for most of the performance differences between the processes. Late revealed preferences can result in significant rework, and can be considered similar to a change in requirements.
NASA has many talented and experienced engineers, so what accounts for the apparent poor performance as compared to MATE-CON? The answer probably lies in the historical inheritance of NASA. As an organization with a high priority on science, NASA has developed a User-centric culture. Active recognition of other key decision maker roles probably does not take place until formal design reviews, however, even during these reviews, the roles are not recognized as such, but rather as further constraints placed on the system. (For example, the
system must fall within the resource constraints perceived by the project manager.) NASA engineers are not blind, but rather, in the context of science user requirements driven design, they would not see the explicit role of other key decision makers and their effect on the system development process.
The sensitivity analysis in Figure 6 reveals that given the optimal MATE-CON process, first order perturbations cannot result in a process with as many feedback loops as the NASA process. Only 93 perturbations out of 3387 resulted in mean blocksizes greater than the NASA process. Several perturbations, possibly considered mistakes, will be necessary for the MATE-CON process to approach the rework delays in the NASA process. The conclusion is that given a set of tasks for a project, the MATE-CON process is faster than the NASA process, and therefore cheaper since time is equivalent to cost for the conceptual design process.
CONCLUSION
The MATE-CON process has explicitly addressed the need for value-focused space system conceptual design. Formal utility analysis, coupled with simulation-based and concurrent design enable broad and rapid tradespace exploration to find designs that deliver more value to key decision makers. DSM analysis has revealed that the MATE-CON process will potentially take less time than the traditional NASA systems engineering process through the conceptual design phase due to less potential iteration in the process structure. Although not conclusively proven a superior process, MATE-CON aligns well with the traditional aerospace-focused metrics of performance, cost, schedule, and risk. Displaying possibly better performance than NASA’s current process, MATE-CON warrants further research and application efforts.
ACKNOWLEDGEMENTS
This work was supported in part by the Department of Defense. The authors would like to thank the members of the SSPARC team including Dr. Annalisa Weigel, Dr. Myles Walton, Dr. Hugh McManus, Dr. Cyrus Jilla, Dr. Joyce Warmkessel, and Dr. Amar Gupta for providing valuable insight. This work has also built upon the design studies of the Space Systems Laboratory and previous graduate design courses. Several theses have also made invaluable contributions to this work including the masters theses of Lt. Nathan Diller, Satwik Seshasai, and Philippe Delquie.

American Institute of Aeronautics and Astronautics
9
Figure 3 Activity List Comparisons (Original, Optimal, NASA)
1 Identify Need 1 Identify Need 1 Identify Need
2 Define Mission 2 Define Mission 3 Define Scope
3 Define Scope 3 Define Scope 5 Identify Constraints
4 Identify all relevant decision makers 4 Identify all relevant decision makers 2 Define Mission
5 Identify Constraints 5 Identify Constraints 6 Propose Attribute Definitions (USER)
6 Propose Attribute Definitions (USER) 6 Propose Attribute Definitions (USER) 7 Nail down attribute definitions (USER)
7 Nail down attribute definitions (USER) 7 Nail down attribute definitions (USER) 18 Concept generation
8 Utility interview (USER) 10 Propose Attribute Definitions (CUSTOMER) 8 Utility interview (USER)
9 Utility verification and validation (USER) 11 Nail down attribute definitions (CUSTOMER) 9 Utility verification and validation (USER)
10 Propose Attribute Definitions (CUSTOMER) 14 Propose Attribute Definitions (FIRM) 20 Propose Design Variables
11 Nail down attribute definitions (CUSTOMER) 15 Nail down attribute definitions (FIRM) 22 Map Design variable to attributes
12 Utility interview (CUSTOMER) 18 Concept generation 21 Nail down Design Variables
13 Utility verification and validation (CUSTOMER) 8 Utility interview (USER) 25 Decompose code (develop software architecture)
14 Propose Attribute Definitions (FIRM) 9 Utility verification and validation (USER) 19 Organization formation (software teams)
15 Nail down attribute definitions (FIRM) 12 Utility interview (CUSTOMER) 23 Identify I/O for entire simulation
16 Utility interview (FIRM) 13 Utility verification and validation (CUSTOMER) 24 Write Model translation from DV to Att
17 Utility verification and validation (FIRM) 16 Utility interview (FIRM) 26 Integrate model
18 Concept generation 17 Utility verification and validation (FIRM) 27 Enumerate tradespace
19 Organization formation (software teams) 20 Propose Design Variables 28 Navigate enumerated tradespace (intelligent pare down)
20 Propose Design Variables 21 Nail down Design Variables 29 Run simulation (calculate attributes)
21 Nail down Design Variables 22 Map Design variable to attributes 30 Run Utility function
22 Map Design variable to attributes 25 Decompose code (develop software architecture) 31 Verify Output
23 Identify I/O for entire simulation 19 Organization formation (software teams) 32 Analyze output
24 Write Model translation from DV to Att 23 Identify I/O for entire simulation 33 Perform sensitivity analysis (constants/constraints)
25 Decompose code (develop software architecture) 24 Write Model translation from DV to Att 34 Perform sensitivity analysis (utility function)
26 Integrate model 26 Integrate model 35 Refine tradespace
27 Enumerate tradespace 27 Enumerate tradespace 36 Rerun simulation/utility function
28 Navigate enumerated tradespace (intelligent pare down)28 Navigate enumerated tradespace (intelligent pare down)37 Analyze output
29 Run simulation (calculate attributes) 29 Run simulation (calculate attributes) 38 Locate frontier
30 Run Utility function 30 Run Utility function 39 Select reduced solution set
31 Verify Output 31 Verify Output 40 Show to DM(s)
32 Analyze output 32 Analyze output 4 Identify all relevant decision makers
33 Perform sensitivity analysis (constants/constraints) 33 Perform sensitivity analysis (constants/constraints)10 Propose Attribute Definitions (CUSTOMER)
34 Perform sensitivity analysis (utility function) 34 Perform sensitivity analysis (utility function) 11 Nail down attribute definitions (CUSTOMER)
35 Refine tradespace 35 Refine tradespace 14 Propose Attribute Definitions (FIRM)
36 Rerun simulation/utility function 36 Rerun simulation/utility function 15 Nail down attribute definitions (FIRM)
37 Analyze output 37 Analyze output 12 Utility interview (CUSTOMER)
38 Locate frontier 38 Locate frontier 13 Utility verification and validation (CUSTOMER)
39 Select reduced solution set 39 Select reduced solution set 16 Utility interview (FIRM)
40 Show to DM(s) 40 Show to DM(s) 17 Utility verification and validation (FIRM)
41 Define stakeholder tradeoff function 41 Define stakeholder tradeoff function 41 Define stakeholder tradeoff function
42 Select design(s) for concurrent design 42 Select design(s) for concurrent design 42 Select design(s) for concurrent design
43 Set selected design as baseline for CE 43 Set selected design as baseline for CE 43 Set selected design as baseline for CE
44 Develop higher fidelity CE models 44 Develop higher fidelity CE models 44 Develop higher fidelity CE models
45 Perform concurrent design trades 45 Perform concurrent design trades 45 Perform concurrent design trades
46 Converge on final design(s) 46 Converge on final design(s) 46 Converge on final design(s)
47 Show to DM(s) 47 Show to DM(s) 47 Show to DM(s)
48 Select final design(s) 48 Select final design(s) 48 Select final design(s)
Original Optimal NASA

American Institute of Aeronautics and Astronautics
10
Figure 4 MATE-CON Optimal Ordering and DSM (italic numbers are activity location in list, normal numbers correspond to original order)
1 2 3 4 5 6 7 8 9 10 11 12 13 14 15 16 17 18 19 20 21 22 23 24 25 26 27 28 29 30 31 32 33 34 35 36 37 38 39 40 41 42 43 44 45 46 47 48
1 2 3 4 5 6 7 10 11 14 15 18 8 9 12 13 16 17 20 21 22 25 19 23 24 26 27 28 29 30 31 32 33 34 35 36 37 38 39 40 41 42 43 44 45 46 47 48
Identify Need 1 1 1 1
Define Mission 2 2 1 2 1 1
Define Scope 3 3 1 1 3
Identify all relevant decision makers 4 4 1 1 1 4
Identify Constraints 5 5 1 1 1 1 5 1
Propose Attribute Definitions (USER) 6 6 1 1 1 1 6
Nail down attribute definitions (USER) 7 7 1 1 1 1 7
Propose Attribute Definitions (CUSTOMER) 8 10 1 1 1 1 10
Nail down attribute definitions (CUSTOMER) 9 11 1 1 1 1 11
Propose Attribute Definitions (FIRM) 10 14 1 1 1 1 14
Nail down attribute definitions (FIRM) 11 15 1 1 1 1 15
Concept generation 12 18 1 1 1 1 1 1 1 1 1 1 1 18
Utility interview (USER) 13 8 1 1 1 8 1
Utility verification and validation (USER) 14 9 1 1 1 1 9
Utility interview (CUSTOMER) 15 12 1 1 1 12 1
Utility verification and validation (CUSTOMER) 16 13 1 1 1 1 13
Utility interview (FIRM) 17 16 1 1 1 16 1
Utility verification and validation (FIRM) 18 17 1 1 1 1 17
Propose Design Variables 19 20 1 1 1 1 1 1 1 1 20
Nail down Design Variables 20 21 1 1 1 1 1 1 1 1 1 21
Map Design variable to attributes 21 22 1 1 1 1 1 1 1 1 1 1 1 1 22
Decompose code (develop software architecture) 22 25 1 1 1 1 1 1 1 1 1 1 1 1 1 25
Organization formation (software teams) 23 19 1 1 19
Identify I/O for entire simulation 24 23 1 1 1 1 1 1 1 1 1 1 1 1 1 23
Write Model translation from DV to Att 25 24 1 1 1 1 1 1 1 1 1 1 1 1 1 1 1 1 24 1 1
Integrate model 26 26 1 1 1 1 1 1 1 1 1 1 26
Enumerate tradespace 27 27 1 1 1 1 1 1 1 1 1 27
Navigate enumerated tradespace (intelligent pare down)28 28 1 1 1 1 1 1 1 1 1 28
Run simulation (calculate attributes) 29 29 1 1 1 1 1 1 29
Run Utility function 30 30 1 1 1 1 1 1 1 1 1 1 1 1 30
Verify Output 31 31 1 1 1 1 1 1 1 1 1 1 1 1 1 1 1 1 1 1 31 1 1
Analyze output 32 32 1 1 1 1 1 1 1 1 1 1 1 1 1 1 32
Perform sensitivity analysis (constants/constraints) 33 33 1 1 1 1 1 1 1 1 1 1 1 33
Perform sensitivity analysis (utility function) 34 34 1 1 1 1 1 1 1 1 1 1 1 1 1 1 34
Refine tradespace 35 35 1 1 1 1 1 1 1 1 1 1 35
Rerun simulation/utility function 36 36 1 1 1 1 1 1 1 1 1 1 1 1 1 36
Analyze output 37 37 1 1 1 1 1 1 1 1 1 37
Locate frontier 38 38 1 1 1 1 1 38 1
Select reduced solution set 39 39 1 1 1 1 1 1 1 1 39 1
Show to DM(s) 40 40 1 1 1 1 1 1 1 40
Define stakeholder tradeoff function 41 41 1 1 1 1 1 41
Select design(s) for concurrent design 42 42 1 1 1 1 1 1 1 42
Set selected design as baseline for CE 43 43 1 1 1 1 1 1 43
Develop higher fidelity CE models 44 44 1 1 1 1 1 1 1 1 1 1 1 1 44 1
Perform concurrent design trades 45 45 1 1 45
Converge on final design(s) 46 46 1 1 46
Show to DM(s) 47 47 1 1 1 1 47
Select final design(s) 48 48 1 1 48
A
mer
ican
Ins
titu
te o
f A
eron
autic
s an
d A
stro
naut
ics
11
Fig
ure
5 M
AT
E-C
ON
NA
SA O
rder
ing
and
DSM
13
52
67
188
920
2221
2519
2324
2627
2829
3031
3233
3435
3637
3839
404
1011
1415
1213
1617
4142
4344
4546
4748
Iden
tify
Nee
d1
11
Def
ine
Sco
pe3
13
1
Iden
tify
Con
stra
ints
51
15
11
1
Def
ine
Mis
sion
21
12
1
Pro
pose
Attr
ibut
e D
efin
ition
s (U
SE
R)
61
11
61
Nai
l dow
n at
trib
ute
defin
ition
s (U
SE
R)
71
11
71
Con
cept
gen
erat
ion
181
11
11
118
11
11
1
Util
ity in
terv
iew
(U
SE
R)
81
18
11
Util
ity v
erifi
catio
n an
d va
lidat
ion
(US
ER
)9
11
19
1
Pro
pose
Des
ign
Var
iabl
es20
11
11
11
201
1
Map
Des
ign
vari
able
to a
ttrib
utes
221
11
11
11
221
11
11
Nai
l dow
n D
esig
n V
aria
bles
211
11
11
11
211
1
Dec
ompo
se c
ode
(dev
elop
sof
twar
e ar
chite
ctur
e)25
11
11
11
11
125
11
11
Org
aniz
atio
n fo
rmat
ion
(sof
twar
e te
ams)
191
119
Iden
tify
I/O fo
r en
tire
sim
ulat
ion
231
11
11
11
123
11
11
1
Wri
te M
odel
tran
slat
ion
from
DV
to A
tt24
11
11
11
11
11
11
241
11
11
1
Inte
grat
e m
odel
261
11
11
11
126
11
Enu
mer
ate
trad
espa
ce27
11
11
11
11
271
Nav
igat
e en
umer
ated
trad
espa
ce (
inte
llige
nt p
are
dow
n)28
11
11
11
11
281
Run
sim
ulat
ion
(cal
cula
te a
ttrib
utes
)29
11
11
11
29
Run
Util
ity fu
nctio
n30
11
11
11
11
301
11
1
Ver
ify O
utpu
t31
11
11
11
11
11
11
131
11
11
11
1
Ana
lyze
out
put
321
11
11
11
11
132
11
11
Per
form
sen
sitiv
ity a
naly
sis
(con
stan
ts/c
onst
rain
ts)
331
11
11
11
11
11
33
Per
form
sen
sitiv
ity a
naly
sis
(util
ity fu
nctio
n)34
11
11
11
11
341
11
11
1
Ref
ine
trad
espa
ce35
11
11
11
11
11
35
Rer
un s
imul
atio
n/ut
ility
func
tion
361
11
11
11
11
361
11
1
Ana
lyze
out
put
371
11
11
11
371
1
Loca
te fr
ontie
r38
11
11
138
1
Sel
ect r
educ
ed s
olut
ion
set
391
11
11
11
391
1
Sho
w to
DM
(s)
401
11
11
140
1
Iden
tify
all r
elev
ant d
ecis
ion
mak
ers
41
11
4
Pro
pose
Attr
ibut
e D
efin
ition
s (C
US
TO
ME
R)
101
11
110
Nai
l dow
n at
trib
ute
defin
ition
s (C
US
TO
ME
R)
111
11
111
Pro
pose
Attr
ibut
e D
efin
ition
s (F
IRM
)14
11
11
14
Nai
l dow
n at
trib
ute
defin
ition
s (F
IRM
)15
11
11
15
Util
ity in
terv
iew
(C
US
TO
ME
R)
121
11
121
Util
ity v
erifi
catio
n an
d va
lidat
ion
(CU
ST
OM
ER
)13
11
11
13
Util
ity in
terv
iew
(F
IRM
)16
11
116
1
Util
ity v
erifi
catio
n an
d va
lidat
ion
(FIR
M)
171
11
117
Def
ine
stak
ehol
der
trad
eoff
func
tion
411
11
11
41
Sel
ect d
esig
n(s)
for
conc
urre
nt d
esig
n42
11
11
11
142
Set
sel
ecte
d de
sign
as
base
line
for
CE
431
11
11
143
Dev
elop
hig
her
fidel
ity C
E m
odel
s44
11
11
11
11
11
11
441
Per
form
con
curr
ent d
esig
n tr
ades
451
145
Con
verg
e on
fina
l des
ign(
s)46
11
46
Sho
w to
DM
(s)
471
11
147
Sel
ect f
inal
des
ign(
s)48
11
48

American Institute of Aeronautics and Astronautics
12
Sensitivity Swaps
Sensitivity InsertsA
Sensitivity InsertsB
Figure 6 Sensitivity Analysis (First order perturbations)
Mean Blocksizes for Swap Sensitiv ity Analysis
0
5
10
15
20
25
0 200 400 600 800 1000 1200
SwapID
Blo
cksi
ze
Swaps
Optimal
Original
NASA
Number of Feedbacks (N) for Swap Sensitiv ity Analysis
0
10
20
30
40
50
60
70
80
90
0 200 400 600 800 1000 1200
SwapID
# F
eed
back
s Swaps
Optimal
Original
NASA
Mean Blocksizes for InsertsA Sensitiv ity Analysis
0
5
10
15
20
25
30
0 200 400 600 800 1000 1200
SwapID
Blo
cksi
ze
Inserts
Optimal
Original
NASA
Number of Feedbacks (N) for InsertsA Sensitiv ity Analysis
0
10
20
30
40
50
60
70
80
90
0 200 400 600 800 1000 1200
SwapID
# Fe
edba
cks Inserts
Optimal
Original
NASA
Mean Blocksizes for InsertsB Sensitivity Analysis
0
2
4
6
8
10
12
14
16
18
0 200 400 600 800 1000 1200
Sw apID
Blo
cksi
ze
Inserts
Optimal
Original
NASA
Number of Feedbacks (N) for Inser tsB Sensitiv ity Analysis
0
10
20
30
40
50
60
70
80
90
0 200 400 600 800 1000 1200
SwapID
# F
eed
bac
ks Inserts
Optimal
Original
NASA

American Institute of Aeronautics and Astronautics
13
REFERENCES
1 “exploration” def. 1, The Oxford English
Dictionary Online, http://dictionary.oed.com/cgi/entry/00080548 Second Edition, 1989.
2 Shaw, G. M., DW; Hastings, DE (2001). "Development of the quantitative generalized information network analysis methodology for satellite systems." Journal of Spacecraft and Rockets 38(2): 257-269.
3 Jilla, C. D., D. W. Miller, et al. (2000). "Application of Multidisciplanary Design Optimization Techniques to Distributed Satellite systems." Ibid. 37(4): 481-490.
4 Keeney, R. L. R., Howard (1993). Decisions with Multiple Objectives--Preferences and Value Tradeoffs. Cambridge, Cambridge University Press.
5 Ulrich, K. T. and S. D. Eppinger (2000). Product Design and Development. Boston, Irwin McGraw-Hill. Chapter 1.
6 Ross, A. M., N. P. Diller, et al. (2002). Multi-Attribute Tradespace Exploration in Space System Design. World Space Congress, IAF, Houston, TX.
7 ICEMaker homepage, http://www.lsmd.caltech.edu/tools/icemaker/icemaker.php, http://www.lsmd.caltech.edu/research/ssparc/LSMD-SSPARC-IAB02.ppt
8 Ulrich, K. T. and S. D. Eppinger (2000). Product Design and Development. Boston, Irwin McGraw-Hill. pp. 20-23.
9 Keeney, R. L. R., Howard (1993). Decisions with Multiple Objectives--Preferences and Value Tradeoffs. Cambridge, Cambridge University Press. Chapters 5 and 6.
10 Thurston, D. L. (1999). Real and perceived limitations to decision based design. ASME Design Technical Conference, Los Vegas, NV.
11 de Neufville, R. (1990). Applied Systems Analysis: Engineering Planning and Technology Management. New York, McGraw-Hill Co. Chapter 19.
12 Keeney, R. L. R., Howard (1993). Decisions with Multiple Objectives--Preferences and Value Tradeoffs. Cambridge, Cambridge University Press. pp. 188-211, 219-223, 261-270, 297-309.
13 Delquie, P. (1989). Contingent Weighting of the Response Dimension in Preference Matching. Civil Engineering (Operational Research). Cambridge, MIT.
14 Seshasai, S. G., Amar (2002 (submitted)). "A Knowledge Based Approach to Facilitate Engineering Design." Journal of Spacecraft and Rockets.
15 Arrow, K. J. (1963). Social Choice and
Individual Values. New Haven, Yale University Press.
16 Eppinger, S. D. (2001). "Innovation at the speed of information." Harvard Business Review 79(1): 149-+.
17 Eppinger, S. D., D. E. Whitney, et al. (1994). "A Model-Based Method for Organizing Tasks in Product Development." Research in Engineering Design-Theory Applications and Concurrent Engineering 6(1): 1-13.
18 Eppinger, S. D. (2001). "Innovation at the speed of information." Harvard Business Review 79(1): 149-+.
19 Browning, T. R. (1998). Modeling and Analyzing Cost, Schedule, and Performance in Complex System Produce Development. Technology, Management, and Policy. Cambridge, MA, Massachusetts Institute of Technology: PhD.
20 MIT DSM group software page, http://web.mit.edu/dsm/macros.htm
21 Shishko, R., Ed. (1995). NASA Systems Engineering Handbook, PPMI.