A Robust Data Envelopment Analysis Method for Business … · A Robust Data Envelopment Analysis...
16
Journal of Information Systems and Telecommunication, Vol. 1, No. 2, April – June 2013 * Corresponding Author 97 A Robust Data Envelopment Analysis Method for Business and IT Alignment of Enterprise Architecture Scenarios Mehdi Fasanghari* Industrial Engineering, University of Tehran [email protected] Mohsen Sadegh Amalnick Industrial Engineering, University of Tehran [email protected] Reza Taghipour Anvari Malek Ashtar University of Technology [email protected] Jafar Razmi Industrial Engineering, University of Tehran [email protected] Received: 01/May/2013 Accepted: 19/Jun/2013 Abstract Information Technology is recognized as a competitive enabler in today’s dynamic business environment. Therefore, alliance of business and Information Technology process is critical, which is mostly emphasized in Information Technology governance frameworks. On the other hand, Enterprise Architectures are deployed to steer organizations for achieving their objectives while being responsive to changes. Thus, it is proposed to align the business and Information Technology through investigating the suitability of Enterprise Architecture scenarios. In view of this fact, investigating a flexible decision making method for business and information technology alignment analysis is necessary, but it is not sufficient since the subjective analysis is always perturbed by some degree of uncertainty. Therefore, we have developed a new robust Data Envelopment Analysis technique designed for Enterprise Architecture scenario analysis. Several numerical experiments and a sensitivity analysis are designed to show the performance, significance, and flexibility of the proposed method in a real case. Keywords: Group Data Envelopment Analysis, Enterprise Architecture, IT Governance, COBIT, Robust Optimization. 1. Introduction Due to the ever increasing struggle to persist in changing environment of today’s market, Information Technology (IT) is recognized as one of the best enablers and strategic partner of business capturing the most capital investments in many enterprises [1]. IT governance frameworks define the mechanism of IT-related responsibilities and decision-making structure and are mostly recognized as a series of processes by which business and IT are aligned. However, effective implementation of an IT governance framework is a rather difficult and costly task, since it requires the acquirement of current status of organizations and an understanding of the desired to-be structure of the organization to find the gaps therein and set for improvements. Increasingly, mangers figure out the great contribution of such governance architectures for depicting the right overview of the organization mission, business objective, information systems, and their relationship. For this, managers in charges with their consultants may propose different IT architecture or scenarios to set the roadmap for the requested business strategies which ensures long-term success and cost-efficiency according to the available budget and resource. Enterprise Architecture (EA) is one of the most effective approaches offering these benefits in an integrated and efficient information system by presenting distinctive architectures for the four key areas of business, data, application, and infrastructure [2-4]. Therefore, planning the EA scenarios or IT master plans can show the systematic approach for transforming the enterprise IT infrastructure for achieving the business strategies and goals. Evaluating the EA scenarios is vital as an EA scenario is really expensive and time-consuming for implementation [5, 6]. IT and business alignment is the most important aspect of EA scenario analysis, which was out of consideration for many years. To this
Transcript of A Robust Data Envelopment Analysis Method for Business … · A Robust Data Envelopment Analysis...
Journal of Information Systems and Telecommunication, Vol. 1, No. 2, April – June 2013
* Corresponding Author
97 97
A Robust Data Envelopment Analysis Method for
Business and IT Alignment of
Enterprise Architecture Scenarios
Mehdi Fasanghari* Industrial Engineering, University of Tehran
Mohsen Sadegh Amalnick Industrial Engineering, University of Tehran
Reza Taghipour Anvari Malek Ashtar University of Technology
Jafar Razmi Industrial Engineering, University of Tehran
Received: 01/May/2013 Accepted: 19/Jun/2013
Abstract Information Technology is recognized as a competitive enabler in today’s dynamic business
environment. Therefore, alliance of business and Information Technology process is critical, which is
mostly emphasized in Information Technology governance frameworks. On the other hand, Enterprise
Architectures are deployed to steer organizations for achieving their objectives while being responsive
to changes. Thus, it is proposed to align the business and Information Technology through investigating
the suitability of Enterprise Architecture scenarios. In view of this fact, investigating a flexible decision
making method for business and information technology alignment analysis is necessary, but it is not
sufficient since the subjective analysis is always perturbed by some degree of uncertainty. Therefore, we
have developed a new robust Data Envelopment Analysis technique designed for Enterprise
Architecture scenario analysis. Several numerical experiments and a sensitivity analysis are designed to
show the performance, significance, and flexibility of the proposed method in a real case.
Keywords: Group Data Envelopment Analysis, Enterprise Architecture, IT Governance, COBIT,
Robust Optimization.
1. Introduction
Due to the ever increasing struggle to persist in
changing environment of today’s market,
Information Technology (IT) is recognized as one
of the best enablers and strategic partner of
business capturing the most capital investments in
many enterprises [1]. IT governance frameworks
define the mechanism of IT-related responsibilities
and decision-making structure and are mostly
recognized as a series of processes by which
business and IT are aligned. However, effective
implementation of an IT governance framework is
a rather difficult and costly task, since it requires
the acquirement of current status of organizations
and an understanding of the desired to-be structure
of the organization to find the gaps therein and set
for improvements. Increasingly, mangers figure
out the great contribution of such governance
architectures for depicting the right overview of
the organization mission, business objective,
information systems, and their relationship. For
this, managers in charges with their consultants
may propose different IT architecture or scenarios
to set the roadmap for the requested business
strategies which ensures long-term success and
cost-efficiency according to the available budget
and resource. Enterprise Architecture (EA) is one
of the most effective approaches offering these
benefits in an integrated and efficient information
system by presenting distinctive architectures for
the four key areas of business, data, application,
and infrastructure [2-4]. Therefore, planning the
EA scenarios or IT master plans can show the
systematic approach for transforming the
enterprise IT infrastructure for achieving the
business strategies and goals. Evaluating the EA
scenarios is vital as an EA scenario is really
expensive and time-consuming for implementation
[5, 6]. IT and business alignment is the most
important aspect of EA scenario analysis, which
was out of consideration for many years. To this

Fasanghari & Sadegh Amalnick & Taghipour Anvari & Razmi, A Robust Data Envelopment Analysis ……
98
aim, we have used the COBIT framework for EA
scenarios analysis. Data Envelopment Analysis
(DEA) is a well-known decision making tool to
evaluate a set of decision making units (DMUs)
based on the multi input-output performance
measures [7]. In some real applications of DEA,
the respected performance criteria are collected
based on the expert opinions. However, when
several experts with different knowledge and
experiences are to submit their points of view,
finding the most proper DMU is not an easy task.
In addition, experts’ opinions data are mostly
perturbed by uncertainty due to several reasons.
In this paper, we intend to analyze the EA
scenarios by introducing a new expert-based
decision-making technique that embraces distinct
preferences’ weights of experts contaminated by
a bounded degree of hesitancy. More specifically,
we introduce a novel DEA technique by
incorporating the robust optimization concept. In
summary, developing a new robust DEA method
for EA scenario analysis in view of the IT and
business alignment is the primitive contribution
in this paper. Analyzing a real case study in Iran
Telecommunication Research Center (ITRC) is
done to show the reliability and applicability of
our proposed idea.
For this, the paper structure is as follows.
First, we take a look at the works deemed to our
study. Then, we lay the background of our works
with introduction of the models and specific
related works, namely DEA and robust
optimization technique. Our models, both
deterministic and its robust counterpart, is also
explained in this section. After that, introducing
the case study for the numerical experiments will
be presented. The performance evaluation
follows next, which include empirical results of
the deterministic and robust version of the
proposed DEA model. Finally, we conclude in
the last Section.
2. Related Works
In this Section, we review some of the
literature around EA analysis domain, and then
take a look at IT governance frameworks,
especially COBIT framework.
2.1 EA analysis review
According to [8], some of the researches
focus on the complexity of EA systems. This
category can be divided into three dimensions of
structure, behavior statistics, and dynamic
behavior. It means that some analysis such as
Niemann [4] model notices on the complexity
and dependency of EA components and their
influence on the organization. Yu model [9]
extends this structural analysis and describes the
transition phase to achieve to the desired status
of the organization. Now, if the experts’ opinions
are considered in the analysis, the behavior sub-
category works such as [10] emerges.
Considering the pathological effects and the
behavior of the organization in the time, gives
rise to the dynamic analysis of EA scenarios [11].
Time reference is another dimension of the
comparison. Some analyses deal with existing
established EA and some evaluate the to-be
structure of the future EA in the organization.
Jacob et el. [10] provides a dynamic model which
is able to analyze the current and desired status of
EA and detects the conditions leading to the target
status. Another category considers whether the
EAs under study are already implemented [9-12]
or the scenarios based on that EA are being
investigated [4,13]. The analysis technique used
for evaluation is another important dimension in
three sub categories of expert-based [4,9,13],
rule-based [11] and indicator-based [4,5,10,14,15]
methods. Analysis using experts’ opinions are
the most flexible approach [8], but time-
consuming. A more formal method is the rule
based approach, but it can just recognize
presence or absence of a pattern in structure.
Indicator based approaches can capture better
properties such as convergence, and
interoperability, though it is very dependent on
the assumption and interpretation of the
architecture under analysis.
More generally, Multi Criteria Decision
Making (MCDM) techniques are tailored for
finding an optimum solution among a set of
alternatives which are judged on multiple
attributes. Such techniques can be used in
investigating various quality attributes of
software architecture or project selections
[13,16-20]. Among the methods of MCDM,
Analytical Hierarchical Process (AHP) [21] has
been used to judge and select the best
architecture candidate or project [13,16,18,22].
Specifically, Razavi et el. [13] have proposed an
AHP-based approach for analysis and selection
of EA scenarios. Further, Data Envelopment
Analysis (DEA) is recognized as a very efficient
approach in the decision making domain with
easy implementation. A large body of researches
and applications has been proposed for DEA [7]
pivoted on efficacy measurement in various
domains. DEA techniques are used for assessing
IT impact on firm performance [23] and using IT
as a tool for selection of projects among various
proposals [24]. Such analysis of DEA helps to
find the source of efficacy and inefficacy and
Journal of Information Systems and Telecommunication, Vol. 1, No. 2, April – June 2013 99 99
establishes the roadmap for improvement in the
organization.
Group-decision making based on AHP
approach has gained popularity in the decision-
making domain [25,26]. However, AHP has
some limitations in confronting the uncertainty.
Specifically, it can just handle uncertainty of
fuzzy type. Overall, EA scenarios selection
problems are usually treated without considering
uncertainty of experts [27].
2.2 IT Governance background
There are several IT governance standards
available as governmental draft or industry
standards (e.g., CMMI, COBIT, ITIL, MOF,
ISPL1, ASL2, ISO, Six Sigma, DSDM3) which
support the governance of IT in a way that is
aligned with the business. One of the most
effective frameworks proposed is the Control
Objectives for IT and related Technology
(COBIT) created by the Information Systems
Audit and Control Association (ISACA) and the
IT Governance Institute (ITGI) in 1992 [28].
This framework provides managers and auditors
with a set of measures and processes which help
them to maximize their benefit through the
responsible use of resources, appropriate
management of risk and alignment of business
and IT.
Acting as an integrator of different aspects of
both IT and business, COBIT presents its
structure and metrics in a manageable and logical
structure of four domains namely: 1) plan and
organize, 2) acquire and implement, 3) deliver
and support and 4) monitor and evaluate. Each of
these domains is described through a set of
control objectives or measures. A short
description of the main domains is summarized
as follows [29-33]:
Plan and organize: This domain presents
the strategy and tactics of the way IT can
assist to business goals. These visions
should be contributed to different people
throughout the organization.
Acquire and implement: For achieving the
IT strategies and tactics, IT solutions
should be acquired and implemented and
finally be integrated into the business
process. Further, if there are preexisting
systems available, ensuring the continuity
of their functionality is handled in this
domain.
Deliver and support: The required service
should be delivered and all other processes
regarding the management of data and
security concerns in addition to supportive
activities are dealt with in this domain.
Monitor and evaluate: all IT processes
should be regularly evaluated to meet their
quality requirement. So internal controls
and regulatory compliance are addressed
in this domain.
Robust optimization models can be used as a
good approach for encountering the uncertainty
in decision making, especially it is useful in the
following situations [34]:
Some parameters are estimates and carry
estimation risk.
There are constraints with uncertain
parameters to be satisfied regardless of
their values of these parameters.
The objective functions/optimal solutions
are particularly sensitive to perturbations.
The decision-maker cannot afford low-
probability high-magnitude risks.
It is necessary for a decision-making process
to reduce the sensitiveness of its results
regarding to the input parameters and data. Thus,
in this paper, we propose a group DEA model
with uncertain data. Experts present their
judgment with interval data (lower bound,
nominal bound, and upper bound for expressing
their opinion).
3. The proposed robust group decision
making method based on DEA
In this section, we elaborate the proposed
robust decision making method, which is
developed based on a robust DEA model. The
proposed robust DEA model has the capability to
incorporate the opinions of a group of decision
makers to evaluate a set of homogeneous
decision making units or alternatives (here EA
scenarios). The robust DEA model is inspired
from the classical CCR DEA model. Therefore,
we first briefly review the classical CCR DEA
model. After that, the robust DEA model is
introduced. To cope with uncertainty of experts’
judgment, we use a technique based on the
robust optimization. Hence, in the subsequent
sub-section, we explain this model and then
introduce our robust counterpart of the DEA
model provided to handle the uncertainty existed
in the input data gathered from experts’ opinions.
3.1 The classical CCR DEA model
Data Envelopment Analysis is a non-
parametric mathematical programming for
measuring the relative efficiency and ranking of
various productive units, termed decision making
units (DMUs) [35]. It does not require any
production or the cost function and measures the
performance DMUs based on their multiple
inputs and outputs. The relative efficiency
measures of DMUs is obtained through
determining a piecewise linear efficiency frontier
Fasanghari & Sadegh Amalnick & Taghipour Anvari & Razmi, A Robust Data Envelopment Analysis ……
100
along the most efficient DMU, and the least
efficient DMU is recognized by comparison with
its frontier curve. The original input oriented
DEA model is written as follows:
*
1
1 1
1
( ) : : max
subject to:
0
1
, 0.
ks
so r ro
r
k ms s
r rj i ij
r i
ms
i io
i
r i
P I E u y
u y v x
v x
u v
(1)
In this model, a set of n homogenous decision
making unit ( 1,...,j n ) with m inputs
( 1,...,i m ) and k outputs ( 1,...,r k ) is
assessed where s
ijx denotes the ith input data of
the jth DMU obtained from the sth expert’s
opinion. Similarly, s
rjy denotes the rth output
data of the jth DMU obtained from the sth
expert’s opinion. Furthermore, *
soE denotes the
efficiency of oth DMU when the input and
output data are obtained from the sth expert’s
opinion. We also call *
soE the ideal efficiency
score of oth DMU from sth expert view. Model
(1) is repeatedly solved for each DMU to obtain
its efficiency score.
In the aforementioned model, it is assumed
that inputs and outputs are explicitly defined.
However, there are many real cases that data are
used without inputs (such as index data or pure
output data). In this case, the original DEA
model converts to a DEA model with k outputs
and one dummy input of 1 for all DMUs [36]. In
this situation, the original DEA model (1) cannot
evaluate DMUs. Hence, to fill the gap of this
area, we propose a new Group Decision Making
Method which is inspired by classical DEA
model (1) to evaluate DMUs based on several
matrix input-output data that each of which is
collected according to one expert’ opinions.
3.2 Robust Optimization
The classical DEA model has no mechanism
to deal with uncertainty in input or output data.
Several methods such as Chance Constraint
Programming (CCP) [37] and Stochastic
Programming (SP) are introduced to handle such
uncertainty. For some of the representative
works related to these models, Sengupta [38-40]
and Cooper [41-43] can be considered. In these
models, uncertain data are estimated with
probabilities, and an error distribution should be
determined. These issues limit the real world
applications of these models.
As an alternative approach for dealing with
uncertainty, robust optimization versions of DEA
have recently been raised which covers the
decision making process when data are of the
form of interval data. Robust optimization can
handle the uncertainty in the form of box,
ellipsoidal, and polyhedral uncertainty sets [44].
The concept was first introduced by [45] who
discussed uncertainty in column vector of the
constraint matrix. Subsequently, Ben-tal and
Nemirovski [44,46,47] and more recently
Bertsimas et el. [48,49] have proposed methods
to deal with ellipsoidal and polyhedral
uncertainty types. These methods are usually
named as BT and BN approach and have some
distinguishing differences in terms of preserving
the class of the problem after applying the robust
approach or the number of variables and
constraints [34]. Various works have been
suggested according to these techniques. For
example, Sadjadi and Omrani [34] applied robust
optimization approach to DEA and utilized their
model to evaluate the performance of Iranian
electricity distribution companies. They suppose
uncertainty of ellipsoidal uncertainty to
demonstrate the efficiency of robust approaches
for ranking strategies of their application.
Furthermore, Wang and Wei [50] proposed a
non-linear programming for robust data
envelopment analysis. In another work, Sadjadi
[51] combined the idea of robust optimization
with traditional bootstrapped DEA [52,53] to
propose a general model for performance
assessment and ranking of DMUs with case
study of telecommunication companies. The
input and output data in [51] can be changed in
an interval, and the results overcomes the
incurrent bias. Shokouhi [54] used the
combination of super-efficiency DEA and robust
BA approach for handling uncertainty in both
inputs and output which is considered to be of
ellipsoidal type for efficiency assessment of gas
companies.
Next, we explain the robust optimization of
Ben-Tal et el. [55] with the box uncertainty sets to
set the background for elaborating the robust
counterpart of our proposed robust DEA model.
The main advantage of Ben-Tal et el. approach
[55] using the box uncertainty set is that the
resulted robust counterpart model becomes a
linear programming model whereas applying this
approach with ellipsoidal uncertainty leads to
obtain a nonlinear robust counterpart model,
which increases the time complexity. Therefore,
we utilize box uncertainty sets to develop the

Journal of Information Systems and Telecommunication, Vol. 1, No. 2, April – June 2013 101 101
robust counterpart of our proposed model. For this,
consider the following linear optimization model:
min ,
subject to:
cx
Ax b (2)
where x is the vector of decision variables
and A is the matrix of constraints with elements
ija . In this model, , ,c A b are constant. Now, if
these parameters are uncertain in a specific range
of U, which is called the uncertainty set, and we
wish our solution yet stays in an immune range
while addressing the uncertainty of those
parameters, we use the robust optimization
approach.
min ,
subject to:
,
, ,
cx
Ax b
c A b U
(3)
The robust approach for addressing the box
uncertainty of entry1,..., , 1,...,{ }ij i m j na a is as
follows:
{ :| | , 1,..., , 1,..., }n
ij ij ij ijU a R a a G i m j n (4)
Here, we take uncertainty in row i of
constraint matrix. Similarly, uncertainty can be
focused in the objective coefficients. In this set,
ija is the mean value of ija and
ijG is the
uncertainty scale of a given entry. Hence, the
robust counterpart model can be written as:
1
1:| |
min { }
min { }nij ij ij ij
n
ij j i
j
n
ij j i
j
U
a R a a G
aa x b or
a x b
(5)
According to uncertainty set U presented in
(6), and since the scale uncertainty ijG is a
positive number, the minimum value of 1
n
ij j
j
a x
on the box uncertainty set U is occurred for the
lower bound of ija , which become
ij ija G .
{ : ,
1,..., , 1,..., }
ij ij ij ij ij ijU a R a G a a G
i m j n
(6)
Therefore, inequality (5) is reformulated as
follows:
1 1
n n
ij j ij j i
j j
a x G x b
(7)
which is the robust counterpart of constraint
Ax b of model (2) and thus the robust LP
model is solvable.
3.3 Robust counterpart of the proposed
DEA model
In our application, due to the expert based
nature of data, experts cannot express an exact
value for input and output data and therefore,
uncertainties are inherent in experts’ opinions.
We, therefore, represent the robust version of our
model to handle this kind of uncertainty. If we
suppose that output data obtained from experts’
opinions ( )s
rjy are defined as the box
uncertainty sets, the robust counterpart of the
robust DEA can be expressed as:
1 1
1
1 1
*
1
( ) : max z
subject to:
min { } ,
1, s
max { } 0,
,
j,s
min { s
0
} ,
.
ro
io
rj ij
ro
s Bro
s Brj
s Bro
S ks
s r
s r
ms
i
i
k ms s
r i
r i
ks
r s
i
o
r
r
y u
y u
y u
P II
w u y z
v x
u y v x
u
u v
y E
(8)
It is worthy to mention that we first move the
objective function into constraints by introducing
new decision variable z, and then provide the
robust equivalence of all constraints of the robust
DEA model. As a result, the first constraint of
the above model is equivalent to the objective
function of the robust DEA model. Similarly, the
two last constraints of model P(II) are the robust
counterpart of the DEA model.
The uncertainty set of model P(II) is defined
as follows:
[ , ]B s s s s
rj rj rj rjU y G y G (9)
where s
rjy is the nominal data assigned to rth
output (here benefit-type criteria) in jth DMU
whose value determined according to the sth
expert opinion.
It is noted that the minimum and maximum
value of s
rjy on the box uncertainty set BU , are
occurred for the lower and upper bounds of s
rjy ,
which are s s
rj rjy G and s s
rj rjy G respectively.
Therefore, when minimizing the left-hand of the
first constraint on the box uncertainty of BU , it
became equal to 1 1
[ ]S R
s s
s r ro ro
s r
w u y G
, since
0s
roy . A similar method can be used for
maximizing the two last constraints of model
P(II). Finally, the robust counterpart model can
be written as:

Fasanghari & Sadegh Amalnick & Taghipour Anvari & Razmi, A Robust Data Envelopment Analysis ……
102
1 1
1
1 1
*
1
, 0.
( ) : max z
subject to:
[ ]
1, s
[ ] 0, j,s
[ ] , s
io
ij
S ks s
s r ro ro
s r
ms
i
i
k ms s s
r rj rj i
r i
ks s
r
r
r ro o
i
o s
r
P III
w u y G z
v x
u y G v x
u y G E
u v
(10)
In this model, s
rjy and s
rjG are the nominal
data and scale uncertainty of data obtained from
sth expert on rth output of jth DMU.
The existing robust DEA models which take
benefit of BT approach are non-linear
programming model due to usage of ellipsoidal
uncertainty form [34,50]. However, our
technique uses box uncertainty which leads to a
linear programming model. Linear models have
the benefit of simplicity and also the higher
accuracy of the computational result in
comparison to nonlinear programming models.
4. The application of proposed robust
DEA for EA scenario evaluations
Our case study is studied for the ITRC in Iran
as the greatest organizations handling ICT
projects with a variant degree of importance and
complexity. Having four faculties of IT, CT,
security, and strategic planning, the center
considers transformations of its process for
approaching e-organizations objectives. To fulfill
his vision, ITRC considers developing some
practical scenarios for successful
accomplishment of its task. EA has been
accepted as a tool for planning and managing the
process. Therefore, a group of IT experts
designed 12 EA scenarios stated in Table 1
which correspond to 12 DMUs for our model. In
fact, there are four distinct scenarios including
planning for ERP implementation, web service
implementation, portal implementation, and the
process integration of ITRC and each can be
implemented via in-sourcing (using the ITRC’s
own resources and employees), out-sourcing (a
recovery-oriented proposal for downsizing and
cost reduction), and co-sourcing (combining the
in-source and out-source capability through
contracting an out-sourced firm to provide part
of IT solutions) [56].
Table 1. The 12 EA scenarios (ICT master plan) for ITRC
migration to e-organization
DMU
No. EA scenario Explanation
DMU1 In-source ERP Implementing an ERP by in-sourcing
DMU2 Out-source
ERP Out-sourcing an ERP for
implementation
DMU3 co-sourcing
ERP
Implementing an ERP through co-
sourcing
DMU4 In-source web
services
Delivering the web services by in-
sourcing
DMU5 Out-source
web services Delivering the web services through
out-sourcing
DMU6 co-sourcing
web services
Delivering the web services through
co-sourcing
DMU7 In-source
portal
Integration of ITRC departments
through in-source portal
implementation
DMU8 Out-source
portal
Integration of ITRC departments
through out-source portal
implementation
DMU9 co-sourcing
portal
Integration of ITRC departments
through co-sourcing portal
implementation
DMU10
In-source
process
integration
Integration the process of ITRC by in-sourcing
DMU11
Out-source
process integration
Integration the process of ITRC by
out-sourcing
DMU12
co-sourcing
process integration
Integration the process of ITRC
through co-sourcing
Executing each of these plans, demands high
investments with high risks and hidden costs and
it is safer to scrutinize the selection of EA
against a robust analytical tool. To satisfy
business objectives, information needs
correspondence to certain several control
objectives such as: efficiency, effectiveness,
confidentiality, integrity, accessibility,
availability, compliance, and reliability. These
metrics correspond to the criteria covered in
COBIT’s framework which are utilized for
evaluating the proposed EA scenarios before
implementation by experts and our method. In
fact, four experts are asked to submit their view
on the suitability of each scenario in regard to
every process of COBIT framework and then the
proposed robust PRS-DEA method is deployed
for obtaining the overall efficacy score of these
EA according to all experts’ preferences. The
objective of this evaluation is to signify the
maturity level of COBIT in the EA proposals and
then selecting the best balanced improvement
plan considering the IT processes of COBIT
framework which meets almost all of the ICT

Journal of Information Systems and Telecommunication, Vol. 1, No. 2, April – June 2013 103 103
ministries’ objectives. So, the scenario which
covers all or most of COBIT processes with high
maturity is more likely to gain higher overall
ranking and is expected to provide business and
IT alignments efficiently.
Tables A-1 to A-4 present each expert’s
opinions regarding the estimated maturity of
each process for the scenario under judgment.
The range of maturity levels is from 0 to 10
which indicate the degree of realization of a
specific process under a given scenario.
Therefore, lower value of maturity level is an
indication of weak realization and the higher
value is an indication of high realization of that
process when a specific scenario is implemented.
Further, as data are inexact, experts present their
estimated maturity in an interval of lower and
higher bound. Further, the nominal value denoted
by s
rjy reflects the average estimated maturity of
rth process under implementation of jth scenario
from sth expert’s viewpoint which is obtained by
averaging the lower and upper bound values. For
example, the reported data in Appendix
Table A-1 presents the lower, nominal and
upper bound for the estimated maturity levels of
COBIT processes through the implementation of
different proposed EA scenarios from the first
expert’s viewpoint.
The information in these tables can be used to
identify IT processes which are estimated to be
affected at most or at least when implementing a
given EA scenario. This information can be used
to reflect the strengths and weaknesses of
implementing that specific EA scenario which is
then can be a source of value for recognizing the
activities for reaching the desired status for
processes.
The output parameters of the model are equal
to 34 processes of COBIT and for the input
parameter, a dummy input of 1 is considered [36].
The evaluation results are presented in the next
section.
5. Performance Evaluation
We utilize several numerical experiments to
validate the applicability and significance of the
robust counterpart of our proposed method. As
mentioned before, four experts’ opinions are
used in this experiment and scoring to the 34
processes of COBIT are regarded as the closed
box uncertainty due to inherent imprecise nature
of experts’ opinion. In fact, the data for COBIT
processes are considered as the interval of
[ , ]s s s s
rj rj rj rjy G y G with s
rjG as the scale
uncertainty associated with sth expert’ opinion
about rth COBIT process in jth EA scenario.
To compute the ideal efficiency score *( )soE
from each expert’s point of view, we solve
model P(I) with nominal data ( )s
rjy . It is worthy
to mention that the best efficiency scores from
each expert’s point of view can be provided
when uncertainty is not considered in model P(I).
If we solve model P(I) with uncertain data to
obtain ideal efficiency scores, the objective
function *( )soE does not function as expected.
For this reason, the resulted efficiency scores
cannot be considered as ideal efficiency scores.
Therefore, it is logical to provide ideal efficiency
scores by solving model P(II) with nominal data
( )s
rjy . The respected results are reported in
Table 2. For example, the second column of
Table 2 reports the ideal efficiency scores
according to data gathered from the first expert.
According to the results, DMU1, 4, 5, 6 and 8
attain the efficiency score of one.
Further, we set 1 2 3 4 0.25w w w w .
Please note that the proposed robust model turns
into a deterministic model when the uncertainties
are not considered in the model parameters.
Table 2. Ideal efficiency scores according to the
experts’ opinion
DMU No. Expert 1 Expert 2 Expert 3 Expert 4
DMU1 1 1 1 1
DMU2 0.818 0.733 0.818 0.747
DMU3 0.750 0.724 0.857 0.714
DMU4 1 1 1 1
DMU5 1 1 1 1
DMU6 1 1 1 1
DMU7 0.955 1 0.875 1
DMU8 1 1 1 1
DMU9 0.875 1 1 1
DMU10 0.857 0.750 0.857 0.808
DMU11 0.750 0.750 0.714 0.750
DMU12 0.750 0.724 0.828 0.857
For the analysis, first, we solve the
deterministic model ( )P II using the nominal
data and calculate the performance of each DMU.
The second column of Table 3 reports the
corresponding results. As indicated, DMU4 and
DMU5 acquire the maximum efficiency score of
1 and DMU3 holds the least efficiency score
(0.546). Then, the robust counterpart model is
solved. As it was expected, the deterministic
model generates the higher efficiency score when
it compares to the robust counterpart model. On
the other hand, the efficiency scores generated by
the deterministic model are greater than those
Fasanghari & Sadegh Amalnick & Taghipour Anvari & Razmi, A Robust Data Envelopment Analysis ……
104
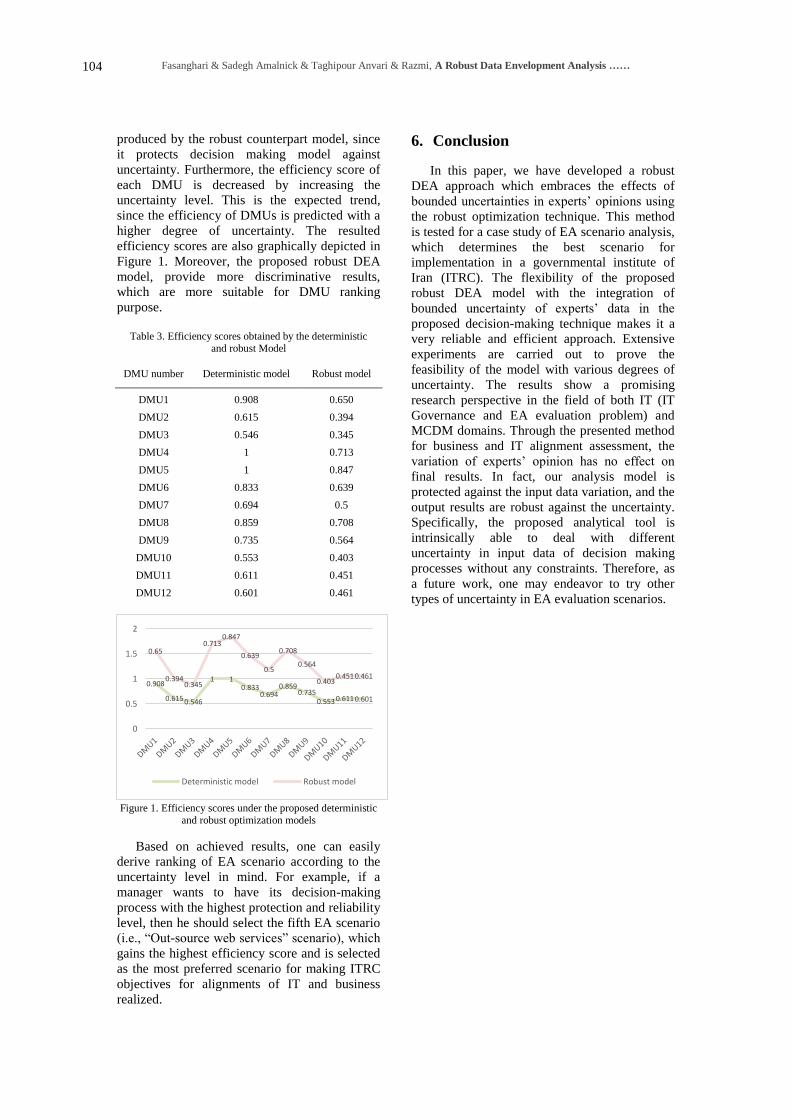
produced by the robust counterpart model, since
it protects decision making model against
uncertainty. Furthermore, the efficiency score of
each DMU is decreased by increasing the
uncertainty level. This is the expected trend,
since the efficiency of DMUs is predicted with a
higher degree of uncertainty. The resulted
efficiency scores are also graphically depicted in
Figure 1. Moreover, the proposed robust DEA
model, provide more discriminative results,
which are more suitable for DMU ranking
purpose.
Table 3. Efficiency scores obtained by the deterministic
and robust Model
DMU number Deterministic model Robust model
DMU1 0.908 0.650
DMU2 0.615 0.394
DMU3 0.546 0.345
DMU4 1 0.713
DMU5 1 0.847
DMU6 0.833 0.639
DMU7 0.694 0.5
DMU8 0.859 0.708
DMU9 0.735 0.564
DMU10 0.553 0.403
DMU11 0.611 0.451
DMU12 0.601 0.461
Figure 1. Efficiency scores under the proposed deterministic
and robust optimization models
Based on achieved results, one can easily
derive ranking of EA scenario according to the
uncertainty level in mind. For example, if a
manager wants to have its decision-making
process with the highest protection and reliability
level, then he should select the fifth EA scenario
(i.e., “Out-source web services” scenario), which
gains the highest efficiency score and is selected
as the most preferred scenario for making ITRC
objectives for alignments of IT and business
realized.
6. Conclusion
In this paper, we have developed a robust
DEA approach which embraces the effects of
bounded uncertainties in experts’ opinions using
the robust optimization technique. This method
is tested for a case study of EA scenario analysis,
which determines the best scenario for
implementation in a governmental institute of
Iran (ITRC). The flexibility of the proposed
robust DEA model with the integration of
bounded uncertainty of experts’ data in the
proposed decision-making technique makes it a
very reliable and efficient approach. Extensive
experiments are carried out to prove the
feasibility of the model with various degrees of
uncertainty. The results show a promising
research perspective in the field of both IT (IT
Governance and EA evaluation problem) and
MCDM domains. Through the presented method
for business and IT alignment assessment, the
variation of experts’ opinion has no effect on
final results. In fact, our analysis model is
protected against the input data variation, and the
output results are robust against the uncertainty.
Specifically, the proposed analytical tool is
intrinsically able to deal with different
uncertainty in input data of decision making
processes without any constraints. Therefore, as
a future work, one may endeavor to try other
types of uncertainty in EA evaluation scenarios.
0.908
0.615 0.546
1 1 0.833
0.694 0.859
0.735 0.553 0.611 0.601
0.65
0.394 0.345
0.713 0.847
0.639
0.5
0.708
0.564
0.403 0.451 0.461
0
0.5
1
1.5
2
Deterministic model Robust model

Journal of Information Systems and Telecommunication, No. 2, Vol. 1, April – June 2013
105
7. Appendix
Table A-1. The input and output data for IT research projects of ITRC including summary statistics expressed by expert 1 (E1)
DMU1 DMU2 DMU3 DMU4 DMU5 DMU6 DMU7 DMU8 DMU9 DMU10 DMU11 DMU12 Min
Max
Mean
L N U L N U L N U L N U L N U L N U L N U L N U L N U L N U L N U L N U
PO1 7 8 9 4 5 6 0 1 2 7 8 9 7 8 9 5 6 7 2 3 4 8 9 10 5.5 6 6.5 4.5 5 5.5 4.5 5 5.5 2.5 3 3.5 1 9 5.58
PO2 5 6 7 2 3 4 0 1 2 6 7 8 6 7 8 5 6 7 1 2 3 6 7 8 4.5 5 5.5 5.5 4.5 6.5 2.5 3 3.5 4.5 2 5.5 1 7 4.46
PO3 6 7 8 3 4 5 5 6 7 5 6 7 7 8 9 5 6 7 5 6 7 3 4 5 5.5 6 6.5 0.5 2.5 1.5 3.5 4 4.5 3.5 6 4.5 2.5 8 5.46
PO4 5 6 7 4 5 6 4 5 6 5 6 7 8 9 10 6 7 8 5 6 7 8 9 10 4.5 5 5.5 5.5 6 6.5 5.5 6 6.5 3.5 6 4.5 5 9 6.33
PO5 7 8 9 2 3 4 0 1 2 5 6 7 7 8 9 5 6 7 5 6 7 6 7 8 5.5 6 6.5 3.5 3.5 4.5 2.5 3 3.5 1.5 6 2.5 1 8 5.29
PO6 7 8 9 2 3 4 3 4 5 5 6 7 8 9 10 3 4 5 2 3 4 5 6 7 4.5 5 5.5 1.5 3 2.5 3.5 4 4.5 5.5 3 6.5 3 9 4.83
PO7 5 6 7 2 3 4 1 2 3 6 7 8 7 8 9 7 8 9 3 4 5 5 6 7 2.5 3 3.5 3.5 4 4.5 3.5 4 4.5 5.5 4 6.5 2 8 4.92
PO8 6 7 8 3 4 5 3 4 5 8 9 10 7 8 9 7 8 9 4 5 6 2 3 4 4.5 5 5.5 3.5 4 4.5 3.5 4 4.5 2.5 5 3.5 3 9 5.50
PO9 5 6 7 4 5 6 2 3 4 4 5 6 7 8 9 6 7 8 1 2 3 6 7 8 4.5 5 5.5 4.5 4.5 5.5 3.5 4 4.5 4.5 2 5.5 2 8 4.88
PO10 7 8 9 5 6 7 2 3 4 7 8 9 8 9 10 6 7 8 4 5 6 2 3 4 3.5 4 4.5 2.5 4 3.5 4.5 5 5.5 5.5 5 6.5 3 9 5.58
AI1 6 7 8 4 5 6 3 4 5 7 8 9 9 9.5 10 4 5 6 6 7 8 5 6 7 2.5 3 3.5 0.5 3.5 1.5 5.5 6 6.5 2.5 7 3.5 3 9.5 5.92
AI2 6 7 8 2 3 4 4 5 6 9 9.5 10 9 9.5 10 5 6 7 3 4 5 7 8 9 4.5 5 5.5 4.5 5 5.5 4.5 5 5.5 3.5 4 4.5 3 9.5 5.92
AI3 6 7 8 4 5 6 5 6 7 5 6 7 7 8 9 6 7 8 4 5 6 2 3 4 5.5 6 6.5 4.5 5 5.5 4.5 5 5.5 2.5 5 3.5 3 8 5.67
AI4 7 8 9 2 3 4 1 2 3 5 6 7 9 9.5 10 6 7 8 1 2 3 3 4 5 3.5 4 4.5 4.5 4.5 5.5 3.5 4 4.5 2.5 2 3.5 2 9.5 4.67
AI5 6 7 8 4 5 6 1 2 3 6 7 8 9 9.5 10 5 6 7 2 3 4 7 8 9 4.5 5 5.5 2.5 3.5 3.5 3.5 4 4.5 2.5 3 3.5 2 9.5 5.25
AI6 7 8 9 5 6 7 5 6 7 5 6 7 7 8 9 5 6 7 2 3 4 8 9 10 5.5 6 6.5 3.5 3.5 4.5 2.5 3 3.5 5.5 3 6.5 3 9 5.63
AI7 7 8 9 4 5 6 2 3 4 6 7 8 9 9.5 10 5 6 7 1 2 3 6 7 8 5.5 6 6.5 4.5 5.5 5.5 5.5 6 6.5 2.5 2 3.5 2 9.5 5.58
DS1 6 7 8 4 5 6 1 2 3 8 9 10 8 9 10 3 4 5 4 5 6 4 5 6 5.5 6 6.5 3.5 4.5 4.5 4.5 5 5.5 3.5 5 4.5 2 9 5.54
DS2 5 6 7 1 2 3 2 3 4 9 9.5 10 9 9.5 10 5 6 7 5 6 7 5 6 7 5.5 6 6.5 5.5 5.5 6.5 4.5 5 5.5 1.5 6 2.5 2 9.5 5.88
DS3 7 8 9 5 6 7 4 5 6 6 7 8 6 7 8 4 5 6 2 3 4 4 5 6 4.5 5 5.5 4.5 5 5.5 4.5 5 5.5 2.5 3 3.5 3 8 5.33
DS4 5 6 7 4 5 6 1 2 3 6 7 8 7 8 9 4 5 6 5 6 7 4 5 6 4.5 5 5.5 5.5 5 6.5 3.5 4 4.5 3.5 6 4.5 2 8 5.33
DS5 7 8 9 2 3 4 3 4 5 5 6 7 6 7 8 6 7 8 6 7 8 3 4 5 3.5 4 4.5 1.5 3 2.5 3.5 4 4.5 4.5 7 5.5 3 8 5.33
DS6 6 7 8 5 6 7 4 5 6 5 6 7 7 8 9 4 5 6 0 1 2 3 4 5 5.5 6 6.5 4.5 5 5.5 4.5 5 5.5 2.5 1 3.5 1 8 4.92
DS7 6 7 8 3 4 5 3 4 5 4 5 6 9 9.5 10 5 6 7 4 5 6 6 7 8 5.5 6 6.5 4.5 5 5.5 4.5 5 5.5 4.5 5 5.5 4 9.5 5.71
DS8 5 6 7 4 5 6 3 4 5 8 9 10 9 9.5 10 6 7 8 4 5 6 7 8 9 2.5 3 3.5 3.5 4.5 4.5 4.5 5 5.5 4.5 5 5.5 3 9.5 5.92
DS9 5 6 7 3 4 5 1 2 3 8 9 10 7 8 9 3 4 5 6 7 8 4 5 6 4.5 5 5.5 1.5 3.5 2.5 4.5 5 5.5 1.5 7 2.5 2 9 5.46
DS10 7 8 9 4 5 6 5 6 7 5 6 7 7 8 9 7 8 9 6 7 8 7 8 9 2.5 3 3.5 2.5 4.5 3.5 5.5 6 6.5 4.5 7 5.5 3 8 6.38
DS11 5 6 7 5 6 7 1 2 3 5 6 7 7 8 9 6 7 8 5 6 7 3 4 5 6.5 7 7.5 3.5 3.5 4.5 2.5 3 3.5 5.5 6 6.5 2 8 5.38
DS12 5 6 7 5 6 7 2 3 4 7 8 9 7 8 9 5 6 7 2 3 4 4 5 6 5.5 6 6.5 1.5 3.5 2.5 4.5 5 5.5 1.5 3 2.5 3 8 5.21
DS13 6 7 8 4 5 6 5 6 7 8 9 10 7 8 9 4 5 6 2 3 4 3 4 5 3.5 4 4.5 4.5 4 5.5 2.5 3 3.5 4.5 3 5.5 3 9 5.08
ME1 5 6 7 4 5 6 1 2 3 8 9 10 7 8 9 3 4 5 6 7 8 3 4 5 5.5 6 6.5 3.5 4 4.5 3.5 4 4.5 1.5 7 2.5 2 9 5.50
ME2 6 7 8 3 4 5 1 2 3 6 7 8 8 9 10 7 8 9 4 5 6 7 8 9 5.5 6 6.5 3.5 4 4.5 3.5 4 4.5 4.5 5 5.5 2 9 5.75
ME3 5 6 7 5 6 7 1 2 3 6 7 8 9 9.5 10 6 7 8 4 5 6 7 8 9 3.5 4 4.5 4.5 4 5.5 2.5 3 3.5 5.5 5 6.5 2 9.5 5.54
ME4 7 8 9 5 6 7 4 5 6 9 9.5 10 9 9.5 10 3 4 5 1 2 3 4 5 6 4.5 5 5.5 1.5 3.5 2.5 4.5 5 5.5 4.5 2 5.5 2 9.5 5.38 L=Lower bound value 1 1( )rj rjy G
N=Nominal value 1( )rjy
U=Upper bound vale 1 1( )rj rjy G

Fasanghari & Sadegh Amalnick & Taghipour Anvari & Razmi, A Robust Data Envelopment Analysis ……
106
Table A-2. The input and output data for IT research projects of ITRC including summary statistics expressed by expert 2 (E2)
DMU1 DMU2 DMU3 DMU4 DMU5 DMU6 DMU7 DMU8 DMU9 DMU10 DMU11 DMU12 Min
Max
Mean
L N U L N U L N U L N U L N U L N U L N U L N U L N U L N U L N U L N U
PO1 4 6 8 3 5 7 4 6 8 4 6 8 9.5 9.75 10 7.5 8 8.5 3.5 4 4.5 7.5 8 8.5 4 5 6 3 5 5 5 6 7 5 4 7 4 9.75 6.06
PO2 4 6 8 2 4 6 0 2 4 5 7 9 9.5 9.75 10 3.5 4 4.5 5.5 6 6.5 4.5 5 5.5 5 6 7 2 4 4 4 5 6 3 6 5 2 9.75 5.40
PO3 4 6 8 3 5 7 2 4 6 5 7 9 6.5 7 7.5 5.5 6 6.5 6.5 7 7.5 3.5 4 4.5 5 6 7 4 4 6 2 3 4 1 7 3 3 7 5.50
PO4 6 8 10 3 5 7 0 1 3 6 8 10 9.5 9.75 10 4.5 5 5.5 2.5 3 3.5 3.5 4 4.5 5 6 7 4 5.5 6 5 6 7 3 3 5 1 9.75 5.35
PO5 6 8 10 2 4 6 2 4 6 8 9 10 9.5 9.75 10 5.5 6 6.5 1.5 2 2.5 4.5 5 5.5 5 6 7 4 5 6 4 5 6 2 2 4 2 9.75 5.48
PO6 5 7 9 3 5 7 0 2 4 4 6 8 8.5 9 9.5 5.5 6 6.5 3.5 4 4.5 3.5 4 4.5 3 4 5 4 4 6 2 3 4 1 4 3 2 9 4.83
PO7 4 6 8 3 5 7 3 5 7 5 7 9 8.5 9 9.5 4.5 5 5.5 3.5 4 4.5 4.5 5 5.5 3 4 5 3 4.5 5 4 5 6 3 4 5 4 9 5.29
PO8 5 7 9 2 4 6 0 2 4 7 8.5 10 8.5 9 9.5 7.5 8 8.5 6.5 7 7.5 6.5 7 7.5 4 5 6 1 4 3 5 6 7 5 7 7 2 9 6.21
PO9 6 8 10 3 5 7 0 2 4 6 8 10 7.5 8 8.5 3.5 4 4.5 4.5 5 5.5 4.5 5 5.5 6 7 8 1 3.5 3 4 5 6 4 5 6 2 8 5.46
PO10 6 8 10 4 6 8 1 3 5 7 8.5 10 7.5 8 8.5 4.5 5 5.5 6.5 7 7.5 6.5 7 7.5 2 3 4 3 5 5 5 6 7 4 7 6 3 8.5 6.13
AI1 4 6 8 2 4 6 4 6 8 8 9 10 6.5 7 7.5 4.5 5 5.5 1.5 2 2.5 3.5 4 4.5 2 3 4 1 2.5 3 2 3 4 5 2 7 2 9 4.46
AI2 5 7 9 2 4 6 3 5 7 6 8 10 8.5 9 9.5 6.5 7 7.5 4.5 5 5.5 7.5 8 8.5 4 5 6 3 4 5 3 4 5 2 5 4 4 9 5.92
AI3 5 7 9 0 2 4 0 2 4 8 9 10 8.5 9 9.5 6.5 7 7.5 5.5 6 6.5 5.5 6 6.5 4 5 6 2 4 4 4 5 6 4 6 6 2 9 5.67
AI4 6 8 10 1 3 5 0 2 4 8 9 10 8.5 9 9.5 4.5 5 5.5 3.5 4 4.5 7.5 8 8.5 4 5 6 2 3.5 4 3 4 5 3 4 5 2 9 5.38
AI5 5 7 9 3 5 7 1 3 5 5 7 9 7.5 8 8.5 7.5 8 8.5 0.5 1 1.5 6.5 7 7.5 5 6 7 3 4.5 5 4 5 6 4 1 6 1 8 5.21
AI6 5 7 9 1 3 5 0 2 4 5 7 9 8.5 9 9.5 5.5 6 6.5 6.5 7 7.5 4.5 5 5.5 3 4 5 1 4 3 5 6 7 3 7 5 2 9 5.58
AI7 4 6 8 0 2 4 0 2 4 6 8 10 8.5 9 9.5 4.5 5 5.5 1.5 2 2.5 7.5 8 8.5 2 3 4 1 3 3 3 4 5 4 2 6 2 9 4.50
DS1 4 6 8 1 3 5 0 2 4 4 6 8 7.5 8 8.5 6.5 7 7.5 5.5 6 6.5 7.5 8 8.5 3 4 5 4 4.5 6 3 4 5 4 6 6 2 8 5.38
DS2 5 7 9 2 4 6 3 5 7 6 8 10 9.5 9.75 10 3.5 4 4.5 3.5 4 4.5 5.5 6 6.5 6 7 8 3 4.5 5 4 5 6 2 4 4 4 9.75 5.69
DS3 4 6 8 4 6 8 2 4 6 7 8.5 10 8.5 9 9.5 7.5 8 8.5 5.5 6 6.5 4.5 5 5.5 4 5 6 3 4 5 3 4 5 4 6 6 4 9 5.96
DS4 4 6 8 1 3 5 3 5 7 3 5 7 8.5 9 9.5 6.5 7 7.5 5.5 6 6.5 4.5 5 5.5 3 4 5 0 2 2 2 3 4 2 6 4 2 9 5.08
DS5 4 6 8 0 2 4 1 3 5 7 8.5 10 6.5 7 7.5 5.5 6 6.5 5.5 6 6.5 4.5 5 5.5 3 4 5 4 4.5 6 3 4 5 1 6 3 2 8.5 5.17
DS6 5 7 9 3 5 7 2 4 6 6 8 10 6.5 7 7.5 6.5 7 7.5 1.5 2 2.5 8.5 9 9.5 5 6 7 1 2.5 3 2 3 4 4 2 6 2 9 5.21
DS7 5 7 9 3 5 7 0 1 3 4 6 8 7.5 8 8.5 7.5 8 8.5 0.5 1 1.5 4.5 5 5.5 6 7 8 4 5.5 6 5 6 7 4 1 6 1 8 5.04
DS8 4 6 8 2 4 6 3 5 7 6 8 10 7.5 8 8.5 5.5 6 6.5 3.5 4 4.5 6.5 7 7.5 5 6 7 5 5.5 7 4 5 6 3 4 5 4 8 5.71
DS9 5 7 9 3 5 7 0 2 4 4 6 8 6.5 7 7.5 3.5 4 4.5 4.5 5 5.5 4.5 5 5.5 6 7 8 3 4 5 3 4 5 1 5 3 2 7 5.08
DS10 6 8 10 0 2 4 2 4 6 8 9 10 6.5 7 7.5 3.5 4 4.5 2.5 3 3.5 8.5 9 9.5 6 7 8 1 3.5 3 4 5 6 4 3 6 2 9 5.38
DS11 5 7 9 2 4 6 3 5 7 7 8.5 10 8.5 9 9.5 3.5 4 4.5 5.5 6 6.5 5.5 6 6.5 4 5 6 0 2.5 2 3 4 5 3 6 5 2.5 9 5.58
DS12 5 7 9 1 3 5 0 2 4 6 8 10 9.5 9.75 10 5.5 6 6.5 1.5 2 2.5 3.5 4 4.5 5 6 7 2 3.5 4 3 4 5 3 2 5 2 9.75 4.77
DS13 6 8 10 3 5 7 0 2 4 6 8 10 6.5 7 7.5 7.5 8 8.5 6.5 7 7.5 2.5 3 3.5 4 5 6 4 4.5 6 3 4 5 3 7 5 2 8 5.71
ME1 5 7 9 3 5 7 0 1 3 5 7 9 7.5 8 8.5 5.5 6 6.5 6.5 7 7.5 7.5 8 8.5 5 6 7 2 4.5 4 5 6 7 4 7 6 1 8 6.04
ME2 4 6 8 2 4 6 2 4 6 5 7 9 9.5 9.75 10 4.5 5 5.5 4.5 5 5.5 5.5 6 6.5 6 7 8 0 3 2 4 5 6 3 5 5 3 9.75 5.56
ME3 5 7 9 0 2 4 0 2 4 8 9 10 7.5 8 8.5 5.5 6 6.5 5.5 6 6.5 7.5 8 8.5 2 3 4 2 4 4 4 5 6 5 6 7 2 9 5.50
ME4 5 7 9 2 4 6 0 2 4 7 8.5 10 8.5 9 9.5 4.5 5 5.5 3.5 4 4.5 5.5 6 6.5 3 4 5 5 4.5 7 2 3 4 5 4 7 2 9 5.08
L=Lower bound value 2 2( )rj rjy G
N=Nominal value 2( )rjy
U=Upper bound vale 2 2( )rj rjy G

Journal of Information Systems and Telecommunication, No. 2, Vol. 1, April – June 2013
107
Table A-3. The input and output data for IT research projects of ITRC including summary statistics expressed by expert 3 (E3)
DMU1 DMU2 DMU3 DMU4 DMU5 DMU6 DMU7 DMU8 DMU9 DMU10 DMU11 DMU12 Min
Max
Mean
L N U L N U L N U L N U L N U L N U L N U L N U L N U L N U L N U L N U
PO1 4 6 8 1 3 5 0 2 4 6 8 10 6.5 7 7.5 4.5 5 5.5 5.5 6 6.5 5.5 6 6.5 3 4 5 0 2.5 2 3 4 5 5 6 7 2 8 4.96
PO2 4 6 8 2 4 6 0 1 3 4 6 8 8.5 9 9.5 5.5 6 6.5 1.5 2 2.5 6.5 7 7.5 3 4 5 1 3 3 3 4 5 5 2 7 1 9 4.50
PO3 4 6 8 3 5 7 3 5 7 8 9 10 6.5 7 7.5 6.5 7 7.5 4.5 5 5.5 2.5 3 3.5 4 5 6 0 2.5 2 3 4 5 4 5 6 2.5 9 5.29
PO4 6 8 10 3 5 7 0 2 4 6 8 10 7.5 8 8.5 6.5 7 7.5 5.5 6 6.5 5.5 6 6.5 5 6 7 4 4.5 6 3 4 5 1 6 3 2 8 5.88
PO5 6 8 10 4 6 8 0 2 4 4 6 8 7.5 8 8.5 6.5 7 7.5 1.5 2 2.5 7.5 8 8.5 3 4 5 3 4.5 5 4 5 6 5 2 7 2 8 5.21
PO6 5 7 9 1 3 5 0 2 4 4 6 8 7.5 8 8.5 6.5 7 7.5 3.5 4 4.5 6.5 7 7.5 3 4 5 0 3 2 4 5 6 5 4 7 2 8 5.00
PO7 5 7 9 3 5 7 1 3 5 7 8.5 10 8.5 9 9.5 6.5 7 7.5 4.5 5 5.5 5.5 6 6.5 5 6 7 4 4.5 6 3 4 5 5 5 7 3 9 5.83
PO8 6 8 10 0 2 4 1 3 5 7 8.5 10 8.5 9 9.5 5.5 6 6.5 1.5 2 2.5 4.5 5 5.5 5 6 7 3 3.5 5 2 3 4 3 2 5 2 9 4.83
PO9 6 8 10 3 5 7 0 2 4 3 5 7 8.5 9 9.5 6.5 7 7.5 0.5 1 1.5 5.5 6 6.5 5 6 7 0 2 2 2 3 4 2 1 4 1 9 4.58
PO10 4 6 8 3 5 7 3 5 7 4 6 8 8.5 9 9.5 6.5 7 7.5 0.5 1 1.5 6.5 7 7.5 3 4 5 3 5 5 5 6 7 3 1 5 1 9 5.17
AI1 5 7 9 2 4 6 0 2 4 7 8.5 10 8.5 9 9.5 6.5 7 7.5 2.5 3 3.5 8.5 9 9.5 5 6 7 0 3 2 4 5 6 3 3 5 2 9 5.54
AI2 5 7 9 3 5 7 3 5 7 6 8 10 8.5 9 9.5 7.5 8 8.5 5.5 6 6.5 5.5 6 6.5 4 5 6 4 4.5 6 3 4 5 4 6 6 4 9 6.13
AI3 5 7 9 2 4 6 0 2 4 3 5 7 7.5 8 8.5 4.5 5 5.5 3.5 4 4.5 7.5 8 8.5 3 4 5 2 4 4 4 5 6 5 4 7 2 8 5.00
AI4 4 6 8 1 3 5 1 3 5 3 5 7 8.5 9 9.5 6.5 7 7.5 5.5 6 6.5 3.5 4 4.5 4 5 6 3 4.5 5 4 5 6 1 6 3 3 9 5.29
AI5 5 7 9 1 3 5 0 1 3 4 6 8 9.5 9.75 10 4.5 5 5.5 1.5 2 2.5 8.5 9 9.5 3 4 5 1 3 3 3 4 5 2 2 4 1 9.75 4.65
AI6 6 8 10 3 5 7 3 5 7 8 9 10 8.5 9 9.5 7.5 8 8.5 2.5 3 3.5 2.5 3 3.5 5 6 7 2 3 4 2 3 4 4 3 6 3 9 5.42
AI7 4 6 8 1 3 5 2 4 6 5 7 9 7.5 8 8.5 3.5 4 4.5 2.5 3 3.5 2.5 3 3.5 2 3 4 2 3 4 2 3 4 2 3 4 3 8 4.17
DS1 4 6 8 3 5 7 3 5 7 5 7 9 7.5 8 8.5 6.5 7 7.5 4.5 5 5.5 4.5 5 5.5 2 3 4 5 5 7 3 4 5 2 5 4 3 8 5.42
DS2 4 6 8 4 6 8 3 5 7 7 8.5 10 7.5 8 8.5 4.5 5 5.5 6.5 7 7.5 7.5 8 8.5 5 6 7 0 2 2 2 3 4 1 7 3 2 8.5 5.96
DS3 5 7 9 1 3 5 0 2 4 3 5 7 7.5 8 8.5 4.5 5 5.5 6.5 7 7.5 6.5 7 7.5 3 4 5 4 4 6 2 3 4 3 7 5 2 8 5.17
DS4 5 7 9 4 6 8 0 1 3 6 8 10 8.5 9 9.5 4.5 5 5.5 4.5 5 5.5 6.5 7 7.5 3 4 5 1 3 3 3 4 5 4 5 6 1 9 5.33
DS5 6 8 10 1 3 5 0 2 4 6 8 10 7.5 8 8.5 6.5 7 7.5 6.5 7 7.5 8.5 9 9.5 4 5 6 1 3 3 3 4 5 5 7 7 2 9 5.92
DS6 4 6 8 3 5 7 4 6 8 4 6 8 9.5 9.75 10 6.5 7 7.5 4.5 5 5.5 6.5 7 7.5 3 4 5 4 4 6 2 3 4 3 5 5 3 9.75 5.65

Fasanghari & Sadegh Amalnick & Taghipour Anvari & Razmi, A Robust Data Envelopment Analysis ……
108
DMU1 DMU2 DMU3 DMU4 DMU5 DMU6 DMU7 DMU8 DMU9 DMU10 DMU11 DMU12 Min
Max
Mean
L N U L N U L N U L N U L N U L N U L N U L N U L N U L N U L N U L N U
DS7 5 7 9 4 6 8 1 3 5 6 8 10 6.5 7 7.5 5.5 6 6.5 2.5 3 3.5 5.5 6 6.5 4 5 6 2 4 4 4 5 6 4 3 6 3 8 5.25
DS8 5 7 9 0 2 4 4 6 8 4 6 8 9.5 9.75 10 4.5 5 5.5 3.5 4 4.5 8.5 9 9.5 6 7 8 2 3.5 4 3 4 5 4 4 6 2 9.75 5.60
DS9 6 8 10 0 2 4 1 3 5 6 8 10 7.5 8 8.5 6.5 7 7.5 3.5 4 4.5 3.5 4 4.5 2 3 4 1 3 3 3 4 5 3 4 5 2 8 4.83
DS10 5 7 9 3 5 7 1 3 5 4 6 8 7.5 8 8.5 4.5 5 5.5 0.5 1 1.5 2.5 3 3.5 4 5 6 2 3 4 2 3 4 2 1 4 1 8 4.17
DS11 5 7 9 3 5 7 3 5 7 6 8 10 8.5 9 9.5 7.5 8 8.5 6.5 7 7.5 7.5 8 8.5 3 4 5 2 3.5 4 3 4 5 2 7 4 3.5 9 6.29
DS12 5 7 9 4 6 8 2 4 6 4 6 8 8.5 9 9.5 4.5 5 5.5 5.5 6 6.5 4.5 5 5.5 5 6 7 2 3 4 2 3 4 3 6 5 3 9 5.50
DS13 4 6 8 2 4 6 1 3 5 5 7 9 6.5 7 7.5 7.5 8 8.5 3.5 4 4.5 3.5 4 4.5 3 4 5 0 3 2 4 5 6 1 4 3 3 8 4.92
ME1 6 8 10 3 5 7 3 5 7 6 8 10 8.5 9 9.5 5.5 6 6.5 4.5 5 5.5 5.5 6 6.5 5 6 7 5 4.5 7 2 3 4 2 5 4 3 9 5.88
ME2 4 6 8 3 5 7 4 6 8 5 7 9 6.5 7 7.5 3.5 4 4.5 2.5 3 3.5 3.5 4 4.5 6 7 8 5 5.5 7 4 5 6 3 3 5 3 7 5.21
ME3 5 7 9 3 5 7 0 1 3 5 7 9 7.5 8 8.5 7.5 8 8.5 2.5 3 3.5 7.5 8 8.5 3 4 5 3 4 5 3 4 5 4 3 6 1 8 5.17
ME4 5 7 9 3 5 7 2 4 6 4 6 8 8.5 9 9.5 3.5 4 4.5 5.5 6 6.5 7.5 8 8.5 2 3 4 1 4 3 5 6 7 5 6 7 3 9 5.67
L=Lower bound value3 3( )rj rjy G
N=Nominal value 3( )rjy
U=Upper bound vale 3 3( )rj rjy G

Journal of Information Systems and Telecommunication, No. 2, Vol. 1, April – June 2013
109
Table A-4. The input and output data for IT research projects of ITRC including summary statistics expressed by expert 4 (E4)
DMU1 DMU2 DMU3 DMU4 DMU5 DMU6 DMU7 DMU8 DMU9 DMU10 DMU11 DMU12 Min
Max
Mean
L N U L N U L N U L N U L N U L N U L N U L N U L N U L N U L N U L N U
PO1 6.5 7 7.5 3.5 4 4.5 1.5 2 2.5 9.5 9.75 10 7 8 9 7 8 9 4 5 6 7 8 9 3 4 5 5 4.5 7 2 3 4 2 5 4 2 9.75 5.69
PO2 5.5 6 6.5 3.5 4 4.5 0.5 1 1.5 5.5 6 6.5 7 8 9 7 8 9 5 6 7 5 6 7 2 3 4 1 3 3 3 4 5 5 6 7 1 8 5.08
PO3 6.5 7 7.5 4.5 5 5.5 2.5 3 3.5 8.5 9 9.5 7 8 9 7 8 9 3 4 5 8 9 10 6 7 8 2 3.5 4 3 4 5 3 4 5 3 9 5.96
PO4 5.5 6 6.5 4.5 5 5.5 5.5 6 6.5 8.5 9 9.5 7 8 9 7 8 9 0 1 2 3 4 5 5 6 7 3 4.5 5 4 5 6 3 1 5 1 9 5.29
PO5 5.5 6 6.5 3.5 4 4.5 4.5 5 5.5 7.5 8 8.5 7 8 9 4 5 6 2 3 4 7 8 9 4 5 6 0 2 2 2 3 4 1 3 3 2 8 5.00
PO6 7.5 8 8.5 2.5 3 3.5 5.5 6 6.5 8.5 9 9.5 8 9 10 6 7 8 5 6 7 4 5 6 4 5 6 1 3.5 3 4 5 6 4 6 6 3 9 6.04
PO7 7.5 8 8.5 4.5 5 5.5 1.5 2 2.5 8.5 9 9.5 8 9 10 4 5 6 3 4 5 3 4 5 3 4 5 3 3.5 5 2 3 4 2 4 4 2 9 5.04
PO8 6.5 7 7.5 3.5 4 4.5 4.5 5 5.5 6.5 7 7.5 6 7 8 5 6 7 0 1 2 6 7 8 3 4 5 4 4.5 6 3 4 5 3 1 5 1 7 4.79
PO9 6.5 7 7.5 2.5 3 3.5 1.5 2 2.5 7.5 8 8.5 7 8 9 5 6 7 2 3 4 4 5 6 4 5 6 0 3.5 2 5 6 7 3 3 5 2 8 4.96
PO10 6.5 7 7.5 2.5 3 3.5 2.5 3 3.5 8.5 9 9.5 7 8 9 4 5 6 4 5 6 7 8 9 3 4 5 4 5 6 4 5 6 4 5 6 3 9 5.58
AI1 5.5 6 6.5 4.5 5 5.5 2.5 3 3.5 8.5 9 9.5 7 8 9 5 6 7 0 1 2 3 4 5 4 5 6 1 3 3 3 4 5 3 1 5 1 9 4.58
AI2 7.5 8 8.5 5.5 6 6.5 5.5 6 6.5 5.5 6 6.5 9 9.5 10 6 7 8 5 6 7 5 6 7 6 7 8 3 4 5 3 4 5 2 6 4 4 9.5 6.29
AI3 5.5 6 6.5 5.5 6 6.5 1.5 2 2.5 9.5 9.75 10 6 7 8 7 8 9 1 2 3 5 6 7 4 5 6 3 4.5 5 4 5 6 5 2 7 2 9.75 5.27
AI4 5.5 6 6.5 5.5 6 6.5 3.5 4 4.5 9.5 9.75 10 6 7 8 4 5 6 4 5 6 5 6 7 4 5 6 3 5 5 5 6 7 3 5 5 4 9.75 5.81
AI5 6.5 7 7.5 3.5 4 4.5 0.5 1 1.5 5.5 6 6.5 6 7 8 4 5 6 1 2 3 2 3 4 6 7 8 0 2.5 2 3 4 5 5 2 7 1 7 4.21
AI6 7.5 8 8.5 2.5 3 3.5 3.5 4 4.5 8.5 9 9.5 9 9.5 10 3 4 5 5 6 7 3 4 5 5 6 7 5 4.5 7 2 3 4 1 6 3 3 9.5 5.58
AI7 6.5 7 7.5 4.5 5 5.5 0.5 1 1.5 4.5 5 5.5 7 8 9 5 6 7 5 6 7 3 4 5 5 6 7 1 3.5 3 4 5 6 2 6 4 1 8 5.21
DS1 7.5 8 8.5 2.5 3 3.5 2.5 3 3.5 9.5 9.75 10 8 9 10 5 6 7 3 4 5 4 5 6 4 5 6 2 4 4 4 5 6 1 4 3 3 9.75 5.48
DS2 7.5 8 8.5 2.5 3 3.5 3.5 4 4.5 5.5 6 6.5 8 9 10 5 6 7 2 3 4 5 6 7 5 6 7 1 3.5 3 4 5 6 3 3 5 3 9 5.21
DS3 7.5 8 8.5 1.5 2 2.5 3.5 4 4.5 7.5 8 8.5 6 7 8 3 4 5 0 1 2 5 6 7 4 5 6 2 3.5 4 3 4 5 2 1 4 1 8 4.46
DS4 6.5 7 7.5 2.5 3 3.5 1.5 2 2.5 7.5 8 8.5 8 9 10 6 7 8 4 5 6 2 3 4 5 6 7 3 4 5 3 4 5 1 5 3 2 9 5.25
DS5 5.5 6 6.5 2.5 3 3.5 2.5 3 3.5 8.5 9 9.5 9 9.5 10 5 6 7 1 2 3 8 9 10 2 3 4 2 4 4 4 5 6 2 2 4 2 9.5 5.13
DS6 5.5 6 6.5 3.5 4 4.5 0.5 1 1.5 6.5 7 7.5 8 9 10 3 4 5 4 5 6 4 5 6 6 7 8 3 4.5 5 4 5 6 4 5 6 1 9 5.21
DS7 6.5 7 7.5 3.5 4 4.5 4.5 5 5.5 5.5 6 6.5 8 9 10 6 7 8 1 2 3 7 8 9 2 3 4 4 5.5 6 5 6 7 5 2 7 2 9 5.38
DS8 5.5 6 6.5 3.5 4 4.5 2.5 3 3.5 9.5 9.75 10 7 8 9 7 8 9 5 6 7 6 7 8 6 7 8 1 3 3 3 4 5 3 6 5 3 9.75 5.98
DS9 5.5 6 6.5 2.5 3 3.5 4.5 5 5.5 5.5 6 6.5 7 8 9 4 5 6 6 7 8 6 7 8 5 6 7 5 5 7 3 4 5 3 7 5 3 8 5.75
DS10 5.5 6 6.5 4.5 5 5.5 2.5 3 3.5 6.5 7 7.5 6 7 8 3 4 5 6 7 8 5 6 7 2 3 4 2 4 4 4 5 6 4 7 6 3 7 5.33
DS11 6.5 7 7.5 1.5 2 2.5 4.5 5 5.5 4.5 5 5.5 8 9 10 5 6 7 2 3 4 6 7 8 4 5 6 2 3 4 2 3 4 2 3 4 2 9 4.83
DS12 7.5 8 8.5 5.5 6 6.5 3.5 4 4.5 8.5 9 9.5 9 9.5 10 4 5 6 3 4 5 8 9 10 5 6 7 1 3.5 3 4 5 6 1 4 3 3.5 9.5 6.08
DS13 5.5 6 6.5 4.5 5 5.5 3.5 4 4.5 5.5 6 6.5 6 7 8 3 4 5 4 5 6 7 8 9 5 6 7 5 5.5 7 4 5 6 3 5 5 4 8 5.54
ME1 6.5 7 7.5 5.5 6 6.5 3.5 4 4.5 7.5 8 8.5 8 9 10 6 7 8 2 3 4 7 8 9 2 3 4 4 5 6 4 5 6 2 3 4 3 9 5.67
ME2 6.5 7 7.5 4.5 5 5.5 4.5 5 5.5 7.5 8 8.5 7 8 9 6 7 8 6 7 8 4 5 6 5 6 7 2 3.5 4 3 4 5 2 7 4 3.5 8 6.04
ME3 5.5 6 6.5 5.5 6 6.5 1.5 2 2.5 8.5 9 9.5 8 9 10 4 5 6 1 2 3 6 7 8 5 6 7 4 4.5 6 3 4 5 3 2 5 2 9 5.21
ME4 6.5 7 7.5 3.5 4 4.5 2.5 3 3.5 6.5 7 7.5 7 8 9 6 7 8 3 4 5 7 8 9 5 6 7 1 3 3 3 4 5 4 4 6 3 8 5.42
L=Lower bound value 4 4( )rj rjy G
N=Nominal value 4( )rjy
U=Upper bound vale 4 4( )rj rjy G

Fasanghari & Sadegh Amalnick & Taghipour Anvari & Razmi, A Robust Data Envelopment Analysis ……
110 110
References [1] Weill, P. and J.W. Ross, IT governance: How top
performers manage IT decision rights for
superior results. 2004: Harvard Business Press.
[2] Davoudi, M.R. and F. Shams Aliee.
Characterization of Enterprise Architecture
Quality Attributes. In Enterprise Distributed
Object Computing Conference Workshops, 2009.
EDOCW 2009. 13th 2009.
[3] Davoudi, M.R. and F. Shams Aliee. A New AHP-
based Approach towards Enterprise Architecture
Quality Attribute Analysis. In Research
Challenges in Information Science, 2009. RCIS
2009. Third International Conference on. 2009.
[4] Niemann, K.D., From Enterprise Architecture to
IT Governance- Elements of Effective IT
Management. 2006, Germany: Friedr. Vieweg &
Sohn Verlag.
[5] Johnson, P., et al. A Tool for Enterprise
Architecture Analysis. In the 11th IEEE
Enterprise Distributed Object Computing
Conference. 2007. USA: IEEE Computer Society.
[6] Lankes, J.K., Metrics for Application Landscapes:
Status Quo, Development, and a Case Study. 2008.
[7] Cook, W.D. and L.M. Seiford, Data envelopment
analysis (DEA)–Thirty years on. European Journal
of Operational Research, 2009. 192 (1): pp.1-17.
[8] Buckl, S., F. Matthes, and C.M. Schweda.
Classifying Enterprise Architecture Analysis
Approaches. In the 2nd IFIP WG5.8 Workshop on
Enterprise Interoperability (IWEI'2009). 2009.
Valencia, Spain.
[9] Yu, E., M. Strohmaier, and X. Deng. Exploring
intentional modeling and analysis for enterprise
architecture. In the EDOC 2006 Conference
Workshop on Trends in Enterprise Architecture
Research (TEAR 2006). 2006. Hong Kong: IEEE
Computer Society Press.
[10] Jacob, M.-E. and H. Jonkers, Quantitative
analysis of enterprise architectures.
Interoperability of Enterprise Software and
Applications, ed. D. Konstantas, et al. 2006,
Geneva, Switzerland: Springer.
[11] Boer, F.S., et al. Enterprise architecture analysis
with XML. In the 38th Annual Hawaii
International Conference on System Sciences
(HICSS 2005). 2005. USA: IEEE Computer
Society Press.
[12] Frank, U., et al. Designing and utilizing business
indicator systems within enterprise models-
outline of a method. In Modeling Business
Information Systems Conference (MobIS 2008).
2008. Saarbrucken, Germany.
[13] Razavi, M., F. Shams Aliee, and K. Badie, An
AHP-based approach toward enterprise
architecture analysis based on enterprise
architecture quality attributes. Knowledge and
information systems, 2011. 28 (2): pp.449-472.
[14] Lagerström, R. Analyzing System Maintainability
Using Enterprise Architecture Models. In the 2nd
Workshop on Trends in Enterprise Architecture
Research (TEAR’07). 2007. St Gallen,
Switzerland.
[15] Lagerström, R. and P. Johnson. Using
Architectural Models to Predict the
Maintainability of Enterprise Systems. in 12th
European Conference on Software Maintenance
and Reengineering. 2008.
[16] Büyüközkan, G. and D. Ruan, Evaluation of
software development projects using a fuzzy
multi-criteria decision approach. Mathematics
and Computers in Simulation, 2008. 77 (5):
pp.464-475.
[17] Lee, K., et al., Quantitative measurement of
quality attribute preferences using conjoint
analysis. Interactive Systems. Design,
Specification, and Verification, 2006: pp.213-224.
[18] Reddy, A., M. Naidu, and P. Govindarajulu, An
integrated approach of analytical hierarchy
process model and goal model (AHP-GP Model)
for selection of software architecture.
International Journal of Computer Science and
Network Security, 2007. 7 (10): pp.108-117.
[19] Svahnberg, M., et al., A quality-driven decision-
support method for identifying software
architecture candidates. International Journal of
Software Engineering and Knowledge
Engineering, 2003. 13 (05): pp.547-573.
[20] Zhu, L., et al., Tradeoff and sensitivity analysis
in software architecture evaluation using analytic
hierarchy process. Software Quality Journal,
2005. 13 (4): pp.357-375.
[21] Saaty, T.L., The analytical hierarchical process. J
Wiley, New York, 1980.
[22] Davidsson, P., S. Johansson, and M. Svahnberg,
Using the analytic hierarchy process for
evaluating multi-agent system architecture
candidates. Agent-Oriented Software
Engineering VI, 2006: pp.205-217.
[23] Wang, C.H., R.D. Gopal, and S. Zionts, Use of
data envelopment analysis in assessing
information technology impact on firm
performance. Annals of Operations Research,
1997. 73: pp.191-213.
[24] Asosheh, A., S. Nalchigar, and M. Jamporazmey,
Information technology project evaluation: An
integrated data envelopment analysis and
balanced scorecard approach. Expert Systems
with Applications, 2010. 37(8): p. 5931-5938.
[25] Huang, Y.S., J.T. Liao, and Z.L. Lin, A study on
aggregation of group decisions. Systems
Research and Behavioral Science, 2009. 26 (4):
pp.445-454.
[26]Chou, S.Y., Y.H. Chang, and C.Y. Shen, A fuzzy
simple additive weighting system under group
decision-making for facility location selection
with objective/subjective attributes. European
Journal of Operational Research, 2008. 189 (1):
pp.132-145.
[27] Sengupta, J., Dynamics of data envelopment
analysis: Theory of systems efficiency. 1995:
Springer.
[28] ISACA, C., Control Objectives for Information
and realted Technologies. 2010.
[29] Bernroider, E.W.N. and M. Ivanov, IT project
management control and the Control Objectives

Journal of Information Systems and Telecommunication, No. 2, Vol. 1, April – June 2013
111 111
for IT and related Technology (CobiT) framework.
International Journal of Project Management,
2011. 29 (3): pp.325-336.
[30] Hardy, G., Using IT governance and COBIT to
deliver value with IT and respond to legal,
regulatory and compliance challenges.
Information Security Technical Report, 2006. 11
(1): pp.55-61.
[31] Huang, S.-M., et al., Building the evaluation
model of the IT general control for CPAs under
enterprise risk management. Decision Support
Systems, 2011. 50 (4): pp.692-701.
[32] Tuttle, B. and S.D. Vandervelde, An empirical
examination of CobiT as an internal control
framework for information technology.
International Journal of Accounting Information
Systems, 2007. 8 (4): pp.240-263.
[33] Žvanut, B. and M. Bajec, A tool for IT process
construction. Information and Software
Technology, 2010. 52 (4): pp.397-410.
[34] Sadjadi, S. and H. Omrani, Data envelopment
analysis with uncertain data: An application for
Iranian electricity distribution companies. Energy
Policy, 2008. 36 (11): pp.4247-4254.
[35] Charnes, A., W.W. Cooper, and E. Rhodes,
Measuring the efficiency of decision making units.
European Journal of Operational Research, 1978.
2 (6): pp.429-444.
[36] Liu, W., et al., A study of DEA models without
explicit inputs. Omega, 2011. 39 (5): pp.472-480.
[37] Charnes, A. and W.W. Cooper, Deterministic
equivalents for optimizing and satisficing under
chance constraints. Operations research, 1963. 11
(1): pp.18-39.
[38] SENGUPTA, J.K., Efficiency measurement in
stochastic input-output systems†. International
Journal of Systems Science, 1982. 13 (3): pp.273-
287.
[39]Sengupta, J.K., Data envelopment analysis for
efficiency measurement in the stochastic case.
Computers & operations research, 1987. 14 (2):
pp.117-129.
[40] SENGUPTA, J.K., Robust efficiency measures in a
stochastic efficiency model. International Journal of
Systems Science, 1988. 19 (5): pp.779-791.
[41] Cooper, W.W., et al., Chance constrained
programming formulations for stochastic
characterizations of efficiency and dominance in
DEA. Journal of Productivity Analysis, 1998. 9
(1): pp.53-79.
[42] Cooper, W., Z. Huang, and S.X. Li, Chapter 13
Satisficing DEA models under chance
constraints. Annals of Operations Research,
1996. 66 (4): pp.279-295.
[43]Cooper, W.W., et al., Chance constrained
programming approaches to congestion in
stochastic data envelopment analysis. European
Journal of Operational Research, 2004. 155 (2):
pp.487-501.
[44] Ben-Tal, A. and A. Nemirovski, Robust solutions
of linear programming problems contaminated
with uncertain data. Mathematical Programming,
2000. 88 (3): pp.411-424.
[45] Soyster, A.L., Technical Note—Convex
Programming with Set-Inclusive Constraints and
Applications to Inexact Linear Programming.
Operations research, 1973. 21 (5): pp.1154-1157.
[46] Ben-Tal, A. and A. Nemirovski, Robust convex
optimization. Mathematics of Operations
Research, 1998. 23 (4): pp.769-805.
[47] Ben-Tal, A. and A. Nemirovski, Robust solutions
of uncertain linear programs. Operations
research letters, 1999. 25 (1): pp.1-13.
[48] Bertsimas, D., D. Pachamanova, and M. Sim, Robust
linear optimization under general norms. Operations
Research Letters, 2004. 32 (6): pp.510-516.
[49] Bertsimas, D. and M. Sim, The price of robustness.
Operations research, 2004. 52 (1): pp.35-53.
[50] Wang, K. and F. Wei, Robust data envelopment
analysis based MCDM with the consideration of
uncertain data. Systems Engineering and
Electronics, Journal of, 2010. 21 (6): pp.981-989.
[51]Sadjadi, S. and H. Omrani, A bootstrapped
robust data envelopment analysis model for
efficiency estimating of telecommunication
companies in Iran. Telecommunications Policy,
2010. 34 (4): pp.221-232.
[52] Simar, L. and P.W. Wilson, Sensitivity analysis of
efficiency scores: How to bootstrap in
nonparametric frontier models. Management
science, 1998: pp.49-61.
[53] Simar, L. and P.W. Wilson, A general
methodology for bootstrapping in non-parametric
frontier models. Journal of applied statistics, 2000.
27 (6): pp.779-802.
[54] Shokouhi, A.H., et al., A robust optimization
approach for imprecise data envelopment
analysis. Computers & Industrial Engineering,
2010. 59 (3): pp.387-397.
[55] Ben-Tal, A., L. El Ghaoui, and A. Nemirovski,
Robust optimization. 2009: Princeton University
Press.
[56]Tsai, W.-H., et al., A MCDM approach for
sourcing strategy mix decision in IT projects.
Expert Systems with Applications, 2010. 37 (5):
pp.3870-3886.