A Roadmap to Raleigh's Energy Future · A Roadmap to Raleigh’s Energy Future City of Raleigh...
62
A Roadmap to Raleigh’s Energy Future City of Raleigh Climate/Energy Action Plan November 2012
Transcript of A Roadmap to Raleigh's Energy Future · A Roadmap to Raleigh’s Energy Future City of Raleigh...
A Roadmap to Raleigh’s Energy Future
City of Raleigh Climate/Energy Action Plan
November 2012
City of Raleigh Climate/Energy Action PlanAcknowledgements
Mayor Nancy McFarlane
Members of the City Council Mary Ann Baldwin, Thomas Crowder, Bonner Gaylord, John Odom, Randall Stagner, Russ Stephenson, Eugene Weeks
Executive SponsorsRussell Allen, City ManagerJulian Prosser, Assistant City ManagerPaula Thomas, Offi ce of Sustainability, Manager
Project ManagerCindy Holmes, Offi ce of Sustainability
The Offi ce of Sustainability would like to thank the following for their participation in the planning process and their contribution to this Plan:
City of Raleigh Staff
Funding Agency: U.S. Department of Energy, Offi ce of Energy Effi ciency and Renewable Energy Consultant: CH2M HILL
Acknowledgements
Mayor Nancy McFarlane
Members of the City CouncilMary Ann Baldwin, Thomas Crowder, Bonner Gaylord, Johnnnn OOOOdommmm, RRRRandall
Executive SponsorsRussell Allen, City ManagerJulian Prosser, Assistant City ManagerPaula Thomas, Offi ce of Sustainability, Manager
Project ManagerCindy Holmes, Offi ce of Sustainability
The Offi ce of Sustainability would like to thank tttthhhheeee ffffooollllllllowingggg ffffor their pcontribution to this Plan:
City of Raleigh Staff
SUSTAINABLERaleigh
A Roadmap to Raleigh’s Energy Future
Budget and Management ServicesStephen BentleyJoyce Munro
FinanceFred Blackwood Perry JamesAllyson WhartonTyrone Williams
City Attorney’s Offi ceDan McLawhorn
Parks and RecreationIvan Dickey William Jackson Diane SauerWayne SchindlerSally ThigpenSuzanne Walker
PoliceDana KnucklesVaughn Lowman
City Manager’s Offi ceJen BakerLou Buonpane Steve BurrStewart GranthamLynn GrahamRobert HinsonDan HoweDerrick Remer
Information TechnologyGail RoperJonathon Minter
Public UtilitiesKermit ChapmanTJ LynchMichele MalletteKenny Waldroup
Public WorksTravis Brown Richard KellyMike Kennon
Raleigh Convention CenterMichael Barbour
Solid Waste ServicesFrederick Battle Bobby Broadaway Darryl CollinsLinda LeightonDavid Scarborough
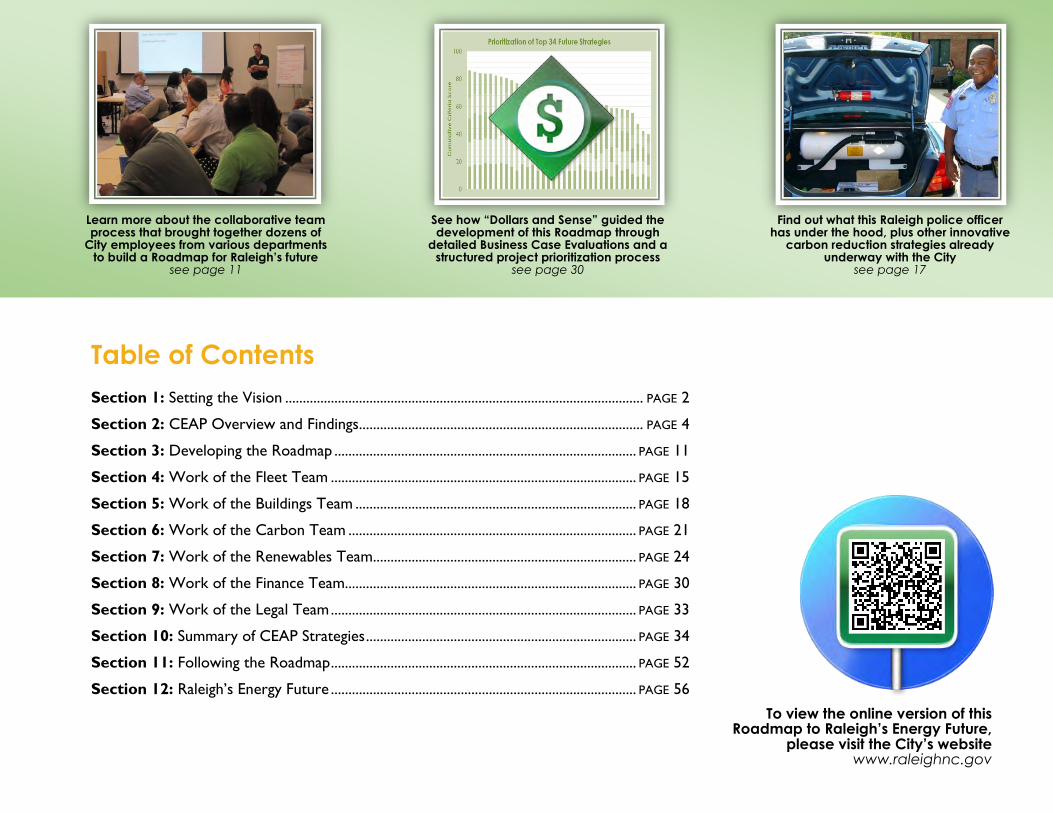
Table of Contents
Section 1: Setting the Vision ...................................................................................................... PAGE 2
Section 2: CEAP Overview and Findings ................................................................................. PAGE 4
Section 3: Developing the Roadmap ...................................................................................... PAGE 11
Section 4: Work of the Fleet Team ....................................................................................... PAGE 15
Section 5: Work of the Buildings Team ................................................................................ PAGE 18
Section 6: Work of the Carbon Team .................................................................................. PAGE 21
Section 7: Work of the Renewables Team........................................................................... PAGE 24
Section 8: Work of the Finance Team................................................................................... PAGE 30
Section 9: Work of the Legal Team ....................................................................................... PAGE 33
Section 10: Summary of CEAP Strategies ............................................................................. PAGE 34
Section 11: Following the Roadmap ....................................................................................... PAGE 52
Section 12: Raleigh’s Energy Future ....................................................................................... PAGE 56
Learn more about the collaborative team process that brought together dozens of
City employees from various departments to build a Roadmap for Raleigh’s future
see page 11
To view the online version of this Roadmap to Raleigh’s Energy Future,
please visit the City’s website www.raleighnc.gov
Find out what this Raleigh police officer
has under the hood, plus other innovative carbon reduction strategies already
underway with the City see page 17
See how “Dollars and Sense” guided the development of this Roadmap through
detailed Business Case Evaluations and a structured project prioritization process
see page 30

he City of Raleigh is already recognized as the Nation’s Most Sustainable Mid-Size Community by the US Chamber of Commerce Business Civic Leadership Center for its outstanding
local-level efforts to achieve complementary economic, environmental, and quality-of-life goals.
The City Council affirmed in 2011 its mission statement for the City of Raleigh as a “21st Century City of Innovation focusing on environmental, cultural and economic sustainability...” Raleigh has a long history of innovative thinking and creative problem solving particularly in times of limited resources and budgetary constraints.
This Roadmap to Raleigh’s Energy Future comes at a critical time in our city’s and our nation’s future as cities are seeking to reduce their dependence on fossil fuels, building energy systems that can support economic and social development goals while lowering emissions of local pollutants and climate-altering greenhouse gases.
This document is intended to prepare the City of Raleigh for the future. Difficult decisions may need to be made, but only after careful evaluation of both the short and long-term consequences. Operational changes may also need to be made and the way business was conducted in the past may no longer meet Raleigh’s needs. Innovative strategies that may not be fully understood today may be on the road to Raleigh’s energy future.
The Climate Energy Action Plan focuses on the creation and adoption of an integrated implementation/action plan. The purpose is to give the City a roadmap for not only implementing projects, but also for developing programs, capacity and capital to institutionalize these values, goals and processes across all departments, thereby extending them well into the future. This is a fundamental cornerstone of the City of Raleigh’s approach to its rapid growth, prudent development, quality of life, and continued focus on maintaining a vibrant and healthy community/economy.
Climate and energy planning is an emerging and increasingly important topic for local governments. Climate change is the distinct, measurable changes (i.e., temperature, rainfall, snow, or wind) in climate over a long period of time, which may be a result of natural factors and/or human activities. Energy
T
SECTION 1
Setting the Vision
Energy-wise is Fiscally Smart
The aggregated energy accounts for the City of Raleigh represent the second largest operating expense, surpassed only by personnel-related expenses.
2 2

insecurity from our dependence on foreign oil and environmental and human health concerns have created a new set of challenges. However, these challenges are coupled with tremendous opportunities to rethink energy usage, protect environmental and human health all while expanding the local economy through energy efficiency and innovation. The reliance on fossil fuels for energy may change as energy interdependence and energy security become more important. This also has come at a time when the entire infrastructure in this country must be updated and improved. The emergence of the smart grid, distributed energy, demand response and other technologies will only hasten the need for energy innovation, which will also require collaboration and education across the entire organization.
Energy costs for the nation have steadily increased over time. The City of Raleigh has experienced this same trend in energy expenses. The aggregated energy accounts for the City of Raleigh represent the second largest operating expense – second only to the personnel related expenses. Long-term savings in operating and capital budgets will be realized for the citizens and taxpayers with thorough total cost of ownership and business case evaluations.
Strategies that have been identified to date are just the beginning of the process for implementing existing and potential programs that address building energy
efficiency, transportation, renewable energy, urban forestry and agriculture, and education and outreach.
Therefore, to meet the Sustainability Goals of the City of Raleigh as articulated in the Council’s mission statement, this Roadmap or Climate Energy Action Plan provides the framework and strategies for our energy future. This project began as a simple climate energy action plan and has matured into the Roadmap to Raleigh’s Energy Future. While the direction of the Roadmap has been set in this document, the trip down this road is not yet complete. This project is the beginning of a transformative change for the City of Raleigh.

he purpose of the City of Raleigh Climate/Energy Action Plan (CEAP): A Roadmap to Raleigh’s Energy Future is to serve as a guide for the City of Raleigh Operations in
the financially responsible, legal and practical implementation of strategies so as to minimize carbon-related emissions, maximize the energy and operational efficiency of existing and new City-owned fleet, facilities and equipment with consideration for life-cycle costs, and provide renewable energy opportunities.
The CEAP provides a framework for the City to advance its role as a 21st Century City of Innovation – exhibiting leadership in energy, climate, and sustainability issues – by becoming more sustainable in terms of internal energy efficiency, carbon reduction, and renewable energy. The framework encompasses holistic thinking about energy, carbon emission reductions, and their related financial aspects.
In developing the CEAP, the City has gained much more than organized information about future projects and strategies. The process also:
Enabled better interdepartmental understanding especially of the many ways in which staff are already working toward similar goals
Uncovered opportunities to combine and leverage various individual or piecemeal efforts
Created a forum for better interdepartmental communication
Created a shared vision for the future
The CEAP presents:
A comprehensive list of activities that can be undertaken to make the City more sustainable in terms of energy efficiency, carbon reduction, and renewable energy
A framework for making financially justifiable decisions that can be correlated to both energy reduction and carbon reduction
A concise way to understand where the “bang for the buck” is, in terms of energy efficiency
T
Climate Energy Action Plan Mission (from CEAP Charter)
“to provide the leadership, resources and management to guide internal City Operations in the financially responsible,
legal and practical implementation of strategies so as to minimize carbon related emissions, maximize the energy
and operational efficiency of existing and new City-owned fleet, facilities, and equipment with consideration for life-
cycle costs, and provide renewable energy opportunities”
SECTION 2
CEAP Overview and Findings
4

Guidance on how to prioritize projects for future funding
Methods to measure and report results achieved by project implementation
A Collaborative Team Approach Unified City Departments The collaborative process to develop the CEAP was driven by an Interdepartmental Team in recognition of the diverse needs and concerns of different departments across the City. This integrated Team included members that covered the range of staff responsibilities from management to operations.
The Team defined criteria that were critical as they developed the CEAP:
Establishing the savings and reductions achievable by the strategies rather than establishing a reduction goal with no practical means to realize it
Identifying specific projects and strategies that could realistically be implemented rather than general concepts
Recognizing the financial and economic impacts to the City as a result of implementing the CEAP
Acknowledging the operational and staff behavioral changes that might be needed to accomplish the CEAP
Six strategic teams developed the plan:
Fleet Renewables
Buildings Finance
Carbon Legal
5
What Sets This CEAP Apart?
Provides a framework for holistic thinking about energy, carbon emission reductions and their related financial aspects
Process directly driven by Interdepartmental Team Members from the bottom up and integrated across City departments
Financial and economic realities of implementing CEAP were part of the process from the start
Practical strategies were developed rather than setting reduction goals without realistic means identified to attain them
A Vision and Strategic Roadmap that is endorsed by the City Council to be implemented by City staff
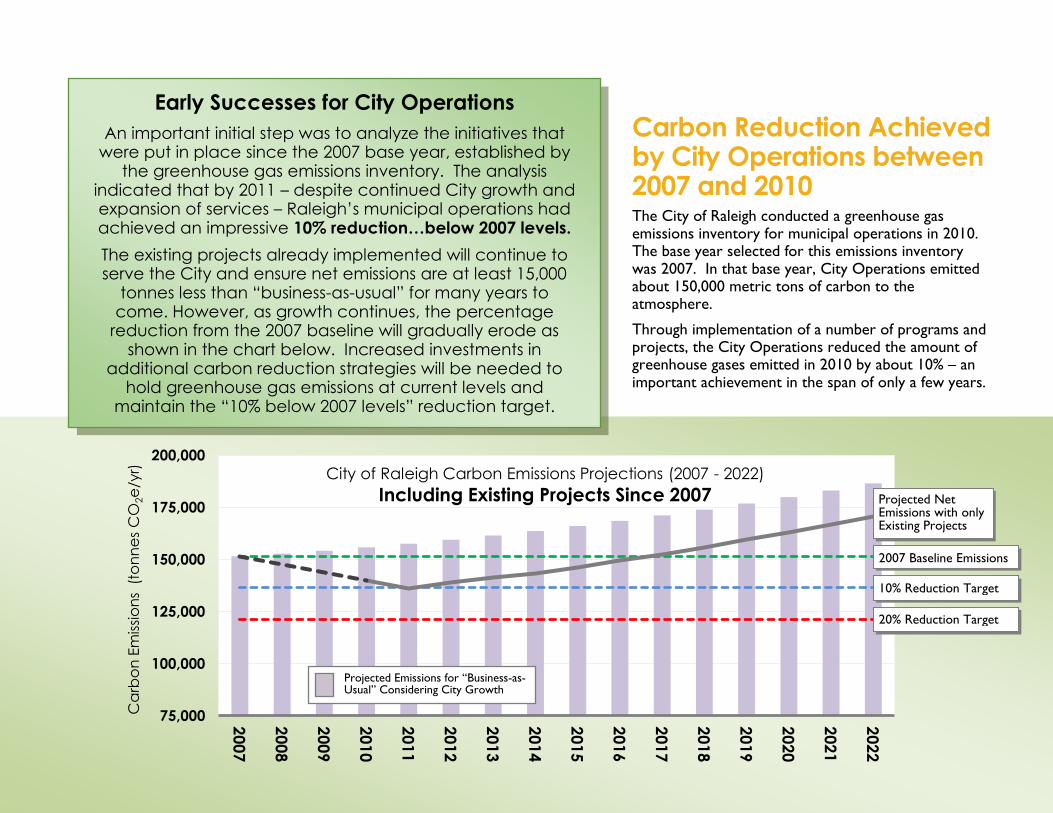
Carbon Reduction Achieved by City Operations between 2007 and 2010 The City of Raleigh conducted a greenhouse gas emissions inventory for municipal operations in 2010. The base year selected for this emissions inventory was 2007. In that base year, City Operations emitted about 150,000 metric tons of carbon to the atmosphere.
Through implementation of a number of programs and projects, the City Operations reduced the amount of greenhouse gases emitted in 2010 by about 10% – an important achievement in the span of only a few years.
75,000
100,000
125,000
150,000
175,000
200,000
200
7
200
8
200
9
201
0
201
1
201
2
2013
201
4
201
5
201
6
201
7
201
8
201
9
202
0
202
1
202
2
Ca
rbo
n E
mis
sio
ns
(to
nn
es
CO
2e
/yr)
City of Raleigh Carbon Emissions Projections (2007 - 2022)
Including Existing Projects Since 2007 Projected Net Emissions with only Existing Projects
2007 Baseline Emissions
10% Reduction Target
20% Reduction Target
Projected Emissions for “Business-as-Usual” Considering City Growth
Early Successes for City Operations
An important initial step was to analyze the initiatives that were put in place since the 2007 base year, established by
the greenhouse gas emissions inventory. The analysis indicated that by 2011 – despite continued City growth and expansion of services – Raleigh’s municipal operations had achieved an impressive 10% reduction…below 2007 levels.
The existing projects already implemented will continue to serve the City and ensure net emissions are at least 15,000
tonnes less than “business-as-usual” for many years to come. However, as growth continues, the percentage
reduction from the 2007 baseline will gradually erode as shown in the chart below. Increased investments in
additional carbon reduction strategies will be needed to hold greenhouse gas emissions at current levels and
maintain the “10% below 2007 levels” reduction target.

75,000
100,000
125,000
150,000
175,000
200,000
200
7
200
8
200
9
201
0
201
1
201
2
201
3
201
4
201
5
201
6
201
7
201
8
201
9
202
0
202
1
202
2
Ca
rbo
n E
mis
sio
ns
(to
nn
es
CO
2e
/yr)
City of Raleigh GHG Projections (2007 - 2022)
With ALL 100+ Future Strategies Added
This reduction was accomplished with relatively low capital expenditures, few impacts on City or department operations or budgets, no increased cost to customers, and no reduction in level of service to customers. Many of these projects were already underway prior to the Greenhouse Gas Emissions Inventory for Municipal Operations being complete.
However, as Raleigh continues to grow at its estimated rate of 2.5% per year, carbon emissions from municipal operations will continue to grow as well in order to provide the same level of services to its new customers. Therefore, the impressive achievements since 2007 will be eroded over time if no actions are taken to achieve further reductions. As shown in the graph, the City Operations carbon emissions would eventually exceed the 2007 levels – in Year 2017 – if no further reductions are achieved.
The Road Ahead The CEAP process identified future additional projects, strategies, and best practices which, if all implemented, could reduce emissions by about another 10%, at an estimated capital cost of over $100 million. If all the actions needed to obtain the additional 10% decrease were implemented at one time (assuming in Year 2013 as shown in this graph), continued City growth would overtake this gain in Year 2020. Just to overcome City growth, additional actions to increase energy efficiencies and reduce carbon emissions annually by 2.5% are needed in the future.
2007 Baseline Emissions
10% Reduction Target
20% Reduction Target
Projected Emissions for “Business-as-Usual” Considering City Growth
By plotting ALL possible strategies, the Team could
clearly see the practical limits of carbon reduction
and develop fiscally responsible targets
and expectations.
The chart below shows a 20% reduction target is
not realistic given the limits of current technology; costs to
achieve this 20% are estimated to be in excess of $100 million.
Projected Net Emissions with ALL 100+ Future Strategies Added
Projected Net Emissions with only Existing Projects

In selecting the most effective strategies, capital cost was only one consideration. The Team defined a total of five criteria of critical importance:
Being financially responsible
Maximize energy and operational efficiency
Realistic and practical to implement
Coordinate well with other projects
Minimize carbon-related emissions
The Team applied a decision analysis framework that incorporated both quantitative and qualitative
evaluations of the potential actions, and prioritized them based on how well they supported the five critical criteria.
Additional judgment must be applied in determining which actions to implement. Consideration of total cost of ownership, and consideration of unpredictable futures that may bring changes in:
Energy availability
Energy costs
Climate variability
Air quality requirements
Economic and financial markets
Integration with City Comprehensive Plan The City of Raleigh’s Comprehensive Plan, “Designing a 21st Century City: The 2030 Comprehensive Plan for the City of Raleigh” highlights the City’s plans for proactive planning for energy security, climate change preparedness, and environmental protection, while considering costs, as highlighted by these policies:
Policy EP 1.1 - Greenhouse Gas Reduction “Promote best practices for reducing greenhouse gas emissions….”
Policy EP 1.3 - Total Cost of Ownership Analysis “Use Total Cost of Ownership, life-cycle analysis, and/or payback analysis on all energy saving proposals.”
Policy EP 1.10 - Alternative Energy Sources “Support the development and application of renewable energy technologies…to provide opportunities for economic and community development, and benefit environmental quality.”
These policies are integrated in the strategies developed through the CEAP process.
Financial Evaluation Framework The Team applied the concept of business case evaluations (BCE) to the CEAP financial evaluation process. A BCE is an evaluation framework most frequently used in private practice but is increasingly
8
being applied by public entities. The BCE process results in recommendations achieved through a comprehensive process that includes input from the staff most knowledgeable of the issues and the affected stakeholders. Conducting BCEs of future CEAP actions provides a transparent framework for making financially justifiable decisions that can be correlated to both energy and carbon reduction.
The process also provided the Team with insights into the tradeoffs between capital replacement projects versus longer life-cycle replacement projects that could potentially be accomplished within departmental operating budgets.
The Role of Renewable Energy Renewable energy comes from natural resources such as sunlight, wind, rain, tides, biomass, and geothermal heat.
Under the American Recovery and Reinvestment Act (ARRA) of 2009, the federal government made its largest commitment in the nation’s history to renewable energy and energy conservation – over $70 billion. A combination of incentives including federal spending and tax credits has created important new opportunities that directly impact both the public and private sectors and also stimulated state governments to adopt more aggressive policies.
The City has an excellent track record of implementing many renewable energy projects that include solar photovoltaic, solar thermal, geothermal,
and methane recovery. The national and state incentives provide the City of Raleigh with:
An opportunity for grants to allow the City to self-implement renewable energy projects
An opportunity to partner with private sector energy companies that could take advantage of Federal and state tax credits, and pass some of those savings on to the City
The opportunity to partner with other public entities such as universities and other non-profit organizations that are also eligible for Federal grants
Numerous new products and technologies in a wide range of renewable energy sectors
The City plans to continue to pursue a diverse array of renewable energy opportunities on municipal facilities and land, potentially including small wind and small hydroelectric projects.
9
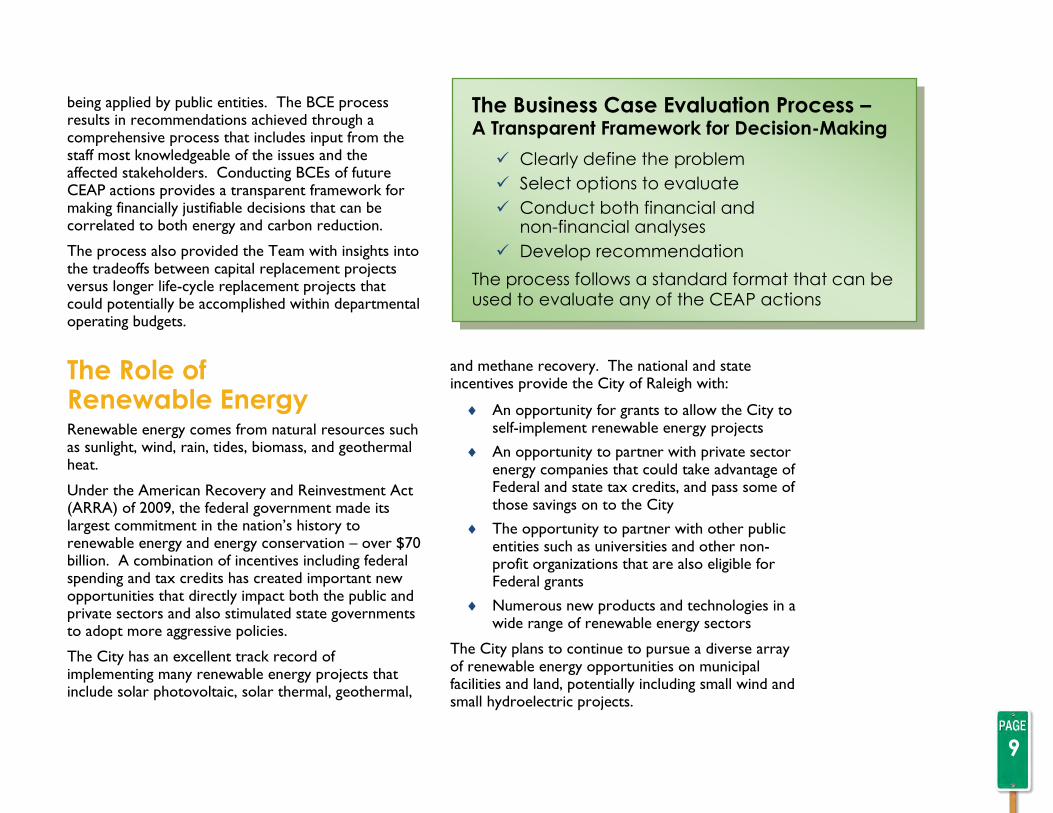
The Business Case Evaluation Process – A Transparent Framework for Decision-Making
Clearly define the problem
Select options to evaluate
Conduct both financial and non-financial analyses
Develop recommendation
The process follows a standard format that can be used to evaluate any of the CEAP actions

Summary of CEAP Findings The City of Raleigh’s operations significantly reduced its carbon emissions between 2007 and 2010, essentially taking advantage of the “low-hanging fruit” to achieve important reductions at relatively low capital costs and operational impacts. Without further action, these gains will be eroded and the City will return to 2007-levels of emissions and then exceed those
levels. Through the CEAP development, the City recognizes that:
A defined process for establishing critical factors (criteria) provides the framework to evaluate a potential project for its contribution toward meeting the criteria
The process is transparent, verifiable, defendable and repeatable, and will provide measurable results
Evaluating the critical factors prior to setting goals or selecting strategies will help avoid committing the City to potentially costly, impractical or even unachievable projects to reduce energy usage and carbon emissions
Setting specific reduction goals will commit the City to spending millions of dollars per year
Building a culture of energy and operational efficiency supported by behavioral changes and selected capital projects will provide measurable, long-term benefits
Implementing this Roadmap will increase the City’s resiliency and ability to respond to unpredictable futures, and set Raleigh on the road to energy independence
The entire CEAP Project Report is available online in Volume 1 of the Technical Documentation
10
Developing the CEAP created a forum to:
Integrate each departments’ activities into a coherent, well-understood approach to moving forward
Consider whether the City should use a values-based system to evaluate all new future City projects and processes so that implementing sustainable solutions is the culture rather than just an initiative
Gain insight into the tradeoffs between capital replacement projects versus longer life-cycle replacement projects that can be done more within departments’ operating budgets
Understand the total cost of change – monetary as well as the impacts to operations and staff behaviors – needed to achieve additional energy efficiency and carbon emissions reductions
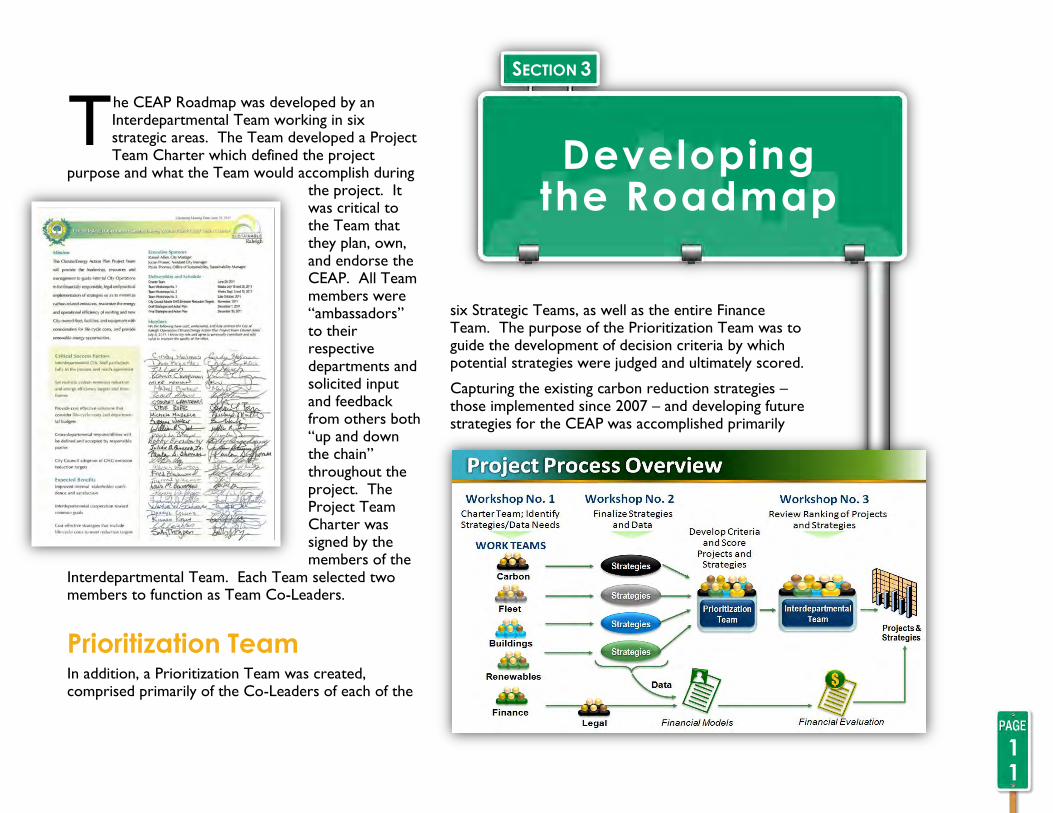
he CEAP Roadmap was developed by an Interdepartmental Team working in six strategic areas. The Team developed a Project Team Charter which defined the project
purpose and what the Team would accomplish during the project. It was critical to the Team that they plan, own, and endorse the CEAP. All Team members were “ambassadors” to their respective departments and solicited input and feedback from others both “up and down the chain” throughout the project. The Project Team Charter was signed by the members of the
Interdepartmental Team. Each Team selected two members to function as Team Co-Leaders.
Prioritization Team In addition, a Prioritization Team was created, comprised primarily of the Co-Leaders of each of the
six Strategic Teams, as well as the entire Finance Team. The purpose of the Prioritization Team was to guide the development of decision criteria by which potential strategies were judged and ultimately scored.
Capturing the existing carbon reduction strategies – those implemented since 2007 – and developing future strategies for the CEAP was accomplished primarily
T
SECTION 3
Developing the Roadmap
11
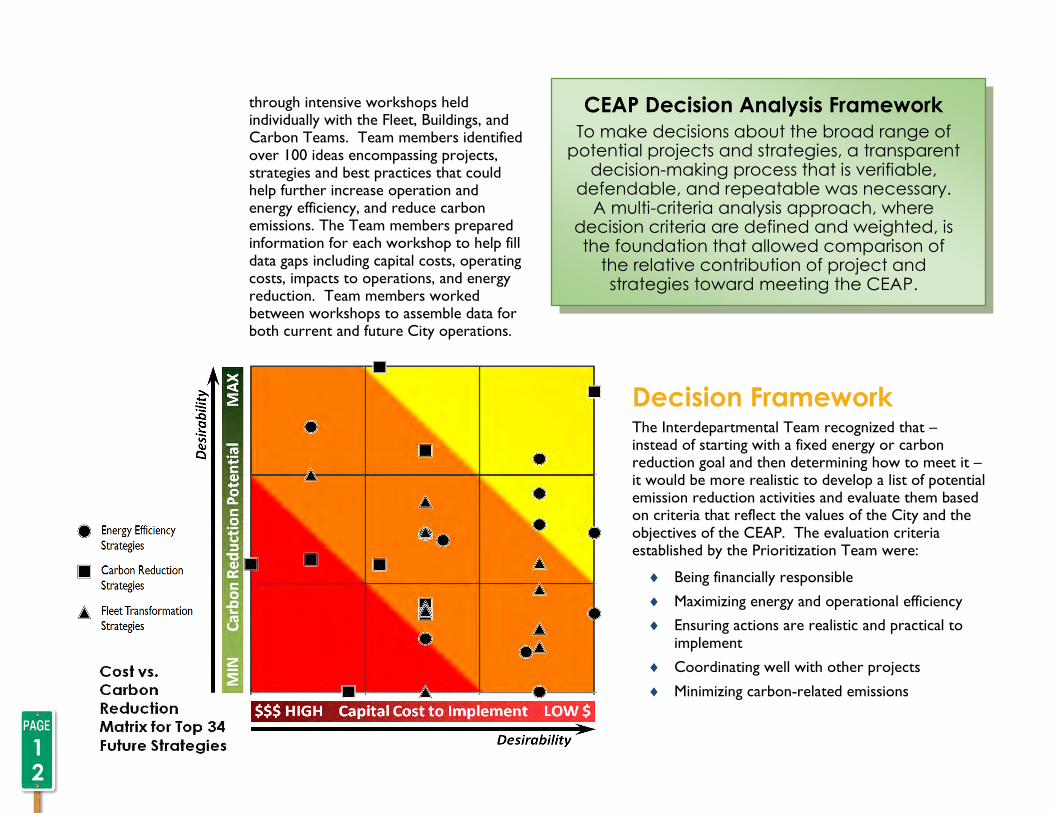
through intensive workshops held individually with the Fleet, Buildings, and Carbon Teams. Team members identified over 100 ideas encompassing projects, strategies and best practices that could help further increase operation and energy efficiency, and reduce carbon emissions. The Team members prepared information for each workshop to help fill data gaps including capital costs, operating costs, impacts to operations, and energy reduction. Team members worked between workshops to assemble data for both current and future City operations.
Decision Framework The Interdepartmental Team recognized that – instead of starting with a fixed energy or carbon reduction goal and then determining how to meet it – it would be more realistic to develop a list of potential emission reduction activities and evaluate them based on criteria that reflect the values of the City and the objectives of the CEAP. The evaluation criteria established by the Prioritization Team were:
Being financially responsible
Maximizing energy and operational efficiency
Ensuring actions are realistic and practical to implement
Coordinating well with other projects
Minimizing carbon-related emissions
CEAP Decision Analysis Framework To make decisions about the broad range of
potential projects and strategies, a transparent decision-making process that is verifiable,
defendable, and repeatable was necessary. A multi-criteria analysis approach, where
decision criteria are defined and weighted, is the foundation that allowed comparison of
the relative contribution of project and strategies toward meeting the CEAP.
12
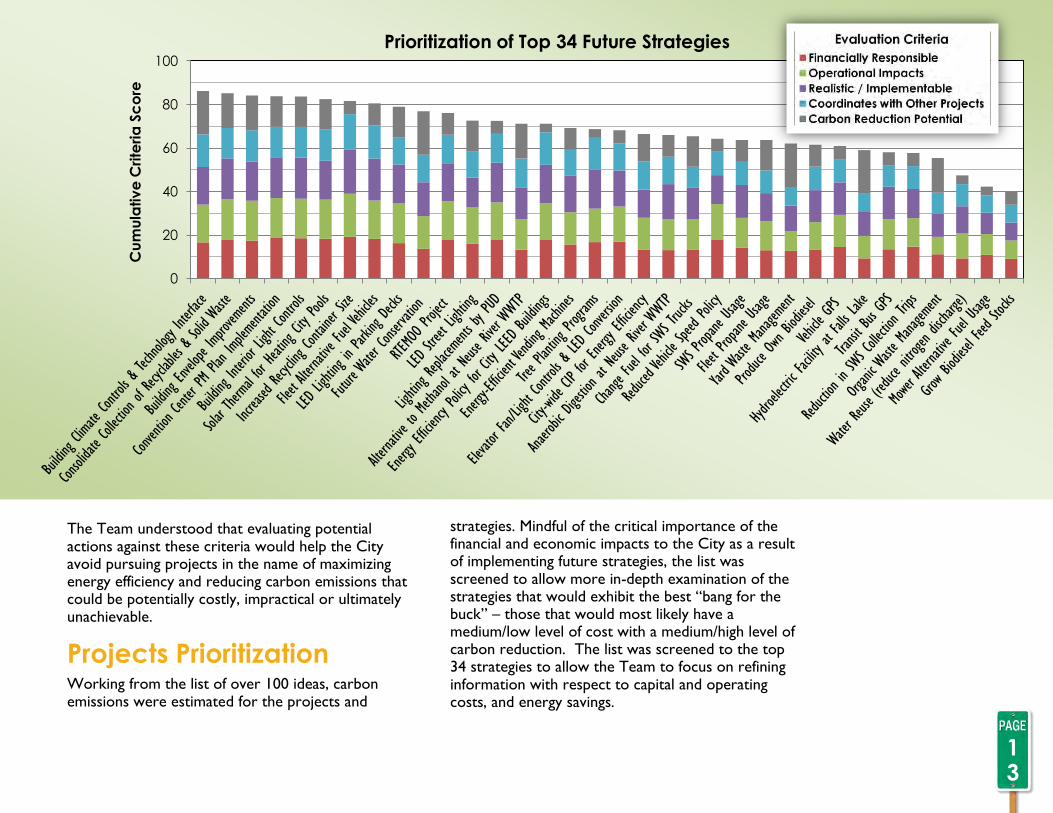
The Team understood that evaluating potential actions against these criteria would help the City avoid pursuing projects in the name of maximizing energy efficiency and reducing carbon emissions that could be potentially costly, impractical or ultimately unachievable.
Projects Prioritization Working from the list of over 100 ideas, carbon emissions were estimated for the projects and
strategies. Mindful of the critical importance of the financial and economic impacts to the City as a result of implementing future strategies, the list was screened to allow more in-depth examination of the strategies that would exhibit the best “bang for the buck” – those that would most likely have a medium/low level of cost with a medium/high level of carbon reduction. The list was screened to the top 34 strategies to allow the Team to focus on refining information with respect to capital and operating costs, and energy savings.
0
20
40
60
80
100
Cu
mu
lativ
e C
rite
ria
Sc
ore
Prioritization of Top 34 Future Strategies
13

The complete Business Case Evaluations described below are available
online in Volume 2 of the Technical Documentation. Additionally, more
information about BCEs can be found in Section 8: Work of the Finance Team.
The Team then applied the decision analysis framework that incorporated both quantitative and qualitative evaluations of the top 34 future strategies and prioritized them using the prioritization criteria. The remaining strategies are still potentially viable and included as part of the CEAP for future consideration.
Business Case Evaluations
In order to provide additional analysis of the screening level cost estimates while balancing capital and operating costs, Business Case Evaluations (BCE) were conducted on two of the highest ranked strategies.
The BCE process follows a standard format that can be applied by the City staff to evaluate any of the CEAP actions. The process can also be applied for capital improvement projects (CIP) prioritization. The potential strategies evaluated are summarized below:
14
Highlights from Business Case Evaluations
Potential Strategy
Utilize the Solid Waste Services Department trucks and personnel to collect recyclables
in addition to outdoor solid waste from the City’s parks
Convert lighting in all City parking decks to
Light-Emitting Diodes (LED)
Problem Statement
A reduction in the number of trips required each week for recyclables collection at the City’s existing park facilities presents an opportunity for
improved efficiency of City resources: staff time, fuel, and truck
maintenance requirements.
LED lighting presents an opportunity for the City to improve operating
efficiency, through increased energy efficiency and longer fixture life-
cycles, and the potential for improved parking deck customer
experience through brighter lighting.
Recommendation Solid Waste Services should collect recyclables and outdoor solid waste from City parks using a “split-body” collection truck to be purchased at
the end of a current collection truck’s life-cycle.
Phasing in of the LED lighting changes provides the greatest savings and lowest net present value total cost. Begin the changes in the highest electricity-
consuming deck to enhance the initial savings potential and start the change out within the next 2
to 3 years as capital funds are available.

he Fleet Team’s work included:
Police Department Vehicles
Fire Department Vehicles
Public Works Department Fleet Vehicle Services – includes all vehicles under the management of the Department including a motor pool fleet that is used by various departments
Public Works Department Transportation Operations – comprised of the City’s bus system services
Solid Waste Services – vehicles used for collection of solid waste and recyclable materials
Parks and Recreation Department Operations and Maintenance – maintenance of the outdoor areas of City parks and ball fields including mowing and collection of solid waste
The scope did not include the Public Utilities Department (PUD) fleet operations as PUD has a separate service area footprint (including the Towns of Garner, Rolesville, Wake Forest, Knightdale, Wendell and Zebulon) and PUD operations were being assessed under a separate organizational study.
Existing Projects The Team began by identifying projects and programs their departments had put in place since the original greenhouse gas inventory of municipal operations was performed in 2007. This allowed the Team to track progress from the established emissions baseline, evaluate what worked well, and share lessons learned. The strategies highlighted in this section represent some of the City’s successes to date and contributed to the impressive 10% reduction in energy use and carbon emissions realized since the 2007 inventory.
T
Team Leaders Travis Brown, Fleet Superintendent, Public Works Mike Kennon, Transportation Operations Manager, Public Works
Team Members Dana Knuckles, Police Bobby Broadaway, Solid Waste Services
Vaughn Lowman, Police Wayne Schindler, Parks and Recreation Darryl Collins, Solid Waste Services Kermit Chapman, Public Utilities Paula Thomas, Office of Sustainability Steve Burr, Office of Sustainability Michele Mallette, Public Utilities Cindy Holmes, Office of Sustainability Lynn Graham, Office of Sustainability
SECTION 4
Work of the Fleet Team
15

Existing Strategies Since 2007 – FLEET Team
Motor Pool Implementation Implemented a motor pool at Municipal Center; City staff can choose a car when needed from those available instead of being assigned an individual vehicle
Fleet Alternative Fuels Fleet alternative fueling program began in 2000; beginning in 2007, increased the variety of biofuels (i.e. B5, B20, E85, and CNG)
Flex Fuel Vehicles Changed pickups and sedans to unleaded/flex fuel vehicles
Right-Sizing the Fleet Reducing large vehicle capacity where not needed, to smaller capacity vehicle (i.e. full-sized pickup trucks to sedan or small truck)
SUV-Pickup Change Out Changed full-size SUVs and pickup trucks to compact SUVs
Vehicle Idling Monitors Initiated a "No Idling" policy; SWS uses controller to monitor vehicle idling and shuts down motor after 3-5 minutes
SWS Route Optimization Implemented route optimization standards to reduce the number of trips and miles traveled for solid waste pick-up and disposal
SWS GPS Usage Installed GPS devices in trucks that record driving behaviors; has reduced instances of speeding, frequent stopping, sudden braking, etc.
SWS Cleaner Fuel Usage Purchased new equipment that uses cleaner fuel and produces less emissions
Police Dept Alternative Fuel Vehicles
Changed some cars to hybrids and increased fuel efficiency of vehicles
Police Dept GPS Usage Using GPS technology for all 911 service calls; system helps ensure the closest officer responds to a call
Police Dept Citizens Reporting
Began allowing citizens to report situations for police response by internet (reduces number of trips officers take to visit citizen's homes)
Fire Dept Alternative Fuel Vehicles
Using more efficient and alternative fuel vehicles for supervisor's cars
Fire Dept Increased B5 Usage
Using more B5 in vehicles and equipment
Extended Maintenance at Parks
Extended maintenance frequency for mowing at parks and road right-of-way from every 2 weeks to every 3 weeks
Naturalization of Parks and Recreation Areas
Parks and Recreation has/is naturalizing areas in parks (i.e. turf reduction to meadow conversion) to reduce the need for mowing
Parks and Recreation Mower Alternative Fuel
Pilot project for mowers to determine the effects of alternative fuel use on exhaust emissions
16
Future Strategies The Team next identified potential future projects, programs, and strategies to achieve further
reductions. In the prioritized ranking of projects, 9 of the top 34 were generated by the Fleet Team.
Rank Top Proposed Future Strategies – FLEET Team
#2 Consolidate Collection of
Recyclables and Outdoor Solid Waste from City Parks
Pick up recyclables and waste from Parks in same trip (Business Case Evaluation conducted for this strategy)
#8 Fleet Alternative Fuel Vehicles Continue to replace fleet with alternative fuel and hybrid vehicles
#21 Change Fuel for SWS Trucks Replace full diesel with hydraulic hybrid trucks
#22 Reduced Vehicle Speed Policy Set maximum speed allowed in City-owned vehicles to reduce fuel usage and increase safety
#23 SWS Propane Usage Use of propane in various equipment within SWS
#24 Fleet Propane Usage Use of propane in various equipment within Fleet
#27 Vehicle GPS Measure and report idle-time, miles driven, speed, etc; with policy to stay below established parameters
#29 Transit Bus GPS Measure and report idle-time, miles driven, speed, etc; with policy to stay below established parameters; City buses are already equipped with GPS equipment
#33 Mower Alternative Fuel Usage Use of natural gas/propane in large capacity mowers
17
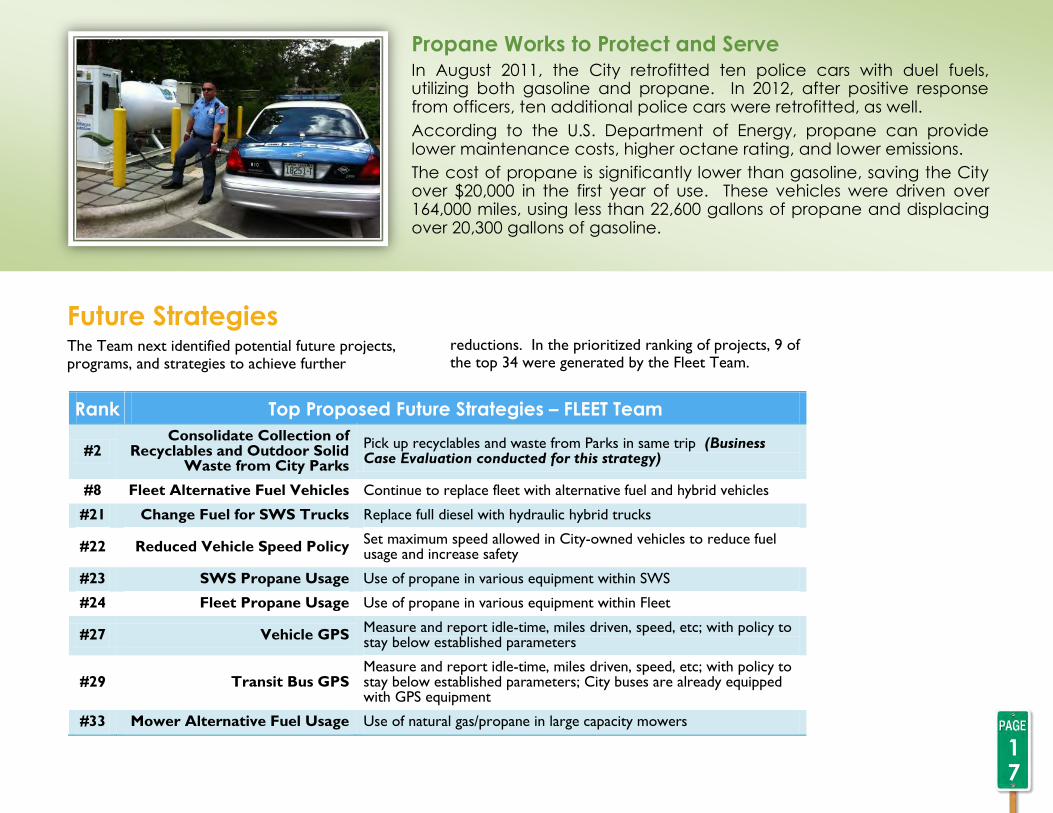
Propane Works to Protect and Serve In August 2011, the City retrofitted ten police cars with duel fuels, utilizing both gasoline and propane. In 2012, after positive response from officers, ten additional police cars were retrofitted, as well.
According to the U.S. Department of Energy, propane can provide lower maintenance costs, higher octane rating, and lower emissions.
The cost of propane is significantly lower than gasoline, saving the City over $20,000 in the first year of use. These vehicles were driven over 164,000 miles, using less than 22,600 gallons of propane and displacing over 20,300 gallons of gasoline.
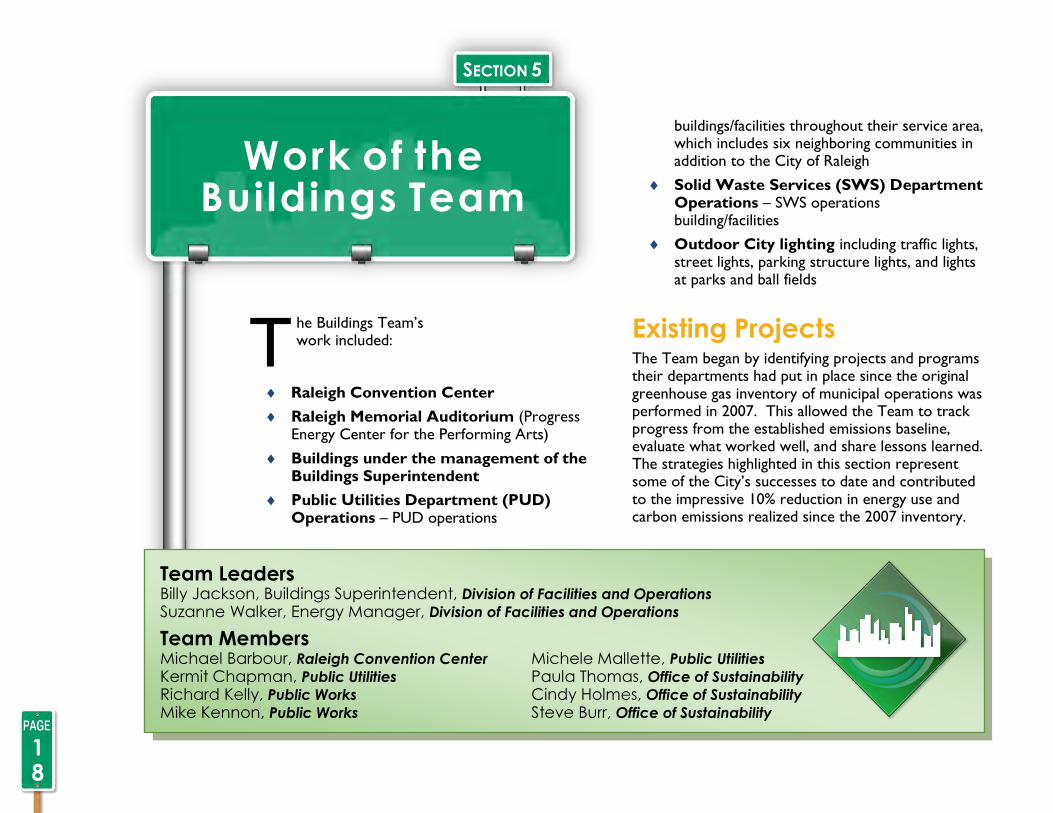
he Buildings Team’s work included:
Raleigh Convention Center
Raleigh Memorial Auditorium (Progress Energy Center for the Performing Arts)
Buildings under the management of the Buildings Superintendent
Public Utilities Department (PUD) Operations – PUD operations
buildings/facilities throughout their service area, which includes six neighboring communities in addition to the City of Raleigh
Solid Waste Services (SWS) Department Operations – SWS operations building/facilities
Outdoor City lighting including traffic lights, street lights, parking structure lights, and lights at parks and ball fields
Existing Projects The Team began by identifying projects and programs their departments had put in place since the original greenhouse gas inventory of municipal operations was performed in 2007. This allowed the Team to track progress from the established emissions baseline, evaluate what worked well, and share lessons learned. The strategies highlighted in this section represent some of the City’s successes to date and contributed to the impressive 10% reduction in energy use and carbon emissions realized since the 2007 inventory.
T
18
Team Leaders Billy Jackson, Buildings Superintendent, Division of Facilities and Operations Suzanne Walker, Energy Manager, Division of Facilities and Operations
Team Members Michael Barbour, Raleigh Convention Center Michele Mallette, Public Utilities Kermit Chapman, Public Utilities Paula Thomas, Office of Sustainability Richard Kelly, Public Works Cindy Holmes, Office of Sustainability Mike Kennon, Public Works Steve Burr, Office of Sustainability
SECTION 5
Work of the Buildings Team
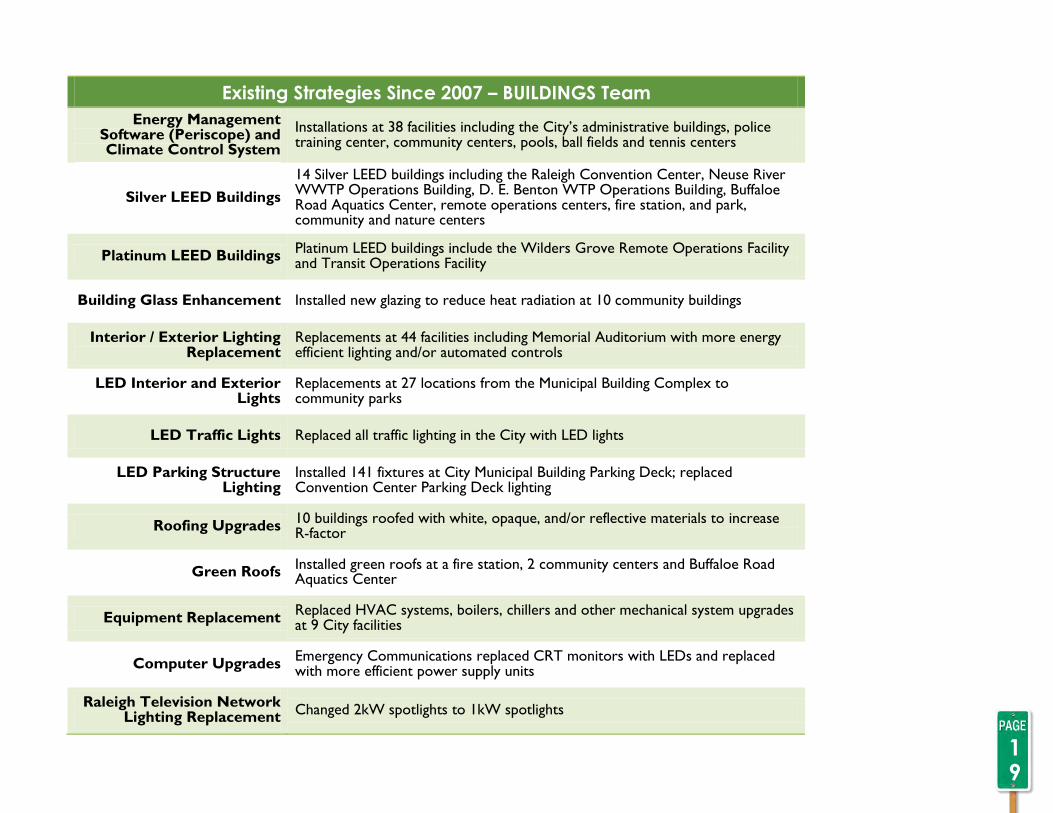
Existing Strategies Since 2007 – BUILDINGS Team
Energy Management Software (Periscope) and Climate Control System
Installations at 38 facilities including the City’s administrative buildings, police training center, community centers, pools, ball fields and tennis centers
Silver LEED Buildings
14 Silver LEED buildings including the Raleigh Convention Center, Neuse River WWTP Operations Building, D. E. Benton WTP Operations Building, Buffaloe Road Aquatics Center, remote operations centers, fire station, and park, community and nature centers
Platinum LEED Buildings Platinum LEED buildings include the Wilders Grove Remote Operations Facility and Transit Operations Facility
Building Glass Enhancement Installed new glazing to reduce heat radiation at 10 community buildings
Interior / Exterior Lighting Replacement
Replacements at 44 facilities including Memorial Auditorium with more energy efficient lighting and/or automated controls
LED Interior and Exterior Lights
Replacements at 27 locations from the Municipal Building Complex to community parks
LED Traffic Lights Replaced all traffic lighting in the City with LED lights
LED Parking Structure Lighting
Installed 141 fixtures at City Municipal Building Parking Deck; replaced Convention Center Parking Deck lighting
Roofing Upgrades 10 buildings roofed with white, opaque, and/or reflective materials to increase R-factor
Green Roofs Installed green roofs at a fire station, 2 community centers and Buffaloe Road Aquatics Center
Equipment Replacement Replaced HVAC systems, boilers, chillers and other mechanical system upgrades at 9 City facilities
Computer Upgrades Emergency Communications replaced CRT monitors with LEDs and replaced with more efficient power supply units
Raleigh Television Network Lighting Replacement
Changed 2kW spotlights to 1kW spotlights
19
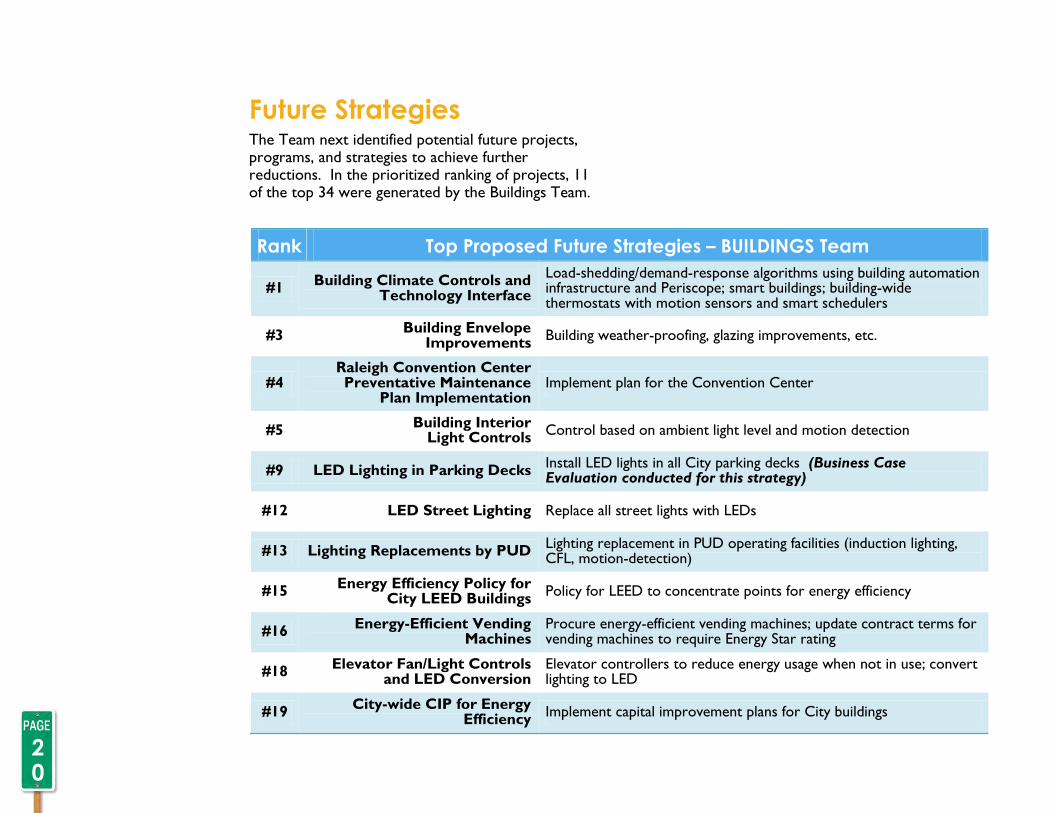
Future Strategies The Team next identified potential future projects, programs, and strategies to achieve further reductions. In the prioritized ranking of projects, 11 of the top 34 were generated by the Buildings Team.
Rank Top Proposed Future Strategies – BUILDINGS Team
#1 Building Climate Controls and
Technology Interface
Load-shedding/demand-response algorithms using building automation infrastructure and Periscope; smart buildings; building-wide thermostats with motion sensors and smart schedulers
#3 Building Envelope
Improvements Building weather-proofing, glazing improvements, etc.
#4 Raleigh Convention Center Preventative Maintenance
Plan Implementation Implement plan for the Convention Center
#5 Building Interior
Light Controls Control based on ambient light level and motion detection
#9 LED Lighting in Parking Decks Install LED lights in all City parking decks (Business Case Evaluation conducted for this strategy)
#12 LED Street Lighting Replace all street lights with LEDs
#13 Lighting Replacements by PUD Lighting replacement in PUD operating facilities (induction lighting, CFL, motion-detection)
#15 Energy Efficiency Policy for
City LEED Buildings Policy for LEED to concentrate points for energy efficiency
#16 Energy-Efficient Vending
Machines Procure energy-efficient vending machines; update contract terms for vending machines to require Energy Star rating
#18 Elevator Fan/Light Controls
and LED Conversion Elevator controllers to reduce energy usage when not in use; convert lighting to LED
#19 City-wide CIP for Energy
Efficiency Implement capital improvement plans for City buildings
20
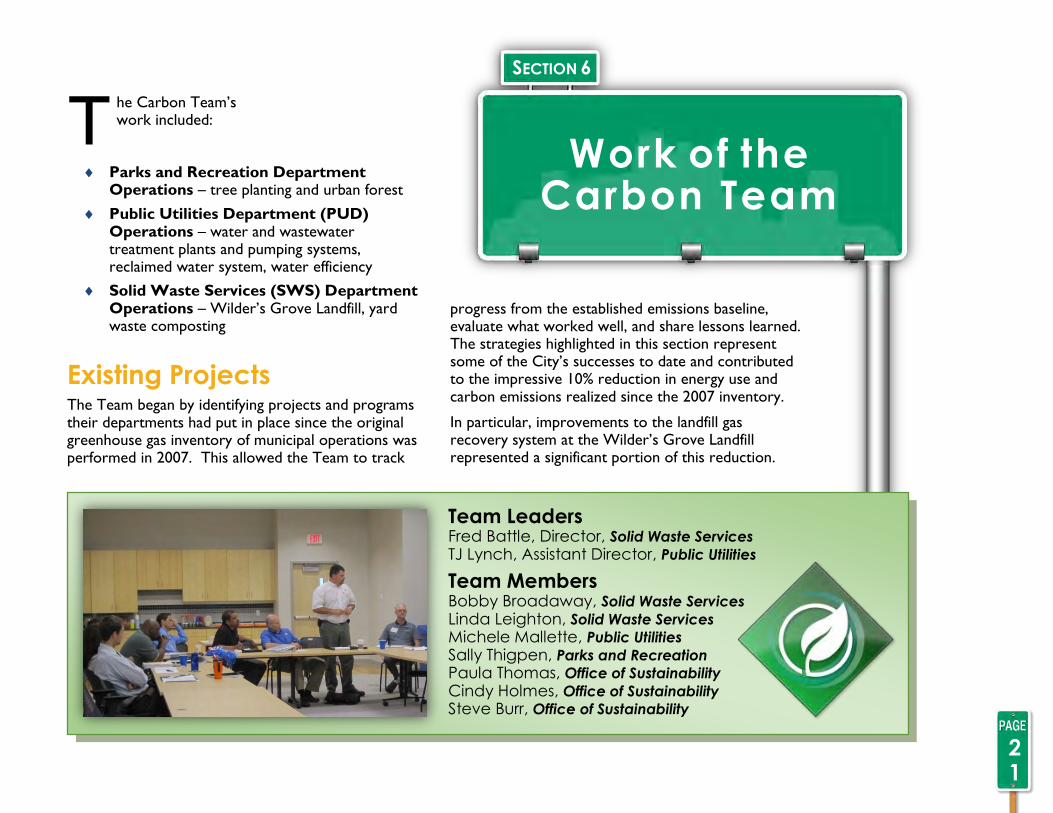
he Carbon Team’s work included:
Parks and Recreation Department Operations – tree planting and urban forest
Public Utilities Department (PUD) Operations – water and wastewater treatment plants and pumping systems, reclaimed water system, water efficiency
Solid Waste Services (SWS) Department Operations – Wilder’s Grove Landfill, yard waste composting
Existing Projects The Team began by identifying projects and programs their departments had put in place since the original greenhouse gas inventory of municipal operations was performed in 2007. This allowed the Team to track
progress from the established emissions baseline, evaluate what worked well, and share lessons learned. The strategies highlighted in this section represent some of the City’s successes to date and contributed to the impressive 10% reduction in energy use and carbon emissions realized since the 2007 inventory.
In particular, improvements to the landfill gas recovery system at the Wilder’s Grove Landfill represented a significant portion of this reduction.
T
Team Leaders Fred Battle, Director, Solid Waste Services TJ Lynch, Assistant Director, Public Utilities
Team Members Bobby Broadaway, Solid Waste Services Linda Leighton, Solid Waste Services
Michele Mallette, Public Utilities Sally Thigpen, Parks and Recreation Paula Thomas, Office of Sustainability Cindy Holmes, Office of Sustainability
Steve Burr, Office of Sustainability
SECTION 2
Report Findings
SECTION 6
Work of the Carbon Team
21

Existing Strategies Since 2007 – CARBON Team
Landfill Gas Recovery Landfill Gas Recovery System Improvements at the Wilder's Grove Landfill
SWS Split Body Trucks Reduced the number of trips to Central Business District by using split body trucks to collect solid waste and recycling at same time
Pump Station Visitation Reduction
Reduced the number of visits to wastewater pump stations through improved reliability of telemetrics at the stations which remotely report to Operations
Reclaimed Water at Neuse River WWTP
Using reuse water in toilets at the Neuse River WWTP and for odor control scrubbers at wastewater pump stations
Reclaimed Water Reduced wastewater effluent nitrogen discharged
Water Efficiency Reduced potable water treatment and pumping costs; reduced wastewater flows and effluent nitrogen discharged
Streetscapes Project Public Works planted 5,000 trees along Fayetteville Rd as part of Streetscapes Project
Native Seeds Parks and Recreation is growing local sources of seeds for park properties, including trees and landscape plants; reduced vehicle fuel use
Parks and Recreation Greenhouse
Constructed a new energy efficient Parks and Recreation greenhouse; reductions in energy usage for cooling and heating the facility
22
Wilders Grove Landfill Yields Green Energy & Revenues
The City of Raleigh captures the methane gas produced by waste decaying in the landfill. This gas is then used to produce steam to power manufacturing operations at a local industry, Ajinomoto USA. The City receives monthly royalties for the use of the landfill gas and this potentially explosive gas is also removed from its property.
Through the use of methane recovery Wilders Grove Landfill has enabled the City to reduce its carbon footprint by capturing and selling over 176 billion BTUs annually, which earns approximately $90,000 per year.
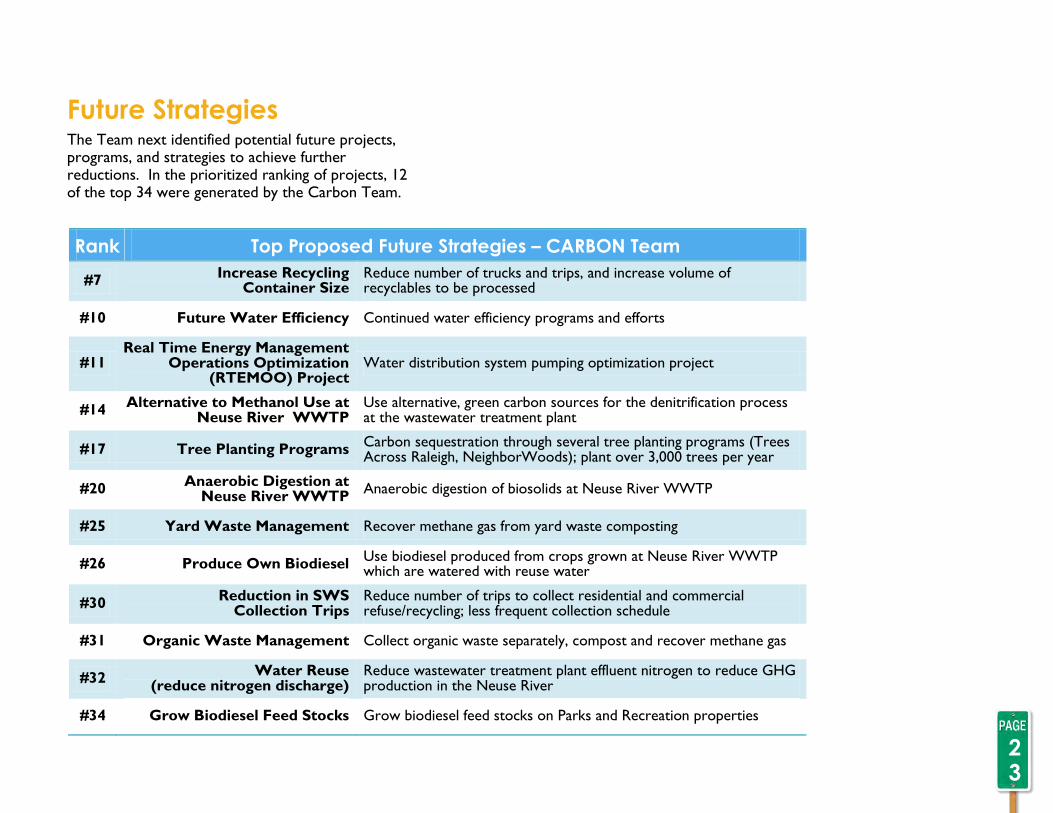
Future Strategies The Team next identified potential future projects, programs, and strategies to achieve further reductions. In the prioritized ranking of projects, 12 of the top 34 were generated by the Carbon Team.
Rank Top Proposed Future Strategies – CARBON Team
#7 Increase Recycling
Container Size Reduce number of trucks and trips, and increase volume of recyclables to be processed
#10 Future Water Efficiency Continued water efficiency programs and efforts
#11 Real Time Energy Management
Operations Optimization (RTEMOO) Project
Water distribution system pumping optimization project
#14 Alternative to Methanol Use at
Neuse River WWTP Use alternative, green carbon sources for the denitrification process at the wastewater treatment plant
#17 Tree Planting Programs Carbon sequestration through several tree planting programs (Trees Across Raleigh, NeighborWoods); plant over 3,000 trees per year
#20 Anaerobic Digestion at
Neuse River WWTP Anaerobic digestion of biosolids at Neuse River WWTP
#25 Yard Waste Management Recover methane gas from yard waste composting
#26 Produce Own Biodiesel Use biodiesel produced from crops grown at Neuse River WWTP which are watered with reuse water
#30 Reduction in SWS
Collection Trips Reduce number of trips to collect residential and commercial refuse/recycling; less frequent collection schedule
#31 Organic Waste Management Collect organic waste separately, compost and recover methane gas
#32 Water Reuse
(reduce nitrogen discharge) Reduce wastewater treatment plant effluent nitrogen to reduce GHG production in the Neuse River
#34 Grow Biodiesel Feed Stocks Grow biodiesel feed stocks on Parks and Recreation properties
12
23
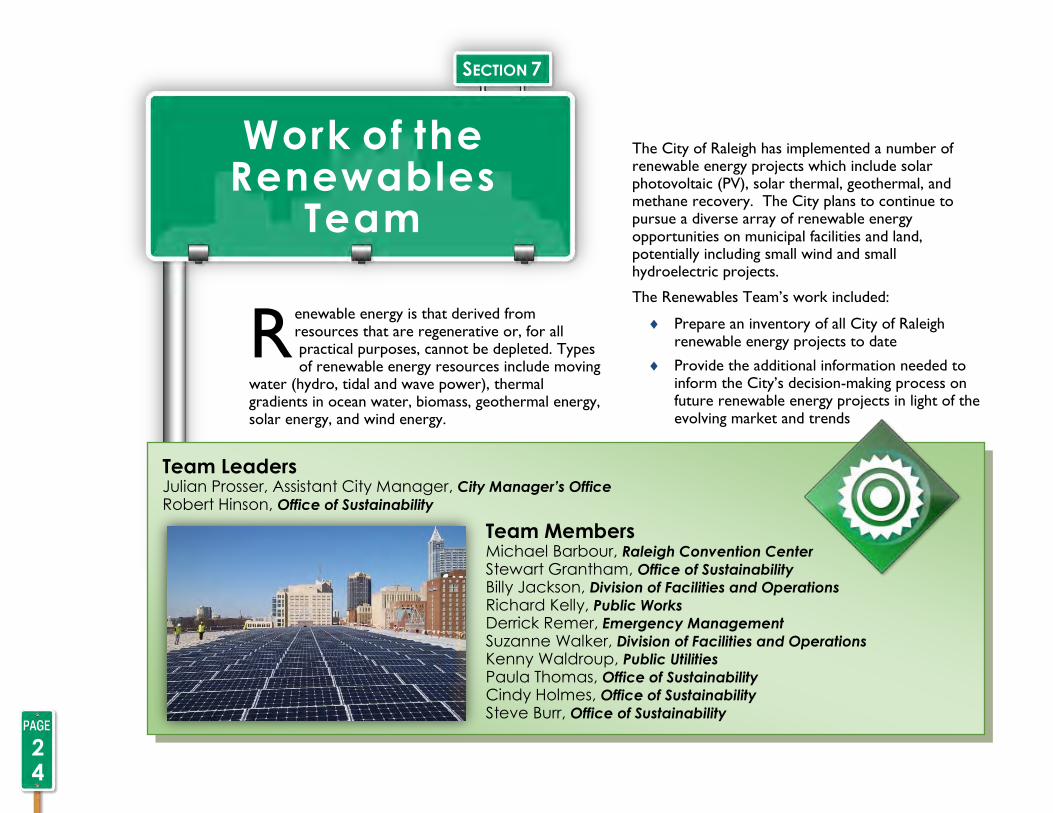
enewable energy is that derived from resources that are regenerative or, for all practical purposes, cannot be depleted. Types of renewable energy resources include moving
water (hydro, tidal and wave power), thermal gradients in ocean water, biomass, geothermal energy, solar energy, and wind energy.
The City of Raleigh has implemented a number of renewable energy projects which include solar photovoltaic (PV), solar thermal, geothermal, and methane recovery. The City plans to continue to pursue a diverse array of renewable energy opportunities on municipal facilities and land, potentially including small wind and small hydroelectric projects.
The Renewables Team’s work included:
Prepare an inventory of all City of Raleigh renewable energy projects to date
Provide the additional information needed to inform the City’s decision-making process on future renewable energy projects in light of the evolving market and trends
R
Team Leaders Julian Prosser, Assistant City Manager, City Manager’s Office Robert Hinson, Office of Sustainability
Team Members Michael Barbour, Raleigh Convention Center Stewart Grantham, Office of Sustainability
Billy Jackson, Division of Facilities and Operations Richard Kelly, Public Works
Derrick Remer, Emergency Management
Suzanne Walker, Division of Facilities and Operations Kenny Waldroup, Public Utilities
Paula Thomas, Office of Sustainability
Cindy Holmes, Office of Sustainability
Steve Burr, Office of Sustainability
SECTION 7
Findings
24
SECTION 7
Work of the Renewables
Team
Recent National Emphasis Focus on providing energy independence, assurance, and clean energy at a national level dates to the oil crisis of the early 1970s. However, this focus has been directed toward specific industries or specific regulatory guidelines (such as improving automotive fuel mileage) and less toward aggressive and widespread financial incentives. Climate change initiatives began to take hold in some environmental and political circles in the mid-2000s. Many new initiatives had been adopted across the country while many more were ripe for implementation.
At more than $70 billion dollars in spending and tax credits, the National American Recovery and Reinvestment Act (ARRA) of early 2009 was the largest federal commitment in the nation’s history for renewable energy and energy conservation. An initial total of $3.2 billion was used to invest in the Energy Efficiency and Conservation Block Grant (EECBG) program. Additionally, Federal tax credits, and in some cases grants, were provided to the private sector to offset the cost differential between the renewable energy systems and traditional energy systems. The Department of Energy and the Environmental Protection Agency also teamed to produce an updated national energy efficiency plan titled “Vision 2025: A Framework for Change” which was intended to provide states with energy efficiency and greenhouse gas reduction guidelines.
The combination of financial spending in the public sector and tax credits in the private sector created a wave of new activity and new renewable energy companies. This wave directly impacted both the
public and private sectors from the Federal level, but also stimulated state governments to adopt more aggressive policies as well. The driver at all levels was to make the use of renewable energy more common and better understood, and in turn make it more affordable and more in demand.
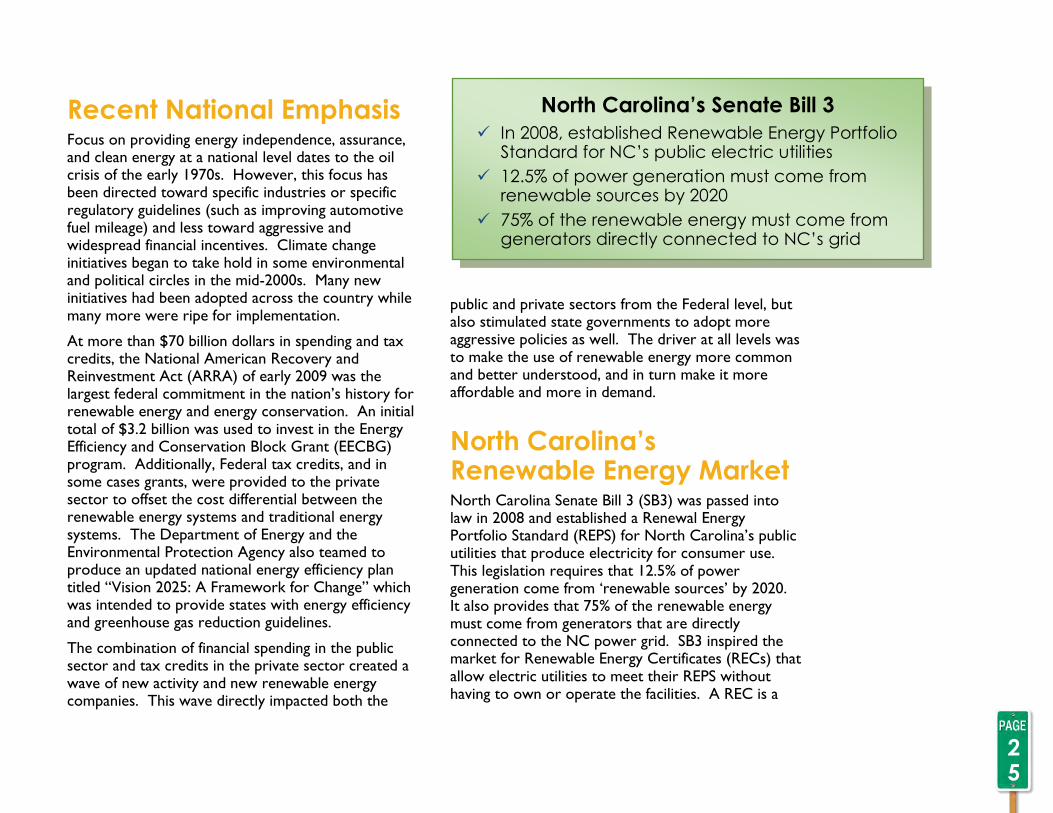
North Carolina’s Renewable Energy Market North Carolina Senate Bill 3 (SB3) was passed into law in 2008 and established a Renewal Energy Portfolio Standard (REPS) for North Carolina’s public utilities that produce electricity for consumer use. This legislation requires that 12.5% of power generation come from ‘renewable sources’ by 2020. It also provides that 75% of the renewable energy must come from generators that are directly connected to the NC power grid. SB3 inspired the market for Renewable Energy Certificates (RECs) that allow electric utilities to meet their REPS without having to own or operate the facilities. A REC is a
North Carolina’s Senate Bill 3
In 2008, established Renewable Energy Portfolio Standard for NC’s public electric utilities
12.5% of power generation must come from renewable sources by 2020
75% of the renewable energy must come from generators directly connected to NC’s grid
25
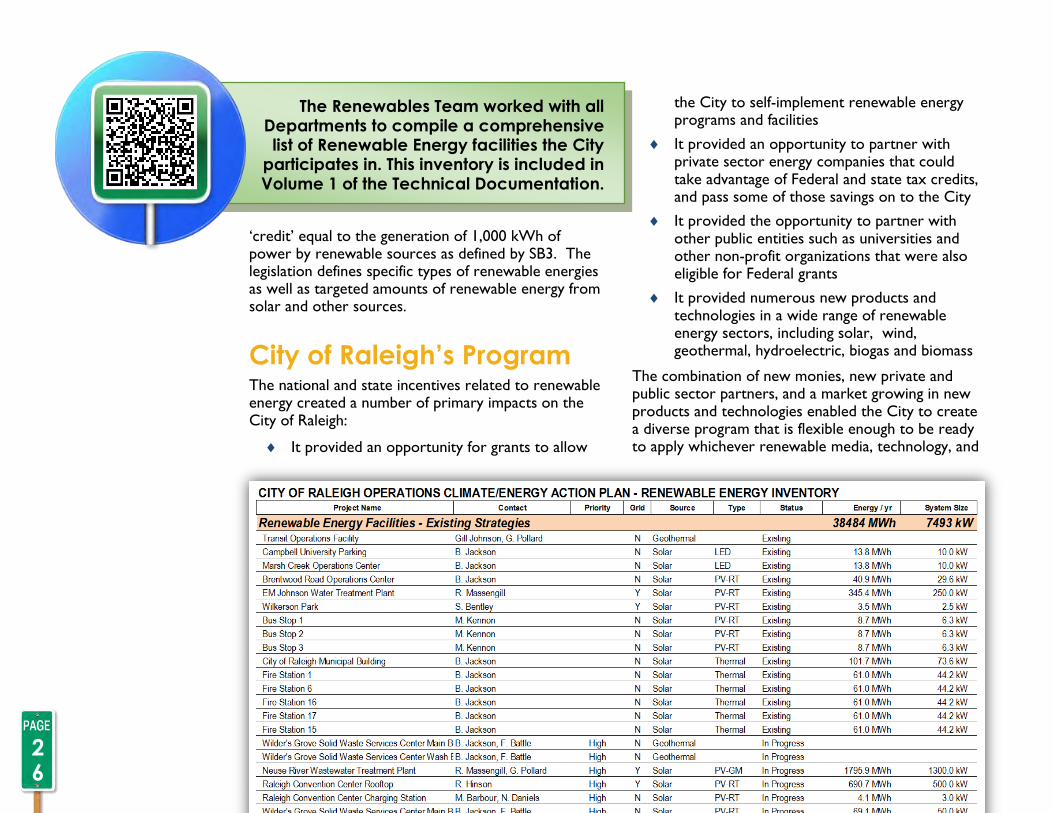
The Renewables Team worked with all Departments to compile a comprehensive list of Renewable Energy facilities the City
participates in. This inventory is included in Volume 1 of the Technical Documentation.
‘credit’ equal to the generation of 1,000 kWh of power by renewable sources as defined by SB3. The legislation defines specific types of renewable energies as well as targeted amounts of renewable energy from solar and other sources.
City of Raleigh’s Program The national and state incentives related to renewable energy created a number of primary impacts on the City of Raleigh:
It provided an opportunity for grants to allow
the City to self-implement renewable energy programs and facilities
It provided an opportunity to partner with private sector energy companies that could take advantage of Federal and state tax credits, and pass some of those savings on to the City
It provided the opportunity to partner with other public entities such as universities and other non-profit organizations that were also eligible for Federal grants
It provided numerous new products and technologies in a wide range of renewable energy sectors, including solar, wind, geothermal, hydroelectric, biogas and biomass
The combination of new monies, new private and public sector partners, and a market growing in new products and technologies enabled the City to create a diverse program that is flexible enough to be ready to apply whichever renewable media, technology, and
26
delivery approaches emerge as the most advantageous for Raleigh.
An Evolving Renewable Energy Market Perhaps the singular goal of the entire 2008-2009 renewable energy incentive programs was to provide seed money broadly and let the market and innovation decide the best options for the long term. Like most of the energy sector, there still remains much uncertainty as to the evolution and future of the renewable market. Under these continuing circumstances, it is recommended that the City monitor the following major issues:
Federal support has increased the demand for many renewable energy products, and in turn has reduced the unit cost of many products – the cost of solar panels is an example. The impact of reduced Federal stimulus on market prices should be monitored.
Federal grant monies have encouraged many units of state and local government to participate in a wide variety of renewable energy programs, products, and delivery models with minimal short-term financial risks.
There still remains much uncertainty about the long-term risks associated with partnering with private sector firms who were formed to take advantage of the Federal and state incentive programs. This is especially true for renewable energy systems that have been promised with
performance lives of 20 to 30 years. The City should monitor and develop mitigation strategies.
Renewable energy technologies and products continue to evolve and generally lack the long-term performance history possessed by more common construction products. The City should make provisions for determining the risk and rewards associated with new renewable energy products when doing business case analyses against more traditional products.
In a future scenario where Federal support may change, it will become increasingly important for the City to have a rigorous system for tracking performance and developing on-going performance metrics.
Existing Projects The Team began by identifying projects and programs their departments had put in place since the original greenhouse gas inventory of municipal operations was performed in 2007. This allowed the Team to track
Future Key Renewable Energy Issues
Impact of Federal actions on market prices
Increased financial concerns as Federal grant programs evolve
Public-Private partnership opportunities and incentives
Long-term performance history and operational reliability of cutting-edge renewable technologies
27

progress from the established emissions baseline, evaluate what worked well, and share lessons learned. The strategies highlighted in this section represent some of the City’s successes to date and contributed to the impressive 10% reduction in energy use and carbon emissions realized since the 2007 inventory.
Future Strategies
The Team next identified potential future projects, programs, and strategies to achieve further reductions. In the prioritized ranking of projects, 2 of the top 34 were generated by the Renewables Team.
Existing Strategies Since 2007 – RENEWABLES Team
Solar PV at Bus Stops Installed solar PV at 3 bus stops where energy produced is used to power lights, reader boards, etc.
Solar PV at Wilder's Grove Remote Operations Facility
50-kW solar PV array at Wilder’s Grove Remote Operations Facility administration building and 25-kW array at vehicle wash building
Solar PV at E.M. Johnson Water Treatment Plant and
Neuse River WWTP
250-kW solar PV array at E.M. Johnson Water Treatment Plant and 1,300-kW PV array at Neuse River WWTP
Solar PV Downtown Solar PV at Raleigh Convention Center and Electric Vehicle Charging Station
Solar LED Installed solar LED lighting at parking area and operations center
Solar Thermal Installed solar thermal for hot water at 5 fire stations and City Municipal Building
Geothermal Heat Transit Operations Facility and Wilder’s Grove Remote Operations Facility
28
Getting a Charge Out of Solar Power
The local electric utility and the City of Raleigh have partnered on a two-year pilot project to develop advancements in the powering of electric vehicle. Two solar-powered electric vehicle charging stations are located at a City-owned parking lot behind the Raleigh Convention Center.
In addition to collecting research data, the trial provides citizens and visitors the opportunity to observe both solar power and plug-in electric vehicles up close. The City has also installed numerous non-solar-powered charging stations throughout Raleigh that are available for public use.
The project includes two charging stations in Raleigh connected to a solar photovoltaic (PV) array and battery system. This joint initiative has several goals:
* Testing the ability to charge plug-in vehicles using electricity generated by the sun and stored in an on-site battery;
* Analyzing the effect on the electric grid from a solar-powered charging station;
* Evaluating electric vehicle battery performance;
* Comparing the side-by-side performance of two solar panel manufacturers; and
* Monitoring the influences of weather on solar power production.
PowerWorks Electric designed and installed the system. Advanced Energy assisted with the design and will manage ongoing data acquisition and evaluation. GE Industrial Solutions provided the charging equipment.
In addition to collecting data, the trial provides citizens and visitors the opportunity to observe both solar power and plug-in electric vehicles up close.
One of the two charging station is dedicated to the local electric utility fleet at all times.
The City has also installed numerous non-solar-powered charging stations throughout Raleigh that are available for public use.
29
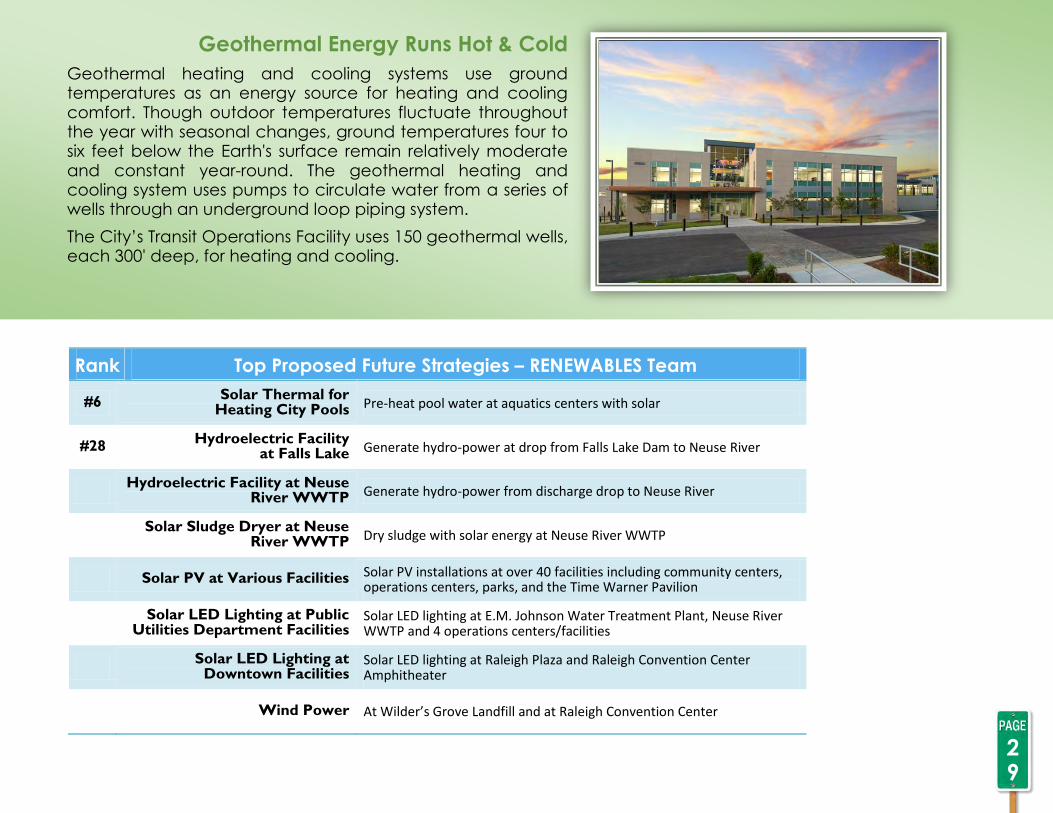
Rank Top Proposed Future Strategies – RENEWABLES Team
#6 Solar Thermal for
Heating City Pools Pre-heat pool water at aquatics centers with solar
#28 Hydroelectric Facility
at Falls Lake Generate hydro-power at drop from Falls Lake Dam to Neuse River
Hydroelectric Facility at Neuse
River WWTP Generate hydro-power from discharge drop to Neuse River
Solar Sludge Dryer at Neuse
River WWTP Dry sludge with solar energy at Neuse River WWTP
Solar PV at Various Facilities Solar PV installations at over 40 facilities including community centers, operations centers, parks, and the Time Warner Pavilion
Solar LED Lighting at Public
Utilities Department Facilities Solar LED lighting at E.M. Johnson Water Treatment Plant, Neuse River WWTP and 4 operations centers/facilities
Solar LED Lighting at
Downtown Facilities Solar LED lighting at Raleigh Plaza and Raleigh Convention Center Amphitheater
Wind Power At Wilder’s Grove Landfill and at Raleigh Convention Center
Geothermal Energy Runs Hot & Cold
Geothermal heating and cooling systems use ground temperatures as an energy source for heating and cooling comfort. Though outdoor temperatures fluctuate throughout the year with seasonal changes, ground temperatures four to six feet below the Earth's surface remain relatively moderate and constant year-round. The geothermal heating and cooling system uses pumps to circulate water from a series of wells through an underground loop piping system.
The City’s Transit Operations Facility uses 150 geothermal wells, each 300' deep, for heating and cooling.
he goals of the Finance Team were to:
Develop financial metrics to be applied to evaluate the financial implications of the strategies at a planning level
Work with the Interdepartmental Team to develop base financial data for strategies financial evaluation
Identify viable financing techniques
Total Cost of Ownership Total cost of ownership was discussed as a basis for the financial evaluation of potential projects and strategies. Components of “total cost” include:
Capital cost (first cost)
Operations and maintenance
Savings
Return on investment
Payback period
Life-cycle costs (net present worth)
Benefit/cost
However, as the financial information was being gathered by the Team, they recognized that not all of the data needed to evaluate the total cost of ownership for the potential activities could be obtained without extensive additional work. One approach discussed with the Team was to proceed with the analyses utilizing industry standard costs
T
Team Leaders Stephen Bentley, Capital Budget Manager, Budget and Management Services Louis Buonpane, Senior Enterprise Programs Manager, City Manager’s Office
Team Members Fred Blackwood, Finance
Julian Prosser, City Manager’s Office Allyson Wharton, Finance Tyrone Williams, Finance Paula Thomas, Office of Sustainability Cindy Holmes, Office of Sustainability Steve Burr, Office of Sustainability
SECTION 7
Findings
30
SECTION 8
Work of the Finance Team
The City’s First “Sustainable
Procurement Policy” was adopted by the City
of Raleigh in November 2011
which could vary significantly from costs in the Triangle region. In order to make the most appropriate recommendations about the CEAP potential actions, the Team agreed that using cost information that was specific to the City of Raleigh Operations would be most valuable.
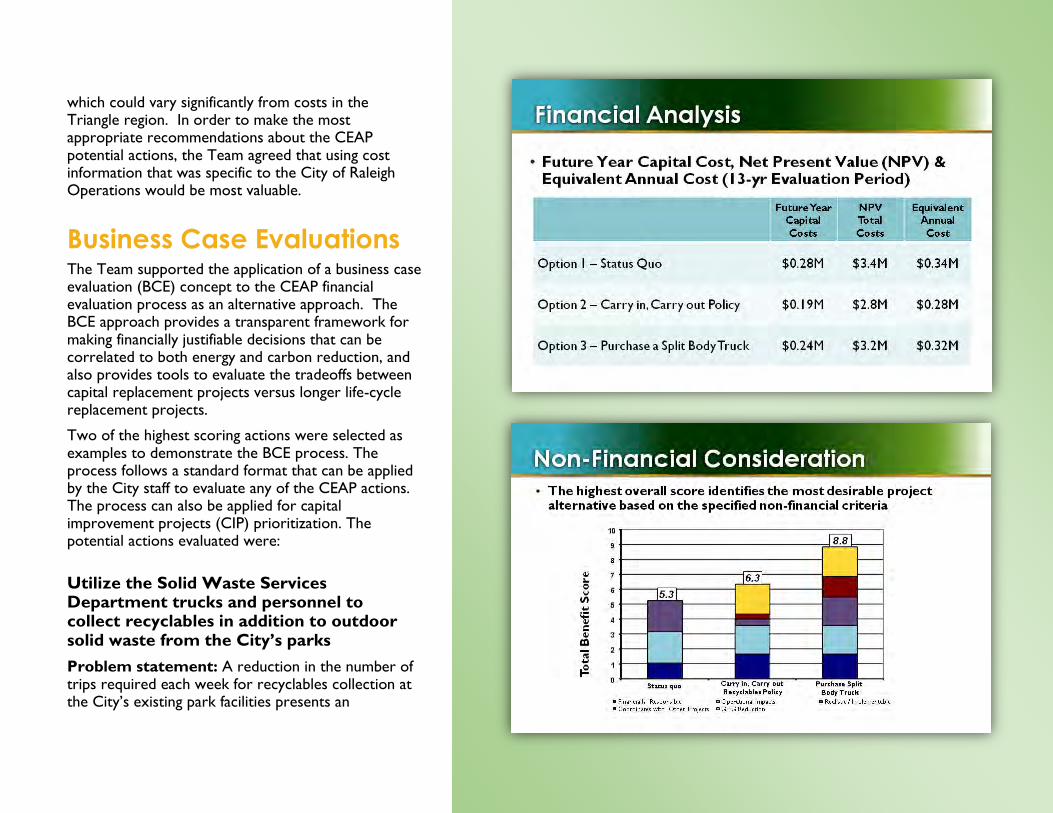
Business Case Evaluations The Team supported the application of a business case evaluation (BCE) concept to the CEAP financial evaluation process as an alternative approach. The BCE approach provides a transparent framework for making financially justifiable decisions that can be correlated to both energy and carbon reduction, and also provides tools to evaluate the tradeoffs between capital replacement projects versus longer life-cycle replacement projects.
Two of the highest scoring actions were selected as examples to demonstrate the BCE process. The process follows a standard format that can be applied by the City staff to evaluate any of the CEAP actions. The process can also be applied for capital improvement projects (CIP) prioritization. The potential actions evaluated were:
Utilize the Solid Waste Services Department trucks and personnel to collect recyclables in addition to outdoor solid waste from the City’s parks
Problem statement: A reduction in the number of trips required each week for recyclables collection at the City’s existing park facilities presents an
opportunity for improved efficiency with City resources, including staff time, fuel, and truck maintenance requirements.
Recommendation: Purchase a “split-body” collection truck at the end of a current truck’s life-cycle
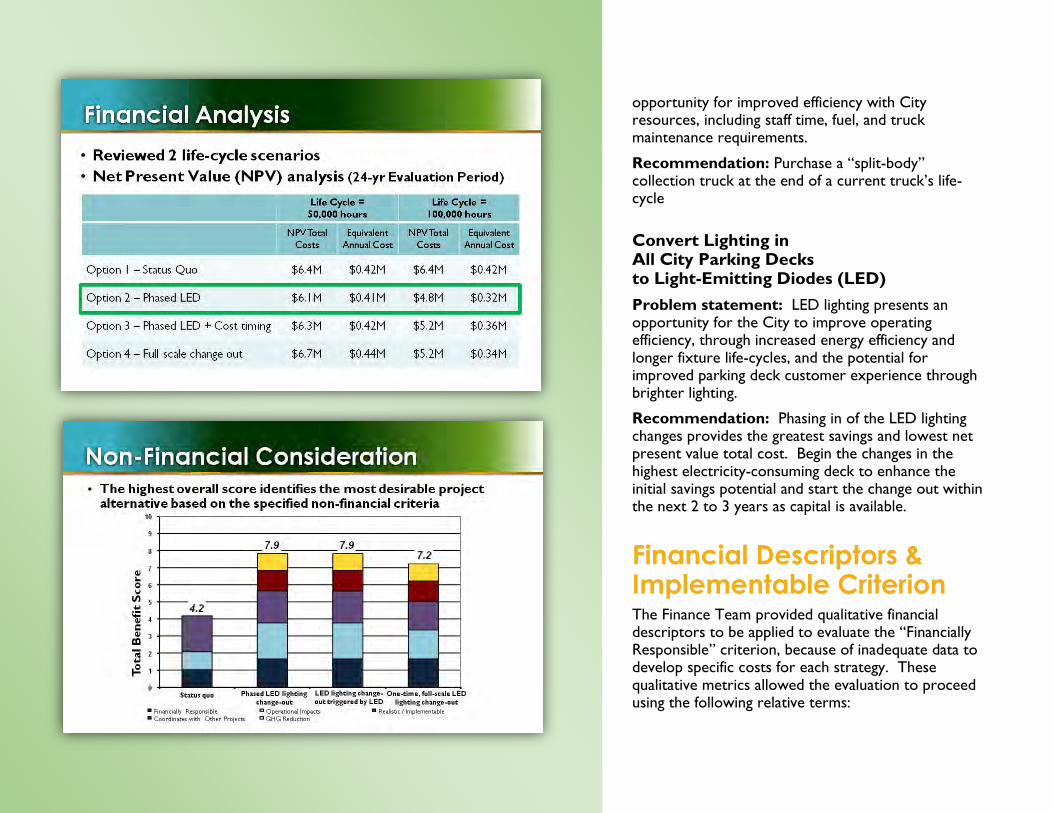
Convert Lighting in All City Parking Decks to Light-Emitting Diodes (LED)
Problem statement: LED lighting presents an opportunity for the City to improve operating efficiency, through increased energy efficiency and longer fixture life-cycles, and the potential for improved parking deck customer experience through brighter lighting.
Recommendation: Phasing in of the LED lighting changes provides the greatest savings and lowest net present value total cost. Begin the changes in the highest electricity-consuming deck to enhance the initial savings potential and start the change out within the next 2 to 3 years as capital is available.
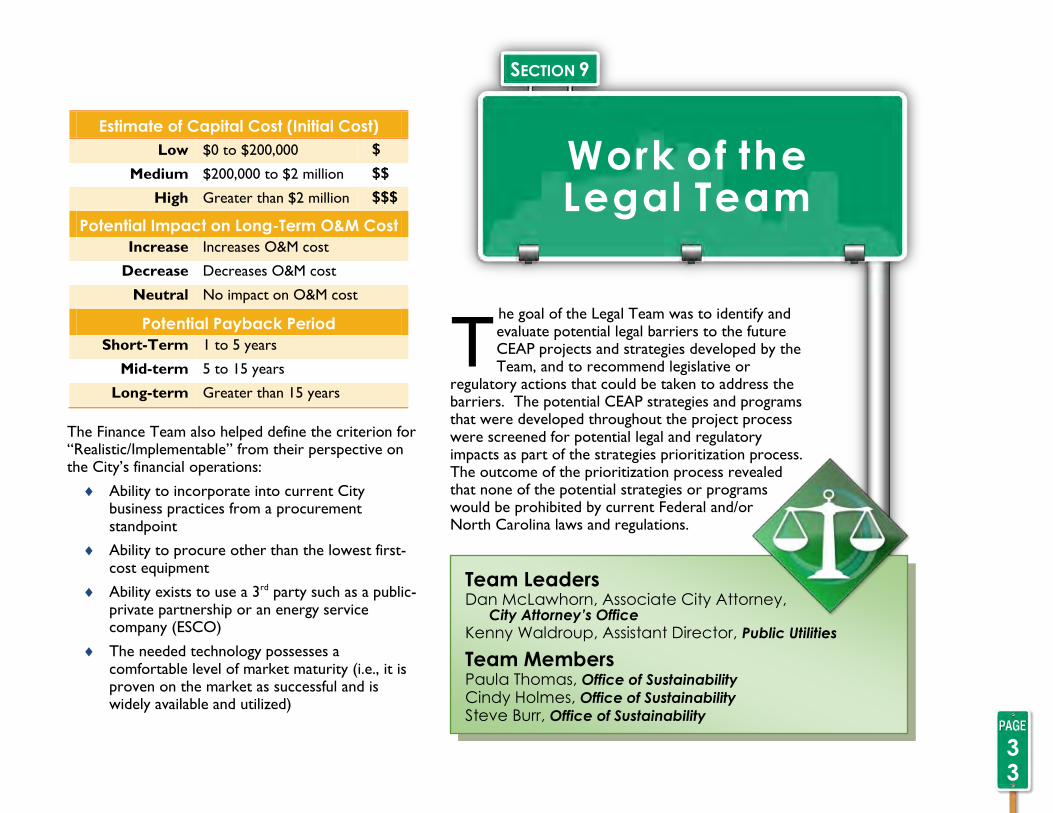
Financial Descriptors & Implementable Criterion The Finance Team provided qualitative financial descriptors to be applied to evaluate the “Financially Responsible” criterion, because of inadequate data to develop specific costs for each strategy. These qualitative metrics allowed the evaluation to proceed using the following relative terms:
T
Estimate of Capital Cost (Initial Cost)
Low $0 to $200,000 $
Medium $200,000 to $2 million $$
High Greater than $2 million $$$
Potential Impact on Long-Term O&M Cost
Increase Increases O&M cost
Decrease Decreases O&M cost
Neutral No impact on O&M cost
Potential Payback Period
Short-Term 1 to 5 years
Mid-term 5 to 15 years
Long-term Greater than 15 years
The Finance Team also helped define the criterion for “Realistic/Implementable” from their perspective on the City’s financial operations:
Ability to incorporate into current City business practices from a procurement standpoint
Ability to procure other than the lowest first-cost equipment
Ability exists to use a 3rd party such as a public-private partnership or an energy service company (ESCO)
The needed technology possesses a comfortable level of market maturity (i.e., it is proven on the market as successful and is widely available and utilized)
he goal of the Legal Team was to identify and evaluate potential legal barriers to the future CEAP projects and strategies developed by the Team, and to recommend legislative or
regulatory actions that could be taken to address the barriers. The potential CEAP strategies and programs that were developed throughout the project process were screened for potential legal and regulatory impacts as part of the strategies prioritization process. The outcome of the prioritization process revealed that none of the potential strategies or programs would be prohibited by current Federal and/or North Carolina laws and regulations.
Team Leaders Dan McLawhorn, Associate City Attorney,
City Attorney’s Office
Kenny Waldroup, Assistant Director, Public Utilities
Team Members Paula Thomas, Office of Sustainability
Cindy Holmes, Office of Sustainability Steve Burr, Office of Sustainability
33
SECTION 9
Work of the Legal Team
Top Proposed Strategies
34 of the most promising strategies – summarized in the
chart here –were identified using screening techniques.
These strategies were evaluated in more detail by
the Prioritization Team.
1.
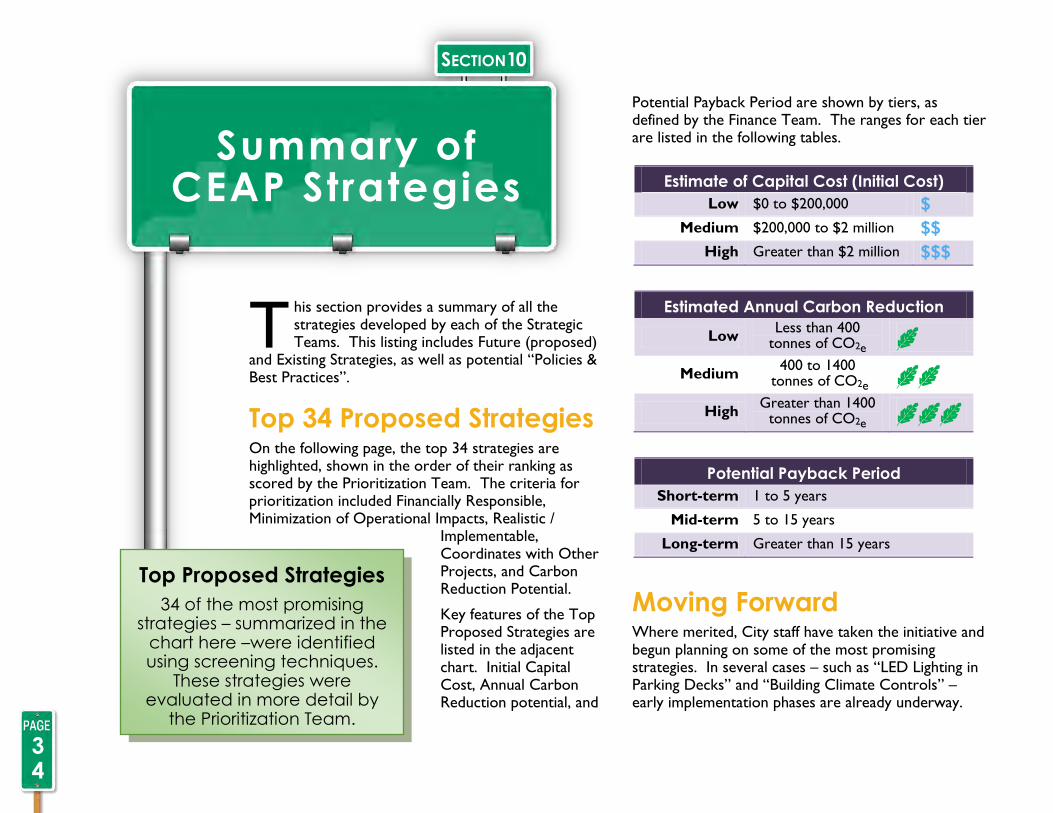
his section provides a summary of all the strategies developed by each of the Strategic Teams. This listing includes Future (proposed)
and Existing Strategies, as well as potential “Policies & Best Practices”.
Top 34 Proposed Strategies On the following page, the top 34 strategies are highlighted, shown in the order of their ranking as scored by the Prioritization Team. The criteria for prioritization included Financially Responsible, Minimization of Operational Impacts, Realistic /
Implementable, Coordinates with Other Projects, and Carbon Reduction Potential.
Key features of the Top Proposed Strategies are listed in the adjacent chart. Initial Capital Cost, Annual Carbon Reduction potential, and
Potential Payback Period are shown by tiers, as defined by the Finance Team. The ranges for each tier are listed in the following tables.
Estimate of Capital Cost (Initial Cost)
Low $0 to $200,000 $
Medium $200,000 to $2 million $$
High Greater than $2 million $$$
Estimated Annual Carbon Reduction
Low Less than 400
tonnes of CO2e `
Medium 400 to 1400
tonnes of CO2e ``
High Greater than 1400
tonnes of CO2e ```
Potential Payback Period
Short-term 1 to 5 years
Mid-term 5 to 15 years
Long-term Greater than 15 years
Moving Forward Where merited, City staff have taken the initiative and begun planning on some of the most promising strategies. In several cases – such as “LED Lighting in Parking Decks” and “Building Climate Controls” – early implementation phases are already underway.
T
SECTION 7
Findings
34
SECTION 10
Summary of CEAP Strategies

Rank/ID Team Top 34 Proposed Strategies Initial Cost O&M Impact Carbon Impact Payback
#1 EE-1-11
Building Climate Controls and Technology Interface
Load-shedding/demand-response algorithms using automation infrastructure and Periscope; smart buildings; building-wide thermostats with motion sensors and smart schedulers $$$ Decrease in Costs ``` Mid-Term
#2 FLT-1-29
Consolidate Collection of Recyclables and Outdoor Solid Waste from City Parks
Pick up recyclables and waste from Parks in same trip (Business Case Evaluation conducted for this strategy)
$$$ Decrease in Costs ``` Mid-Term
#3 EE-1-53
Building Envelope Improvements Building weather-proofing, glazing improvements, etc. $
2
Decrease in Costs ``` Short-Term
#4 EE-1-72
Raleigh Convention Center Preventative Maintenance Plan Implementation
Implement plan for the Convention Center $$ Decrease in Costs `` Mid-Term
#5 EE-1-35
Building Interior Light Controls
Control based on ambient light level and motion detection $2
Decrease in Costs `` Short-Term
#6 EE-1-63
Solar Thermal for Heating City Pools
Pre-heat pool water at aquatics centers with solar $ Decrease in Costs `` Short-Term
#7 CR-1-02
Increase Recycling Container Size
Reduce number of trucks and trips, and increase volume of recyclables to be processed
$$ Decrease in Costs; Revenue Neutral ` Mid-Term
#8 FLT-1-10
Fleet Alternative Fuel Vehicles Continue to replace fleet with alternative fuel and hybrid vehicles $$ No Change `` Mid-Term
#9 EE-1-36
LED Lighting in Parking Decks
Install LED lights in all City parking decks (Business Case Evaluation conducted for this strategy)
$$ Decrease in Costs `` Mid-Term
#10 CR-1-32
Future Water Efficiency Continued water efficiency programs and efforts $ Decrease in Costs ```
Mid- to Long-Term
#11 CR-1-28
Real Time Energy Management Operations Optimization Project
Water distribution system pumping optimization project $$ Decrease in Costs `` Mid-Term
#12 EE-1-33
LED Street Lighting Replace all street lights with LEDs $
1
Decrease in Costs `` Short-Term
#13 EE-1-32
Lighting Replacements by PUD
Lighting replacement in PUD operating facilities (induction lighting, CFL, motion-detection)
$1
Decrease in Costs ` Mid-Term
#14 CR-1-13
Alternative to Methanol Use at Neuse River WWTP
Use alternative, green carbon sources for the denitrification process at the wastewater treatment plant
$$$ No Change ``` n/a
#15 EE-1-21
Energy Efficiency Policy for City LEED Buildings
Policy for LEED to concentrate points for energy efficiency $ Decrease in Costs ` Mid-Term
#16 EE-1-52
Energy-Efficient Vending Machines
Procure energy-efficient vending machines; update contract terms for vending machines to require Energy Star rating
$ Decrease in Costs; No New Revenues ` Short-Term
#17 CR-1-08
Tree Planting Programs
Carbon sequestration through several tree planting programs (Trees Across Raleigh, NeighborWoods); plant over 3,000 trees per year
$ Increase in Costs ` n/a
1 Assumes strategy is accomplished through end-of-service-life light fixture replacement 2 Assumes strategy is implemented as part of annual building maintenance
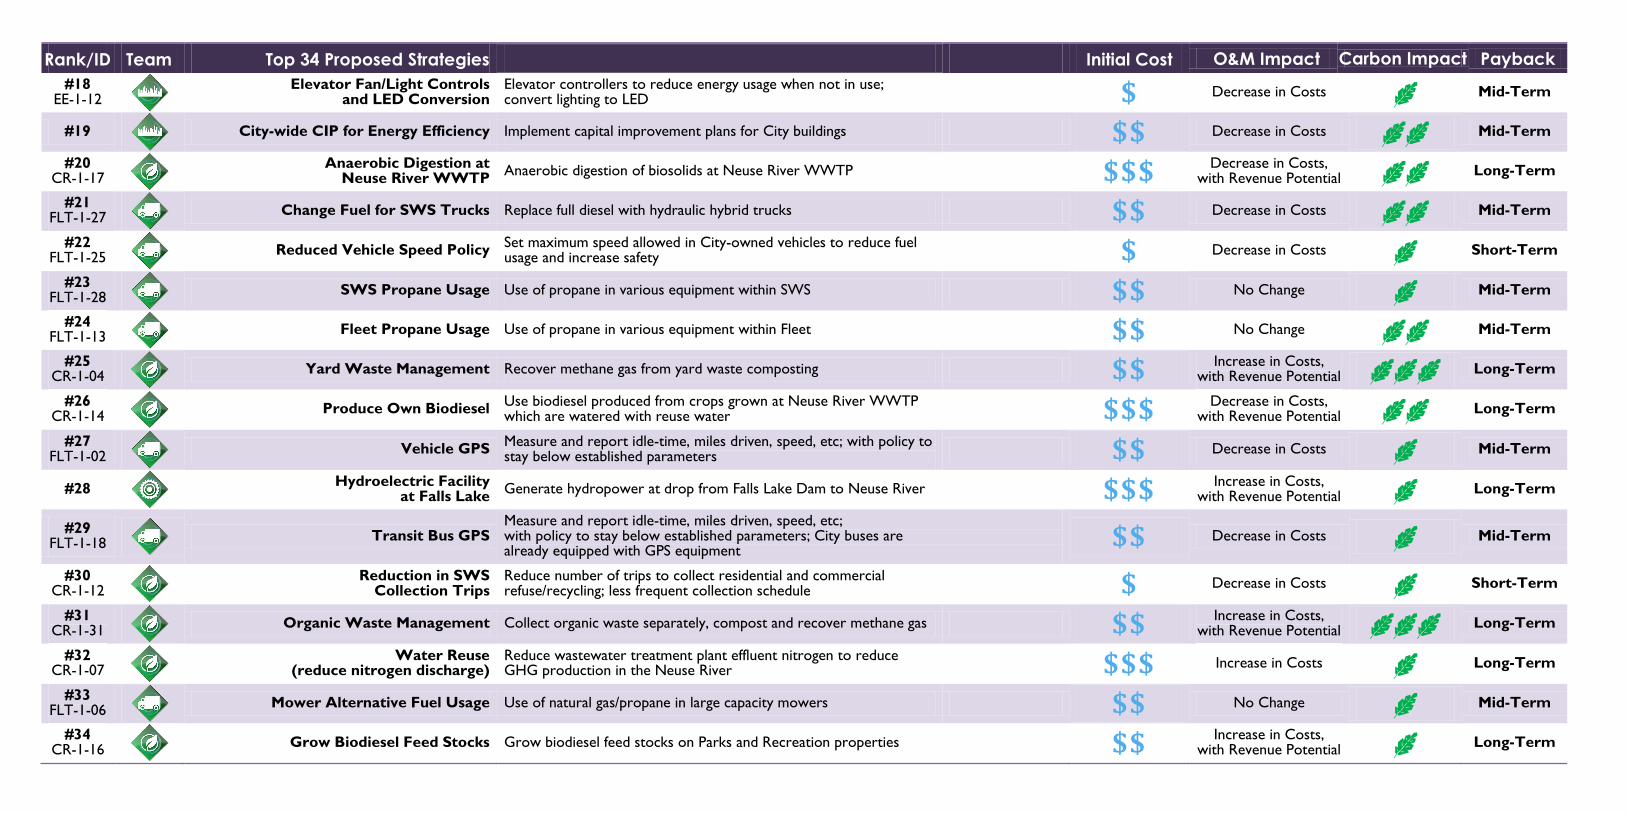
Rank/ID Team Top 34 Proposed Strategies Initial Cost O&M Impact Carbon Impact Payback
#18 EE-1-12
Elevator Fan/Light Controls and LED Conversion
Elevator controllers to reduce energy usage when not in use; convert lighting to LED
$ Decrease in Costs ` Mid-Term
#19
City-wide CIP for Energy Efficiency Implement capital improvement plans for City buildings $$ Decrease in Costs `` Mid-Term
#20 CR-1-17
Anaerobic Digestion at Neuse River WWTP
Anaerobic digestion of biosolids at Neuse River WWTP $$$ Decrease in Costs, with Revenue Potential `` Long-Term
#21 FLT-1-27
Change Fuel for SWS Trucks Replace full diesel with hydraulic hybrid trucks $$ Decrease in Costs `` Mid-Term
#22 FLT-1-25
Reduced Vehicle Speed Policy
Set maximum speed allowed in City-owned vehicles to reduce fuel usage and increase safety
$ Decrease in Costs ` Short-Term
#23 FLT-1-28
SWS Propane Usage Use of propane in various equipment within SWS $$ No Change ` Mid-Term
#24 FLT-1-13
Fleet Propane Usage Use of propane in various equipment within Fleet $$ No Change `` Mid-Term
#25 CR-1-04
Yard Waste Management Recover methane gas from yard waste composting $$ Increase in Costs,
with Revenue Potential ``` Long-Term
#26 CR-1-14
Produce Own Biodiesel
Use biodiesel produced from crops grown at Neuse River WWTP which are watered with reuse water
$$$ Decrease in Costs, with Revenue Potential `` Long-Term
#27 FLT-1-02
Vehicle GPS
Measure and report idle-time, miles driven, speed, etc; with policy to stay below established parameters
$$ Decrease in Costs ` Mid-Term
#28
Hydroelectric Facility at Falls Lake
Generate hydropower at drop from Falls Lake Dam to Neuse River $$$ Increase in Costs, with Revenue Potential ` Long-Term
#29 FLT-1-18
Transit Bus GPS
Measure and report idle-time, miles driven, speed, etc; with policy to stay below established parameters; City buses are already equipped with GPS equipment
$$ Decrease in Costs ` Mid-Term
#30 CR-1-12
Reduction in SWS Collection Trips
Reduce number of trips to collect residential and commercial refuse/recycling; less frequent collection schedule
$ Decrease in Costs ` Short-Term
#31 CR-1-31
Organic Waste Management Collect organic waste separately, compost and recover methane gas $$ Increase in Costs,
with Revenue Potential ``` Long-Term
#32 CR-1-07
Water Reuse (reduce nitrogen discharge)
Reduce wastewater treatment plant effluent nitrogen to reduce GHG production in the Neuse River
$$$ Increase in Costs ` Long-Term
#33 FLT-1-06
Mower Alternative Fuel Usage Use of natural gas/propane in large capacity mowers $$ No Change ` Mid-Term
#34 CR-1-16
Grow Biodiesel Feed Stocks Grow biodiesel feed stocks on Parks and Recreation properties $$ Increase in Costs,
with Revenue Potential ` Long-Term

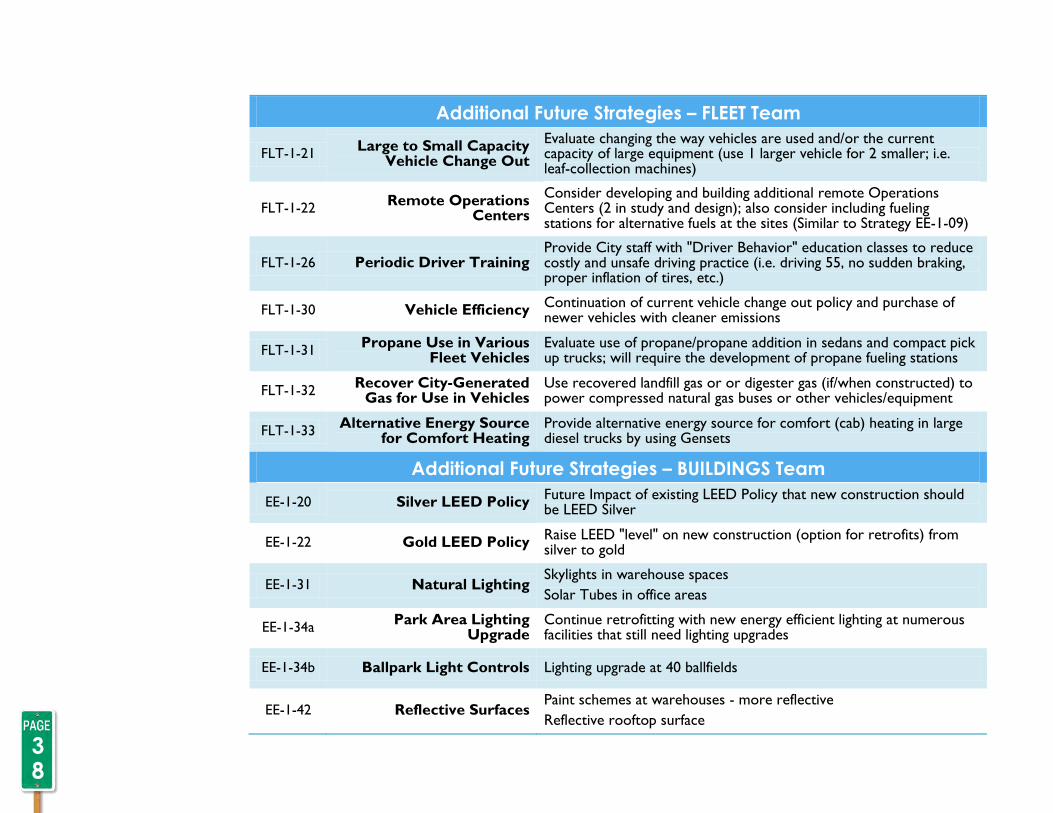
Additional Future Strategies In addition to the 34 strategies shown in the previous section, the Teams developed dozens of other potential projects and programs that would reduce Carbon emissions. These are summarized below.
Additional Future Strategies – FLEET Team
FLT-1-03 Route Optimization Evaluate route optimization in city departments (i.e. PUD for AMR, Police & Fire call-outs, etc.)
FLT-1-04a Auxiliary Battery Power
for Police Vehicles
Consider installing battery operated equipment on police vehicles to run flashing lights, etc. so that if the engine does not need to be running, the vehicle can be turned off
FLT-1-04b Solar to Charge Auxiliary
Batteries Evaluate the use of solar panels to charge batteries for auxiliary power source
FLT-1-05 Remote Operations
Centers for Parks and Rec
Evaluate the development of remote operation centers for Parks & Recreation (currently under consideration for location in Mt. Herman area and south of downtown)
FLT-1-07 Police Work Order
System Evaluate the development of a Police Work Order system to reduce travel times to service areas and back to stations
FLT-1-08 Co-Location of Employees Consider co-locating City departmental staff to reduce the distance employees must travel to get to their work and/or service locations
FLT-1-09 Co-Location of Fueling
Operations
For the new remote facility planned in the NE quadrant of city, evaluate equipping the facility with all-types of fuels - specifically bio-fuels - for fueling city vehicles. Will reduce miles traveled to only the one or two sites available now to refuel with alternative fuels.
FLT-1-12 Compressed Natural Gas
Vehicles
Evaluate the use of natural gas; issue is City doesn't have infrastructure to accommodate more CNG vehicles; consider the limits on fuel capacity (125 mi/tank) and fueling time (a SWS truck would have to refuel in parking lot overnight)
FLT-1-14 Use SWS Trucks for
"Double-Duty" Evaluate using SWS trucks for collecting AMR data for Public Utilities Dept.
37
Additional Future Strategies – FLEET Team
FLT-1-21 Large to Small Capacity
Vehicle Change Out
Evaluate changing the way vehicles are used and/or the current capacity of large equipment (use 1 larger vehicle for 2 smaller; i.e. leaf-collection machines)
FLT-1-22 Remote Operations
Centers
Consider developing and building additional remote Operations Centers (2 in study and design); also consider including fueling stations for alternative fuels at the sites (Similar to Strategy EE-1-09)
FLT-1-26 Periodic Driver Training Provide City staff with "Driver Behavior" education classes to reduce costly and unsafe driving practice (i.e. driving 55, no sudden braking, proper inflation of tires, etc.)
FLT-1-30 Vehicle Efficiency Continuation of current vehicle change out policy and purchase of newer vehicles with cleaner emissions
FLT-1-31 Propane Use in Various
Fleet Vehicles Evaluate use of propane/propane addition in sedans and compact pick up trucks; will require the development of propane fueling stations
FLT-1-32 Recover City-Generated
Gas for Use in Vehicles Use recovered landfill gas or or digester gas (if/when constructed) to power compressed natural gas buses or other vehicles/equipment
FLT-1-33 Alternative Energy Source
for Comfort Heating Provide alternative energy source for comfort (cab) heating in large diesel trucks by using Gensets
Additional Future Strategies – BUILDINGS Team
EE-1-20 Silver LEED Policy Future Impact of existing LEED Policy that new construction should be LEED Silver
EE-1-22 Gold LEED Policy Raise LEED "level" on new construction (option for retrofits) from silver to gold
EE-1-31 Natural Lighting Skylights in warehouse spaces
Solar Tubes in office areas
EE-1-34a Park Area Lighting
Upgrade Continue retrofitting with new energy efficient lighting at numerous facilities that still need lighting upgrades
EE-1-34b Ballpark Light Controls Lighting upgrade at 40 ballfields
EE-1-42 Reflective Surfaces Paint schemes at warehouses - more reflective
Reflective rooftop surface
38
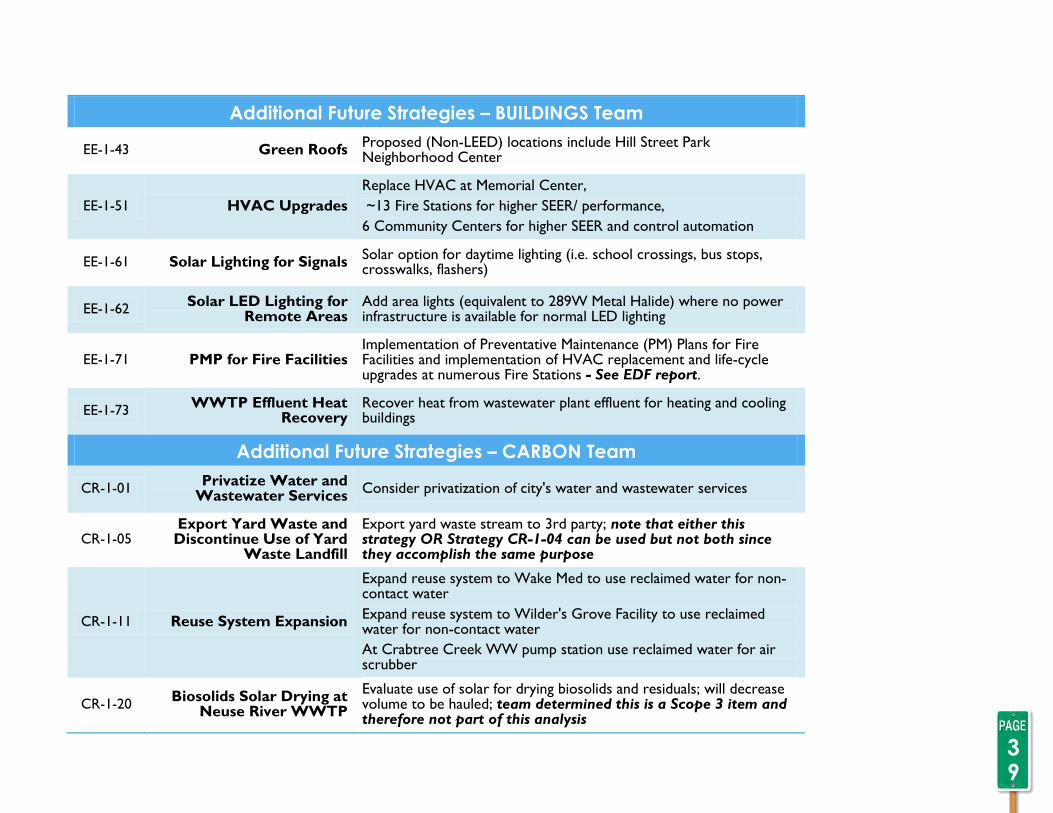
Additional Future Strategies – BUILDINGS Team
EE-1-43 Green Roofs Proposed (Non-LEED) locations include Hill Street Park Neighborhood Center
EE-1-51 HVAC Upgrades
Replace HVAC at Memorial Center,
~13 Fire Stations for higher SEER/ performance,
6 Community Centers for higher SEER and control automation
EE-1-61 Solar Lighting for Signals Solar option for daytime lighting (i.e. school crossings, bus stops, crosswalks, flashers)
EE-1-62 Solar LED Lighting for
Remote Areas Add area lights (equivalent to 289W Metal Halide) where no power infrastructure is available for normal LED lighting
EE-1-71 PMP for Fire Facilities Implementation of Preventative Maintenance (PM) Plans for Fire Facilities and implementation of HVAC replacement and life-cycle upgrades at numerous Fire Stations - See EDF report.
EE-1-73 WWTP Effluent Heat
Recovery Recover heat from wastewater plant effluent for heating and cooling buildings
Additional Future Strategies – CARBON Team
CR-1-01 Privatize Water and
Wastewater Services Consider privatization of city's water and wastewater services
CR-1-05 Export Yard Waste and Discontinue Use of Yard
Waste Landfill
Export yard waste stream to 3rd party; note that either this strategy OR Strategy CR-1-04 can be used but not both since they accomplish the same purpose
CR-1-11 Reuse System Expansion
Expand reuse system to Wake Med to use reclaimed water for non-contact water
Expand reuse system to Wilder's Grove Facility to use reclaimed water for non-contact water
At Crabtree Creek WW pump station use reclaimed water for air scrubber
CR-1-20 Biosolids Solar Drying at
Neuse River WWTP
Evaluate use of solar for drying biosolids and residuals; will decrease volume to be hauled; team determined this is a Scope 3 item and therefore not part of this analysis
39
Additional Future Strategies – CARBON Team
CR-1-21 Equalization at Neuse
River WWTP
Use existing 32 million gallon equalization basin at Neuse River WWTP to store WW and then pump and treat during off-peak hours; not feasible due to US Army COE issues with regulation of downstream flows
CR-1-23 Increase WW Pump
Station Wet Well Capacities
Increase WW PS wet well capacity to reduce pumping; team determined not feasible as can create large operational problems
CR-1-24 Pump Station Visitation
Reduction Continue to reduce pump station visits
CR-1-27 Reclaimed water pickup Initiate policy to use reclaimed water for watering landscapes by city personnel and contractors (in water trucks totes, etc.)
CR-1-29 Landfill Gas Recovery
Expansion Additional LFG Recovery from Wilder's Grove
Additional Future Strategies – OTHER
IT-1-01 Desktop Virtualization
Continue investigation of utilizing desktop virtualization to centralize computing resources in the data center and having "dumb terminal"-style devices on the desktop. Energy savings as terminals use about 1/3 the power of a full PC.
IT-1-02 Data center consolidation Continue investigation of reducing the number of servers in the City's data centers by further utilizing server virtualization and consolidation strategies
Policies & Best Practices In cases where the Teams developed strategies that were more about changing policy or operational culture, as opposed to proposing a specific activity or project with a measurable Carbon impact, these ideas were recorded as potential “Best Practices.” These Best Practices are summarized by Team in the charts in the following section.
40

Policy Strategies & Best Practices – FLEET Team
FLT-BP-01 Right-Size the Fleet
Select the right vehicle for the right job, i.e. the vehicle that best fit its mission
Every 6 months, send departments a report on vehicle usage; departments can use this information to consider switching to more efficient vehicles
Evaluate who is using what type of vehicles; i.e., have crews used Escape Hybrids because they travel many miles instead of supervisors who may travel few miles
Determine whether to replace a vehicle with the same type or to find a more fuel efficient/green vehicle that is the best fit for the use. This will allow for better budgeting and allow City to take advantage of technology changes
When considering the replacement of large capacity vehicles, take into account the towing, loading, and hauling capacity required, i.e. if a smaller vehicle is chosen it will negatively affect the ability to use the vehicle to respond to natural disasters
Establish a two-meeting process (inter-departmental and with Fleet) for replacement of vehicles and equipment to ensure best type is purchased
FLT-BP-02 Sustainability Fund
Establish a "Sustainability Fund" in the Budget; that would allow Departments to augment their budgets to purchase sustainable alternatives and pilot new technologies/practices rather than continue with "business as usual"
FLT-BP-03 Sell Used Vehicle Oil Sell used vehicle oil and generate revenue
FLT-BP-04 Enhanced Preventative Maintenance for SWS
Vehicles
Sample oil during preventative maintenance at every 3,000 miles and change oil only if needed at that time instead of changing oil whether needed or not; this will reduce oil changes and save money
FLT-BP-05 Use of Synthetic Fluids Consider use of synthetic based fluids
FLT-BP-06 Vehicle Fleet Services
Awareness Training
Help other departments better understand what Vehicle Fleet Services does and the data that is required for evaluating vehicle purchases
41
Policy Strategies & Best Practices – FLEET Team
FLT-BP-07 Vehicle Change Out Awareness Training
Raise awareness that budget cuts cause delays in vehicle replacement
FLT-BP-08 Vehicle Change Out Awareness Training
Raise awareness that maintenance of older, retained equipment can cost more in the long run than replacing with newer and more efficient equipment; use this information to provide justification for replacement (make the business case)
FLT-BP-09 Evaluation of Alternative
Fuel Mix
Evaluate breadth and depth of fuel mix - too much diversification will require many types of alternative fuel systems to be constructed to keep vehicles and equipment fueled and operational
FLT-BP-10 Central Warehousing
Consider more central warehousing for storing/stocking supplies (similar to Facilities and PUD); allows supplies to be delivered instead of employees traveling to pick them up, reducing mileage/fuel usage in City vehicles
FLT-BP-11 Teleworking, Video-
Conferencing, Electronic Data Exchange
Evaluate teleworking, compressed work schedule, alternative hours, etc.
Evaluate the use of video conferencing for mandatory employee workshops, training, information sessions (i.e. HR Mtg, Healthcare, operational training)
Evaluate the use of electronic data exchange instead of delivering paperwork to various City departments
Evaluate using pictures and electronic media transfer to obtain 3 estimates for wrecked vehicles instead of driving to 3 different sites for cost estimates
FLT-BP-12 Cross Training for
Reduction of Service Call Mileage
Evaluate cross-training PUD and PWD staff in order to better utilize staff and Fleet resources for call-outs/service calls
FLT-BP-13 Use of Hydrogen or Fuel
Cell Vehicles Evaluate use as technology improves
Policy Strategies & Best Practices – BUILDINGS Team
EE-BP-01 Energy Management Utilize the high-level strategies presented in the Sustainable Energy Plan developed by Facilities as a basis for implementation strategies that can be used by other departments
42

Policy Strategies & Best Practices – BUILDINGS Team
EE-BP-02 Cross-Departmental
Design Reviews
Ensure that the Facilities group along with other city departments (i.e. Planning, Engineering, etc.) are reviewing and modifying aspects of new construction design prior to construction to ensure that best management practices are considered and included from the start of a project
EE-BP-03 Control Automation
Ensure that when automated controls of any type (i.e. lighting, climate controls) are installed in buildings, that Facilities can track usage and provide this data to the various departments to encourage better energy management
EE-BP-04 Lighting Standards Develop City-wide standards for indoor and outdoor lighting
EE-BP-05 Lighting Evaluations
Evaluate lighting at all WTPs and WWTPs (motion sensors controls, LEDs, CFDs) at control rooms, auxiliary buildings, and for external lighting
Continue evaluating where fluorescent lights can be replaced with CFDs or LEDs
EE-BP-06 Preventative Maintenance Use existing preventative maintenance (PM) plans to assist other departments (i.e. Fire, PUD) with development of their own PM Plans
EE-BP-07 Facilities Audits Conduct audits on City buildings using internal City staff
EE-BP-08 Real-Time Energy Data Ensure that Facilities/Buildings is able to use real-time energy data (from EDI) to determine total peak and off-peak usage
EE-BP-09 High Efficiency Equipment Require that replacement equipment has a high efficiency rating
EE-BP-10 Building Roofing Develop standards/policy for evaluating roofs for new buildings and for roof replacements to ensure that green roofs and possible solar applications are considered
Policy Strategies & Best Practices – CARBON Team
CR-BP-01 Real Estate Purchasing
Policy
Develop a real estate purchasing policy that takes into consideration the potential for locating solar and also employee co-location opportunities
CR-BP-02 Carbon Footprint Policy Develop construction policy for CIP projects that includes carbon footprint as part of the evaluation criteria
43
Policy Strategies & Best Practices – CARBON Team
CR-BP-03 High Efficiency Equipment Require that replacement equipment has a high efficiency rating (i.e. replacement of aging aeration blowers at Neuse River WWTP with high efficiency blowers)
CR-BP-04 Budget Practice Provide fuel "consumption" budget for vehicles instead of "dollars" budget due to fluctuating fuel prices
CR-BP-05 Neuse River WWTP
Blower Operation Awareness
Consider developing a "cost speedometer" at Neuse River WWTP via the SCADA system so operators can see cost impact of ramping blowers up or down (i.e. see energy costs impacts when tweaking system)
CR-BP-06 AMR Use fixed AMR system for entire service area to read water meters - reduces vehicle idling, fuel usage, and number of employees
CR-BP-07 Neuse River WWTP Filter
Denite Chemicals At Neuse River WWTP test use of sugar water instead of methanol for denitrification filters
CR-BP-08 Neuse River WWTP Pump
VFDs At Neuse River WWTP replace screw pumps with vertical turbines with VFDs for solids handling and influent flow
CR-BP-09 Aeration Efficiency at Neuse River WWTP
Implement a formal inspection, cleaning and replacement program for aeration basin diffusers at Neuse River WWTP
CR-BP-09 Neuse River WWTP
Screenings Compaction At Neuse River WWTP compact influent screenings to reduce solids volume and number of trips required for disposal
CR-BP-10 Neuse River WWTP
Operations Audit
Evaluate wastewater treatment operations for energy efficiency opportunities (i.e. operational improvements, pump replacements, lighting upgrades, etc.)
CR-BP-11 Neuse River WWTP
Biosolids for Fertilizer
Evaluate use of Class A dried biosolids from anaerobic digestion (if/when implemented) as fertilizer for use by City or citizens
Parks and Recreation to partner with PUD to use Neuse River WWTP biosolids instead of potting soil
CR-BP-12 PUD Strategic Plan PUD is developing a Strategic Plan for fleet usage and routing; this takes into consideration the location at which employees should report for maximum efficiency
CR-BP-13 WW Pump Station
Elimination
Eliminate WW PS and use gravity flow where possible; always consider new opportunities for WW gravity flow instead of new pump stations
44

Policy Strategies & Best Practices – CARBON Team
CR-BP-14 System to Track Position
of Valves in Water System
Institute a system for tracking the position of major valves in the water distribution system to prevent pumping against closed valves or pumping in a loop
CR-BP-15 WTPs Filter Optimization Optimize filter backwash at water treatment plants
CR-BP-16 Distribution Pressure Evaluate pressure of system needed to provide water to customers and consider reducing by 5 psi to reduce pumping throughout various water system zones
CR-BP-17 Toilet Conversion Convert all old toilets in City buildings from 5-gallon flush to lower flush model
CR-BP-18 Water Efficiency Develop plan to better manage water use in all City buildings
CR-BP-19 Convention Center Water
Efficiency Consider collecting and using the stream of water running under the building
CR-BP-20 Recovery of Rain Water at
Convention Center
Consider expanding rainwater collection at the Convention Center (now recovering ~ 10,000 gallons of water from the roof top) and using it for irrigation; consider practice at other City buildings
CR-BP-21 Recycling
Require mandatory recycling by all city employees; would increase volume of recyclables and has revenue earning potential of $30/ton
Require mandatory residential recycling of all recyclables; would increase volume of recyclables and has revenue earning potential of $30/ton. Note that Parks and Recreation has obtained a grant for placing recycle containers for use by employees and a pilot is underway.
Implement recycling "education" campaign to increase total recyclables
CR-BP-22 Tree Removal and Sale When City removes trees, sell as firewood and /or send to mills for revenue
CR-BP-23 Smart Grid Concepts Adopt Smart Grid concepts for energy management; consider modifying the operation of generators and other practices
Policy Strategies & Best Practices – RENEWABLES Team
RE-BP-01 Sustainability Fund Use revenue from renewables projects to create a "Sustainability Fund"
45
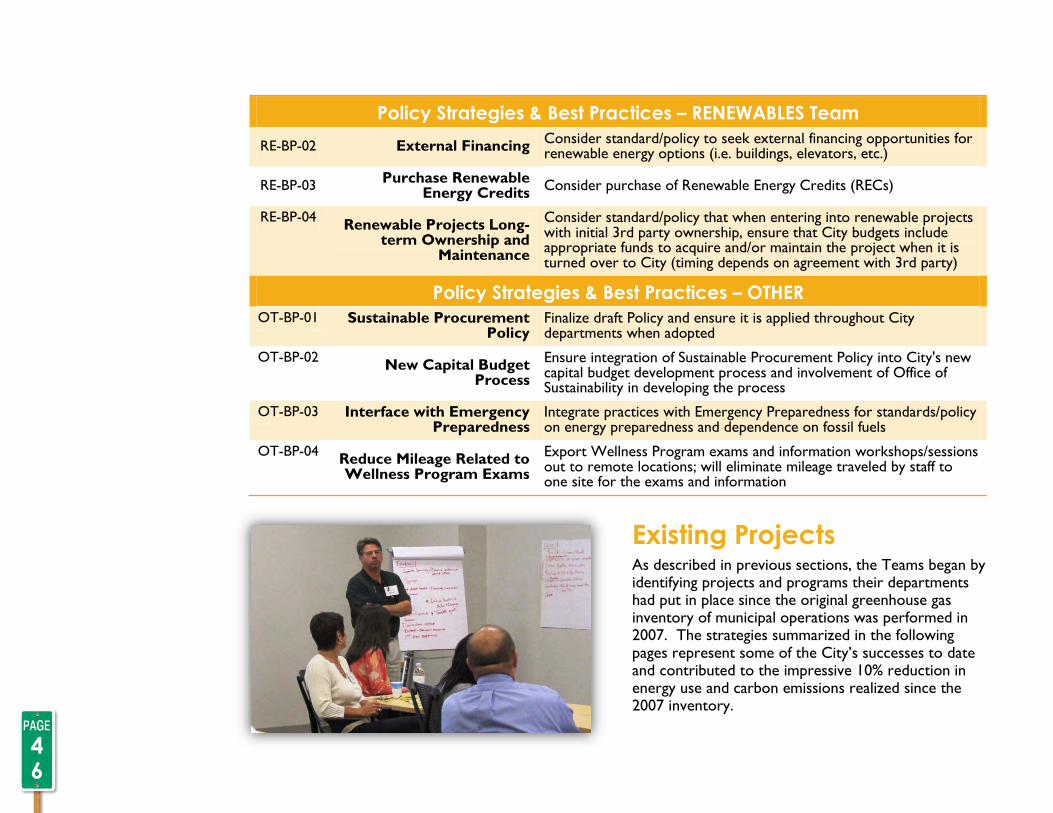
Policy Strategies & Best Practices – RENEWABLES Team
RE-BP-02 External Financing Consider standard/policy to seek external financing opportunities for renewable energy options (i.e. buildings, elevators, etc.)
RE-BP-03 Purchase Renewable
Energy Credits Consider purchase of Renewable Energy Credits (RECs)
RE-BP-04 Renewable Projects Long-
term Ownership and Maintenance
Consider standard/policy that when entering into renewable projects with initial 3rd party ownership, ensure that City budgets include appropriate funds to acquire and/or maintain the project when it is turned over to City (timing depends on agreement with 3rd party)
Policy Strategies & Best Practices – OTHER
OT-BP-01 Sustainable Procurement Policy
Finalize draft Policy and ensure it is applied throughout City departments when adopted
OT-BP-02 New Capital Budget
Process
Ensure integration of Sustainable Procurement Policy into City's new capital budget development process and involvement of Office of Sustainability in developing the process
OT-BP-03 Interface with Emergency Preparedness
Integrate practices with Emergency Preparedness for standards/policy on energy preparedness and dependence on fossil fuels
OT-BP-04 Reduce Mileage Related to Wellness Program Exams
Export Wellness Program exams and information workshops/sessions out to remote locations; will eliminate mileage traveled by staff to one site for the exams and information
Existing Projects As described in previous sections, the Teams began by identifying projects and programs their departments had put in place since the original greenhouse gas inventory of municipal operations was performed in 2007. The strategies summarized in the following pages represent some of the City’s successes to date and contributed to the impressive 10% reduction in energy use and carbon emissions realized since the 2007 inventory.
46

Existing Strategies Since 2007 – FLEET Team
FLT-0-01 Fleet Alternative Fuels
Fleet alternative fueling program began in 2000. Fleet increased the variety of biofuels (i.e. B5, B20, E85, and CNG) beginning in 2007 to meet the EAB goal of reducing the amount of fossil-fuel consumed by 20%
FLT-0-02 Flex Fuel Vehicles Changed pickups and sedans to unleaded/flex fuel vehicles
FLT-0-03 Police Dept Alternative
Fuel Vehicles Changed undercover cars from Crown Victoria to Hybrids and increased fuel efficiency of vehicles
FLT-0-04 SUV-Pickup Change Out Changed full-size SUVs & Pickups to compact SUVs
FLT-0-05 No Idling Policy Initiated a "No Idling" policy
FLT-0-06 Right-Sizing the Fleet Shifted focus to reduce large vehicle capacity, where it was not needed, to smaller capacity vehicle (i.e. F150 vs. sedan or Escape)
FLT-0-07 Police Dept GPS Usage Police department is using GPS technology for all 911 service calls; System helps ensure the closest officer responds to a call
FLT-0-08 SWS Route Optimization Solid Waste Services (SWS) implemented route optimization standards to reduce the number of trips (miles traveled) for solid waste pick-up and disposal
FLT-0-09 Extended Maintenance at
Parks Extended maintenance frequency - i.e. mow every 3 weeks instead of 2 weeks at parks and road right-of-ways
FLT-0-10 Naturalization of Parks
and Recreation Areas Parks and Recreation has/is naturalizing areas in Parks (i.e. turf reduction to meadow conversion) to reduce the need for mowing
FLT-0-11 SWS GPS Usage SWS installed GPS devices in trucks that record a driver's behavior; has helped reduce instances of speeding, frequent stopping, sudden braking, etc.
FLT-0-12 Fire Dept. Alternative Fuel
Vehicles The Fire Dept is using more efficient and alternative fuel vehicles for supervisor's cars
FLT-0-13 Fire Dept Increased B5
Usage The Fire Dept is using more B5 in vehicles and equipment
FLT-0-14 SWS Cleaner Fuel Usage SWS purchased new equipment that uses cleaner fuel and produces less emissions
47

Existing Strategies Since 2007 – FLEET Team
FLT-0-15 Motor Pool
Implementation
Implemented a motor pool at municipal center; City staff can choose a car from those available to drive to other City centers instead of being assigned an individual vehicle
FLT-0-16 Police Dept Citizens
Reporting
Police Dept. began allowing citizens to reports situations for police response by internet (reduces number of trips officers take to visit citizen's homes)
FLT-0-17 Parks and Recreation
Mower Alternative Fuel
In 2009 pilot project for mowers within Parks & Recreation was initiated to determine the effects of alternative fuel use on exhaust emissions using GESI (report is not available yet)
FLT-0-19 SWS Idling Monitors Solid Waste Services - uses controller to monitor vehicle idling monitored - shuts down motor after 3-5 minutes
Existing Strategies Since 2007 – BUILDINGS Team
EE-0-11 Energy Management
Software (Periscope) and Climate Control System
Installations in Police Training Center, Sanderford Rd, Optimist Pool & CC, Six Forks Police Admin Facility, Greystone, Millbrook Exchange Pool & CC, St. Monica Teen Center, Municipal Complex, Jaycee CC, Frank E. Evans Admin Office, Pullen Arts, Pullen Pool, Barwell Rd Emergency Communications, Lake Lynn, Laurel Hills, Chavis, Worthdale, Biltmore Hills, Green Rd, Lions Park, Walnut Creek Ballfields, Cabarrus St Downtown District Station, One Exchange Plaza, 310 W. Martin St, Ralph Campbell, Sertoma Arts, Brentwood Neighborhood Center, Roberts, Tarboro Rd, Glen Eden, Millbrook Exchange Tennis, Peach Rd, Halifax, Hill St, Five Points Center for Active Adults, Dunn Rd, Chavis Park Carousel, Mordecai Historic Park Interpretive Center
EE-0-20 2008 LEED Buildings
(Silver) Convention Center and Neuse River WWTP Building
EE-0-21 2009 LEED Buildings
(Silver)
Walnut Creek Wetland Center - Includes exterior LED lighting and climate control system with lighting occupancy sensors. The Walnut Creek Wetland Center was designed by Frank Harmon Architects and incorporates many elements of environmentally friendly design.
Brentwood Remote Operations - Solar LED exterior lighting, LED exterior lighting, roofttop solar PV system
EE-0-22 2010 LEED Building
(Silver) D.E. Benton WTP Building
48

Existing Strategies Since 2007 – BUILDINGS Team
EE-0-23 2011 LEED Buildings
(Silver)
Marsh Creek Community Center - energy efficient lighting, solar thermal water heating, climate control system
Annie Louise Wilkerson Nature Center - energy efficient lighting, small cell solar PV system, climate control system, EVSE charging station
Pullen Park Amusement - LED lighting, geothermal for carousel building, climate control system
EE-0-24 2011 LEED Building
(Platinum) Transit Operations Facility
EE-0-25 2012 LEED Building
(Platinum) Wilders Grove Remote Operations Facility
EE-0-26 2012 LEED Building (Silver) Buffaloe Road Aquatics Center
EE-0-27 2013 LEED Buildings
(Silver)
NE Remote Operations - Climate control system, exterior LED lighting
Fire Station 29, Whitaker Mill Senior Center, Millbrook Senior Center
EE-0-28 2014 LEED Buildings
(Silver) Barwell Community Center
EE-0-29 2014 LEED Building (Gold) Public Safety Center
EE-0-31 Raleigh Television Network Lighting
Replacement Changed 2kW spots to 1kW spots
EE-0-32 Interior Lighting
Replacement (multiple locations)
Buildings - Fire Stations 2-12, 14-16, 18, 19; Biltmore Hills Park, Carolina Pines, Brentwood CC, Worthdale, Sgt. Courtney T. Johnson, Durant Nature Park Admin Building, Eastgate Park, Garris Building, Glen Eden, Roberts Park, Lions Park, Chavis Park, Sertoma Arts, Tarboro Rd, Pullen Arts, Laurel Hills, Lake Lynn, Green Rd, Jaycee Park, Kiwanis Park, Lake Johnson, Method CC/Pioneer Building, Millbrook, Millbrook Tennis Center, Optimist Park, Powell Dr, One Exchange Plaza, 310 W. Martin St
EE-0-33 LED Traffic Lights Replaced ALL traffic lighting with LED lights
EE-0-34 Lighting Replacement in
Memorial Auditorium Replaced 85-90% of lights in Memorial Auditorium with LEDs/CFLs
49

Existing Strategies Since 2007 – BUILDINGS Team
EE-0-35 LED Lighting Replacement in Convention Center Deck
Replaced Parking Deck Lights with LEDs
EE-0-36 LED Parking Structure
Lighting Facilities has installed LED lights on the 1st floor of the parking deck (at 222 W. Hargett St.); 141 fixtures replaced
EE-0-37 LED Exterior Park/Area
Lights (multiple locations)
One Exchange Plaza, Carolina Pines, Jamaica Dr Greenway Tunnel, Brentwood Road Operations Center wallpacks, Sgt. Courtney Johnson, Chavis Park, Eastgate, Optimist, Walnut Creek Wetlands Center, Reedy Creek Pedestrian Bridge, Sertoma Arts, Cabarrus Street Downtown Police District, City Plaza light towers, Lake Boone Trail Bridge Underpass, Municipal Complex campus, Lions Park, Worthdale Park, Ridge Rd Pool, Pullen Aquatics, Pullen Amusement, Longview Pool, Roberts, Method
EE-0-38 LED Exterior & Interior
Lighting Replacement (misc depts)
EXTERIOR: Public Works - Hillsborough Street, State Street - Community Development, Benton Water Plant - Public Utilities
INTERIOR: Mayor's Office and Elevator Lighting Downtown
EE-0-39 Exterior Lighting
Replacement at Parks (excludes LED)
Parks and Recreation has installed exterior lights with control panels at ball fields; the lights are on automated controls which allows lights to turn on and off based on the presence of citizens: Optimist Senior Ballfield, Jaycee Little League Field
EE-0-41 Roofing Upgrades
Rooftops with white, opaque, and/or reflective materials to increase R-factor at Biltmore Hills, Tarboro, Optimist, Chavis, Pullen Pool, Glen Eden, Green Road, Method, Pullen Community, and One Exchange Plaza
EE-0-42 Green Roofs Developed green roofs at Hill Street Neighborhood Center, Five Points Center for Active Adults, Fire Station 9
EE-0-43 Building Glass Enhancement
Installed new glazing to reduce heat radiation at Roberts, Sgt. Courtney Johnson, Worthdale, Optimist, Green Road, Lions, Method, Pullen Community, Chavis, Jaycee, and Carolina Pines
EE-0-51 Equipment Replacement
Boiler Replacement at Biltmore Hills, Method Road, Lions boiler and HVAC, mechanical upgrades at Chavis community to include variable refrigerant system and upgrade of gym heaters, Pullen Arts HVAC and boiler replacement, Carolina Pines and Jaycee mechanical upgrade to higher SEER, Sgt. Courtney T. Johson HVAC and mechanical upgrade, One Exchange Plaza chiller replacement.
50
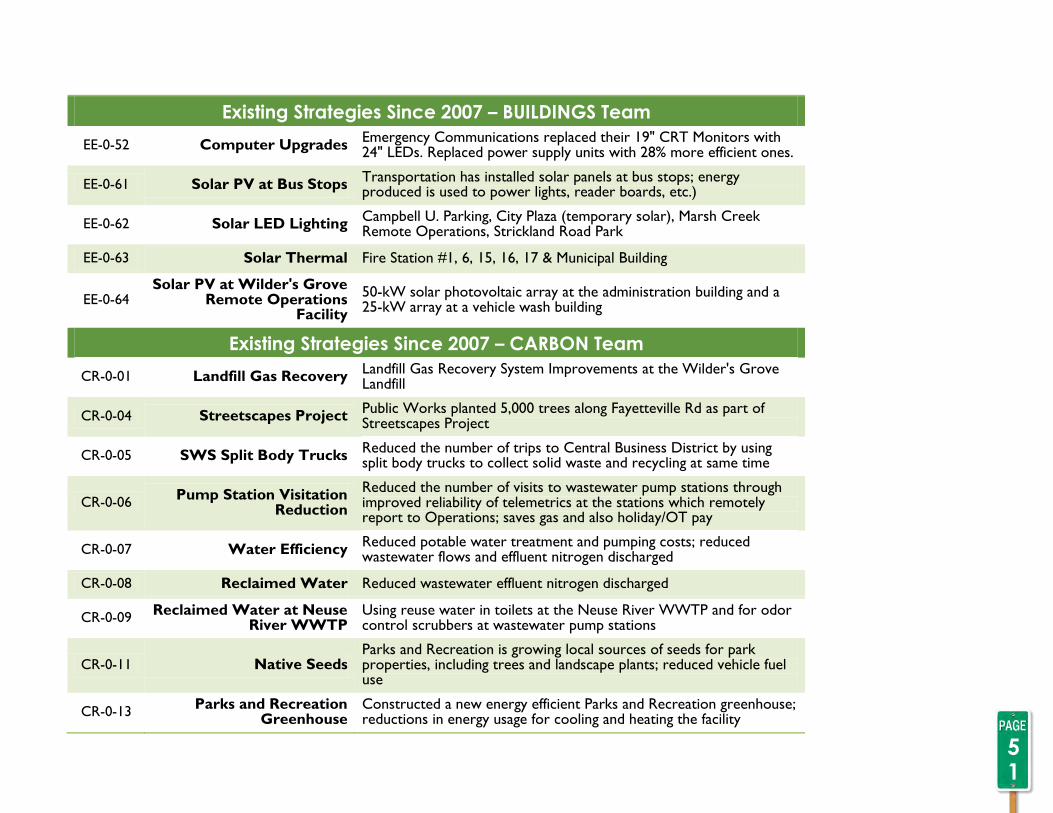
Existing Strategies Since 2007 – BUILDINGS Team
EE-0-52 Computer Upgrades Emergency Communications replaced their 19" CRT Monitors with 24" LEDs. Replaced power supply units with 28% more efficient ones.
EE-0-61 Solar PV at Bus Stops Transportation has installed solar panels at bus stops; energy produced is used to power lights, reader boards, etc.)
EE-0-62 Solar LED Lighting Campbell U. Parking, City Plaza (temporary solar), Marsh Creek Remote Operations, Strickland Road Park
EE-0-63 Solar Thermal Fire Station #1, 6, 15, 16, 17 & Municipal Building
EE-0-64 Solar PV at Wilder's Grove
Remote Operations Facility
50-kW solar photovoltaic array at the administration building and a 25-kW array at a vehicle wash building
Existing Strategies Since 2007 – CARBON Team
CR-0-01 Landfill Gas Recovery Landfill Gas Recovery System Improvements at the Wilder's Grove Landfill
CR-0-04 Streetscapes Project Public Works planted 5,000 trees along Fayetteville Rd as part of Streetscapes Project
CR-0-05 SWS Split Body Trucks Reduced the number of trips to Central Business District by using split body trucks to collect solid waste and recycling at same time
CR-0-06 Pump Station Visitation
Reduction
Reduced the number of visits to wastewater pump stations through improved reliability of telemetrics at the stations which remotely report to Operations; saves gas and also holiday/OT pay
CR-0-07 Water Efficiency Reduced potable water treatment and pumping costs; reduced wastewater flows and effluent nitrogen discharged
CR-0-08 Reclaimed Water Reduced wastewater effluent nitrogen discharged
CR-0-09 Reclaimed Water at Neuse
River WWTP Using reuse water in toilets at the Neuse River WWTP and for odor control scrubbers at wastewater pump stations
CR-0-11 Native Seeds Parks and Recreation is growing local sources of seeds for park properties, including trees and landscape plants; reduced vehicle fuel use
CR-0-13 Parks and Recreation
Greenhouse Constructed a new energy efficient Parks and Recreation greenhouse; reductions in energy usage for cooling and heating the facility
51

mplementing the City of Raleigh Operations Climate/Energy Action Plan will require sustained commitment and must be consistent with the City’s values of environmental, cultural and
economic sustainability. The Interdepartmental Team was guided by these principles throughout the development of the CEAP and as it formulated strategies to increase energy efficiency and reduce carbon emissions in City Operations. The projects, strategies and best practices identified in the CEAP support these values by providing:
Economic sustainability through increasing operational and energy efficiency
Environmental stewardship and improved quality of life for its citizens through the reduction of carbon emissions
Opportunities to build the City’s culture of implementing sustainable solutions that are fiscally sound and financially responsible
Implementing the Plan will also increase the City’s resiliency and ability to respond to unpredictable futures that may bring changes in:
Energy availability
Energy costs
Climate variability
Air quality and public health
Economic and financial markets
While the CEAP process resulted in a prioritized list of projects, the City must carefully determine which projects to implement through further review, consideration of total cost of ownership, and consideration of the potential for changing futures.
Short-term Action Plan (within the next year) The following actions are recommended to be started promptly:
1. Evaluate and implement a robust system to track, document, and report advances in energy efficiency and reductions in carbon emissions for current operations and as strategies are
I
SECTION 7
Findings
Using Business Case Evaluations
The Business Case Evaluations and project prioritization program that have been utilized in
the CEAP development process are complimentary to and should be included as
part of the on-going CIP process improvement initiative that is being developed by City staff.
52
SECTION 11
Following the Roadmap
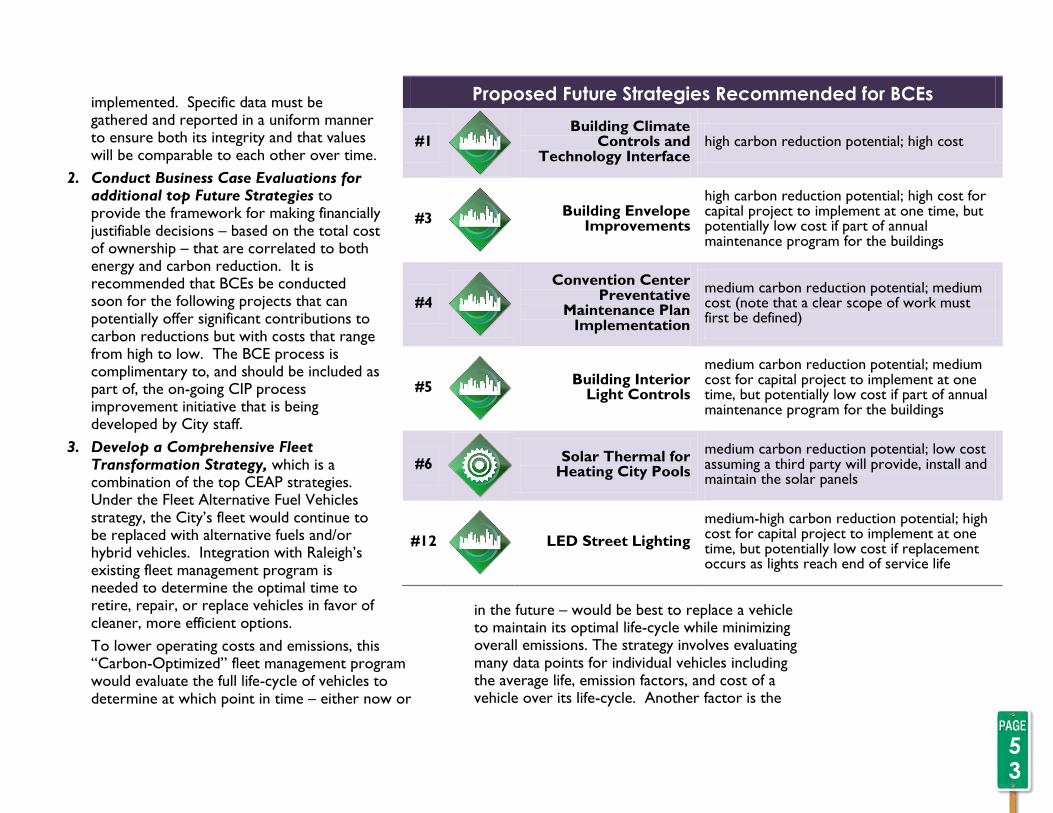
Proposed Future Strategies Recommended for BCEs
#1
Building Climate Controls and
Technology Interface high carbon reduction potential; high cost
#3
Building Envelope Improvements
high carbon reduction potential; high cost for capital project to implement at one time, but potentially low cost if part of annual maintenance program for the buildings
#4
Convention Center Preventative
Maintenance Plan Implementation
medium carbon reduction potential; medium cost (note that a clear scope of work must first be defined)
#5
Building Interior Light Controls
medium carbon reduction potential; medium cost for capital project to implement at one time, but potentially low cost if part of annual maintenance program for the buildings
#6
Solar Thermal for Heating City Pools
medium carbon reduction potential; low cost assuming a third party will provide, install and maintain the solar panels
#12
LED Street Lighting
medium-high carbon reduction potential; high cost for capital project to implement at one time, but potentially low cost if replacement occurs as lights reach end of service life
implemented. Specific data must be gathered and reported in a uniform manner to ensure both its integrity and that values will be comparable to each other over time.
2. Conduct Business Case Evaluations for additional top Future Strategies to provide the framework for making financially justifiable decisions – based on the total cost of ownership – that are correlated to both energy and carbon reduction. It is recommended that BCEs be conducted soon for the following projects that can potentially offer significant contributions to carbon reductions but with costs that range from high to low. The BCE process is complimentary to, and should be included as part of, the on-going CIP process improvement initiative that is being developed by City staff.
3. Develop a Comprehensive Fleet Transformation Strategy, which is a combination of the top CEAP strategies. Under the Fleet Alternative Fuel Vehicles strategy, the City’s fleet would continue to be replaced with alternative fuels and/or hybrid vehicles. Integration with Raleigh’s existing fleet management program is needed to determine the optimal time to retire, repair, or replace vehicles in favor of cleaner, more efficient options.
To lower operating costs and emissions, this “Carbon-Optimized” fleet management program would evaluate the full life-cycle of vehicles to determine at which point in time – either now or
in the future – would be best to replace a vehicle to maintain its optimal life-cycle while minimizing overall emissions. The strategy involves evaluating many data points for individual vehicles including the average life, emission factors, and cost of a vehicle over its life-cycle. Another factor is the
53

ability to access alternative fuel infrastructure which is being planned for installation at some of the City’s remote operations facilities. Utilizing this information, the best time for replacement relative to the maintenance and repair cost versus that of new technology would be determined. Individual vehicles in the fleet would be evaluated as part of the entire fleet in order to minimize the present value of future costs associated with the fleet, and identify the long-term impacts of operating suboptimal equipment.
Utilizing statistical modeling and a decision support system provides a transparent process that will aid in establishing potential fleet management policies that may include guidelines for the most appropriate type of equipment based on usage, as well as establishing the life-cycle costs and emissions threshold that would trigger decisions to retire, repair, or replace. To implement the strategy, it would be necessary to generate the data needed to apply the tool and determine how to minimize the future costs and emissions associated with the fleet.
4. Evaluate the benefits of implementing the water distribution system Real Time Energy Management Operations Optimization (RTEMOO) considering its contributions to both energy efficiency and reduced carbon emissions, with the Public Utilities Department.
5. Establish plan to annually report progress on reducing City Operations energy and carbon emissions and to update the CEAP every three years to identify new priority actions and maintain momentum.
6. Reconvene the Interdepartmental Team every six months to maintain their momentum for implementing the CEAP.
7. Review the list of the remaining Top 34 Future Strategies and select (or re-prioritize) those to implement next.
8. Train several City staff members to become experienced in using the BCE process. This transparent process can be used in a wide range of decision-making applications including City-wide CIP prioritization.
9. Initiate planning for City-wide Community Energy and Carbon Reduction Program which would engage all members of the Raleigh community including residents, businesses and other institutions.
10. Evaluate and implement a system specifically designed to monitor and measure results for the City’s renewable energy projects.
11. Register renewable energy projects with the NC Utilities Commission. If approved, receive Renewable Energy Certificates (RECs) that meet the requirements of NC’s portfolio standard. Register the RECs through the North Carolina Renewable Energy Tracking System, which allows for the sale of RECs should the City choose to do so.
12. Charge the Renewable Energy Team to:
Monitor potential changes to NC Senate Bill 3 (SB3) which established the Renewal Energy Portfolio Standard for NC’s public utilities.
Evaluate benefits of owning and operating
54
More details on action items and next steps to develop and implement a carbon-reducing Fleet Transformation Strategy are available in Volume 3 of the Technical Documentation
renewable energy projects versus facilitating projects that are owned/operated by private entities.
Evaluate benefits of keeping RECS and/or buying additional RECs to provide for carbon reductions.
Monitor renewables market for evolving trends and potential funding.
Consider development of a Renewable Energy Action Plan.
Intermediate Action Plan (in the next 2 to 3 years) 1. Conduct BCEs on other Additional Future
Strategies and Best Management Practices to determine their total cost of ownership and to establish timeframes for inclusion in the City’s overall CIP program or operational policy.
2. Implement the City of Raleigh Comprehensive Fleet Transformation Strategy which will result in the most efficient mix of vehicles that minimizes costs and overall carbon emissions. Implementation will be based on the results of the data gathered and analyzed as part of Item #3 under the Short-term Action Plan.
3. Develop a policy for City LEED buildings that places the emphasis on optimizing energy performance while acknowledging the potential for additional initial capital expenditure
4. Prepare an Annual Progress Report documenting reductions in energy and carbon
emissions, engaging the Interdepartmental Team in the process.
5. Review the list of the remaining Additional Future Strategies and Best Management Practices and select (or re-prioritize) those to implement next.
6. Begin the update of the Roadmap to identify new priority actions and maintain momentum, following the CEAP process with the Interdepartmental Team.
7. Evaluate incorporating other City Operations processes into the CEAP framework such as Information Technology and managing construction debris generated at City-owned projects.
Long-term Action Plan (beyond 3 years) 1. Annually prepare Progress Reports documenting
reductions in energy and carbon emissions.
2. Continue the three-year cycle for updating the Roadmap with considerations for including additional City Operations processes.
3. Implement the Renewable Energy Action Plan
55

everal overarching recommendations emerged from the CEAP process and are presented separately below:
Data Management System Needs
Using Business Case Evaluations to Make Decisions about Prioritization and Funding
Collaboration with Local Power Providers
Renewable Energy Plan
City-wide Community Energy Assurance
City-wide Community Energy and Carbon Reduction Program
Data Management System Needs While developing the CEAP, the Interdepartmental Team recognized that the collection and reporting of the various types of data needed for the CEAP analyses were not always
straightforward or readily available. It is vital that the City of Raleigh develop and implement an ongoing data collection process that will streamline and increase the accuracy of reporting information needed to evaluate cost savings and carbon reductions.
Business Case Evaluations The CEAP process demonstrated the value of applying business case evaluations (BCE) to:
Make decisions about prioritization,
Project timing of needed expenditures, and
Evaluate tradeoffs between capital projects versus longer life-cycle replacement projects.
The BCE process is a transparent framework for making financially justifiable decisions about projects. It results in recommendations achieved through a comprehensive analysis that includes input from the staff most knowledgeable of the issues and the affected stakeholders.
The BCEs and project prioritization program that have been utilized in the CEAP development process are complimentary to, and should be included as part of, the on-going CIP process improvement initiative that is being developed by City staff.
Collaboration with Local Power Providers The City would like to build on existing partnerships and expand collaboration with its local power
S
56
SECTION 7
Findings
Future Data Collection and Reporting This information is
particularly critical in developing the total cost of ownership as a basis
for future financial evaluations
SECTION 12
Raleigh’s Energy Future
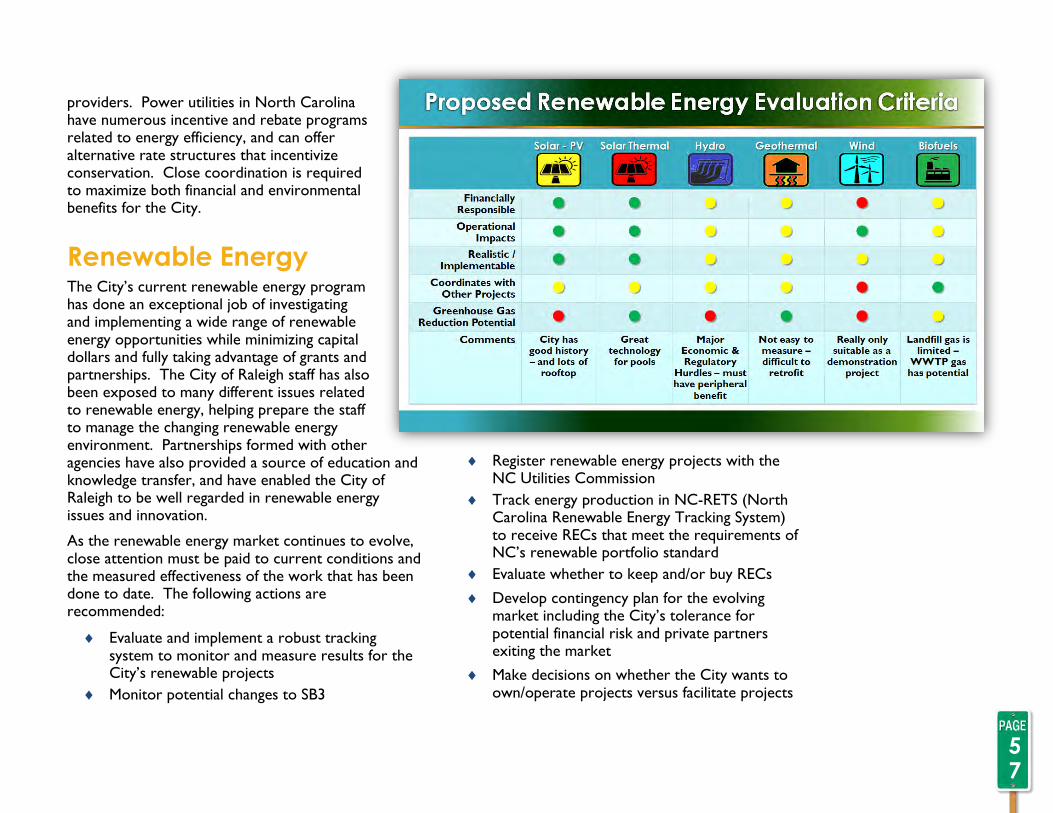
providers. Power utilities in North Carolina have numerous incentive and rebate programs related to energy efficiency, and can offer alternative rate structures that incentivize conservation. Close coordination is required to maximize both financial and environmental benefits for the City.
Renewable Energy The City’s current renewable energy program has done an exceptional job of investigating and implementing a wide range of renewable energy opportunities while minimizing capital dollars and fully taking advantage of grants and partnerships. The City of Raleigh staff has also been exposed to many different issues related to renewable energy, helping prepare the staff to manage the changing renewable energy environment. Partnerships formed with other agencies have also provided a source of education and knowledge transfer, and have enabled the City of Raleigh to be well regarded in renewable energy issues and innovation.
As the renewable energy market continues to evolve, close attention must be paid to current conditions and the measured effectiveness of the work that has been done to date. The following actions are recommended:
Evaluate and implement a robust tracking system to monitor and measure results for the City’s renewable projects
Monitor potential changes to SB3
Register renewable energy projects with the NC Utilities Commission
Track energy production in NC-RETS (North Carolina Renewable Energy Tracking System) to receive RECs that meet the requirements of NC’s renewable portfolio standard
Evaluate whether to keep and/or buy RECs
Develop contingency plan for the evolving market including the City’s tolerance for potential financial risk and private partners exiting the market
Make decisions on whether the City wants to own/operate projects versus facilitate projects
57
Utilize the same criteria and prioritization tools used in the CEAP development process to evaluate potential projects
Develop a Renewable Energy Action Plan.
City-wide Energy Assurance The City of Raleigh has established a Local Energy Assurance Plan (LEAP) as a municipal planning initiative to prepare for and become more resilient against energy assurance threats and disasters. The Plan serves as a comprehensive framework dedicated
to the preparation, response, and recovery for local energy disruptions. Raleigh is a unique
city as it encounters many different types of man-made and natural disasters.
With an ever-growing population and increasing interdependencies,
the City must be prepared for disasters which could halt
city functions, specifically fuel scarcities.
LEAP aids in the mitigation of
energy-related disasters by establishing
City of Raleigh’s expectations and
interdependencies during energy emergencies. This involves
enhancing the City’s response to energy shortages as well as identifying
areas for improvement.
Specifically, the goals of LEAP are to:
Understand interrelationships and interdependencies between energy sources
Identify opportunities to better prepare for energy disruptions
Reduce threats for energy emergencies
Increase the City of Raleigh’s access to reliable energy
Mitigate the severity and duration of energy emergencies
Develop a comprehensive fuel strategy
The Local Energy Assurance Plan outlines broad energy profiles and City responsibilities to be utilized in conducting mitigation, prevention, preparedness, protection, response, and recovery operations in the event of an energy disruption. Additionally, it is dedicated to the integration of renewables into emergency response planning. LEAP is designed to give the City an accurate understanding of its energy usage and interdependencies, as well as its opportunities to optimize energy resources.
City-wide Energy and Carbon Reductions The City of Raleigh has also completed a community-wide Greenhouse Gas Emissions Inventory. This inventory is available under separate cover on the City of Raleigh website. The report will be the baseline for the community-wide energy and carbon reduction program.
There are many next steps in the implementation of the Roadmap to Raleigh’s Energy Future. The direction
is now set and the transformative
change has begun.
58

Volume One – Project ReportThis volume describes the details of the core process, people, and tools that were utilized to develop the CEAP. The information is presented primarily in
chronological order, supplemented by Appendices such as the Renewable Energy Project Inventory and a complete copy of the Project Charter.
Volume Two – Business Case Evaluations
This volume includes the complete report of the two Business Case Evaluations (BCEs) that were performed with the Finance Team as part of the CEAP.
The process used to develop the BCEs is described in this volume and can serve as a model for the City to perform similar evaluations for other strategies.
Volume Three – Fleet Transformation Strategy
This volume provides background information and a list of data needs to develop a decision support system to
implement one of the Fleet Team’s highly ranked strategies, “Increase City Fleet Alternative Fuel Vehicles”.
Volume Four – Future Data Collection Tool
This volume provides an assessment and recommendations for obtaining the information needed to track, document and report advances
in energy effi ciency and reductions in GHG emissions as strategies are implemented. Currently no formal systems or methods are in place;
this information should be gathered and reported in a uniform manner to effectively identify trends and accurately report the City’s achievements.
Volume Five – Baseline Emissions Inventory for Solid Waste
This volume presents a baseline greenhouse gas (GHG) emissions inventory for the disposal of the City’s solid waste in Wake County landfi lls for the
baseline year of 2007, as well as for 2010. While Wake County has operational control over disposal activities, the City can directly infl uence the
volume of solid waste through policy decisions, education, and selection of services offered to the community such as recycling and composting.
SUSTAINABLERaleigh
A Roadmap to Raleigh’s Energy Future
Technical Documentation
City of Raleigh Climate/Energy Action Plan

Printed on 100% Post-Consumer Recycled Paper