
A REVIEW OF Dvortextools.com/VtxTechnicalReports/SWPSC_2007_Review_DOE_Test… · Since this novel...
15
A REVIEW OF D.O.E. TESTING OF VORTEXFLOW TECHNOLOGY FOR PETROLEUM & NATURAL GAS PRODUCTION AND OPERATIONS Norman W. Hein, Jr. VortexFLOW, LLC ABSTRACT New, patented technology developments on forming spiral flow in surface flowlines and pipelines as well as in downhole applications to extend critical flow have been tested in a variety of programs by the Department of Energy (D. O. E.) in association with the Stripper Well Consortium, Universities, and the Rocky Mountain Oilfield Testing Center (RMOTC). This paper provides a summary of these tests conducted from 2002 through 2006. Testing covers artificial lift applications to extend the flowing life of gas wells and lowering the critical flow requirements to unload wells. Additionally, tests were performed to evaluate the tools effectiveness on mitigating paraffin and line freezing, as well as removing stagnant fluids and preventing the associated corrosion problems. Finally, future testing of the various devices at the new test lab and headquarters facilities will be discussed. BACKGROUND Spiral, helical, or vortex flows are not new. Mother Nature uses this flow regime as the ‘preferred’ technique for moving fluids. Figures 1 and 2 show helical or spiral flow examples that include Catarina’s hurricane forces and the red spot on Jupiter. Every day one may see spiral flow with the swirl of water going down a drain. Harnessing and/or generating a helical flow may be useful for transporting fluids, especially if applied to petroleum and natural gas operations. Method and apparatus for developing spiral flow by man was covered in U.S. Patent 6,155,751 by Lane and Prince 1 in 2000. This method was originally developed for conveying particulate material through a conduit using air. This technology was exclusively licensed from Ecotech Systems International, Ltd. (which later became Ecotechnology, Ltd.) by VortexFLOW, LLC in 2001 to cover all related oil and gas applications. The technology was further expanded by U. S. Patent 6,659,118 by Lane, Prince and Miller 2 in 2003. This patent covered the method and system for conveying flowable material through a conduit by surrounding the material with a boundary layer. U. S. Patent 6,749,374 B1 3 , issued June 15, 2004, was a continuation of the original Lane and Prince Patent. Recently, new technology for creating a vortex chamber for vertical and/or horizontal flow for oil & gas production or transportation was issued in U. S. Patent 7,160,024 by Dougherty, Fehn, and Smith 4 in 2007. Since this novel technology had application for both surface and downhole production and operations, a variety of tools were developed. Testing of these tools in both lab and field trials were conducted to determine whether the tools worked or not, under what conditions the tools provided benefits, and what improvements could be made to optimize the tools performance and/or solve operating problems found during the testing. These results follow. TESTING PROGRAMS W/DOE Six different contract programs were developed through the DOE. All but one of these were subcontracted through the Penn State Stripper Well Consortium (SWC) with one University and four different operating company partners in these field tests. One additional program was conducted by the DOE through RMOTC. A summary of the six main contracts, the subcontracts, the year(s) of the tests, the subject, the major scope, the partner and a summary of the test results are shown in Table I. The details of the tests are discussed in each of the following subsections. DOWNHOLE GRANT AT TEXAS A&M The first tests of the vortex technology for oil and gas applications were performed in 2002. The scope of the DOE and SWC grant was divided into two phases. The first was to test in a controlled, laboratory environment, prototype tools extending the original Ecotechnology patents from horizontal to vertical orientation. The second phase was to test the best prototype design with a longer vertical length. The summary report was written in December 2003. 5
Transcript of A REVIEW OF Dvortextools.com/VtxTechnicalReports/SWPSC_2007_Review_DOE_Test… · Since this novel...

A REVIEW OF D.O.E. TESTING OF VORTEXFLOW TECHNOLOGY FOR PETROLEUM & NATURAL GAS
PRODUCTION AND OPERATIONS
Norman W. Hein, Jr. VortexFLOW, LLC
ABSTRACT New, patented technology developments on forming spiral flow in surface flowlines and pipelines as well as in downhole applications to extend critical flow have been tested in a variety of programs by the Department of Energy (D. O. E.) in association with the Stripper Well Consortium, Universities, and the Rocky Mountain Oilfield Testing Center (RMOTC). This paper provides a summary of these tests conducted from 2002 through 2006. Testing covers artificial lift applications to extend the flowing life of gas wells and lowering the critical flow requirements to unload wells. Additionally, tests were performed to evaluate the tools effectiveness on mitigating paraffin and line freezing, as well as removing stagnant fluids and preventing the associated corrosion problems. Finally, future testing of the various devices at the new test lab and headquarters facilities will be discussed. BACKGROUNDSpiral, helical, or vortex flows are not new. Mother Nature uses this flow regime as the ‘preferred’ technique for moving fluids. Figures 1 and 2 show helical or spiral flow examples that include Catarina’s hurricane forces and the red spot on Jupiter. Every day one may see spiral flow with the swirl of water going down a drain. Harnessing and/or generating a helical flow may be useful for transporting fluids, especially if applied to petroleum and natural gas operations. Method and apparatus for developing spiral flow by man was covered in U.S. Patent 6,155,751 by Lane and Prince1
in 2000. This method was originally developed for conveying particulate material through a conduit using air. This technology was exclusively licensed from Ecotech Systems International, Ltd. (which later became Ecotechnology, Ltd.) by VortexFLOW, LLC in 2001 to cover all related oil and gas applications. The technology was further expanded by U. S. Patent 6,659,118 by Lane, Prince and Miller2 in 2003. This patent covered the method and system for conveying flowable material through a conduit by surrounding the material with a boundary layer. U. S. Patent 6,749,374 B13, issued June 15, 2004, was a continuation of the original Lane and Prince Patent. Recently, new technology for creating a vortex chamber for vertical and/or horizontal flow for oil & gas production or transportation was issued in U. S. Patent 7,160,024 by Dougherty, Fehn, and Smith4 in 2007. Since this novel technology had application for both surface and downhole production and operations, a variety of tools were developed. Testing of these tools in both lab and field trials were conducted to determine whether the tools worked or not, under what conditions the tools provided benefits, and what improvements could be made to optimize the tools performance and/or solve operating problems found during the testing. These results follow. TESTING PROGRAMS W/DOE Six different contract programs were developed through the DOE. All but one of these were subcontracted through the Penn State Stripper Well Consortium (SWC) with one University and four different operating company partners in these field tests. One additional program was conducted by the DOE through RMOTC. A summary of the six main contracts, the subcontracts, the year(s) of the tests, the subject, the major scope, the partner and a summary of the test results are shown in Table I. The details of the tests are discussed in each of the following subsections. DOWNHOLE GRANT AT TEXAS A&M The first tests of the vortex technology for oil and gas applications were performed in 2002. The scope of the DOE and SWC grant was divided into two phases. The first was to test in a controlled, laboratory environment, prototype tools extending the original Ecotechnology patents from horizontal to vertical orientation. The second phase was to test the best prototype design with a longer vertical length. The summary report was written in December 2003.5
Original lab tests were performed in 2-inch, 125 feet long, clear PVC pipe. Normal pipe flow was compared to the flow with the tool present. Pressures of 10, 20, and 30 psi were used to test various configurations and numbers of inlets, fins, lengths, etc. with fresh water and compressed air injected into the system. The results showed the tool changed the flow pattern in the pipe providing improved liquid unloading along with a decrease in tubing pressure loss. The optimized tool also lowered the minimum lift velocity required for liquid unloading by 17%. Figure 3 provides a copy of the graph from the thesis and SPE paper 841366 showing the effect of pressure for the operating window at 10 psi. Figure 4 shows the minimum unloading performance of the best tool tested compared to the expected Turner and Coleman critical unloading response from the thesis and SPE paper. The second phase tests at Texas A&M were conducted by Kartik Ramachandran. He conducted tests at the Multiphase Field Laboratory located outside College Station at the Riverside Campus and reported the results in July 2003.7 The best prototype downhole tool from the first phase of testing was run at the end of 1258 feet of 2 3/8-inch J-55 tubing (4.7 #/ft). The tubing was hung in a tubing hanger that was located about 10 feet above the ground. The tool performance was tested using fixed volumes of water (10 gallons fresh water) and varying the surface wellhead pressure from 25 to 55 psi. The results showed at the 25 psi test the Turner equation would require a minimum lift velocity of 49 ft/sec which corresponded to a flow rate of 201 mcfpd. When 10 gallons of water were injected, the critical flow rate with the tool turned out to be only 110 mcfpd. The tool proved relatively more effective at higher pressures. GATHERING GRANT WITH CABOT OIL & GAS This test was conducted using 11 different surface VortexFLOW tools and tested the hypothesis that by reducing surface flowline pressure, the backpressure on the reservoir will be reduced and the production from a well will be increased. Standard 2”, 4” or 6” SX units were placed in flowlines after additional feeder lines entered the Cabot Oil & Gas gathering system located in the Appalachian Basin in Wayne County, West Virginia,. Table II shows the installations locations, the tool sizes, the flow rates and the distance from the amine plant. Flow rates were measured at strategic points in the gathering system and were typically at one of the following four positions:
• Placed just after feeder lines entered the gathering system. • Installed in long, straight runs of over 1,500 ft. with no feeder line interruptions. • All drips downstream of tools were removed. • Tools put at low elevation sites versus higher elevation sites.
Table III shows the installation average pressures for four weeks before the tool installations and eight weeks after. Also shown are the change in pressure (mislabeled in the original table) and the percentage change (pressure drop) after eight weeks. The results showed that the tools were effective in lowering pressure at all locations and assured that accumulated fluids were swept downstream to points in the system where these could be collected. This effectively prevented stagnant fluids and the need for drip systems. While the pressure reductions were observed, there was not the increased production originally theorized. This was attributed to the formations being very tight and not responding sufficiently to the lower pressures. FLOWLINE GRANT WITH BELDEN & BLAKE This project investigated the installation of 22 VortexFLOW surface SX tools in flowlines in the Michigan Basin (12 wells in the grant) and the Appalachian basin (7 wells in the grant plus 3 wells not in the grant) of fields operated by Belden and Blake. This test also assumed that by moving accumulated fluids downstream or by improving the overall flow regime, there would be an effective system pressure drop that would cause lower reservoir backpressure. Reducing the backpressure on the wells should result in increased production. The operating pressures of the Michigan wells were 1 to 15 psi with gas production of 50 to 80 mcfpd. The Michigan wells were in the Antrim Shale and water was rod pumped up the tubing while gas was produced up the annulus. Flowlines were 2-inch and approximated 500 to 8,000 feet long. The production from the 12 wells was from a pod and single well production data were not available. The operating pressures of the Appalachian wells were 50 to 150 psi with gas production of 10 to 125 mcfpd. The Appalachian basin formation type was not recorded; however, all these wells were flowing from two to seven years

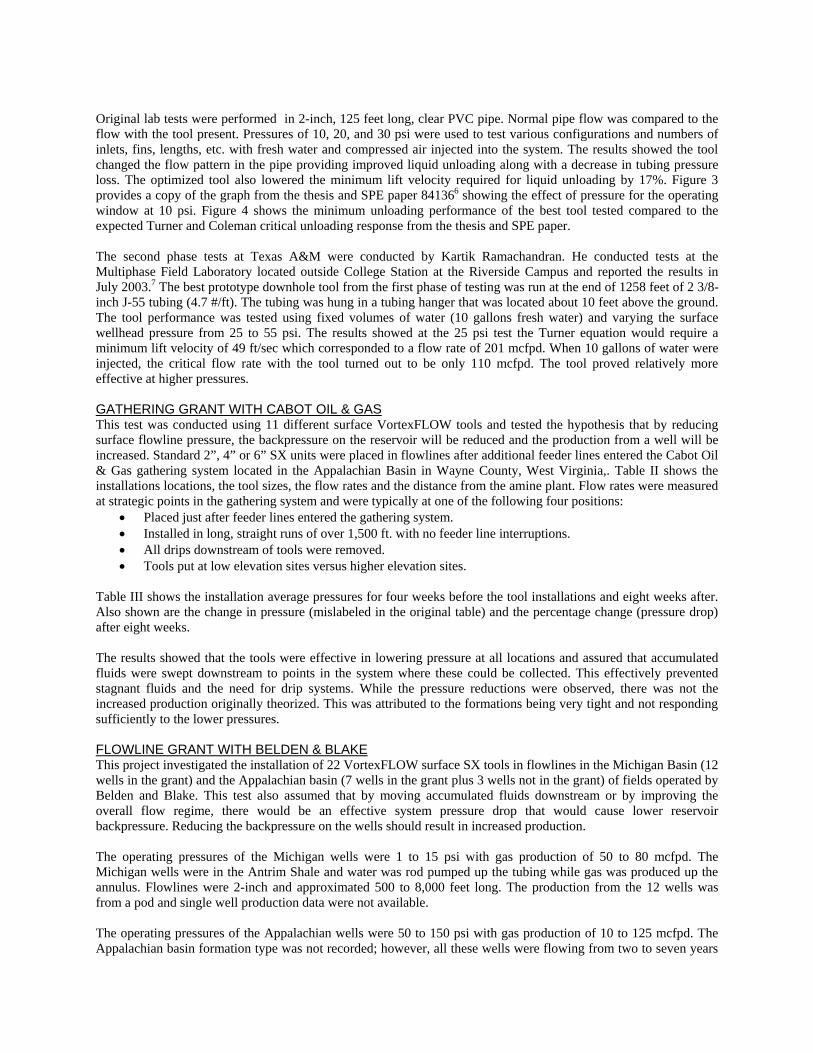
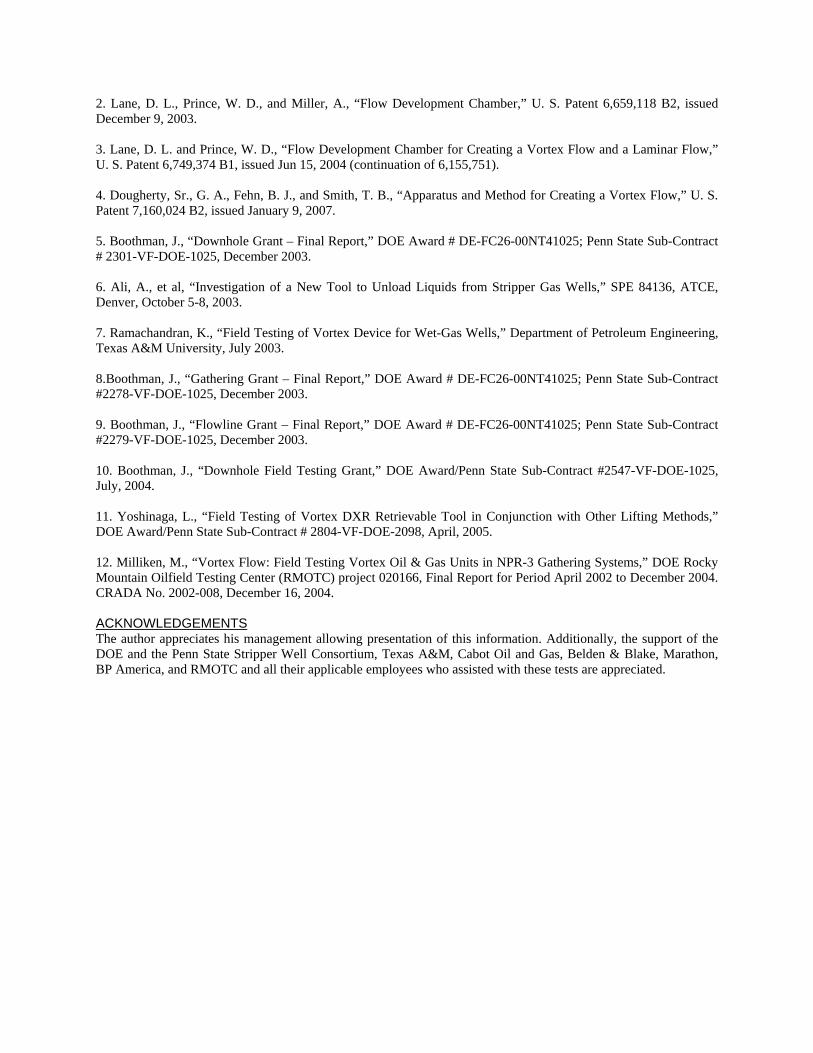
with flowlines of 2, 2.5, or 3-inch and lengths from 500 to 2000 feet long. The data from these 10 wells were analyzed individually. Agreed decline curves and related production were obtained for the group of Michigan wells or the individual Appalachian basin wells over a five month period after tool installation. Figure 5 shows the gas production from the 12 Michigan Basin wells. The results show the tools arrested the decline on these wells while increasing production approximately 5%. Table IV shows the actual average production (by month or day) for the 10 Appalachian wells with the 5 month average decline curve predicted total production along with the actual 5 month total production after the tools were installed and the percentage increase in production. These tools were effective in all wells raising production from 53 to approximately 3,174 mcfpd (a 1.65% to over 48% increase). DOWNHOLE FIELD TEST WITH MARATHON This was a follow-up project to the Texas A&M tests where tools were installed in actual production wells. The objective of this project was to see if the downhole tools could replace progressing cavity pumps (PCPs) and/or electric submersible pumps (ESPs) on coal bed methane wells being produced by Marathon in the Powder River Basin, Wyoming. Also investigated was the tools ability to increase production in flowing wells. The wells were completed with 7-inch casing and 2-3/8-inch tubing. The known details of the seven test wells are shown in Table V. This table shows the date the downhole DX tools were installed, the well depth, the casing and tubing pressure along with the existing gas and water rates. It should be noted that the Spell 8-31-A showed no water or gas production even thought it was producing with an ESP but it had been gas locked for almost one-month prior to the tool installation. Either 4-inch or 5-inch outside diameter tools were threaded on to the 2-3/8-inch tubing. Well West 5-23 was producing approximately 190 mcfpd and 60 bwpd on PCP prior to the tool installation but production was erratic due to the pumping of the well. After tool installation, water and gas production increased and the overall gas production stabilized during the 6 month test period. These data are shown in Figure 6. Well Spell 12-32A was producing 120 mcfpd and ~122 bwpd prior to tool installation. Production was on ESP and the prior year’s production varied from 60 to 150 mcfpd and 30 to 200 bwpd. After installing the VortexFLOW DX tool, water and gas production rates stabilized. Water production was ~133 bwpd while the gas increased to ~190 mcfpd. The well continued to flow, without the need to pump the well, during the 4 month test period. These data are shown in Figure 7. Well Spell 8-31A was producing water up the annulus which caused problems for the gas measurement system as well as putting water into the gas flowline. Also, the water sometimes did not make it completely to the surface and fell back pushing gas into the downhole ESP. This caused the pump to gas lock and usually resulted in a failure. After DX tool installation, the well flowed continuously without the need for ESP pumping. Figure 8 shows the production data from this well. The North Barker well was on ESP and producing approximately 120 mcfpd and 20 bwpd. Initially, a 5-inch DX tool was installed and production fell to 80 mcfpd. The 5-inch DX tool was pulled and a 4-inch OD tool was installed. The change did not affect gas rate, but, water production fell to virtually 0. While the post installation rates were below the preinstallation rates, it appears the 85 psi bottom hole pressure was not sufficient to keep the well flowing and unload the minimum of 50 bwpd required to stay unloaded. Oriva Hills 1 well was flowing ~60 mcfpd with no water using an ESP. After tool installation, gas rates stabilized at ~60 mcfpd; however, over several months, gas rate increased to 70 mcfpd. The lack of measurable produced water in the well limited the impact of the DX tool. With bottomhole pressure of only 30 psi and surface pressure of 22 psi, there probably was insufficient pressure to lift liquid even with the DX tool in place. Custer 12 C well was flowing approximately 200 mcfpd with a small amount (less than 1 bpd) of oil and water. Upon installation of the DX tool the well maintained flow for a longer period without logging off. While the well was not able to flow 24 hours per day, production increased approximately 20% over the 6 months of the test. Spell 12-34 well had experiments carried out to test the effect of wellhead pressure on production rates for flowing wells. Table VI shows the three different data points where changes were made and the resulting gas producing rate,

water rate, calculated gas velocity and the bwpd/mcfpd ratios. These data also are plotted in Figure 9. This shows that as casing pressure and well head pressure decreased, gas and water production increased as well as the associated gas velocity and the ratio of bwpd/mcfpd. These rates and gas velocities were compared to the calculated velocities for annular flow and Turner or Coleman critical unloading criteria. With the DX tool installed, this well was able to produce 266 bwpd with a gas rate of only 100 mcfpd. The summary results from these tests illustrate that downhole pumps may be replaced if the well conditions allow sustained flowing, especially with assistance of a VortexFLOW tool. The key variable was bottomhole pressure which needs to be at a minimum equal to the pressure to support the weight of the fluid column in the tubing. Replacing the pumps would be an operational savings due to electrical power savings and reduced maintenance expenses especially from not paying for pump failures. Additionally, the tools appeared to increase production in flowing wells, even with a velocity below the typical 14 ft/sec normally required to unload wells. FIELD TESTING OF VORTEX DXR RETRIEVABLE TOOL IN CONJUNCTION WITH OTHER LIFT METHODS WITH BP Downhole tests at Texas A&M and then with Marathon showed promise of the VortexFLOW technology improving production and/or lowering costs. However, these tests required a workover to be performed and tubing pulled in order for the DX tools to be installed. It was suggested in the university work and from discussions with operators that a wireline/slickline insertable and retrievable tool that had the same capabilities to change flow would be less expensive to install and more attractive to operations. Additionally, it was theorized that this type tool could provide added benefit to other artificial lift methods used for gas wells such as surfactants/soap, plunger lift and/or velocity strings. The scope of this project was to test the DXR tool in 12 Carthage Field gas wells in East Texas operated by BP America. Most of the wells had the new DXR tools installed while two wells had standard thread-on DX tools installed. Table VII shows a summary of the wells, dates tools were installed, pre and post production rates (when these data were available) along with the results from these tests. A summary of the results shows that:
• Price 8, Price 11, Jones 1, and Price 12 showed the tools were effective with automated foamers and enabled a significant reduction (up to 50%) in the required surfactant volume.
• GCU 12-2 and Burnet Bros 22 CV showed that the tools, in conjunction with pad or Pacemaker plungers, lowered the flowing bottomhole pressure.
• Hicks 7 showed the tool improved production when just the pad plunger was installed, lifting more water during the after-flow period and extending the flowing portion of the plunger on cycle.
• GCU 13-13 showed the tool reduced liquid loading while increasing gas production and extending the flowing life.
• Wilcher and Brown 7 showed that these rapid declining wells could benefit from a DXR with intermitter combination.
• 2 installations were not successful (Galespie and GCU 9-7). It is uncertain why these wells did not respond since the study was terminated before sufficient data could be collected.
ROCKY MOUNTAIN OILFIELD TESTING CENTER (RMOTC) Testing at this DOE supported production facility started in April 2002 and continued through December 2004.12 There was a two year restriction on disclosing these results until December 2006. Thus, this is the first time that results have been summarized and provided to the industry. Two testing phases were conducted at RMOTC. The first test was to determine the effect of VortexFLOW tools on single and two-phase high-liquid volume wells and to evaluate the ability to mitigate line freezing by using a surface SX tool. The second phase test objective was to develop a surface flowline tool to mitigate paraffin in the flowline. Figure 10 shows a summary of all the tests and the respective well these tests were conducted along with the schedule of the tests. Results of the 2”, 3” and 4” SX units on high flow rate (up to 4200 bwpd) flowlines demonstrated the need for better sizing or different designs. Improved flow efficiencies were recorded with the SX tool size increased. When the

larger units were tested they showed less than 5 psi pressure drop. It was recommended that 6” or larger tools be tested. Results of the paraffin testing confirmed the tool’s ability to decrease paraffin buildup in gathering lines. The original design installed on a rod pumped well is shown in Figure 11. This is installed in place of the 90 elbow in the flowline before the flowline is connected to the buried line. After digging up and cutting the line two times to check on deposition, a flanged spool test piece was installed as shown in Figure 12. The standard 2” SX tool performed adequately until the well was treated with hot water. When this occurred, the SX unit was plated with excess paraffin. A new design was developed with a flanged fitting on the tool end to allow removal and cleaning of the internal bluff body. This new design proved successful and is now marketed as the SX-P (paraffin) tool. Figure 14 shows the internal bluff body, after removal, showing the spiral orientation of the paraffin on the body. During the testing of the unit on two wells, the flowline pressure remained lower than the line even after a hot water treatment. These pressure data are shown in Figure 15. Historically the flowlines were treated every two weeks. However, the tools performed for over 60 days test period without the need for any flowline treatments. A special clear Plexiglas viewing line, installed to investigate the effectiveness of different designs, showed the ability for the units to mobilize water and mitigate ice formation. The most successful design was the longest in-line (SXI) tool. The least efficient design proved to be a 90o domed SX tool designed for higher pressure applications. A test of the SXI tool demonstrated the ability to sweep the line and minimize freezing in a 5,400 foot long gathering line. CONCLUSIONS 1. Various surface tools have been tested and successfully showed the ability to mitigate paraffin, prevent line freezing, and prevent stagnant fluid (and the related corrosion) from occurring in line lengths up to 8,000 ft. 2. When SX tools were installed in flowlines directly attached to wells, gas production increased from about 2 to 48% due to lower flowline pressures and decreased well back pressure when the reservoir was responsive. 3. The original translation of the surface tools to downhole tools and testing of the DX (threaded, in-line) tool showed the ability to form a vertical spiral, lower critical flow rate requirements up to 50% below Coleman, and proved to be effective at a length up to 1200 feet. 4. Field tests of the DX tool showed the ability to increase production on flowing wells and possibly replace PCP and/or ESPs when the wells had the potential to flow. 5. Field testing of the wireline/slickline insertable and retrievable DXR downhole tools in conjunction with other artificial lift techniques showed the ability to lower surfactant requirements up to 50%, aid both pad and two piece plunger to be more efficient and increase production, replace a plunger, and increase production when combined with an intermitter. 6. Field testing of two DXR wells was not successful in the Carthage field. The study was terminated without determining the cause. RECOMMENDATIONS 1. Future testing is recommended on larger tools for higher rate flowline volumes. 2. Controlled testing of the various surface and downhole tools is being conducted to develop the full range of flow and pressure successful operation. 3. Results of new laboratory tests will be combined with state-of-the-art computational fluid dynamics (CFD) analysis and translation to higher pressure and flow rated. REFERENCES1. Lane, D. L, and Prince, W. D., “Flow Development Chamber for Creating a Vortex Flow and a Laminar Flow,” U. S. Patent 6,155,751, issued December 5, 2000.
2. Lane, D. L., Prince, W. D., and Miller, A., “Flow Development Chamber,” U. S. Patent 6,659,118 B2, issued December 9, 2003. 3. Lane, D. L. and Prince, W. D., “Flow Development Chamber for Creating a Vortex Flow and a Laminar Flow,” U. S. Patent 6,749,374 B1, issued Jun 15, 2004 (continuation of 6,155,751). 4. Dougherty, Sr., G. A., Fehn, B. J., and Smith, T. B., “Apparatus and Method for Creating a Vortex Flow,” U. S. Patent 7,160,024 B2, issued January 9, 2007. 5. Boothman, J., “Downhole Grant – Final Report,” DOE Award # DE-FC26-00NT41025; Penn State Sub-Contract # 2301-VF-DOE-1025, December 2003. 6. Ali, A., et al, “Investigation of a New Tool to Unload Liquids from Stripper Gas Wells,” SPE 84136, ATCE, Denver, October 5-8, 2003. 7. Ramachandran, K., “Field Testing of Vortex Device for Wet-Gas Wells,” Department of Petroleum Engineering, Texas A&M University, July 2003. 8.Boothman, J., “Gathering Grant – Final Report,” DOE Award # DE-FC26-00NT41025; Penn State Sub-Contract #2278-VF-DOE-1025, December 2003. 9. Boothman, J., “Flowline Grant – Final Report,” DOE Award # DE-FC26-00NT41025; Penn State Sub-Contract #2279-VF-DOE-1025, December 2003. 10. Boothman, J., “Downhole Field Testing Grant,” DOE Award/Penn State Sub-Contract #2547-VF-DOE-1025, July, 2004. 11. Yoshinaga, L., “Field Testing of Vortex DXR Retrievable Tool in Conjunction with Other Lifting Methods,” DOE Award/Penn State Sub-Contract # 2804-VF-DOE-2098, April, 2005. 12. Milliken, M., “Vortex Flow: Field Testing Vortex Oil & Gas Units in NPR-3 Gathering Systems,” DOE Rocky Mountain Oilfield Testing Center (RMOTC) project 020166, Final Report for Period April 2002 to December 2004. CRADA No. 2002-008, December 16, 2004. ACKNOWLEDGEMENTSThe author appreciates his management allowing presentation of this information. Additionally, the support of the DOE and the Penn State Stripper Well Consortium, Texas A&M, Cabot Oil and Gas, Belden & Blake, Marathon, BP America, and RMOTC and all their applicable employees who assisted with these tests are appreciated.

Table I Summary of DOE and Penn State Stripper Well Consortium Testing of Various VortexFLOW Devices
DOE Award
Number Penn State
Sub-Contract Subject Scope Research Partner Summary Results
DE-FC26-00NT41025
2301-VF-DOE-1025-2002
Downhole Grant Test downhole prototypes
Texas A&M
Ahsan Ali Master Thesis; SPE 84136, 2003
Test best prototype 1200' well Texas A&M Kartik Ramachandran report
DE-FC26-00NT41025
2278-VF-DOE-1025-2002
Gathering Grant Install 11 SX tools
Cabot Oil & Gas
Average 7.1% drop from all wells/taps
DE-FC26-00NT41025
2279-VF-DOE-1025-2002
Flowline Grant
Install 19 SX (12 Mi; 10 (7 in grant) Appalachia)
Belden & Blake
Q increase ~5% Mi avg.; 2 to 48% inc. App.
2547-VF-DOE-1025-2003
Downhole Field Test
Install DX 7 wells; replace ESP, PCP, & increase Q Marathon
PCP & ESP rates stable; flatter decline
Increase production on flowing gas wells
Lifted 266 BWPD w/100 mcfpd
2804-VF-DOE-2098-2004
DXR Tests w/Others
Install DXR 12 wells in conjunction other lift methods
BP America
4 wells 50% decrease foam, 2 wells lower FBHP
w/plungers, 1 well replace plunger, 1 improved
pad production, 1 well increase flowing,
1 well, increase production w/intermitter
2 not successful; but study terminated w/o why
DOERMOTC-020166
2004 (not release to 2006)
Field test in cold
Test SX high water rate, optimize 2 phase, mitigate RMOTC
Hi rate at first increase pressure, larger tool
freezing & mitigate paraffin w/ SX-P development
lowered pressure; paraffin coated SX tool;
redesigned SXP pressure drop, no hot oil >60d
tests on SXI design showed no line freezing
except when -45 degrees
TABLE 2 Schedule of Installation Sites for Cabot Oil & Gas (ref. 8)

TABLE 3 Pressure Difference from Installation Point to Amine Plant
for Cabot Oil & Gas (ref. 8)
TABLE 4
Results of 10 VortexFLOW SX Tools in Appalachian Basin (ref. 9)

TABLE 5 Well Details for Marathon Powder River Basin Wells with VortexFLOW DX Tools (ref. 10)
TABLE 6 Results of Production of Spell 12-34 Well in Powder River Basis with VortexFLOW DX Tool Installed (ref.
10) These data are plotted in Figure 9.


Figure 1 - Catarina March 26, 2004 Figure 2 - Jupiter’s red spot is shown relative to Earth’s size
Figure 3 - Figure 6 from SPE 84136 Showing the Effect of Pressure on Operational Envelope at 10 psi. (ref.
6)
Figure 4 - Figure 8 from SPE 84136 Showing Critical Rate Comparison Note: w/o Tool Approximates
the Coleman Critical Criteria While with Tool is Approximately 17% Below Coleman. (ref. 6)
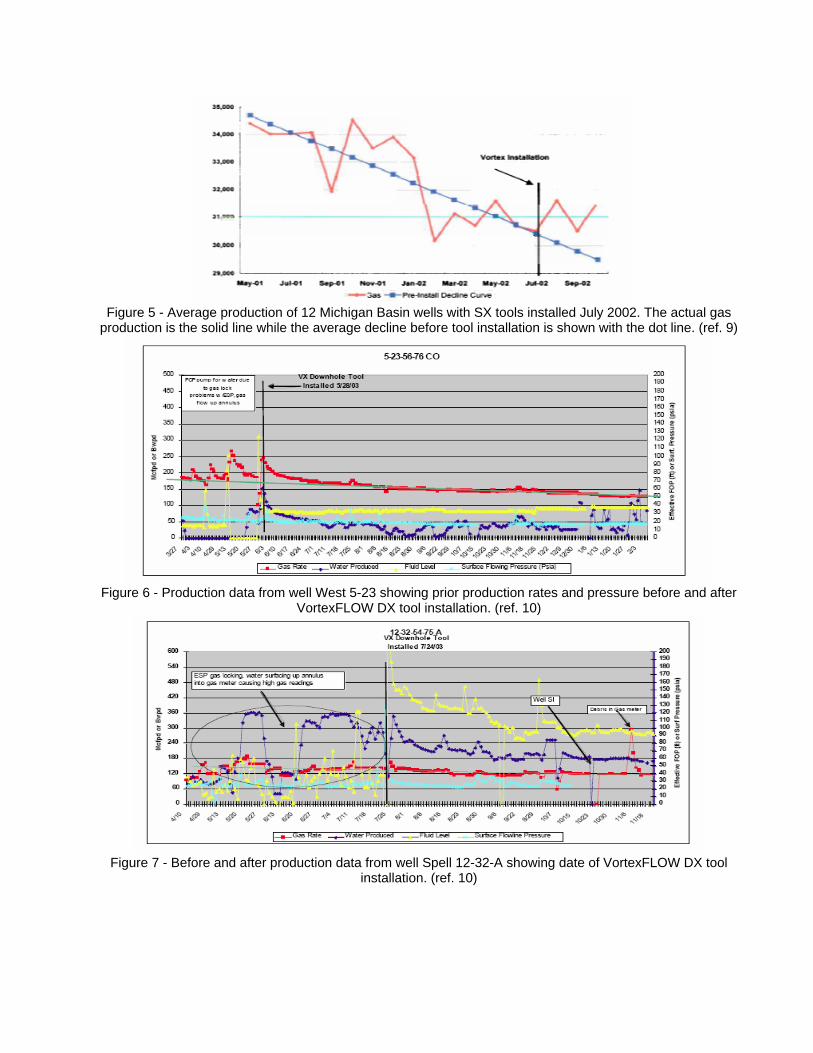
Figure 5 - Average production of 12 Michigan Basin wells with SX tools installed July 2002. The actual gas
production is the solid line while the average decline before tool installation is shown with the dot line. (ref. 9)
Figure 6 - Production data from well West 5-23 showing prior production rates and pressure before and after
VortexFLOW DX tool installation. (ref. 10)
Figure 7 - Before and after production data from well Spell 12-32-A showing date of VortexFLOW DX tool
installation. (ref. 10)
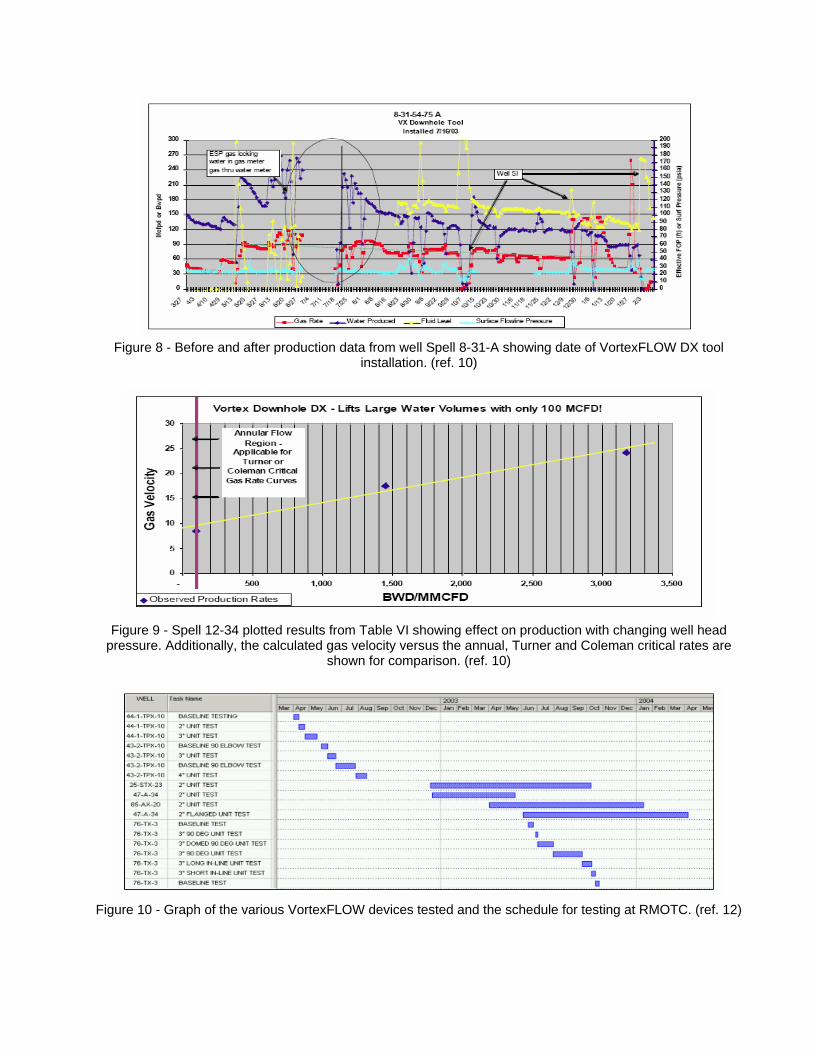
Figure 8 - Before and after production data from well Spell 8-31-A showing date of VortexFLOW DX tool
installation. (ref. 10)
Figure 9 - Spell 12-34 plotted results from Table VI showing effect on production with changing well head
pressure. Additionally, the calculated gas velocity versus the annual, Turner and Coleman critical rates are shown for comparison. (ref. 10)
Figure 10 - Graph of the various VortexFLOW devices tested and the schedule for testing at RMOTC. (ref. 12)

Figure 11 - Photo of the rod pumped 47-A-34 well with standard SX tool. (Ref. 12)
Figure 12 - RMOTC flanged flowline section to test for paraffin deposition. (ref. 12)

Figure 13 - New development of SX tool shows Figure 14 - Internal bluff body showing flanged back plate to aid in internal cleaning. spiral of paraffin deposit after downhole This new tool is now the SX-P for surface paraffin hot water treatment. (Ref. 12) mitigation. (Ref. 12)
Figure 15 - Plot comparing before and after installation of SXP tools and the flowline pressure showing little or
not line blockage even though the flowline was usually hot water treated every other week. (Ref. 12)


![Thyristor Three Phase, Six Pulse Controller[1]](https://static.fdocuments.us/doc/165x107/55cf8fa4550346703b9e4e24/thyristor-three-phase-six-pulse-controller1.jpg)


![A novel six-degrees-of-freedom series-parallel … · A novel six-degrees-of-freedom series-parallel manipulator ... Kutzbach criterion [19], is capable to realize six degrees of](https://static.fdocuments.us/doc/165x107/5b79f3c77f8b9a703b8ebdd5/a-novel-six-degrees-of-freedom-series-parallel-a-novel-six-degrees-of-freedom.jpg)
