A Review of Rental Housing with Tax Credits - Minnesota Housing
30
A Review of Rental Housing with Tax Credits A Review of Rental Housing with Tax Credits Summer 2013 Contents Contents
Transcript of A Review of Rental Housing with Tax Credits - Minnesota Housing

A Review of Rental Housing with Tax Credits
A Review of Rental Housing with Tax Credits
Summer 2013
Contents
Contents

Minnesota Housing Planning, Research & Evaluation
CONTENTS
Page
Summary 1 Introduction and Background 2 Data Notes 3 The Qualified Allocation Plan 3 The Need for Affordable Housing 5 Types of Units and Rents 7 Serving Targeted Populations 12 Conclusion 25 Appendix: Data Issues and Clarity 26
A Review of Rental Housing with Tax Credits
1
Summary
As of 2011, Minnesota Housing and suballocators in the state monitored nearly 34,000 units of rental housing with federal housing tax credits (HTC). Of these, Minnesota Housing monitored approximately 22,500 units in 574 developments and suballocators monitored nearly 11,500 units in 176 developments that are made more affordable through the allocation of federal housing tax credits to property owners. This report describes HTC housing and summarizes the basic characteristics of its tenants. Property owners report data to Minnesota Housing at initial occupancy of new units and for compliance monitoring purposes. A review of available data on HTC units and their tenants, reported to Minnesota Housing for 2011, shows that:
65.8 percent of all monitored HTC units are located in the Twin Cities and 34.2 percent in Greater Minnesota. Further analysis shows that the distribution of HTC housing units monitored in 2011 is similar to the estimated renter need for assistance in most regions of the state.
Census estimates of population and household size indicate that the distribution of HTC units by size reflects household needs. The greatest proportion of occupied HTC units reported had two bedrooms, followed by one-bedroom units; the Census estimates that 74.9 percent of lower-income renter households in Minnesota include only one or two people.
Housing with tax credits serves a relatively high percentage of families with children—47.4 percent of HTC households were families with children under the age of 18.
HTC units house a high proportion of households of color or Hispanic ethnicity. Of reporting HTC households, 44.3 percent were of color or Hispanic ethnicity. According to estimates from the Census Bureau’s American Community Survey, 2011, nearly 12 percent of householders in Minnesota (27.9 percent of lower-income renter households) were of color or Hispanic ethnicity.
Nearly three percent of HTC units were accessible to occupants with mobility impairments, a higher proportion than required by the State Building Code. A better match between accessible units and mobility impaired tenants could be achieved.
The greatest proportion of HTC households reporting (52.7 percent) had extremely low incomes as defined by the U.S. Department of Housing and Urban Development.
43.6 percent of HTC households benefitted from additional tenant or project-based housing assistance.

Minnesota Housing Planning, Research & Evaluation
2
Introduction and Background
The Housing Tax Credit (HTC) is a federal income tax credit for investors in the construction or acquisition with substantial rehabilitation of eligible rental housing. HTC has been significant in the development of new and the preservation of existing affordable housing for more than two decades—the U.S. Department of Housing and Urban Development (HUD) database of HTC housing includes information on more than 2.2 million units in more than 36,000 developments placed in service in the U.S. since 1987 (see http://lihtc.huduser.org/). The allocation of tax credits from the federal government is based upon a per capita formula that increases each year with the cost of living. The Minnesota Legislature has designated Minnesota Housing as the primary agency for allocating HTC within Minnesota. Tax credits are awarded in a competitive allocation process held each year concurrently with Minnesota Housing’s Consolidated Request for Proposals (RFP), which also awards first mortgages and gap funding for affordable housing projects. (Owners of tax-exempt bond deals may receive “non-capped” credits and do not compete in the RFP process, but must score a minimum number of points in the selection process and be financially feasible.) The Legislature also has authorized the cities of Duluth, Minneapolis, Rochester, Saint Cloud, and Saint Paul and the counties of Dakota and Washington to administer HTCs in their respective jurisdictions. Duluth, Rochester, and Saint Cloud have Minnesota Housing allocate their credits for them under joint powers suballocator agreements. Minneapolis, Saint Paul, Washington and Dakota County allocate their own credits. Minnesota Housing typically allocates approximately 70 percent of the annual of HTCs available to Minnesota (including joint powers suballocators). Minnesota Housing has provided affordable housing to lower-income households since 1974 using a variety of federal, state, and agency resources. HTC is only one of a number of important tools in this provision of affordable rental housing; however, at the request of housing advocates, this report only reviews HTC. In 2012, the Agency administered Housing Assistance payments for more than 30,000 Section 8 units; assisted more than 10,000 households with rent assistance or homelessness prevention resources; and provided first mortgage and/or gap funding for 2,300 new or substantially rehabilitated units of affordable housing (of which some received HTC and some did not). Abt Associates completed a study of HUD properties in August 2012.1 Researchers based the study on HUD’s database of units placed in service each year, HUD’s Public Housing Information Center database of units rented under the Housing Choice Voucher Program, and interviews with property owners/managers and syndicators. They found that most HTC properties reaching year 15 of their rent restrictions by the end of 2009 were still owned by the original developers and still maintained as affordable—either with HTC restrictions in place or with rents at or below maximum HTC levels. Properties built in 1990 or later appear to be at an even
1 Abt Associates, What Happens to Low-Income Housing Tax Credit Properties at Year 15 and Beyond? (U.S.
Department of Housing and Urban Development, August 2012).

A Review of Rental Housing with Tax Credits
3
lower risk of becoming unaffordable due to extended use restrictions. HTC rules require housing built prior to 1990 to meet income and rent restrictions for a minimum of 15 years and housing built in 1990 or later to meet income and rent restrictions for a minimum of 30 years.
Data Notes The Low Income Housing Tax Credit Program has enabled the construction or acquisition/ rehabilitation of roughly 39,000 units of affordable rental housing in Minnesota since 1987. Of these about 34,000 currently are being monitored (22,500 by Minnesota Housing and 11,500 by suballocators). In some analyses, this report assesses all 34,000 units. In other analyses, the assessment focuses on the households living in the monitored units. These tenant-focused assessments are based on roughly 21,800 households for which Minnesota Housing has tenant information—units with tax credits allocated by Minnesota Housing or tax credits allocated by suballocators that also have deferred funding from Minnesota Housing. These tenant-focused analyses exclude units with tax credits from suballocators that don’t have deferred funding from Minnesota Housing. They also exclude units where the property owner or manager failed to report tenant information to Minnesota Housing.
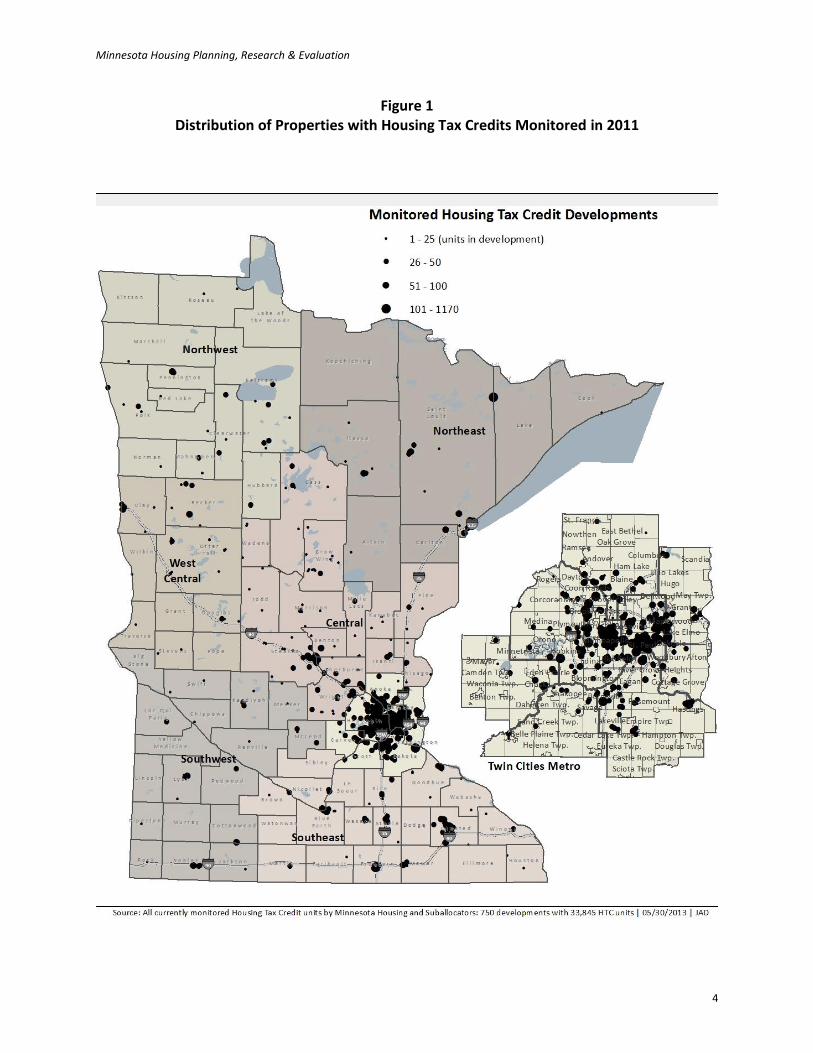
The Qualified Allocation Plan Section 42 of the Internal Revenue Code requires that each agency receiving an allocation of federal housing tax credits develop an allocation plan for the distribution of the tax credits within the jurisdiction. Each Qualified Allocation Plan (QAP) reflects the policies and priorities of the jurisdiction that promulgates it. Minnesota Housing’s QAP identifies selection criteria and priorities for affordable rental housing developed through a process that includes input from the general public and local stakeholders. Minnesota Housing’s QAP currently includes selection criteria that award points for economic integration, access to transit, preservation of existing federally assisted housing, supportive housing for people experiencing long-term homelessness, and other criteria. A copy of the current QAP is available at: http://www.mnhousing.gov/wcs/Satellite?c=Page&cid=1358905254471&pagename=External%2FPage%2FEXTStandardLayout Minnesota Housing historically has reviewed its allocation priorities annually and updated them as needed based on an examination of housing needs and available resources. A complete assessment of the state’s performance in meeting allocation priorities is beyond the scope of this analysis, particularly since those priorities change. Figure 1 shows a distribution of 33, 845 HTC units in 750 developments monitored by Minnesota Housing and suballocators in 2011.
Minnesota Housing Planning, Research & Evaluation
4
Figure 1 Distribution of Properties with Housing Tax Credits Monitored in 2011

A Review of Rental Housing with Tax Credits
5
The Need for Affordable Housing To what extent is HTC meeting the need for affordable housing in Minnesota, and are credits equitably distributed around the state to meet regional need?
The need for affordable housing is great—the Census Bureau estimates there are more than 500,000 lower-income, cost-burdened households in Minnesota as of 2011. (Lower-income cost-burdened households are defined here as having incomes less than $50,000 and paying more than 30 percent of income for rent.) With insufficient resources, HTCs fall short of meeting Minnesota’s need for affordable housing; however, the state is distributing available resources relatively equitably in relation to estimated need.
Minnesota Housing and suballocators in Minnesota have allocated an estimated 39,000 HTC units since 1987, some of which have reached the end of their compliance period and currently may or may not be considered affordable housing. As of 2011, Minnesota Housing and suballocators monitored nearly 34,000 units of HTC rental housing for compliance with federal IRS rules. Minnesota Housing monitored 22,499 of these HTC units in 574 multifamily rental housing developments throughout the state. Tax credit units comprised 90 percent of the total units in these developments; the remaining ten percent were at market rents. Suballocators monitored 11,355 HTC units in 176 developments. Tax credit units comprised 88 percent of the total units in suballocator developments. Figure 2 shows the regional distribution of 33,845 monitored HTC units and the distribution of Minnesota’s lower-income households that are housing cost burdened, which is a proxy for affordable housing need.

Minnesota Housing Planning, Research & Evaluation
6
Figure 2 Regional Share of Minnesota’s HTC Units Monitored and Regional Share of
Minnesota’s Estimated Need for Affordable Housing, 2011
Source: Minnesota Housing Compliance Monitoring files; American Community Survey 2007-2011, U.S. Department of Commerce, Bureau of the Census.
The distribution of all HTC housing units monitored in 2011 is similar to the estimated renter need for assistance in each region across the state. State statute establishes a formula for allocating credits between the Twin Cities and Greater Minnesota, which traditionally has provided for 62 percent of the credits to be allocated in the Twin Cities Metro area and 38 percent in Greater Minnesota.2 There is no formula for allocating credits across Greater Minnesota’s six regions.
2Minnesota Statutes 2012, section 462A.222, subdivision 1a.
0.0%
10.0%
20.0%
30.0%
40.0%
50.0%
60.0%
70.0%
% of Total MonitoredHTC Units
% of Low Income Cost-Burdened Householdsin Minnsota
A Review of Rental Housing with Tax Credits
7
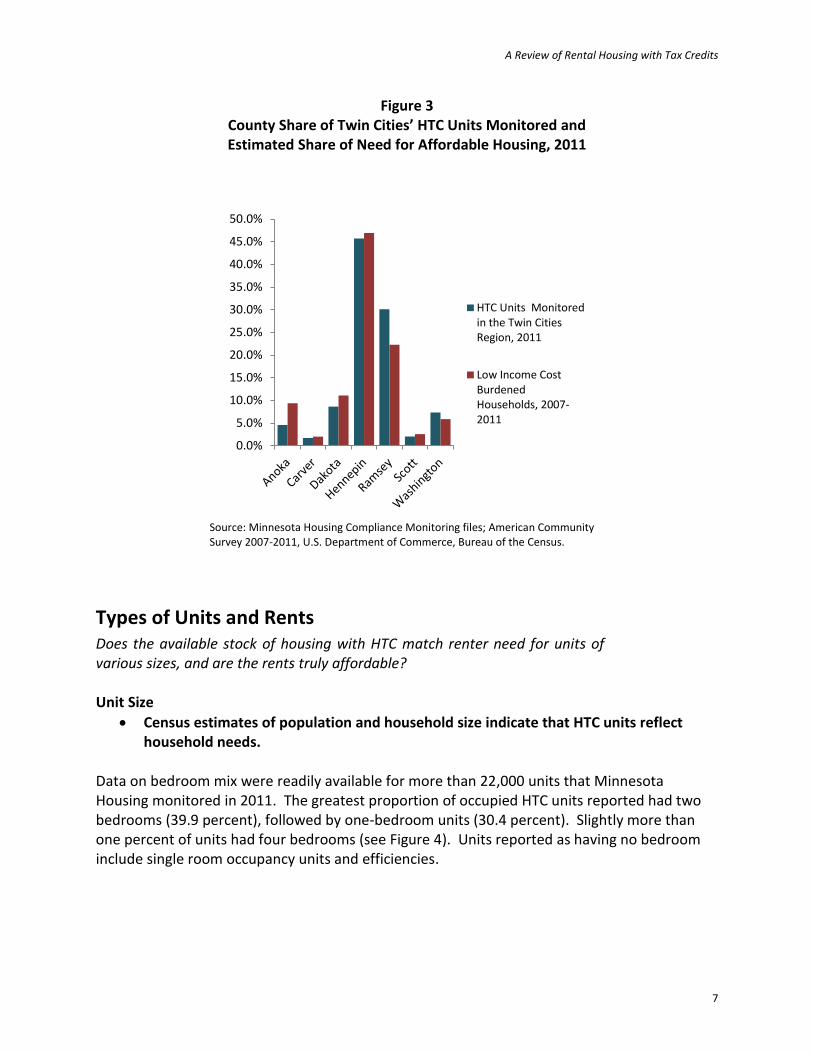
Figure 3 County Share of Twin Cities’ HTC Units Monitored and Estimated Share of Need for Affordable Housing, 2011
Source: Minnesota Housing Compliance Monitoring files; American Community Survey 2007-2011, U.S. Department of Commerce, Bureau of the Census.
Types of Units and Rents Does the available stock of housing with HTC match renter need for units of various sizes, and are the rents truly affordable? Unit Size
Census estimates of population and household size indicate that HTC units reflect household needs.
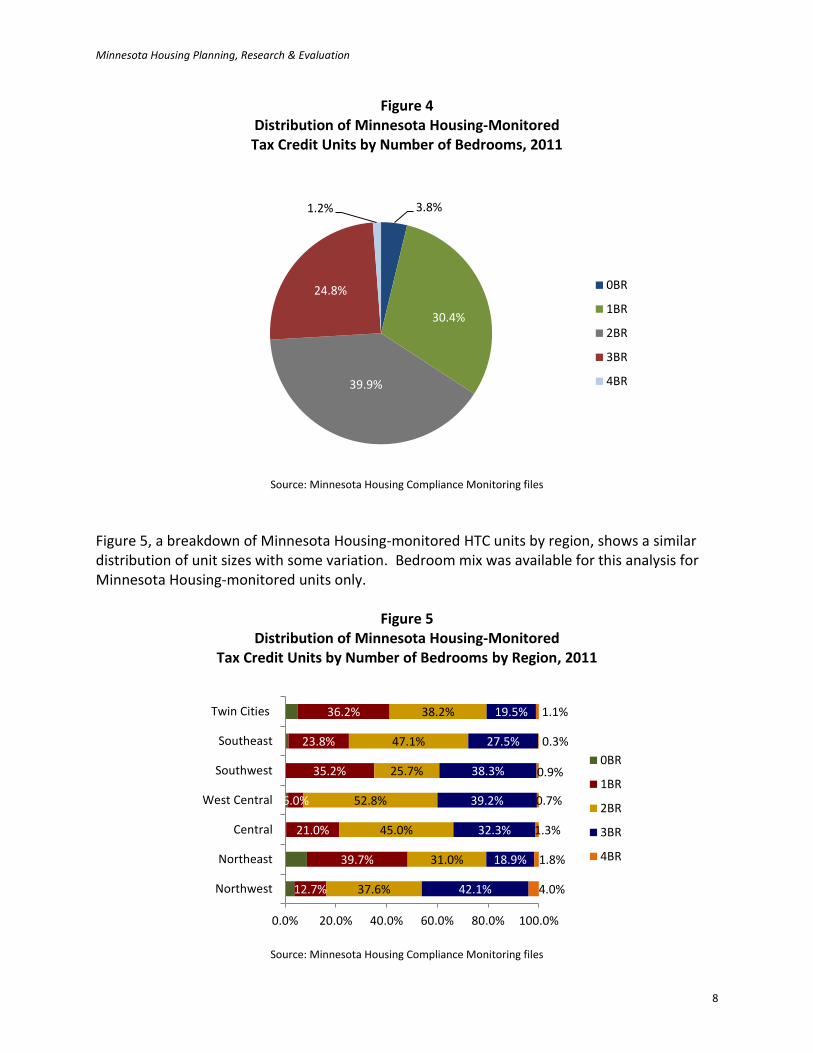
Data on bedroom mix were readily available for more than 22,000 units that Minnesota Housing monitored in 2011. The greatest proportion of occupied HTC units reported had two bedrooms (39.9 percent), followed by one-bedroom units (30.4 percent). Slightly more than one percent of units had four bedrooms (see Figure 4). Units reported as having no bedroom include single room occupancy units and efficiencies.
0.0%
5.0%
10.0%
15.0%
20.0%
25.0%
30.0%
35.0%
40.0%
45.0%
50.0%
HTC Units Monitoredin the Twin CitiesRegion, 2011
Low Income CostBurdenedHouseholds, 2007-2011
Minnesota Housing Planning, Research & Evaluation
8
Figure 4 Distribution of Minnesota Housing-Monitored Tax Credit Units by Number of Bedrooms, 2011
Source: Minnesota Housing Compliance Monitoring files
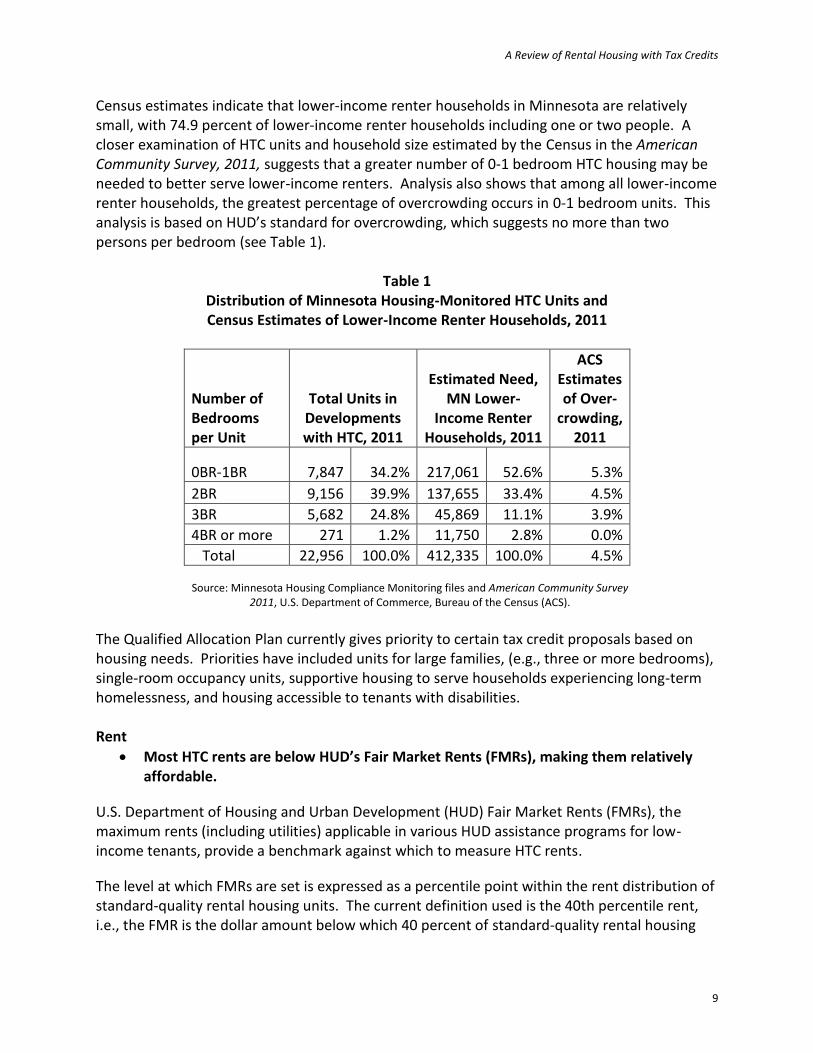
Figure 5, a breakdown of Minnesota Housing-monitored HTC units by region, shows a similar distribution of unit sizes with some variation. Bedroom mix was available for this analysis for Minnesota Housing-monitored units only.
Figure 5 Distribution of Minnesota Housing-Monitored
Tax Credit Units by Number of Bedrooms by Region, 2011
Source: Minnesota Housing Compliance Monitoring files
3.8%
30.4%
39.9%
24.8%
1.2%
0BR
1BR
2BR
3BR
4BR
12.7%
39.7%
21.0%
6.0%
35.2%
23.8%
36.2%
37.6%
31.0%
45.0%
52.8%
25.7%
47.1%
38.2%
42.1%
18.9%
32.3%
39.2%
38.3%
27.5%
19.5%
4.0%
1.8%
1.3%
0.7%
0.9%
0.3%
1.1%
0.0% 20.0% 40.0% 60.0% 80.0% 100.0%
Northwest
Northeast
Central
West Central
Southwest
Southeast
Twin Cities
0BR
1BR
2BR
3BR
4BR
A Review of Rental Housing with Tax Credits
9
Census estimates indicate that lower-income renter households in Minnesota are relatively small, with 74.9 percent of lower-income renter households including one or two people. A closer examination of HTC units and household size estimated by the Census in the American Community Survey, 2011, suggests that a greater number of 0-1 bedroom HTC housing may be needed to better serve lower-income renters. Analysis also shows that among all lower-income renter households, the greatest percentage of overcrowding occurs in 0-1 bedroom units. This analysis is based on HUD’s standard for overcrowding, which suggests no more than two persons per bedroom (see Table 1).
Table 1 Distribution of Minnesota Housing-Monitored HTC Units and Census Estimates of Lower-Income Renter Households, 2011
Number of Bedrooms per Unit
Total Units in Developments with HTC, 2011
Estimated Need, MN Lower-
Income Renter Households, 2011
ACS Estimates of Over-
crowding, 2011
0BR-1BR 7,847 34.2% 217,061 52.6% 5.3%
2BR 9,156 39.9% 137,655 33.4% 4.5%
3BR 5,682 24.8% 45,869 11.1% 3.9%
4BR or more 271 1.2% 11,750 2.8% 0.0%
Total 22,956 100.0% 412,335 100.0% 4.5%
Source: Minnesota Housing Compliance Monitoring files and American Community Survey 2011, U.S. Department of Commerce, Bureau of the Census (ACS).
The Qualified Allocation Plan currently gives priority to certain tax credit proposals based on housing needs. Priorities have included units for large families, (e.g., three or more bedrooms), single-room occupancy units, supportive housing to serve households experiencing long-term homelessness, and housing accessible to tenants with disabilities. Rent
Most HTC rents are below HUD’s Fair Market Rents (FMRs), making them relatively affordable.
U.S. Department of Housing and Urban Development (HUD) Fair Market Rents (FMRs), the maximum rents (including utilities) applicable in various HUD assistance programs for low-income tenants, provide a benchmark against which to measure HTC rents.
The level at which FMRs are set is expressed as a percentile point within the rent distribution of standard-quality rental housing units. The current definition used is the 40th percentile rent, i.e., the FMR is the dollar amount below which 40 percent of standard-quality rental housing

Minnesota Housing Planning, Research & Evaluation
10
units in an area are rented. HUD establishes FMRs for the eleven-county Twin Cities Metropolitan Statistical Area (MSA).3
In order to be comparable to HUD’s FMRs for the Twin Cities MSA, information on HTC rents in this assessment is based on rents in the eleven-county Twin Cities area and the balance of the state. Data were available for nearly 8,000 two-bedroom HTC units, including nearly 5,300 in the Twin Cities MSA and more than 2,600 in the balance of the state. (Elsewhere in this report, the Twin Cities Metro region includes the seven-county Minneapolis/Saint Paul area.)
FMRs for a two-bedroom unit in the Twin Cities MSA have been slightly above the average rent for two-bedroom HTC units for at least five years (see Figure 6). Among HTC two-bedroom units in the Twin Cities MSA, 57.7 percent of the units rented below the area FMR in 2011, up from 55.2 percent in 2010 and 52 percent in 2009.
Figure 6 Fair Market Rents and HTC Rents
in the Twin Cities in the Last Five Years (2011 dollars)
Source: Minnesota Housing analysis of current HTC rents and 2011 FMRs
Developments with HTC typically are underwritten and funded so that a percentage of the units are affordable to households with incomes at 50 percent or 60 percent of HUD’s estimated area median income (AMI), with some as low as 30 percent. Differences in HTC rents and FMRs depend on the income level to which units are underwritten and the relationship between prevailing rents in a community (which determine the FMR) and the community’s area median income. Some communities may have rents that are relatively high or low in relation to their median incomes.
3 U.S. Department of Housing & Urban Development, Fair Market Rents
$0
$100
$200
$300
$400
$500
$600
$700
$800
$900
$1,000
FMRs
HTC units
A Review of Rental Housing with Tax Credits
11
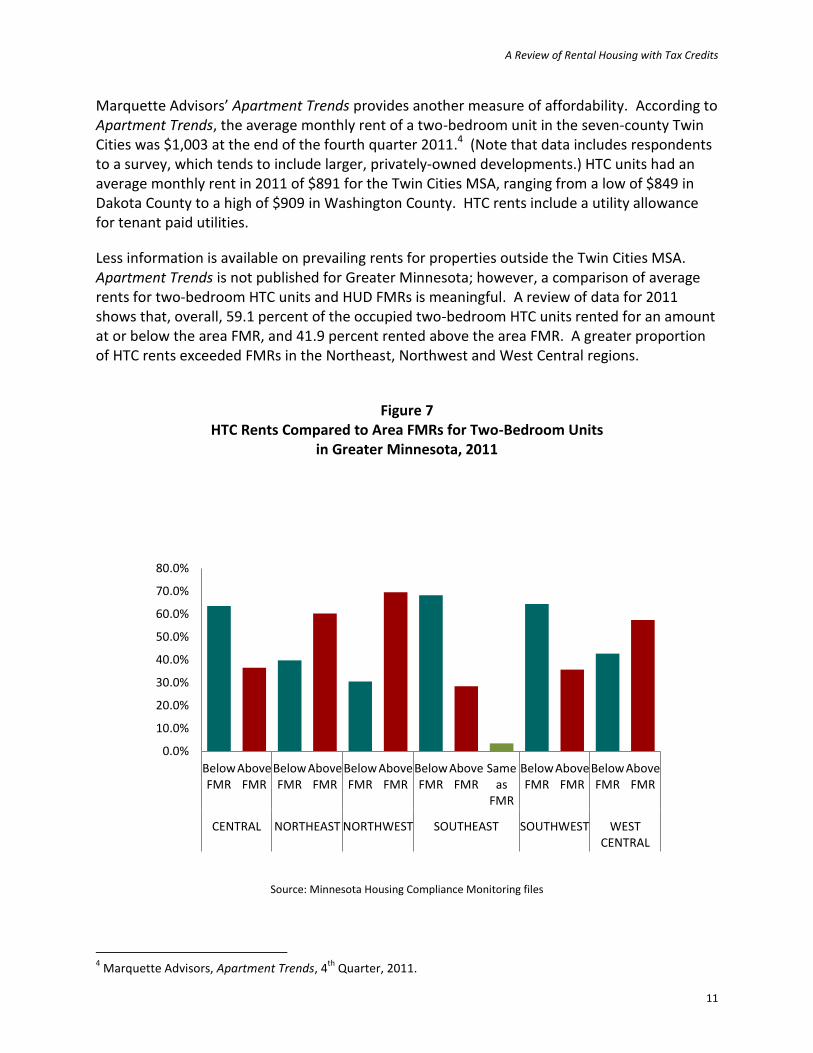
Marquette Advisors’ Apartment Trends provides another measure of affordability. According to Apartment Trends, the average monthly rent of a two-bedroom unit in the seven-county Twin Cities was $1,003 at the end of the fourth quarter 2011.4 (Note that data includes respondents to a survey, which tends to include larger, privately-owned developments.) HTC units had an average monthly rent in 2011 of $891 for the Twin Cities MSA, ranging from a low of $849 in Dakota County to a high of $909 in Washington County. HTC rents include a utility allowance for tenant paid utilities.
Less information is available on prevailing rents for properties outside the Twin Cities MSA. Apartment Trends is not published for Greater Minnesota; however, a comparison of average rents for two-bedroom HTC units and HUD FMRs is meaningful. A review of data for 2011 shows that, overall, 59.1 percent of the occupied two-bedroom HTC units rented for an amount at or below the area FMR, and 41.9 percent rented above the area FMR. A greater proportion of HTC rents exceeded FMRs in the Northeast, Northwest and West Central regions.
Figure 7 HTC Rents Compared to Area FMRs for Two-Bedroom Units
in Greater Minnesota, 2011
Source: Minnesota Housing Compliance Monitoring files
4 Marquette Advisors, Apartment Trends, 4
th Quarter, 2011.
0.0%
10.0%
20.0%
30.0%
40.0%
50.0%
60.0%
70.0%
80.0%
BelowFMR
AboveFMR
BelowFMR
AboveFMR
BelowFMR
AboveFMR
BelowFMR
AboveFMR
Sameas
FMR
BelowFMR
AboveFMR
BelowFMR
AboveFMR
CENTRAL NORTHEAST NORTHWEST SOUTHEAST SOUTHWEST WESTCENTRAL

Minnesota Housing Planning, Research & Evaluation
12
Serving Targeted Populations How well does housing with HTC serve targeted populations? Household Type
Families with children account for the most households occupying HTC units. Families with children account for nearly one-half of the HTC households served in 2011 (Table 2). HTC units house a greater percentage of families with children and lower percentages of single people and two-person households without children than the Census estimates for all lower-income renters in Minnesota in 2011. Estimates from the American Community Survey, 2011, show that in Minnesota 28.0 percent of lower-income renter household were families with children, 19.3 percent were two or more unrelated adults with no children, and 52.6 percent of were one person living alone.
Table 2 HTC and Lower-Income Renter Households by Type, 2011
Household Type HTC Households,
2011
ACS All Lower-Income MN
Renters
Families with Children 10,329 47.4% 115,503 28.0%
One Person 8,997 41.3% 217,061 52.6%
Two or More Adults, No Children 2,468 11.3% 79,771 19.3%
Total 21,794 100.0% 412,335 100.0%
Source: Minnesota Housing Compliance Monitoring files and American Community Survey 2011, U.S. Department of Commerce, Bureau of the Census (ACS).
Of the families with children occupying HTC units, 74.2% included three or more people and 43.2% included four or more, a reflection of the QAP priority for large family units. HTC household types vary by region with the greatest proportion of families served in the Northwest, West Central, and Central regions, and the greatest proportion of one-person households served in the Northeast and Metro regions (see Figure 8).
Most HTC units are “general occupancy”, available to seniors and non-seniors alike.

A Review of Rental Housing with Tax Credits
13
Figure 8 Percentage of HTC Households by Type, 2011
Source: Minnesota Housing Compliance Monitoring files
Homelessness
HTC currently provides housing to more than 1,200 households who have experienced homelessness.
Five percent of HTC households reporting in 2011 reported having been homeless, i.e., without permanent shelter, prior to occupancy. Three percent (more than 700 households) reported having been long-term homeless, which Minnesota has defined as “lacking a permanent place to live continuously for a year or more or at least four times in the past three years.” One of Minnesota Housing’s current QAP priorities is to allocate credits to developments that include supportive housing for people experiencing (or at risk of) homelessness.
0.0%
10.0%
20.0%
30.0%
40.0%
50.0%
60.0%
70.0%
80.0%
Sin
gle
Per
son
Ad
ult
s, N
o C
hild
ren
Fam
ilie
s w
ith
Ch
ildre
n
Sin
gle
Per
son
Ad
ult
s, N
o C
hild
ren
Fam
ilie
s w
ith
Ch
ildre
n
Sin
gle
Per
son
Ad
ult
s, N
o C
hild
ren
Fam
ilie
s w
ith
Ch
ildre
n
Sin
gle
Per
son
Ad
ult
s, N
o C
hild
ren
Fam
ilie
s w
ith
Ch
ildre
n
Sin
gle
Per
son
Ad
ult
s, N
o C
hild
ren
Fam
ilie
s w
ith
Ch
ildre
n
Sin
gle
Per
son
Ad
ult
s, N
o C
hild
ren
Fam
ilie
s w
ith
Ch
ildre
n
Sin
gle
Per
son
Ad
ult
s, N
o C
hild
ren
Fam
ilie
s w
ith
Ch
ildre
n
CENTRAL TWINCITIES NORTHEAST NORTHWEST SOUTHEAST SOUTHWEST WESTCENTRAL

Minnesota Housing Planning, Research & Evaluation
14
Mobility Impaired Tenants
Minnesota Housing architectural standards require that at least three percent of units in developments the agency funds must be designed for tenants with disabilities, which is higher than state Building Code standards; however, many accessible units are occupied by households that are not mobility impaired.
Available data enable us to identify households that include a member with a permanent mobility impairment, e.g., using a wheelchair, which is one example of the population with disabilities. How owners identify and report impairment may be somewhat subjective; however, this information provides some insight into how the stock of accessible HTC units is being used. Of the 21,795 HTC units for which owners reported household characteristics in 2011, nearly three percent were accessible to a mobility impaired occupant. Note that some developments may not be required to meet accessibility standards, e.g., those without Minnesota Housing funds, developments predating current accessibility standards, and rehabilitation projects for which accessibility improvements are not feasible. Occupancy of accessible HTC units by mobility impaired tenants has improved in the last ten years through the use of better information and outreach, but utilization of the accessible housing stock could be improved. The rate of mobility impaired tenants occupying accessible units has varied from year-to-year, increasing from 22 percent of all accessible units in 2002 to 35 percent in 2011 (more than 600 occupied accessible units). Sixty-five percent of accessible units were occupied by tenants who were not mobility impaired (see Table 3). Seventeen percent of mobility impaired HTC households were seniors.
Table 3 Occupancy of Accessible HTC Units Reporting, 2011
Households by Mobility
Units Number of HTC Units
Not Impaired Impaired All
Not accessible 21,190 93.3% 6.7% 100%
Accessible 605 65.0% 35.0% 100%
Source: Minnesota Housing Compliance Monitoring files

A Review of Rental Housing with Tax Credits
15
Figure 9 shows that the percentage of accessible units occupied by mobility impaired tenants varied widely by region in Minnesota, with the Northwest and Southeast regions having the highest rates at 65.0 and 60.5 percent, respectively.
Figure 9 Mobility Impaired Households in Accessible HTC Units by Region, 2011
Source: Minnesota Housing Compliance Monitoring files
A review of units that are not designed to be accessible but are occupied by a mobility impaired tenant indicates some ongoing mismatch between population needs and accessible units as shown in Table 4.
58.1%
24.9%
41.7%
65.0%
60.5%
22.2%
50.0%
41.9%
75.1%
58.3%
35.0%
39.5%
77.8%
50.0%
0% 10% 20% 30% 40% 50% 60% 70% 80% 90% 100%
CENTRAL
TWIN CITIES
NORTHEAST
NORTHWEST
SOUTHEAST
SOUTHWEST
WEST CENTRAL
Mobility ImpairedHousehold Yes
Mobility ImpairedHousehold No

Minnesota Housing Planning, Research & Evaluation
16
Table 4 Accessibility of Occupied HTC Units Monitored by Minnesota Housing, 2011
Accessible Units Units Not Accessible
Number of HTC Units
Mobility Impaired Household
Number of HTC Units
Mobility Impaired Household
Region No Yes No Yes
CENTRAL 74 41.9% 58.1% 2,402 93.4% 6.6%
TWIN CITIES 370 75.1% 24.9% 13,716 93.8% 6.2%
NORTHEAST 40 58.3% 41.7% 1,384 90.0% 10.0%
NORTHWEST 23 35.0% 65.0% 452 96.6% 3.4%
SOUTHEAST 38 39.5% 60.5% 2,049 90.3% 9.7%
SOUTHWEST 27 77.8% 22.2% 709 94.2% 5.8%
WEST CENTRAL 33 50.0% 50.0% 478 96.3% 3.7%
Total 605 65.0% 35.0% 21,190 93.3% 6.7%
Source: Minnesota Housing Compliance Monitoring files Lower-Income Households
Most households occupying HTC units have extremely low incomes, by any measure. Incomes of HTC households may or may not be recertified, depending upon IRS requirements for the building type (i.e., mixed income or 100 percent HTC). Even for those households subject to annual income recertifications (e.g., for rental assistance), owners may report income at the time of initial occupancy rather than the recertified incomes on the Characteristics of Tenant Households data collection form. To ensure a review of reasonably current income data, we limited our review of income amounts to recent move-ins, i.e., tenants with HTC move-in dates of January 1, 2009 or later. The median income of households occupying HTC units is very low, especially compared to the income of other households in Minnesota. According to the Census Bureau’s American Community Survey, 2011, the median household income for all households was estimated to be $56,954 and the median income of renter households in Minnesota in 2011 was estimated to be $29,094. The median income of households occupying HTC units was $17,864. The U. S. Department of Health and Human Services (HHS) sets poverty income guidelines that are used to determine eligibility for a variety of federal assistance programs. For 2011, HHS established poverty-level income as $19,090 for a three-person family and $23,050 for a family of four.
Another measure of income is HUD’s estimated median family income, which provides the basis for income guidelines in a variety of housing assistance programs. HUD estimates medians,
A Review of Rental Housing with Tax Credits
17
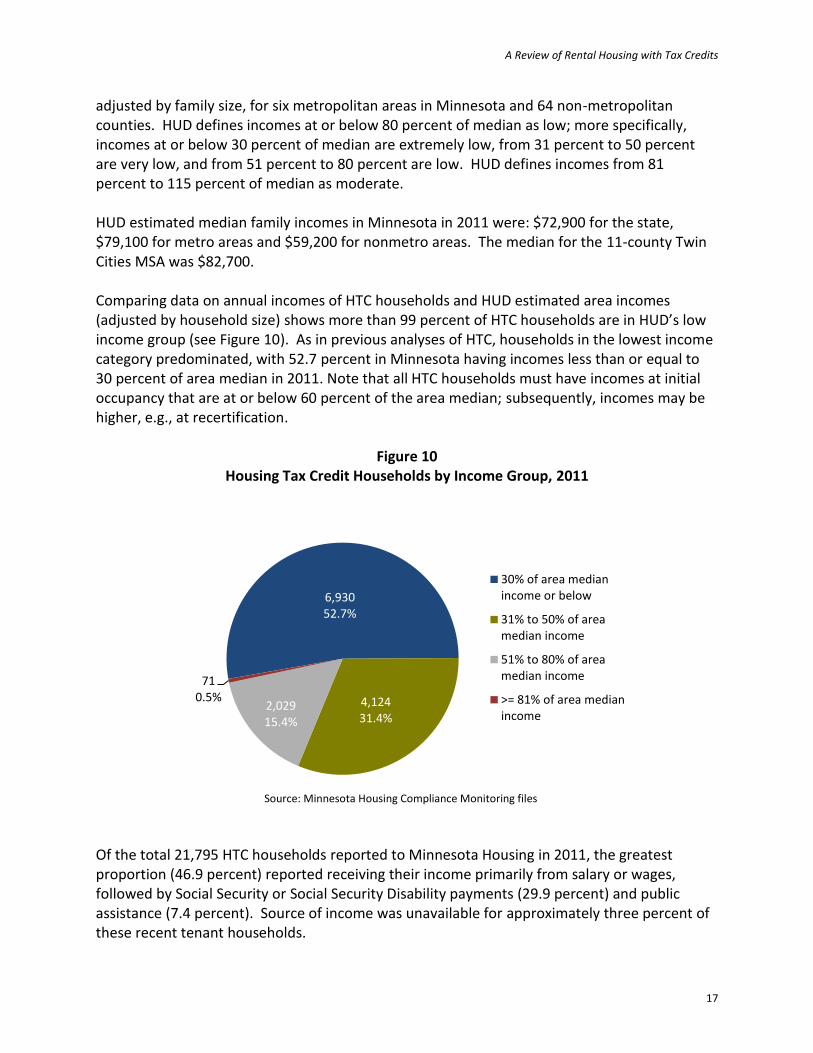
adjusted by family size, for six metropolitan areas in Minnesota and 64 non-metropolitan counties. HUD defines incomes at or below 80 percent of median as low; more specifically, incomes at or below 30 percent of median are extremely low, from 31 percent to 50 percent are very low, and from 51 percent to 80 percent are low. HUD defines incomes from 81 percent to 115 percent of median as moderate. HUD estimated median family incomes in Minnesota in 2011 were: $72,900 for the state, $79,100 for metro areas and $59,200 for nonmetro areas. The median for the 11-county Twin Cities MSA was $82,700. Comparing data on annual incomes of HTC households and HUD estimated area incomes (adjusted by household size) shows more than 99 percent of HTC households are in HUD’s low income group (see Figure 10). As in previous analyses of HTC, households in the lowest income category predominated, with 52.7 percent in Minnesota having incomes less than or equal to 30 percent of area median in 2011. Note that all HTC households must have incomes at initial occupancy that are at or below 60 percent of the area median; subsequently, incomes may be higher, e.g., at recertification.
Figure 10
Housing Tax Credit Households by Income Group, 2011
Source: Minnesota Housing Compliance Monitoring files
Of the total 21,795 HTC households reported to Minnesota Housing in 2011, the greatest proportion (46.9 percent) reported receiving their income primarily from salary or wages, followed by Social Security or Social Security Disability payments (29.9 percent) and public assistance (7.4 percent). Source of income was unavailable for approximately three percent of these recent tenant households.
6,930 52.7%
4,124 31.4%
2,029 15.4%
71 0.5%
30% of area medianincome or below
31% to 50% of areamedian income
51% to 80% of areamedian income
>= 81% of area medianincome

Minnesota Housing Planning, Research & Evaluation
18
The distribution of income groups was similar among regions (see Figure 11).
Figure 11 Distribution of HTC Household Income Groups
by Region, 2011
Source: Minnesota Housing Compliance Monitoring files
Cost-Burdened Households
Most HTC households without rent assistance are cost-burdened, but less so than all lower-income renters in Minnesota.
HUD defines a household as cost-burdened if it spends more than 30 percent of income on housing and severely cost-burdened if it spends more than 50 percent on housing. Households with federal rent assistance are not cost-burdened due to program regulations requiring that tenants pay no more than 30 percent of their incomes for rent. For this reason, this analysis focuses on the cost burdens of the 12,297 HTC households without rent assistance (56.4 percent of all HTC households reporting). To ensure recent income data, we limited our review to records for households with initial occupancy dates of January 1, 2009 or later. We excluded households reported as paying more than 100 percent of income for housing. Using these parameters, we reviewed nearly 7,200 HTC household records for an analysis of cost burden.
43.3%
56.1%
54.4%
52.6%
46.1%
33.5%
51.1%
35.8%
29.9%
31.7%
32.7%
33.4%
39.5%
27.9%
20.6%
13.5%
12.7%
14.4%
20.3%
25.3%
19.1%
0.3%
0.5%
1.1%
0.3%
0.2%
1.6%
1.8%
0.0% 20.0% 40.0% 60.0% 80.0% 100.0%
CENTRAL
TWIN CITIES
NORTHEAST
NORTHWEST
SOUTHEAST
SOUTHWEST
WEST CENTRAL30% of areamedian incomeor below
31% to 50% ofarea medianincome
51% to 80% ofarea medianincome
Greater than80% of areamedian income

A Review of Rental Housing with Tax Credits
19
According to the Census Bureau’s American Community Survey, 2011, an estimated 66.4 percent of lower-income renter households in Minnesota were cost-burdened. A lower percentage of HTC households (without rent assistance) reporting for 2011 were cost-burdened than all lower-income renters in the state—61.1 percent. Data show an even smaller proportion of households in HTC units were severely cost-burdened (paying more than 50 percent of income for rent) than in the overall population of renters. According to the American Community Survey, 2011, 25.7 percent of all renters in Minnesota were severely cost-burdened (summary estimates are not available by income). Among HTC households, an estimated 18.3 percent in 2011 were severely cost-burdened Cost burden can occur in HTC units because units are often underwritten to rents affordable to households at or below 50 percent or 60 percent of area median income, but the units may be occupied by people with incomes that are even lower. Note also that HTC units not only provide a more affordable option (though not necessarily completely affordable), they also provide high quality housing that tenants most likely would be unable to find at similar rents in the overall market. As shown in Table 5, the Twin Cities includes the greatest proportion of cost-burdened lower-income HTC households, followed by the Northeast region.

Minnesota Housing Planning, Research & Evaluation
20
Table 5 Cost-Burdened HTC Households by Region, 2011
Cost Burdened HTC Households
without Rent Assistance
Severely Cost Burdened HTC
Households
Region Burdened Number % in
Region Number % in
Region
CENTRAL
No 464 48.0% 866 89.6%
Yes 503 52.0% 101 10.4%
Total 967 100.0% 967 100.0%
TWIN CITIES
No 1,603 34.2% 3,711 79.1%
Yes 3,088 65.8% 980 20.9%
Total 4,691 100.0% 4,691 100.0%
NORTHEAST
No 81 37.3% 175 80.6%
Yes 136 62.7% 42 19.4%
Total 217 100.0% 217 100.0%
NORTHWEST
No 118 65.2% 162 89.5%
Yes 63 34.8% 19 10.5%
Total 181 100.0% 181 100.0%
SOUTHEAST
No 300 42.7% 576 82.1%
Yes 402 57.3% 126 17.9%
Total 702 100.0% 702 100.0%
SOUTHWEST
No 148 57.4% 244 94.6%
Yes 110 42.6% 14 5.4%
Total 258 100.0% 258 100.0%
WEST CENTRAL
No 74 48.1% 127 82.5%
Yes 80 51.9% 27 17.5%
Total 154 100.0% 154 100.0%
Total
No 2,788 38.9% 5,861 81.7%
Yes 4,382 61.1% 1,309 18.3%
Total 7,170 100.0% 7,170 100.0%
Source: Minnesota Housing Compliance Monitoring files
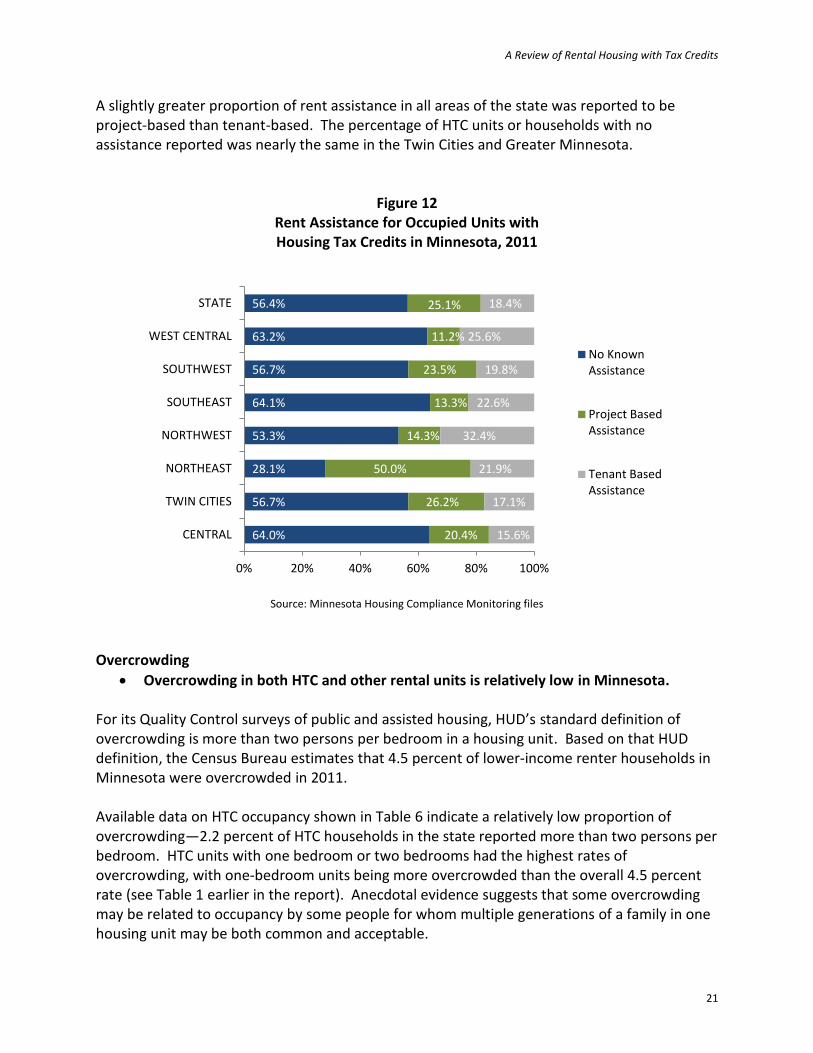
Information reported to Minnesota Housing by property owners for 2011 indicates that 43.6 percent of housing units with tax credits were made more affordable through either project- or tenant-based assistance (see Figure 12). Project-based assistance may include properties with Rural Development or Minnesota Housing financing, and Section 8 properties. Tenant-based assistance includes rent assistance paid on behalf of tenants, such as Housing Choice vouchers.
A Review of Rental Housing with Tax Credits
21
A slightly greater proportion of rent assistance in all areas of the state was reported to be project-based than tenant-based. The percentage of HTC units or households with no assistance reported was nearly the same in the Twin Cities and Greater Minnesota.
Figure 12 Rent Assistance for Occupied Units with Housing Tax Credits in Minnesota, 2011
Source: Minnesota Housing Compliance Monitoring files
Overcrowding
Overcrowding in both HTC and other rental units is relatively low in Minnesota. For its Quality Control surveys of public and assisted housing, HUD’s standard definition of overcrowding is more than two persons per bedroom in a housing unit. Based on that HUD definition, the Census Bureau estimates that 4.5 percent of lower-income renter households in Minnesota were overcrowded in 2011. Available data on HTC occupancy shown in Table 6 indicate a relatively low proportion of overcrowding—2.2 percent of HTC households in the state reported more than two persons per bedroom. HTC units with one bedroom or two bedrooms had the highest rates of overcrowding, with one-bedroom units being more overcrowded than the overall 4.5 percent rate (see Table 1 earlier in the report). Anecdotal evidence suggests that some overcrowding may be related to occupancy by some people for whom multiple generations of a family in one housing unit may be both common and acceptable.
64.0%
56.7%
28.1%
53.3%
64.1%
56.7%
63.2%
56.4%
20.4%
26.2%
50.0%
14.3%
13.3%
23.5%
11.2%
25.1%
15.6%
17.1%
21.9%
32.4%
22.6%
19.8%
25.6%
18.4%
0% 20% 40% 60% 80% 100%
CENTRAL
TWIN CITIES
NORTHEAST
NORTHWEST
SOUTHEAST
SOUTHWEST
WEST CENTRAL
STATE
No KnownAssistance
Project BasedAssistance
Tenant BasedAssistance

Minnesota Housing Planning, Research & Evaluation
22
Table 6 HTC Households and Overcrowding, 2011
Region Over-
crowded
Number of HTC
Households
Percentage of Region
Total
CENTRAL No 2,429 98.1%
Yes 47 1.9%
Total 2,476 100.0%
TWIN CITIES No 13,718 97.4%
Yes 368 2.6%
Total 14,086 100.0%
NORTHEAST No 1,418 99.6%
Yes 6 0.4%
Total 1,424 100.0%
NORTHWEST No 469 98.7%
Yes 6 1.3%
Total 475 100.0%
SOUTHEAST No 2,045 98.0%
Yes 42 2.0%
Total 2,087 100.0%
SOUTHWEST No 726 98.6%
Yes 10 1.4%
Total 736 100.0%
WEST CENTRAL
No 509 99.6%
Yes 2 0.4%
Total 511 100.0%
TOTAL No 21,314 97.8%
Yes 481 2.2%
Total 21,795 100.0%
Source: Minnesota Housing Compliance Monitoring files

A Review of Rental Housing with Tax Credits
23
Communities of Color or Hispanic Ethnicity
Data show that HTC housing includes a greater percentage of households of a race other than White or of Hispanic/Latino ethnicity than estimated by the Census in the general population.
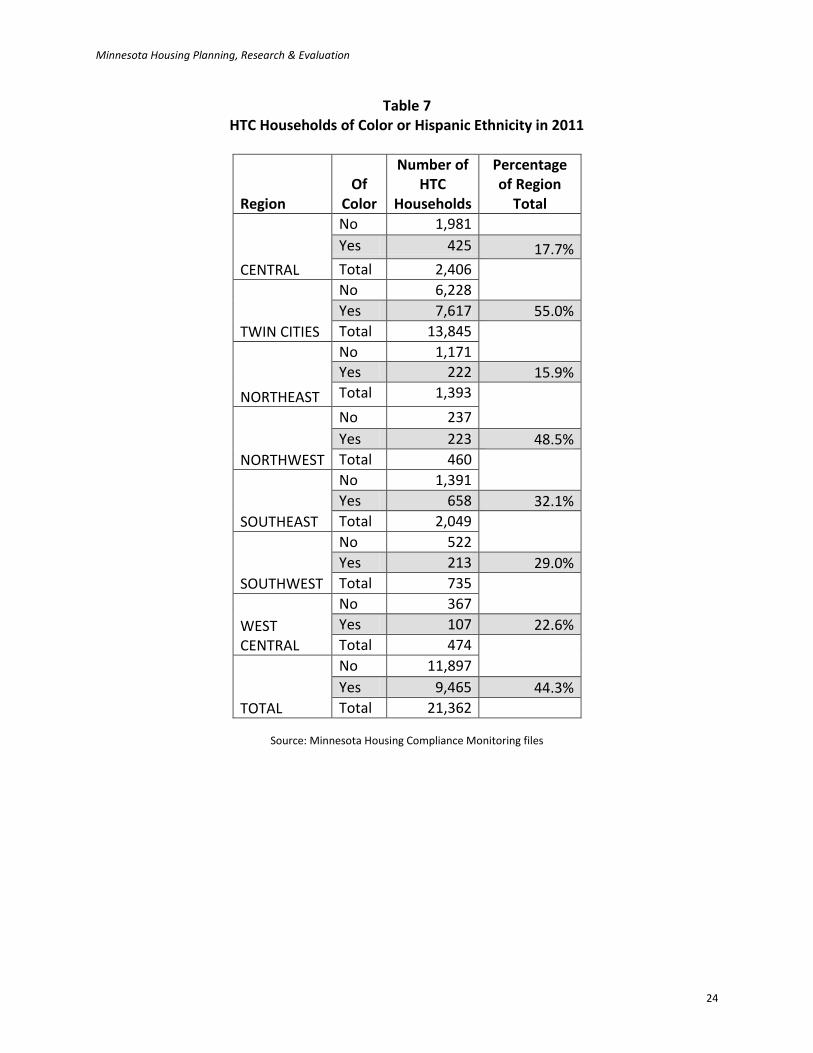
The federal Office of Management and Budget (OMB) identifies five basic race categories and requires agencies collecting data from program participants to allow them to report their race in any combination thereof: American Indian or Alaskan Native, Asian, Black or African American, Native Hawaiian or Other Pacific Islander, or White. Ethnicity may be reported as Hispanic/Latino or Not Hispanic/Latino. Current OMB standards on race and ethnicity were announced in 1997: http://www.whitehouse.gov/omb/fedreg_1997standards/ Adequate data on race and ethnicity were available for the heads of 21,362 HTC households. HTC race/ethnicity data are available for the householder only. Household of color is defined here as headed by a person of a race other than White. A Hispanic person may be of any race. According to estimates from the Census Bureau’s American Community Survey, 2011, 27.9 percent of lower-income renter households in Minnesota were of color or Hispanic ethnicity. In the Twin Cities MSA, an estimated 37.6 percent lower-income renter households were of color or Hispanic ethnicity. Data show that HTC housing is occupied by a greater percentage of households of color or Hispanic ethnicity than are in the general lower-income renter population. Among all HTC households reported to Minnesota Housing for 2011, 44.3 percent of HTC householders were of color or Hispanic ethnicity (see Table 7). In the Twin Cities region, 55.0 percent of HTC householders were of color or Hispanic ethnicity.
Minnesota Housing Planning, Research & Evaluation
24
Table 7 HTC Households of Color or Hispanic Ethnicity in 2011
Region Of
Color
Number of HTC
Households
Percentage of Region
Total
CENTRAL
No 1,981
Yes 425 17.7%
Total 2,406
TWIN CITIES
No 6,228
Yes 7,617 55.0%
Total 13,845
NORTHEAST
No 1,171
Yes 222 15.9%
Total 1,393
NORTHWEST
No 237
Yes 223 48.5%
Total 460
SOUTHEAST
No 1,391
Yes 658 32.1%
Total 2,049
SOUTHWEST
No 522
Yes 213 29.0%
Total 735
WEST CENTRAL
No 367
Yes 107 22.6%
Total 474
TOTAL
No 11,897
Yes 9,465 44.3%
Total 21,362
Source: Minnesota Housing Compliance Monitoring files
A Review of Rental Housing with Tax Credits
25
Conclusion The Low Income Housing Tax Credit has enabled Minnesota Housing to provide an estimated 39,000 units of affordable rental housing since 1987. As of 2011, Minnesota Housing and suballocators were monitoring 33,845 HTC units with income and rent restrictions still in place.
Monitored HTC units are distributed throughout the state in a pattern similar to the distribution of estimated need for affordable rental housing. Units are occupied mostly by extremely low-income tenants, many of whom also receive rent assistance
The tenants of housing with HTC have lower incomes than all renters in Minnesota; however, in other respects, the profile of HTC tenants tends to reflect the lower-income renter population. Tenants of HTC housing with no rent assistance experience cost burdens similar to other tenants in Minnesota; however, a smaller percentage of HTC households are severely cost-burdened than all other renters.
The distribution of HTC housing units monitored in 2011 is similar to the estimated renter need for assistance in most regions of the state.
Housing with tax credits serves a relatively high percentage of families with children—47.4 percent of HTC households were families with children under the age of 18.
HTC units house a high proportion of households of color or Hispanic ethnicity. Of reporting HTC households in Minnesota, 44.3 percent were of color or Hispanic ethnicity.
The greatest proportion of HTC households reporting (52.7 percent) had incomes in the lowest income group defined by the U.S. Department of Housing and Urban Development.
43.6 percent of HTC households benefitted from additional tenant or project-based housing assistance.

Minnesota Housing Planning, Research & Evaluation
26
Appendix: Data Issues and Clarity “HTC units” as used in this report are income- and rent-restricted, in other words, for occupancy by low-income tenants. Data on all HTC units allocated since 1987 have been derived from and verified through the following sources: Minnesota Housing’s HDS system, Minnesota Housing’s Characteristics of Tenant Households Report (CTH), Affordable Housing Connections’ list of suballocator properties monitored, and Electronic Reporting Program (ERP) forms submitted by property owners for HTC suballocator units. This inventory of HTC allocations is as complete as is possible. Due to changes in reporting procedures and information systems in the last 25 years, some developments with HTC may have been unavoidably excluded from the dataset used in this analysis. This report, unlike previous versions, includes data on suballocator units currently being monitored (no tenant demographics). While this more comprehensive dataset adds to the overall understanding of HTC units in Minnesota, information on units from earlier reports are no longer comparable with the data in this one. Minnesota Housing collects tenant data through the annual process of monitoring HTC housing for compliance with applicable federal and state rules. Minnesota Housing requests information on tenants as of December 31 through the CTH report, which provides a “snapshot” of the characteristics of tenants served during the reporting year. In this report, unit data generally apply to all HTC units monitored in 2011 (see http://www.mnhousing.gov/wcs/Satellite?c=Page&cid=1358905290806&pagename=External%2FPage%2FEXTStandardLayout for a list of properties monitored in 2013). Tenant characteristics data are based on reports submitted to Minnesota Housing by property owners in 2012 for the households occupying HTC units as of December 31, 2011. Owners reported tenant information on a total of 21,795 households. The report only includes tenant characteristics for units with tax credits allocated by Minnesota Housing or units allocated by suballocators and with deferred funding from Minnesota Housing. Minnesota Housing encourages owners to complete and submit the CTH report; however, some information cannot be required of owners or tenants and therefore is not available for all HTC units.
Owners may inadvertently report the tenant portion of rent paid rather than total rent, therefore this analysis was made both with and without a basic rent assumption (e.g., a “floor” or minimum amount). The results were nearly identical. Tenant data in this review generally apply to units allocated and monitored by Minnesota Housing. Data include suballocator units if owners also received Minnesota Housing deferred funding for which Minnesota housing monitors for compliance with program rules.

A Review of Rental Housing with Tax Credits
27
Concerning reported data:
39,714 units of HTC have been allocated since 1987
33,845 units of HTC currently are monitored by Minnesota Housing (22,490 units) and suballocators (11,355 units)
21,795 occupied HTC units reported tenant household characteristics. The majority in this dataset were Minnesota Housing-allocated HTC units. (Tenant characteristics data exclude suballocator units with no Minnesota Housing deferred funding.)
Information includes HTC units of different credit types, as follows:
15,047 units at nine percent credit, allocated by Minnesota Housing
6,201 units at nine percent credit, allocated by suballocators
4,569 units at four percent credit with Minnesota housing tax-exempt bond financing
8,441 units at four percent credit with other bond issuers (Numbers do not total the currently monitored HTC units as a few developments have both four and nine percent credits.) Table 8 shows the distribution of HTC units currently monitored compared to the HTC households for which data were reported to Minnesota Housing. The coverage of monitored units is quite complete (owners submitted tenant characteristics data to Minnesota Housing on 78.5 percent of the HTC units monitored by Minnesota Housing and 36.4 percent of suballocator HTC units), and the distribution of tenant characteristics data closely reflects unit location.
Table 8
Tax Credit Units Monitored By and Reported To Minnesota Housing, 2011
Property Location
HTC units Monitored
Share of HTC Units Monitored
Share of HTC Households
Reported
Twin Cities, all 22,255 65.8% 64.6%
Central 3,954 11.7% 11.4%
Southeast 3,127 9.2% 9.6%
Northeast 1,646 4.9% 6.5%
Northwest 1,144 3.5% 2.2%
Southwest 865 2.6% 3.4%
West Central 854 2.5% 2.3%
Total 33,845 100% 100%
Household incomes of HTC tenants are recertified as required by program regulations; however, the existing database does not distinguish between recently recertified and older incomes. To ensure the analysis of recent income amounts, most income and rent burden data

Minnesota Housing Planning, Research & Evaluation
28
are analyzed for households moving into HTC units within the last three years, i.e., since January 1, 2009. Unless otherwise noted, “Twin Cities” includes the seven counties of: Anoka, Carver, Dakota, Hennepin, Ramsey, Scott, and Washington. Some federal agencies also include Chisago, Isanti, Sherburne, and Wright counties as part of the Twin Cities. Discussion of HTC rents and HUD FMRs are based on the federally defined 11-county area, which is referred to as the Twin Cities Metropolitan Statistical Area (MSA).