A review of ECG-based diagnosis support systems for ...shura.shu.ac.uk/13328/1/Faust Review of ECG...
38
A review of ECG-based diagnosis support systems for obstructive sleep apnea FAUST, Oliver <http://orcid.org/0000-0002-0352-6716>, ACHARYA, U. Rajendra, NG, E. Y. K. and FUJITA, Hamido Available from Sheffield Hallam University Research Archive (SHURA) at: http://shura.shu.ac.uk/13328/ This document is the author deposited version. You are advised to consult the publisher's version if you wish to cite from it. Published version FAUST, Oliver, ACHARYA, U. Rajendra, NG, E. Y. K. and FUJITA, Hamido (2016). A review of ECG-based diagnosis support systems for obstructive sleep apnea. Journal of Mechanics in Medicine and Biology, 16 (01), p. 1640004. Copyright and re-use policy See http://shura.shu.ac.uk/information.html Sheffield Hallam University Research Archive http://shura.shu.ac.uk
Transcript of A review of ECG-based diagnosis support systems for ...shura.shu.ac.uk/13328/1/Faust Review of ECG...

A review of ECG-based diagnosis support systems for obstructive sleep apnea
FAUST, Oliver <http://orcid.org/0000-0002-0352-6716>, ACHARYA, U. Rajendra, NG, E. Y. K. and FUJITA, Hamido
Available from Sheffield Hallam University Research Archive (SHURA) at:
http://shura.shu.ac.uk/13328/
This document is the author deposited version. You are advised to consult the publisher's version if you wish to cite from it.
Published version
FAUST, Oliver, ACHARYA, U. Rajendra, NG, E. Y. K. and FUJITA, Hamido (2016). A review of ECG-based diagnosis support systems for obstructive sleep apnea. Journal of Mechanics in Medicine and Biology, 16 (01), p. 1640004.
Copyright and re-use policy
See http://shura.shu.ac.uk/information.html
Sheffield Hallam University Research Archivehttp://shura.shu.ac.uk
A review of ECG based diagnosis support systems for
obstructive sleep apnea
Oliver Faust1, and U. Rajendra Acharya2, and E. Y. K. Ng3, and Hamido Fujita4
1Faculty of Arts, Computing, Engineering and Sciences, Sheffield Hallam University, UK,e-mail: [email protected]
2Ngee Ann Polytechnic, Singapore3Nanyang Technological University, Singapore
4Iwate Prefectural University, Japan
Abstract
Humans need sleep. It is important for physical and psychological recreation.During sleep our consciousness is suspended or least altered. Hence, our abil-ity to avoid or react to disturbances is reduced. These disturbances can comefrom external sources or from disorders within the body. Obstructive Sleep Ap-nea (OSA) is such a disorder. It is caused by obstruction of the upper airwayswhich causes periods where the breathing ceases. In many cases, periods ofreduced breathing, known as hypopnea, precede OSA events. The medical back-ground of OSA is well understood, but the traditional diagnosis is expensive, asit requires sophisticated measurements and human interpretation of potentiallylarge amounts of physiological data. Electrocardiogram (ECG) measurementshave the potential to reduce the cost of OSA diagnosis by simplifying the mea-surement process. On the down side, detecting OSA events based on ECG datais a complex task which requires highly skilled practitioners. Computer algo-rithms can help to detect the subtle signal changes which indicate the presenceof a disorder. That approach has the following advantages: computers nevertire, processing resources are economical and progress, in the form of better al-gorithms, can be easily disseminated as updates over the internet. Furthermore,Computer-Aided Diagnosis (CAD) reduces intra- and inter-observer variability. Inthis review we adopt and support the position that computer based ECG signalinterpretation is able to diagnose OSA with a high degree of accuracy.
Keywords: Computer Aided Diagnosis, Electrocardiogram, Obstructive SleepApnea, Classifier, Features
Preprint submitted to Elsevier January 6, 2016

1. Introduction
Obstructive Sleep Apnea (OSA) is a common disorder that affects both chil-dren and adults [1]. In 1993, the Wisconsin Sleep Cohort Study produced datawhich suggests that one in every 15 Americans experiences symptoms of sleepapnea, such as pauses in breathing or instances of shallow breathing during sleep[2]. OSA is associated with increased perioperative risk, hypertention and stroke[3, 4]. Kapur et al. presented evidence that medical costs almost double prior tothe diagnosis of OSA [5]. The result was established by taking into account con-trol groups matched for age, sex, residence, and in some cases, family physicianas well as obesity. In a sequence of 238 cases, identified in a health-maintenanceinstitution, in the year prior to the diagnosis of OSA, the mean yearly medicalcost per patient was US$2,720, versus US$1,384 for sex and age matched con-trols. Regression analysis showed that the OSA severity, expressed through theApnea/Hypopnea Index (AHI), was positively correlated with the annual med-ical costs, after adjusting for age, sex, and Body Mass Index (BMI) [6]. Forthe entire population, that increase may cause US$3.4 billion/year in additionalmedical costs. Unfortunately, the costs of untreated OSA are higher than just thecost incurred by health issues. Apart from diagnosis and treatment costs, thereis a decrement in the quality of life, which is associated with the medical con-sequences, but there are also motor vehicle accidents, and occupational losses.OSA-related motor vehicle collisions in 2000 were estimated to cost US$15.9billion [7]. Another factor, which increases the cost, is the fact that traditionalOSA diagnosis requires an Polysomnography (PSG), an all-night examination ina specialized clinic, under constant medical supervision [8, 9]. That procedure islabour-intensive, time-consuming and, at times, inaccessible or even impractical[10]. Accordingly, a cost effective screening method, which allows us an earlyassessment of the disease severity prior to a referral for PSG [11].
As such, OSA poses a high cost to society and current diagnosis methods areexpensive. These two facts are interrelated, hence it is reasonable to assume thatnovel methods of OSA detection can contribute to the solution of both problems.Accurate and more cost effective diagnosis will result in wider screenings whereOSA is detected earlier. Early disease detection means more effective treatmentcan be administered, which reduces both patient suffering and social cost of thedisease. Thus, there is a growing interest in alternative diagnosis approaches,such as portable holter Electrocardiogram (ECG) monitoring [12, 13]. By usingmodern computing machinery and state of the art algorithms, it is possible toextract respiration waveforms from ECG signals [14]. Such systems can be used
2

in OSA analysis. In terms of medical foundations, these systems are based onthe fact that there are fluctuations in both R-wave amplitude and QRS durationat the onset and termination of apnoea-bradycardia episodes [15]. However,practical holter reports are often difficult to analyze from a Heart Rate Variability(HRV) perspective, because of the nondeterministic nature of the signal, whichresults from underlying physiological processes that are assumed to be chaotic[16, 17, 18, 19].
Both, the amount of disability affected lifetime and the economic cost createa powerful need to diagnose OSA in an accurate and cost effective manner. ECGbased screening methods hold the promise of delivering non-invasive, accurateand cost efficient diagnosis methods. However, the physiological processes, whichlink changes in the heart beat to OSA events are not entirely understood. Hence,we have to depend on empirical evidence to show that indeed such a link exists.The first part of our study details a comprehensive survey of papers which discussphysiological evidence that changes in the ECG signal are positively correlatedwith OSA events. Once that link is established, a corollary problem is to automatethe detection of OSA induced changes in the ECG signal. To analyze the problemand to get an overview of the performance of automated OSA detection systems,the second part of our study reviews ECG based OSA Computer-Aided Diagnosis(CAD) systems. As such, each of these engineering papers provides evidencethat there is an exploitable correlation between ECG measurements and OSA.Hence, these papers constitute valuable input to medical researchers. But, duringour study, we found that the medical community forms distinct citation clusters,where research, with a biomedical background, is rarely cited. To overcome that,our review aims to provide an unbiased overview of ECG based OSA detection.
1.1. Sleep apnea survey
Before we introduce CAD systems for OSA detection, it is beneficial to brieflyreview the scientific literature that relates to sleep-disordered breathing and HeartRate (HR). In general, sleep disordered breathing, known as sleep apnea, is fur-ther classified as mixed, central, or obstructive. The classification is based onwhether effort to breathe is present during the event [20]. With approximately84% of all cases, OSA is the most common form of sleep apnea [21, 22]. In 1984,Guilleminault et al. published the first paper about the effects of sleep apneaon the electrical activity of the human heart. To be specific, they noted thatOSAs were often correlated with a bradycardia during apneic periods, followedby a tachycardia as breathing resumes [23]. These patterns were termed cyclicalfluctuations in HR. Typical apneas have a duration of 10–20 seconds and that
3
is the time when the effect on the heart beat is most profound. More specif-ically, the apnea periods introduce a frequency component to the RespirationRate (RR) interval tachogram, which corresponds to the apnea duration. Hence,the apnea induced frequency component has a value in the range of 0.05 Hzto 0.1 Hz. It is difficult to detect these additional frequency components inthe time domain. However, transform domains, like the spectrum, reveal bothfrequency and amplitude of the sleep apnea induced signal component. Steinet al. established a useful graphical representation of this observation [24]. Inadult patients, they were able to detect episodes of OSA solely through visualinspection of the RR-interval tachogram by detecting the characteristic cyclicalvariations in HR patterns. Other research groups noted the low-frequency fluc-tuations which were introduced by apneas as well. In response, they developed arange of possible systems for using HR to detect apneas [25, 26]. Even healthysubjects can influence their heart beats by holding their breath [27]. Erdem et al.demonstrated the pure effect of OSA on the cardiac autonomic function with HRturbulence parameters [28]. Impaired HR turbulence may be an important factorwhich causes arrhythmia and sudden cardiac death in patients with OSA [29].By monitoring the Q wave/T wave (QT) interval, computed from ECG signalsduring sleep, it is possible to create a link between the ventricular repolarizationand sleep stages [30]. Uznanska et al. found that there is a significant correlatedbetween OSA and cardiovascular diseases [31].
That concludes our brief review of the medical evidence which underpins allattempts to construct ECG based diagnosis support systems for OSA. In thenext section, we review scientific articles, which were published on that subject.Our focus is on CAD systems which help practitioners to detect OSA. Section3 relates these systems to the wider research in the field of OSA detection andCAD. The paper concludes with Section 4, where we highlight again the systemicaspects of creating ECG based diagnosis support systems for OSA.
2. Materials
The previous section outlined that there is a link between OSA and the beatingpattern of the human heart. That link is important, because these beatingpattern can be measured with the non-invasive and cost effective ECG method.However, OSA induced changes on the ECG signal are minute and the data needsto be observed over a long time interval. Hence, human based interpretation iserror prone and there is inter- and intra-observer variability. As a consequence,computing technology is used to detect OSA induced changes in ECG signals.
4
Such computing methods form the backbone of CAD systems. These systemsbenefit patients through diagnosis support and treatment monitoring. In thispart of our study, we review research on ECG based CAD systems for OSA.
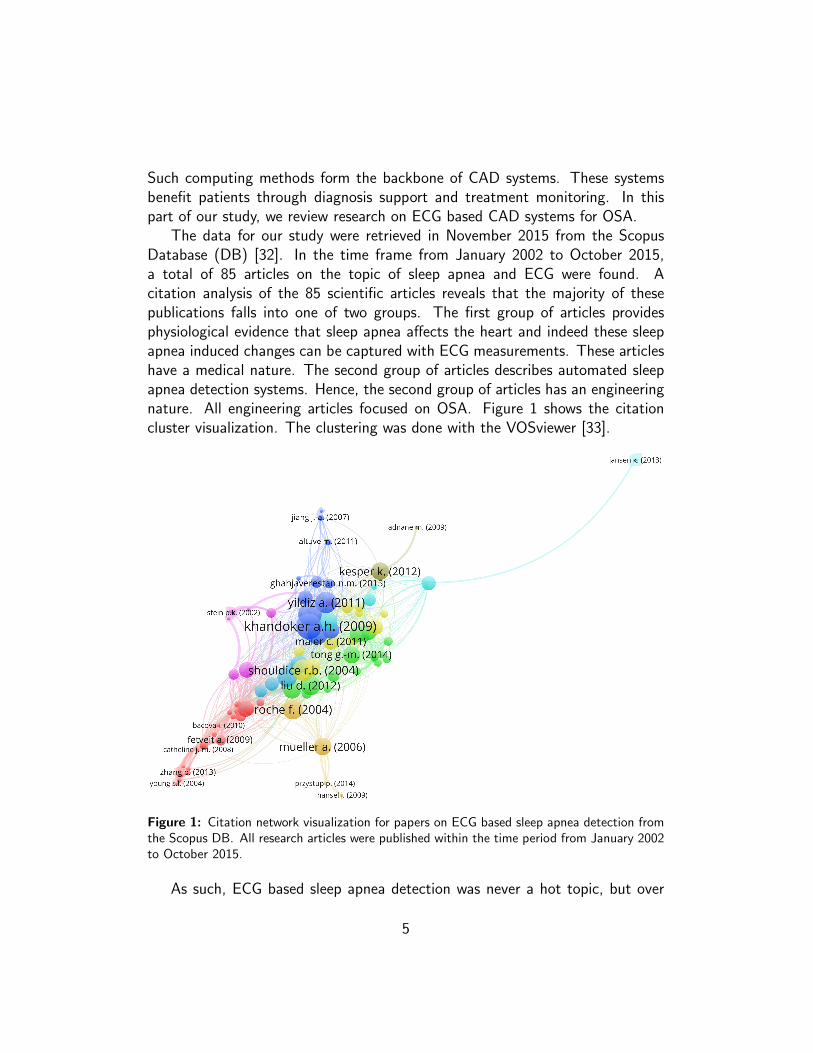
The data for our study were retrieved in November 2015 from the ScopusDatabase (DB) [32]. In the time frame from January 2002 to October 2015,a total of 85 articles on the topic of sleep apnea and ECG were found. Acitation analysis of the 85 scientific articles reveals that the majority of thesepublications falls into one of two groups. The first group of articles providesphysiological evidence that sleep apnea affects the heart and indeed these sleepapnea induced changes can be captured with ECG measurements. These articleshave a medical nature. The second group of articles describes automated sleepapnea detection systems. Hence, the second group of articles has an engineeringnature. All engineering articles focused on OSA. Figure 1 shows the citationcluster visualization. The clustering was done with the VOSviewer [33].
Figure 1: Citation network visualization for papers on ECG based sleep apnea detection fromthe Scopus DB. All research articles were published within the time period from January 2002to October 2015.
As such, ECG based sleep apnea detection was never a hot topic, but over
5

(5)2002
(0) (11)2004
(1) (5)2006
(15) (6)2008
(12)(12)2010
(9) (13)2012
(6) (7)2014
(7)
0
5
10
15N
umb
erof
pap
ers
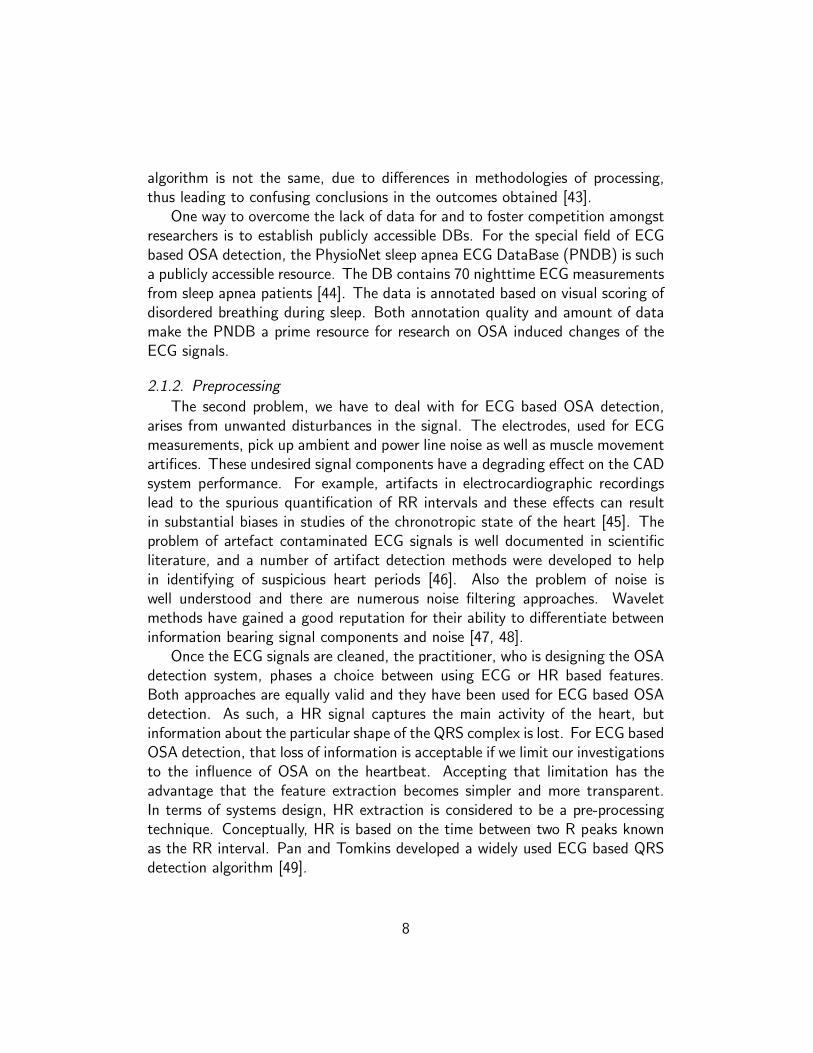
Figure 2: Distribution of papers on ECG based sleep apnea detection over the observationperiod from 2002 to 2015.
the last 10 years there was a steady stream of high quality research articles whichfocused on that subject. Figure 2 details the yearly distribution of these researcharticles over the time span from January 2002 to October 2015. Within theobservation period, 2007 saw the largest number of research articles (15) onECG and sleep apnea. In contrast, there were no articles in 2003. From 2006onwards, there were at least five articles a year on that topic.
Having outlined both the need for CAD systems and the way in which thatneed sparked research publications, we move on to discuss CAD systems for ECGbased OSA detection.
2.1. Computer aided diagnosis systems
The steady stream of research articles indicates that there is a link betweenrespiration and ECG signals. Hence, it is necessary to translate that link intotangible improvements for patients as well as cost savings for society. CAD sys-tems are a well-known strategy to realize the diagnostic potential of physiologicalmeasurements, such as ECG [34, 35].
CAD systems apply data mining techniques to reach a decision on whether ornot a particular ECG signal sequence shows signs of OSA [36, 37]. InterpretingCAD systems as data mining machines leads to a clear design pattern whichstructures the system creation [38]. Figure 3 shows an overview block-diagramof the individual processing steps which establish the CAD functionality. In termsof systems design, each of these steps poses a particular problem. As long asthese problems are well defined, they can be addressed with standard solutions.In exceptional cases, it is possible to find novel and innovative problem solutions.The next sections detail the individual steps, by introducing the problem and
6

ECGdata
Pre-processing
Featureextraction and
selection
Classificationand
assessment
Two classresult
Three classresult
Figure 3: Block diagram of computer aided sleep apnea detection systems based on ECGsignals.
discussing standard solutions.
2.1.1. Electrocardiogram data
The first problem of ECG based OSA detection is data. There are a numberof requirements for the ECG recordings, some of them are even conflicting. Firstand foremost, the data should represent the variety and veracity of OSA inducedchanges in ECG signals [39]. In general, that requirement can only be adequatelymet with large datasets taken from a wide range of specimens. However, there isproblem with the group of heart patients. Their heart beat, hence also their ECGsignal, is already altered by an underlying heart disease [40, 41, 42]. Routinely,such datasets are not considered as a basis for the design of OSA detectionsystems. As a consequence, all automated OSA detection systems under-performfor patients with an underlying heart disease.
Another important requirement for ECG data, which is used for OSA de-tection, is concerned with availability and competition. As such, availability isprerequisite for competition, because competition means to compare the per-formance results of different studies and that comparison is only valid if theunderlying data is the same. When the studies, under scrutiny, were based ondifferent datasets, researchers tend to regard larger datasets to be more difficult,i.e. good performance results are harder to achieve, then smaller datasets ordatasets from selected individuals.
As a consequence of the interrelatedness between performance and data used,we have to be extra careful when comparing different OSA detection methods.For example, the plentiful and diverse measurements very useful for validatingmethods for diagnosing sleep disorders, however researchers must be careful whencomparing their algorithms with those implemented by other authors. The samealgorithm my yield significantly different results, if the DB employed to test the
7
algorithm is not the same, due to differences in methodologies of processing,thus leading to confusing conclusions in the outcomes obtained [43].
One way to overcome the lack of data for and to foster competition amongstresearchers is to establish publicly accessible DBs. For the special field of ECGbased OSA detection, the PhysioNet sleep apnea ECG DataBase (PNDB) is sucha publicly accessible resource. The DB contains 70 nighttime ECG measurementsfrom sleep apnea patients [44]. The data is annotated based on visual scoring ofdisordered breathing during sleep. Both annotation quality and amount of datamake the PNDB a prime resource for research on OSA induced changes of theECG signals.
2.1.2. Preprocessing
The second problem, we have to deal with for ECG based OSA detection,arises from unwanted disturbances in the signal. The electrodes, used for ECGmeasurements, pick up ambient and power line noise as well as muscle movementartifices. These undesired signal components have a degrading effect on the CADsystem performance. For example, artifacts in electrocardiographic recordingslead to the spurious quantification of RR intervals and these effects can resultin substantial biases in studies of the chronotropic state of the heart [45]. Theproblem of artefact contaminated ECG signals is well documented in scientificliterature, and a number of artifact detection methods were developed to helpin identifying of suspicious heart periods [46]. Also the problem of noise iswell understood and there are numerous noise filtering approaches. Waveletmethods have gained a good reputation for their ability to differentiate betweeninformation bearing signal components and noise [47, 48].
Once the ECG signals are cleaned, the practitioner, who is designing the OSAdetection system, phases a choice between using ECG or HR based features.Both approaches are equally valid and they have been used for ECG based OSAdetection. As such, a HR signal captures the main activity of the heart, butinformation about the particular shape of the QRS complex is lost. For ECG basedOSA detection, that loss of information is acceptable if we limit our investigationsto the influence of OSA on the heartbeat. Accepting that limitation has theadvantage that the feature extraction becomes simpler and more transparent.In terms of systems design, HR extraction is considered to be a pre-processingtechnique. Conceptually, HR is based on the time between two R peaks knownas the RR interval. Pan and Tomkins developed a widely used ECG based QRSdetection algorithm [49].
8

2.1.3. Feature extraction and selection
The third problem for ECG based OSA detection is to find methods whichextract relevant information from ECG signals. In this case, information is rele-vant if it helps to discriminate between OSA and normal berating periods. Theprocess of extracting relevant information from a physiological signal is usuallyreferred to as feature extraction. In the past years, we have seen the applicationof machine learning or pattern recognition. As a consequence, the feature do-main has expanded from tens to hundreds of features that can be used in thoseapplications [50]. ECG based OSA detection is no exception. In the reviewedresearch articles, we found a diverse range of feature extraction algorithms. Thefollowing text describes the most common feature extraction methods with abias towards nonlinear feature extraction.
A number of researchers used statistical methods to extract relevant informa-tion from either ECG or HR. The statistical methods included basic first orderquantities, such as mean and variance as well as more advanced approaches suchas ST-segment deviation. In general, these statistical approaches assume thatthe signal is predictable and that the signal is stationary. However, the humanheart is a non-stationary oscillator and there is good evidence that it is even achaotic system. Statistical methods are prone to failure, because they are notrobust to nonlinear events. Indeed such nonlinear events can be caused by OSA,i.e. such events cause a significant but unpredictable alteration of the heartbeat.
The main idea behind domain transformation algorithms, such as Fourier,Spectrum estimation and wavelets, is to compare the measured ECG signal withknown signals. In the case of spectrum approaches, the known signals are sinewaves of different phase angles and frequencies. As a consequence, the spectrummethod yields information about the frequency content of the ECG signal andthe phase angle. The phase angle is rarely used, but the frequency content is animportant signal feature. Similarly, the continuous wavelet transform comparesthe measured ECG signal with scaled versions of the so called mother wavelet.The discrete wavelet transform compares the measured signal with the filtertransfer functions. The wavelet transform results show location and quality ofthe comparison. Both parameters hold valuable information for ECG based OSAdetection, because they reveal the nature of an OSA induced abnormality andwhen that abnormality happened.
The reviewed papers describe a number of novel time domain feature extrac-tion methods. These methods aim to extract relevant information for either HRor ECG to OSA periods. They were proposed by scientists with expertise in both
9

algorithm design and wide ranging medical knowledge on either ECG or HR [51].For example, Kalman filter can be used to measure the predictability of the ECGsignal. OSA events are not predictable, hence the Kalman filter will do poorlyfor OSA affected ECG signals. As a consequence, the Kalmen filter performancecan be used as feature, for OSA detection.
Nonlinear features were also used for ECG based OSA detection. The featureswere extracted with algorithms from the domain of the chaos theory [52]. Thesealgorithms deal with strange signals. In this case ‘strange’ means that the signalsare predictable if and only if we understand all the physiological processes inthe human body. Clearly, that is impossible, hence the ECG prediction is alsoimpossible. However, it is possible to quantify the strangeness or indeed the self-similarity of the signal. Such quantifications reveal lots of hidden informationabout the underlying processes. One of these underlying processes is the effectOSA has on the human heart. A common test to support the idea that ECGsignals result from strange attractors can be constructed with a surrogate datatest [53]. The test is established as follows. The Fast Fourier Transform (FFT)algorithm is used to calculate the spectrum of the ECG signal. Subsequently, thephase is randomized before the inverse FFT is used to transform the signal backinto the time domain. The resulting signal has the same statistical properties asthe original ECG signal. If a nonlinear parameter shows a difference between theoriginal and phase randomized signal, then we cannot rule out that the underlyingprocess, which generates the signal, is nonlinear. So far, there are no recordsthat the test has failed for ECG signals, at least not for all nonlinear parameters.
Having such a wide range of possible feature extraction methods requiresfeature selection. Fundamentally, feature selection is necessary because the clas-sification step can only deal with a limited number of features. Plenty of featureselection methods are documented in literature due to the availability of data withhundreds of variables leading to data with very high dimension. As such, featureselection methods provide us with a way of reducing computational complexity,improving prediction performance, and a better understanding of the data in ma-chine learning or pattern recognition applications. There is no way of knowinga priori which feature combination works best for a given OSA detection task.Hence, the strategy must be to try out as many features as possible. With thatapproach, the problem reduces to the simple task of feature selection, i.e. wehave to select the features which are used for classification. To find the bestpossible combination, the experimenter has multiple options. The first of theseoptions is to use statistical performance evaluation methods, such as students t-test and Analysis Of Variance (ANOVA) [54, 55]. Once the statistical test results
10

are established, the best features are selected, to form the basis for classifica-tion. Another method is to process all permutations of a feature set with strongclassifier. However, even with state of the art processing facilities, such a bruteforce approach is very time consuming, because running classification algorithmsfor all feature permutations is computationally complex. The final method relieson dimension reduction through algorithms, such as Principal Component Anal-ysis (PCA), Kernel PCA, Neighborhood Preserving Embedding (NPE), LocalitySensitive Discriminant Analysis (LSDA), Independent Component Analysis (ICA)[35, 56, 57]. The idea, behind that method, is to establish an ordered sequenceof parameters from a feature set. The parameters are ordered in terms of theirability to represent the important properties (not noise) of the feature set [58].Hence, the feature vector, which is used for classification, is composed from themost signification parameters.
2.1.4. Two class results
The forth problem of ECG based OSA detection centres on finding waysof using the extracted information. In general, the extracted features do notreassemble the ECG waveform. Hence, it is difficult for humans to relate thefeatures to particular diseases. To overcome that difficulty, threshold values areintroduced. For example, Roche et al. state that a threshold value of -11.1 fora statistical feature (∆[D/N] SDNN index) results in a sensitivity of 86.5% anda specificity of 55% [59]. However, such thresholding methods can only be usedon a single scalar value. One way to overcome that drawback is to incorporatemultiple features into one index value and to present the resulting value to thethreshold classifier [60]. However, the creation of such index values is based onthe intuition and experience of the experimenter. Hence, such indexes are highlysubjective, which makes it difficult to evaluate them. To be specific, a differentway of combining the features might yield better results. In many cases it isimpossible to analyze all features combinations, therefore we cannot proof that aparticular index is the most performant for a given feature set. To find the rightthreshold value, the Receiver Operating Characteristic (ROC) method can beused [61]. The ROC curve reflects the fact that a lower threshold value increasesthe sensitivity, but decreases the specificity, under the assumption that a largerfeature value indicates OSA.
A much better approach, then to combine individual features to form anindex value and to specify a threshold value, is to automate the classification ofa feature vector. An automated classification algorithm will find the best wayof reaching a classification decision. For supervised learning algorithms, the best
11

way is found with decision strategies based on a known dataset. By extractionrelevant information from a known dataset, the Support Vector Machine (SVM)algorithm establishes a hyperplane which separates two signal groups [62, 63].Repeating the process of establishing the hyperplane, with a reduced dataset,will lead to the classification of more than two classes. The classifier has beenused for five of the surveyed OSA detection systems, as shown in Tables 1 and2.
The Artificial Neural Network (ANN) classifier is one of the oldest decisionmaking algorithms [64]. It models the way a human brain works. The ANNstructure is application specific, i.e. different ANN structures show differentperformance for the same OSA detection task [65]. There is no way to predictwhich structure works the best. Hence, trial and error is required to find the bestANN configuration for a given task. As part of our survey, we found four ANNbased OSA detection systems.
The most common application for Linear Discriminant (LD) in medicine isdisease severity assessment [66]. However, the technique, which characterizes twoor more signal classes, can also be used for classification [67]. In the surveyedscientific articles, LD was used twice as classification method.
AdaBoost is a modern meta classification algorithm, which employs a poten-tially large number of weak decision making methods to reach a strong decision[68]. For biomedical problems, AdaBoost is always a strong contender for thebest classifier, but it is usually outperformed by other classification algorithms,such as SVM. Hence, AdaBoost was used only once in the surveyed researcharticles.
Just like feature extraction, also the classification step needs internal compe-tition as well. There is no way of knowing which classification algorithm worksbest for a given feature set. Therefore, empirical science is called upon to find thebest classification algorithm. The best classification algorithm is chosen basedon performance parameters which reflect various aspects of making a correct de-cision [69]. For classification problems, the correct decision constitutes the truevalue and the classification. Accuracy (A) is inversely proportional to the degreeof closeness of the classification achieved by an individual algorithm. Another im-portant performance measure is Sensitivity (Se), which describes the proportionof different samples that are correctly identified. For ECG based OSA detection,Se represents the percentage of ECG samples that were correctly identified asshowing signs of OSA [70]. Specificity (Sp) is the last measure which was widelyused in the surveyed papers. As such, Sp determines the proportion of normalECG signals that were correctly identified. The formal definition of all three per-
12

formance measures is based on the confusion matrix [71]. That four quadrantmatrix contains: true positive – ECG segments correctly identified as showingsigns of OSA, true negative – normal segments correctly identified as normal,false positive – normal segments identified as showing signs of OSA, and falsenegative – incorrect identification of ECG signal segment showing signs of OSA.
2.1.5. Two class results
In between January 2002 to October 2015, there were 29 engineering papers,which discussed OSA detection systems. In technical terms, sleep apnea detec-tion comes down to a two class problem: either there are sleep apnea events ina given ECG signal or not. In general, the research articles in Table 1 describesystem designs which follow the block diagram shown in Figure 3. However,the methods used in the individual steps vary significantly. From an engineeringperspective, the feature extraction methods are the most important and indeedthe most creative step. During this step, a designer is confronted with the taskof selecting the best feature extraction methods, for a given task, from a widerange of existing algorithms. Some designers push the envelope by proposingnew and innovative feature extraction methods which are specifically tailored toECG based OSA detection.
From the 29 research articles, listed in Table 1, 17 detail threshold classifica-tion, in some cases supported by ROC analysis. Even with such basic classificationmethods, the researchers achieved good classification accuracy, >= 79%. Thelowest reported classification accuracy came from Cohen and de Chazal [72].They reported an accuracy of just 67% based on the LD classifier. However,their system had to deal with infant ECG signals which have a much smallerknowledge base when compared with adult ECG.
Table 1: Summary of study conducted on classification of normal and apnea. The termfeatures to the feature extraction method used. The column labelled ‘Perf. in %’ detailsthe CAD system performance in A, Se, and Sp. Some researchers did no publish all threeperformance measures. Primarily, the table entries are ordered in terms of data used. Withinthe resulting subgroups, the entries are ordered in terms of classification performance.
Name,year
Features Classifier Data used Perf.in %
Khandokeret al. [73],2009
Wavelet SVM PNDB A =100
13
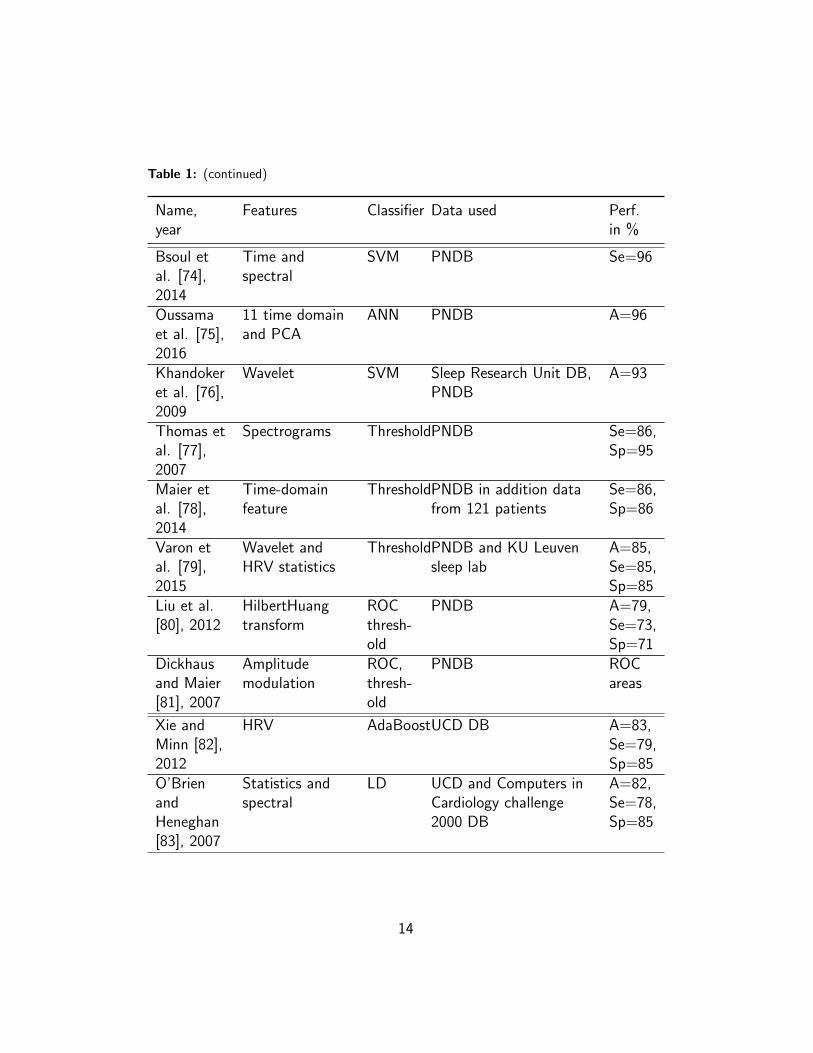
Table 1: (continued)
Name,year
Features Classifier Data used Perf.in %
Bsoul etal. [74],2014
Time andspectral
SVM PNDB Se=96
Oussamaet al. [75],2016
11 time domainand PCA
ANN PNDB A=96
Khandokeret al. [76],2009
Wavelet SVM Sleep Research Unit DB,PNDB
A=93
Thomas etal. [77],2007
Spectrograms ThresholdPNDB Se=86,Sp=95
Maier etal. [78],2014
Time-domainfeature
ThresholdPNDB in addition datafrom 121 patients
Se=86,Sp=86
Varon etal. [79],2015
Wavelet andHRV statistics
ThresholdPNDB and KU Leuvensleep lab
A=85,Se=85,Sp=85
Liu et al.[80], 2012
HilbertHuangtransform
ROCthresh-old
PNDB A=79,Se=73,Sp=71
Dickhausand Maier[81], 2007
Amplitudemodulation
ROC,thresh-old
PNDB ROCareas
Xie andMinn [82],2012
HRV AdaBoostUCD DB A=83,Se=79,Sp=85
O’BrienandHeneghan[83], 2007
Statistics andspectral
LD UCD and Computers inCardiology challenge2000 DB
A=82,Se=78,Sp=85
14

Table 1: (continued)
Name,year
Features Classifier Data used Perf.in %
Aksahin etal. [84],2011
HRV crosspower spectrumdensity
ANN 10 patients and 10control
A=99
Cohen andde Chazal[72], 2015
HRV statisticsand PSD
LD National CollaborativeHome Infant MonitoringEvaluation dataset
A=67,Se=67,Sp=58
Tong et al.[85], 2014
Mean cardiacelectrical axis
ROC,thresh-old
32 control, 88 patients A=88
Jiang etal. [86],2014
ST-segmentdeviation
Threshold105 patients and acontrol group
Se=65,Sp=89
Monasterioet al. [87],2012
20 linearmeasures
SVM Multi-ParameterIntelligent Monitoring forIntensive Care II
A=90,Se=86,Sp=91
Roche etal. [59],2002
HRV statistics Threshold124 sets Se=87
Maier etal. [88],2007
Localrecurrences
ROCthresh-old
140 sets Se=81,Sp=86
Shouldiceet al. [89],2004
Statistics andPSD
Quadraticdis-crimi-nant
25 sets A=88,Se=86,Sp=91
Roche etal. [90],2007
HRV statisticsand spectrum
ROC 150 sets Se=91,Sp=34
Kesper etal. [91],2012
HRV, EDR ThresholdSIESTA DB A=81
15

Table 1: (continued)
Name,year
Features Classifier Data used Perf.in %
Poupard etal. [92],2012
HRV statistics Threshold118 patients Se=97,Sp=72
Yilmaz etal. [93],2010
HRV statistics SVM 17 subjects A=87
Singhathipet al. [94],2010
HRV statistics ROCthresh-old
26 subjects A=93
Roche etal. [95],2004
Spectral Threshold28 subjects Se=78,Sp=70
Tong et al.[85], 2012
Not reported ROCthresh-old
120 subjects Se=85,Sp=94
Maier andDickhaus[96], 2010
Time-delayEmbedding
Threshold26 recordings Se=84
Ghahjaver-estan et al.[97], 2015
Kalman filter ThresholdNot reported Se=95,Sp=94
2.1.6. Three class results
There were only five research articles, which discriminated the ECG signals inthree classes, in the Scopus DB on ECG and sleep apnea between January 2002to October 2015. Table 2 lists these five papers. Most of the three class CADsystems discriminate between normal, apnea and hypopnea ECG segments. Ingeneral, three class problems are more difficult than two class problems. There-fore, the performance measurements are lower as compared to two class problems.The work by Acharya et al. stands out, because they achieved a classificationaccuracy of 90% on a large dataset [98]. The key to that classification perfor-mance lies in the feature extraction methods. The authors have used a range ofnonlinear methods, from the domain of chaos theory, to extract features which
16

represent the complexities of the electrical activity of the human heart well.
Table 2: Summary of study conducted on classification of normal, hypopnea and apnea.
Name,year
Features Classifier Data used Perf. in %
Acharyaet al.[98],2011
Approximate entropy, fractaldimension, correlationdimension, largest Lyapunovexponent and Hurstexponent
ANN 450 apnoeasets, 130hypopnoeasets and 130normal sets
A=90,Se=100,Sp=95
Khan-dokeret al.[99],2009
Wavelet ANN 17 sets A=77
Babaei-zadehet al.[100],2011
Peak-to-trough QRSamplitude and HRV basedmethod
ROCthresh-olds
Sleep healthcenter inBoston
A = 71,Se=60,Sp=82
Boyleet al.[101]
Wavelet Statisticalanalysis
10 one hourrecordings andsix overnightrecordings
ECG methodcomparablewithrespiratorymonitor.
Lado etal.[102],2012
HRV STFT Threshold 46 patients Not reported
3. Discussion
The human heart beat is influenced by both internal and external factors.Therefore, electrical measurements of the heart, in the form of ECG signals, canprovide a holistic assessment of health [103]. However, a fundamental problemwith such general indicators of health is the complexity of interpretation. As a
17

consequence, it is necessary to focus on one disease or disease class. The primecandidates for such a focus are the heart diseases [104, 105]. For this diseaseclass, ECG signals are the reference physiological measurement. OSA is anotherapplication area where ECG abnormalities can be used to support a diagnosis,despite the fact that the ECG signal changes are just a secondary measure ofbreathing problems [101]. In this case, secondary means that the ECG signalsare influenced by both autonomous and non-autonomous activities of the humanbody, and respiration events are just one amongst many influencing factors.Fortunately, sleep describes a rather predictable state of the human body, henceother factors, which shape the ECG signals are less prominent, at least they aremore predictable. Therefore, external influences on the ECG signal are minimal.Hence, it is possible to link abnormalities in ECG signals with berating disorderswithout the need for restricting or controlling external influences. For example,during sleep, there is no need to enforce a specific posture when taking the ECGmeasurement. As a consequence, ECG based OSA detection is practical, it canbe done with autonomous machines, such as holter or even cost effective HRmonitors [106].
There is dependable physiological evidence that OSA events cause changes inthe ECG signal. As a consequence it is possible to build automated systems whichdetect OSA induced ECG signal changes and through that provide diagnosissupport for practitioners. Building these systems is a creative process, becausethere is no standard way of extracting information from nonlinear signals, suchas ECG measurements. In this review, we focused on the creative process andthe fact that it is difficult to compare individual OSA detection systems. Tables1 and 2 detail features, classifier, data as well as performance of OSA detectionsystems. The data used, together with the classification performance, indicatethe system quality. To be specific, accuracy alone is insufficient to determine thesystem quality, because the accuracy depends on the dataset used for testing.In general, the performance measures, A, Se and Sp, are more dependable whenobtained in huge quantity from varied dataset. Hence, the first step in evaluatingthe system performance is to look at the datasets used. According to our review,for two class problems, the most widely used data comes from the PNDB. Theeight studies, which were based on PNDB, are highly competitive, because theperformance results are comparable. Therefore, we have ordered the entries inTable 1 according to the data used. Within the resulting subsets, the order wasestablished by the system performance. That ordering allows us to compare thefeature extraction and the classification methods. The most relevant observationscome from the largest subset, namely to the detection systems based on the
18
PNDB. For that subset, the adopted element ordering reveals that classificationalgorithms are superior to simple threshold methods, because the four classifierbased systems outperform the five threshold based systems. There is not such aclear result for the features used. Time and frequency domain as well as waveletfeatures seem to be sufficient to discriminate two classes.
Some researchers describe the effects of obstructive sleep hypopnea as indis-tinguishable from apnea events [107]. Gould et al. introduced the idea of a sleephypopnea syndrome as an alternative to the AHI [108]. Their index lists minimalbreathing difficulties on the lower end of the scale and OSA is listed as mostsevere event. Another aspect, which makes it worthwhile to study hypopnea,comes from the fact that hypopnea periods usually precede apnea events. Hence,hypopnea periods can be used to predict and, with more advanced systems, pre-vent OSA events. Future CAD systems should have the ability to discriminatebetween hypopnea periods and apnea events, because hat will improve patientmonitoring. With such improved patient monitoring, it is possible to individualizetreatment. The ability to administer individualized treatment, together with con-stant patient monitoring, can lead to self-optimizing patient control systems withfeedback through monitoring and activation through individualized treatment.
ECG based OSA detection is not the only novel method to diagnose breathingdisorders during sleep. Pulse oximetry is another non-invasive tool which is oftenapplied in modern medicine to evaluate both arterial oxygen saturation and HR.In recent years, pulse oximeters shrank, the smaller size has broadened theirapplication spectrum. In terms of medical evidence, it was found that OSA isfrequently accompanied by repetitive oxygen desaturation that can be useful inits detection [109]. For diagnosis and treatment of sleep-disordered breathing,overnight pulse oximetry helps us to determine the severity of disease and is usedas an economical means to detect OSA [110, 111, 112].
The prevalence of specific sleep disorders increases with age. For example,the number of patients with phase advance in the normal circadian sleep cy-cle increases with age, so does the restless legs syndrome. Especially, OSA isincreasingly seen among older individuals and it is significantly correlated withcardio- and cerebrovascular diseases as well as cognitive impairment [113]. OSAincreases corrected QT dispersion, that is the difference between the maximumand minimum QT intervals and is a strong risk factor for cardiovascular mortal-ity [114]. Solaimanzadeh et al. identified ECG based predictors of mortality inpatients with familial dysautonomia [115].
OSA is associated with hypertension and diabetes. The combination of thesediseases puts patients at high risk of developing cardiovascular disease. Appropri-
19

ate screening routines are important to detect cardiovascular risk factors in pa-tients with OSA [116]. Unfortunately, very little data is currently available aboutthe incidence of OSA in patients examined for cardiac arrhythmias [117, 118].Another important problem is heritability of abnormalities in cardiopulmonarycoupling in sleep apnea [119]. Mauser et al. predicted that ECG based sleep ap-nea detection methods could become a simple tool for cardiologists to screen forSleep Apnea/Hypopnoea Syndrome (SAHS) in clinical routine [120]. In patientswith arrhythmias, coincidence with sleep-related breathing disorders is high andof clinical relevance [121]. To investigate the cardiac activity further, Czopekcombined acoustic and ECG measurements to monitor sleep [122].
Morbidly obese patients have a high prevalence of known and unknown car-diopulmonary diseases [123]. Catheline et al. evaluated the impact of surgically-induced weight loss on obstructive SAHS electrocardiographic changes, pul-monary arterial pressure and daytime sleepiness in morbidly obese patients [124].
Adnane et al. developed a cardiorespiratory belt sensor [125]. Their systemis used for unobtrusive night-time ECG and HRV monitoring. Furthermore, theypresent data analysis methods by comparing bed sheet HR and HRV values withcorresponding parameters obtained by a reference measurement. ECG derivedRR1-interval data can be used to calculate HRV parameters, these parameterscan be used to analyze the sleep quality as well as other wellness-related topics,which include sleep apnoea detection [126].
Traditionally, sleep staging is based on Electroencephalogrphy (EEG) signals[127]. Redmond and Heneghan found that cardiorespiratory signals deliver mod-erate sleep-staging accuracy [128]. The features exhibit significant subject depen-dence which is a limitation to use these signals in a general subject-independentsleep staging system. Paree et al. discuss the design of a new sleep staging sys-tem for ambulatory situations [129]. Cardiorespiratory-based sleep staging canbe used as an adjunct tool in home sleep apnea monitoring [130].
We predict that the complexity of ECG based CAD systems will increase,because that is the dominant way of increasing accuracy, sensitivity and specificityof such mature systems [131, 132, 133]. The increased complexity creates its ownunique set of problems. The increased system complexity is addressed with divideand conquer design methods [134]. Individual design teams create functionalentities which communicate with one another. On the system level, complexnetworked problem solutions are susceptible to cyber vandalism and cybercrime.
1R-peak to R-peak in the QS complex.
20

The only way to overcome these difficulties is through well thought out designstrategies which take into account the increased levels of system complexity [135].
4. Conclusion
Over the last decades, ECG based OSA detection has attracted lots of inter-est from the research community. One measure for that interest is the numberand diversity of the research articles on that topic. In the current review, we haveanalysed papers from a range of medical and engineering backgrounds. Duringthe review we found that ECG based OSA detection is difficult, because ECGsignals are complex and the OSA induced signal changes are varied and sub-tle. Such complex detection tasks are best handled with computer algorithms.Indeed, none of the surveyed research relied on human interpretation of ECGsignals. Even though all relevant studies involved computer support, there was awide range of topics covered. Fundamental studies established the link betweenOSA and ECG. Scientific articles, from the engineering domain, described howto exploit such a link for diagnostic purposes to complete descriptions of physicalsystem implementations. Our review focused on papers which aim to automateOSA detection. From these papers, we distilled the design pattern for the datamining systems which deliver effective physical problem solutions for the chal-lenging task of ECG based OSA detection. These physical problem solutions takethe form of CAD systems. It is of eminent importance to establish and improvethe CAD system performance through internal and external competition. Mostof the reviewed articles establish the concept of internal competition by com-paring different feature extraction and classification methods. That competitionleads to optimal CAD systems within the search space, which was establishedthrough the tested methods. External competition is established through citingthe performance and data used by other published research work. As a directconsequence of the requirement for external competition, the surveyed researchpapers also published their performance and the dataset used. In turn, that in-formation should be used by future ECG based OSA detection systems for futureexternal competition.
Our survey shows that there is a link between changes in the ECG signal andOSA events. Hence, it is time to realize the cost saving potential of ECG basedOSA detection by designing CAD systems. During our survey, we discovered 29two class and 5 three class OSA diagnosis support systems. Most of the threeclass studies discriminated between normal, hypopnea and OSA events. We foundthat, based on the same data, classification algorithms outperform threshold
21
methods. Another observation is that for simple two class detectors time andfrequency feature extraction methods yield good results. However, for three classproblems nonlinear feature extraction methods were used with great success.Hence, even two class systems might benefit from nonlinear feature extractionmethods. These features could help to extend the detector performance for largerand more varied datasets.
5. Acronyms
A AccuracyANN Artificial Neural NetworkAHI Apnea/Hypopnea IndexANOVA Analysis Of VarianceBMI Body Mass IndexCAD Computer-Aided DiagnosisDB DatabaseECG ElectrocardiogramEDR ECG-Derived RespirationEEG ElectroencephalogrphyFFT Fast Fourier TransformHR Heart RateHRV Heart Rate VariabilityICA Independent Component AnalysisLD Linear DiscriminantLSDA Locality Sensitive Discriminant AnalysisNPE Neighborhood Preserving EmbeddingOSA Obstructive Sleep ApneaPCA Principal Component AnalysisPNDB PhysioNet sleep apnea ECG DataBasePSD Power Spectrum DensityPSG PolysomnographyROC Receiver Operating CharacteristicRR Respiration RateSAHS Sleep Apnea/Hypopnoea SyndromeSe SensitivitySp SpecificitySTFT Short Time Fourier TransformSVM Support Vector Machine
22

UCD Sleep Disorders Clinic at St Vincent’s University Hospital, Dublin
6. References
[1] V. K. Kapur, Obstructive sleep apnea: diagnosis, epidemiology, and eco-nomics, Respiratory care 55 (9) (2010) 1155–1167.
[2] T. Young, M. Palta, J. Dempsey, J. Skatrud, S. Weber, S. Badr, Theoccurrence of sleep-disordered breathing among middle-aged adults, NewEngland Journal of Medicine 328 (17) (1993) 1230–1235.
[3] D. Hwang, N. Shakir, B. Limann, C. Sison, S. Kalra, L. Shulman,A. de Corla Souza, H. Greenberg, Association of sleep-disordered breath-ing with postoperative complications, Chest Journal 133 (5) (2008) 1128–1134.
[4] R. J. Thomas, M. D. Weiss, J. E. Mietus, C. K. Peng, A. L. Goldberger,D. J. Gottlieb, Prevalent hypertension and stroke in the sleep heart healthstudy: Association with an ecg-derived spectrographic marker of cardiopul-monary coupling, Sleep 32 (7) (2009) 897–904.
[5] V. K. Kapur, R. Alfonso-Cristancho, Just a good deal or truly a steal?medical cost savings and the impact on the cost-effectiveness of treatingsleep apnea, Sleep 32 (2) (2009) 135–136.
[6] M. D. Vishesh Kapur, R. E. Sandblom, R. Hert, B. James, D. Sean, Themedical cost of undiagnosed sleep apnea, Sleep 22 (6) (1999) 749–755.
[7] A. Sassani, L. J. Findley, M. Kryger, E. Goldlust, C. George, T. M.Davidson, Reducing motor-vehicle collisions, costs, and fatalities bytreating obstructive sleep apnea syndrome, SLEEP-NEW YORK THENWESTCHESTER- 27 (3) (2004) 453–458.
[8] P. Przystup, A. Bujnowski, J. Ruminski, J. Wtorek, A detector of sleep dis-orders for using at home, Journal of Telecommunications and InformationTechnology 2014 (2) (2014) 70–78.
[9] T. Young, L. Evans, L. Finn, M. Palta, Estimation of the clinically diag-nosed proportion of sleep apnea syndrome in middle-aged men and women.,Sleep 20 (9) (1997) 705–706.
23
[10] B. Taha, J. Dempsey, S. Weber, M. Badr, J. Skatrud, T. Young,A. Jacques, K. Seow, Automated detection and classification of sleep-disordered breathing from conventional polysomnography data., Sleep20 (11) (1997) 991–1001.
[11] J. Sola-Soler, J. A. Fiz, J. Morera, R. Jane, Multiclass classification ofsubjects with sleep apnoea–hypopnoea syndrome through snoring analysis,Medical engineering & physics 34 (9) (2012) 1213–1220.
[12] W. W. Flemons, M. R. Littner, J. A. Rowley, P. Gay, W. M. Anderson,D. W. Hudgel, R. D. McEvoy, D. I. Loube, Home diagnosis of sleep apnea:a systematic review of the literature: an evidence review cosponsored bythe american academy of sleep medicine, the american college of chestphysicians, and the american thoracic society, CHEST Journal 124 (4)(2003) 1543–1579.
[13] D. S. Morillo, N. Gross, Probabilistic neural network approach for thedetection of sahs from overnight pulse oximetry, Medical & biological en-gineering & computing 51 (3) (2013) 305–315.
[14] E. Helfenbein, R. Firoozabadi, S. Chien, E. Carlson, S. Babaeizadeh, De-velopment of three methods for extracting respiration from the surface ecg:A review, Journal of Electrocardiology 47 (6) (2014) 819–825.
[15] M. Altuve, G. Carrault, J. Cruz, A. Beuchee, P. Pladys, A. I. Hernandez,Multivariate ecg analysis for apnoea-bradycardia detection and characteri-sation in preterm infants, International Journal of Biomedical Engineeringand Technology 5 (2-3) (2011) 247–265.
[16] P. K. Stein, Assessing heart rate variability from real-world holter reports,Cardiac Electrophysiology Review 6 (3) (2002) 239–244.
[17] S. Ozegowski, E. Wilczynska, T. Piorunek, K. Szymanowska,L. Paluszkiewicz, Usefulness of ambulatory ecg in the diagnosis of sleep-related breathing disorders, Kardiologia Polska 65 (11) (2007) 1321–1328.
[18] G. G. Berntson, J. T. Bigger, D. L. Eckberg, P. Grossman, P. G. Kaufmann,M. Malik, H. N. Nagaraja, S. W. Porges, J. P. Saul, P. H. Stone, Heart ratevariability: origins, methods, and interpretive caveats, Psychophysiology34 (6) (1997) 623–648.
24
[19] S. Patidar, R. B. Pachori, U. R. Acharya, Automated diagnosis of coro-nary artery disease using tunable-q wavelet transform applied on heart ratesignals, Knowledge-Based Systems 82 (2015) 1–10.
[20] E. A. Bresnitz, R. Goldberg, R. M. Kosinski, Epidemiology of obstructivesleep apnea., Epidemiologic reviews 16 (2) (1993) 210–227.
[21] T. I. Morgenthaler, V. Kagramanov, V. Hanak, P. A. Decker, Complexsleep apnea syndrome: is it a unique clinical syndrome?, SLEEP-NEWYORK THEN WESTCHESTER- 29 (9) (2006) 1203–1209.
[22] L. Littmann, R. M. Nesbit, J. M. Blackwell, ”awakenings”: Electrocardio-graphic findings in central sleep apnea, Annals of Noninvasive Electrocar-diology 15 (4) (2010) 387–391.
[23] C. Guilleminault, R. Winkle, S. Connolly, K. Melvin, A. Tilkian, Cyclicalvariation of the heart rate in sleep apnoea syndrome: Mechanisms, andusefulness of 24 h electrocardiography as a screening technique, The Lancet323 (8369) (1984) 126–131.
[24] P. K. Stein, S. P. Duntley, P. P. Domitrovich, P. Nishith, R. M. Carney, Asimple method to identify sleep apnea using holter recordings, Journal ofcardiovascular electrophysiology 14 (5) (2003) 467–473.
[25] T. Shiomi, C. Guilleminault, R. Sasanabe, I. Hirota, M. Maekawa,T. Kobayashi, Augmented very low frequency component of heart ratevariability during obstructive sleep apnea., Sleep 19 (5) (1996) 370–377.
[26] F. Roche, J.-M. Gaspoz, P. Minini, V. Pichot, D. Duverney, F. Costes, J.-R.Lacour, J.-C. Barthelemy, Screening of obstructive sleep apnea syndromeby heart rate variability analysis, Circulation 100 (13) (1999) 1411–1415.
[27] J. Hansel, I. Solleder, W. Gfroerer, C. M. Muth, K. Paulat, P. Simon,H. C. Heitkamp, A. Niess, K. Tetzlaff, Hypoxia and cardiac arrhythmiasin breath-hold divers during voluntary immersed breath-holds, EuropeanJournal of Applied Physiology 105 (5) (2009) 673–678.
[28] A. Erdem, O. T. Dogan, O. C. Yontar, K. Epozturk, M. Ozlu, S. Oz-turk, S. S. Ayhan, F. H. Erdem, M. Yazici, I. Akkurt, F. Talay, The pure
25

effects of obstructive sleep apnea syndrome on cardiac autonomic func-tions: Heart rate turbulence analysis, European Review for Medical andPharmacological Sciences 17 (20) (2013) 2778–2783.
[29] T. Shimizu, A. Y. S. Iwaya, S. Abe, T. Sato, S. Suzuki, K. Sugimoto,H. Kunii, K. Nakazato, H. Suzuki, S. I. Saitoh, Y. Takeishi, Cyclic varia-tion in heart rate score by holter electrocardiogram as screening for sleep-disordered breathing in subjects with heart failure, Respiratory Care 60 (1)(2015) 72–80.
[30] K. A. Kaya, B. Yilmaz, A new tool for qt interval analysis during sleep inhealthy and obstructive sleep apnea subjects: A study on women, TurkishJournal of Electrical Engineering and Computer Sciences 21 (5) (2013)1504–1513.
[31] B. Uznanska, E. Trzos, T. Rechcinski, J. D. Kasprzak, M. Kurpesa, Re-peatability of sleep apnea detection in 48-hour holter ecg monitoring, An-nals of Noninvasive Electrocardiology 15 (3) (2010) 218–222.
[32] J. F. Burnham, Scopus database: a review, Biomedical digital libraries3 (1) (2006) 1–2.
[33] N. J. Van Eck, L. Waltman, VOS: A new method for visualizing similaritiesbetween objects, Springer, 2007.
[34] O. Faust, M. G. Bairy, Nonlinear analysis of physiological signals: a review,Journal of Mechanics in Medicine and Biology 12 (04) (2012) 1240015.
[35] O. Faust, R. J. Martis, L. Min, G. L. Z. Zhong, W. Yu, Cardiac arrhythmiaclassification using electrocardiogram, J. Med. Imaging Health Inf 3 (2013)448.
[36] M. Maddouri, M. Elloumi, A data mining approach based on machine learn-ing techniques to classify biological sequences, Knowledge-Based Systems15 (4) (2002) 217–223.
[37] W.-W. Wu, Y.-T. Lee, M.-L. Tseng, Y.-H. Chiang, Data mining for ex-ploring hidden patterns between km and its performance, Knowledge-BasedSystems 23 (5) (2010) 397–401.
26

[38] M. R. K. Mookiah, U. R. Acharya, C. M. Lim, A. Petznick, J. S. Suri,Data mining technique for automated diagnosis of glaucoma using higherorder spectra and wavelet energy features, Knowledge-Based Systems 33(2012) 73–82.
[39] A. L. Goldberger, L. A. Amaral, L. Glass, J. M. Hausdorff, P. C. Ivanov,R. G. Mark, J. E. Mietus, G. B. Moody, C.-K. Peng, H. E. Stanley, Phys-iobank, physiotoolkit, and physionet components of a new research re-source for complex physiologic signals, Circulation 101 (23) (2000) e215–e220.
[40] O. Faust, U. R. Acharya, F. Molinari, S. Chattopadhyay, T. Tamura, Linearand non-linear analysis of cardiac health in diabetic subjects, BiomedicalSignal Processing and Control 7 (3) (2012) 295–302.
[41] U. R. Acharya, O. Faust, N. A. Kadri, J. S. Suri, W. Yu, Automatedidentification of normal and diabetes heart rate signals using nonlinearmeasures, Computers in biology and medicine 43 (10) (2013) 1523–1529.
[42] O. Faust, L. M. Yi, L. M. Hua, Heart rate variability analysis for differentage and gender, Journal of Medical Imaging and Health Informatics 3 (3)(2013) 395–400.
[43] M. J. Lado, X. A. Vila, L. Rodriguez-Linares, A. J. Mendez, D. N. Olivieri,P. Felix, Detecting sleep apnea by heart rate variability analysis: Assessingthe validity of databases and algorithms, Journal of Medical Systems 35 (4)(2011) 473–481.
[44] T. Penzel, G. B. Moody, R. G. Mark, A. L. Goldberger, J. H. Peter, Theapnea-ecg database, in: Computers in Cardiology 2000, IEEE, 2000, pp.255–258.
[45] G. G. Berntson, J. R. Stowell, Ecg artifacts and heart period variability:don’t miss a beat!, Psychophysiology 35 (1) (1998) 127–132.
[46] R. Xia, O. Odemuyiwa, J. Gill, M. Malik, A. J. Camm, Influence of recog-nition errors of computerised analysis of 24-hour electrocardiograms on themeasurement of spectral components of heart rate variability, Internationaljournal of bio-medical computing 32 (3) (1993) 223–235.
27
[47] B. N. Singh, A. K. Tiwari, Optimal selection of wavelet basis functionapplied to ecg signal denoising, Digital Signal Processing 16 (3) (2006)275–287.
[48] M. Alfaouri, K. Daqrouq, Ecg signal denoising by wavelet transform thresh-olding, American Journal of applied sciences 5 (3) (2008) 276–281.
[49] J. Pan, W. J. Tompkins, A real-time qrs detection algorithm, BiomedicalEngineering, IEEE Transactions on 32 (3) (1985) 230–236.
[50] G. Chandrashekar, F. Sahin, A survey on feature selection methods, Com-puters & Electrical Engineering 40 (1) (2014) 16–28.
[51] O. Barquero-Perez, R. Goya-Esteban, F. Alonso-Atienza, J. Requena-Carrion, E. Everss, A. Garcıa-Alberola, J. L. Rojo-alvarez, A review on re-cent patents in digital processing for cardiac electric signals (ii): Advancedsystems and applications, Recent Patents on Biomedical Engineering 2 (1)(2009) 32–47.
[52] R. J. Martis, U. R. Acharya, H. Adeli, Current methods in electrocar-diogram characterization, Computers in biology and medicine 48 (2014)133–149.
[53] J. Theiler, S. Eubank, A. Longtin, B. Galdrikian, J. D. Farmer, Testingfor nonlinearity in time series: the method of surrogate data, Physica D:Nonlinear Phenomena 58 (1) (1992) 77–94.
[54] H. Scheffe, The analysis of variance, Vol. 72, John Wiley & Sons, 1999.
[55] J. F. Box, Guinness, gosset, fisher, and small samples, Statistical Science(1987) 45–52.
[56] N. Z. N. Jenny, O. Faust, W. Yu, Automated classification of normal andpremature ventricular contractions in electrocardiogram signals, Journal ofMedical Imaging and Health Informatics 4 (6) (2014) 886–892.
[57] D. Giri, U. R. Acharya, R. J. Martis, S. V. Sree, T.-C. Lim, T. Ahamed, J. S.Suri, Automated diagnosis of coronary artery disease affected patients usinglda, pca, ica and discrete wavelet transform, Knowledge-Based Systems 37(2013) 274–282.
28

[58] R. J. Martis, U. R. Acharya, C. M. Lim, J. S. Suri, Characterization ofecg beats from cardiac arrhythmia using discrete cosine transform in pcaframework, Knowledge-Based Systems 45 (2013) 76–82.
[59] F. Roche, D. Duverney, I. Court-Fortune, V. Pichot, F. Costes, J. R. La-cour, A. Antoniadis, J. M. Gaspoz, J. C. Barthelemy, Cardiac interbeatinterval increment for the identification of obstructive sleep apnea, PACE- Pacing and Clinical Electrophysiology 25 (8) (2002) 1192–1199.
[60] U. R. Acharya, O. Faust, S. V. Sree, D. N. Ghista, S. Dua, P. Joseph, V. T.Ahamed, N. Janarthanan, T. Tamura, An integrated diabetic index usingheart rate variability signal features for diagnosis of diabetes, Computermethods in biomechanics and biomedical engineering 16 (2) (2013) 222–234.
[61] J. A. Hanley, B. J. McNeil, The meaning and use of the area under areceiver operating characteristic (roc) curve., Radiology 143 (1) (1982)29–36.
[62] B. E. Boser, I. M. Guyon, V. N. Vapnik, A training algorithm for opti-mal margin classifiers, in: Proceedings of the fifth annual workshop onComputational learning theory, ACM, 1992, pp. 144–152.
[63] B. Baesens, S. Viaene, T. Van Gestel, J. A. Suykens, G. Dedene,B. De Moor, J. Vanthienen, An empirical assessment of kernel type perfor-mance for least squares support vector machine classifiers, in: Knowledge-Based Intelligent Engineering Systems and Allied Technologies, 2000. Pro-ceedings. Fourth International Conference on, Vol. 1, IEEE, 2000, pp.313–316.
[64] W. S. McCulloch, W. Pitts, A logical calculus of the ideas immanent innervous activity, The bulletin of mathematical biophysics 5 (4) (1943)115–133.
[65] R. Andrews, J. Diederich, A. B. Tickle, Survey and critique of techniquesfor extracting rules from trained artificial neural networks, Knowledge-based systems 8 (6) (1995) 373–389.
[66] G. McLachlan, Discriminant analysis and statistical pattern recognition,Vol. 544, John Wiley & Sons, 2004.
29

[67] J. Hu, W. Deng, J. Guo, W. Xu, Learning a locality discriminating projec-tion for classification, Knowledge-Based Systems 22 (8) (2009) 562–568.
[68] R. E. Schapire, Y. Singer, Improved boosting algorithms using confidence-rated predictions, Machine learning 37 (3) (1999) 297–336.
[69] T. S. Hock, O. Faust, T.-C. Lim, W. Yu, Automated detection of pre-mature ventricular contraction using recurrence quantification analysis onheart rate signals, Journal of Medical Imaging and Health Informatics 3 (3)(2013) 462–469.
[70] D. G. Altman, J. M. Bland, Diagnostic tests. 1: Sensitivity and specificity.,BMJ: British Medical Journal 308 (6943) (1994) 1552.
[71] D. M. Powers, Evaluation: from precision, recall and f-measure to roc,informedness, markedness and correlation, Technical Report 7 (1) (2011)1–24.
[72] G. Cohen, P. de Chazal, Automated detection of sleep apnea in infants:A multi-modal approach, Computers in Biology and Medicine 63 (2015)118–123.
[73] A. Khandoker, C. K. Karmakar, M. Palaniswami, Automated recognitionof patients with obstructive sleep apnoea using wavelet-based features ofelectrocardiogram recordings, Computers in Biology and Medicine 39 (1)(2009) 88–96.
[74] M. Bsoul, H. Minn, L. Tamil, Apnea medassist: Real-time sleep apneamonitor using single-lead ecg, IEEE Transactions on Information Technol-ogy in Biomedicine 15 (3) (2011) 416–427.
[75] B. M. Oussama, B. M. Saadi, H. S. Zine-Eddine, Extracting features fromecg and respiratory signals for automatic supervised classification of heart-beat using neural networks, Asian Journal of Information Technology 15 (1)(2016) 5–11.
[76] A. H. Khandoker, M. Palaniswami, C. K. Karmakar, Support vector ma-chines for automated recognition of obstructive sleep apnea syndromefrom ecg recordings, IEEE Transactions on Information Technology inBiomedicine 13 (1) (2009) 37–48.
30
[77] R. J. Thomas, J. E. Mietus, C. K. Peng, G. Gilmartin, R. W. Daly, A. L.Goldberger, D. J. Gottlieb, Differentiating obstructive from central andcomplex sleep apnea using an automated electrocardiogram-based method,Sleep 30 (12) (2007) 1756–1769.
[78] C. Maier, H. Wenz, H. Dickhaus, Robust detection of sleep apnea fromholter ecgs: Joint assessment of modulations in qrs amplitude and respi-ratory myogram interference, Methods of Information in Medicine 53 (4)(2014) 303–307.
[79] C. Varon, A. Caicedo, D. Testelmans, B. Buyse, S. Van Huffel, A novelalgorithm for the automatic detection of sleep apnea from single-lead ecg,IEEE Transactions on Biomedical Engineering 62 (9) (2015) 2269–2278.
[80] D. Liu, X. Yang, G. Wang, J. Ma, Y. Liu, C. K. Peng, J. Zhang, J. Fang,Hht based cardiopulmonary coupling analysis for sleep apnea detection,Sleep Medicine 13 (5) (2012) 503–509.
[81] H. Dickhaus, C. Maier, Detection of sleep apnea episodes from multi-leadecgs considering different physiological influences, Methods of Informationin Medicine 46 (2) (2007) 216–221.
[82] B. Xie, H. Minn, Real-time sleep apnea detection by classifier combination,IEEE Transactions on Information Technology in Biomedicine 16 (3) (2012)469–477.
[83] C. O’Brien, C. Heneghan, A comparison of algorithms for estimation of arespiratory signal from the surface electrocardiogram, Computers in Biol-ogy and Medicine 37 (3) (2007) 305–314.
[84] M. Aksahin, A. Erdamar, H. Fırat, S. Ardıc, O. Erogul, Obstructive sleepapnea classification with artificial neural network based on two synchronichrv series, Biomedical Engineering - Applications, Basis and Communica-tions 27 (2) (2015) 1550011–1–1550011–8.
[85] G. M. Tong, H. C. Zhang, J. H. Guo, F. Han, Detection of sleep apnea-hypopnea syndrome with ecg derived respiration in chinese population,International Journal of Clinical and Experimental Medicine 7 (5) (2014)1269–1275.
31

[86] Y. Jiang, J. P. Tian, H. Wang, B. X. Chen, F. H. Du, Diagnostic value ofcombined parameters derived from ambulatory electrocardiography for de-tecting coronary artery disease in non-active chest pain patients, PakistanJournal of Medical Sciences 30 (6) (2014) 1331–1335.
[87] V. Monasterio, F. Burgess, G. D. Clifford, Robust classification of neonatalapnoea-related desaturations, Physiological Measurement 33 (9) (2012)1503–1516.
[88] C. Maier, H. Wenz, H. Dickhaus, Steps toward subject-specific classifi-cation in ecg-based detection of sleep apnea, Physiological Measurement32 (11) (2011) 1807–1819.
[89] R. B. Shouldice, L. M. O’Brien, C. O’Brien, P. De Chazal, D. Gozal,C. Heneghan, Detection of obstructive sleep apnea in pediatric subjectsusing surface lead electrocardiogram features, Sleep 27 (4) (2004) 784–792.
[90] F. Roche, S. Celle, V. Pichot, J. C. Barthelemy, E. Sforza, Analy-sis of the interbeat interval increment to detect obstructive sleep ap-noea/hypopnoea, European Respiratory Journal 29 (6) (2007) 1206–1211.
[91] K. Kesper, S. Canisius, T. Penzel, T. Ploch, W. Cassel, Ecg signal analysisfor the assessment of sleep-disordered breathing and sleep pattern, Medicaland Biological Engineering and Computing 50 (2) (2012) 135–144.
[92] L. Poupard, M. Mathieu, M. Goldman, F. Chouchou, F. Roche, Multi-modal ecg holter system for sleep-disordered breathing screening, Sleepand Breathing 16 (3) (2012) 685–693.
[93] B. Yilmaz, M. H. Asyali, E. Arikan, S. Yetkin, F. Ozgen, Sleep stage andobstructive apneaic epoch classification using single-lead ecg, BioMedicalEngineering Online 9 (2010) 1–39.
[94] R. Singhathip, S. H. Yang, M. Abbod, R. G. Yeh, J. S. Shieh, Extractingrespiration rate from raw ecg signals, Biomedical Engineering - Applica-tions, Basis and Communications 22 (4) (2010) 307–314.
[95] F. Roche, E. Sforza, D. Duverney, J. R. Borderies, V. Pichot, O. Bigaignon,G. Ascher, J. C. Barthelemy, Heart rate increment: An electrocardiological
32

approach for the early detection of obstructive sleep apnoea/hypopnoeasyndrome, Clinical Science 107 (1) (2004) 105–110.
[96] C. Maier, H. Dickhaus, Central sleep apnea detection from ecg-derivedrespiratory signals: Application of multivariate recurrence plot analysis,Methods of Information in Medicine 49 (5) (2010) 462–466.
[97] N. M. Ghahjaverestan, M. B. Shamsollahi, D. Ge, A. I. Hernandez, Switch-ing kalman filter based methods for apnea bradycardia detection from ecgsignals, Physiological Measurement 36 (9) (2015) 1763–1783.
[98] U. R. Acharya, E. C. P. Chua, O. Faust, T. C. Lim, L. F. B. Lim, Automateddetection of sleep apnea from electrocardiogram signals using nonlinearparameters, Physiological Measurement 32 (3) (2011) 287–303.
[99] A. H. Khandoker, J. Gubbi, M. Palaniswami, Automated scoring of ob-structive sleep apnea and hypopnea events using short-term electrocar-diogram recordings, IEEE Transactions on Information Technology inBiomedicine 13 (6) (2009) 1057–1067.
[100] S. Babaeizadeh, S. H. Zhou, S. D. Pittman, D. P. White,Electrocardiogram-derived respiration in screening of sleep-disorderedbreathing, Journal of Electrocardiology 44 (6) (2011) 700–706.
[101] J. Boyle, N. Bidargaddi, A. Sarela, M. Karunanithi, Automatic detectionof respiration rate from ambulatory single-lead ecg, IEEE Transactions onInformation Technology in Biomedicine 13 (6) (2009) 890–896.
[102] M. J. Lado, A. J. Mendez, L. Rodriguez-Linares, A. Otero, X. A. Vila, Noc-turnal evolution of heart rate variability indices in sleep apnea, Computersin Biology and Medicine 42 (12) (2012) 1179–1185.
[103] U. R. Acharya, H. Fujita, V. K. Sudarshan, V. S. Sree, L. W. J. Eu-gene, D. N. Ghista, R. San Tan, An integrated index for detection of sud-den cardiac death using discrete wavelet transform and nonlinear features,Knowledge-Based Systems 83 (2015) 149–158.
[104] O. Faust, W. Yu, Cardiac health visualization and diagnosis using entropies,Journal of Medical Imaging and Health Informatics 3 (3) (2013) 409–416.
33
[105] K. Y. Zhi, O. Faust, W. Yu, Wavelet based machine learning techniques forelectrocardiogram signal analysis, Journal of Medical Imaging and HealthInformatics 4 (5) (2014) 737–742.
[106] N. A. Collop, W. M. Anderson, B. Boehlecke, D. Claman, R. Goldberg,D. Gottlieb, D. Hudgel, M. Sateia, R. Schwab, Clinical guidelines for theuse of unattended portable monitors in the diagnosis of obstructive sleepapnea in adult patients, J Clin Sleep Med 3 (7) (2007) 737–747.
[107] J. Duran, S. Esnaola, R. Rubio, A. Iztueta, Obstructive sleep apnea–hypopnea and related clinical features in a population-based sample ofsubjects aged 30 to 70 yr, American journal of respiratory and critical caremedicine 163 (3) (2001) 685–689.
[108] G. Gould, K. Whyte, G. Rhind, M. Airlie, J. Catterall, C. Shapiro, N. Dou-glas, The sleep hypopnea syndrome, American Review of Respiratory Dis-ease 137 (4) (1988) 895–898.
[109] C. Zamarron, F. Gude, J. Barcala, J. R. Rodriguez, P. V. Romero, Utility ofoxygen saturation and heart rate spectral analysis obtained from pulse oxi-metric recordings in the diagnosis of sleep apnea syndrome, Chest Journal123 (5) (2003) 1567–1576.
[110] N. Netzer, A. H. Eliasson, C. Netzer, D. A. Kristo, Overnight pulse oxime-try for sleep-disordered breathing in adults: a review, CHEST Journal120 (2) (2001) 625–633.
[111] D. Alvarez, R. Hornero, M. Garcıa, F. del Campo, C. Zamarron, Improvingdiagnostic ability of blood oxygen saturation from overnight pulse oximetryin obstructive sleep apnea detection by means of central tendency measure,Artificial intelligence in medicine 41 (1) (2007) 13–24.
[112] K. E. Bloch, Getting the most out of nocturnal pulse oximetry, CHESTJournal 124 (5) (2003) 1628–1630.
[113] A. Fetveit, Late-life insomnia: A review, Geriatrics and Gerontology Inter-national 9 (3) (2009) 220–234.
[114] T. Nakamura, K. Chin, R. Hosokawa, K. Takahashi, K. Sumi, M. Ohi,M. Mishima, Corrected qt dispersion and cardiac sympathetic function in
34
patients with obstructive sleep apnea-hypopnea syndrome, Chest 125 (6)(2004) 2107–2114.
[115] I. Solaimanzadeh, T. T. Schlegel, A. H. Feiveson, E. C. Greco, J. L.DePalma, V. Starc, H. Marthol, M. Tutaj, S. Buechner, F. B. Axelrod,M. J. Hilz, Advanced electrocardiographic predictors of mortality in famil-ial dysautonomia, Autonomic Neuroscience: Basic and Clinical 144 (1-2)(2008) 76–82.
[116] T. E. Herrscher, B. Overland, L. Sandvik, A. S. Westheim, H. Akre,High cardiovascular risk profile in patients with sleep apnea, Laryngoscope124 (1) (2014) 306–310.
[117] E. Sovova, M. Hobzova, M. Sova, V. Kolek, I. Buriankova, P. Zme’skal,Occurrence of symptoms and risk factors for obstructive sleep apnea inpatients examined for cardiac arrhythmias through hotter ecg monitoring,Prakticky Lekar 90 (8) (2010) 469–471.
[118] M. Trefny, T. Palecek, Z. Susa, A. Linhart, J. Slavicek, Z. Trefny, Echocar-diographic abnormalities in obstructive sleep-apnea syndrome [echokardio-graficke nalezy u syndromu spankove apnoe], Ceska a Slovenska Neurologiea Neurochirurgie 67 (4) (2004) 260–264.
[119] L. H. Ibrahim, F. J. Jacono, S. R. Patel, R. J. Thomas, E. K. Larkin,J. E. Mietus, C. K. Peng, A. L. Goldberger, S. Redline, Heritabilityof abnormalities in cardiopulmonary coupling in sleep apnea: Use of anelectrocardiogram-based technique, Sleep 33 (5) (2010) 643–646+S1–S2.
[120] W. S. Mauser, S. Sandrock, L. Kotzott, H. Bonnemeier, Screening for sleepapnea in cardiovascular patients in clinical routine [schlafapnoescreeningkardiovaskulrer patienten im klinischen alltag], Herzschrittmachertherapieund Elektrophysiologie 23 (1) (2012) 27–32.
[121] A. Mueller, I. Fietze, R. Voelker, S. Eddicks, M. Glos, G. Baumann,H. Theres, Screening for sleep-related breathing disorders by transthoracicimpedance recording integrated into a holter ecg system, Journal of SleepResearch 15 (4) (2006) 455–462.
[122] K. Czopek, Cardiac activity based on acoustic signal properties, Acta Phys-ica Polonica A 121 (1 A) (2012) A42–A45.
35

[123] J. M. Catheline, H. Bihan, T. Le Quang, D. Sadoun, J. C. Charniot,I. Onnen, J. L. Fournier, J. Benichou, R. Cohen, Preoperative cardiac andpulmonary assessment in bariatric surgery, Obesity Surgery 18 (3) (2008)271–277.
[124] M. Valencia-Flores, A. Orea, M. Herrera, V. Santiago, V. Rebollar, V. A.Castano, J. Oseguera, J. Pedroza, J. Sumano, M. Resendiz, G. Garcia-Ramos, Effect of bariatric surgery on obstructive sleep apnea and hypop-nea syndrome, electrocardiogram, and pulmonary arterial pressure, ObesitySurgery 14 (6) (2004) 755–762.
[125] M. Adnane, Z. Jiang, S. Choi, Development of qrs detection algorithmdesigned for wearable cardiorespiratory system, Computer Methods andPrograms in Biomedicine 93 (1) (2009) 20–31.
[126] M. Peltokangas, J. Verho, A. Vehkaoja, Night-time ekg and hrv moni-toring with bed sheet integrated textile electrodes, IEEE Transactions onInformation Technology in Biomedicine 16 (5) (2012) 935–942.
[127] R. Acharya, O. Faust, N. Kannathal, T. Chua, S. Laxminarayan, Non-linear analysis of eeg signals at various sleep stages, Computer methodsand programs in biomedicine 80 (1) (2005) 37–45.
[128] S. J. Redmond, C. Heneghan, Cardiorespiratory-based sleep staging in sub-jects with obstructive sleep apnea, IEEE Transactions on Biomedical En-gineering 53 (3) (2006) 485–496.
[129] F. Poree, A. Kachenoura, H. Gauvrit, C. Morvan, G. Carrault, L. Senhadji,Blind source separation for ambulatory sleep recording, IEEE Transactionson Information Technology in Biomedicine 10 (2) (2006) 293–301.
[130] S. J. Redmond, P. De Chazal, C. O’Brien, S. Ryan, W. T. McNicholas,C. Heneghan, Sleep staging using cardiorespiratory signals, Somnologie11 (4) (2007) 245–256.
[131] Z. Song, Z. Ji, J.-G. Ma, B. Sputh, U. R. Acharya, O. Faust, A systematicapproach to embedded biomedical decision making, Computer methodsand programs in biomedicine 108 (2) (2012) 656–664.
[132] U. R. Acharya, O. Faust, F. Molinari, S. V. Sree, S. P. Junnarkar, V. Sudar-shan, Ultrasound-based tissue characterization and classification of fatty
36

liver disease: A screening and diagnostic paradigm, Knowledge-Based Sys-tems 75 (2015) 66–77.
[133] U. R. Acharya, H. Fujita, V. K. Sudarshan, S. Bhat, J. E. Koh, Applicationof entropies for automated diagnosis of epilepsy using eeg signals: A review,Knowledge-Based Systems 88 (2015) 85–96.
[134] O. Faust, U. R. Acharya, T. Tamura, Formal design methods for reliablecomputer-aided diagnosis: a review, Biomedical Engineering, IEEE Reviewsin 5 (2012) 15–28.
[135] O. Faust, R. Acharya, B. H. Sputh, L. C. Min, Systems engineering prin-ciples for the design of biomedical signal processing systems, Computermethods and programs in biomedicine 102 (3) (2011) 267–276.
37